


Abstract
Photovoltaic technology selection in Gulf Cooperation Council (GCC) desert environments is affected by coupled dust, thermal, ultraviolet (UV), humidity, and salinity stresses, which are not fully represented by static weighting and additive multi-criteria decision-making models. This study develops a GCC evidence-calibrated nonlinear decision-support framework that integrates published literature-derived GCC/desert-stress calibration, adaptive hybrid entropy–desert weighting, and bipolar fuzzy Einstein aggregation. The framework is applied to compare passivated emitter and rear cell (PERC), tunnel oxide passivated contact (TOPCon), and heterojunction technology (HJT) photovoltaic technologies using calibrated evidence from Qatar, the United Arab Emirates, Saudi Arabia, and Oman. The results show that dust tolerance receives the highest final hybrid weight (0.258), followed by thermal resistance (0.228), UV resistance (0.207), efficiency (0.173), and cost effectiveness (0.134). The nonlinear Einstein aggregation ranks HJT first (0.889), followed by TOPCon (0.861) and PERC (0.742). Benchmark comparison with TOPSIS, VIKOR, and PROMETHEE II shows high rank agreement, while Monte Carlo perturbation analysis indicates that HJT preserves the first rank in 93% of perturbation runs. The proposed framework links PV technology selection with published GCC desert-stress evidence and provides a reproducible basis for technology prioritization in harsh solar energy deployment environments. A stress-to-decision translation table is also provided to clarify how desert degradation mechanisms are converted into decision criteria and reusable selection guidance.
1. Introduction
Solar photovoltaic (PV) deployment in Gulf Cooperation Council (GCC) countries has expanded rapidly, creating a practical need for technology selection models that reflect regional operating conditions. Although the GCC has high solar irradiance, PV systems operate under severe environmental stress caused by dust accumulation, high module temperature, ultraviolet (UV) exposure, humidity, and coastal salinity. These factors reduce irradiance transmission, accelerate material degradation, and increase uncertainty in long-term performance [1,2,3].
PV technology selection is therefore not only an efficiency-ranking problem. Passivated emitter and rear cell (PERC), tunnel oxide passivated contact (TOPCon), and heterojunction technology (HJT) modules differ in passivation structure, temperature behavior, UV sensitivity, soiling response, and cost profile. Recent comparative evidence indicates that high-efficiency technologies may not be uniformly optimal when environmental degradation and maintenance burden are considered simultaneously [3,4,5].
Multi-criteria decision-making (MCDM) methods, including Technique for Order Preference by Similarity to Ideal Solution (TOPSIS), VIKOR, Preference Ranking Organization Method for Enrichment Evaluations (PROMETHEE), Analytic Hierarchy Process (AHP), and fuzzy MCDM, have been widely used for renewable energy technology selection [6,7,8,9,10]. However, many conventional approaches use static weighting and additive aggregation, which implicitly assume that criteria act independently and that their relative importance remains unchanged across operating environments. This assumption is weak in desert PV systems, where dust, heat, and UV exposure act as coupled degradation drivers [11,12,13,14,15,16].
Previous PV and renewable energy technology selection studies have followed three related directions. Classical MCDM methods provide transparent ranking procedures for energy alternatives, but they commonly depend on fixed criterion weights and generic normalized decision matrices [6,7,8,9,10,17,18,19,20]. Fuzzy MCDM and Einstein-type aggregation methods improve the representation of uncertainty and nonlinear evidence combination [6,7,10,21,22,23,24,25,26,27,28,29]. In parallel, desert PV degradation and reliability studies document the effects of soiling, high module temperature, UV exposure, humidity, salinity, and technology-specific failure modes on PV performance [1,2,3,11,12,13,14,15,16,30,31,32,33,34,35].
However, these streams are often treated separately: MCDM studies frequently emphasize ranking mechanics, whereas degradation studies usually report physical stress evidence without converting it into a reproducible technology selection protocol. The research gap addressed in this study is therefore the limited integration of GCC desert-stress evidence, adaptive weighting, and nonlinear aggregation within one transparent decision-support structure. The novelty is not the isolated use of an MCDM method but the integration of published GCC/desert PV evidence, adaptive entropy–desert weighting, bipolar fuzzy Einstein aggregation, benchmark comparison, and Monte Carlo robustness testing for PERC, TOPCon, and HJT selection under coupled GCC desert stress.
To address this gap, the present study proposes a GCC evidence-calibrated nonlinear decision framework for PV technology selection under desert environmental stress. The contribution is not the isolated use of fuzzy MCDM, entropy weighting, or Einstein aggregation, since these tools already exist in the literature. Rather, the contribution is their joint integration into one reproducible and GCC evidence-calibrated decision-support structure for PV technology ranking under GCC desert conditions.
The main contributions are as follows: (i) a GCC evidence-calibrated decision matrix linking PV technology scores with published GCC/desert evidence from Qatar, the UAE, Saudi Arabia, and Oman; (ii) an adaptive hybrid entropy–desert weighting model that combines statistical dispersion with environmental stress intensity; (iii) a bipolar fuzzy Einstein aggregation structure that separates beneficial performance evidence from degradation penalties; and (iv) a validation protocol including benchmark MCDM comparison, scenario analysis, and Monte Carlo robustness testing.
2. Materials and Methods
No laboratory chemicals, reagents, biological materials, commercial cell lines, samples, or experimental instruments were used in this study. Spreadsheet-based calculations were performed using Microsoft Excel (Microsoft Corporation, Redmond, WA, USA); no dedicated proprietary simulation software was used.
2.1. Research Gap and Novelty Positioning
Recent PV technology selection studies have improved uncertainty representation using fuzzy MCDM models, but most retain fixed weighting structures and do not directly incorporate literature-derived GCC environmental stress evidence [6,7]. Broader sustainable energy MCDM studies compare weighting and ranking procedures but often treat the input decision matrix as a generic normalized structure rather than an environment-calibrated representation of actual degradation behavior [8,9,10].
Adaptive weighting theory shows that changing criterion importance can improve decision realism under uncertain and dynamic evaluation conditions [36,37]. In parallel, Einstein aggregation operators have been developed in several fuzzy environments because they provide nonlinear composition rules that differ from arithmetic averaging [21,22,23,24,25,26,27,28,29]. However, to the authors’ knowledge, no previous PV technology selection study has jointly integrated literature-derived GCC desert-stress evidence, adaptive hybrid entropy–desert weighting, and nonlinear bipolar Einstein aggregation within a single decision-support framework.
The overall decision operator is written as
where denotes the GCC evidence-calibration operator, denotes the hybrid adaptive weighting operator, and denotes the bipolar fuzzy Einstein aggregation operator. This coupled structure transforms regional environmental evidence into a weighted and nonlinear ranking score. Here, denotes the overall decision operator that maps calibrated evidence to a final technology ranking score.
Accordingly, the proposed framework addresses a specific gap in the PV-MCDM literature: previous studies commonly rank alternatives using generic normalized matrices or fixed weighting schemes, whereas the present framework links the decision matrix, criterion weights, and aggregation process to GCC desert-stress evidence and tests the resulting ranking through theta sensitivity, benchmark comparison, and Monte Carlo robustness checks. This makes the framework a reproducible stress-to-decision structure rather than another application of an existing MCDM technique.
2.2. Alternatives, Criteria, and Environmental Stress Vector
The PV alternatives are defined as , where is PERC, is TOPCon, and is HJT. The criteria set is , representing efficiency, thermal resistance, dust tolerance, UV resistance, and cost effectiveness, respectively.
The environmental stress vector is defined as
where is thermal stress, is dust loading, is UV exposure or degradation intensity, is humidity, and is salinity. The calibrated decision matrix is denoted as , where is the normalized performance of alternative under criterion after GCC environmental calibration. Table 1 summarizes the GCC environmental calibration inputs used in the decision framework.
Table 1.
GCC environmental calibration inputs used in the decision framework.
2.3. Decision Matrix Construction and Calibration Protocol
The decision matrix was reconstructed as a transparent literature-derived calibration chain rather than as a black-box expert score. Each criterion score follows five steps: (i) identify the relevant GCC or desert climate evidence; (ii) map the evidence to a decision criterion; (iii) convert degradation measures into positive resilience indicators when necessary; (iv) normalize values onto a common unitless scale; and (v) document whether the value is measured, derived, normalized, or assumed. This clarification directly separates published field-measured inputs from literature-derived calibration and prevents the term “calibrated” from implying one new synchronized GCC field campaign. Table 2 summarizes the construction logic for the GCC evidence-calibrated decision matrix.
Table 2.
Transparent construction logic for the GCC evidence-calibrated decision matrix.
2.4. Normalization and Calibration Rules
Benefit criteria and cost criteria are normalized using the equations below. For degradation-based criteria, the direction is first converted so that larger values always indicate stronger suitability. In particular, UV degradation is converted into a positive resistance indicator using Equation (7). This ensures that the aggregation stage combines criteria with a consistent interpretation: higher normalized values represent stronger performance or resilience.
Benefit criteria are normalized as
whereas cost criteria are normalized as
UV resistance is calculated directly from measured degradation as
where is the measured UV degradation fraction. Thus, the calibrated UV resistance values are 0.978 for PERC, 0.968 for TOPCon, and 0.989 for HJT. These values are used as positive resistance indicators because lower degradation corresponds to higher UV resilience.
2.5. Hybrid Adaptive Entropy–Desert Weighting
Entropy weighting first computes the proportional criterion value
and the entropy value
where m is the number of alternatives, n is the number of criteria, and κ = 1/ln(m) is the entropy normalization constant used to keep entropy values on a comparable scale.
For transparency, the entropy weighting stage uses a calibrated entropy input protocol. The reported entropy weights are derived from the evidence-screened decision matrix and the criterion dispersion calibration reported in the supplementary workbook. The supplementary workbook provides a formula-driven calibrated entropy trace, allowing the entropy pathway to reproduce the reported weights before the hybrid entropy–desert weighting step.
To avoid notation conflict, denotes salinity in the environmental stress vector, whereas denotes the criterion-level stress intensity used for weighting. The criterion-level stress intensity vector is denoted by , where each maps environmental stress evidence to the corresponding decision criterion. Humidity and salinity are treated as secondary contextual modifiers rather than independent final criteria.
The final hybrid weight is
In this study, θ = 0.6 is used as the baseline weighting balance. This setting is not treated as a fixed empirical constant; it is a modeling choice tested through sensitivity analysis over θ = 0.30–0.80. The value gives slightly greater emphasis to entropy-derived information dispersion while retaining a substantial desert-stress adjustment. The physical monotonicity condition is interpreted for sj > 0 and a positive total criterion-level stress intensity as
This means that the importance of a criterion increases when the corresponding environmental stress becomes more severe.
2.6. Theta Sensitivity and Weight Robustness Check
Because the hybrid parameter θ controls the balance between entropy-derived information dispersion and desert-stress responsiveness, the framework treats θ = 0.6 as a baseline rather than an untested assumption. A sensitivity check is added for θ values between 0.3 and 0.8. The purpose is not to recalibrate the model for each site but to verify whether the rank order depends strongly on one arbitrary value. The ranking is considered robust when the order HJT > TOPCon > PERC is preserved over the tested θ range; otherwise, the model reports a rank reversal warning. Table 3 reports the theta-sensitivity results for the hybrid weighting parameter.
Table 3.
Theta (θ) sensitivity results for the hybrid weighting parameter.
2.7. Bipolar Fuzzy Einstein Aggregation
Let the positive and negative membership degrees represent the beneficial evidence and degradation penalty of alternative under criterion . The Einstein sum and Einstein product are defined as
The bipolar fuzzy Einstein aggregation score is computed as
where and denote the positive and negative Einstein sum components obtained by iterative use of the Einstein sum and product over all criteria. Unlike additive aggregation, this nonlinear structure is non-separable; therefore, the mixed partial derivative is generally non-zero for interacting criteria. This property is useful for desert PV systems, where the combined impact of dust, heat, and UV exposure cannot be interpreted as a purely additive effect.
The final ranking rule is
2.8. Validation and Robustness Protocol
The proposed ranking is evaluated using complementary checks: (i) scenario-based ranking under single and combined environmental stress cases; (ii) benchmark comparison against TOPSIS, VIKOR, and PROMETHEE II using the same evidence-calibrated decision matrix; (iii) Spearman rank correlation; (iv) theta sensitivity of the hybrid weighting parameter; and (v) Monte Carlo perturbation of both criterion weights and decision matrix scores. This expanded protocol addresses uncertainty arising from heterogeneous literature inputs and from the choice of weighting parameter.
For the Monte Carlo analysis, criterion weights and decision matrix entries are perturbed simultaneously. Each weight is perturbed within ±20% and then renormalized, while each matrix entry is perturbed within a bounded interval and truncated to the range from 0 to 1. The ±20% range is used as a mid-level uncertainty band because the calibration inputs are drawn from different published studies, field locations, and experimental contexts. The Monte Carlo output is therefore interpreted as a rank stability test, not as a time-series forecast of PV degradation. This robustness design follows standard simulation experiment and uncertainty analysis practice in decision modeling [38,39].
and the perturbed weights are renormalized as
The first-rank preservation probability for alternative is
Here, the superscript (k) denotes the Monte Carlo run index. The perturbation term in Equation (19) is the random perturbation applied to criterion weight denotes the perturbation interval, the numerator in Equation (21) is the number of first-rank runs for alternative and the denominator is the total number of perturbation runs.
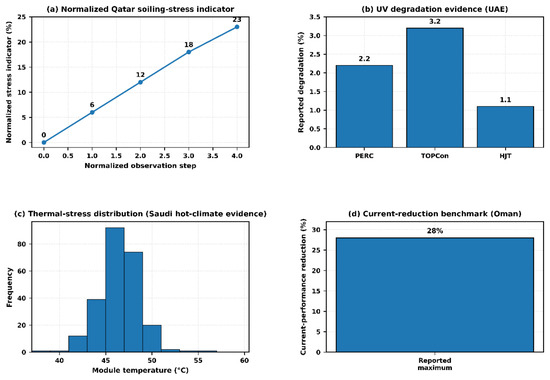
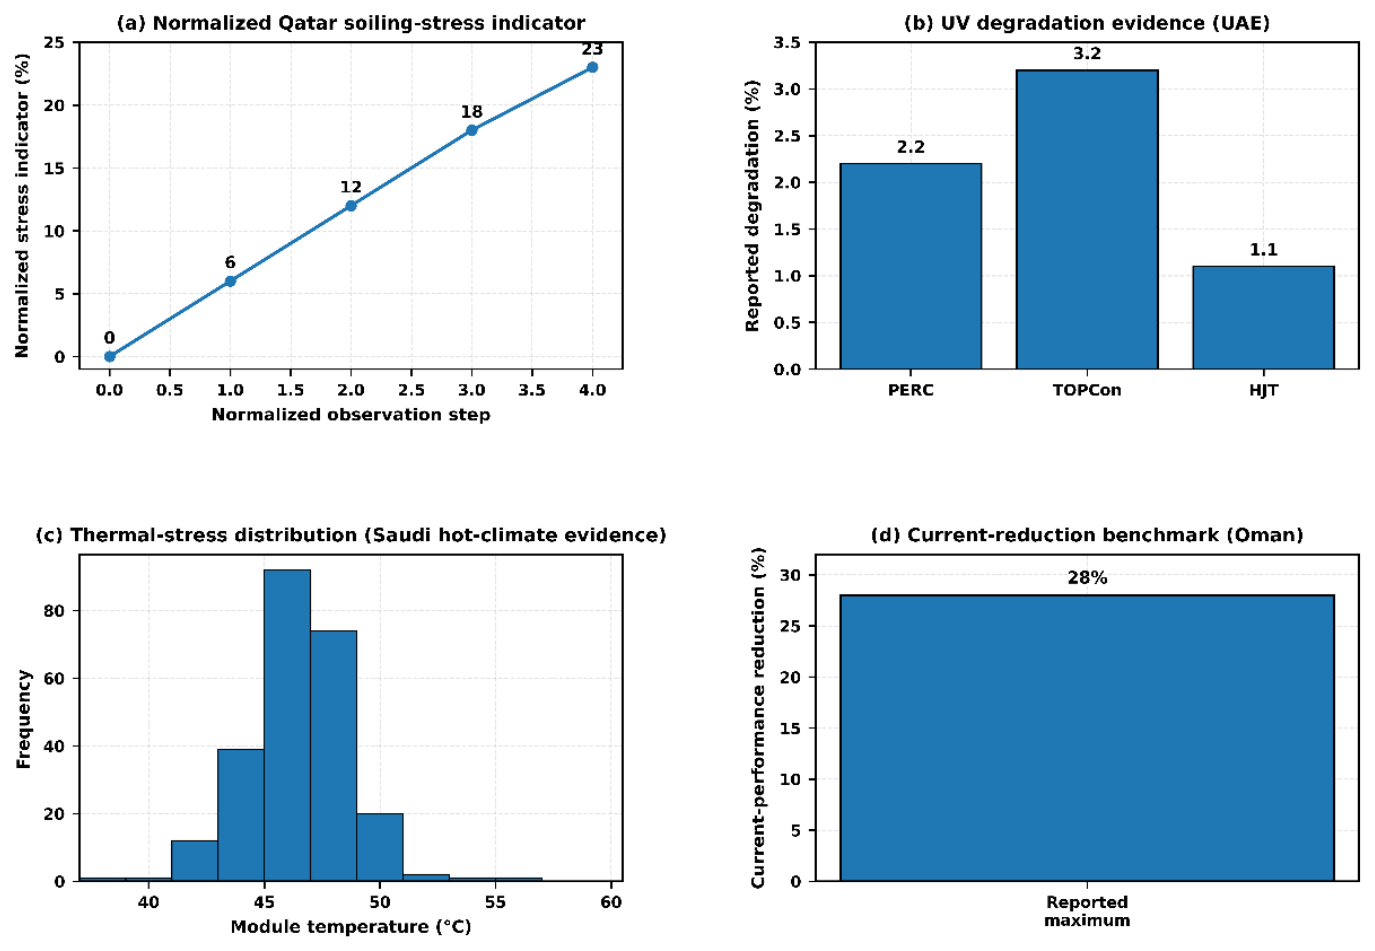
Figure 1 summarizes the GCC evidence-calibration behavior used to construct the decision matrix.
Figure 1.
GCC environmental calibration summary: (a) dust accumulation in Qatar; (b) UV degradation values for PERC, TOPCon, and HJT; (c) thermal stress distribution representative of Saudi hot climate operation; and (d) reported Oman current performance reduction benchmark used for external soiling loss validation.
3. Results
3.1. GCC Evidence-Calibrated Decision Matrix
The calibrated decision matrix used in the analysis is
where columns correspond to efficiency, thermal resistance, dust tolerance, UV resistance, and cost effectiveness. The matrix is calibrated from published GCC and desert climate stress inputs described in Table 1 and normalized so that higher values indicate better suitability. Cost effectiveness is treated as a benefit-oriented techno-economic proxy after conversion from cost-related evidence; therefore, higher normalized cost-effectiveness scores indicate more favorable economic performance. Table 4 reports the calibrated decision matrix in tabular form.
Table 4.
GCC evidence-calibrated decision matrix.
3.2. Hybrid Weighting Results
The hybrid weights show that dust tolerance is the most influential criterion, followed by thermal resistance, UV resistance, efficiency, and cost effectiveness. This result is consistent with field observations showing that dust accumulation and soiling losses are major drivers of PV underperformance in desert environments [1,11,30].
Table 5 reports the entropy, desert-adaptive, and final hybrid weights.
Table 5.
Entropy, desert-adaptive, and final hybrid weights.
3.3. Transparent Computation Chain
To improve reproducibility, Table 6 reports the calculation chain linking calibrated inputs, hybrid weights, and final nonlinear scores. The negative membership component is represented as a degradation penalty derived from environmental exposure and cost burden; the final model score is the net bipolar Einstein aggregation result. The supplementary workbook reports the calibrated entropy trace, the hybrid weight calculation path, and the positive Einstein aggregation trace.
Table 6.
Transparent computational chain for PV technology ranking.
The values are rounded to three decimal places. The supplementary spreadsheet provides intermediate values, θ-sensitivity results, scenario calculations, entropy weight traces, and Einstein aggregation traces as a transparent reproducibility companion rather than standalone simulation software.
3.4. Final Ranking Results
The final aggregation scores are
The resulting ranking is
HJT ranks first because it combines the lowest UV degradation among the considered technologies, strong thermal resilience, and higher dust tolerance balance. TOPCon remains competitive due to high efficiency, but its higher UV sensitivity reduces its overall suitability under GCC stress. PERC has a favorable cost score but is less competitive when dust and thermal effects dominate the decision structure.
3.5. Scenario-Based Ranking and Benchmark Validation
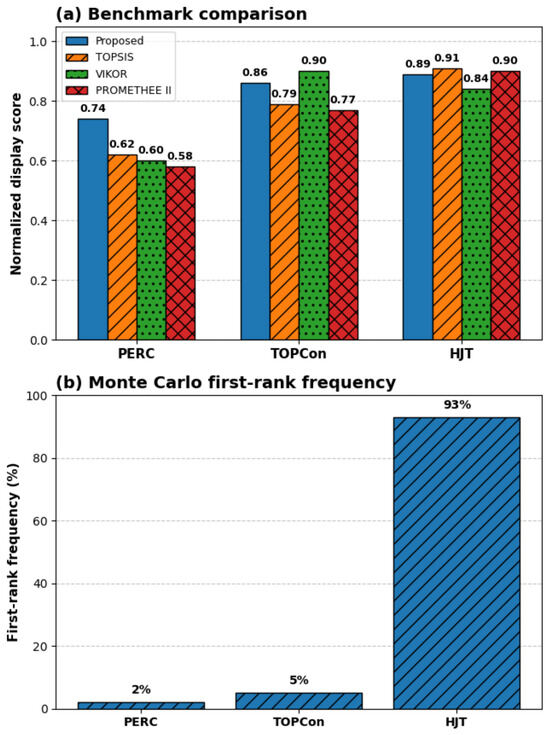
The proposed model is compared with TOPSIS, VIKOR, and PROMETHEE II using the same evidence-calibrated decision matrix. TOPSIS and PROMETHEE II preserve the same ranking as the proposed model, while VIKOR gives TOPCon the first rank due to compromise ranking behavior. The mean Spearman benchmark agreement is 0.83, indicating substantial agreement with established MCDM tools while still allowing the VIKOR rank reversal case to be reported transparently. Table 7 summarizes the single-factor scenario-based ranking results.
Table 7.
Scenario-based ranking results.
To address combined GCC operating conditions, the scenario analysis was expanded beyond single-factor stress cases. The additional scenario logic considers simultaneous dust, heat, UV, humidity, and salinity effects, which better reflects inland and coastal GCC deployment environments.
To further address combined environmental stress conditions, Table 8 reports the combined stress rows derived directly from Appendix A, Table A2. The scenario scores are calculated as the arithmetic mean of the emphasized normalized criteria, and the values in Table 8 therefore match Appendix A, Table A2 for the combined dust, thermal, and UV stress cases.
Table 8.
Combined environmental stress scenario scores.
The mean Spearman benchmark agreement is summarized as
3.6. Monte Carlo Robustness and Sensitivity Analysis
The robustness analysis was expanded to account for uncertainty in both criterion weights and decision matrix values. Criterion weights were perturbed by ±20%, and the calibrated matrix values were perturbed within bounded uncertainty intervals while keeping all normalized values within the range from 0 to 1. The baseline robustness test uses 1000 perturbation runs. The supplementary workbook reports the configuration, first-rank counts, and reproducibility path used to trace the analysis, but it should be interpreted as a reproducibility companion rather than as standalone simulation software. HJT preserves the first position in 93.0% of runs, which is reported as the HJT first-rank preservation probability (0.930).
The sensitivity analysis indicates the following relative influence pattern among the scored and contextual stress drivers: dust, followed by thermal resistance, UV resistance, secondary coastal modifiers, and the cost-effectiveness proxy.
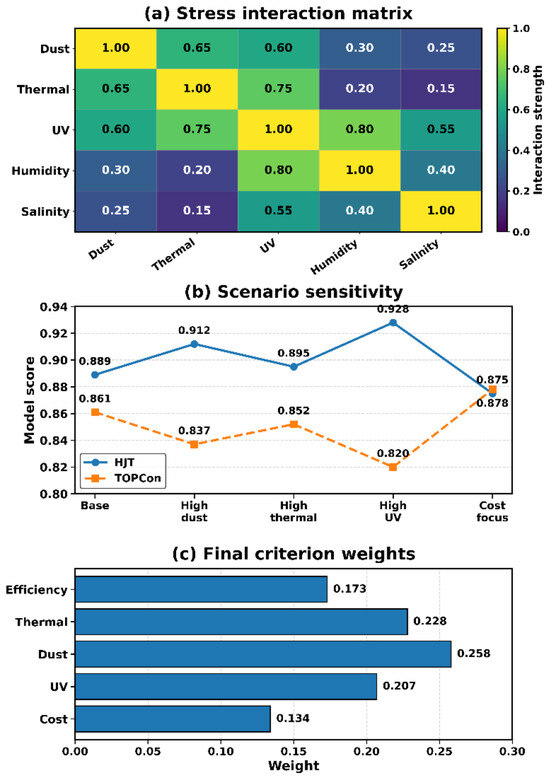
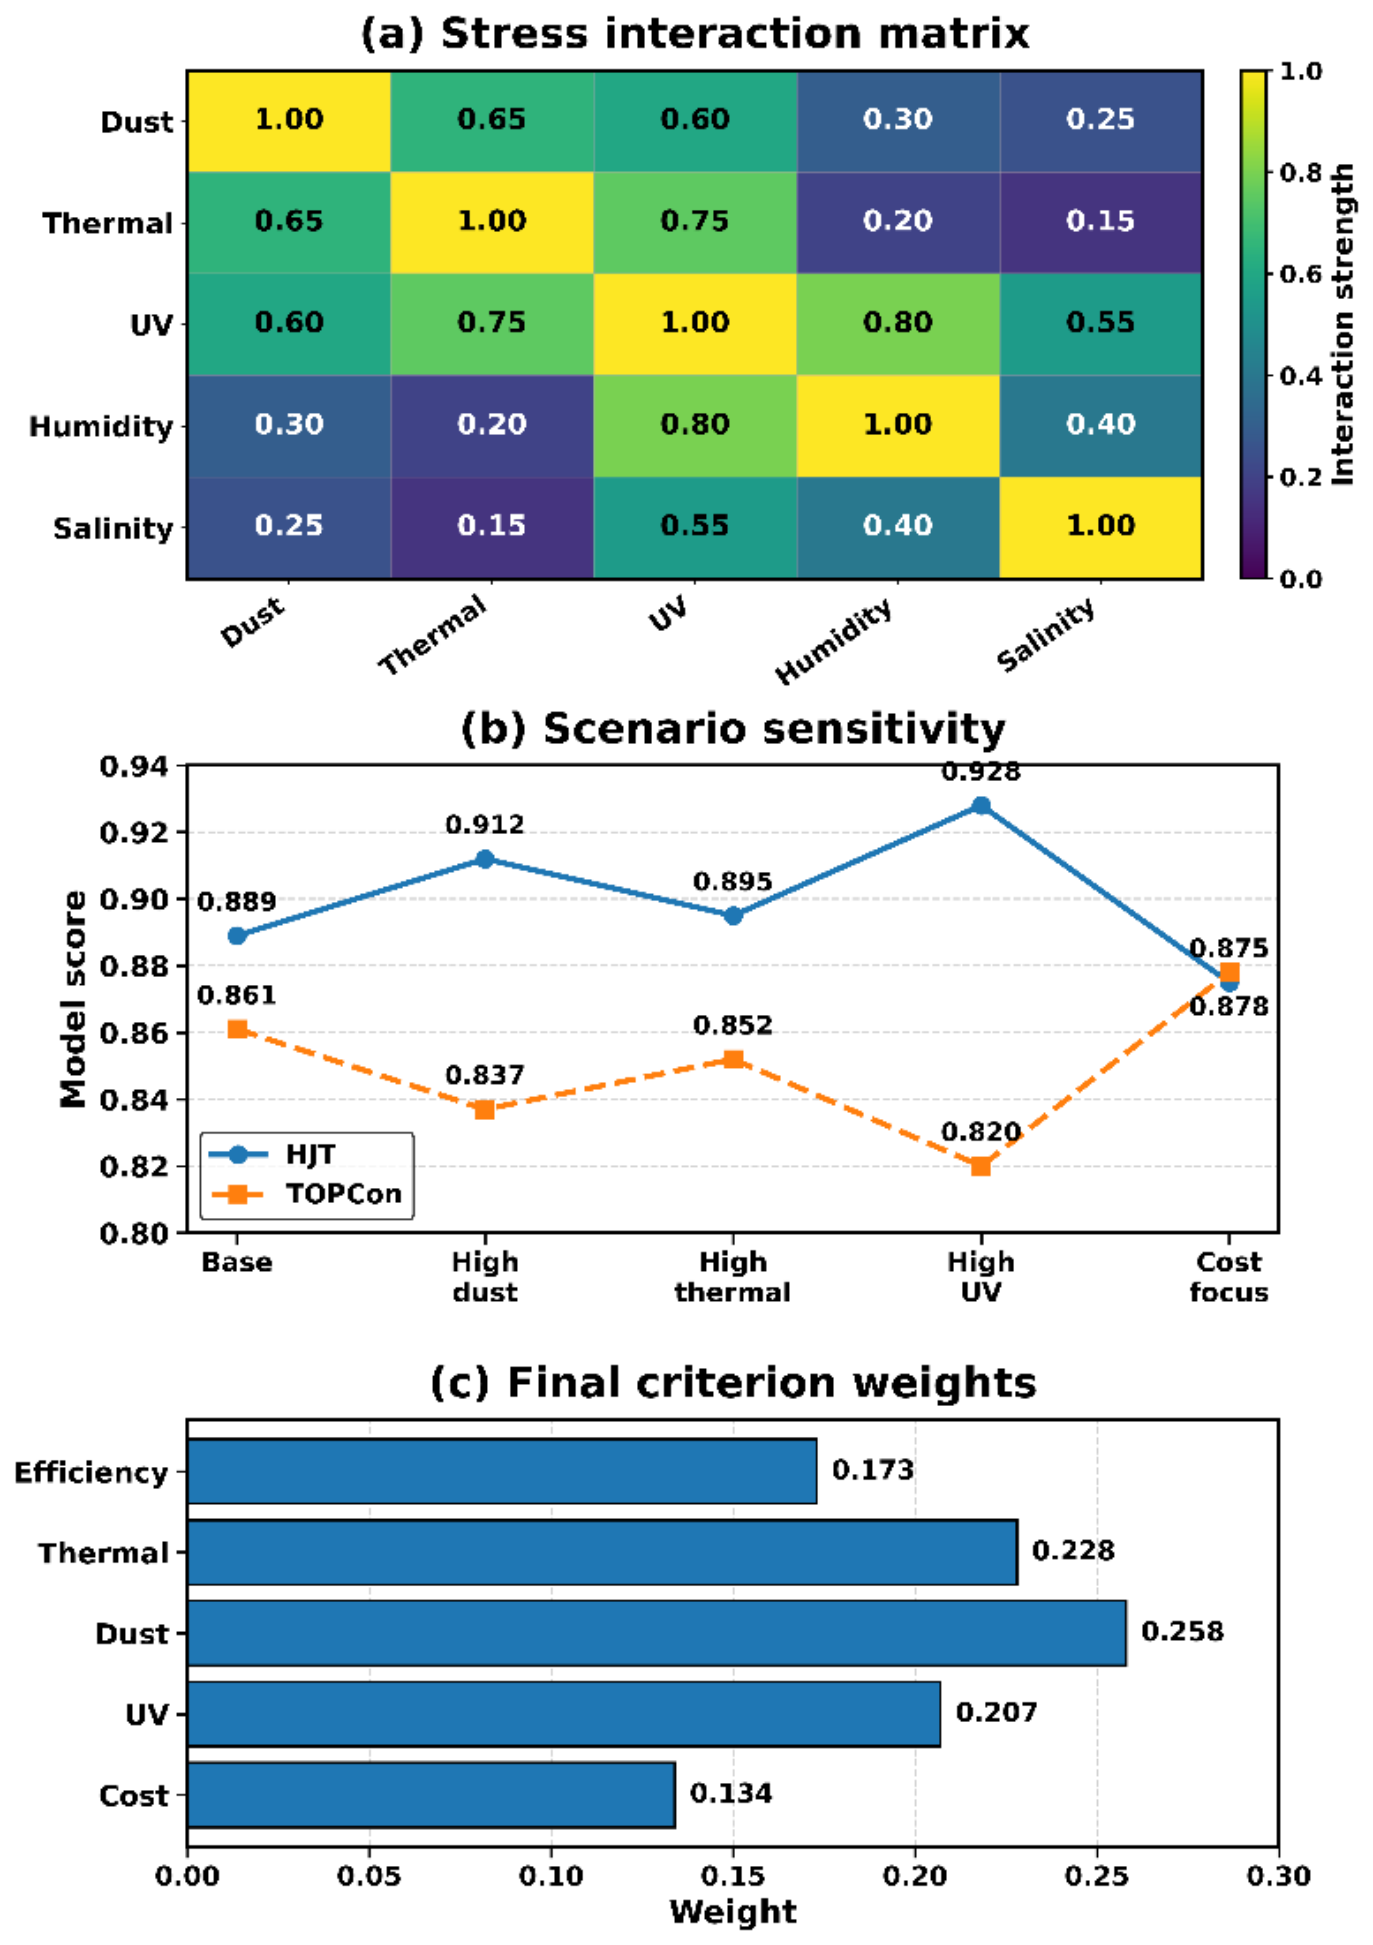
Figure 2 presents the model calibration and weighting behavior. The stress interaction matrix is reported as a scenario interaction map used for structural interpretation, while the sensitivity panel displays HJT and TOPCon as the two leading alternatives that determine the rank stability margin; PERC is reported in the scenario and ranking tables.
Figure 2.
Model calibration and structural behavior: (a) scenario-based stress interaction map used for structural interpretation, not a direct field-measured correlation matrix; (b) sensitivity analysis for HJT and TOPCon under representative scenarios; and (c) final criterion weights.
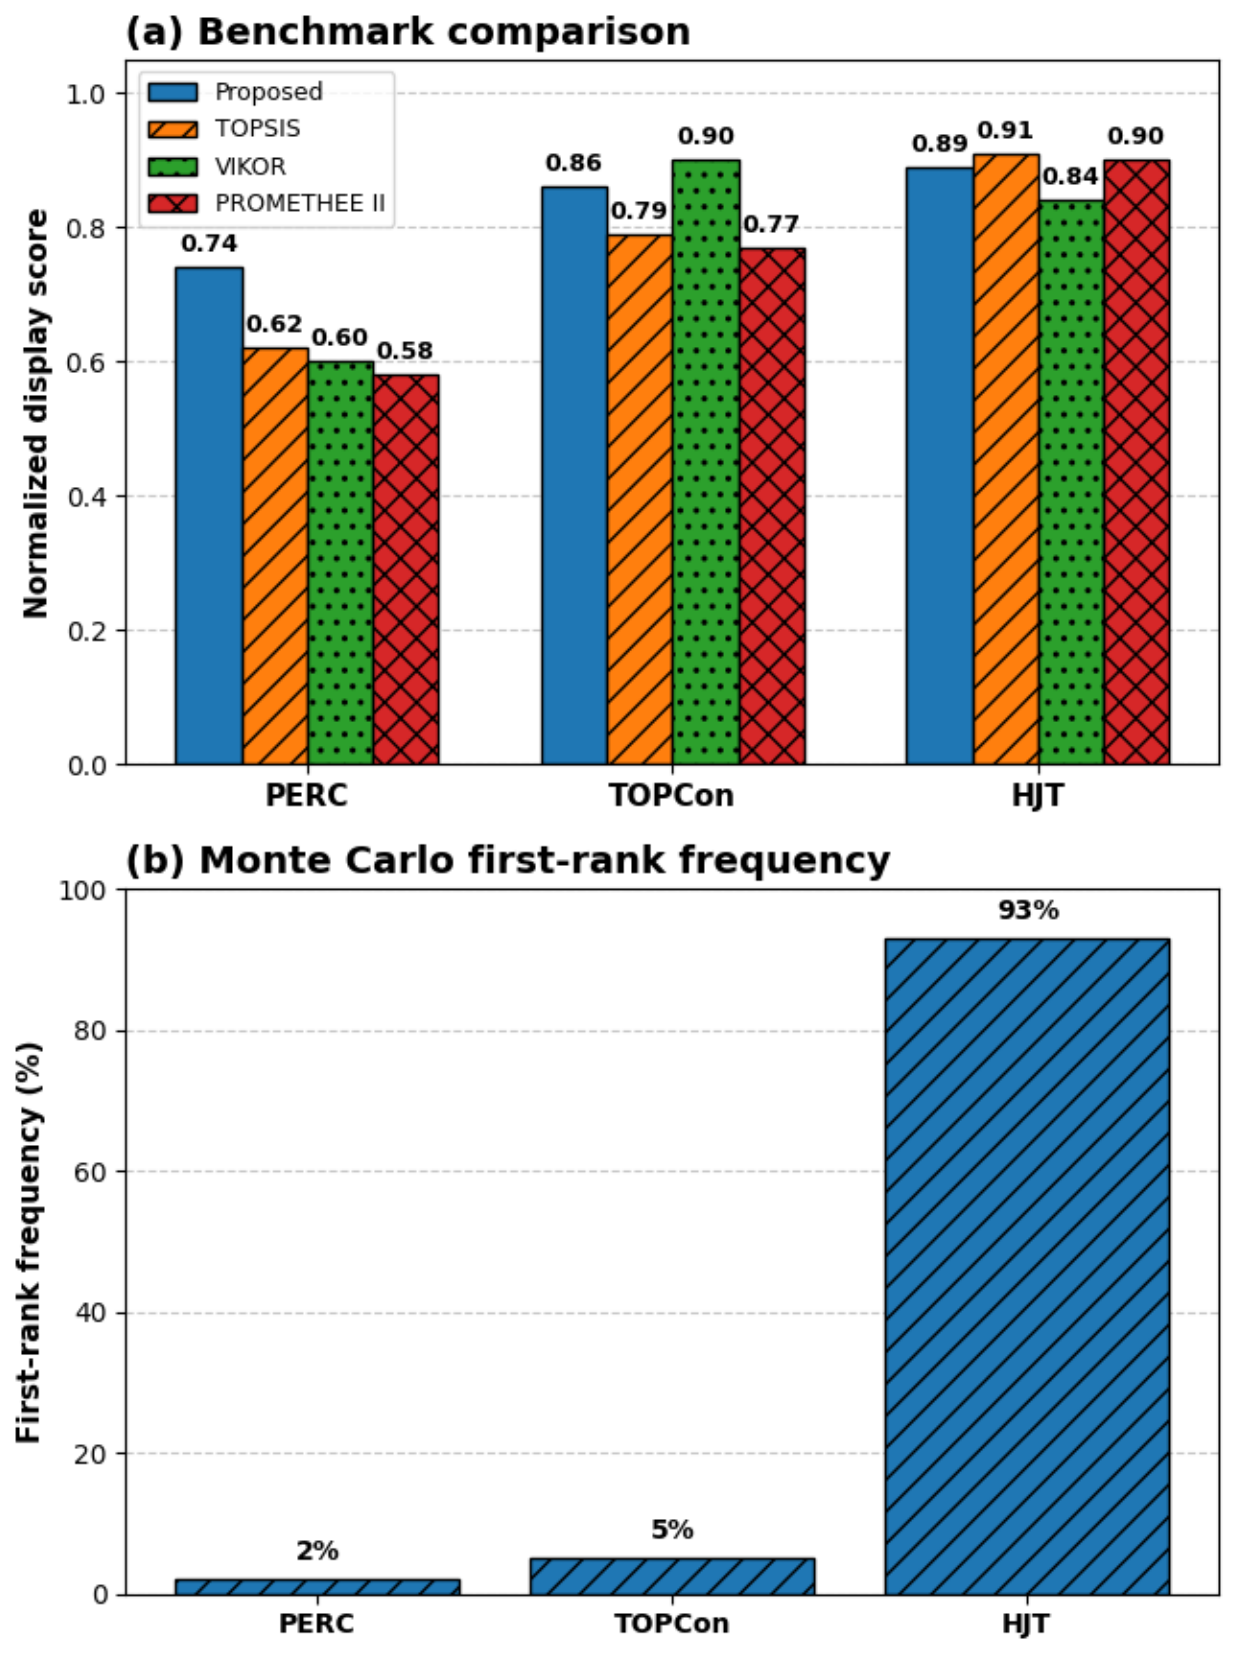
Figure 3 presents benchmark and robustness evidence. The benchmark panel reports normalized display scores for visual comparison, while the final interpretation of VIKOR follows the compromise ranking order reported in Table 9.
Figure 3.
Benchmark comparison and Monte Carlo robustness results: (a) normalized benchmark display scores across MCDM methods for visual comparison and (b) Monte Carlo first-rank frequency.
Table 9.
Comparative benchmark validation.
Table 10 reports the Monte Carlo first-rank preservation results.
Table 10.
Monte Carlo first-rank preservation results.
4. Discussion
The results show that PV technology ranking in GCC deserts is governed primarily by environmental degradation rather than nominal efficiency alone. Dust tolerance receives the highest hybrid weight because soiling directly reduces irradiance transmission and increases cleaning and maintenance needs in desert environments [1,11,30]. Thermal resistance and UV resistance also carry high weights because module temperature and prolonged UV exposure accelerate degradation pathways such as encapsulant discoloration, delamination, and electrical losses [2,3,14,15,16].
The first-rank position of HJT is technically meaningful. HJT combines low UV degradation, high temperature resilience, and strong dust tolerance balance. TOPCon remains a strong candidate where efficiency carries greater decision weight, but its UV sensitivity reduces its relative score under harsh desert exposure. PERC remains economically attractive in moderate-stress environments, but it is less competitive in severe multi-stress zones where dust and thermal effects carry greater weight.
The nonlinear Einstein aggregation structure strengthens the decision interpretation because it does not force all criteria to combine additively. In desert PV systems, dust, heat, and UV exposure interact through physical pathways: dust changes optical absorption and module surface conditions, heat accelerates material degradation, and UV exposure affects encapsulant and cell interface stability. A non-separable aggregation structure is therefore more consistent with the coupled nature of the engineering problem than a purely additive score.
From a practical planning perspective, the framework supports differentiated PV procurement in GCC regions. High-dust inland zones should prioritize technologies with strong soiling and thermal resilience, while moderate-dust urban zones may favor higher-efficiency technologies if cleaning logistics and cost remain favorable. This makes the framework relevant to utility-scale solar developers, energy ministries, procurement teams, and desert PV researchers.
The practical decision interpretation is as follows: HJT may be preferred for high-dust, high-thermal, and UV-intensive sites when budget allows because its ranking is supported by degradation resilience indicators. TOPCon remains a strong option when high efficiency and cost performance balance are prioritized under moderate stress. PERC remains relevant in lower-stress or cost-constrained projects, but its selection should be supported by stronger cleaning logistics and site-specific O&M planning. For coastal humidity/salinity conditions, the framework recommends additional field validation because public harmonized cross-technology data remain limited.
4.1. Stress-to-Decision Translation for Desert PV Technology Selection
The proposed framework can also be interpreted as a stress-to-decision translation layer for desert PV technology selection. This interpretation is useful because PV degradation studies and PV decision-making studies often remain separated. Degradation studies document soiling, thermal stress, UV exposure, humidity, salinity, encapsulant aging, corrosion, and operation-and-maintenance effects, whereas MCDM studies often start from a normalized decision matrix without explicitly showing how environmental stress evidence is converted into technology selection criteria. The framework links these two levels by translating published GCC/desert PV stress evidence into decision criteria, criterion weights, and technology rankings.
The need for this translation layer is supported by the PV reliability literature and IEA PVPS Task 13 guidance. Task 13 reports emphasize that soiling affects PV performance and that operation-and-maintenance strategies should be adapted to climate-specific conditions [32,35], while recent Task 13 degradation work highlights the relevance of failure modes in new PV technologies [33]. In the MCDM literature, sustainable energy decisions are commonly separated into criteria selection, criteria weighting, evaluation, and aggregation steps [18,19,20]. The proposed framework connects these decision steps to PV stress mechanisms rather than treating criteria as generic inputs. Table 11 summarizes the stress-to-decision translation logic for desert PV technology selection.
Table 11.
Stress-to-decision translation logic for desert PV technology selection.
This stress-to-decision table supports reuse of the framework in future PV technology selection studies by documenting how each environmental stressor enters the decision logic. It also clarifies that the ranking is a desert-suitability ranking rather than a nominal-efficiency ranking independent of site conditions.
This interpretation strengthens the practical meaning of the results. HJT ranks first not only because of its final aggregation score but because its evidence profile aligns better with the combined desert-stress mechanisms emphasized in the model. TOPCon remains a strong option when high conversion efficiency and cost-performance balance are prioritized under moderate stress. Recent TOPCon reliability evidence also supports the need to evaluate advanced PV technologies under stress-specific reliability conditions [31]. PERC remains relevant in lower-stress or strongly cost-constrained deployments, but its selection should be supported by cleaning logistics and site-specific O&M planning.
4.2. Limitations and Future Work
The study has limitations. First, the calibration dataset is assembled from multiple regional studies rather than one synchronized cross-country experiment. Second, humidity and salinity are treated as secondary modifiers because harmonized public datasets remain limited. Third, only three PV technologies are compared. Future work could include IBC, tandem, and perovskite–silicon modules and should validate rankings using long-term field measurements from a coordinated GCC testbed. Future extensions could also follow climate-specific PV optimization guidance when applying the framework to additional GCC operating environments [34].
5. Conclusions
This study developed a GCC evidence-calibrated nonlinear decision-support framework for PV technology selection under coupled desert environmental stress. The framework links published GCC/desert PV evidence with adaptive entropy–desert weighting, bipolar fuzzy Einstein aggregation, benchmark MCDM comparison, theta sensitivity, and Monte Carlo rank-stability testing.
The main result is that HJT ranks first, followed by TOPCon and PERC, with dust tolerance, thermal resistance, and UV resistance acting as the most influential decision drivers. The practical implication is that GCC PV procurement should not rely on nominal efficiency alone; it should account for coupled soiling, as well as thermal and degradation stresses. The main limitations are that the framework compares three technologies and uses heterogeneous literature-derived inputs rather than one synchronized GCC field campaign. Future work should validate the ranking using coordinated long-term GCC testbeds and extend the alternatives to IBC, tandem, and perovskite–silicon modules. The stress-to-decision translation layer further supports reuse of the framework in future studies that need to convert desert PV degradation evidence into transparent MCDM criteria and practical selection guidance.
Supplementary Materials
The following supporting information can be downloaded at: https://www.mdpi.com/article/10.3390/en19163908/s1, The following supporting information is provided as a supplementary spreadsheet: Table S1: Raw calibration inputs; Table S2: Calibrated decision matrix; Table S3: Formula-driven entropy and desert-adaptive weights; Table S4: Theta-sensitivity analysis; Table S5: Individual and combined desert-stress scenarios; Table S6: Benchmark ranking outputs; Table S7: Monte Carlo robustness outputs; Table S8: Einstein aggregation traceability; Table S9: Reproducibility notes, replication settings, and first-rank preservation formulas.
Author Contributions
Conceptualization, G.M. and A.E.; methodology, G.M., A.E. and A.A. (Azmi Alazzam); validation, A.O., S.B. and A.A. (Abdelrahman Altigani); formal analysis, G.M. and A.E.; investigation, B.H. and M.A.; data curation, G.M., A.O. and S.B.; writing—original draft preparation, G.M.; writing—review and editing, A.E., A.A. (Azmi Alazzam), A.O., S.B., B.H., M.A. and A.A. (Abdelrahman Altigani); visualization, G.M.; supervision, G.M. and A.E.; project administration, G.M.; funding acquisition, G.M. All authors have read and agreed to the published version of the manuscript.
Funding
The APC was funded by the Higher Colleges of Technology (HCT), United Arab Emirates.
Data Availability Statement
The normalized decision matrix, weighting calculations, entropy formula checks, benchmark rankings, theta-sensitivity results, combined stress scenario calculations, Einstein aggregation traceability, and Monte Carlo configuration/results generated for this study are provided in the Supplementary Spreadsheet accompanying this submission. The source literature values remain traceable to the cited publications and are transformed only through the stated normalization and calibration rules. The Supplementary Workbook is provided as a reproducibility companion that reports supporting inputs, intermediate values, configuration choices, and output tables; it is not intended to serve as a standalone probabilistic simulation package.
Acknowledgments
The authors thank the Academic Editor, reviewers, and the MDPI editorial and production teams for their careful handling of the manuscript and for comments that improved its clarity and presentation.
Conflicts of Interest
The authors declare no conflicts of interest. The funders had no role in the design of the study; in the collection, analyses or interpretation of data; in the writing of the manuscript; or in the decision to publish the results.
Abbreviations and Symbols
Mathematical symbols and model notation used in the proposed framework:
General abbreviations and acronyms used in the proposed framework:
| Definition | Mathematical Symbol/Notation |
| Photovoltaic alternative i | |
| Decision criterion j | |
| Set of PV alternatives | |
| Set of decision criteria | |
| Environmental stress vector | |
| Thermal stress, dust loading, UV exposure/degradation intensity, humidity, and salinity | |
| GCC evidence-calibrated decision matrix | |
| Normalized performance of alternative i under criterion j after GCC evidence calibration | |
| Normalized criterion value | |
| Entropy proportional value | |
| Entropy value of criterion j | |
| Entropy normalization constant | |
| Number of alternatives and number of criteria, respectively | |
| Entropy-based weight of criterion j | |
| Criterion-level desert-stress intensity | |
| Desert-stress weight of criterion j | |
| Final hybrid weight of criterion j | |
| Hybrid weighting balance parameter | |
| Einstein sum | |
| Einstein product | |
| Aggregated positive evidence component | |
| Aggregated negative degradation penalty component | |
| Final bipolar fuzzy Einstein score | |
| Random perturbation applied to criterion weight j during Monte Carlo run k | |
| Uniform perturbation interval used for ±20% weight uncertainty | |
| First-rank preservation probability | |
| Number of Monte Carlo runs in which alternative i ranks first | |
| Total number of Monte Carlo perturbation runs |
| Abbreviation/Acronym | Definition |
| GCC | Gulf Cooperation Council |
| PV | Photovoltaic |
| MCDM | Multi-criteria decision-making |
| UV | Ultraviolet |
| PERC | Passivated emitter and rear cell |
| TOPCon | Tunnel oxide passivated contact |
| HJT | Heterojunction technology |
| TOPSIS | Technique for Order Preference by Similarity to Ideal Solution |
| VIKOR | VIKOR compromise-ranking method |
| PROMETHEE | Preference Ranking Organization Method for Enrichment Evaluations |
| AHP | Analytic Hierarchy Process |
| O&M | Operation and maintenance |
Appendix A. Reproducibility Checklist
Table A1 summarizes the reproducibility checklist for the proposed GCC evidence-calibrated decision framework.
Table A1.
Reproducibility checklist for the proposed GCC evidence-calibrated decision framework.
Table A2.
Scenario-based stress emphasis check under individual and combined GCC desert-stress conditions.
References
- Javed, W.; Guo, B.; Figgis, B.; Martin Pomares, L.; Aïssa, B. Multi-year field assessment of seasonal variability of photovoltaic soiling and environmental factors in a desert environment. Sol. Energy 2020, 211, 1392–1402. [Google Scholar] [CrossRef] [Scilit]
- Bahaidarah, H.; Rehman, S.; Subhan, A.; Gandhidasan, P.; Baig, H. Performance evaluation of a PV module under climatic conditions of Dhahran, Saudi Arabia. Energy Explor. Exploit. 2015, 33, 909–929. [Google Scholar] [CrossRef] [Scilit]
- Adothu, B.; Aly, S.P.; Bhaduri, S.; Alhamadani, H.; Jäckel, B.; Islam, F.; Gottschalg, R.; Alberts, V.; Alam, M.A. UV-induced degradation of new generation bifacial HJT, IBC, PERC, and TOPCON PV modules. In Proceedings of the 2025 IEEE 53rd Photovoltaic Specialists Conference (PVSC), Montreal, QC, Canada, 8–13 June 2025; IEEE: Piscataway, NJ, USA, 2025; pp. 849–853. [Google Scholar] [CrossRef] [Scilit]
- Kivambe, M.; Abdallah, A.; Figgis, B.; Abdelrahim, M.; Elgaili, M.; Pillai, D.; Aïssa, B. Comprehensive assessment of performance and reliability of PERC, TOPCon and SHJ modules in desert climates. Sol. Energy 2025, 295, 113555. [Google Scholar] [CrossRef] [Scilit]
- Green, M.A.; Dunlop, E.D.; Yoshita, M.; Kopidakis, N.; Bothe, K.; Siefer, G.; Hinken, D.; Rauer, M.; Hohl-Ebinger, J.; Hao, X. Solar cell efficiency tables (Version 64). Prog. Photovolt. Res. Appl. 2024, 32, 425–441. [Google Scholar] [CrossRef] [Scilit]
- van de Kaa, G.; Rezaei, J.; Kamp, L.; de Winter, A. Photovoltaic technology selection: A fuzzy MCDM approach. Renew. Sustain. Energy Rev. 2014, 32, 662–670. [Google Scholar] [CrossRef] [Scilit]
- Ziemba, P.; Szaja, M. Fuzzy decision-making model for solar photovoltaic panel evaluation. Energies 2023, 16, 5161. [Google Scholar] [CrossRef] [Scilit]
- Şahin, M. A comprehensive analysis of weighting and multicriteria methods in the context of sustainable energy. Int. J. Environ. Sci. Technol. 2021, 18, 1591–1616. [Google Scholar] [CrossRef] [Scilit] [PubMed]
- Sałabun, W.; Wątróbski, J.; Shekhovtsov, A. Are MCDA methods benchmarkable? A comparative study of TOPSIS, VIKOR, COPRAS, and PROMETHEE II methods. Symmetry 2020, 12, 1549. [Google Scholar] [CrossRef] [Scilit]
- Wang, C.-N.; Nguyen, V.T.; Kao, J.-C.; Chen, C.-C.; Nguyen, V.T. Multi-criteria decision-making methods in fuzzy decision problems: A case study in the frozen shrimp industry. Symmetry 2021, 13, 370. [Google Scholar] [CrossRef] [Scilit]
- Ilse, K.; Micheli, L.; Figgis, B.W.; Lange, K.; Daßler, D.; Hanifi, H.; Wolfertstetter, F.; Naumann, V.; Hagendorf, C.; Gottschalg, R.; et al. Techno-economic assessment of soiling losses and mitigation strategies for solar power generation. Joule 2019, 3, 2303–2321. [Google Scholar] [CrossRef] [Scilit]
- Dahlioui, D.; Laarabi, B.; Barhdadi, A. Review on dew water effect on soiling of solar panels: Towards its enhancement or mitigation. Sustain. Energy Technol. Assess. 2022, 49, 101774. [Google Scholar] [CrossRef] [Scilit]
- Mekhilef, S.; Saidur, R.; Kamalisarvestani, M. Effect of dust, humidity and air velocity on efficiency of photovoltaic cells. Renew. Sustain. Energy Rev. 2012, 16, 2920–2925. [Google Scholar] [CrossRef] [Scilit]
- Jordan, D.C.; Kurtz, S.R. Photovoltaic degradation rates-an analytical review. Prog. Photovolt. Res. Appl. 2013, 21, 12–29. [Google Scholar] [CrossRef] [Scilit]
- Köntges, M.; Altmann, S.; Heimberg, T.; Jahn, U.; Berger, K.A. Mean degradation rates in PV systems for various kinds of PV module failures. In Proceedings of the 32nd European Photovoltaic Solar Energy Conference and Exhibition, Munich, Germany, 20–24 June 2016; pp. 21–24. [Google Scholar] [CrossRef] [Scilit]
- Hadj Mahammed, I.; Hadj Arab, A.; Berrah, S.; Bakelli, Y. Impact of the desert climate on the degradation of photovoltaic modules characteristics: A case study. Energy Sources Part A Recovery Util. Environ. Eff. 2022, 44, 6021–6034. [Google Scholar] [CrossRef] [Scilit]
- Shao, M.; Han, Z.; Sun, J.; Xiao, C.; Zhang, S.; Zhao, Y. A review of multi-criteria decision making applications for renewable energy site selection. Renew. Energy 2020, 157, 377–403. [Google Scholar] [CrossRef] [Scilit]
- Wang, J.-J.; Jing, Y.-Y.; Zhang, C.-F.; Zhao, J.-H. Review on multi-criteria decision analysis aid in sustainable energy decision-making. Renew. Sustain. Energy Rev. 2009, 13, 2263–2278. [Google Scholar] [CrossRef] [Scilit]
- Kumar, A.; Sah, B.; Singh, A.R.; Deng, Y.; He, X.; Kumar, P.; Bansal, R.C. A review of multi criteria decision making (MCDM) towards sustainable renewable energy development. Renew. Sustain. Energy Rev. 2017, 69, 596–609. [Google Scholar] [CrossRef] [Scilit]
- Mardani, A.; Zavadskas, E.K.; Khalifah, Z.; Zakuan, N.; Jusoh, A.; Nor, K.M.; Khoshnoudi, M. A review of multi-criteria decision-making applications to solve energy management problems: Two decades from 1995 to 2015. Renew. Sustain. Energy Rev. 2017, 71, 216–256. [Google Scholar] [CrossRef] [Scilit]
- Wang, W.; Liu, X. Intuitionistic fuzzy geometric aggregation operators based on Einstein operations. Int. J. Intell. Syst. 2011, 26, 1049–1075. [Google Scholar] [CrossRef] [Scilit]
- Tan, C. Generalized intuitionistic fuzzy geometric aggregation operator and its application to multi-criteria group decision making. Soft Comput. 2011, 15, 867–876. [Google Scholar] [CrossRef] [Scilit]
- Karande, P.; Zavadskas, E.K.; Chakraborty, S. A study on the ranking performance of some MCDM methods for industrial robot selection problems. Int. J. Ind. Eng. Comput. 2016, 7, 399–422. [Google Scholar] [CrossRef] [Scilit]
- Bortot, S.; Marques Pereira, R.A. Inconsistency and non-additive capacities: The Analytic Hierarchy Process in the framework of Choquet integration. Fuzzy Sets Syst. 2013, 213, 6–26. [Google Scholar] [CrossRef] [Scilit]
- Zhang, L.; Zhang, L.; Zhou, P.; Zhou, D. A non-additive multiple criteria analysis method for evaluation of airline service quality. J. Air Transp. Manag. 2015, 47, 154–161. [Google Scholar] [CrossRef] [Scilit]
- Zhao, X.; Wei, G. Some intuitionistic fuzzy Einstein hybrid aggregation operators and their application to multiple attribute decision making. Knowl.-Based Syst. 2013, 37, 472–479. [Google Scholar] [CrossRef] [Scilit]
- Fahmi, A.; Amin, F.; Abdullah, S.; Ali, A. Cubic fuzzy Einstein aggregation operators and its application to decision-making. Int. J. Syst. Sci. 2018, 49, 2385–2397. [Google Scholar] [CrossRef] [Scilit]
- Khan, S.; Abdullah, S.; Ashraf, S. Picture fuzzy aggregation information based on Einstein operations and their application in decision making. Math. Sci. 2019, 13, 213–229. [Google Scholar] [CrossRef] [Scilit]
- Jamil, M.; Afzal, F.; Akgül, A.; Abdullah, S.; Maqbool, A.; Razzaque, A.; Riaz, M.B.; Awrejcewicz, J. Einstein aggregation operators under bipolar neutrosophic environment with applications in multi-criteria decision-making. Appl. Sci. 2022, 12, 10045. [Google Scholar] [CrossRef] [Scilit]
- Al Jassasi, I.S.; Al Hashmi, H.S.; Al Humairi, A.; Bulale, Y.; Husain, A.; Al-Azzawi, M.; Jung, P. Experimental investigation of the soiling effect on the PV systems performance and the cleaning intervals in Oman. Sol. Energy Adv. 2023, 3, 100045. [Google Scholar] [CrossRef] [Scilit]
- Gebhardt, P.; Kräling, U.; Fokuhl, E.; Hädrich, I.; Philipp, D. Reliability of commercial TOPCon PV modules-an extensive comparative study. Prog. Photovolt. Res. Appl. 2025, 33, 1378–1386. [Google Scholar] [CrossRef] [Scilit]
- Schill, C.; Anderson, A.; Baldus-Jeursen, C.; Burnham, L.; Micheli, L.; Parlevliet, D.; Pilat, E.; Stridh, B.; Urrejola, E. Soiling Losses-Impact on the Performance of Photovoltaic Power Plants; Report IEA-PVPS T13-21:2022; International Energy Agency Photovoltaic Power Systems Programme: Paris, France, 2022; Available online: https://iea-pvps.org/wp-content/uploads/2023/01/IEA-PVPS-T13-21-2022-REPORT-Soiling-Losses-PV-Plants.pdf (accessed on 13 June 2026).
- Köntges, M.; Lin, J.; Virtuani, A.; Eder, G.C.; Oreski, G.; Hacke, P.; Stein, J.S.; Bruckman, L.; Gebhardt, P.; Barrit, D.; et al. Degradation and Failure Modes in New Photovoltaic Cell and Module Technologies; Report IEA-PVPS T13-30:2025; International Energy Agency Photovoltaic Power Systems Programme: Paris, France, 2025. [Google Scholar] [CrossRef] [Scilit]
- Friesen, G.; Micheli, L.; Eder, G.C.; Müller, T.; Ali, J.M.Y.; Rivera, M.; Vásquez, J.A.; Oreski, G.; Burnham, L.; Baldus-Jeursen, C. Optimisation of Photovoltaic Systems for Different Climates; Report IEA-PVPS T13-32:2025; International Energy Agency Photovoltaic Power Systems Programme: Paris, France, 2025. [Google Scholar] [CrossRef] [Scilit]
- Jahn, U.; Herteleer, B.; Tjengdrawira, C.; Tsanakas, I.; Richter, M.; Dickeson, G.; Astigarraga, A.; Tanahashi, T.; Valencia, F.; Green, M.; et al. Guidelines for Operation and Maintenance of Photovoltaic Power Plants in Different Climates; Report IEA-PVPS T13-25:2022; International Energy Agency Photovoltaic Power Systems Programme: Paris, France, 2022; pp. 1–153. ISBN 978-3-907281-13-0. Available online: https://iea-pvps.org/wp-content/uploads/2022/11/IEA-PVPS-Report-T13-25-2022-OandM-Guidelines.pdf (accessed on 13 June 2026).
- Erbey, A.; Fidan, Ü.; Gündüz, C. A robust hybrid weighting scheme based on IQRBOW and entropy for MCDM: Stability and advantage criteria in the VIKOR framework. Entropy 2025, 27, 867. [Google Scholar] [CrossRef] [Scilit] [PubMed]
- Jin, L.; Mesiar, R.; Yager, R.; Qin, J. Dynamic weights allocation according to uncertain evaluation information. Int. J. Gen. Syst. 2019, 48, 33–47. [Google Scholar] [CrossRef] [Scilit]
- Kleijnen, J.P.C. An overview of the design and analysis of simulation experiments for sensitivity analysis. Eur. J. Oper. Res. 2005, 164, 287–300. [Google Scholar] [CrossRef] [Scilit]
- Zhu, F.; Zhong, P.; Sun, Y. Multi-criteria group decision making under uncertainty: Application in reservoir flood control operation. Environ. Model. Softw. 2018, 100, 236–251. [Google Scholar] [CrossRef] [Scilit]

Disclaimer/Publisher’s Note: The statements, opinions and data contained in all publications are solely those of the individual author(s) and contributor(s) and not of MDPI and/or the editor(s). MDPI and/or the editor(s) disclaim responsibility for any injury to people or property resulting from any ideas, methods, instructions or products referred to in the content. |
© 2026 by the authors. Licensee MDPI, Basel, Switzerland. This article is an open access article distributed under the terms and conditions of the Creative Commons Attribution (CC BY) license.