


Abstract
Against the backdrop of the dual-carbon goals, a new power system is undergoing rapid construction, and distributed renewable energy is being connected at high density to regional ring networks. This study deeply explores the impact of photovoltaic (PV) power station connection positions on energy distribution and flow, as well as the voltage and energy loss of ring networks. Firstly, it takes the actual 220 kV/500 kV ring network in a certain city in Yunnan Province as the research object, and constructs a high-precision ETAP simulation model. It then systematically explores the mechanism of how PV power connection positions and grid connection penetration rates affect node voltage and line loss and derives the energy loss calculation formula. On this basis, two differentiated operation scenes corresponding to renewable energy output peaks and valleys are established. Through comparative analysis of multiple sets of simulation data, this study reveals the coupling laws among PV output fluctuation, bidirectional reverse power flow, system energy loss, and voltage over-limit. Finally, combined with the operational pain points of existing ring network and distribution network connection modes, this study proposes diversified loss reduction optimization strategies, including coordinated optimization of active and reactive power, and coordinated regulation of PV power and energy storage. The relevant research conclusions and optimization methods can improve the line loss analysis theory for ring networks integrated with PV power, and provide important engineering references for renewable energy planning and design, operation regulation, and loss management for similar mountain power grids.
1. Introduction
Against the backdrop of China’s “dual-carbon” (carbon peak and carbon neutrality) strategy, the construction of a new power system has become a national priority. In response, China Southern Power Grid Co., Ltd., has proactively advanced its “two types and two modernizations” strategic framework—aimed at facilitating the efficient, secure, and stable integration of renewable energy into the grid. By early 2025, the cumulative installed capacity of renewable energy (including wind and PV generation) in the Southern Power Grid region had exceeded 200 GW [1], surpassing all other generation sources to become the largest single contributor to total installed capacity. However, the inherent characteristics of renewable energy—including output intermittency, spatially distributed grid connection, and low rotational inertia—pose significant technical challenges. Moreover, renewable energy units exhibit comparatively limited voltage regulation capability and inter-regional power transfer capacity relative to conventional synchronous generators. As the share of renewable energy in the generation mix continues to rise, issues such as increased power flow volatility, elevated transmission and distribution losses, and deteriorating power quality have intensified—culminating, in extreme cases, in large-scale cascading disconnection events among renewable generation units [2]. Notably, on 9 February 2025, the National Development and Reform Commission and the National Energy Administration jointly issued a policy directive eliminating the mandatory energy storage co-location requirement for new renewable energy projects. This revision reflects an enhanced emphasis on grid security, operational stability, and real-time supply–demand balance [3].
Regarding distributed energy resources, regulatory measures—including distributed energy storage systems and reactive power compensation devices—have been increasingly deployed across distribution networks to ensure safe and stable distributed energy resource integration [4]. With rising renewable penetration, uncertainties in power and energy balancing, electricity market clearing, and system dispatch have grown substantially. The stochastic and geographically dispersed nature of renewable generation further complicates loss mechanisms [5]. Ref. [6] underscores that China’s uneven geographical distribution of renewable resources and electricity demand necessitates long-distance, high-capacity transmission as an inevitable pathway for future grid development. Refs. [7,8] have elucidated how AC/DC hybrid transmission corridors—and particularly DC power flow patterns—influence network losses, leading to the formulation of an optimal power flow model specifically designed to minimize aggregate network losses. Additional investigations have systematically examined the impact of key equipment and operational parameters—including conductor configuration, synchronous condensers at sending-end stations, transformers, converter stations, and transformer DC bias—on network losses, and proposed targeted mitigation strategies [9].
Current academic research on transmission corridor losses predominantly focuses on equipment-level and operational-mode factors, yet remains insufficient in quantitatively characterizing how the dynamic operating features of renewable generation—such as rapid ramping, reverse load–generation correlation, and probabilistic output variability—affect transmission losses [10,11]. Likewise, the coupled interactions between HVDC transmission corridors and adjacent AC/DC networks, and their collective influence on loss distribution, warrant deeper analytical investigation [12,13]. Several studies have qualitatively assessed the impact of renewable power fluctuations on network losses from both sending- and receiving-end perspectives [14], or analyzed loss sensitivity based on power flow redistribution patterns induced by renewable intermittency [15]. Others have adopted probabilistic modeling—leveraging the statistical distribution of renewable output fluctuations—to establish a quantitative relationship between fluctuation magnitude and incremental network losses, thereby enabling probabilistic loss evaluation [16]. One study further examines how peak–valley load shifting affects transmission and distribution losses under idealized symmetrical three-phase conditions, demonstrating potential loss reduction through temporal load reshaping [17]. Another theoretical analysis explores the compound effects of renewable output volatility and reverse peak regulation on network losses, highlighting the multifaceted and non-linear nature of these impacts [18]. Nevertheless, prevailing methodologies remain largely qualitative; they lack the precision, scalability, and engineering applicability required for identifying localized high-loss segments or supporting real-world operational decision-making [19]. Consequently, there is an urgent need to develop robust, quantitatively grounded, and field-deployable line loss calculation tools tailored to high-renewable-integration scenes. Ref. [20] emphasizes that the scope of reactive power resource management—and associated control strategies—near ultra-high-voltage direct current terminals significantly influences overall system controllability and stability. Refs. [21,22] investigate how large-scale renewable integration alters system-wide reactive power demand, cross-boundary reactive power flows, and reactive power control requirements. Refs. [23,24] examine the coupling between active and reactive power dynamics, revealing underlying mechanisms and key influencing factors governing reactive power’s contribution to network losses.
Strategically sited and capacity-matched distributed generation can effectively alleviate voltage deviation and excessive line losses at distribution nodes characterized by long feeder lengths and high load density. However, excessive DER penetration, suboptimal siting, or non-compliant operational practices may instead trigger voltage violations and abnormally high line losses at specific nodes. Ref. [25] conducts a granular analysis of how DER integration location and capacity affect component-level losses across low-, medium-, and high-voltage distribution networks. For multi-node radial (chain-type) distribution systems, Ref. [26] comprehensively evaluates the joint impact of distributed energy resource capacity and placement on overall line loss trends and proposes practical loss reduction measures. Ref. [27] investigates how four distinct load distribution patterns—uniform, stochastic, periodic, and intermittent—affect line losses, offering methodological insights for subsequent studies on load–loss correlations. Collectively, recent work emphasizes the interdependence among load profile characteristics, distributed energy resource grid connection parameters, operational modes, and unit configurations, and has begun to quantify algebraic relationships between line losses and key influencing variables under idealized modeling assumptions—thereby enabling predictive assessment of total distribution network losses in distributed energy resource-rich environments.
Based on the above analysis, this study aims to explore the impact of the connection of PV power stations on the voltage at regional ring-grid nodes and the system losses, and proposes an effective approach to reduce the losses in the ring network. The main contributions of this paper can be summarized as follows:
- (1)
- It focuses on a regional power system with a typical ring network structure, and establishes a high-precision network topology model that includes equipment such as PV, wind power, and power converters;
- (2)
- It develops a method for calculating power loss in a regional ring-shaped power grid, aiming to study the impact of the capacity of renewable energy integration on the voltage of system nodes and power loss, and to verify the accuracy of the model;
- (3)
- It explores various feasible methods to reduce the loss in the distribution network, thereby providing optimization ideas for the design of the project.
The structure of this article is as follows: Section 2 introduces the research object of this article and develops a simulation model; Section 3 presents the derivation process and result analysis of the theoretical method proposed in this article; Section 4 performs simulation verification using an ETAP 21.0.1 model built from a real-world power system, which verifies the correctness and practical applicability of the proposed method; Section 5 discusses various control methods for system power loss from multiple perspectives; and Section 6 presents the conclusion.
2. A Typical Ring-Shaped Power System for Distributed Renewable Energy Integration
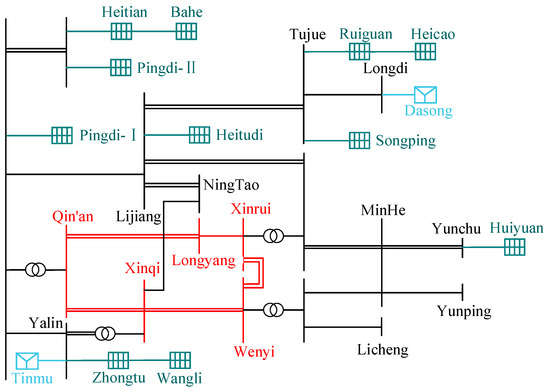
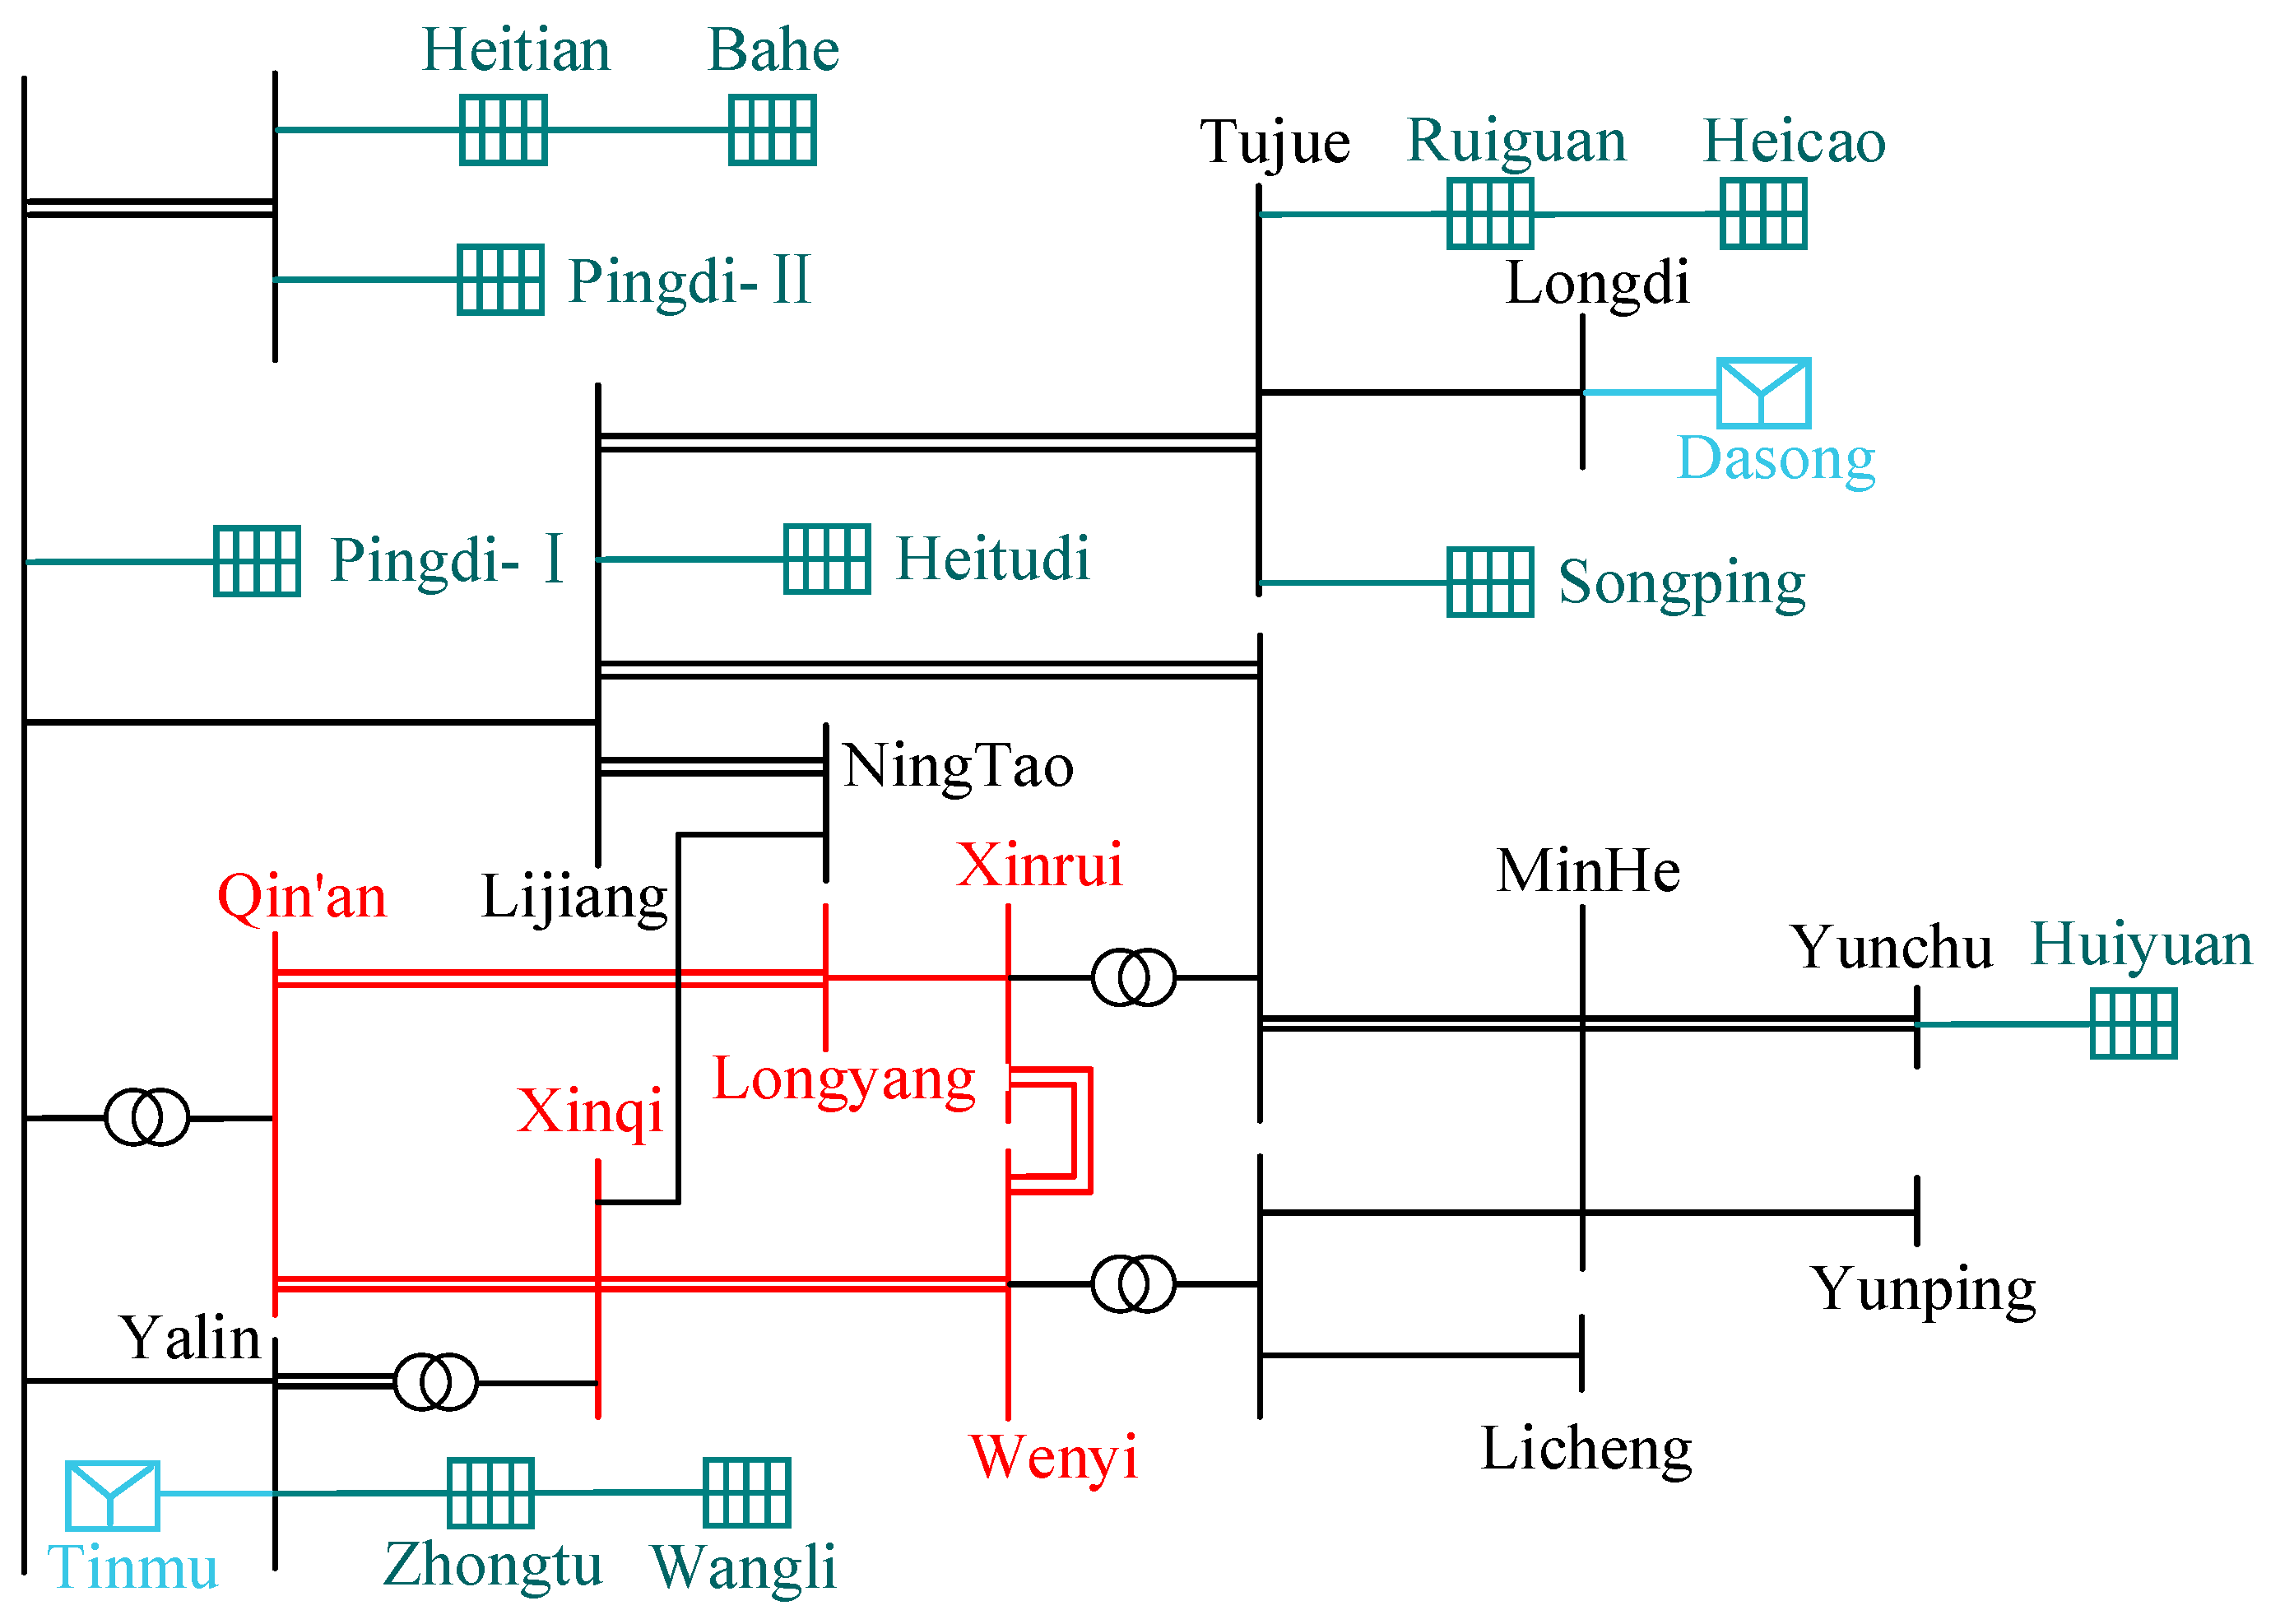
Figure 1 shows the power flow diagram of the power grid in Lijiang City, Yunnan Province, China, on 7 May 2026. It includes 5 regional hub nodes, 5 secondary nodes, 3 terminal nodes, 11 PV power stations, and 2 wind power stations.
Figure 1.
Power grid topology diagram.
Among them, the voltage levels of the four hub nodes—Qin’an, Longyang, Xinqi, and Wenyi—are 500 kV, while the voltage levels of the remaining nodes are 220 kV.
The 11 renewable energy stations are mainly concentrated in 7 locations, with PV power stations as the main capacity contributors and wind power stations as supplements. All of them are connected to the 220 kV/500 kV backbone grid of the Lijiang region, forming a multi-cluster, wide-coverage, hierarchical renewable energy grid access system. The subordinate nodes of each 220 kV node are not listed in detail.
2.1. Substation Area Division and Analysis
The study focuses on the impact of different PV penetration rates on system node voltages and energy losses. Accordingly, the Lijiang regional ring network shown in Figure 1 is divided into three parts: the hub substation, the regional substation, and the renewable energy substation. The main body of the Lijiang regional ring network consists of 4500 kV hub substations (Qin’an, Longyang, Wenyi, Xinqi) and a 1220 kV hub substation (Xinrui). The hub substations conduct energy exchange with adjacent municipal bureaus, and 500/220 kV transformers are installed at three of these substations: Qin’an, Longyang, and Wenyi.
2.1.1. Regional Substations
The Lijiang regional power grid consists of seven regional substations, which form a small ring network with each other and are responsible for receiving the electricity from PV power stations and wind farms. The main parameters are shown in Table 1.
Table 1.
The main parameters of the substations in the Lijiang area.
2.1.2. Renewable Energy Power Stations
There are a total of 11 PV power stations in the Lijiang area, with a total installed capacity of approximately 1500 MW. According to the geographical regions, they can be divided into three major concentrated distribution areas. The statistics are shown in Table 2, Table 3 and Table 4.
Table 2.
PV power stations in the northwest area of Lijiang City.
Table 3.
PV power stations in the northeastern area of Lijiang City.
Table 4.
PV power stations in the southeastern area of Lijiang City.
Table 2 shows the Lijiang northwest area, which is the core concentrated zone for PV power generation in Lijiang. A total of three PV power stations have been constructed here, forming a contiguous PV cluster. With a total installed capacity exceeding 380 MW, this area is the PV zone with the highest installed density in the region.
As shown in Table 3, the northeastern area of Lijiang is the second largest PV cluster area in Lijiang. It hosts a total of four PV power stations, with an aggregate installed capacity exceeding 450 MW. The power stations are distributed in a belt along the Longyang 52 transmission line, making this the PV area with the best transmission conditions in the region.
Table 4 shows the southeastern area of Lijiang, which is the multi-point distribution zone for PV power generation in Lijiang. A total of four PV power stations have been built here, with a total installed capacity of approximately 330 MW. They are distributed in a star-shaped pattern around the 220 kV substations of Xinrui and Yunping, and serve as an important supplement for renewable energy integration in this region.
Table 5 provides an overview of the Lijiang wind farms. There are two wind farms in the Lijiang area, with a total installed capacity exceeding 68 MW. Both of them are of a decentralized layout and are connected to the core substations in the south and east areas of Lijiang City.
Table 5.
Wind power stations in Lijiang area.
2.2. Design of the Lijiang Power Grid Simulation Model
As shown in Figure 1, the connection points of the PV power stations are geographically dispersed. However, analysis of the energy flow reveals that most PV power is injected into the ring network via tree-shaped branches.
For PV connection node i, its energy flow mainly consists of two parts—the inflow power Si and the outflow power Si−1; for ring network node j, its energy flow mainly consists of three parts—the clockwise inflow power Sj−1 of the ring network, the clockwise outflow power Sj+1 of the ring network, and the local outflow power Sj.
From an energy flow perspective, the model can be systematically decomposed into essential branches and auxiliary branches. Essential branches represent those components critical to accurately capturing the physical energy flow within the system; auxiliary branches, by contrast, correspond to secondary connections—typically low-impact lines incident to a given node—that contribute minimally to overall energy dynamics. By substituting auxiliary branches with the analytical expression in Equation (1), computational complexity is significantly reduced without compromising modeling fidelity. This simplification strategy aligns with the constant-impedance load representation. In practical power system applications, many power electronic devices inherently behave as constant-power loads; however, under well-justified engineering approximations—such as operating-point linearization or small-signal assumptions—their behavior can be effectively captured using appropriately parameterized constant-impedance equivalents [28].
In the formula, Vreg represents the reference voltage. During actual operation, for the simplified circuit, the voltage error can be disregarded. PLx + jQLx represents the actual power consumed by the circuit.
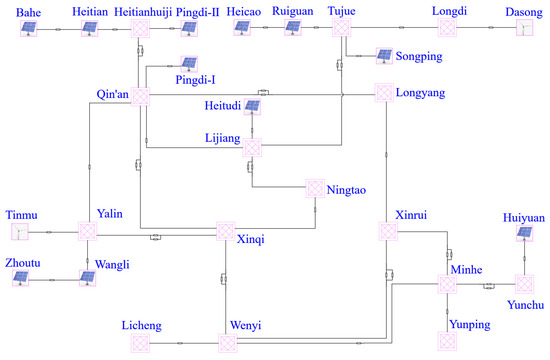
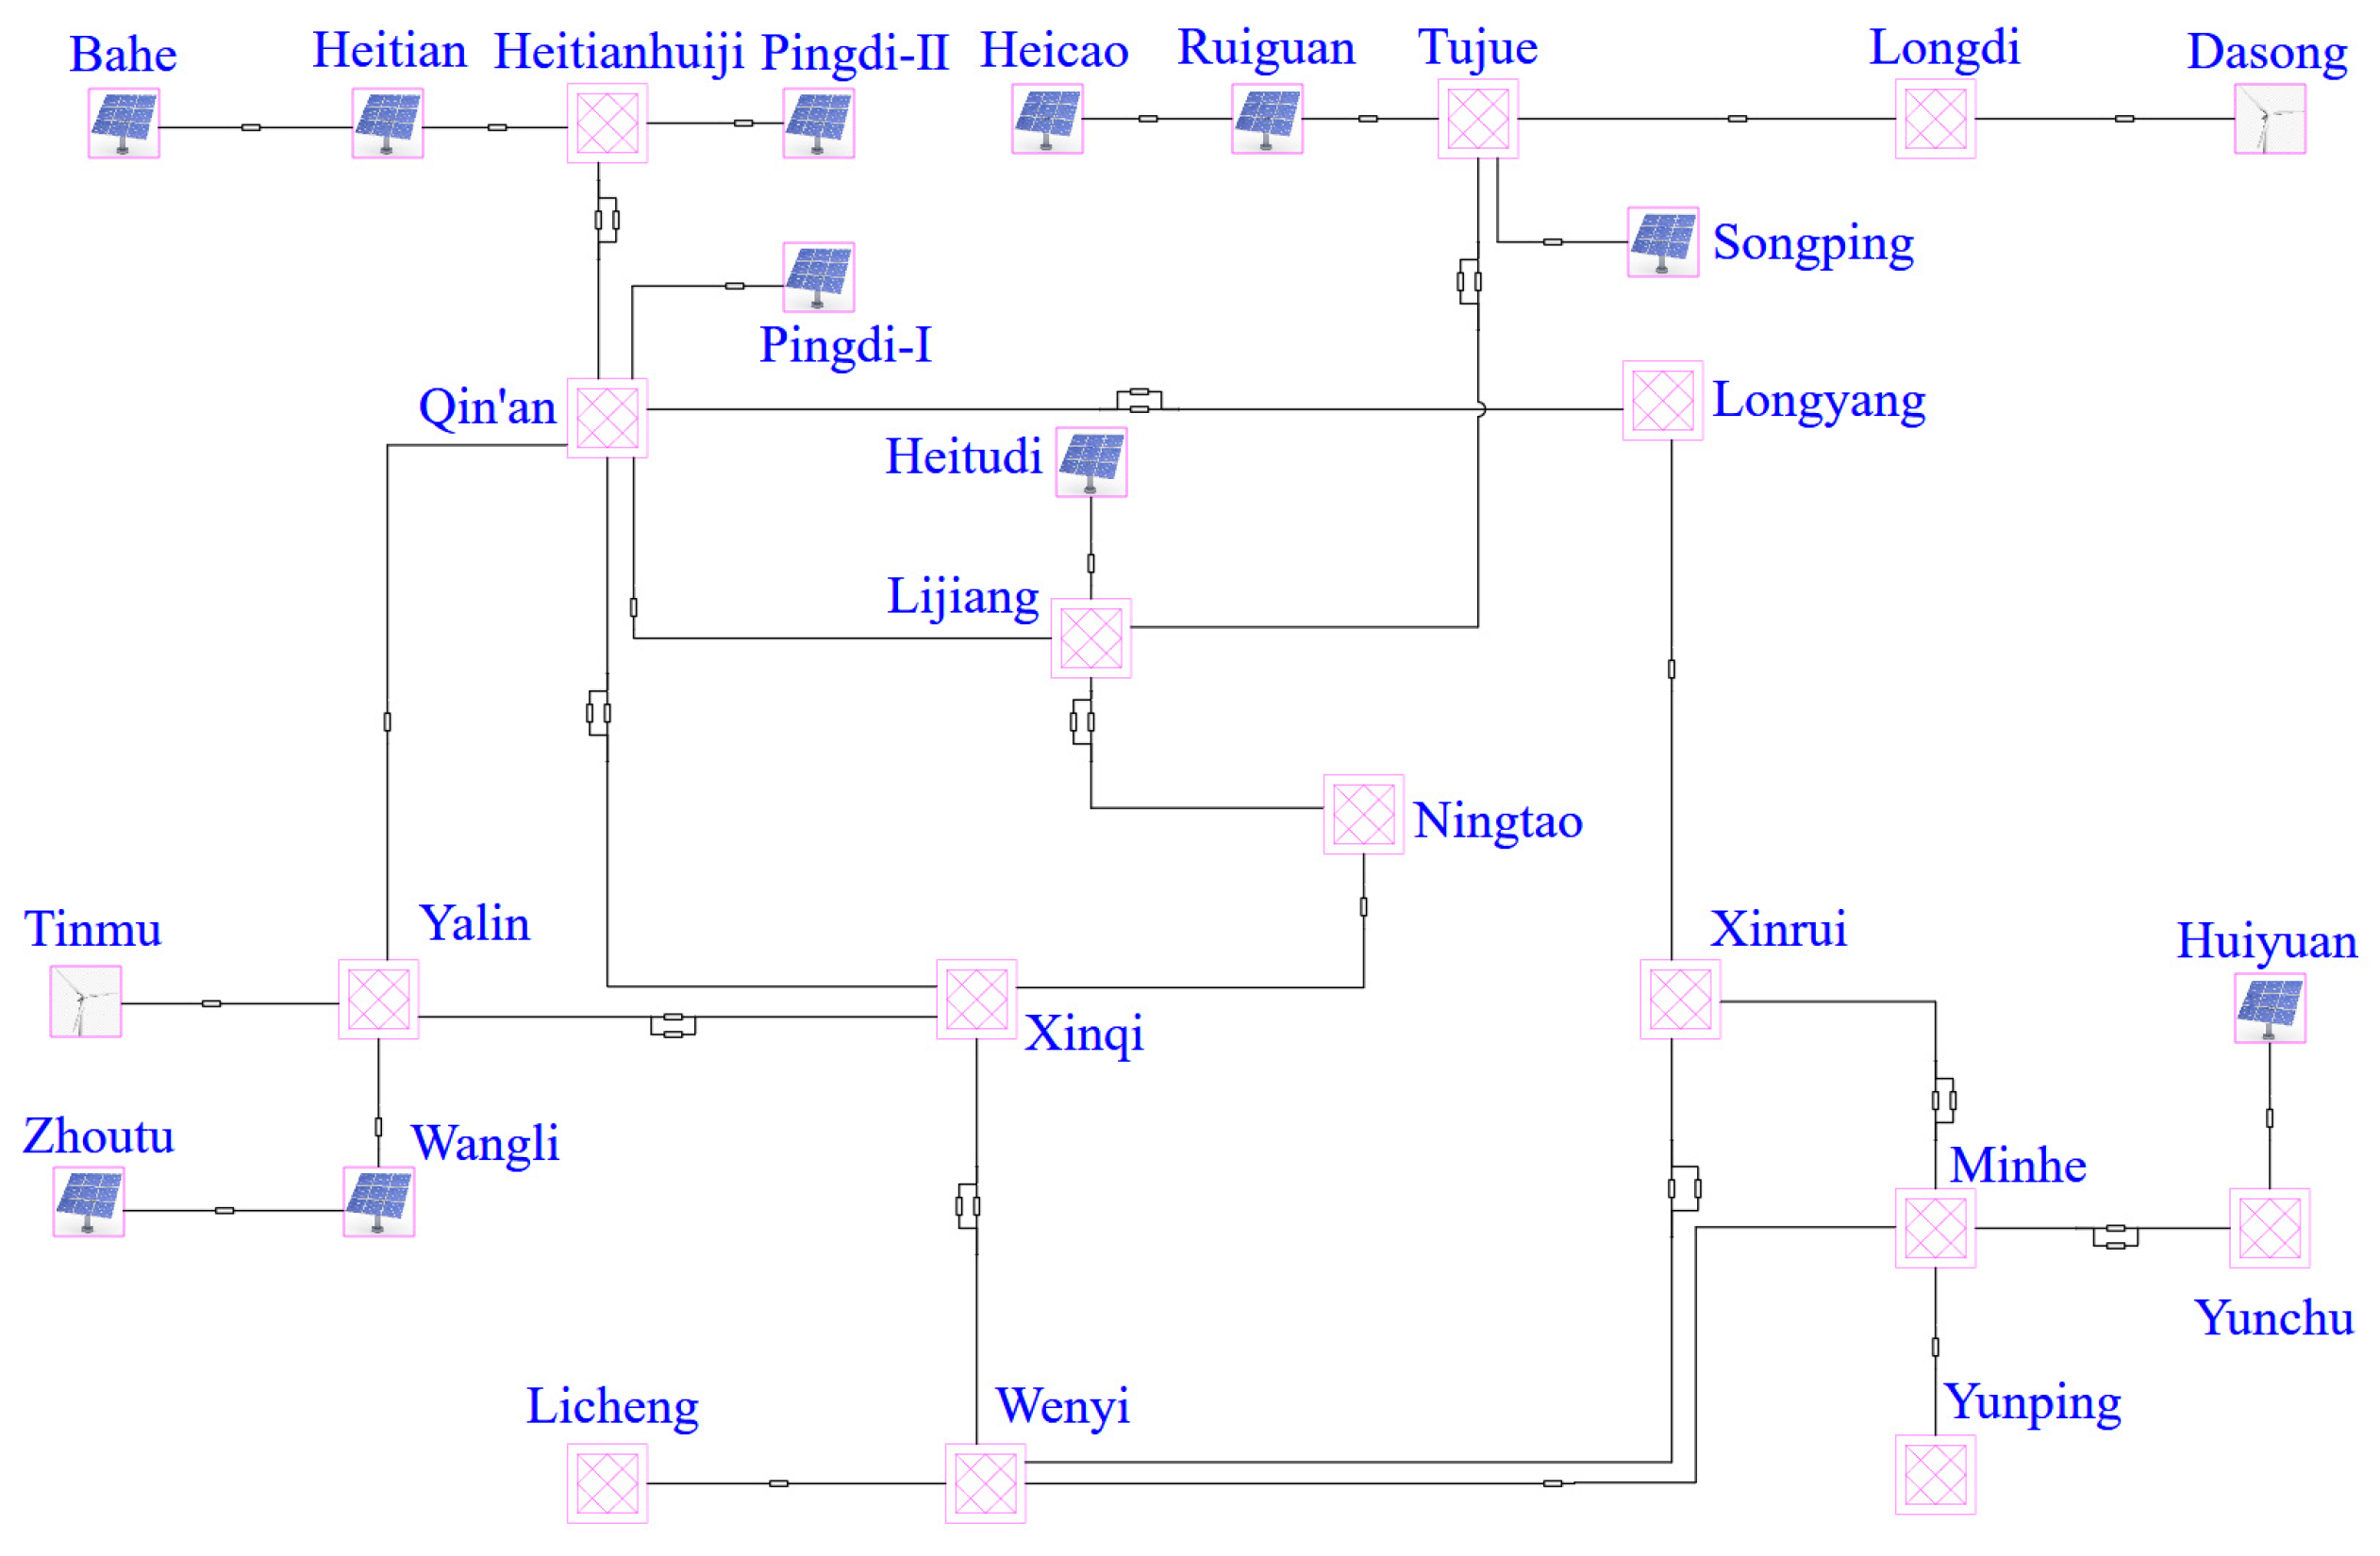
Furthermore, based on the specifications given in Table 1, Table 2, Table 3 and Table 4 and combined with the engineering wiring diagram, the system simulation model shown in Figure 2 can be constructed in ETAP.
Figure 2.
System simulation model.
3. Analysis of the Impact of PV on the Power Grid
Renewable energy power stations are predominantly connected as distributed small power sources, and their output power is uncertain. Therefore, their grid connection will have a significant impact on the operation of the power grid, with the most prominent effects being changes to node voltage levels and system losses. This section takes PV power stations as an analysis case. Increasing PV power generation capacity helps achieve energy conservation goals. However, it is necessary to fully consider the impact of PV grid connection on the power flow distribution of the power grid, especially node voltage rise and increased system loss, which introduce both cost and safety concerns.
3.1. The Impact of PV Power Generation on the Distribution Network
Figure 3 shows a typical radial distribution network structure. The branch impedance is Zi = Ri + Xi. The subordinate lines at each node are equivalently calculated using Equation (1). From the perspective of energy, the energy flowing into the node is the photovoltaic power PPVi + jQPVi, and the energy flowing out of the node is the power Pi + jQi that flows to the subordinate lines and subordinate nodes [28].
Figure 3.
Feedline diagram with PV.
First, we analyze the situation where PV power is not connected.
The current flowing into the node can be obtained through Equation (2):
The voltage drop generated when the branch current flows through the branch impedance on both sides is as shown in Equation (3):
Using reference node U0, the voltages of all nodes can be obtained as shown in Equation (4):
Next, we analyze the situation where PVc power is connected at point k.
The current flowing into the node can be obtained as shown in Equation (5):
From Equation (3), we obtain Equation (6):
is the equivalent current of the load; is the equivalent current of distributed PV.
Analysis of the voltage profile reveals that integrating PV generation units effectively elevates nodal voltages at their points of connection. From a power flow perspective, the injection of PV current reduces the magnitude of power transmitted along upstream transmission lines, thereby diminishing line voltage drops. Consequently, for the segment between reference node U0 and downstream node k, the reduced voltage drop leads to a uniform rise in voltage across all intermediate nodes, and this effect propagates to nodes beyond k. At node U0, the diminished upstream voltage drop alleviates the need for reactive power support or voltage boosting in operational practice, thereby easing system supply stress.
It is important to note that IPV scales proportionally with installed PV capacity. At low penetration levels, IPV flows unidirectionally toward the line terminus, improving local voltage regulation. However, when PV capacity exceeds the local load demand and line capacity constraints, reverse power flow occurs: excess IPV flows upstream, from the line end toward the source, resulting in voltage rise beyond acceptable limits and potential operational challenges.
3.2. The Impact of PV Power Generation on Regional Distribution Networks
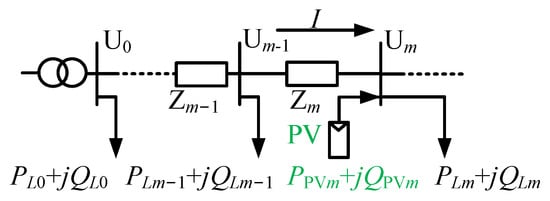
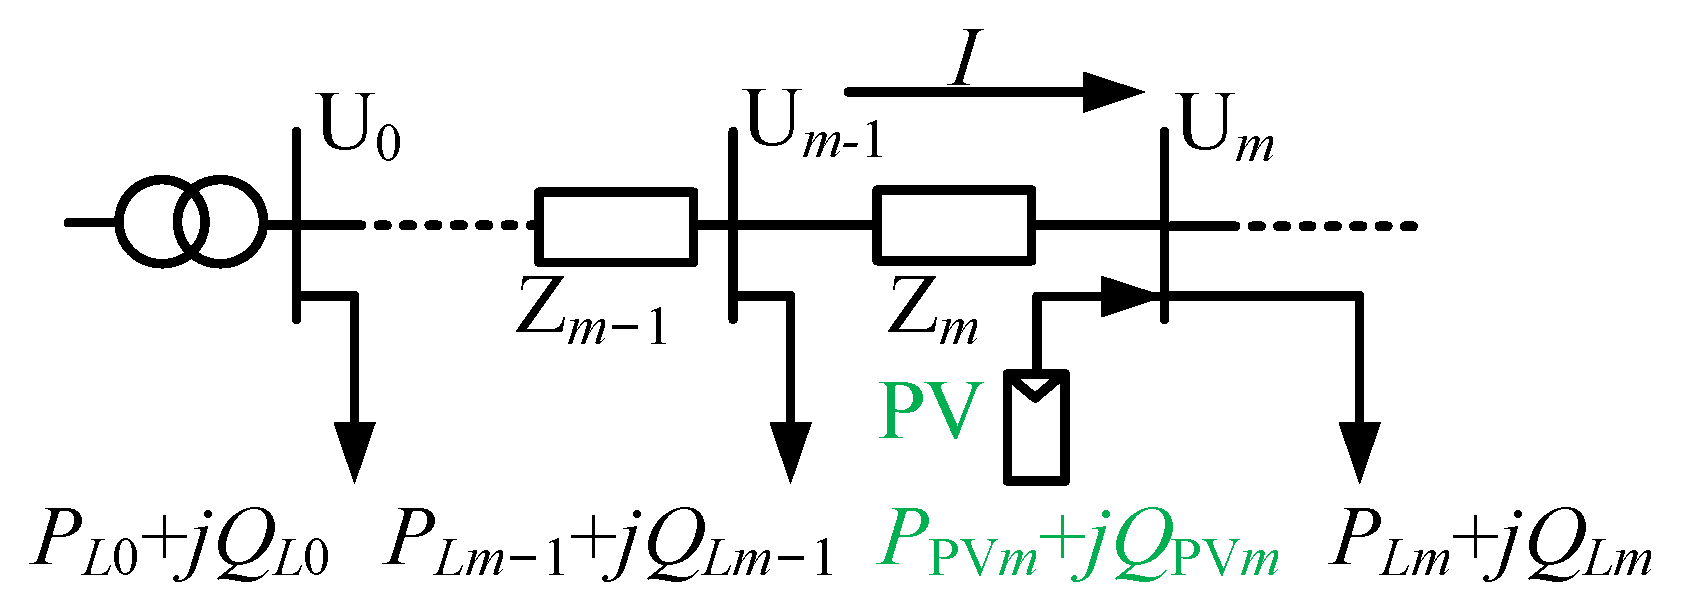
Based on the topology shown in Figure 1, when a renewable energy station is directly connected to a node of the ring network, its impact on the ring network is considered equivalent to that of the original node, meaning the two are integrated into a single equivalent node. Accordingly, the analysis follows this procedure: first, the ring network is split at the reactive power splitting point, then one power source and one non-overlapping renewable energy connection point are selected as the analysis objects, as illustrated in Figure 4. Zm = rml + jxml.
Figure 4.
Area distribution network with PV systems.
The current I in the transmission line shown in the figure can be used to represent the electrical energy output by the power source. The formula is as follows:
Then the network loss of this section of the line can be calculated as
The same principle applies throughout the entire system, and thus the total network loss of the system can be obtained as
l represents the length of this line; rm represents the unit resistance of the line; PLm and Qlm are the active load and reactive load at node m; PPVm and QPVm are the active power and reactive power generated by PV at node m; n is the total number of lines in the system.
Studies show that the grid integration of renewable energy causes active–reactive power imbalance, which increases random fluctuations in node operating voltage U and creates a risk of voltage over-limit. Furthermore, on short time scales, after incorporating fluctuation factors into the analysis of node input power and load matching, the node net load becomes significantly more time-varying, which in turn gives network losses obvious time-varying characteristics. It can therefore be concluded that the total network loss after centralized grid connection of renewable energy is correlated with multiple factors, including the length and impedance of outgoing lines, the original load of the connected system, and the grid connection position and capacity of renewable energy. In addition, network loss is also affected by the active and reactive power transmitted within the system.
4. Simulation Analysis and Model Verification
In order to facilitate the study of the impact of PV power generation on the distribution network, the nodes of the model in Figure 2 are numbered. For the ring network, the start is the Ta’an station and the nodes are numbered clockwise as H1–H5. The remaining nodes are numbered L1–L23. Due to the low proportion of wind power, its capacity is included in the calculation of PV power. The benchmark value is the average daily load of the entire city, which is 6600 MW.
This section uses operational data from Lijiang City on 7 May, 17 May and 27 May to analyze temporal trends in power system behavior. For each date, two representative operational scenes are identified based on the diurnal profile of renewable energy generation: a peak-generation scene and a low-generation scene. Under each scene, the interrelationships among active power flow, reactive power flow, and voltage magnitude are systematically examined.
- (1)
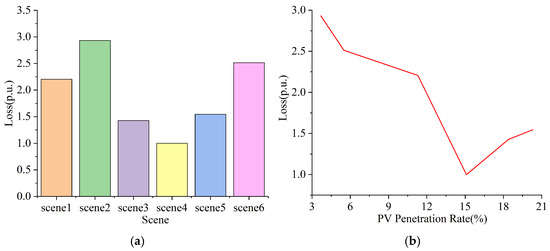
- Scene 1: the peak-generation conditions observed on 7 May; the real-time PV penetration rate is 11.3%.
- (2)
- Scene 2: the low-generation conditions observed on 7 May; the real-time PV penetration rate is 3.7%.
- (3)
- Scene 3: the peak-generation conditions observed on 17 May; the real-time PV penetration rate is 18.4%.
- (4)
- Scene 4: the low-generation conditions observed on 17 May; the real-time PV penetration rate is 15.1%.
- (5)
- Scene 5: the peak-generation conditions observed on 27 May; the real-time PV penetration rate is 20.3%.
- (6)
- Scene 6: the low-generation conditions observed on 27 May; the real-time PV penetration rate is 5.5%.
The PV penetration rate referred to here is the proportion of the total PV output power in the city at a given time to the total city load.
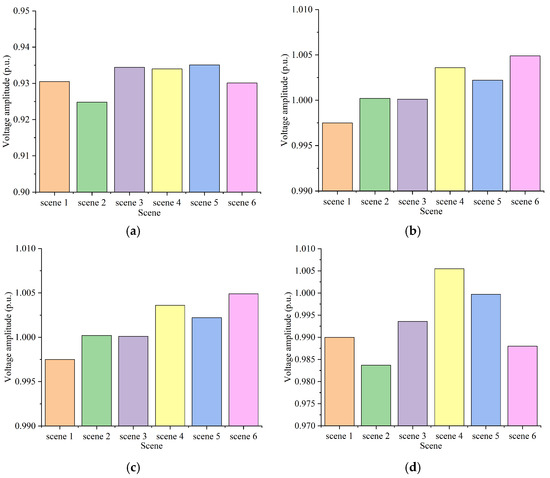
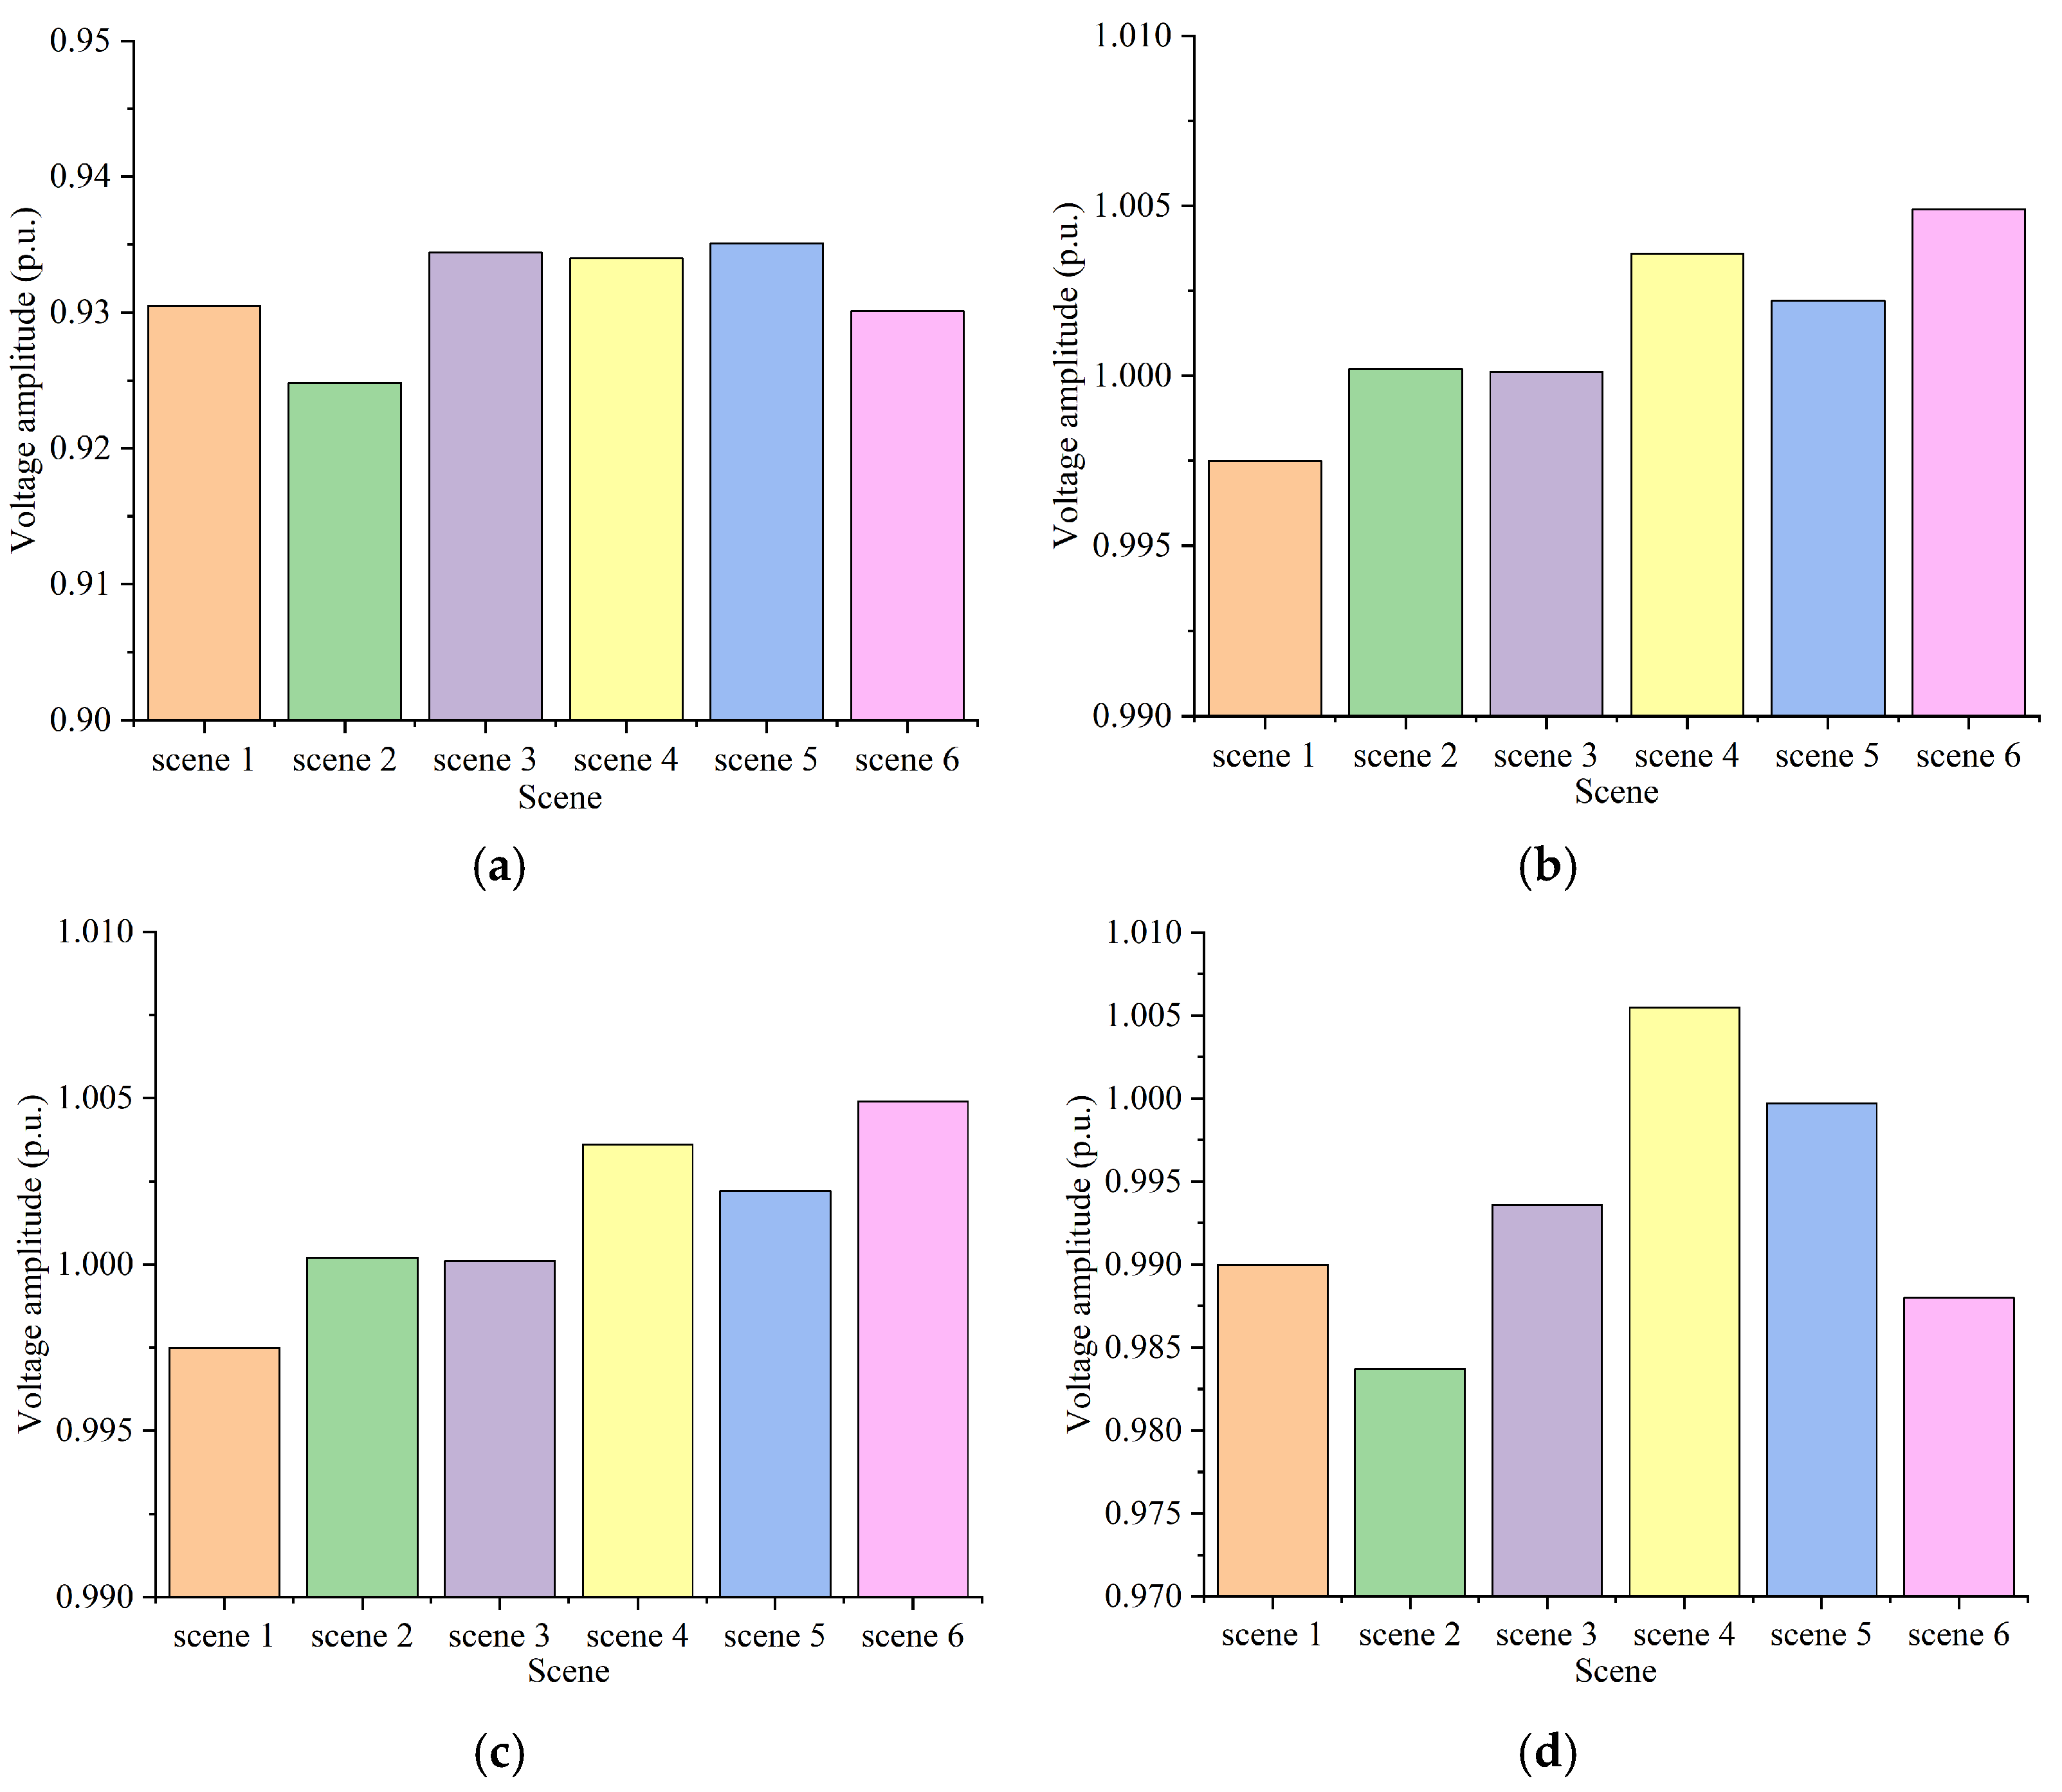
The voltage variations of the nodes across the six scenes are visually presented in Figure 5.
Figure 5.
The voltage of the nodes in each scene: (a) node 2; (b) node 3; (c) node 4; (d) node 5.
The voltage amplitudes of the five ring network nodes in different scenes, the power of each branch, and the total system loss are respectively shown in Table 6, Table 7 and Table 8 and Figure 6.
Table 6.
Comparison of voltage amplitudes of system nodes in different scenes.
Table 7.
Comparison of the power of each branch in the system under different scenes.
Table 8.
System power loss in different scenes.
Figure 6.
Comparison of system power loss in different scenes: (a) time order; (b) order of PV penetration rate.
By comparing the simulation data of the model with the actual system operation data, the errors of the node voltages are all within 5%. Therefore, the model meets the error requirements and can be effectively used for the subsequent simulation calculations of network losses.
Based on the load flow model, the study analyzes the influence of active power and reactive power on system active power loss and voltage, combines the transmission characteristics of centralized grid connection of renewable energy power generation, and investigates the flow direction and voltage magnitude of active power and reactive power under renewable energy peak and valley scenes. Based on the analysis results, the following conclusions are drawn:
- (1)
- During the peak output period of renewable energy, the voltage of the local system increases, and active power is transmitted outward. When local reactive power is insufficient, reactive power flows from the main grid to the renewable energy station, from the high-voltage level to the low-voltage level.
- (2)
- During the valley output period of renewable energy, the voltage of the local system decreases, and the flow direction of active power is reversed. When local reactive power is excessive, reactive power flows from the renewable energy station to the main grid, from the low-voltage level to the high-voltage level.
The fundamental reason for this phenomenon is the insufficient reactive power reserve at the nodes.
Based on the simulation data, the following observations can be made:
- (1)
- When distributed power sources are connected to the power grid, changes in system line losses are correlated with the output of the distributed power sources and the local load. When distributed power generation can be absorbed locally, power flow through the lines decreases, which in turn reduces network losses. When the installed capacity of distributed power sources is too large to be fully absorbed locally, reverse power flow will occur, leading to an increase in line losses. At the same time, the output adjustment of distributed power sources changes the power flow of the regional power grid—that is, it alters the original power flow distribution, which ultimately affects the total line loss.
- (2)
- For a ring network, each node has at least two interconnection lines and one subordinate line. When renewable energy is connected to the grid, it affects both interconnection lines simultaneously. The magnitude and nature of this influence depend on the voltage vector of the interconnection node, which is in turn affected by multiple factors including load, line impedance, line length, and power electronic devices.
5. Research on Methods for Reducing System Electrical Energy Losses
The power grid of Lijiang City represents a typical weak grid within Yunnan Province, characterized by extensive coverage across numerous towns and significant topographic complexity due to its mountainous terrain. These factors contribute to heterogeneous load patterns and an elevated system-wide network loss rate. Drawing upon both field operational requirements and the simulation results presented in the preceding section, this part proposes a suite of technically grounded, multidimensional strategies for network loss reduction.
5.1. Research on the Main Network Loss Reduction Mode over a Long Time Scale
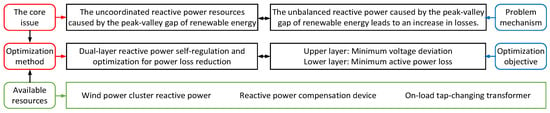
For scenes where the output of renewable energy is extremely variable and reactive power circulation is prominent, considering the requirements of engineering economy, the research focuses on reactive power crossing losses and only uses double-layer optimization of reactive power equipment. As shown in Figure 7, this method constructs a double-layer multi-objective optimization model, precisely controlling the operation indicators of the power grid at different levels and achieving refined and autonomous regulation of reactive power resources.
Figure 7.
Loss reduction of the main network over a long time scale.
Among them, the upper-level optimization takes the minimum voltage deviation of all network nodes as the core goal, coordinating the voltage operation levels of each hub node and regional node in the loop network, suppressing the voltage drop and rise problems under extreme conditions of renewable energy, avoiding voltage over-limit risks, and ensuring the stable operation of the power grid voltage; the lower-level optimization takes the minimum total active power loss of the system as the goal, focusing on reactive power circulation and additional network losses caused by reactive power crossing, and reducing line losses through optimizing the distribution of reactive power. The adjustable resources include the reactive power output of wind power clusters, photovoltaic units, capacitor banks, static reactive power compensation devices, and tap-changing transformers. For the problem of scattered reactive power resources, disorderly regulation, and poor coordination in mountainous loop networks, the method solves the problem of disorderly reactive power crossing, local excess reactive power and shortage coexisting under extreme conditions of renewable energy by precisely distributing adjustment instructions.
This method does not require the mobilization of active regulation resources. It can achieve the goal of reducing losses merely through hierarchical self-regulation optimization of reactive power resources. The control cost is low, the response speed is fast, and it is suitable for the operational scenes in the Lijiang mountainous area grid, where the penetration rate of renewable energy is high over a long period, extreme output conditions occur frequently, and the problem of reactive power crossing is prominent.
5.2. Research on the Main Grid Loss Reduction Mode Under Short-Term Time Scales
In response to the random fluctuations in the output of wind power and photovoltaic renewable energy sources over short time scales, which cause fluctuations in the active power of the power grid, frequent fluctuations in power flow, and imbalance in the coupling of active and reactive power, and ultimately lead to high dynamic losses in the system, a coordinated dual-layer optimization method for active and reactive power of wind and photovoltaic random fluctuations is proposed. This method adopts a hierarchical collaborative optimization architecture for active and reactive power, precisely adapting to the dynamic network loss problems caused by the uncertainty of renewable energy output, and solving the operational problems of power fluctuations, unstable power flow, and rising losses in mountainous loop networks.
As shown in Figure 8, the method constructs an upper–lower hierarchical and collaborative linkage active power–reactive power two-dimensional optimization model to achieve integrated regulation of fluctuation suppression and power loss reduction and efficiency improvement. The upper layer is the active power optimization layer, with the core regulatory goal being minimum system loss across the entire network. The core adjustable resource is the charging and discharging power of the energy storage system, and through the rapid charging and discharging characteristics of energy storage, it can, in real time, suppress the random fluctuations of the output of wind and solar renewable energy sources, offset the supply–demand deviation of the active power in the system, and stabilize the distribution of the entire network’s power flow. The lower layer is the reactive power optimization layer, which adopts a multi-objective optimization strategy of minimizing the system loss and minimizing the voltage deviation at the node, and comprehensively coordinates reactive resources such as capacitor switching, static reactive power compensation devices, and tap-changing transformers. On the basis of the stability of the active power flow in the upper layer, it further optimizes the distribution of reactive power across the entire network, corrects the voltage offset problem, and eliminates the reactive power disturbance loss derived from the active power fluctuations.
Figure 8.
Loss reduction of the main network over a short-term time scale.
Compared with a single reactive power optimization method, this method achieves deep coupling of active power and reactive power regulation, effectively addressing the problem of “active power instability causing network disturbances and reactive power imbalance leading to increased losses” under the random fluctuations of renewable energy, and precisely adapting to the high proportion of renewable energy grid connection scenes with intense fluctuations in wind and solar output on a short time scale.
6. Conclusions
This study investigates the operational challenges induced by high-penetration PV integration into mountainous ring-type distribution networks within the framework of an emerging power system. Key challenges include: the inherent uncertainty and volatility of PV generation output, bidirectional power flow reversal, node voltage violations exceeding statutory limits, and exacerbated network losses—issues inadequately addressed in the existing literature. To address these, the study develops a region-specific quantitative methodology for power loss calculation tailored to ring-type topologies; establishes a high-fidelity ETAP simulation model calibrated with actual grid parameters; and defines two representative operational scenes—renewable energy generation peak and valley—to enable rigorous, multi-case validation. Through integrated theoretical analysis and simulation-based verification, the paper systematically uncovers the underlying mechanisms through which distributed PV integration affects the steady-state operation of ring networks, thereby substantiating both the scientific validity and engineering applicability of the proposed analytical frameworks and optimization strategies.
- (1)
- Differential impact mechanism of PV integration across topologically distinct networks: The study rigorously differentiates between chain-type and ring-type distribution networks, clarifying how distributed PV connection exerts distinct effects on power flow distribution, voltage profile, and network losses in each topology. In chain-type networks, appropriately scaled PV integration can reduce line loading, mitigate voltage drop, and improve nodal voltage regulation via localized consumption; conversely, excessive PV capacity may trigger branch-level power reversal and amplify system-wide operational volatility. In contrast, the ring topology—characterized by multiple interconnected loops and strong coupling among branches—exhibits heightened sensitivity: even single-node PV injection influences multiple adjacent branches simultaneously. These findings underscore the unique analytical complexity associated with PV-integrated ring networks.
- (2)
- Coupled power–loss dynamics under renewable energy generation peaks and valleys: By implementing well-defined peak- and low-generation scenes, the paper elucidates the coupling relationships among PV output variability, power flow directionality, nodal voltage magnitude, and system-wide power losses. Under peak PV conditions, regional active power export surges while reactive power supply–demand imbalance widens, collectively depressing system-wide voltage levels; insufficient local absorption further induces power flow reversal, substantially elevating network losses. Under valley conditions, the network reverts to active power import, while reactive power becomes locally surplus—leading to elevated nodal voltages and increased risk of voltage limit violations.
- (3)
- Regulatory centrality of PV integration parameters on grid stability and economic performance: The study empirically confirms that PV connection location and penetration level are pivotal determinants of voltage stability and loss efficiency in mountainous ring networks. A low-penetration, spatially distributed PV configuration aligned with local load centers maximizes self-consumption benefits, shortens transmission distances, reduces aggregate system losses, and enhances overall economic operation. Conversely, high-penetration, centralized, or misaligned PV integration disrupts the intrinsic power flow equilibrium of the ring network—inducing multi-branch flow disorder and active–reactive power decoupling—thereby significantly increasing both power losses and voltage violation risks.
- (4)
- Engineering feasibility and performance gains of multidimensional collaborative loss reduction strategies: Addressing the operational bottlenecks of high-PV ring networks, this strategy set is explicitly designed to align with the structural attributes and loss fluctuation patterns of mountainous ring networks. It effectively suppresses scene-dependent power flow imbalances, prevents voltage limit breaches, and enables precise, dynamic governance of system losses and operational states. Through systematic theoretical derivation, high-fidelity modeling, and multi-scene empirical validation, the study fully characterizes the evolutionary mechanisms governing network losses and voltage fluctuations under high-PV integration. It resolves three critical technical gaps: quantitative loss assessment during renewable energy integration; identification of voltage fluctuation coupling mechanisms; and implementation-ready, engineering-oriented loss mitigation. The work advances the theoretical foundation for line loss analysis in ring networks hosting distributed renewables and delivers actionable methodological guidance and field-tested references for renewable energy planning, grid connection parameter design, penetration rate control, real-time operation regulation, and holistic loss management in southwestern mountainous power systems.
This study focuses exclusively on steady-state operational behaviors under diurnal PV generation peaks and valleys. It does not examine transient or high-frequency dynamic responses to short-term PV fluctuations. Future research will extend the simulation scope across multiple time scales to investigate the dynamic influence of rapid PV output variations on loss evolution and voltage stability. Concurrently, integration with electricity market mechanisms will be explored to develop market-driven, multi-stakeholder coordination strategies involving PV plants, energy storage systems, and reactive power resources—thereby supporting refined, intelligent, and market-oriented operation of mountainous ring networks with distributed renewable energy.
Author Contributions
Conceptualization, R.H., Y.D. and C.S.; methodology, R.H., C.X. and W.Y.; software, Y.L., C.S. and C.X.; validation, R.H., Y.D. and W.Y.; formal analysis, Y.D. and C.S.; investigation, R.H., C.X. and W.Y.; resources, R.H., Y.L. and Y.D.; data curation, R.H. and C.S.; writing—original draft preparation, R.H., Y.D. and C.S.; writing—review and editing, Y.L., C.X. and W.Y.; visualization, Y.L. and C.S.; supervision, Y.L., Y.D. and C.S.; project administration, Y.L., R.H. and W.Y.; funding acquisition, R.H. and Y.D. All authors have read and agreed to the published version of the manuscript.
Funding
This research was funded by China Southern Power Grid (CSG) under the project “Research on Energy Storage and Reactive Power Compensation Configuration Methods and Control Strategies for renewable energy Aggregation Stations”, grant number EDRI-PS-ZLYJ-2025-104.
Data Availability Statement
The original contributions presented in this study are included in the article. Further inquiries can be directed to the corresponding author.
Conflicts of Interest
Authors Rong Hu, Chong Shao, Yingrui Dong, Cheng Xu and Weican Yuan were employed by the Energy Development Research Institute, CSG. The remaining authors declare that the research was conducted in the absence of any commercial or financial relationships that could be construed as a potential conflict of interest.
References
- International Energy Agency (IEA). Energy Technology Perspectives 2024; International Energy Agency (IEA): Paris, France, 2024; Available online: https://www.iea.org/reports/energy-technology-perspectives-2024 (accessed on 18 December 2024).
- Chiang, H.D.; Flueck, A.J.; Shah, K.S.; Balu, N. CPFLOW: A practical tool for tracing power system steady-state stationary behavior due to load and generation variations. IEEE Trans. Power Syst. 1995, 10, 623–634. [Google Scholar] [CrossRef] [Scilit]
- Fresia, M.; Robbiano, T.; Caliano, M.; Delfino, F.; Bracco, S. Optimal Operation of an Industrial Microgrid within a Renewable Energy Community: A Case Study a Greentech Company. Energies 2024, 17, 3567. [Google Scholar] [CrossRef] [Scilit]
- Huang, K.Y.; Huang, Y.C. Integrating direct load control with interruptible load management to provide instantaneous reserves for ancillary services. IEEE Trans. Power Syst. 2004, 19, 1626–1634. [Google Scholar] [CrossRef] [Scilit]
- Tan, B.; Zhao, J.; Xie, L. Transferable Deep Kernel Emulator for Probabilistic Load Margin Assessment with Topology Changes, Uncertain Renewable Generations and Loads. IEEE Trans. Power Syst. 2023, 38, 5740–5754. [Google Scholar] [CrossRef] [Scilit]
- Bharati, A.K.; Ajjarapu, V. Investigation of Relevant Distribution System Representation with DG for Voltage Stability Margin Assessment. IEEE Trans. Power Syst. 2020, 35, 2072–2081. [Google Scholar] [CrossRef] [Scilit]
- Poulek, V.; Safránková, J.; Cerná, L.; Libra, M.; Beránek, V.; Finsterle, T.; Hrzina, P. PV Panel and PV Inverter Damages Caused by Combination of Edge Delamination, Water Penetration, and High String Voltage in Moderate Climate. IEEE J. Photovolt. 2021, 11, 561–565. [Google Scholar] [CrossRef] [Scilit]
- Zhang, W.; Wang, Y.; Zeeshan, M.; Han, F.; Song, K. Super-twisting sliding mode control of grid-side inverters for wind power generation systems with parameter perturbation. Int. J. Electr. Power Energy Syst. 2025, 165, 110501. [Google Scholar] [CrossRef] [Scilit]
- Cheng, D.; Mather, B.-A.; Seguin, R.; Hambrick, J.; Broadwater, R.-P. Photovoltaic (PV) Impact Assessment for Very High Penetration Levels. IEEE J. Photovolt. 2016, 6, 295–300. [Google Scholar] [CrossRef] [Scilit]
- Xie, S.; Wu, Q.; Zhang, M.; Guo, Y. Coordinated Energy Pricing for Multi-Energy Networks Considering Hybrid Hydrogen-Electric Vehicle Mobility. IEEE Trans. Power Syst. 2024, 39, 7304–7317. [Google Scholar] [CrossRef] [Scilit]
- Wang, D.; Huang, D.; Hu, Q.; Jia, H.; Liu, B.; Lei, Y. Electricity-Heat-Based Integrated Demand Response Considering Double Auction Energy Market with Multi-Energy Storage for Interconnected Areas. CSEE J. Power Energy Syst. 2024, 10, 1688–1700. [Google Scholar] [CrossRef] [Scilit]
- Sun, L.; Bao, J.; Pan, N.; Jia, R.; Yang, J. Optimal Scheduling of Wind-Photovoltaic- Pumped Storage Joint Complementary Power Generation System Based on Improved Firefly Algorithm. IEEE Access 2024, 12, 70759–70772. [Google Scholar] [CrossRef] [Scilit]
- Zhou, Y.; Ajjarapu, V. A Fast Algorithm for Identification and Tracing of Voltage and Oscillatory Stability Margin Boundaries. Proc. IEEE 2005, 93, 934–946. [Google Scholar] [CrossRef] [Scilit]
- Wang, Y.; Zhang, H.; Zhang, W.; Wang, X.; Wang, J. Optimization Method for Topology Identification of Port Microgrid Based on Line Disconnection. Energies 2025, 18, 706. [Google Scholar] [CrossRef] [Scilit]
- Neves, L.S.; Alberto, L.F.C. On The Computation of The Locally Closest Bifurcation Point Considering Loading Uncertainties and Reactive Power Limits. IEEE Trans. Power Syst. 2020, 35, 3885–3894. [Google Scholar] [CrossRef] [Scilit]
- Rahman, S.; Saha, S.; Islam, S.N.; Arif, M.T.; Mosadeghy, M.; Oo, A.M.T.; Haque, M.E. Analysis of Power Grid Voltage Stability with High Penetration of Solar PV Systems. IEEE Trans. Ind. Appl. 2021, 57, 2245–2257. [Google Scholar] [CrossRef] [Scilit]
- Wang, L.; Bai, F.; Yan, R.; Saha, T.-K. Real-Time Coordinated Voltage Control of PV Inverters and Energy Storage for Weak Networks with High PV Penetration. IEEE Trans. Power Syst. 2018, 33, 3383–3395. [Google Scholar] [CrossRef] [Scilit]
- Hraiz, M.-D.; García, J.-A.-M.; Castañeda, R.-J.; Muhsen, H. Optimal PV Size and Location to Reduce Active Power Losses While Achieving Very High Penetration Level with Improvement in Voltage Profile Using Modified Jaya Algorithm. IEEE J. Photovolt. 2020, 10, 1166–1174. [Google Scholar] [CrossRef] [Scilit]
- Aggarwal, S.; Kumar, N.; Tanwar, S.; Alazab, M. A Survey on Energy Trading in the Smart Grid: Taxonomy, Research Challenges and Solutions. IEEE Access 2021, 9, 116231–116253. [Google Scholar] [CrossRef] [Scilit]
- Chen, Z.; Qi, J.; Chen, X.; Xu, J. Stability Margin Evaluation of Black-Box Power Distribution Systems in a Wide Load Range. CPSS Trans. Power Electron. Appl. 2023, 8, 325–335. [Google Scholar] [CrossRef] [Scilit]
- Wang, W.; Huo, Q.; Liu, Q.; Ni, J.; Zhu, J.; Wei, T. Energy Optimal Dispatching of Ports Multi-Energy Integrated System Considering Optimal Carbon Flow. IEEE Trans. Intell. Transp. Syst. 2024, 25, 4181–4191. [Google Scholar] [CrossRef] [Scilit]
- Gao, H.; Wang, L.; Yang, D.; Cai, G.; Liu, C.; Yang, H.; Sun, Z.; Wang, B. Mechanism Enhanced Data-Driven Method for Reliability Improvement of Load Margin Estimation. IEEE Trans. Power Syst. 2024, 39, 3715–3724. [Google Scholar] [CrossRef] [Scilit]
- Luo, C.; Ajjarapu, V. Sensitivity-Based Efficient Identification of Oscillatory Stability Margin and Damping Margin Using Continuation of Invariant Subspaces. IEEE Trans. Power Syst. 2011, 26, 1484–1492. [Google Scholar] [CrossRef] [Scilit]
- Limpisawas, T.; Wattanapanitch, W. A Low-Power Wide-Load-Range Output-Capacitorless Low-Dropout Voltage Regulator with Indirect-Direct Nested Miller Compensation. IEEE Access. 2022, 10, 67396–67412. [Google Scholar] [CrossRef] [Scilit]
- Chatzipanagi, A.; Kakoulaki, G.; Szabó, S.; Jäger-Waldau, A. Overview and Perspective of Integrated Photovoltaics with a Focus on the European Union. Appl. Sci. 2024, 14, 10628. [Google Scholar] [CrossRef] [Scilit]
- Rohouma, W.; Metry, M.; Balog, R.-S.; Peerzada, A.-A.; Begovic, M.-M.; Zhou, D. Analysis of the Capacitor-Less D-STATCOM for Voltage Profile Improvement in Distribution Network with High PV Penetration. IEEE Open J. Power Electron. 2022, 3, 255–270. [Google Scholar] [CrossRef] [Scilit]
- Singh, S.; Pamshetti, V.-B.; Thakur, A.-K.; Singh, S.-P. Multistage Multiobjective Volt/VAR Control for Smart Grid-Enabled CVR With Solar PV Penetration. IEEE Syst. J. 2021, 15, 2767–2778. [Google Scholar] [CrossRef] [Scilit]
- Wang, Y.; Zhang, H.; Zhang, W.; Han, S.; Yang, Y. Energy Optimal Configuration Strategy of Distributed Photovoltaic Power System for Multi-Level Distribution Network. Appl. Sci. 2025, 15, 234. [Google Scholar] [CrossRef] [Scilit]





Disclaimer/Publisher’s Note: The statements, opinions and data contained in all publications are solely those of the individual author(s) and contributor(s) and not of MDPI and/or the editor(s). MDPI and/or the editor(s) disclaim responsibility for any injury to people or property resulting from any ideas, methods, instructions or products referred to in the content. |
© 2026 by the authors. Licensee MDPI, Basel, Switzerland. This article is an open access article distributed under the terms and conditions of the Creative Commons Attribution (CC BY) license.