


Abstract
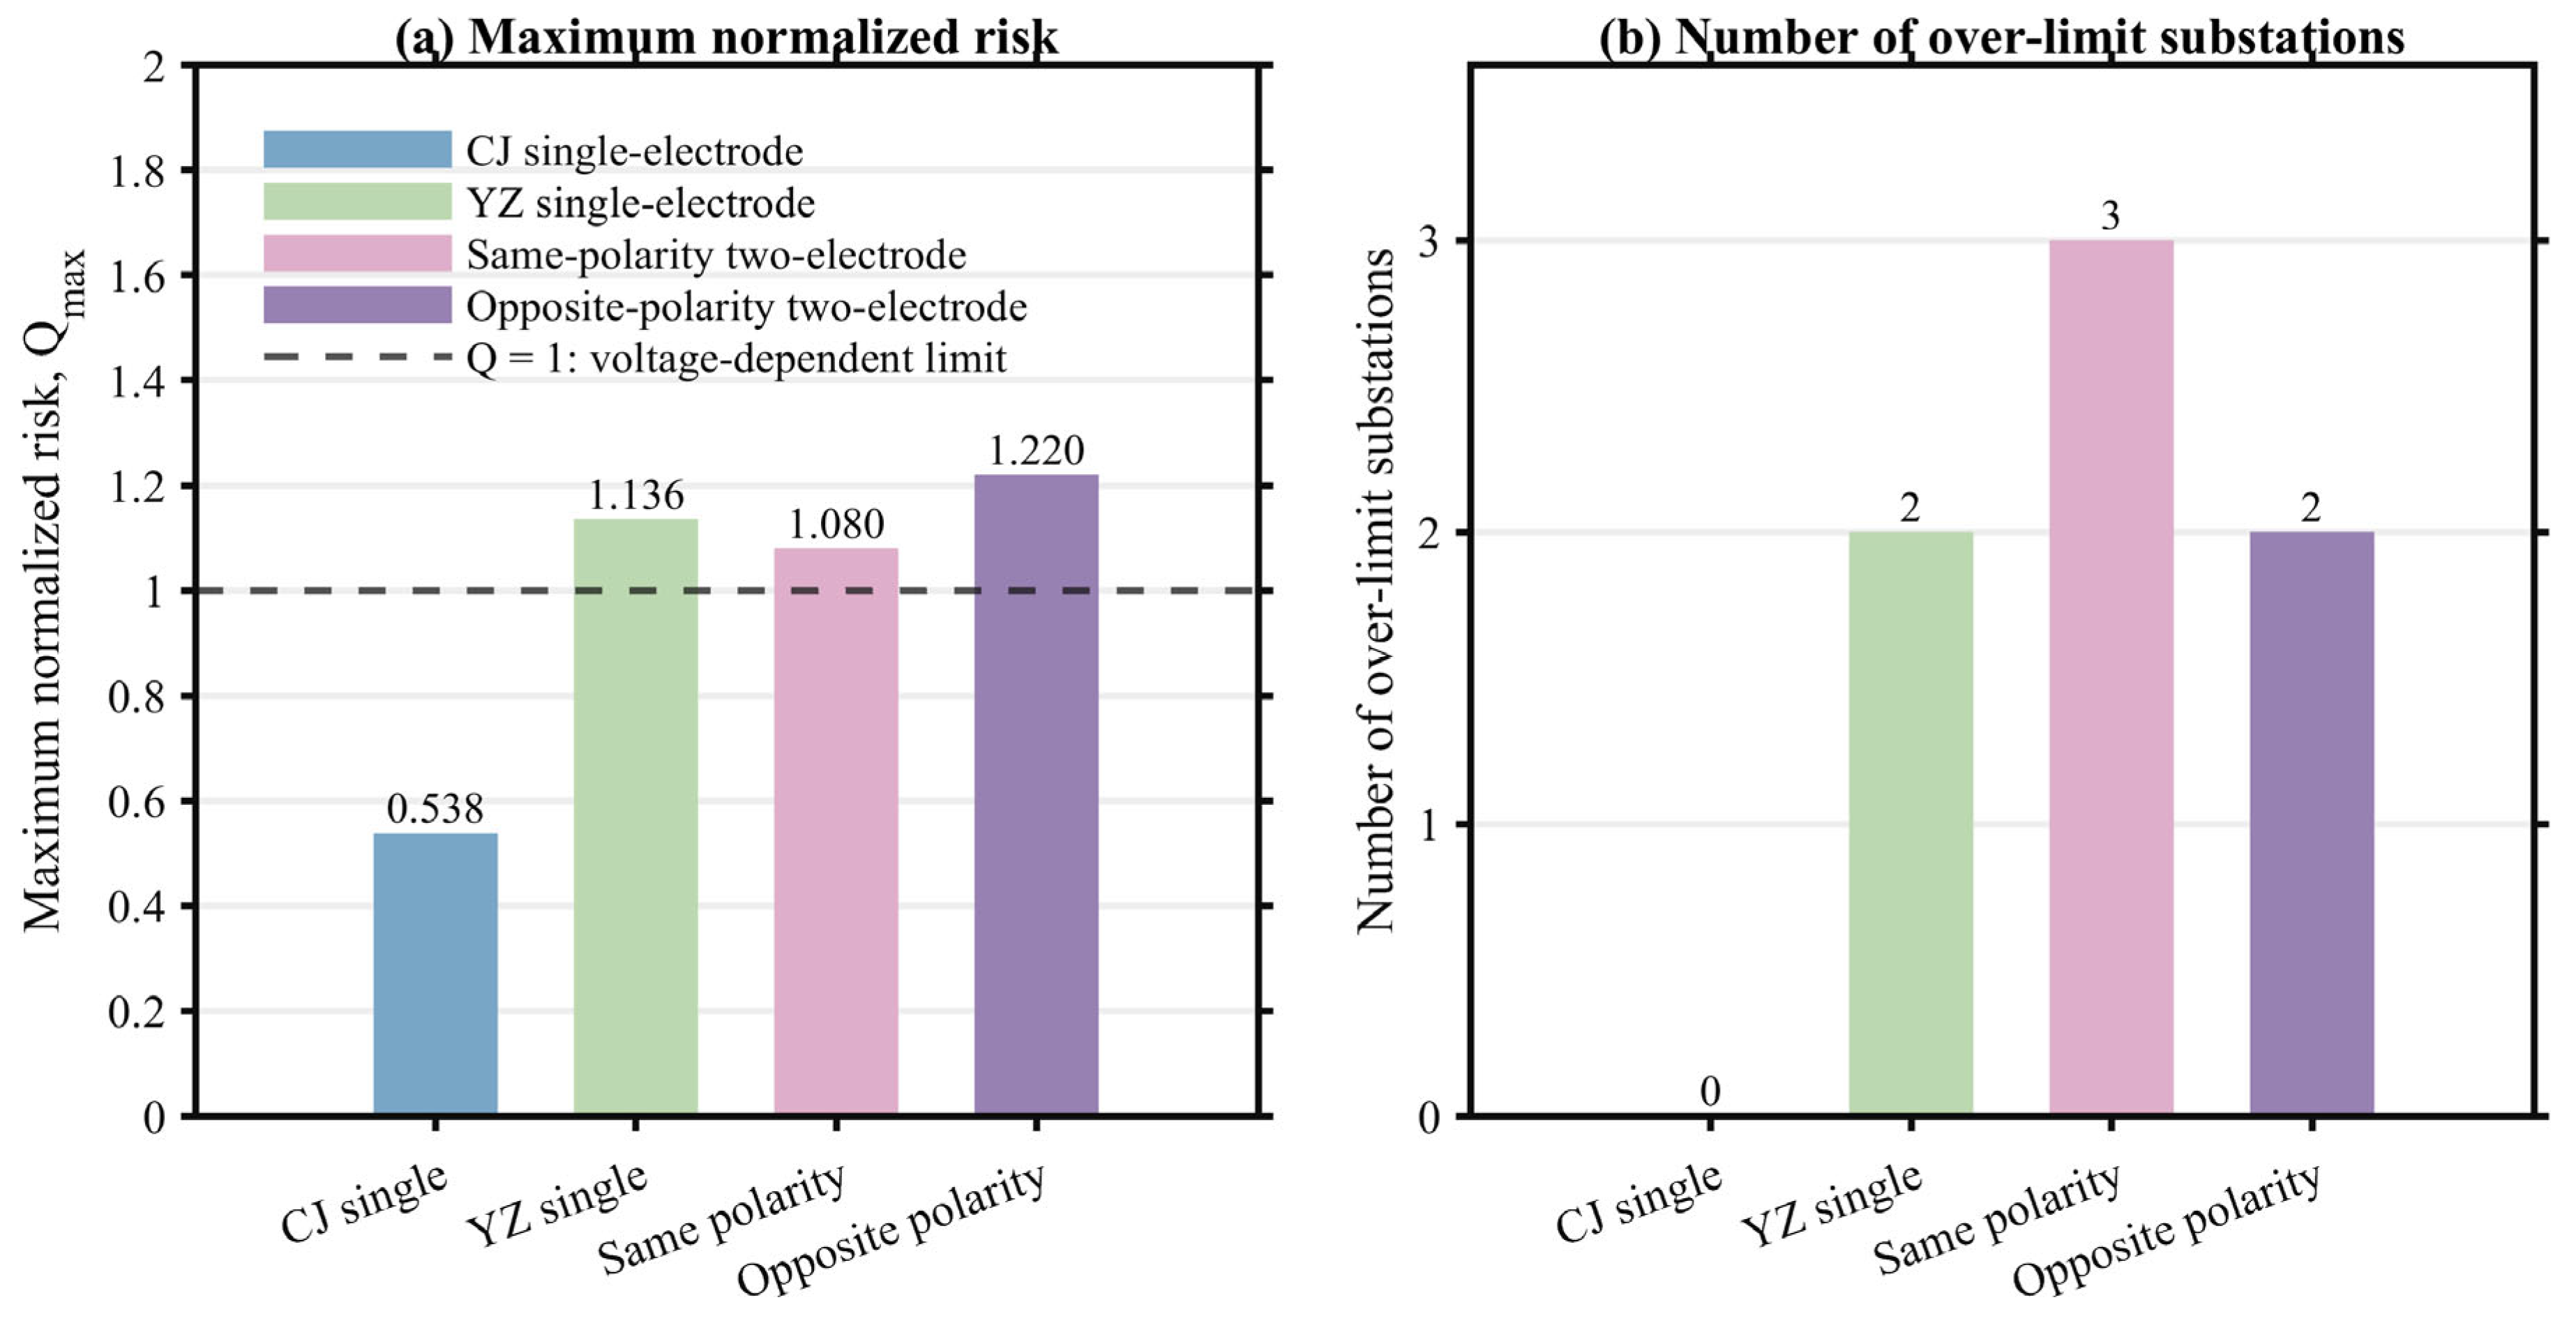
In multi-infeed UHVDC receiving-end grids, transformer DC-bias risk is affected not only by the magnitude of grounding-electrode current, but also by the AC-grid topology, substation grounding condition, voltage-level-dependent current limits, and polarity coordination among grounding electrodes. Conventional single-electrode or magnitude-only assessments may therefore fail to identify the substations that require priority mitigation. This paper proposes a full-registry high-risk substation identification and targeted mitigation framework for transformer DC bias in multi-infeed UHVDC receiving-end grids. A field–circuit coupling model is established using the earth-resistivity model, grounding-electrode parameters, substation grounding parameters, transformer winding DC resistances, and AC-grid topology. To address earth-resistivity uncertainty, a measurement-based correction procedure is introduced and verified by an engineering field-measurement case. On this basis, the receiving-end grid is represented as a weighted complex network, and high-risk substations are identified by jointly considering network importance, voltage-dependent limits, multi-mode DC-bias exposure, and over-limit severity. A case study with 898 substations is carried out under four representative grounding-electrode operating modes. The results show that CJ single-electrode operation produces no over-limit substation, whereas YZ single-electrode, same-polarity two-electrode, and opposite-polarity two-electrode operation produce 2, 3, and 2 over-limit substations, respectively. Polarity coordination changes the risk pattern: same-polarity operation mainly aggravates the UHV substations NY UHV and ZMD UHV, whereas opposite-polarity operation relieves them but concentrates the 500 kV risk at SMPP and ZT. Guided by the high-risk ranking, installing 2 Ω neutral-point resistors at only two over-limit 500 kV substations reduces the currents at ZT and SMPP from 5.26 A and 5.68 A to 2.55 A and 0.58 A, respectively, bringing all evaluated substations within their limits and avoiding system-wide retrofitting.
1. Introduction
Under the national strategic policy of “carbon peak” and “carbon neutrality” [1,2,3,4,5,6], the rapid development of Ultra High Voltage Direct Current (UHVDC) transmission projects is driving the receiving-end grid to gradually evolve toward a multi-infeed UHVDC structure, with the grounding electrodes of converter stations becoming increasingly dense. During bipolar imbalance or monopolar operation due to faults or maintenance, DC current is injected into the grounding electrodes, which subsequently returns via the earth. This process induces a significant DC-bias effect, leading to increased transformer noise, intensified vibrations, and localized overheating [7,8]. As a result, DC bias has become one of the most critical factors affecting the safe and stable operation of power grids [9,10].
DC bias induced by HVDC monopolar earth-return operation and by geomagnetically induced currents (GICs) has also been extensively investigated in international power systems. He et al. [11] characterized the vibration and audible noise behavior of AC transformers under HVDC monopolar operation, providing direct evidence of the impact mechanism. For GIC-related disturbances, Marti et al. [12] developed a recursive-convolution method to compute the induced electric field during geomagnetic storms, while Overbye et al. [13] proposed a power-grid sensitivity analysis framework for evaluating GIC propagation. These studies confirm that the underlying DC bias mechanism is universal across HVDC-equipped power systems, and provide the international context for the present work. More recently, Acosta et al. [14] performed a sensitivity analysis of commutation failure in multi-infeed HVDC systems with different AC system representations and fault types, highlighting that multi-infeed interaction is a current and active research focus in the HVDC community.
Although the above studies provide valuable practical experience through field measurement and post-commissioning mitigation [15,16,17,18], they still have several limitations. First, such approaches usually require online monitoring devices at transformer neutral points and other locations, and therefore are more suitable for post-event diagnosis or operational verification than for planning-stage risk assessment. Second, as the number of DC infeeds in receiving-end grids continues to increase, the interaction among multiple grounding electrodes makes transformer DC-bias behavior more complex, and conventional analysis based only on a single DC project or current-magnitude evaluation is no longer sufficient. In particular, polarity coordination may transfer the critical risk from one voltage level or area to another, so high-risk substations should be screened under multiple operating modes using a unified substation registry. Third, from an engineering perspective, practical mitigation should not only suppress the DC-bias current effectively, but also support targeted deployment at a limited number of high-risk substations, thereby avoiding unnecessary system-wide retrofitting.
Compared with existing studies, the specific contribution of this work can be positioned from three aspects. First, most existing DC-bias assessments rely on pre-surveyed soil-resistivity models and design grounding parameters, while field measurements are usually used only for post-commissioning verification or operational monitoring. A clear engineering route is therefore needed to reduce earth-resistivity uncertainty when transformer neutral-point current measurements are available. Second, the most closely related screening approaches identify critical or vulnerable substations either from the network connectivity of the DC-bias current distribution [19] or from site-selection screening based mainly on single-electrode DC-bias magnitude [9], building on classical ground-return current modeling that captures mutual resistances between substations [6]. However, for a multi-infeed receiving-end grid, high-risk identification should be performed on a unified substation registry and should jointly consider AC-grid topology, grounding conditions, voltage-dependent allowable limits, and DC-bias responses under different grounding-electrode operating modes. Third, existing mitigation schemes are often determined according to engineering experience or directly observed over-limit substations under a given operating condition [20,21,22]. Such schemes may suppress local DC-bias currents, but they do not fully form a closed loop between system-level risk screening, prioritized mitigation target selection, and post-mitigation verification.
To address these issues, this paper selects a typical multi-infeed UHVDC receiving-end grid as the study object. A field–circuit coupling model is first established to calculate the DC current distribution in the AC network using the earth-resistivity model, grounding-electrode parameters, substation grounding parameters, transformer winding DC resistances, and grid topology. To reduce the influence of earth-resistivity uncertainty, a measurement-based correction procedure is introduced and verified using field measurements from a commissioned UHVDC project, while the local case-study simulations are carried out using the locally established earth-resistivity model. Based on a weighted complex-network representation of the AC grid, transformer DC-bias risks are then evaluated under four representative grounding-electrode operating modes. The maximum DC-bias risk, average DC-bias risk, over-limit severity, and topology-related importance are combined to rank high-risk substations on a unified 898-substation registry. Finally, targeted neutral-point resistor mitigation is evaluated for the actual over-limit substations, and the mitigation effect is verified by post-mitigation DC-bias calculation. The grounding-electrode parameters and operating modes considered in this work are consistent with the international design guidelines in CIGRE TB 675 [23].
Complex network representations have previously been applied to DC-bias problems, both for identifying critical nodes from the connectivity of the DC-bias current distribution [19] and for evaluating substation DC-bias control [24]. The present work does not claim the network representation itself as its contribution. What is new is the object being screened: a unified full-substation registry evaluated under multiple grounding-electrode polarity combinations against voltage-dependent limits, rather than a single operating condition or an incidental subset of exported records. Section 4.5.1 quantifies what this adds—a ranking based on DC-bias current magnitude alone recovers only two of the four physically over-limit substations within its top ten, whereas the proposed limit-normalized multi-mode ranking recovers all four within its top four, and no single grounding-electrode operating mode recovers the complete over-limit set. Beyond DC-bias-specific studies, metaheuristic optimization has also been widely applied to controller tuning and device configuration in modern power systems, for example walrus-optimizer-based fractional-order PID control [25] and chaos-game-optimization-based control strategies [26] for offshore wind farms, as well as ant-colony-based optimization of DC-bias blocking-device installation [27].
The main contributions of this paper can be summarized as follows.
(1) A field–circuit DC-bias calculation framework with a measurement-based earth-resistivity correction procedure is established. The correction procedure is verified using field measurements from a commissioned UHVDC project, and the case-study grid is modeled with locally measured and inverted earth resistivity together with detailed grounding, transformer, and network parameters. This provides an engineering route for dealing with earth-resistivity uncertainty in planning-stage DC-bias assessment.
(2) A complex-network-guided high-risk substation identification method is proposed for multi-infeed receiving-end grids. By combining weighted grid topology, voltage-dependent current limits, multi-mode neutral-point DC-bias exposure, and over-limit severity, all 898 substations are screened under a unified criterion, avoiding the incomplete-subset limitation of exported records and the one-sidedness of single-mode rankings.
(3) A targeted mitigation verification is carried out for the identified high-risk substations. Four representative grounding-electrode operating modes are simulated to reveal polarity-dependent risk transfer between 500 kV and UHV substations. The identified over-limit substations are then mitigated by installing neutral-point series resistors, verifying that the proposed ranking can directly support economical mitigation deployment while avoiding system-wide retrofitting.
2. Field–Circuit Coupling Model for Transformer DC-Bias Assessment
2.1. Theory Behind DC Bias in UHVDC Transmission Projects
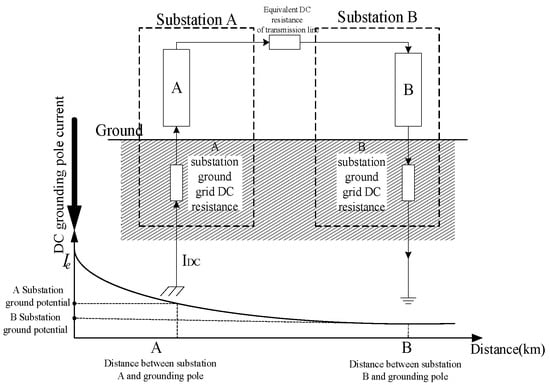
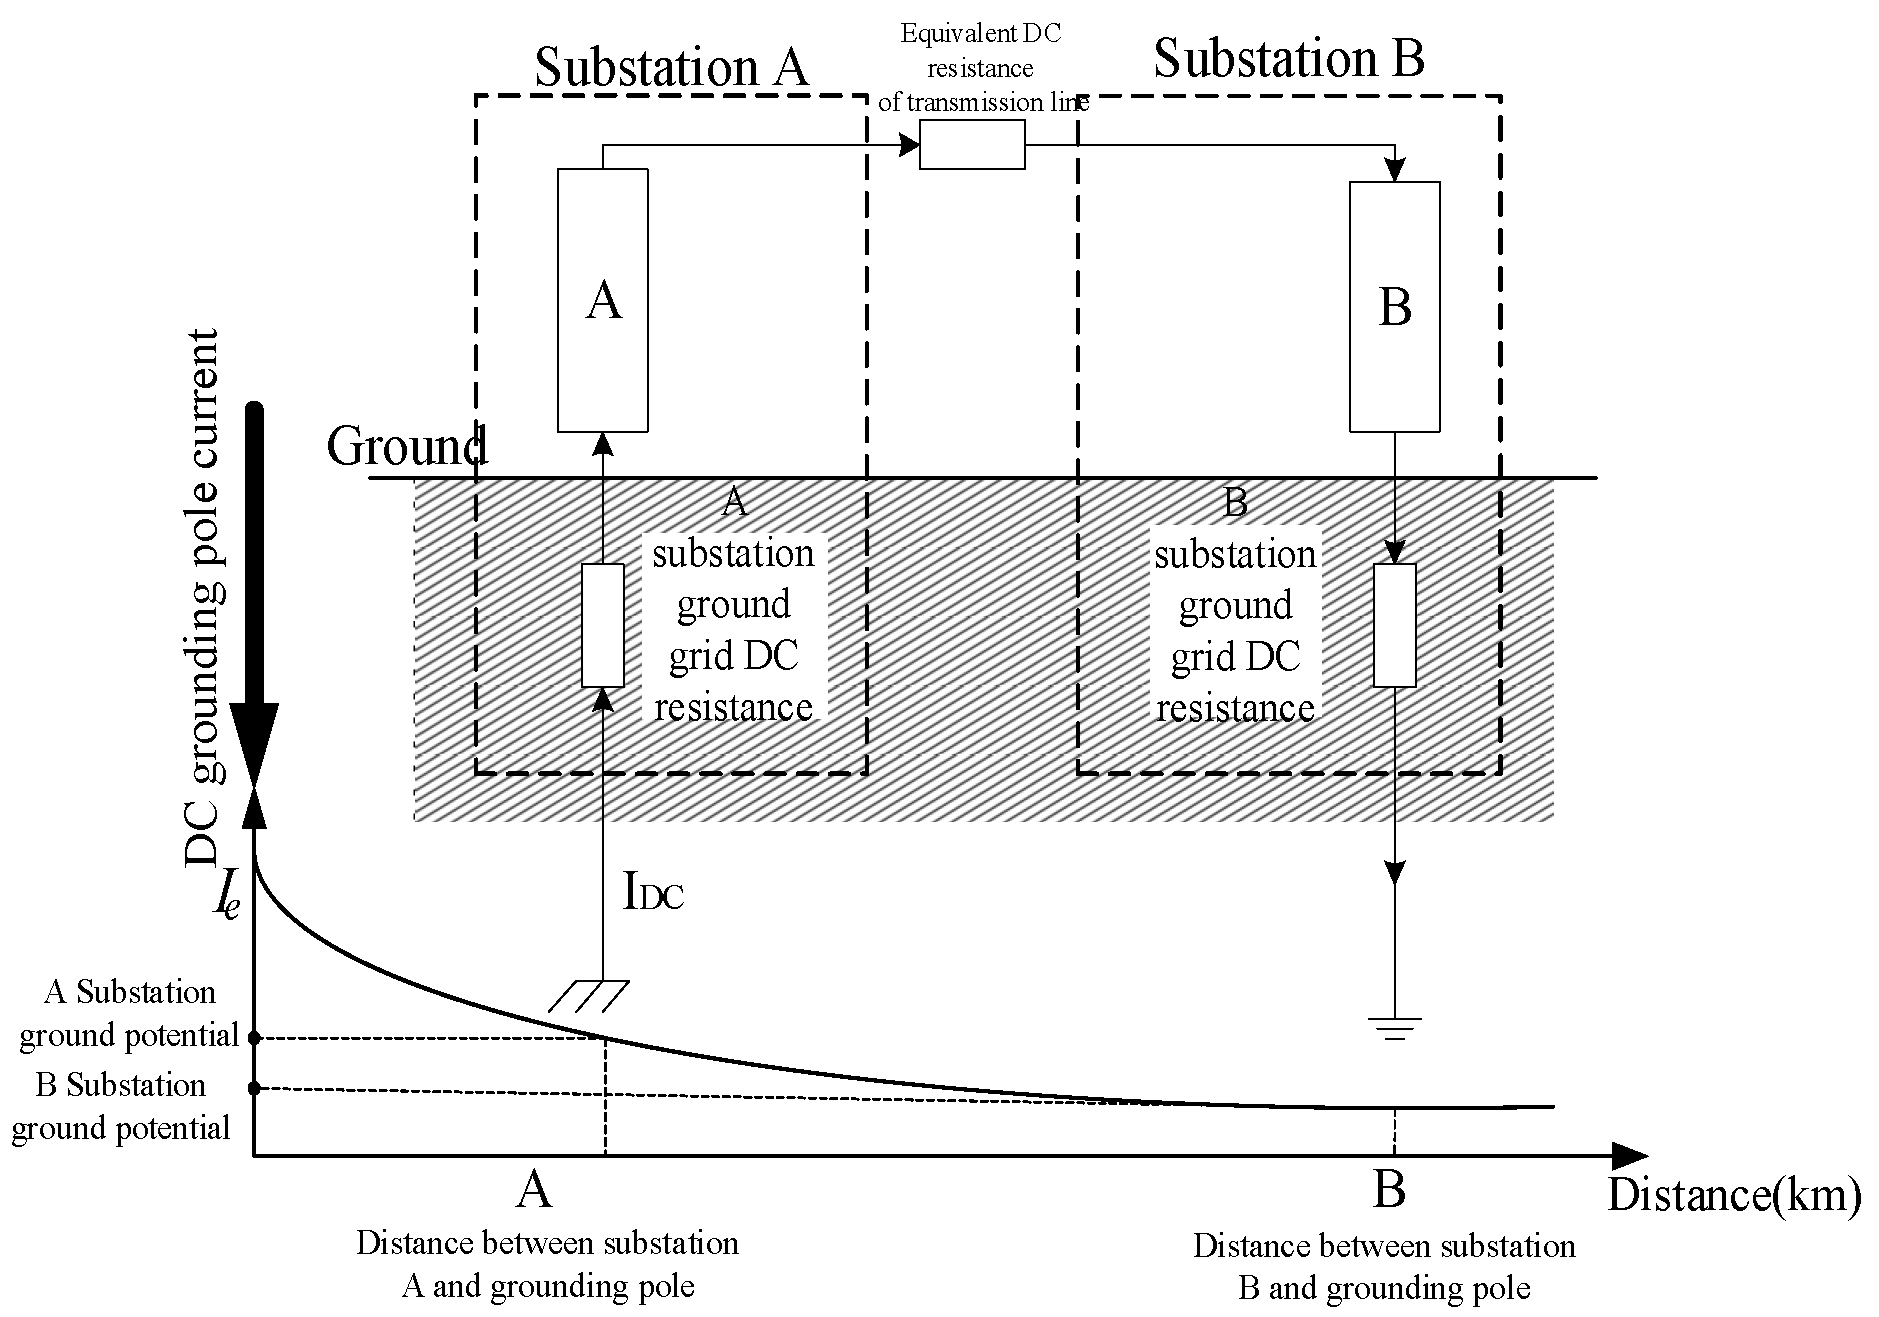
Figure 1 illustrates the path through which DC current flows from the DC transmission system into the Alternating Current (AC) transmission system.
Figure 1.
The principle diagram of DC bias caused by grounding current in DC engineering [28].
In (1), RA, RB, and MAB denote the grounding resistances of substations A and B and their mutual resistance, while RTA, RTB, and RZ denote the transformer winding and line conductor DC resistances. Under monopolar earth-return operation, grounding-electrode current causes ground-potential distortion, allowing DC current to enter transformer windings through the earth–substation–line return path. Thus, DC-bias assessment requires calculating the AC-grid DC current distribution as a function of soil properties, grounding-electrode current, substation grounding parameters, and network configuration.
2.2. DC Current Distribution in the AC Power Grid
The formulation below addresses the steady-state DC current distribution produced by monopolar earth-return operation. The grounding-electrode injection is treated as a zero-frequency source and the AC network as a linear resistive network of transformer winding DC resistances, line DC resistances and substation grounding resistances. Transient AC phenomena occur on millisecond-to-second timescales, whereas monopolar earth-return operation persists for minutes to hours, so the two are treated as separable; core saturation, harmonics, vibration and audible noise are consequences of the resulting DC bias rather than inputs to its calculation.
The DC current distribution model comprises an aboveground and an underground part. The aboveground part represents the AC transmission network as a circuit model containing line and substation components. The underground part represents a multi-conductor current field and therefore takes the form of an electric field model.
2.2.1. Aboveground Model
Consider the line model first. It consists of three resistive branches connecting the three-phase buses of the substation, and is defined by two key parameters: DC resistance and wiring configuration. The equation used to estimate the DC resistance of the line is provided below:
In (2), RL represents the resistance of a single-phase line (Ω), ρ is the resistivity of the line material (Ω·m), S is the cross-sectional area of a single-phase line (m2), and D is the length of a single-phase line (m).
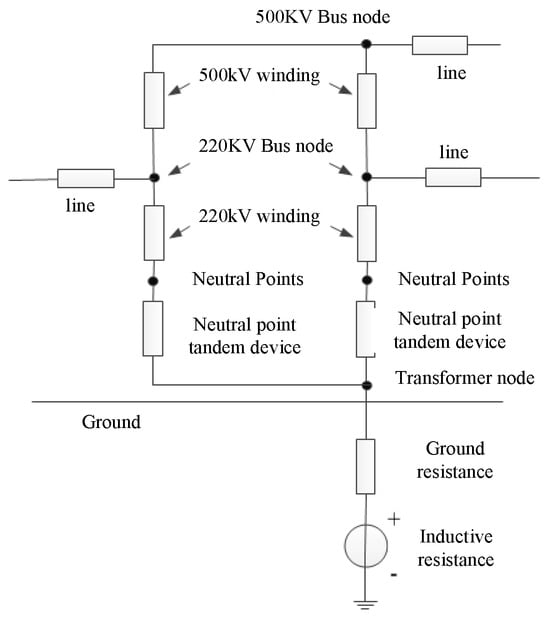
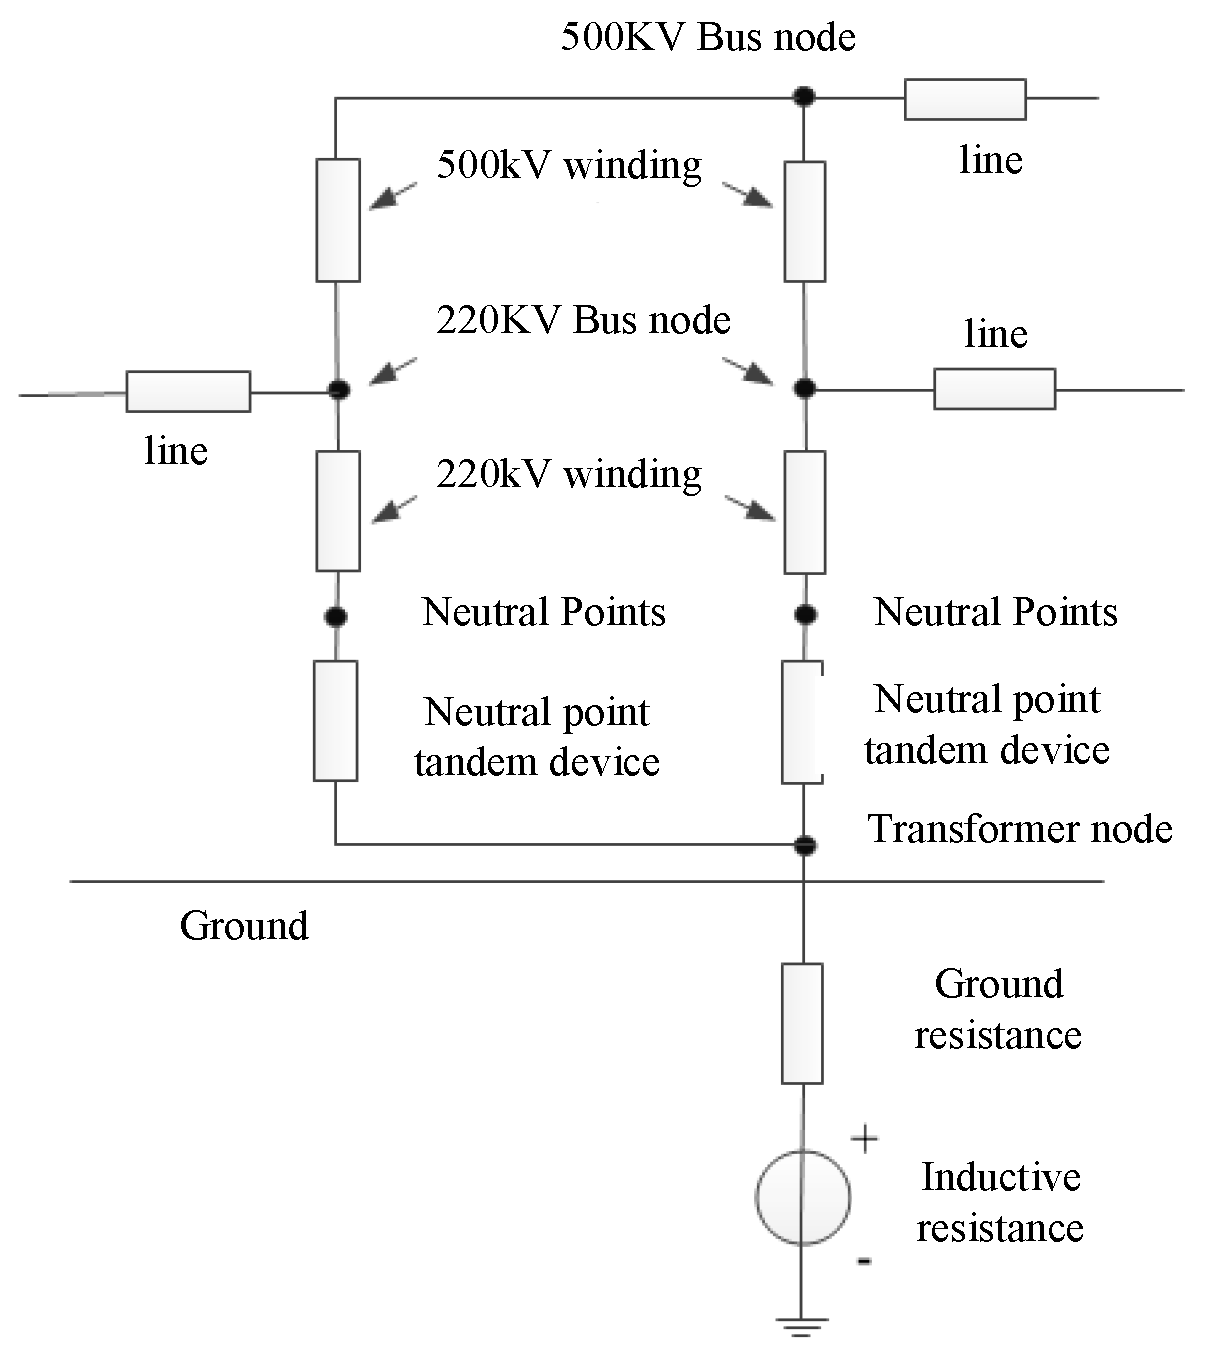
The substation model follows. Its aboveground portion poses a purely circuit-theoretic problem and comprises substation nodes, a transformer model, and a neutral-point series-device model. Figure 2 shows the equivalent DC model of a typical 500 kV transformer.
Figure 2.
Equivalent DC model of the substation [29].
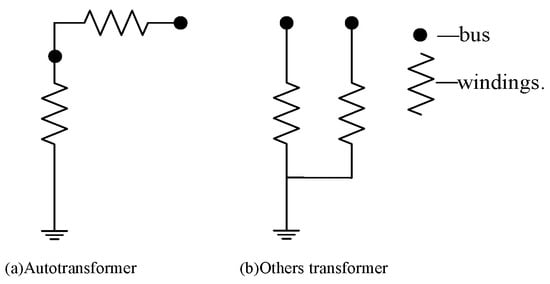
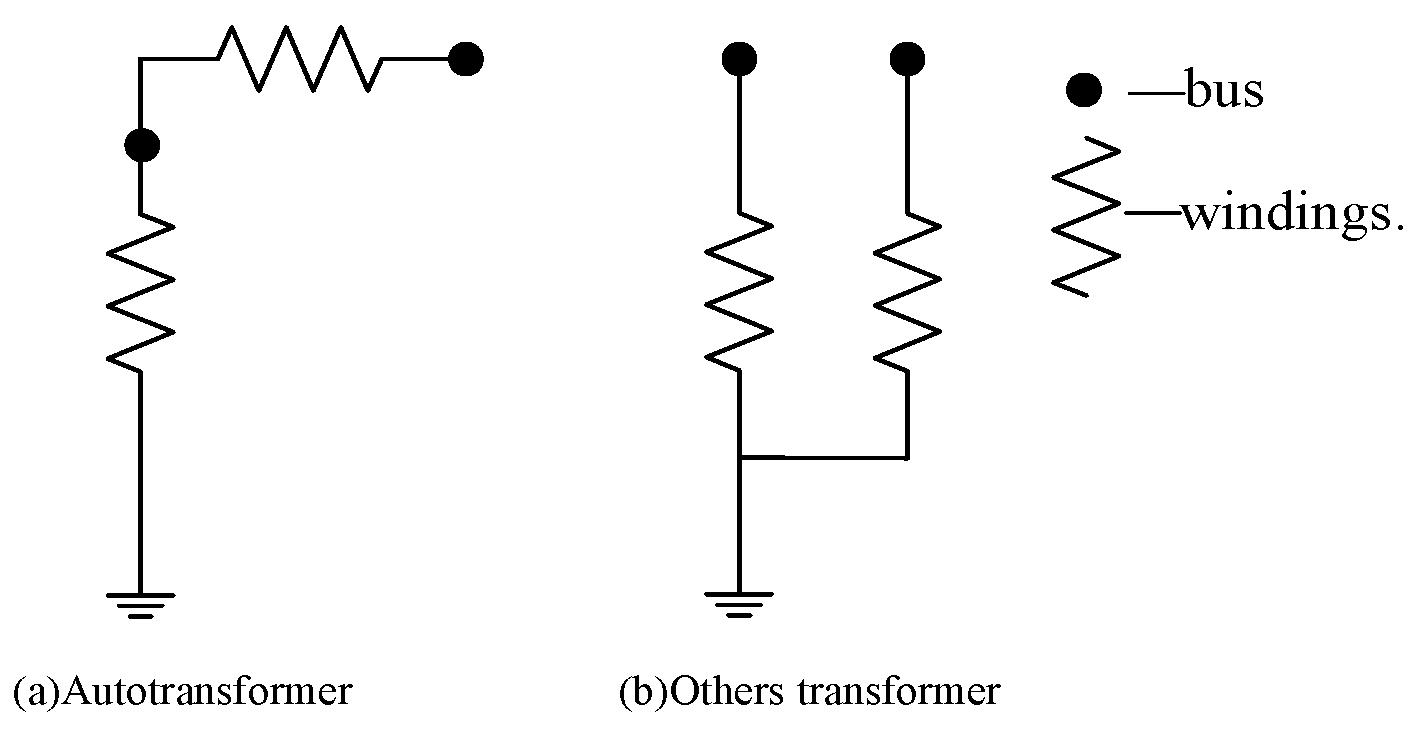
The calculation of the DC current distribution only needs distinguishing whether a transformer is an autotransformer. Figure 3 shows the types of transformer windings.
Figure 3.
Schematic diagram of transformer winding types.
2.2.2. Underground Model
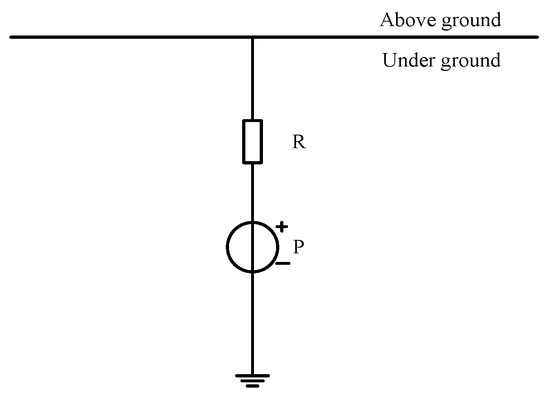
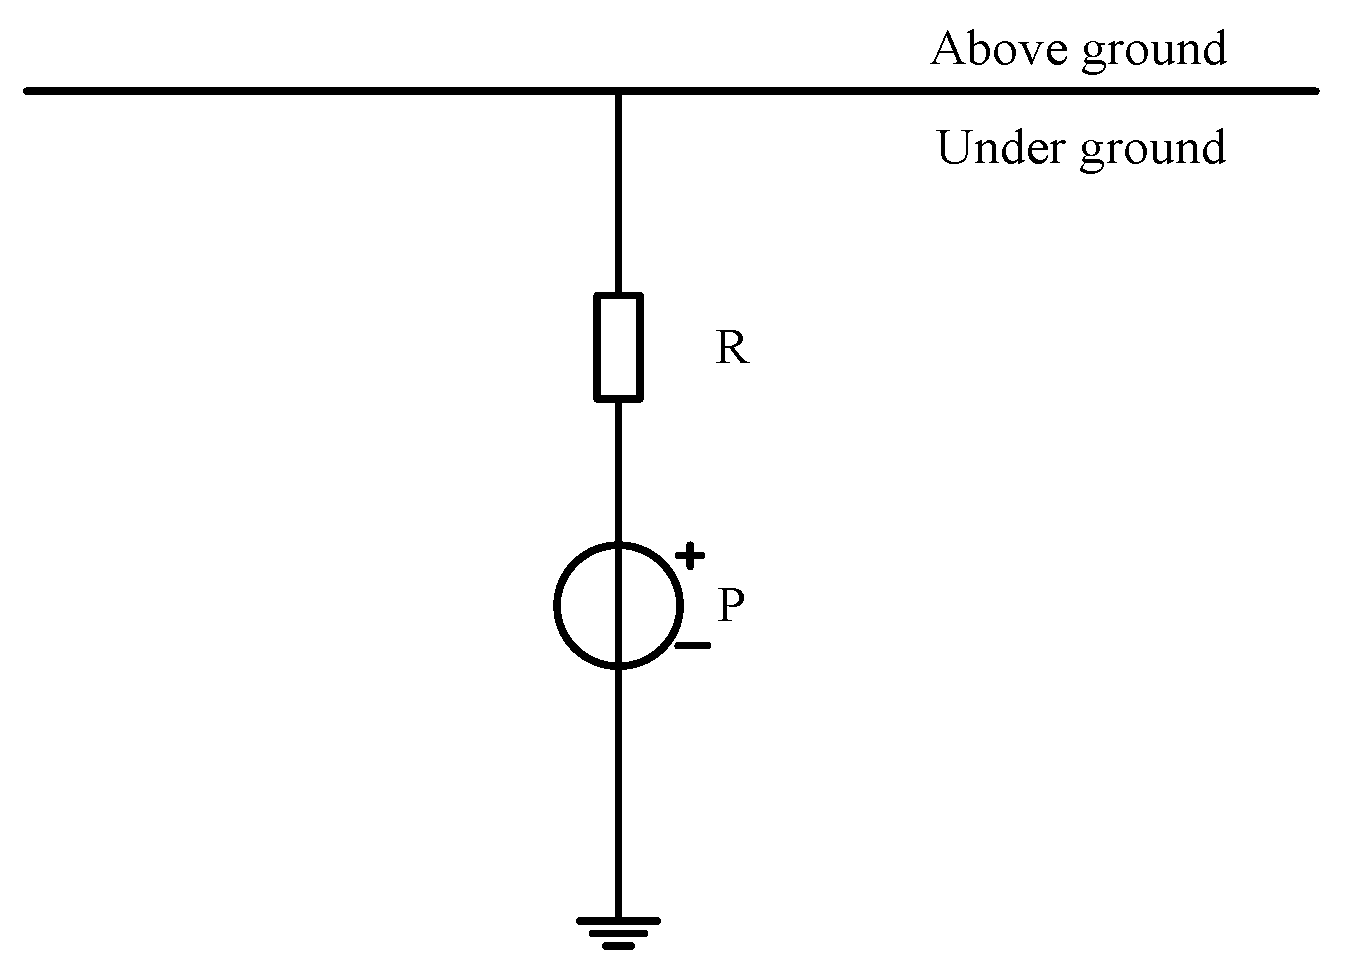
The underground model of the substation includes the grounding resistances and surface potentials, as depicted in the subsurface portion of Figure 4.
Figure 4.
Underground model of the substation.
The grounding resistance R represents the equivalent resistance between the substation’s neutral point and the zero potential point at infinity. The ground potential P is the potential formed by the dissipation of incoming current in the earth. The surface ground potential P is given by
In (3), M represents the mutual resistance matrix between the DC pole and the substation, while N is the mutual impedance matrix between substations (excluding self-impedance). ID denotes the DC current injected into the ground by the DC pole, and IA represents the DC current at the neutral point of the substation. The mutual resistance matrices M and N can be solved using classical grounding theory equations:
In (4) and (5), Vp represents the ground surface potential, while G(P, Oj) denotes the potential at point P induced by a unit point current source located at Oj, considered as the equivalent center. By positioning the target point P at each segment i, G(i, j) represents the voltage induced at segment i when a unit current source is applied at segment j. This value is defined as the mutual resistance, denoted by Rij. When i equals j, Rij is referred to as the self-resistance.
2.2.3. DC Current Distribution in the AC Power Grid Based on Field–Circuit Coupling
The aboveground and underground models are coupled through two shared quantities, and it is useful to state the coupling explicitly before assembling the equations. The underground (field) model of Section 2.2.2 produces the ground surface potential at each substation site, which acts as the driving source of the DC problem; the aboveground (circuit) model of Section 2.2.1 then determines how the resulting current distributes among transformer windings, transmission lines and grounding grids. The two models are not solved in sequence, because the substation neutral current appears in both: it is an output of the circuit model and, through the mutual resistances between grounding grids, also a source term of the field model. They must therefore be solved simultaneously, which is what the field–circuit coupling formulation below does.
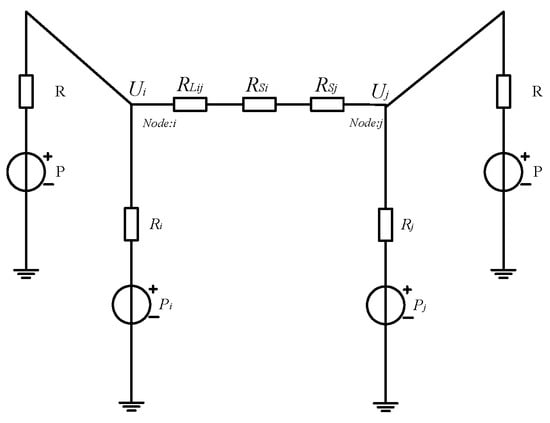
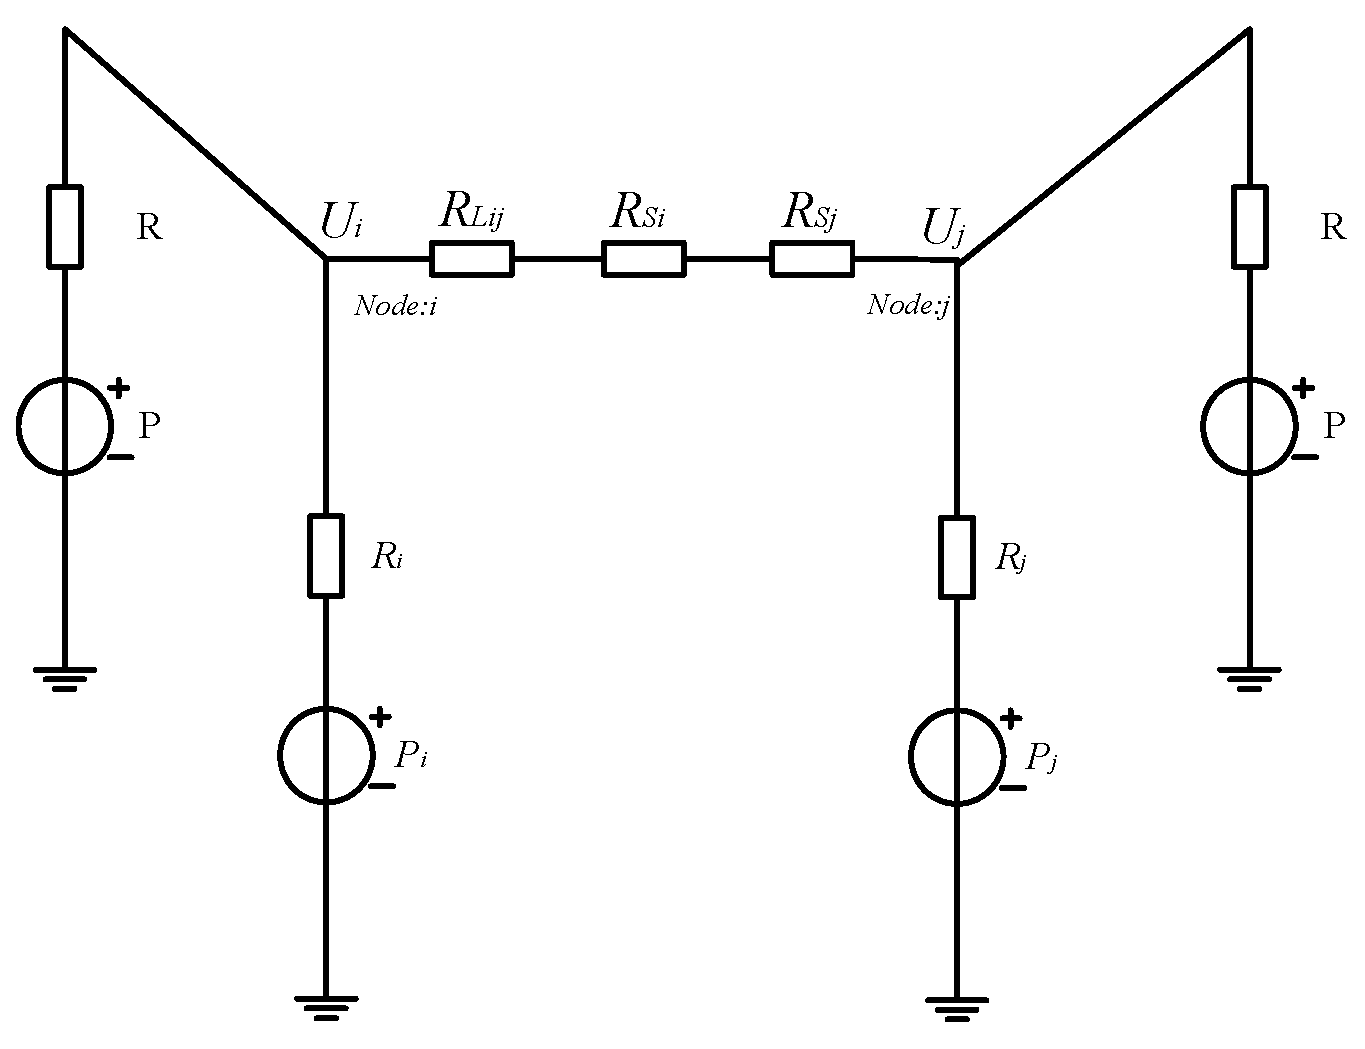
For an AC power grid with k substations and b independent neutral points, there are h transmission lines, resulting in k nodes and (k + h + b) branches in total. By combining the aboveground and underground models, a field–circuit coupling model can be constructed, as illustrated in Figure 5.
Figure 5.
DC current distribution in the AC power grid based on field–circuit coupling.
According to the node voltage method and Figure 5, (6) can be derived [19,30]:
where Y is the grid node conductance matrix, denoted as
In (7), H is the association matrix between the substation node and all nodes, and HT is the transpose of H. The matrix Hm × (m + n + b) is defined as
In (8), Em is an identity matrix of order m. G represents the substation grounding conductance matrix, given by G = R−1, where R = diag(RG1, RG2, …, RGm), and RGi is the DC grounding resistance of the ith substation (Ω). Q denotes the node conductance matrix of the AC grid grounding network.
In (6), J is the column vector of current injected into the grid nodes, which can be represented by (9):
In (9), JS, JN, and JB represent the column vectors of injected currents (A) at the substation nodes, independent neutrals, and bus nodes, respectively.
Similarly, in Equation (6), U represents the column vector of grid node voltages, and Equation (10) is given by
US, UN, and UB represent the column vectors of voltages (V) at substation nodes, independent neutral points, and bus nodes, respectively. Where a neutral point short-circuits to a substation node, the model retains only the substation node. Consequently, the substation node voltage is given by (11):
Using (11) and basic circuit principles, the DC current at the neutral point of the substation, IA, can be obtained, as represented by (12):
By solving (11) and (12) simultaneously, and substituting the ground surface potential P of the substation, (13) can be expressed as
In Equation (13), Z = HY−1HTG − E. The term HY−1HT represents the portion of the nodal resistance matrix corresponding to the substation nodes. Except for the current quantities IA and ID, R, N, and M are purely field quantities, and the Z matrix represents a field–circuit coupling parameter. The model described by (13) is the field–circuit coupling model used in this work to compute the DC current distribution in the multi-infeed AC receiving-end grid considered in the case study; its extension to other large-scale systems follows the same formulation and is left to future work.
The matrix Z admits a direct physical reading. The term HY−1HT is the block of the nodal resistance matrix associated with the substation nodes, that is, the driving-point and transfer resistances that the AC network presents at the transformer neutrals. Post-multiplying by the grounding conductance matrix G converts a ground-potential rise at a substation into the current that this rise drives into the network, and subtracting the identity matrix retains only the net exchange between the earth and the network. Element Z_ij therefore expresses how strongly a potential rise at substation j contributes to the neutral-point DC current at substation i, so that Z acts as the transfer operator between the field problem and the circuit problem. The symbols used in (6)–(13) are collected in the Nomenclature at the end of the paper.
3. DC-Bias Simulation Modeling and High-Risk Substation Identification Method
3.1. Factors Required for DC-Bias Current Simulation Modeling
Transformer DC-bias modeling typically requires collecting the soil model near the grounding electrodes (Section 3.1.1) together with the grid information and operating mode parameters detailed in Section 3.1.2.
3.1.1. Soil Model near Grounding Electrode
The earth-resistivity model determines the ground surface potential distribution and the mutual resistance between grounding electrodes and substations, and is therefore a key input for DC-bias simulation. Combining shallow four-electrode measurements with deep magnetotelluric sounding yields an initial layered-earth model [31], whose layer resistivities and thicknesses enter the field–circuit coupling calculation directly. Supplementary S1 lists the measurement equipment and Supplementary S2 gives the layered soil-resistivity parameters used in the case study.
3.1.2. Other Influencing Factors in DC-Bias Current Simulation Modeling
In addition to the earth-resistivity model, DC-bias simulation requires AC-grid parameters and grounding-electrode operating conditions. The grid parameters include substation locations, grounding resistances, transformer winding DC resistances, neutral-point grounding modes, and line DC resistances. The operating parameters include grounding-electrode locations, earth-return currents, current polarity, converter-station operating modes, and representative AC network operating modes.
For multi-infeed UHVDC receiving-end grids, different grounding-electrode polarity combinations may cause reinforcement or cancelation of neutral-point DC currents. Therefore, single-electrode operation, same-polarity multi-electrode operation, and opposite-polarity multi-electrode operation are considered in the following analysis.
3.2. Comprehensive High-Risk Substation Identification Based on Complex Network Theory
In a multi-infeed UHVDC receiving-end grid, transformer DC-bias risk is influenced by the neutral-point DC current, the substation’s electrical position in the AC network, its grounding condition, the DC resistance of connected transmission corridors, and the operating mode of grounding electrodes. Complex network theory provides an effective way to represent these structural and electrical factors at the system level. Although it has been used to identify key substations affected by DC bias and to evaluate mitigation effects [24], high-risk substations in multi-infeed receiving-end grids should be identified by jointly considering network importance, DC-bias risk, voltage-dependent limits, and operating-mode variation.
Accordingly, this study proposes a comprehensive high-risk substation identification method based on a weighted complex-network model of the AC grid. The receiving-end grid is represented as an undirected weighted graph:
where V is the set of substations, E is the set of AC transmission lines, and W is the weighted adjacency matrix. Each substation forms a node and each AC transmission corridor forms an edge. For parallel transmission lines, the equivalent DC resistance is obtained by parallel equivalence. The edge weight is defined as
where is the equivalent DC resistance between substations i and j. A larger wij indicates a stronger DC electrical connection. The electrical distance used for topological analysis is correspondingly taken as dij = .
The choice of 1/ as the edge weight is not a heuristic proxy for electrical coupling but the exact branch admittance of the DC problem. Under zero-frequency excitation a transmission corridor exhibits neither series reactance nor shunt susceptance, so its DC resistance is the only parameter that governs current sharing, and any alternative weighting based on line length, thermal rating or geographic distance would be less physically faithful. It should also be noted that the DC current distribution itself is obtained from the field–circuit coupling model of Section 2, not from the graph; the edge weight enters only the structural descriptors defined below.
To describe the structural importance of each substation, four indicators are considered: weighted degree, betweenness centrality, closeness centrality, and grounding participation. The weighted degree reflects the direct electrical connection strength of a substation; betweenness centrality indicates whether the substation lies on important electrical transfer paths; closeness centrality reflects its average electrical distance to other substations; and grounding participation accounts for the influence of substation grounding resistance. The grounding participation factor is defined as Gi = 1/, where is the grounding resistance of substation i. After min-max normalization, the comprehensive topological importance is expressed as
The DC-bias risk of each substation is then evaluated under different grounding-electrode operating modes. Let denote the calculated transformer neutral-point DC-bias current of substation i under operating mode s, and let Li denote the allowable DC-bias current limit corresponding to the voltage level of substation i. The normalized DC-bias risk under mode s is defined as
where > 1 indicates that the substation exceeds the adopted screening limit under operating mode s. To account for both worst-case and multi-mode DC-bias risk, the maximum DC-bias risk the average DC-bias risk , and the over-limit severity Ei are defined as
where S is the set of considered operating modes. represents the worst-case DC-bias risk, reflects the average DC-bias risk across all considered operating modes, and Ei quantifies the severity and persistence of limit violations.
Finally, the comprehensive high-risk identification index of substation \( i\) is constructed as
The weighting and normalization used in (16) and (19) are specified as follows. All indicators are mapped to [0, 1] by min–max normalization, Xi = (Xi − Xmin)/(Xmax − Xmin), with the extrema taken over the whole screened substation registry rather than per voltage level, so that the normalized quantities remain comparable across the system. In (16) the four topological indicators are weighted equally (a1 = a2 = a3 = a4 = 0.25), since there is no physical basis for ranking one structural descriptor above another. The four risk terms in (19), by contrast, are not equally relevant to limit compliance, and their weights are therefore obtained by the analytic hierarchy process. The pairwise judgments adopted are as follows: Qmax equally important to Qavg; Qmax weakly more important than E (scale 2); Qmax very strongly more important than T (scale 8); Qavg equally important to E; Qavg strongly more important than T (scale 5); and E strongly more important than T (scale 5). These judgments express the engineering principle that the worst-case exposure is what determines whether a limit is violated, whereas the topological term supplies structural context and must not be allowed to override a physically computed limit violation. The resulting principal eigenvector gives b1 = 0.40, b2 = 0.30, b3 = 0.25 and b4 = 0.05, with a consistency ratio CR = 0.018, well below the 0.10 acceptance threshold.
3.3. Measurement-Based Correction of the Earth-Resistivity Model
The earth-resistivity model directly affects the calculated ground surface potential and the mutual resistance between grounding electrodes and substations. Although the initial layered-earth model is obtained from four-electrode resistivity measurements, magnetotelluric sounding, and geological information, uncertainties remain due to limited measurement points, inversion errors, layered-earth simplification, and local geological inhomogeneity. These uncertainties may cause deviations between calculated and measured transformer neutral-point DC currents.
To reduce this uncertainty, measured transformer neutral-point DC currents are used as calibration targets for the equivalent earth-resistivity model. The correction does not modify the AC network topology, transformer parameters, substation grounding resistances, or grounding-electrode currents. Instead, it adjusts the equivalent soil resistivity used in the field–circuit coupling calculation. Let denote the initial resistivity of the kth soil layer or equivalent soil region, and ck denote the corresponding correction coefficient. The corrected resistivity is expressed as
For substations with available field measurements, the correction coefficients are obtained by minimizing the mismatch between calculated and measured neutral-point DC currents:
where M is the set of substations with measured neutral-point DC currents, is the measured current, (c) is the calculated current obtained from the field–circuit coupling model, I0 is a small reference current used to avoid excessive weighting of near-zero measurements, and λ is a regularization coefficient. The regularization term constrains the corrected model so that it remains physically consistent with the initial geophysical inversion result.
In practical implementation, the correction can be performed by adjusting equivalent resistivity correction coefficients for different soil layers or regions. To avoid nonphysical correction, the parameters are constrained within engineering-acceptable bounds:
The correction proceeds iteratively: the initial model yields a first DC-bias calculation, comparison with the measured currents gives the mismatch, and the correction coefficients update until the error falls to an acceptable level. The corrected earth-resistivity model is then used for the multi-infeed simulations in Section 4. Its effectiveness is evaluated in Section 4.2 by comparing measured currents with calculated results before and after correction.
3.4. Simulation Modeling of DC-Bias Current
Based on the corrected earth-resistivity model and the field–circuit coupling formulation in Section 2, a DC-bias simulation model is established for the multi-infeed UHVDC receiving-end grid. The model includes grounding-electrode locations and earth-return currents, substation locations, grounding resistances, transformer winding DC resistances, neutral-point grounding modes, AC transmission-line DC resistances, and the AC network topology. The ground surface potential caused by each grounding electrode is first calculated, and the AC grid is then converted into an equivalent DC network. By solving the field–circuit coupling equations, the neutral-point DC currents of substations and transformers are obtained.
In the case study, four representative grounding-electrode operating modes are considered: YZ single-electrode operation, CJ single-electrode operation, two-electrode operation with the same polarity, and two-electrode operation with opposite polarity. For each operating mode, the transformer neutral-point DC current is calculated for the unified substation set. The resulting ground surface potential, total ground current, and neutral-point DC current are then used to calculate , , , Ei, and Hi, providing the quantitative basis for the validation, high-risk substation identification, and mitigation analysis in Section 4.
4. Prediction and Suppression of DC-Bias Effects in a Complex Receiving-End Grid with Multiple DC Infeeds
4.1. Topological Structure of the Case-Study Receiving-End Grid
To verify the proposed method, a typical multi-infeed UHVDC receiving-end grid is selected as the case-study system. According to the modeling framework in Section 3.2, substations and grounding electrodes are represented as point objects in the topology diagram, but their roles are different. Substations are candidate nodes for high-risk identification and mitigation, whereas grounding electrodes are treated as DC current source nodes. Therefore, the topological importance is calculated only for substation nodes, while the influence of grounding electrodes is reflected through the ground surface potential and the calculated neutral-point DC currents in the field–circuit coupling simulation.
In the AC-grid topology, each substation is represented as a node, and each AC transmission corridor between two substations is represented as an edge. Parallel transmission lines are converted into equivalent branches according to their DC resistance. The main node attributes include voltage level, grounding resistance, transformer neutral grounding mode, and transformer winding DC resistance. These parameters are used to construct the weighted network and to calculate the topological importance index defined in Section 3.2.
The basic information of the constructed topology is summarized in Table 1. The unified simulation registry contains 898 substation nodes, and the same node set is used for the ground-current and transformer-neutral-current calculation results. This unified topology provides the data basis for applying the proposed high-risk identification method to the complete case-study system rather than to an incidental subset of substations.
Table 1.
Basic information of the case-study topology.
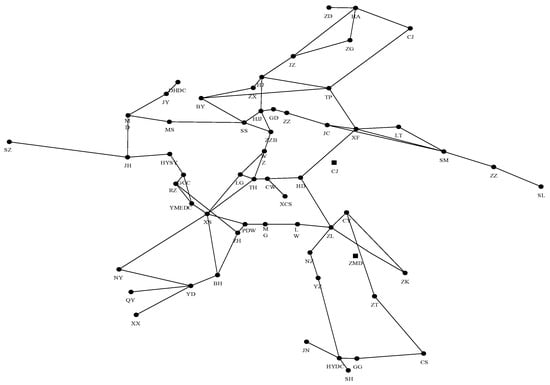
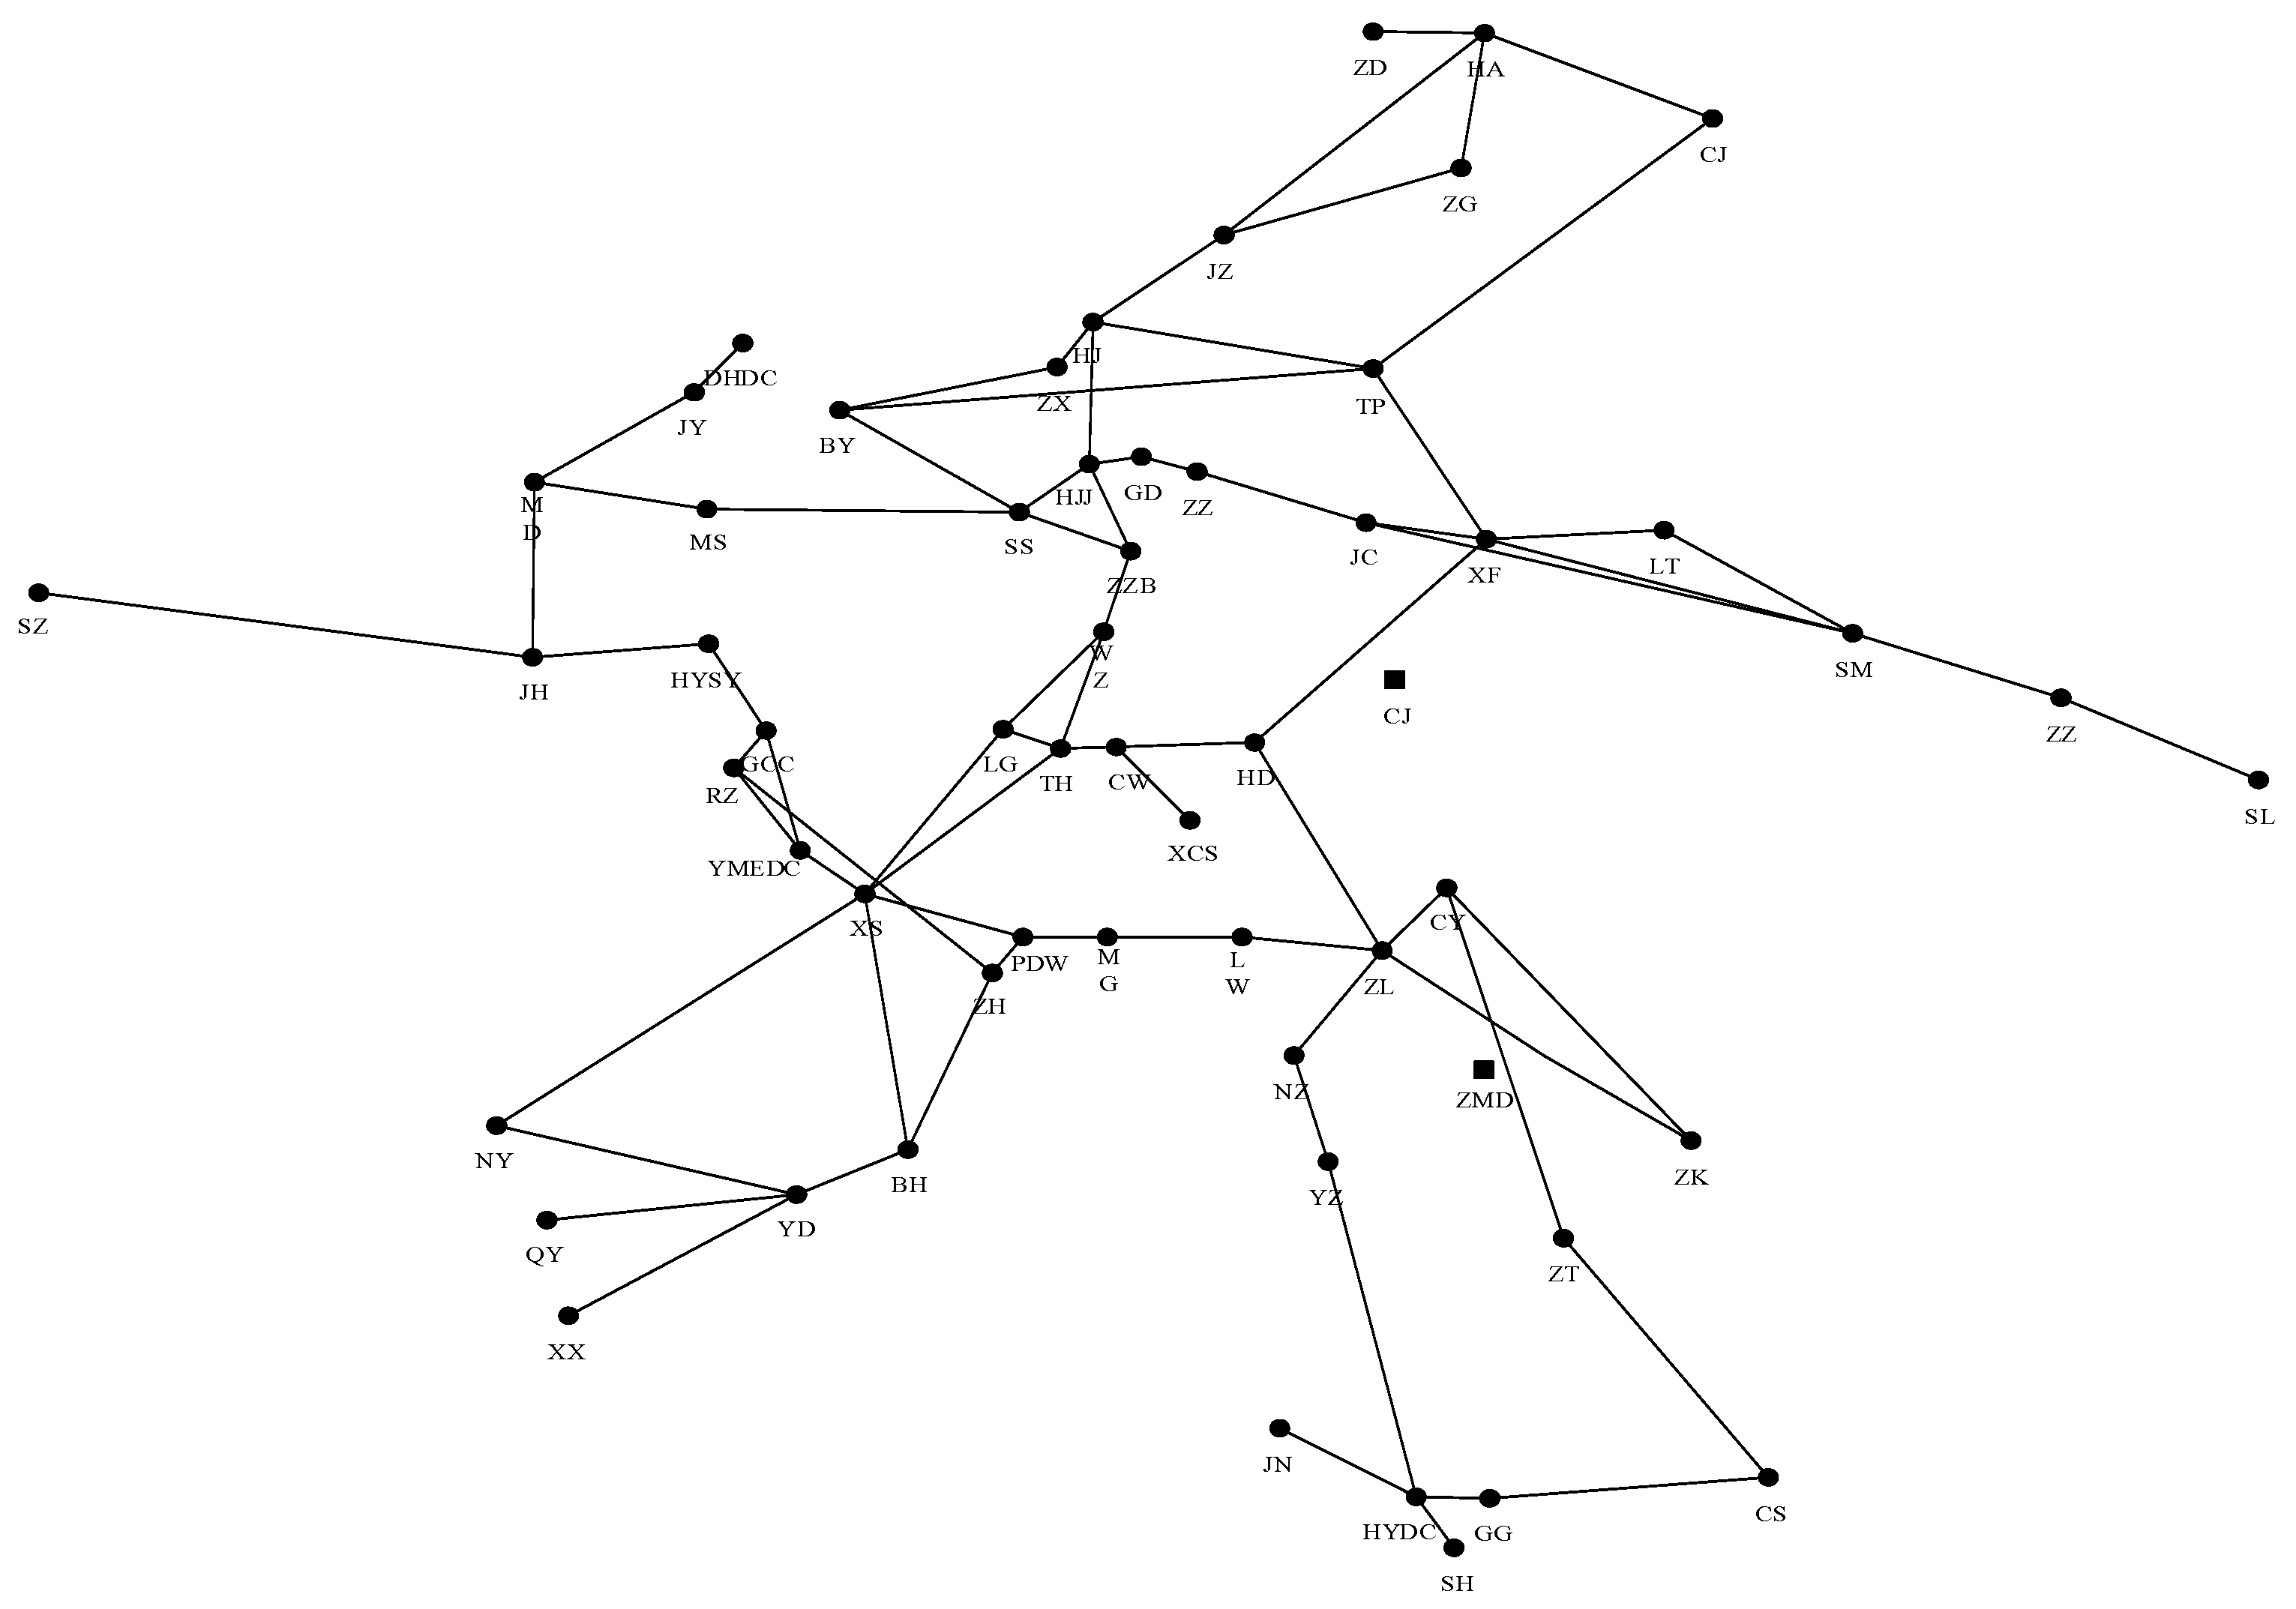
Figure 6 shows the topology of the case-study receiving-end grid used for DC-bias calculation and high-risk substation identification. The topology model provides the structural basis for the subsequent analysis: Section 4.2 validates the measurement-based correction of the DC-bias calculation model; Section 4.3 identifies high-risk substations by combining the topology information with multi-mode DC-bias simulation results; and Section 4.4 evaluates the targeted mitigation effect.
Figure 6.
Topological structure of the case-study receiving-end grid with YZ and CJ grounding electrodes.
4.2. Engineering Validation of the Measurement-Based Correction Framework
In the case-study receiving-end grid, no local transformer neutral-point DC current measurements are available under the YZ/CJ grounding-electrode operating conditions. Therefore, the earth-resistivity model used in the following simulations is not directly corrected by local field measurements, but is established from local geophysical measurements and inversion results. To address earth-resistivity testing and inversion uncertainty, Section 3.3 introduces a measurement-based correction framework, and an engineering validation case based on field measurements from a commissioned UHVDC project is provided in Supplementary S3.
The validation case shows that the initial earth-resistivity model already has acceptable engineering accuracy, while measurement-based correction further improves the agreement between calculated and measured neutral-point DC currents. The mean absolute error decreases from 0.51 A to 0.15 A after correction, and the maximum absolute error decreases from 1.27 A to 0.31 A; the current polarity is also reproduced at all measured substations after correction. Thus, although local YZ/CJ measurements are unavailable in this case study, the proposed framework provides a practical calibration route for future engineering application, while the following high-risk identification and mitigation analysis is carried out using the locally established earth-resistivity model and the unified 898-substation simulation registry.
The consequence of this limitation for the present conclusions is quantified in Section 4.5.2: under a ±5% perturbation of the equivalent earth resistivity the ranking retains 19 of its top 20 substations, and SMPP and ZT remain above their limits across the entire perturbed range. The absence of local calibration therefore bounds the accuracy of individual current values but does not alter the identification of the substations selected for mitigation.
4.3. High-Risk Substation Identification Results
Based on the unified 898-substation simulation registry, the proposed identification procedure is applied to the case-study receiving-end grid. For each substation, the transformer DC-bias currents under the four grounding-electrode operating modes are used to calculate the normalized risk indices defined in Section 3.2. In this subsection, the polarity effect is first interpreted from the multi-mode simulation results, and the high-risk substations are then ranked using the same 898-node registry. This avoids the incomplete-subset problem and ensures that all substations participating in the DC-bias calculation are screened under the same criterion.
4.3.1. Multi-Mode DC-Bias Calculation Results
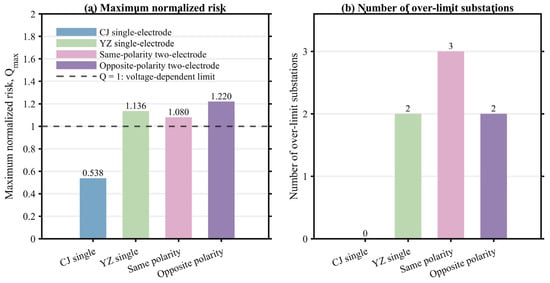
Table 2 summarizes the DC-bias risk under the four grounding-electrode operating modes, and Figure 7 compares the maximum normalized risk and the number of over-limit substations for each mode. CJ single-electrode operation does not produce any over-limit substation, whereas YZ single-electrode operation produces two over-limit 500 kV substations. Under same-polarity two-electrode operation, the over-limit set extends to UHV substations because of the lower 2 A screening limit at the 1000 kV level. Under opposite-polarity operation, the UHV risk is relieved, but the 500 kV risk at SMPP and ZT becomes more concentrated.
Table 2.
Summary of DC-bias risk under four grounding-electrode operating modes.
Figure 7.
Multi-mode DC-bias risk comparison under four grounding-electrode operating modes.
4.3.2. Polarity Superposition Effect Under Multi-Electrode Operation
The multi-electrode results show that polarity coordination changes not only the maximum current level but also the identity of the critical substations. For the signed ground current and ground surface potential, the combined response generally follows the algebraic superposition trend of the two single-electrode cases. However, the transformer DC-bias current used for risk screening is affected by the network current path, grounding condition, and transformer connection, and therefore the risk level cannot be inferred only from the magnitude of a single-electrode result.
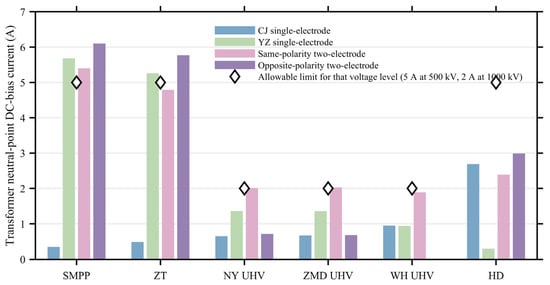
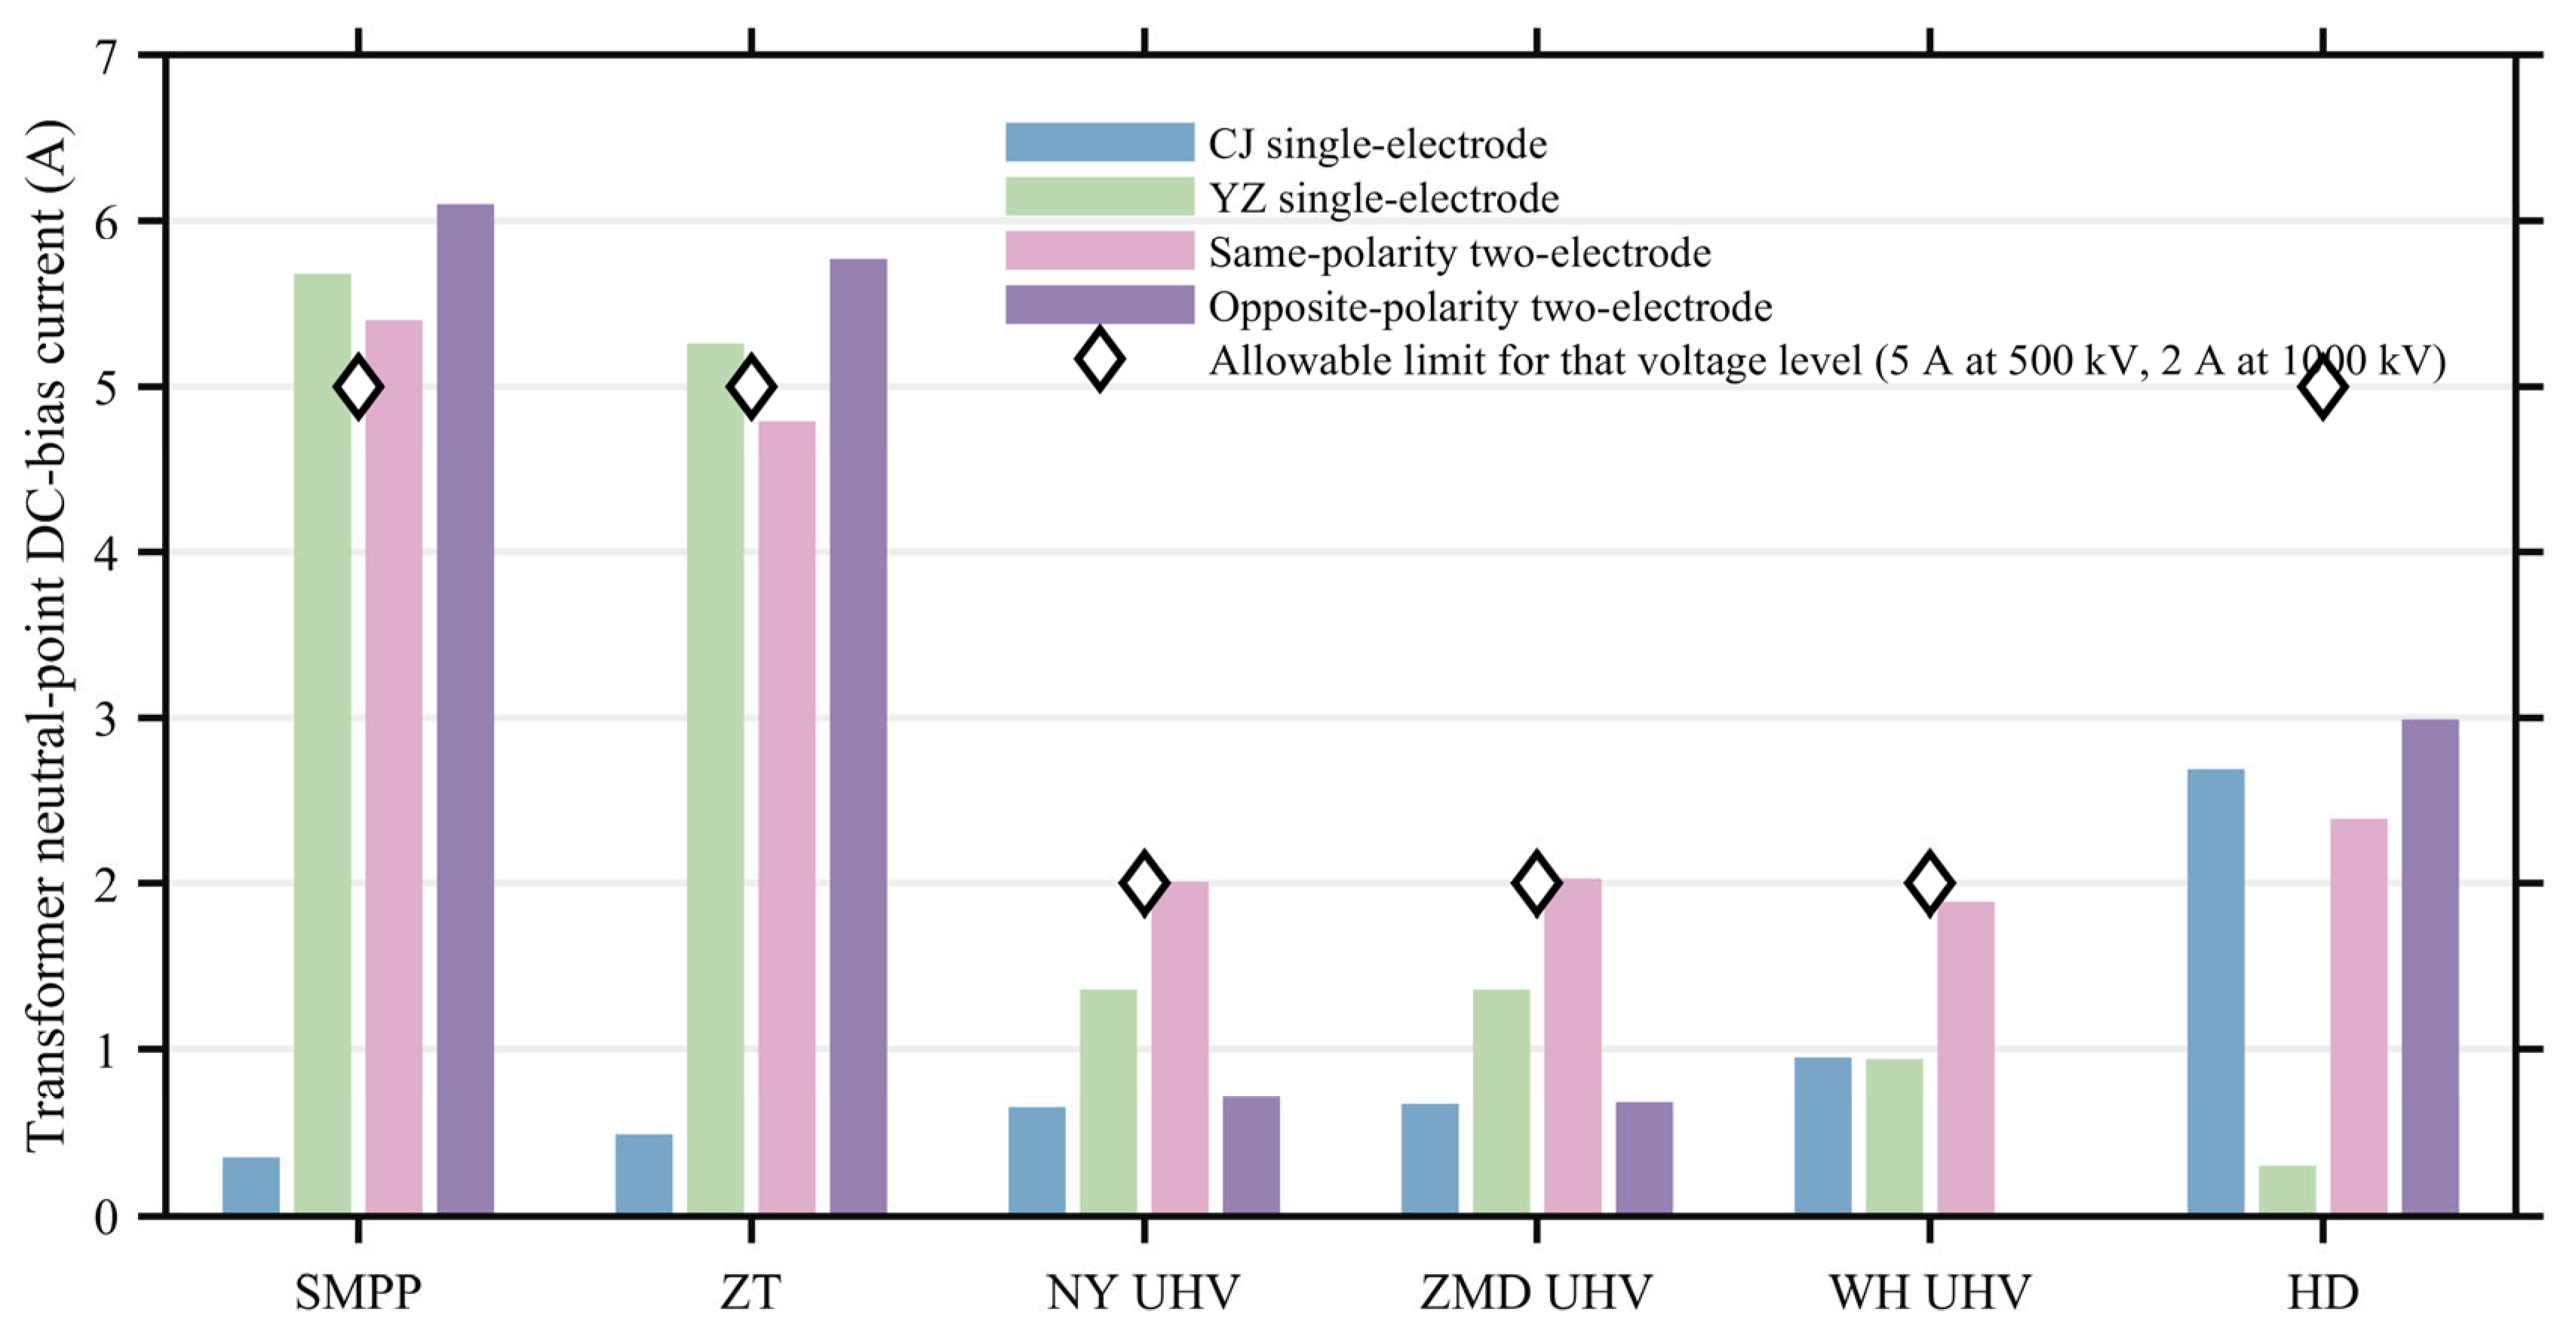
Representative examples are listed in Table 3 and visualized in Figure 8. At SMPP and ZT, opposite-polarity operation aggravates the 500 kV over-limit risk. In contrast, the UHV substations NY UHV and ZMD UHV become slightly over-limit under same-polarity operation but are relieved under opposite-polarity operation. WH UHV also shows strong cancelation under opposite polarity. These observations confirm that polarity coordination is an important mechanism for interpreting the multi-mode risk pattern, while the final screening should still be performed on the unified full-substation dataset.
Table 3.
Representative polarity-dependent DC-bias responses of substations.
Figure 8.
Polarity-dependent DC-bias currents at representative substations.
4.3.3. Full-Registry High-Risk Substation Ranking
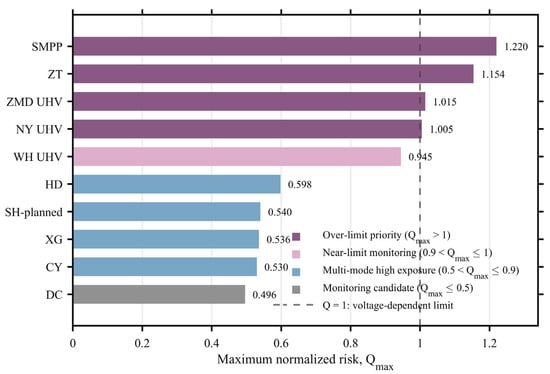
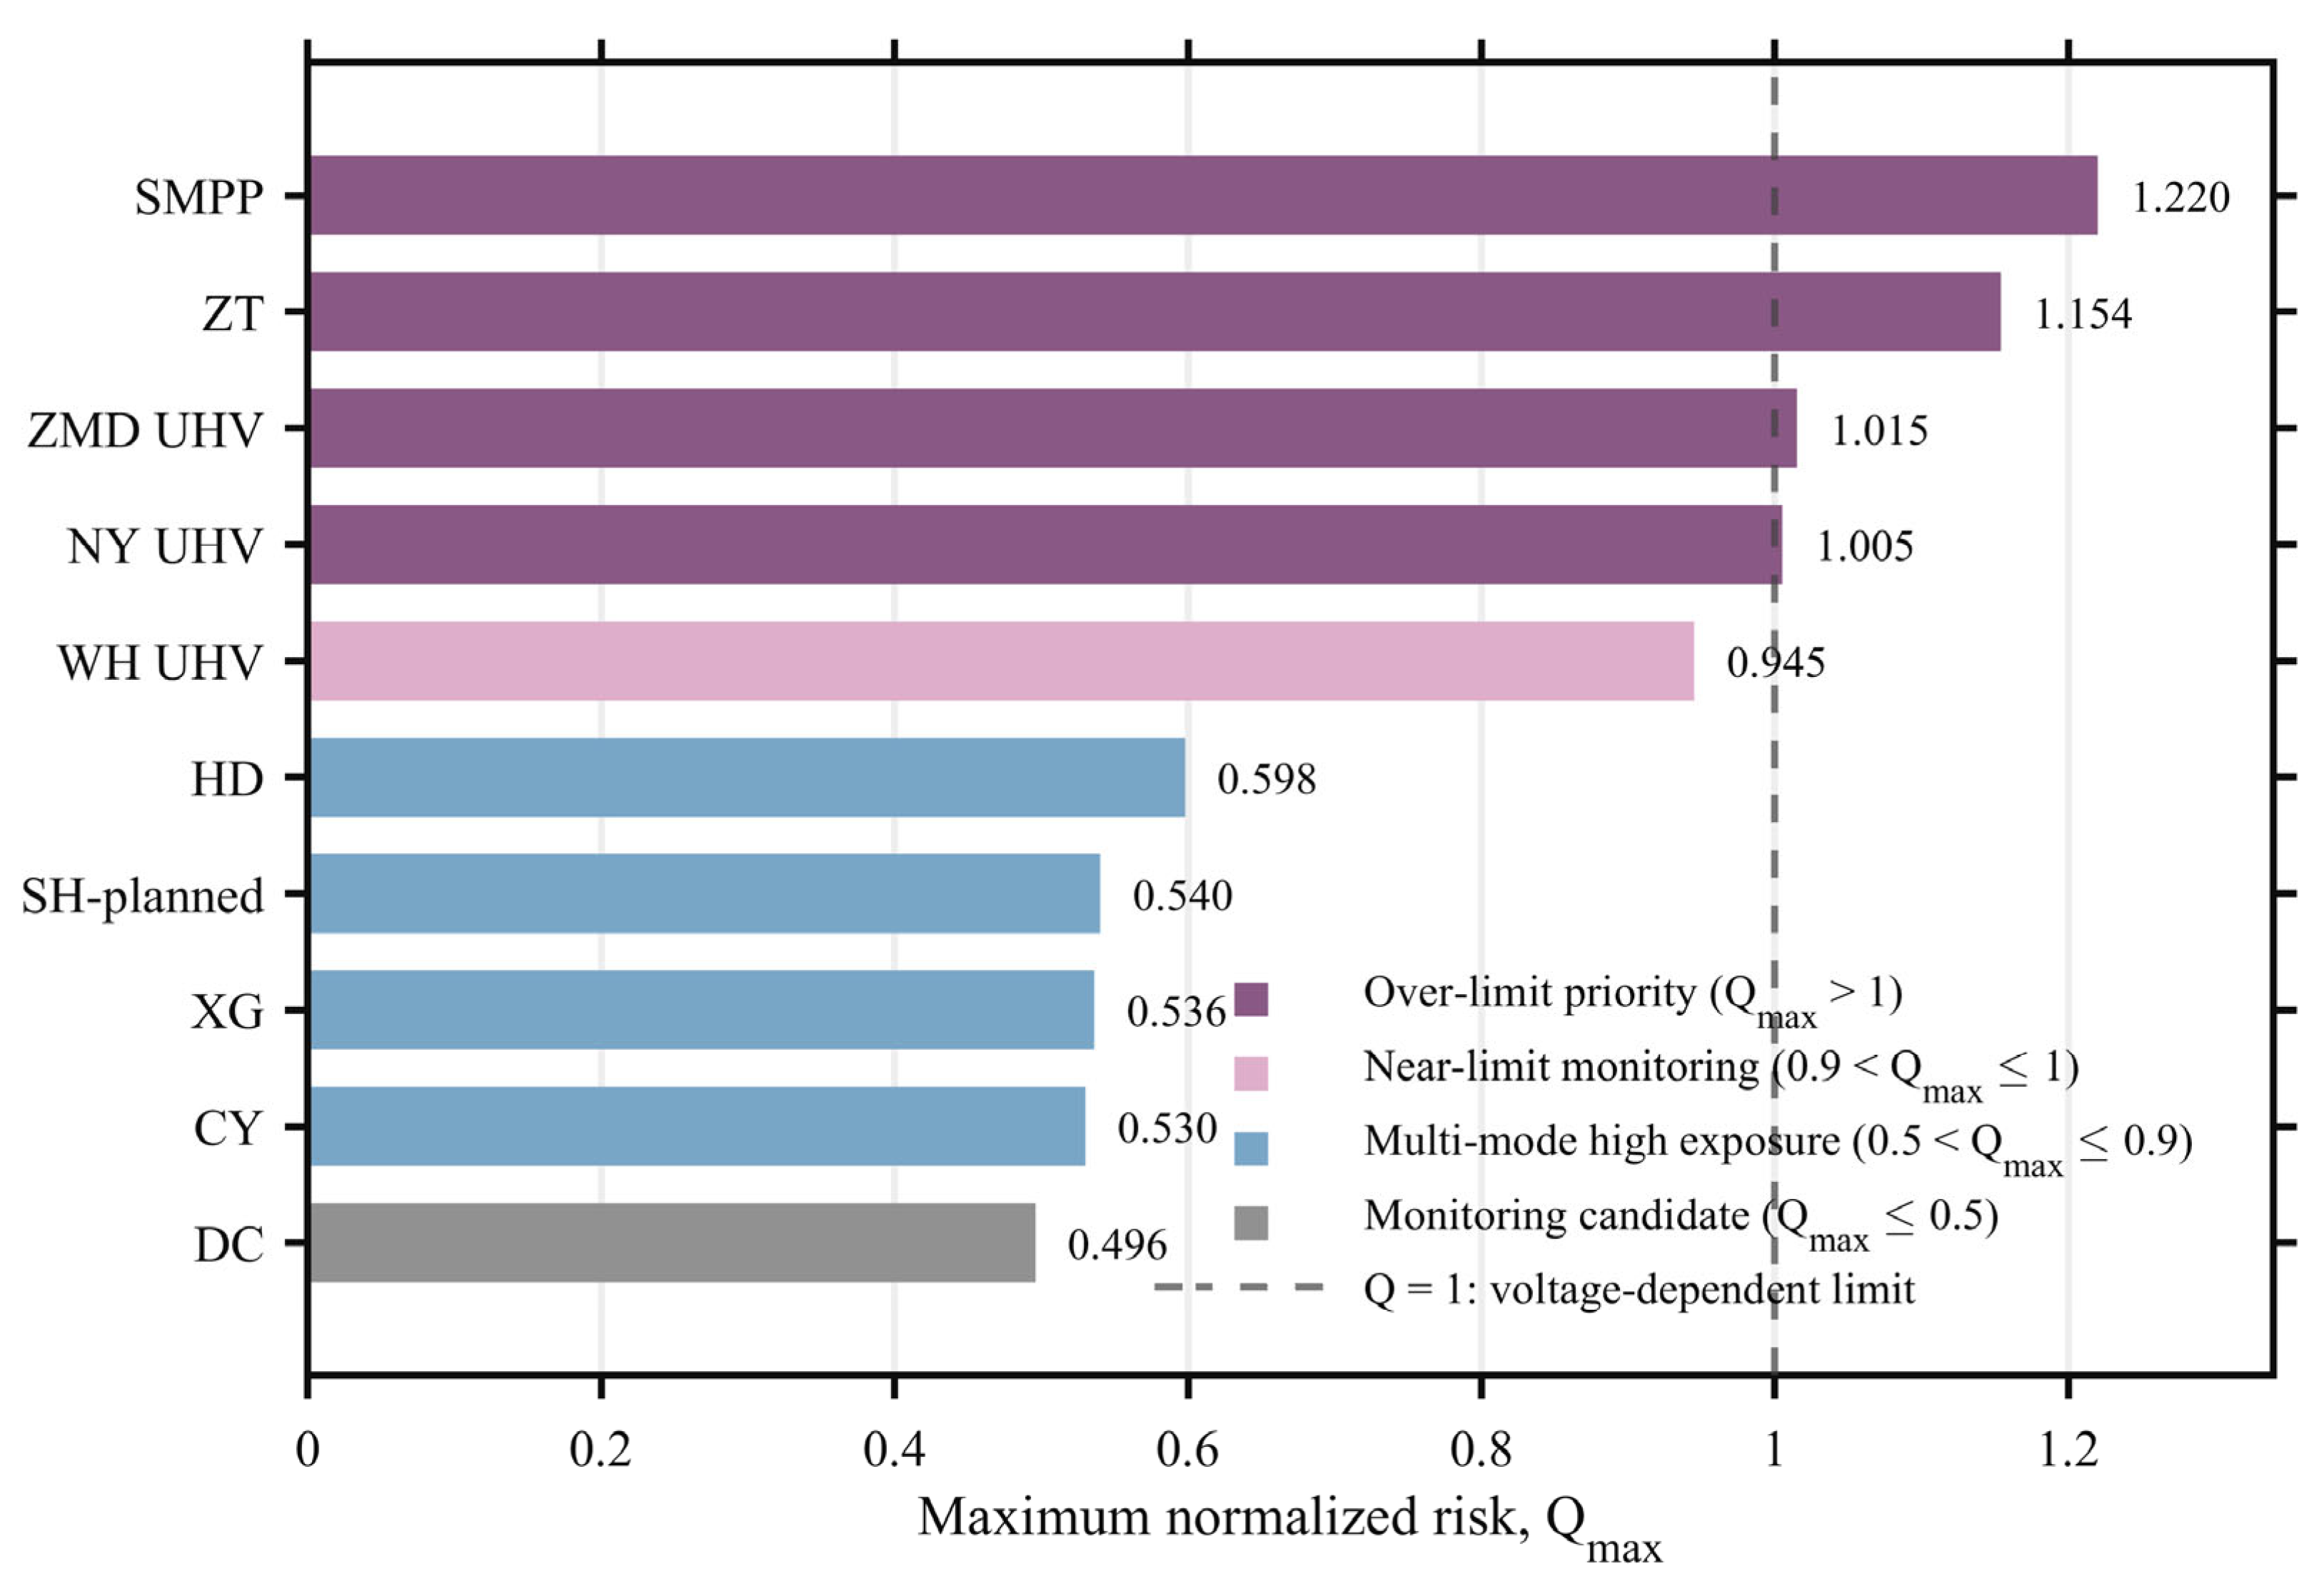
Using the four-mode simulation results, the maximum DC-bias risk, average DC-bias risk, and over-limit severity are calculated for all 898 substations. Table 4 gives the top-ranked substations, and Figure 9 visualizes the corresponding maximum normalized risk levels. The ranking distinguishes actual over-limit substations from near-limit and multi-mode high-exposure substations. Therefore, it provides a direct basis for selecting mitigation targets and monitoring candidates, rather than relying on a single operating mode or a limited subset of exported records.
Table 4.
High-risk substation ranking based on the unified 898-substation registry.
Figure 9.
High-risk ranking based on the unified 898-substation registry.
As shown in Figure 9, SMPP and ZT are the primary mitigation targets because they exceed the screening limit under multiple operating modes. NY UHV and ZMD UHV are operating-mode-sensitive UHV substations: they slightly exceed the limit under same-polarity operation but are relieved under opposite-polarity operation. WH UHV remains below the limit but approaches it under same-polarity operation, and is therefore identified as a monitoring candidate. Several 500 kV substations, such as HD, SH-planned, XG, and CY, do not exceed the limit but retain relatively high multi-mode exposure. This layered result supports targeted mitigation for actual over-limit substations and monitoring for potential high-risk substations.
4.4. Targeted Mitigation of DC-Bias Risk
4.4.1. Comprehensive Suppression Strategy for DC-Bias Risk
Based on the DC distribution calculation of the power grid, a comprehensive DC-bias mitigation principle is formulated. The strategy evaluates the risk level according to the magnitude of DC-bias current, implements suppression measures by voltage level, and adopts distinct DC current limits and mitigation schemes for transformers at various voltage levels in a step-by-step hierarchical approach.
For high-voltage substations, the allowable DC-bias current limits are set to 2 A for 1000 kV transformers and 5 A for 500 kV transformers [32,33]. For 220 kV transformers, the allowable limit is set to 7 A. Substations that remain within these limits are regarded as acceptable under the corresponding operating mode and do not require additional mitigation. By contrast, substations exceeding the voltage-dependent limits are identified as primary mitigation targets.
To further improve the practicality of mitigation deployment, candidate substations are selected from the full-registry high-risk ranking in Section 4.3.3. Over-limit substations are treated as primary mitigation targets, whereas near-limit and operating-mode-sensitive substations are retained as monitoring candidates. This forms a calculation-identification-mitigation loop: multi-mode DC-bias calculation provides the risk indices, the high-risk ranking determines the mitigation targets, and the mitigation calculation verifies whether the neutral-point currents are reduced below the voltage-dependent limits.
For the present case study, the high-risk ranking in Table 4 shows that no additional suppression measures are required under CJ monopolar operation, whereas under YZ monopolar operation the over-limit risk is concentrated at only a few 500 kV substations. Therefore, a targeted mitigation strategy is adopted, in which 2 Ω neutral-point series resistors are installed only at the actual over-limit substations. This approach is directly oriented to the identified risk locations and provides a practical and economical mitigation scheme.
The mitigation device adopted here is a standard neutral-point series resistor, which is deliberate, so that the contribution lies in determining where and how few such devices are required, not in the device itself. The screening result is also device-agnostic—the same ranking would govern the deployment of capacitor-blocking or hybrid resistive-capacitive schemes.
4.4.2. DC-Bias Risk Under CJ Monopolar Operation
The ground current of the CJ grounding electrode was set to 2875 A, and the DC current distribution across the regional power grid was calculated. For clarity, the representative substations with relatively large transformer DC-bias currents are summarized in Table 5.
Table 5.
Representative transformer DC bias currents under CJ monopolar operation.
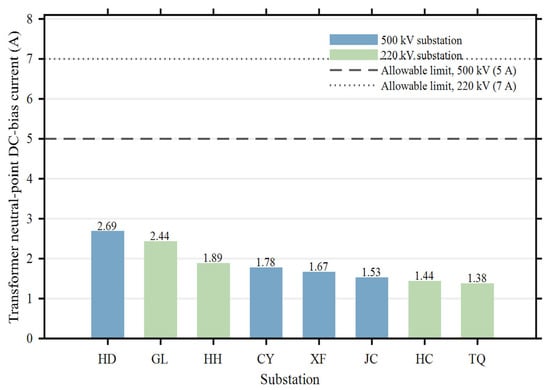
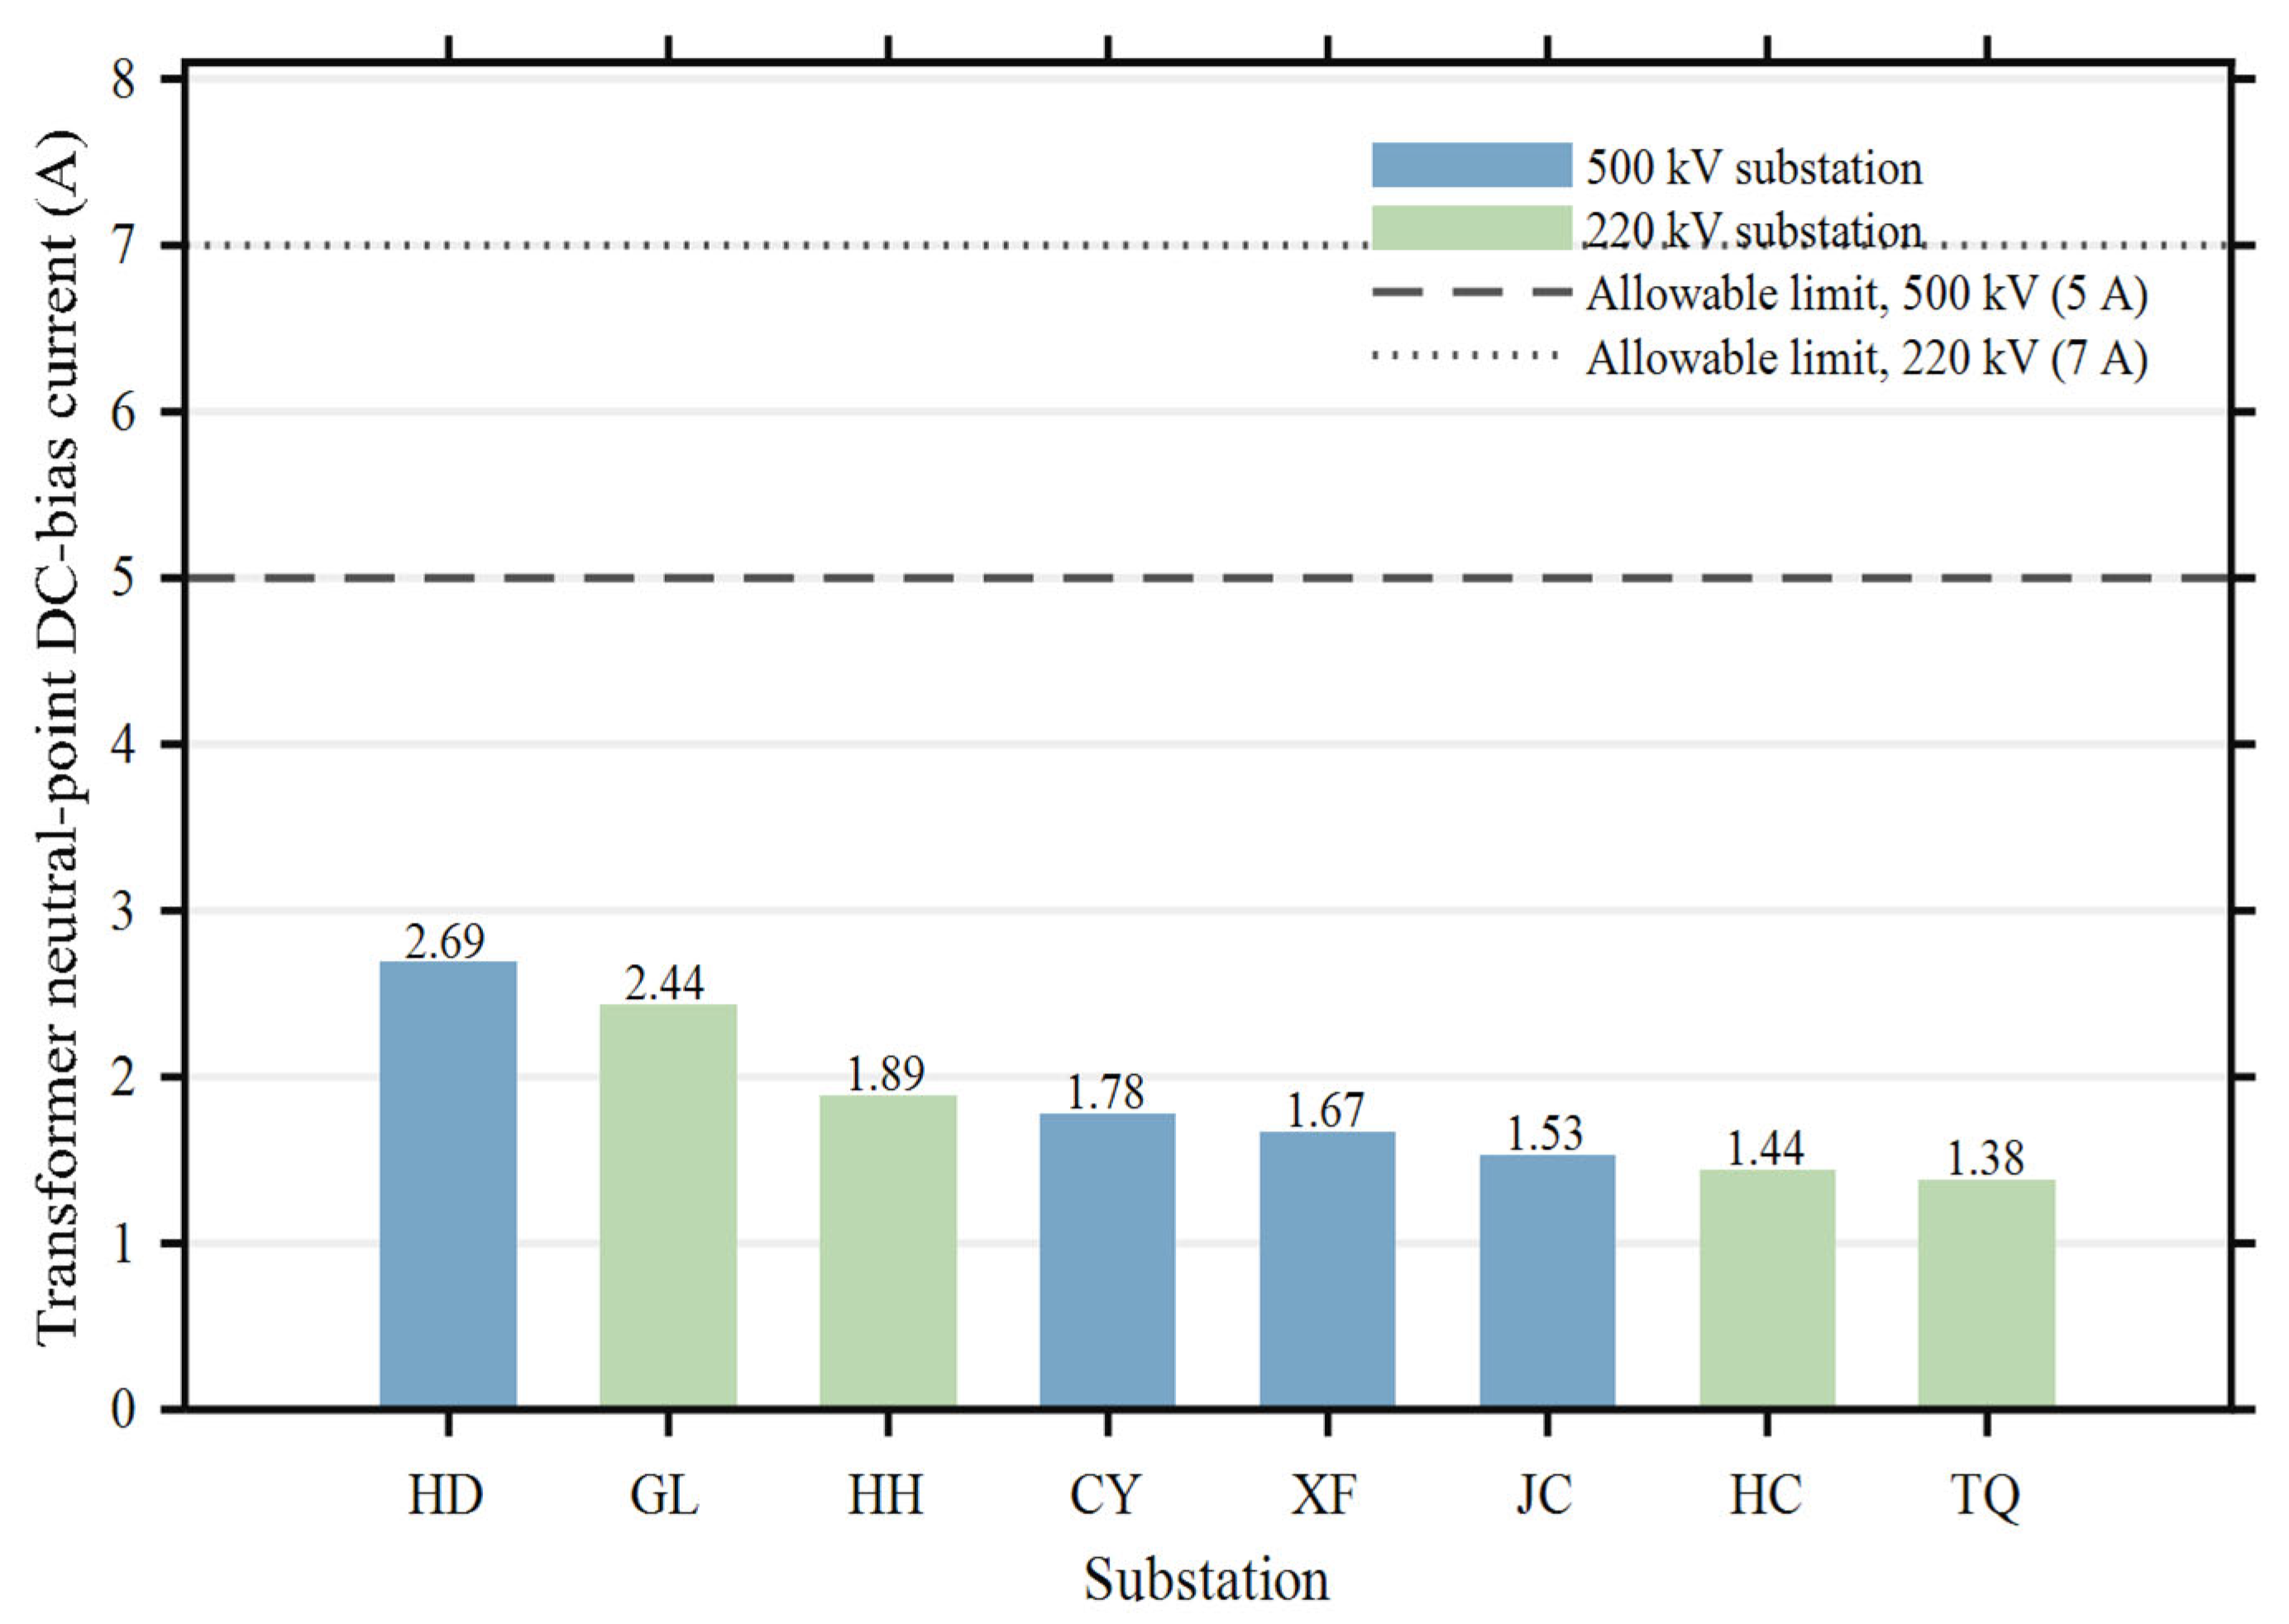
As shown in Table 5 and Figure 10, when the CJ grounding electrode operates in monopolar earth-return mode, the transformer DC-bias currents at all listed substations remain within the allowable limits for their corresponding voltage levels. The maximum value is observed at the Huadu 500 kV substation, with a DC-bias current of 2.69 A, which is still lower than the 500 kV limit of 5 A. For the 220 kV substations, the highest value is 2.44 A at the Gangliu substation, which is also well below the 7 A limit. Therefore, no additional neutral-point mitigation measure is required under CJ monopolar operation.
Figure 10.
DC-bias current distribution of substations under CJ monopolar operation.
4.4.3. Targeted Mitigation Under YZ Monopolar Operation
According to the YZ(A) results in Table 3, the DC-bias risk under YZ monopolar operation is mainly concentrated in several 500 kV substations. In particular, the DC-bias currents at ZT and SMPP are 5.26 A and 5.68 A, respectively, both exceeding the 500 kV allowable limit of 5 A. By contrast, the other listed substations remain within their corresponding limits. For NY UHV, the DC-bias current is 1.36 A, which is still below the 1000 kV threshold of 2 A.
Since the over-limit risk is only observed at ZT and SMPP, a targeted mitigation scheme is adopted in this study. Specifically, a 2 Ω neutral-point resistor is installed at these two 500 kV substations. This measure is directly oriented to the actual risk locations and is easier to implement in engineering practice with better economic efficiency.
After installing the 2 Ω neutral-point resistors, the DC-bias currents at ZT and SMPP decrease from 5.26 A and 5.68 A to 2.55 A and 0.58 A, respectively, both of which are reduced below the allowable limit. The DC-bias currents at ZT and SMPP before and after the installation of the 2 Ω neutral-point resistors are compared in Table 6. This confirms that the proposed targeted resistor-based mitigation strategy is effective for suppressing the DC-bias risk under YZ monopolar operation. In addition, the mitigation targets identified here are consistent with the high-risk substations ranked in Section 4.3.3, which further supports the engineering applicability of the proposed identification method.
Table 6.
Comparative analysis of DC-bias mitigation effects.
Therefore, for the present YZ monopolar operating mode, installing small neutral-point resistors at the few over-limit 500 kV substations provides a practical and economical mitigation solution.
4.5. Uncertainty, Robustness, and Comparison with Simpler Current-Based Screening
Several sources of uncertainty affect the present assessment. First, operating-condition uncertainty is addressed by evaluating four representative grounding-electrode modes, and the same 898-substation registry is used in all modes. Second, because local neutral-point measurements under YZ/CJ conditions are unavailable, the earth-resistivity correction is validated through an external commissioned project and treated as an engineering calibration route rather than a direct calibration of the present grid. Third, the mitigation conclusion is therefore interpreted conservatively: actual over-limit substations are selected for resistor installation, while near-limit and operating-mode-sensitive substations are retained as monitoring candidates.
The remainder of this section makes these statements quantitative. Section 4.5.1 compares the proposed ranking with a simpler current-based ranking on the same registry, and Section 4.5.2 quantifies how ±5% uncertainty in the dominant model inputs propagates into the ranking and into the classification of individual substations. The reference set used throughout is the four substations that exceed their voltage-dependent limit in at least one operating mode, obtained directly from the field–circuit coupling calculation: SMPP and ZT at 500 kV, ZMD UHV and NY UHV at 1000 kV.
4.5.1. Comparison with a Simpler Current-Based Ranking
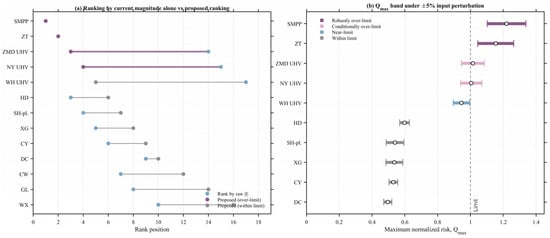
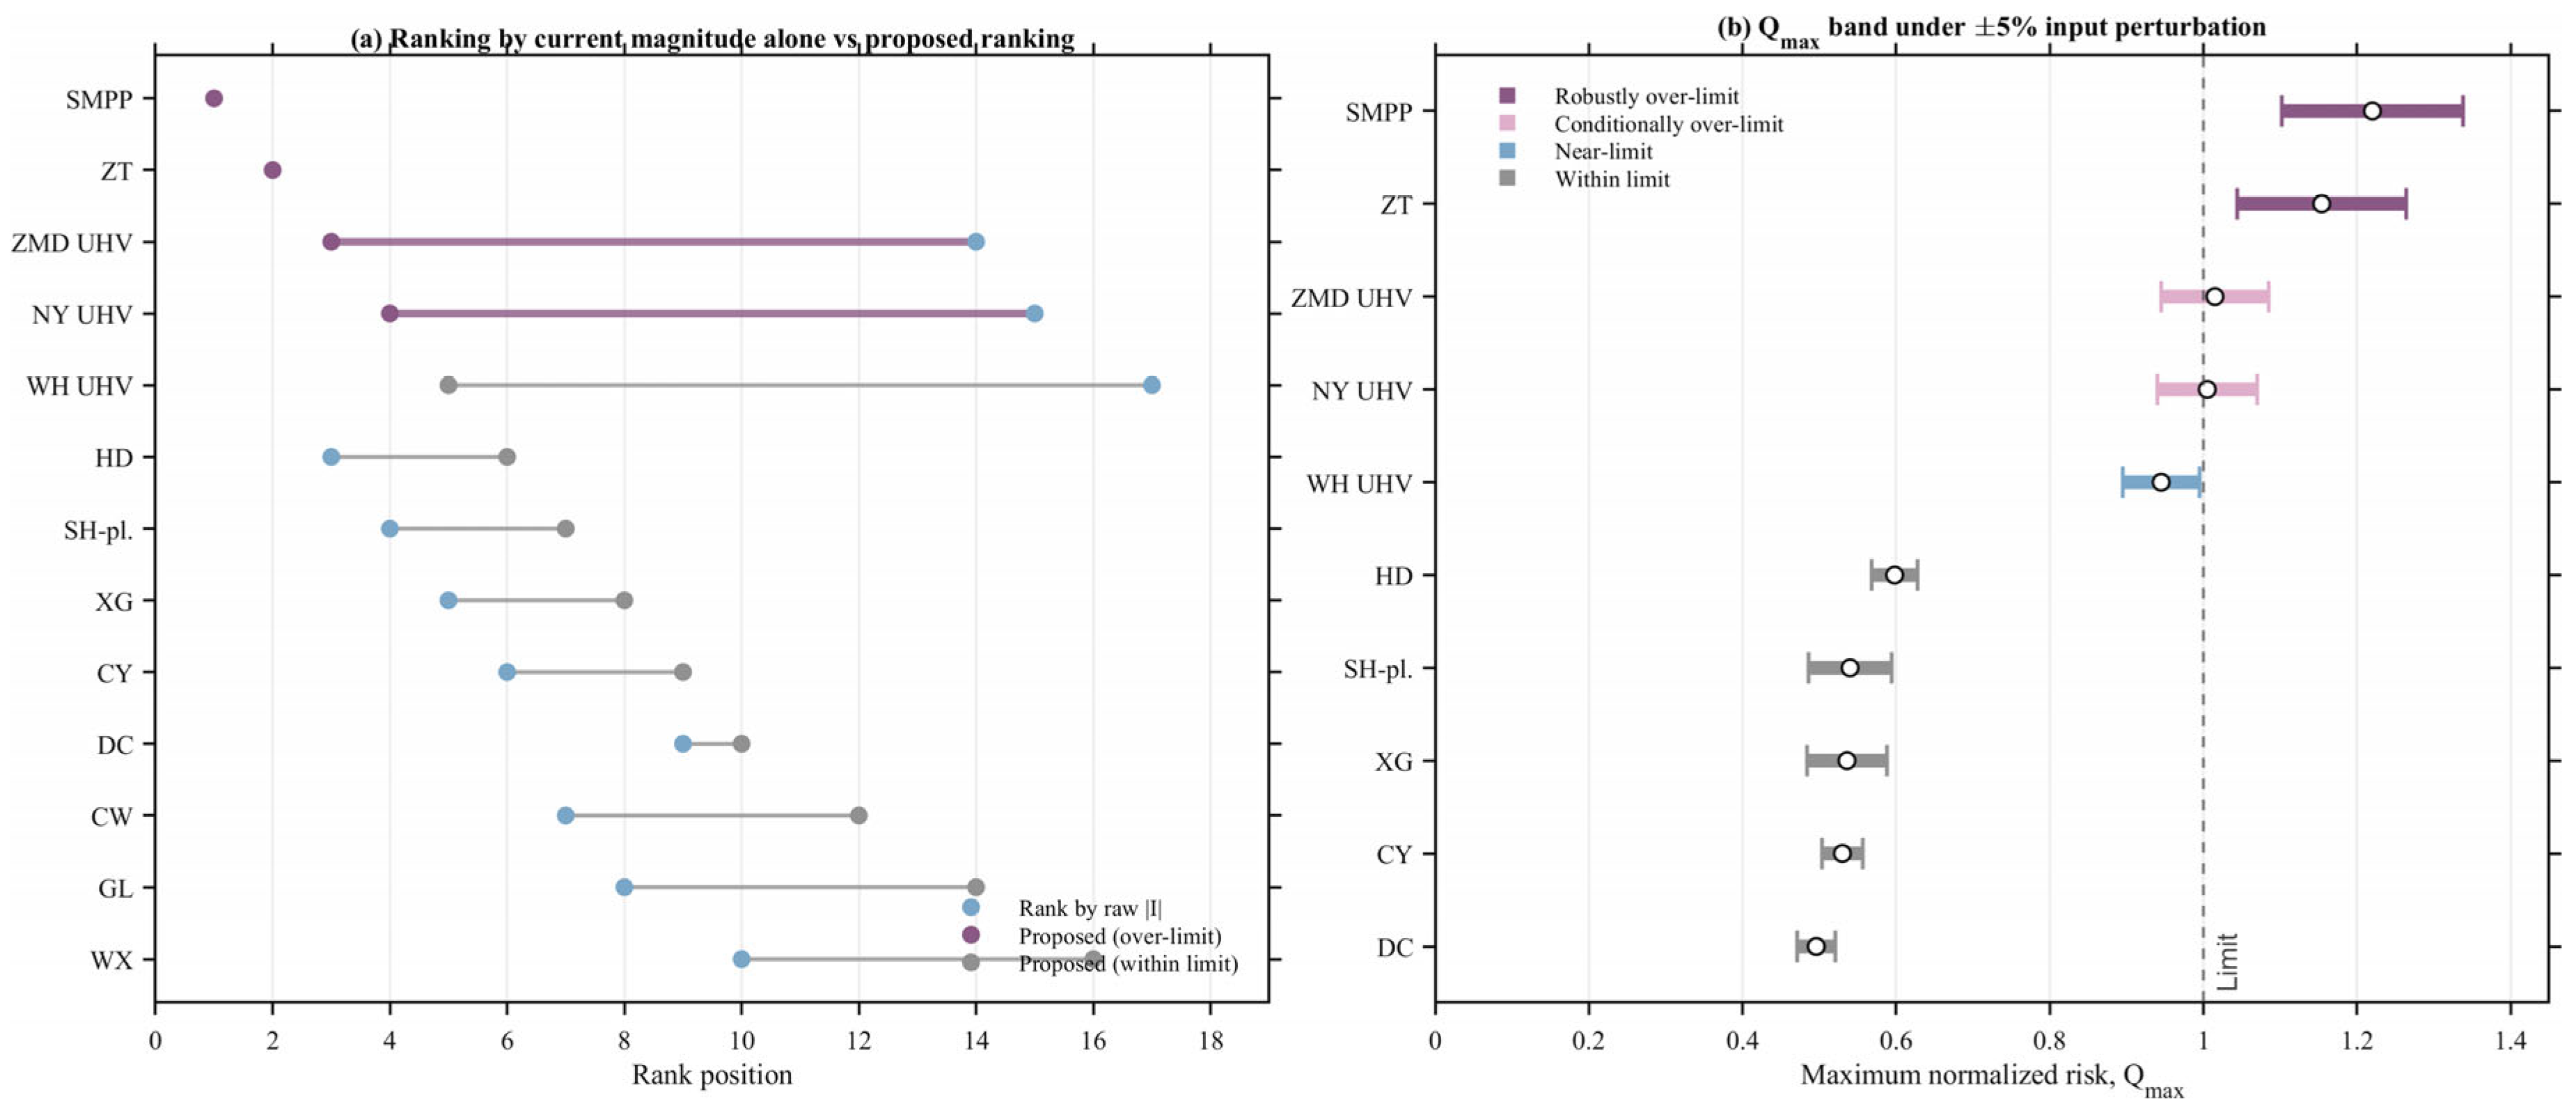
Because the allowable DC-bias current is voltage-dependent—2 A at 1000 kV, 5 A at 500 kV and 7 A at 220 kV—current magnitude and actual risk are not monotonically related, and a ranking built on magnitude alone inverts across voltage levels. Figure 11a compares the two orderings on the same registry. The over-limit UHV substations ZMD UHV and NY UHV are placed 14th and 15th by raw current but 3rd and 4th by the proposed index. HD (2.99 A, 500 kV, Q = 0.598, within limit) is ranked above ZMD UHV (2.03 A, 1000 kV, Q = 1.015, over limit), and HH (2.13 A, 220 kV, Q = 0.304) above NY UHV (2.01 A, 1000 kV, Q = 1.005). Measured against the physical over-limit set, a magnitude-only ranking recovers only two of the four over-limit substations within its top ten, whereas the proposed ranking recovers all four within its top four. The comparison therefore also provides a direct check of the ranking itself: the substations it places first are exactly those that the field–circuit calculation shows to be over their limits, and they are the substations at which the targeted mitigation of Section 4.4 restores compliance for the whole grid.
Figure 11.
Comparison with a simpler current-based ranking and robustness of the proposed ranking. (a) Rank migration from the magnitude-only ranking to the proposed limit-normalized ranking; the two over-limit UHV substations move from 14th and 15th to 3rd and 4th. (b) Q_max band under ±5% grounding-electrode current perturbation; open markers denote the baseline value and the bars span the perturbed range.
Multi-mode aggregation contributes in the same direction. No single grounding-electrode operating mode recovers the complete over-limit set: CJ single-electrode operation produces none at all, YZ single-electrode and opposite-polarity operation each identify only the two 500 kV substations, and same-polarity operation identifies three of the four. The enumeration cannot be reduced by keeping only the most severe mode either, since opposite-polarity operation produces the largest DC-bias current of the whole study (6.10 A) yet misses both UHV substations, whereas same-polarity operation, whose peak current is lower at 5.40 A, is the only mode that reveals them. Peak current is thus not a reliable indicator of how many substations a mode places over their limits, because the binding limit differs by voltage level and polarity coordination redistributes risk between voltage levels.
4.5.2. Sensitivity to ±5% Grounding-Electrode Current Perturbation
The dominant input uncertainty in this assessment is the earth-return current of the grounding electrodes, which sets the magnitude of the injected DC source and is not known exactly at the planning stage. Two perturbations are therefore applied and the full field–circuit coupling calculation is repeated for each. In the first, the earth-return currents of both electrodes are scaled together by ±5%, which represents uncertainty in the overall injection level. In the second, the current of the YZ electrode alone is changed by ±5%, which represents unequal loading between the two DC projects. Because the DC sub-problem is a linear resistive network, both perturbations propagate exactly: a common scaling multiplies every neutral-point current by the same factor, so the relative sensitivity is exactly unity, whereas a single-electrode change alters substation i in proportion to δi, the share of its response attributable to that electrode. The share δi follows directly from the two single-electrode calculations that the screening already performs, so no additional simulation is required and both bounds are exact rather than first-order estimates.
Neither perturbation disturbs the ranking. Over the 793 screened substations, the Spearman rank correlation with the baseline is 1.0000 for the common scaling and 0.9997 for the single-electrode change, and both retain the identical top-ten and top-twenty sets. What the perturbation does change is the confidence attached to individual classifications, as reported in Table 7 and Figure 11b, and this is what substantiates the conservative interpretation stated above. SMPP and ZT remain above their limits across the entire perturbed range, with lower bounds of Q = 1.159 and 1.096, and are therefore robustly over-limit; they are confirmed as unconditional mitigation targets consistent with Section 4.4. ZMD UHV and NY UHV have baseline values marginally above unity but lower bounds below it, 0.964 and 0.955, and are therefore conditionally over-limit, which is why they are retained as monitoring rather than immediate retrofit targets. WH UHV stays below its limit but its upper bound reaches 0.992, leaving essentially no margin.
Table 7.
Uncertainty bounds of the leading substations under ±5% grounding-electrode current perturbation.
The width of each interval is governed by δi and therefore carries a direct engineering reading: substations whose response is dominated by a single electrode, such as SMPP and ZT with δ = 0.94 and 0.91, are the most exposed to an increase in that electrode’s current, whereas HD, with δ = 0.10, is almost unaffected by the YZ electrode. Because δi is available from calculations already performed, it indicates without further computation which substations should be prioritized for neutral-point monitoring. Uncertainty in the earth-resistivity model is treated separately in Section 4.2 and Section 3.3 and is not repeated here.
In summary, limit normalization is required to avoid rank inversion between voltage levels, without which the two over-limit UHV substations would not be selected for mitigation, and multi-mode aggregation is required for completeness, since every single-mode study omits at least one over-limit substation and peak current does not indicate which mode may be dropped. The complex-network representation supports both operations by supplying the topology-consistent unified registry over which every substation participating in the DC-bias calculation is screened under a single criterion. The resulting ranking is robust to ±5% uncertainty in the dominant physical inputs, and should be reported together with its uncertainty band, since two substations exceed their limits under every perturbation whereas two UHV substations change classification within the perturbation range.
5. Conclusions
Based on the actual operating conditions of a typical regional power grid and the field–circuit coupling principle, this study investigates transformer DC-bias risk in a multi-infeed UHVDC receiving-end grid. The main conclusions are summarized as follows:
(1) Accurate assessment of transformer DC bias requires explicit field–circuit coupling calculation of the DC current distribution in the AC network. The neutral-point DC current is jointly affected by the earth resistivity around grounding electrodes, substation grounding parameters, transformer winding DC resistance, neutral-point grounding mode, AC-grid topology, and grounding-electrode operating state. The measurement-based correction case further shows that the earth-resistivity model has an important influence on calculation accuracy; after correction, the mean absolute error of neutral-point DC current decreases from 0.51 A to 0.15 A, and the maximum absolute error decreases from 1.27 A to 0.31 A. This provides a practical calibration route for future engineering applications when field measurements are available.
(2) Under multi-infeed DC operating conditions, DC-bias risk cannot be reliably assessed based only on single-electrode results or a limited set of exported over-limit records. In this study, a complex-network-guided full-registry high-risk identification method is established for the 898-substation receiving-end grid. The complex-network model provides a topology-consistent node registry and structural basis for system-level screening, while the final priority is determined by voltage-dependent limits, multi-mode DC-bias exposure, maximum normalized risk, average risk, and over-limit severity. This enables all substations to be screened under a unified criterion.
(3) The case study demonstrates that DC-bias risk exhibits pronounced spatial heterogeneity and operating-mode dependence. CJ monopolar operation does not produce over-limit substations, whereas YZ monopolar operation causes over-limit risk at ZT and SMPP. Under same-polarity two-electrode operation, the over-limit set extends to the UHV substations NY UHV and ZMD UHV because of the lower 2 A screening limit at the 1000 kV level. In contrast, opposite-polarity operation relieves the UHV substations but concentrates the 500 kV risk at SMPP and ZT. These results confirm the necessity of multi-mode screening.
(4) The proposed high-risk ranking can directly support targeted mitigation. For the substations that actually exceed the allowable limits, installing 2 Ω neutral-point resistors at ZT and SMPP reduces their DC-bias currents from 5.26 A and 5.68 A to 2.55 A and 0.58 A, respectively, bringing both substations below the 5 A limit. Since mitigation devices are required only at the two physically confirmed over-limit 500 kV substations rather than across the full affected grid, the proposed screening-driven strategy improves engineering economy while maintaining technical effectiveness. Continuous online monitoring is still recommended for near-limit and operating-mode-sensitive substations to support future model calibration and risk updating. Two directions remain for future work: the transient interaction between transformer DC bias and AC system dynamics, which requires an electromagnetic-transient representation of the converter and AC network; and the combination of the proposed ranking with metaheuristic optimization for resistor sizing and siting [25,26,27], since the mitigation targets identified here follow from the physical over-limit condition rather than from an optimization search.
Supplementary Materials
The following supporting information can be downloaded at: https://www.mdpi.com/article/10.3390/en19163866/s1.
Author Contributions
Conceptualization, J.S. and Y.L.; methodology, B.Y. and L.L.; software, B.Y.; validation, J.S., H.Q. and C.C.; formal analysis, B.Y. and L.Z.; investigation, X.Y. and J.Z.; resources, J.S. and Y.L.; data curation, H.Q. and C.C.; writing—original draft preparation, B.Y.; writing—review and editing, Y.L. and L.L.; visualization, B.Y.; supervision, Y.L.; project administration, J.S.; funding acquisition, J.S. All authors have read and agreed to the published version of the manuscript.
Funding
This work was supported in part by State Grid Henan Economic Research Institute under project No. 5217L024000W.
Data Availability Statement
The soil-resistivity measurement equipment, layered soil-resistivity model, and measurement-based correction case are provided in Supplementary Materials S1–S3. The grounding, transformer, and line parameters used in the article are reported where disclosure is permitted. The full 898-substation DC-bias datasets and the regional grid model contain operational information of the power utility and are therefore subject to confidentiality restrictions; they are not publicly available, but may be obtained from the corresponding author upon reasonable request and with the permission of State Grid Henan Economic Research Institute.
Conflicts of Interest
Authors Jingbo Song, Huanruo Qi, Chen Chen, Liang Zhang, Xiangyang Yan and Jinfeng Zhang were employed by State Grid Henan Economic Research Institute. The remaining authors declare that the research was conducted in the absence of any commercial or financial relationships that could be construed as a potential conflict of interest. This work was supported in part by State Grid Henan Economic Research Institute. The funder had no role in the design of the study; in the collection, analyses, or interpretation of data; in the writing of the manuscript; or in the decision to publish the results.
Nomenclature
| Y | grid node conductance matrix |
| H | association matrix between substation nodes and all nodes; HT its transpose |
| Em | identity matrix of order m |
| G | substation grounding conductance matrix, G = R−1 |
| R | diag(RG1, …, RGm), DC grounding resistance of each substation (Ω) |
| Q | node conductance matrix of the AC grid grounding network |
| J | column vector of currents injected at grid nodes (A); JS, JN, JB at substation nodes, independent neutrals and bus nodes |
| U | column vector of grid node voltages (V); US, UN, UB correspondingly |
| IA | transformer neutral-point DC current at a substation (A) |
| ID | DC current injected into the earth by the grounding electrode (A) |
| M | mutual resistance matrix between the DC pole and the substations (Ω) |
| N | mutual resistance matrix between substations, excluding self-resistance (Ω) |
| P | ground surface potential at the substation sites (V) |
| Z | field–circuit coupling matrix, Z = HY−1HTG − E |
| equivalent DC resistance of the corridor between substations i and j (Ω) | |
| wij | edge weight of the weighted network, wij = 1/ (S) |
| Di, Bi, Ci | weighted degree, betweenness centrality and closeness centrality of substation i |
| Gi | grounding participation of substation i, Gi = 1/ (S) |
| Ti | comprehensive topological importance of substation i, Equation (16) |
| Li | allowable DC-bias current limit for the voltage level of substation i (A) |
| normalized DC-bias risk of substation i under operating mode s, Equation (17) | |
| , , Ei | maximum risk, average risk and over-limit severity, Equation (18) |
| Hi | comprehensive high-risk identification index of substation i, Equation (19) |
References
- Shu, Y.; Zhao, Y.; Zhao, L.; Qiu, B.; Liu, M.; Yang, Y. Study on Low Carbon Energy Transition Path Toward Carbon Peak and Carbon Neutrality. Proc. CSEE 2023, 43, 1663–1672. [Google Scholar]
- Sun, B.; Luo, Y.; Yu, Y.; Wu, W.; Liu, J.; Zhang, B. Study on the DC bias of the ±1100 kV Changji Converter Station and the ±800 kV Tianshan Converter Station. High Volt. Appar. 2020, 56, 121–127. [Google Scholar]
- He, L.; Wu, T.; Li, R.; Ding, D.; Yang, J.; Li, S. Influence analysis of DC bias on vibration characteristics of 500 kV transformer. Electr. Power Autom. Equip. 2024, 44, 133–138. [Google Scholar] [CrossRef]
- Sun, Y.; Zhang, L.; Zhang, Z.; Wang, D. Overview of Research Status of DC Bias and Its Suppression in Power Transformers. Energies 2022, 15, 8842. [Google Scholar] [CrossRef] [Scilit]
- Yang, C.; Wang, J.; Wang, C.; You, X.; Xu, L. Transient DC Bias Current Reducing for Bidirectional Dual-Active-Bridge DC-DC Converter by Modifying Modulation. IEEE Trans. Power Electron. 2021, 36, 13149–13161. [Google Scholar] [CrossRef] [Scilit]
- Pan, Z.; Zhang, L.; Wang, X.; Yao, H.; Zhu, L.; Liu, Y. HVDC Ground Return Current Modeling in AC Systems Considering Mutual Resistances. IEEE Trans. Power Deliv. 2016, 31, 165–173. [Google Scholar] [CrossRef] [Scilit]
- Ma, S.; Xia, S.; Xiong, W.; Lin, X.; Li, Z.; Zheng, Y.; Wu, Y.; Xu, H. Difference analysis of HVDC/GIC type DC bias. Power Syst. Prot. Control 2023, 51, 55–64. [Google Scholar] [CrossRef]
- Xu, B.; Pan, Z.; Tong, T.; Chen, T.; Yan, N.; Wang, W. Analysis and Mitigation of Cross-grid DC Bias Problem. High Volt. Appar. 2023, 59, 84–92. [Google Scholar] [CrossRef]
- Su, R.; Zou, J.; Wang, W.; Lu, H.; Zheng, Z.; Wen, X. Research on Optimal Site Selection Method for Substation Considering DC Bias Risk. In Proceedings of the 2023 3rd International Conference on Energy, Power and Electrical Engineering (EPEE), Wuhan, China, 15–17 September 2023; pp. 854–858. [Google Scholar] [CrossRef] [Scilit]
- Wen, X.; Guo, T.; He, Z.; Yang, Q.; Lu, H. Review on the related problems of DC bias. High Volt. Appar. 2016, 52, 1–8. [Google Scholar] [CrossRef]
- He, J.; Yu, Z.; Zeng, R.; Zhang, B. Vibration and audible noise characteristics of AC transformer caused by HVDC system under monopole operation. IEEE Trans. Power Deliv. 2012, 27, 1835–1842. [Google Scholar] [CrossRef] [Scilit]
- Marti, L.; Rezaei-Zare, A.; Boteler, D. Calculation of induced electric field during a geomagnetic storm using recursive convolution. IEEE Trans. Power Deliv. 2014, 29, 802–807. [Google Scholar] [CrossRef] [Scilit]
- Overbye, T.J.; Shetye, K.S.; Hutchins, T.R.; Qiu, Q.; Weber, J.D. Power grid sensitivity analysis of geomagnetically induced currents. IEEE Trans. Power Syst. 2013, 28, 4821–4828. [Google Scholar] [CrossRef] [Scilit]
- Acosta, J.S.; Xiao, H.; Gole, A.M. Sensitivity analysis of commutation failure in multi-infeed HVDC systems: Exploring the impact of ac system representations and fault types. Electr. Power Syst. Res. 2024, 234, 110802. [Google Scholar] [CrossRef] [Scilit]
- Zou, G.; Yao, H.; He, W.; Sun, X.; Wu, Z.; Wang, W. DC bias suppression of receiving-end power grid in ±800 kV Xiluodu-Zhexi UHVDC project. High Volt. Eng. 2016, 42, 543–550. [Google Scholar]
- Dong, M.; Yao, S.; Guo, L.; Ding, G.; Kou, X.; Zhang, K. DC-bias analysis and suppression of transformers in Henan power grid after Tianshan- Zhongzhou UHVDC transmission project commissioning. High Volt. Eng. 2017, 43, 611–618. [Google Scholar] [CrossRef]
- Cai, H.; Hu, S.; Liu, G.; Li, R.; Zou, L.; Wang, X. Influence of Weng yuan DC grounding-electrode current of Niuzhai-Conghua HVDC project on DC bias of adjacent power transformers. South. Power Syst. Technol. 2015, 9, 11–15. [Google Scholar]
- Hu, S.; Cai, H.; Jia, L.; Liu, G.; Li, R.; Zou, L.; Wang, X. Influence of DC grounding current of Pu’er-Qiaoxiang HVDC project on DC bias of surrounding AC transformers. South. Power Syst. Technol. 2015, 9, 22–27. [Google Scholar] [CrossRef]
- Sun, B.; Yu, Y.; Qi, X.; Wang, K.; Zhao, P.; Wu, W. Identification method for critical nodes of DC-bias current distribution based on network connectivity. High Volt. Eng. 2020, 46, 979–986. [Google Scholar] [CrossRef]
- Liu, C.; Huang, C.; Pan, M. Optimal configuration of capacitor blocking devices for suppressing DC bias in transformers. High Volt. Eng. 2016, 42, 2308–2314. [Google Scholar]
- Yang, N.; Chen, Y.; Pan, Z.; Wen, X. Influence prediction and suppression research of DC bias in eastern Junggar-Southern Anhui ±1 100 kV UHVDC receiving-end grid. Power Syst. Technol. 2018, 42, 380–386. [Google Scholar]
- Lu, H.L. Simulation and Monitoring on DC Bias of Power Transformer. Doctoral Thesis, Wuhan University, Wuhan, China, 2010. [Google Scholar]
- CIGRE Working Group B4.61. General Guidelines for HVDC Electrode Design; CIGRE Technical Brochure 675; International Council on Large Electric Systems: Paris, France, 2017. [Google Scholar]
- Dang, C.L.; Ma, X.W. Research on DC Bias Control of Substation Based on Complex Network Theory. High Volt. Appar. 2024, 60, 193–198. [Google Scholar] [CrossRef]
- Shaheen, M.A.M.; Hasanien, H.M.; Alharbi, M.; Turky, R.A.; Fahmy, A.M.; Elkhouly, H.I.; Muyeen, S.M. Walrus optimizer-based optimal fractional order PID control for performance enhancement of offshore wind farms. Sci. Rep. 2024, 14, 17636. [Google Scholar] [CrossRef] [Scilit] [PubMed]
- Shaheen, M.A.M.; Hasanien, H.M.; Alharbi, M.; Turky, R.A.; Ullah, Z.; Fahmy, A.M. A chaos game optimization algorithm-based optimal control strategy for performance enhancement of offshore wind farms. Renew. Energy Focus 2024, 49, 100578. [Google Scholar] [CrossRef] [Scilit]
- DL/T 437-2012; Technical Code for HVDC Grounding. National Energy Administration of China: Beijing, China, 2012.
- Wang, Y.; Wang, C.; Cui, W.; Li, P.; Yang, B.; Lu, H.; Tian, Z.; Zheng, Z. Quantitative analysis of transformer DC-bias risk influencing factors. In Proceedings of the SPIE 13419, Tenth International Conference on Energy Materials and Electrical Engineering (ICEMEE 2024), Lhasa, China, 16–18 August 2024. [Google Scholar] [CrossRef] [Scilit]
- Wang, Y.; Wang, C.; Cui, W.; Li, P.; Yang, B.; Lu, H.; Tian, Z.; Lan, L. Research on installation strategy of transformer DC-bias blocking device based on artificial ant colony intelligent algorithm. In Proceedings of the SPIE 13419, Tenth International Conference on Energy Materials and Electrical Engineering (ICEMEE 2024), Lhasa, China, 16–18 August 2024. [Google Scholar] [CrossRef] [Scilit]
- Yu, Y.; Yang, Q.; Hou, Z.; Wen, X.; Qi, X.; Wang, L. Influence of grounding current in UHVDC transmission project from Tianshan to Zhongzhou on Hami AC power system in Xinjiang Uygur autonomous region. Power Syst. Technol. 2014, 38, 2298–2303. [Google Scholar] [CrossRef]
- IEEE Std 81-2012; IEEE Guide for Measuring Earth Resistivity, Ground Impedance, and Earth Surface Potentials of a Grounding System. Institute of Electrical and Electronics Engineers: New York, NY, USA, 2012.
- DL/T 1957-2018; Guide for DC Bias Risk Assessment and Defense in Power Grids. National Energy Administration of China: Beijing, China, 2018.
- Q/GDW 13011.2-2018; Technical Specification for 500 kV/250 MVA Single-Phase Autotransformers. State Grid Corporation of China: Beijing, China, 2018.

Disclaimer/Publisher’s Note: The statements, opinions and data contained in all publications are solely those of the individual author(s) and contributor(s) and not of MDPI and/or the editor(s). MDPI and/or the editor(s) disclaim responsibility for any injury to people or property resulting from any ideas, methods, instructions or products referred to in the content. |
© 2026 by the authors. Licensee MDPI, Basel, Switzerland. This article is an open access article distributed under the terms and conditions of the Creative Commons Attribution (CC BY) license.