


Abstract
The transition to net-zero energy systems involves substantial uncertainty in exogenous conditions such as policy, fuel prices, and technology deployment. Conventional energy system optimization models, formulated as forward problems, excel at identifying a single least-cost solution but provide limited insight into the diverse configurations feasible within an acceptable cost range. This study proposes a hierarchical inverse-analysis framework integrating a genetic algorithm (GA) and linear programming (LP). The upper-level GA explores a broad space of exogenous conditions, including selected fuel-price assumptions, technology-cost conditions, equipment capacities, end-use electrification rates, CO2-capture installation rates, and CO2-storage limits, while the lower-level LP rigorously optimizes operations for each candidate. The framework applies explainable AI (SHAP) to identify dominant cost-determining factors and their interactions, and employs k-means clustering to compress the high-dimensional feasible solution space into illustrative archetypes. As an illustrative demonstration, the framework is applied to a hypothetical 2050 net-zero case for the Kanto region. The framework, under the assumed conditions, generates diverse feasible solutions, identifies influential cost-related conditions and their interactions, and organizes the generated solution set into five illustrative archetypes. The proposed framework extends energy system modeling beyond single-optimum solutions toward interpretable decision-support analytics for long-term net-zero planning under deep uncertainty.
1. Introduction
1.1. Background
Japan has established the goal of achieving carbon neutrality (CN) by 2050 as a national policy and, in June 2021, released the Green Growth Strategy Through Achieving Carbon Neutrality in 2050 [1]. As reflected in the strategy’s coverage of 14 industrial sectors and eight policy tools, the technologies and institutions required for a CN society span a wide range. As elements such as power generation, heat demand, electrification, energy storage, decarbonized fuels, and CO2 capture and storage are mutually interrelated, energy supply–demand models have become increasingly important for quantitatively examining future energy-system configurations [2].
Energy supply–demand models are broadly classified into bottom-up models, which evaluate technology choices under a given demand level, and top-down models, which describe energy supply and demand in relation to economic activity [3]. Bottom-up energy system optimization models, in particular, are well suited to evaluating technology selection, installed capacity, and operational states from a cost-minimization perspective under specified demand and technological conditions. In Japan, representative models such as DNE21+ [3,4] and IEEJ-NE [5] have been developed and applied to long-term energy supply–demand analyses toward 2050. In recent years, scenario analysis has become more robust through soft-linking approaches that enable the mutual use of results across multiple models [6,7].
However, most conventional energy system optimization models are formulated as forward problems, in which a cost-minimal solution is computed under a given set of assumptions. Consequently, analytical outputs are often limited to a single optimal solution or a small number of cases predefined by the analyst. Although such analyses are useful for long-term investment planning and policy assessment, they are not necessarily sufficient for identifying practical alternatives under substantial uncertainty in the underlying assumptions.
This limitation is particularly important for micro-level decision-makers, such as firms and regional actors. Investments toward a CN society are made under medium- to long-term uncertainty and are constrained by factors such as grid connection and permitting; therefore, cost-minimal choices are not always realized in practice. Actual investment decisions are influenced by social acceptability, institutional change, fuel-price volatility, equipment deployment feasibility, and technological progress, many of which are difficult to represent explicitly within a model. From a decision-support perspective, energy supply–demand models are therefore required not only to present a single optimal solution, but also to identify multiple alternative system configurations achievable within a given cost range, together with the conditions under which each becomes viable. Such a capability enables responses to questions such as “How should one respond if a particular business environment emerges?” and “What options exist for implementing a given strategy?” This task can be formulated as an inverse problem, in which causes are inferred from outcomes and feasible solution sets are explored. Conventional models, however, remain limited in their ability to address such inverse problems flexibly and efficiently. The present study seeks to provide a methodological foundation in this direction.
1.2. Related Work and Research Gap
The motivation for this study—the need to identify multiple alternative system configurations achievable within a given cost range, together with the conditions under which each becomes viable, rather than presenting only a single optimal solution—is related to two strands of prior research. The first is research on modeling to generate alternatives (MGA), which generates diverse alternatives within a near-optimal region instead of presenting only a single optimal solution [8]. The second is research on hierarchical design optimization, in which the upper level determines equipment configuration and capacity while the lower level optimizes operation under that configuration. The following reviews both strands and clarifies the position of the present study.
MGA was proposed as a framework for generating alternatives that achieve comparably favorable objective values while differing substantially from one another. The classical work by Brill et al. introduced the idea of intentionally generating multiple alternatives to accommodate factors that are difficult to incorporate into a model, rather than presenting only the optimal solution [8]. DeCarolis extended this concept to the energy domain, arguing that systematic exploration of the near-optimal region through MGA can broaden perspectives on possible energy futures [9]. Price and Keppo applied MGA to TIAM-UCL, a global energy–environment–economy model, and showed that technologically distinct transition pathways exist within the near-optimal region [10]. Neumann and Brown showed that, even within very small cost differences, numerous technologically distinct near-optimal solutions exist for a European power system with a high share of renewables [11]. Lau et al. reviewed and compared MGA methods, showing that the choice of vector-selection method affects exploration breadth, efficiency in identifying extreme solutions, and computational performance [12].
These studies have been highly influential in establishing the importance of considering diverse alternatives within the near-optimal region rather than relying on a single optimal solution. However, most existing studies first solve for the optimum, then impose slack constraints around it, and sequentially explore the model’s internal capacity or design variables. This reflects a methodological limitation: when MGA includes operational variables such as annual generation in the alternative-generation objective, weights unrelated to actual operating costs are introduced, causing dispatch to deviate from the principle of least-cost operation and undermining economic dispatch [12]. Consequently, exploration tends to remain confined to capacity-related variables. Additionally, few studies have simultaneously explored a broad assumption space that includes exogenous and institutional conditions such as policy settings, fuel prices, demand-side electrification rates, and CO2 capture rates. Moreover, even when MGA produces many near-optimal solutions, the results are typically represented as a high-dimensional point cloud that is not directly useful for decision support. Practical application therefore requires an additional step that organizes numerous solutions into representative design archetypes and presents the conditions under which each archetype emerges in an interpretable form.
In hierarchical design optimization, methods have been proposed in which equipment configuration and capacity are determined at the upper level, while operation is optimized at the lower level under the given configuration, with the aim of optimally designing energy supply systems. Yokoyama et al. introduced a mixed-integer linear programming (MILP) branch-and-bound method that exploits the hierarchical relationship between design and operational variables to efficiently solve optimal design problems for energy supply systems [13]. This approach explicitly handles design variables while embedding lower-level operational optimization, thereby enabling rigorous treatment of large-scale design problems. Wakui et al. [14] proposed a two-stage optimization approach combining an artificial immune system (AIS) with MILP, separating the upper-level structural design problem from the lower-level operational problem and efficiently obtaining diverse design candidates for large-scale energy supply networks. Yokoyama et al. further extended the hierarchical MILP approach to derive K-best solutions, providing a method for systematically enumerating multiple design alternatives following the optimal solution [15].
These studies demonstrate that hierarchical frameworks separating upper-level structural design from lower-level operational optimization are effective for energy supply systems. Their objectives, however, differ. The basic hierarchical MILP method was developed primarily to derive a single optimal solution efficiently, whereas the K-best extension and the AIS–MILP approach explicitly aim to obtain multiple design candidates [14,15]. Even so, the primary targets of exploration in these studies are internal design variables such as equipment configuration and capacity, and the systems considered are formulated as design problems for energy supply systems, distributed energy systems, cogeneration systems, or energy supply networks. Although some studies consider seasonal and time-resolved multi-period operation, they differ from research targeting a regional energy supply–demand system over the medium-to-long term toward 2050 and primarily seeking to explore assumption combinations feasible under long-term socioeconomic and institutional uncertainty. In contrast, the present study employs a heuristic genetic algorithm (GA) [16,17] for upper-level exploration to flexibly search a broad assumption space, including institutional conditions, price conditions, demand-side electrification rates, and CO2 capture rates, while LP optimizes operation for each individual at the lower level.
The novelty of this study lies in incorporating a GA into the upper level of an established hierarchical design-optimization framework to emphasize broader exploration and the generation of diverse solutions, while extending the analytical scope to a medium-to-long-term regional energy supply–demand system. Additionally, prior studies have rarely developed frameworks that organize multiple solutions into interpretable illustrative solution archetypes incorporating sensitivity structures and viability conditions. In contrast, the present study connects diverse-solution generation with explainable AI and clustering in downstream analysis, thereby transforming the solution set into a form suitable for decision support.
In recent years, explainable AI techniques have been widely adopted to improve the interpretability of complex models. Shapley additive explanations (SHAP), proposed by Lundberg and Lee [18], provide a consistent framework for evaluating each feature’s contribution to a predicted value, enabling not only feature-importance analysis but also identification of contribution direction and feature interactions. However, few studies have integrated explainable AI with diverse-solution generation in energy systems or addressed, in a unified manner, both characterization of sensitivity structures in the assumption space and extraction of illustrative solution archetypes.
In summary, three gaps remain in the existing literature. First, MGA research has demonstrated the importance of diversity within the near-optimal region, but its exploration has focused mainly on design variables, with limited systematic exploration of the exogenous assumption space, including institutional and price conditions. Second, hierarchical design optimization studies have provided effective computational frameworks for upper-level design and lower-level operation, but they have largely concentrated on equipment configuration and have not been sufficiently extended to exploration of exogenous assumption sets. Third, frameworks that organize numerous feasible solutions and their realization conditions into interpretable illustrative solution archetypes remain limited.
To clarify the methodological positioning of the present study, Table 1 summarizes the primary differences among MGA, hierarchical design optimization, and the proposed framework. The comparison concerns the principal analytical emphasis of the representative studies reviewed above and should not be interpreted as implying that MGA or hierarchical optimization is inherently restricted to the variables or outputs shown.
Table 1.
Comparison of MGA, hierarchical design optimization, and the proposed framework.
As summarized in Table 1, the proposed framework shares MGA’s motivation of moving beyond a single optimum and shares hierarchical design optimization’s separation of upper-level exploration from lower-level operation. Its distinguishing feature lies in the combination of three elements: explicit exploration of selected upper-level conditions together with equipment capacities, preservation of least-cost operation through lower-level LP optimization for each candidate, and downstream interpretation of the resulting feasible set using SHAP and clustering. The proposed framework is therefore positioned as complementary to, rather than a replacement for, MGA and established hierarchical optimization methods.
1.3. Objective
The objective of this study is to develop a hierarchical energy supply–demand model integrating combinatorial optimization and linear programming to generate diverse assumption sets under which a specified state can be realized, and to propose a new analytical framework that enables sensitivity analysis and extraction of interpretable illustrative solution archetypes from the generated assumption sets. Specifically, the GA explores an assumption space encompassing institutional conditions, price conditions, demand-side electrification rates, and CO2 capture rates, while LP performs operational optimization for each individual, thereby generating a large number of total cost–assumption data points. Machine learning and explainable AI are then used to identify the principal drivers of total cost and their interactions, while clustering of the feasible solution set yields a small number of comparable illustrative solution archetypes. The primary aim of this study is not to forecast or evaluate the future of a specific region under realistic conditions, but to propose a methodological framework and demonstrate its effectiveness under hypothetical conditions.
1.4. Contributions
This study offers four methodological contributions. First, it shares MGA’s motivation of moving beyond a single optimal solution to address diverse feasible solutions, while extending the scope of exploration to the exogenous assumption space. In existing MGA and hierarchical design optimization studies, the principal exploration targets have largely been limited to equipment capacity and design variables. In contrast, this study presents a methodology that systematically explores combinations of exogenous assumptions—including institutional conditions, price conditions, demand-side electrification rates, and CO2 capture rates—by adopting a heuristic GA at the upper level and combining it with LP at the lower level.
Second, the study reconciles the flexibility of alternative generation with the rigor of operational optimization through hierarchical separation. The upper-level GA stochastically explores the assumption space, while the lower-level LP minimizes operating cost subject to supply–demand constraints for each individual. This hierarchical structure circumvents the dispatch-breakdown problem that arises in MGA when operational variables are incorporated into the objective function, while still enabling the generation of diverse alternatives.
Third, the study introduces a sensitivity-analysis approach that uses the diverse solution set as training data. By inputting numerous assumption–total cost data points into explainable AI, the study establishes a methodology for extracting the sensitivity structure of a high-dimensional assumption space. Whereas conventional one-at-a-time sensitivity analyses require iterative optimization with sequential parameter changes, the proposed approach uses generated diverse solutions as learning samples and efficiently identifies principal factors and their interactions through SHAP.
Fourth, the study establishes a downstream step that compresses the diverse solution set into illustrative solution archetypes through clustering. This enables the framework not only to generate diverse solutions but also to use their distributional structure to organize representative assumption combinations and present them as comparable scenarios suitable for decision support.
Figure 1 provides an overview of the proposed framework. The framework comprises two stages. In the first stage, the integrated GA–LP model generates a set of diverse feasible solutions. In the second stage, sensitivity analysis and illustrative solution archetype extraction are performed. Beyond simply generating diverse solutions, the framework connects explainable AI and clustering downstream to transform the high-dimensional assumption space into interpretable insights.
Figure 1.
Conceptual structure of the proposed framework. The framework consists of a hierarchical inverse analysis model that integrates upper-level GA-based exploration of exogenous assumptions with lower-level LP-based operational optimization, followed by sensitivity analysis and illustrative solution archetype extraction from the generated feasible solution set. The arrows indicate the analytical flow from assumption-space exploration and operational optimization to the generation of feasible solutions, followed by downstream interpretation using SHAP and clustering.
The remainder of this paper is organized as follows. Section 2 describes the proposed method and demonstration setting. Section 3 presents the generation of diverse feasible solutions, sensitivity analysis, illustrative solution archetype extraction, and identification of common and variable elements across scenarios. Section 4 discusses the methodological implications, application possibilities, limitations, and future work in light of these results.
2. Methods
This section formalizes the framework introduced conceptually in Section 1 as a concrete analytical procedure.
2.1. Overall Structure of the Proposed Framework
As shown in Figure 1, the proposed framework consists of two stages: generation of diverse feasible solutions and their interpretation and organization. In the first stage, a hierarchical inverse-analysis model integrating GA and LP generates diverse “assumption–total cost” combinations that satisfy a prescribed cost threshold. In the second stage, sensitivity analysis and clustering are applied to the resulting feasible solution set to identify the principal drivers of total cost, representative patterns under which solutions are realized, and elements that are common across scenarios as well as those that vary among them.
A defining characteristic of the proposed approach is that it adopts a stakeholder-acceptable cost level as a threshold, constructs the feasible solution set as the population of individuals satisfying that threshold, and treats the distribution of this set as the object of analysis. In other words, rather than seeking a single minimum-cost solution, the framework analyzes the structure of the feasible solution set realized under net-zero carbon conditions.
2.2. Generation of Diverse Feasible Solutions by the Hierarchical GA–LP Model
Figure 2 shows the computational flow of the integrated GA–LP approach used in this study. At the upper level, a GA explores combinations of discrete assumptions, including equipment capacities, price conditions, heat-demand electrification rates, and parameters related to CO2 capture, while at the lower level, LP determines the operational state of each individual. Through this procedure, diverse “assumption–total cost” combinations at or below the prescribed cost threshold are collected as the feasible solution set.
Figure 2.
Overview of the proposed GA–LP integrated framework. The upper-level genetic algorithm (GA) explores combinations of exogenous conditions, while the lower-level linear programming (LP) model evaluates each individual by optimizing system operation under technical and supply–demand constraints. For each individual, the total cost is calculated by combining OPEX from the LP model with CAPEX and O&M costs. Individuals whose total cost falls below a predefined threshold are retained, and the GA generates the next population through selection, crossover, and mutation. Repeating this process yields diverse feasible total cost–condition pairs. The arrows and lines indicate the computational flow from GA-based generation of candidate assumptions to LP-based operational evaluation, feasible-solution retention, and feedback to the next GA generation.
The methodological rationale for adopting a GA at the upper level and LP at the lower level is threefold. First, because the assumption space is structured as combinations of discrete candidate values, evolutionary computation is more suitable than gradient-based optimization. Second, the lower-level operational optimization is a cost-minimization problem with continuous variables under supply–demand balance constraints, for which LP provides rigorous and consistent evaluation. Third, the hierarchical separation between stochastic exploration at the upper level and deterministic optimization at the lower level reconciles the flexibility of alternative generation with the rigor of operational evaluation (discussed further in Section 4.1). Model details are provided in Appendix A.1.
2.2.1. Upper-Level Problem: GA-Based Exploration of the Assumption Space
In the upper-level problem, a combination of assumptions—including institutional conditions, price conditions, equipment capacities, the electrification rate of heat demand, and installation rate and performance of CO2 capture equipment—is represented as an individual i, and the GA explores the resulting high-dimensional assumption space. Each individual is encoded as a discrete chromosome composed of multiple candidate values, where each assumption is assigned one of two to five predefined discrete candidate values.
Uncertainty in the demonstration was represented through finite sets of discrete candidate values assigned to selected upper-level variables. No probability distribution or probabilistic weight was assigned to these values. A single candidate value indicates a fixed input, whereas two or more candidate values indicate discrete choices explored by the upper-level GA. The purpose was to examine contrasting combinations of assumptions and deployment conditions for methodological demonstration, rather than to estimate their future likelihood. Accordingly, the frequency of a value or configuration in the GA-generated dataset reflects the search process, feasibility constraints, and total-cost threshold, and should not be interpreted as a probability of occurrence.
The total cost of individual i is defined as the sum of the capital expenditure and the operating expenditure computed in the lower-level problem.
Here, CAPEXi is obtained by multiplying the total capacity Capacityi,j of technology j by the unit construction cost UnitConstructionCostj, annualizing the resulting construction cost using the payback period PPj and the discount rate DR, and summing across all technologies j. OPEXI is expressed as the sum of fuel costs, operation and maintenance (O&M) costs, and other operating costs over the representative time series T.
Only individuals whose total cost is at or below the threshold are retained, constituting the feasible solution set F.
The GA is a stochastic search algorithm inspired by natural selection and inheritance, capable of efficiently exploring broad solution spaces by simultaneously maintaining a population of candidate solutions [16,17]. In the proposed approach, an initial population is first generated, after which the lower-level LP is applied to each individual to compute total cost. The resulting cost serves as the fitness value used in selection, crossover, and mutation to generate the next generation. Individuals whose total cost is at or below the threshold are retained as the feasible solution set F. Since exploration behavior can be adjusted through parameters such as crossover and mutation rates, the GA is well suited not only for local optimization but also for characterizing the distribution of an admissible solution set. In this study, the GA functions both as an optimization algorithm and as a sampling mechanism for generating diverse “assumption–total cost” data. The implementation employed the Python library DEAP [19,20]. The basic GA settings were a population size of 200, a tournament size of 5, two-point crossover, a crossover rate of 0.6, a mutation target ratio of 0.5, and 20 generations. No adaptive stopping criterion was applied. These settings were selected through preliminary calibration runs to balance computational feasibility, diversity of generated feasible solutions, and interpretability of the resulting solution set. They should therefore be interpreted as pragmatic demonstration settings rather than systematically optimized hyperparameters.
The original GA-LP evaluation was executed serially. Because each individual requires construction and solution of a lower-level LP, the computational burden is primarily governed by the number of LP evaluations and the per-individual LP evaluation time.
2.2.2. Lower-Level Problem: LP-Based Operational Optimization
In the lower-level problem, given the equipment conditions and other assumptions provided by the upper-level GA, operating cost is minimized while satisfying the energy supply–demand balance at each time step. The objective function is annual OPEX, which includes fuel costs and O&M costs.
The electricity supply–demand balance at each time t is imposed such that electricity supplied by generation equipment and battery discharge equals net electricity demand, battery charging, electricity used for hydrogen production, and curtailment when necessary. A representative form of this balance is given by the following:
The principal constraints include output upper limits for generation equipment, supply–demand balance constraints, charge and discharge constraints for storage systems, and constraints related to CO2 capture and storage.
Using LP for the lower-level problem ensures tractable and consistent operational optimization for each individual. This is important because, even when a heuristic GA is used at the upper level, each candidate must be evaluated based on supply–demand feasibility and cost minimization rather than heuristic rules. The proposed GA–LP framework therefore reconciles flexible exploration at the upper level with rigorous operational evaluation at the lower level.
2.2.3. Total Cost Evaluation, Net-Zero Condition, and Retention of Feasible Solutions
The total cost used to evaluate each individual comprises CAPEX, O&M, and fuel costs. It is evaluated by adding CAPEX—derived from the equipment conditions specified at the upper level—with the annual OPEX computed by the lower-level LP. Each candidate is therefore evaluated based on total system cost rather than operating cost alone.
The net-zero condition is defined such that CO2 emissions from thermal power generation and heat demand are captured by CO2 capture equipment, while residual emissions are captured and stored via direct air capture and storage (DACCS), ensuring that the system achieves net-zero carbon overall. A feasible solution in this study is thus defined as one that satisfies both the supply–demand balance and the net-zero constraint through emissions, capture, and storage.
The net-zero condition is conceptually expressed as follows:
Here, , , and denote CO2 emissions from each source; denotes source-side capture; and denotes capture via DACCS. In the implementation, CO2 emissions are computed for GTCC, BTG, and heat-demand sectors based on fuel consumption and emission factors, while source-side capture is represented according to the installation rate and performance of CO2 capture equipment.
The additional equipment requirements associated with electrification of the heat-demand sector are incorporated into CAPEX as a switching cost. This enables total cost evaluation to reflect not only supply-side technology choices but also demand-side conversion costs.
Individuals whose total cost lies at or below the prescribed threshold are retained and constitute the feasible solution set F.
2.3. Sensitivity Analysis Based on the Generated Solution Set
A key methodological feature of this section is that sensitivity analysis is not conducted as a post hoc step independent of optimization; instead, the “assumption–total cost” data obtained through diverse solution generation are directly used as training samples. Whereas conventional one-at-a-time sensitivity analyses require repeated iterative function evaluations, the proposed approach accumulates such data as a by-product of GA-based sampling. As a result, the sensitivity structure, including high-dimensional interactions, can be extracted without additional computational burden.
In this study, a random forest is adopted as the machine learning model, with total cost as the response variable and the assumptions as explanatory variables, while SHAP [18] is used as the explainable AI method. The random forest is an ensemble learning method that applies bootstrap sampling (sampling with replacement from the dataset) to decision trees and is known for its high predictive accuracy on complex nonlinear relationships [21,22]. SHAP decomposes each feature’s contribution to the predicted value, enabling identification of feature importance, contribution direction, and feature interactions.
By constructing a machine learning model on the diverse solution set generated by the GA and applying SHAP, the sensitivity structure of total cost across the high-dimensional assumption space can be systematically interpreted. This procedure is feasible only when data obtained through broad exploration of the assumption space are available.
To assess the dependence of SHAP interpretation on the GA-generated training sample, we performed 50 repetitions of random 80% subsampling without replacement from the 2460 full-gene unique feasible solutions. Stability was quantified using rank correlations, top-10 overlap, feature-selection frequencies, and empirical subsampling intervals. Full results are reported in Appendix D.3.
2.4. Illustrative Solution Archetype Extraction by Clustering
The feasible solution set obtained through the GA–LP integrated approach forms a high-dimensional point cloud that is not readily interpretable or comparable for decision-makers in its raw form. Therefore, this study applies clustering to the feasible solutions below the threshold to organize numerous solutions into a small number of illustrative solution archetypes.
First, the inverse-analysis model is executed with specified constraints, exogenous values, and parameter options to obtain diverse solutions whose total cost lies at or below the threshold. Next, the principal parameters characterizing differences among solutions are extracted from each solution and used as explanatory variables for clustering. In this approach, the principal assumptions are treated as clustering features, and k-means clustering [22] is applied.
K-means clustering was fitted to the five features selected to represent the principal equipment-configuration dimensions: newly installed high-efficiency GTCC, PV, offshore wind, Li-ion battery capacity, and the CO2-storage limit. The features were standardized before clustering to remove differences in units and numerical ranges. The number of clusters was evaluated over k = 2–10 using inertia, the silhouette score, the Calinski–Harabasz index, and the Davies-Bouldin index. Values of k = 4, 5, and 6 were then compared in terms of cluster centers, cluster sizes, cost distributions, and energy-system interpretability. Supporting metrics are reported in Appendix D.4.
For each cluster, the cluster center and mean parameter values are calculated to identify the combination of principal parameters that characterizes that cluster. By organizing and visualizing the operational states of representative individuals within each cluster, together with the range of conditions under which the cluster is realized, both the central tendency and the variability of each scenario are captured. Integrating these results allows each cluster to be interpreted as an illustrative solution archetype.
The clustering step is positioned as a method for compressing the high-dimensional feasible solution set into a small number of illustrative solution archetypes suitable for decision support. This step is not merely statistical classification but an interpretive process that includes (i) identifying design archetypes, (ii) organizing the range of conditions under which each archetype is realized, and (iii) distinguishing between common and variable elements. Ensuring this interpretability is a key methodological feature distinguishing the proposed framework from existing diverse-solution generation approaches. For each cluster, the cluster center, key equipment configuration, operational characteristics, and range of realization conditions are organized together so that each cluster is presented as an interpretable scenario rather than a collection of numerical values.
In summary, the method proposed in this section integrates diverse-solution generation via GA–LP, sensitivity analysis using explainable AI, and illustrative solution archetype extraction through clustering into a unified analytical framework.
2.5. Demonstration Setting
To demonstrate the operation of the proposed framework, a hypothetical case study is constructed for the Kanto region in 2050 under a net-zero carbon target. Figure 3 shows an overview of the energy supply–demand system used in the analysis. The target system includes generation technologies (GTCC, conventional steam power (boiler-turbine generator, BTG), photovoltaics (PV), onshore and offshore wind, nuclear, hydro, geothermal, and biomass), Li-ion batteries, pumped hydro storage (PHS), hydrogen production and methanation, CO2 capture and storage, and DACCS. Final energy consumption includes electricity and heat demand in the residential and industrial sectors.
Figure 3.
Conceptual structure of the regional energy supply–demand model used in the demonstration. The figure illustrates the relationships among primary energy inputs, conversion technologies, storage and transport, final energy demand, and carbon management options, including CCS and DACCS. The arrows indicate the direction of energy, fuel, hydrogen/e-methane, electricity, and CO2 flows among the system components.
The assumptions are defined as combinations selected from two to five discrete candidate values and include equipment capacities, unit construction costs, fuel prices, electrification rates, and the installation rate and performance of CO2 capture equipment. Based on multiple investment-scale references and assumed energy-related investment in the Kanto region, the total-cost threshold was set at 12 trillion JPY as a permissive demonstration threshold for retaining a broad feasible-solution set [23,24] (refer to Appendix D.2 for the total-cost threshold sensitivity study). This value is not intended to represent a policy budget, forecast, or social optimum. The temporal resolution is set to one hour, and a representative time series consisting of four characteristic weeks per year, exhibiting distinctive electricity demand and renewable generation profiles, is used as input.
This demonstration is a hypothetical configuration intended to illustrate the operation of the proposed framework and does not represent a forecast of the future energy system in the Kanto region. Some exogenous values and parameter settings are assumed for illustrative purposes, and analysis under realistic conditions would require separate condition settings. Detailed technical settings, data sources, and exogenous assumptions are provided in Appendix A.
Figure 3 shows a conceptual structure of the regional energy supply–demand model for the demonstration. The figure illustrates relationships among primary energy inputs, conversion technologies, storage and transport, final energy demand, and carbon management options, including CCS and DACCS.2.6.
Software environment: The analyses were conducted in Python 3.10.16. The energy-system optimization model was implemented in Pyomo 6.7.3 and solved with the CBC 2.10.11 linear-programming solver, and the solution search was performed with a genetic algorithm built on DEAP 1.4. The main packages used for the downstream analyses were scikit-learn 1.5.1 for k-means clustering, random forest regression, and preprocessing (standardization), SHAP 0.48.0 for feature-importance analysis, and SciPy 1.14.0 for statistical tests (e.g., Spearman’s rank correlation). Numerical computation and data handling relied on NumPy 1.26.4 and pandas 2.2.3, and the figures were produced with Matplotlib 3.9.0 and seaborn 0.13.2.
3. Results
This section presents the application of the proposed framework to a hypothetical 2050 net-zero case for the Kanto region. Two types of findings are distinguished throughout. The first concerns the methodological capabilities of the framework, including diverse-solution generation, cost-driver characterization, and archetype extraction. The second concerns patterns observed under the particular assumptions adopted in the demonstration. The latter are conditional on the selected input data, candidate values, model boundaries, and total-cost threshold and should not be interpreted as forecasts or policy recommendations for the Kanto region.
Section 3.1 demonstrates diverse-solution generation using the GA–LP integrated approach. Section 3.2 demonstrates sensitivity analysis based on the generated data. Section 3.3 demonstrates illustrative solution archetype extraction via clustering. Section 3.4 demonstrates identification of common and variable elements through cluster comparison.
3.1. Generation of Diverse Feasible Solutions
This section verifies that the GA–LP integrated approach proposed in Section 2.2 can generate diverse feasible solutions whose total cost lies at or below the cost threshold.
The Figure 4 plots, for feasible individuals whose total cost is at or below the threshold (12 trillion JPY), show the individual index on the horizontal axis and the total cost (fitness value) on the vertical axis. The individual index represents the serial number assigned to feasible individuals retained during the GA search, where larger indices correspond to individuals obtained in later search stages. The total cost is defined as the sum of operating cost computed by the lower-level LP and capital and O&M expenditures. A total of 3752 individuals were collected, of which 2460 correspond to unique combinations of assumptions.
Figure 4.
Distribution of feasible individuals by total cost. The horizontal axis shows the index of feasible individuals in the order in which they were retained during the GA search, and the vertical axis shows the total cost (fitness value). The figure indicates that lower-cost feasible individuals emerge as the search progresses, while a wide range of feasible solutions remains below the cost threshold.
Figure 4 shows that individuals with total costs in the 9–12 trillion JPY range dominate in the early stage of the search. As the search progresses, the lower bound of feasible solutions gradually decreases, and low-cost individuals in the 6.5–7.0 trillion JPY range continue to be obtained. This indicates that the upper-level GA progressively identifies more cost-favorable combinations of assumptions while exploring the assumption space. At the same time, individuals in the 9–12 trillion JPY range remain present in later stages, suggesting that the proposed approach does not converge exclusively toward low-cost regions but retains feasible solutions across a wide cost range below the threshold.
To further examine solution diversity, Figure 5 shows the distribution of feasible individuals below the threshold, with a distance-based novelty score on the horizontal axis and total cost on the vertical axis. Each point represents one feasible individual. The solid line connects median total costs across twenty equal-frequency bins (vigintiles) of the novelty score, and the shaded area indicates the 10th–90th percentile range within each bin.
Figure 5.
Relationship between the novelty of explanatory-variable combinations and total cost for feasible individuals. Each point represents one feasible individual, with the horizontal axis showing the distance-based novelty score and the vertical axis showing the total cost. The novelty score is defined as the mean Manhattan distance to the 10 nearest neighbors in the min–max normalized explanatory-variable space, divided by the number of explanatory variables. The solid line shows the median total cost within each novelty decile, and the shaded area indicates the 10th–90th percentile range.
The novelty score measures how different an individual’s assumption combination is from others. Specifically, all explanatory variables are first normalized to the [0, 1] range using min–max normalization. The mean distance to neighboring individuals is then computed for each individual. Let denote the normalized explanatory-variable vector of an individual where p is the number of explanatory variables, and the set of k nearest neighbors of . The novelty score is defined as follows:
where denotes the Manhattan distance. In this study, k = 10 is used and self-distances are excluded. A higher novelty score indicates a more distinctive combination of assumptions relative to nearby solutions in the feasible solution set.
Figure 5 shows that, in the low-novelty region—particularly between 0.02 and 0.05—relatively low-cost individuals with total costs of approximately 6.5–7.5 trillion JPY are densely distributed. As the novelty score increases, the representative total cost also tends to rise overall. This indicates that low-cost feasible solutions are concentrated around relatively similar combinations of assumptions, whereas accommodating more distinctive combinations requires additional cost. At the same time, a substantial number of feasible individuals with total costs at or below 12 trillion JPY are also distributed in the region with novelty scores above 0.10, indicating that increasingly diverse alternatives emerge within the feasible solution set as cost increases.
Overall, this observed novelty–cost relationship quantitatively shows that the proposed approach does not merely converge toward low-cost solutions but maintains diversity across a broad region of the assumption space, thereby achieving diversity exploration under the cost threshold. In the next section, the principal drivers of total cost and their interactions are identified through sensitivity analysis using the generated “assumption–total cost” dataset.
Additional diagnostic runs were conducted to examine random-seed dependence and search-budget dependence. Across three random seeds under the baseline setting, the number of unique feasible solutions was relatively stable, and the number of LP evaluations varied only slightly.
The search-budget comparison indicated a trade-off between search breadth and cost deepening. Increasing the population from 100 to 200 increased the number of unique feasible solutions obtained within 20 generations. Also, extending the 100-individual run from 20 to 40 generations further lowered the best cost but did not produce more unique feasible solutions than the population-200, 20-generation setting. Because the objective of this demonstration was to generate and interpret a broad feasible-solution set below the threshold rather than to identify the global minimum-cost solution, the population-200, 20-generation setting was retained from the perspective of efficiently acquiring a diverse range of individuals.
In the measured per-individual evaluation, LP model construction and LP solution accounted for 38.4% and 56.0% of the full-model evaluation time, respectively, confirming that LP evaluation is the dominant computational burden. Detailed diagnostics are provided in Appendix D.1.
3.2. Sensitivity Analysis Based on the Generated Data
This section verifies the operation of the sensitivity-analysis step proposed in Section 2.3. The objective is to confirm that the combination of random forest and SHAP can extract the principal drivers of total cost and characterize their interaction structure from the generated diverse-solution set.
A random forest model was constructed using the assumptions as explanatory variables and total cost as the response variable. Predictive performance was evaluated by three-fold cross-validation. The mean R2 across folds was 0.9002, with a standard deviation of 0.0065. Since this study does not aim to develop a highly accurate total-cost prediction model, the random forest hyperparameters were retained at their default values. Nevertheless, the resulting performance was considered sufficient to demonstrate the operation of the proposed framework.
Figure 6 shows the top 10 assumptions with the largest contributions to total cost, ranked by mean absolute SHAP value. The horizontal axis in Figure 6a represents mean(|SHAP value|), that is, the average magnitude of each assumption’s contribution to total-cost prediction, while the vertical axis lists the assumptions in descending order of importance. A larger mean (|SHAP value|) indicates that the corresponding assumption has a greater influence on predicted total cost and therefore exhibits higher sensitivity.
Figure 6.
High-importance parameters and their SHAP-value distributions. Panel (a) shows the top 10 parameters ranked by mean absolute SHAP value, where the horizontal axis indicates the average magnitude of impact on the model output and the vertical axis lists the parameters. Panel (b) shows the SHAP-value distribution for the same parameters, where each point represents one feasible individual, the horizontal axis shows the SHAP value, and the color indicates the feature value.
Figure 6a shows that, in this demonstration, the H2 price was identified as the most influential assumption. This was followed by the construction cost of offshore wind, the construction cost of Li-ion batteries, the newly installed PV capacity, and the newly installed offshore wind capacity. The e-methane price, the CO2-capture installation rate in the high-temperature industrial heat sector, the construction cost of PV, the newly installed Li-ion battery capacity, and the residential-sector electrification rate were also included among the top 10. Although these results are obtained under hypothetical conditions, they demonstrate that the SHAP-based analysis can successfully identify the principal cost drivers.
Figure 6b shows the per-individual distribution of SHAP values for the same top 10 assumptions. The horizontal axis represents the SHAP value: positive values indicate that the assumption contributes to increasing total cost, while negative values indicate that it contributes to reducing total cost. The vertical axis lists the assumptions, and each point corresponds to one individual. Point color encodes the magnitude of the assumption value, with red indicating higher values and blue indicating lower values.
For the H2 price, Figure 6b clearly shows that higher-priced individuals tend to exhibit positive SHAP values, whereas lower-priced individuals tend to exhibit negative SHAP values. Similar trends are observed for the construction costs of offshore wind, Li-ion batteries, and PV, as well as for the e-methane price, indicating that higher values of these cost-related variables generally increase total cost. In contrast, the direction of influence is less uniform for variables related to newly installed capacity. For newly installed PV and offshore wind capacities, negative SHAP values tend to appear at lower capacities, whereas positive SHAP values are more frequently observed at higher capacities. For the CO2-capture installation rate in the high-temperature industrial heat sector and the residential-sector electrification rate, higher values tend to correspond to negative SHAP values, whereas lower values tend to correspond to positive SHAP values. The coexistence of monotonic and non-monotonic relationships indicates that the proposed step can identify diverse contribution patterns.
Figure 7 presents dependence plots showing the relationship between the value of each of four representative assumptions and its corresponding SHAP value. In each panel, the horizontal axis represents the value of the focal assumption, the vertical axis represents its SHAP value, and the color indicates the value of the assumption exhibiting the strongest interaction. Thus, Figure 7 conveys not only the standalone effect of each assumption but also conditional effects arising from interactions with other assumptions. For each parameter on the horizontal axis, the SHAP value varies across individuals even at the same parameter value, indicating that the sensitivity of each parameter’s effect on total cost depends strongly on other assumptions.
Figure 7.
SHAP dependence plots for representative parameters. In each panel, the horizontal axis shows the value of the focal parameter, and the vertical axis shows its SHAP value. The color indicates the interacting parameter with the strongest interaction effect. Panels (a–d) correspond to the H2 price, construction cost of offshore wind, construction cost of Li-ion batteries and newly built capacity of PV, respectively.
Figure 7a shows that the H2 price exhibits negative SHAP values around 20 and shifts substantially toward positive SHAP values at approximately 60 and above. Beyond this level, changes in SHAP value with increasing H2 price become relatively small. In this region, the relationship with the color-coded CO2-capture installation rate in the high-temperature industrial heat sector is reversed relative to that observed around an H2 price of 20, suggesting that the proposed step captures changes in equipment configuration and operational modes required to satisfy the net-zero condition as the H2 price varies.
In Figure 7b,c, the SHAP value increases stepwise with the rising construction costs of offshore wind and Li-ion batteries. The point colors indicate that, for the offshore wind construction cost, the positive contribution becomes larger when newly installed offshore wind capacity is high, and that, for Li-ion battery construction cost, the positive contribution increases with newly installed Li-ion battery capacity. These results show that the proposed step can capture interactions in which the influence of cost factors is amplified by deployment scale.
For newly installed PV capacity in Figure 7d, large negative SHAP values are observed when capacity is zero, whereas SHAP values shift toward positive as capacity increases. Additionally, in the region with large PV capacity, the SHAP value tends to be lower when the color-coded H2 price is high and higher when it is low. This indicates that the proposed step can identify interactions between supply-side configurations and fuel-price conditions.
Overall, these results confirm that the SHAP analysis step consistently extracts principal drivers, identifies monotonic and non-monotonic contribution patterns, and characterizes interactions among assumptions. Conventional one-at-a-time sensitivity analyses are generally not well suited to capturing such non-linear and joint relationships among parameters. This indicates that the proposed framework, which applies explainable AI to data generated through GA-based exploration of a broad assumption space, enables comprehensive characterization of cost structure in a high-dimensional assumption space.
The SHAP ranking was highly stable under repeated subsampling. The median Spearman correlation with the full-data ranking was 0.990, and the top-10 feature set was identical in all 50 repetitions. The four leading features appeared in the top five in every repetition, while limited switching occurred around the fifth rank and below. The comparison between all feasible individuals and full-gene unique solutions also showed a highly similar ranking. These results indicate that the leading SHAP interpretation is stable within the generated feasible-solution dataset, although lower-ranked features remain sample-dependent. Detailed results are reported in Appendix D.3.
3.3. Illustrative Solution Archetype Extraction by Clustering
This section verifies that the clustering step proposed in Section 2.4 can compress the diverse solution set into interpretable illustrative solution archetypes.
For feasible solutions below the threshold, k-means clustering was applied after standardizing the newly built capacity of high-efficiency GTCC, PV, offshore wind, and Li-ion batteries, as well as the upper limit of CO2 storage. The number of clusters was set to five. Figure 8, Figure 9 and Figure 10 show the distribution of the number of individuals per cluster, the distribution of total cost by cluster (boxplots), and the standardized mean values of the principal parameters for each cluster (heatmap), respectively.
Figure 8.
Number of feasible individuals by cluster. The horizontal axis shows the cluster ID, and the vertical axis shows the number of feasible individuals assigned to each cluster. The figure illustrates that feasible solutions are unevenly distributed across clusters, indicating differences in the frequency with which each representative solution type appears.
Figure 9.
Distribution of total cost by cluster. The horizontal axis shows the cluster ID, and the vertical axis shows the total cost (fitness value). The boxplots indicate differences among clusters in median cost level and within-cluster variability, suggesting that the extracted clusters represent solution types with distinct cost structures.
Figure 10.
Heatmap of standardized mean values of major equipment-related parameters by cluster. The horizontal axis shows the cluster ID, and the vertical axis shows the major parameters used for clustering. Each cell reports the mean standardized value of the corresponding parameter within the cluster, where positive values indicate levels above the overall mean and negative values indicate levels below the overall mean. The figure highlights distinct equipment-configuration characteristics across the five representative clusters.
As shown in Figure 8, Cluster 0 contains 482 individuals, Cluster 1 contains 897, Cluster 2 contains 91, Cluster 3 contains 208, and Cluster 4 contains 782. The feasible solutions are therefore unevenly distributed and tend to concentrate in particular clusters. Figure 9 further indicates that the typical cost levels differ among clusters: Cluster 2 exhibits the highest median total cost, whereas Clusters 1 and 4 show relatively low medians. Each cluster also exhibits a certain degree of variation and should therefore be understood not as a single point but as a representative type characterized by a common structural pattern.
Figure 10 presents a heatmap of the standardized mean values of the principal parameters for each cluster. The horizontal axis represents cluster ID, and the vertical axis lists the five principal parameters used for clustering. Each cell value corresponds to the mean standardized value of the parameter for individuals belonging to the cluster: positive values denote levels above the overall mean, whereas negative values denote levels below it. Red indicates relatively higher parameter values, while blue indicates relatively lower values. Based on Figure 10 and the time-series operational patterns of representative individuals (shown in Figure A1 in Appendix B), the characteristics of each cluster are summarized in Table 2.
Table 2.
Cluster characteristics and illustrative solution archetype names.
As shown in Table 2, the clustering step organizes the large set of feasible solutions into five representative types systematically differentiated by equipment configuration, operational pattern, and the conditions under which low-cost realization is possible. These results verify that the proposed approach can extract illustrative solution archetypes suitable for decision support from a diverse solution set. Details of the cluster analysis underlying Table 2 are provided in Appendix B.
No single clustering-quality metric identified a uniquely optimal number of clusters. The inertia curve showed a bend around k = 4–5, while the silhouette scores were low overall, indicating that the generated feasible-solution space is relatively continuous rather than sharply separated. The k = 4 solution combined configurations that were distinguishable in terms of PV and GTCC deployment, whereas k = 6 mainly subdivided the offshore-wind-centered archetype. The k = 5 solution provided a useful balance between statistical compactness and physical interpretability and was therefore retained for the illustrative archetype analysis. Supporting metrics are reported in Appendix D.4.
A post hoc one-sided sensitivity analysis was conducted by re-filtering the existing full-model solution set using total-cost thresholds of 9, 10, 11, and 12 trillion JPY. Tightening the threshold reduced the number of retained unique configurations, from 2460 at 12 trillion JPY to 1372 at 9 trillion JPY. Nevertheless, all five baseline-defined archetypes remained represented. The SHAP ranking was highly stable between 10 and 12 trillion JPY, with Spearman correlations of 0.953–0.984 relative to the baseline ranking. Under the strictest 9 trillion JPY threshold, the leading feature changed, consistent with the narrower range of retained costs and input values. Detailed results are provided in Appendix D.2.
The resulting clusters are illustrative categories derived from the present demonstration dataset; they are not intended to represent forecasts, probabilities, or validated transition pathways for the Kanto region.
3.4. Common and Variable Elements
As an implication for future decision-support applications, this section verifies that comparisons among the illustrative solution archetypes extracted through clustering can be used to identify common and variable elements.
Comparison of the five representative clusters shown in Table 2 reveals both tendencies shared across all clusters and tendencies that differ among them. Common tendencies include deployment of renewables at or above a certain scale, provision of flexibility to accommodate supply–demand variability, and the importance of H2 price as a condition for low-cost realization. By contrast, variable tendencies include the dominant renewable technology (PV or offshore wind), the principal source of flexibility (battery storage, GTCC, or a combination of both), the extent of CO2 storage utilization, and the combinations of conditions that become bottlenecks for low-cost realization.
The ability to distinguish these common and variable elements verifies one of the key methodological contributions of the proposed approach. By linking diverse-solution generation with illustrative solution archetype extraction, the framework compresses numerous feasible solutions into an interpretable structure that distinguishes “what is common” from “what varies.” In future decision-support applications using real-world data, this information-compression capability could serve as a basis for distinguishing robust investment targets from domains requiring flexible domain-making.
It should be noted, however, that the specific common and variable elements observed in this demonstration were obtained under hypothetical conditions and should not be interpreted as universal claims applicable under realistic conditions. A more detailed discussion of these common and variable elements is provided in Appendix C.
4. Discussion
4.1. Methodological Implications
This section discusses the methodological significance of the analytical framework presented in Section 1 by contrasting it with research on MGA, hierarchical design optimization, one-at-a-time sensitivity analysis, and conventional uses of clustering.
Relative to conventional MGA, the present study shares the underlying motivation of valuing diverse alternatives within the near-optimal region but differs in both its exploration target and computational structure. As discussed in Section 1.2, existing MGA studies typically first solve for the optimal solution, then impose slack constraints around it, and explore alternatives mainly with respect to capacity or design variables [8,9,10,11]. By contrast, the present study extends upper-level exploration beyond equipment capacity to include exogenous assumptions related to institutional conditions, price conditions, and demand-side conversion, such as the H2 price, e-methane price, heat-demand electrification rate, and CO2-capture installation rate. The diversity obtained in this study is therefore expressed not only as differences in equipment design but also as diversity in the assumption space, representing an extension beyond conventional MGA. As shown by the cost distribution and novelty–cost relationship in Section 3.1, the proposed approach generates not only solutions near the minimum-cost solution but also structurally distinct feasible solutions as the admissible cost range widens.
A central feature of the proposed approach is its treatment of operational variables during alternative generation. MGA intentionally modifies the objective function to direct the search toward solutions different from the optimum; however, when operational variables such as annual generation are directly incorporated into the alternative-generation objective, weights unrelated to actual operating costs may be introduced. Consequently, the search direction can distort dispatch behavior and deviate from the principle of least-cost operation (economic dispatch) [12]. In contrast, in the proposed GA–LP integrated approach, the upper-level GA explores combinations of assumptions concerning equipment capacities, prices, institutional conditions, and demand-side electrification rates, while the lower-level LP minimizes OPEX subject to supply–demand constraints under the given assumptions. This hierarchical separation preserves flexibility of exploration at the upper level while maintaining rigor in operational evaluation at the lower level. Consequently, the operational state of each individual is consistently evaluated on the basis of cost minimization even as diverse alternatives are generated. This structure therefore prevents arbitrary weighting introduced for alternative generation from directly distorting dispatch.
The present study does not aim to provide a quantitative performance comparison with MGA, such as a comparison of computational cost or solution-diversity indicators under the same problem setting. This is because the exploration of exogenous assumption spaces addressed here differs qualitatively from the standard exploration targets of existing MGA studies, making direct comparison difficult. Accordingly, the present study should be understood not as a substitute for MGA but as an independent framework that extends the problem orientation of MGA toward a different exploration target. A quantitative comparison between the two approaches under a common exploration target remains an avenue for future research.
In comparison with conventional one-at-a-time sensitivity analysis, the present study is significant in positioning sensitivity analysis not as a post hoc auxiliary task but as an analytical step integrated with diverse-solution generation. As described in Section 2.3, conventional sensitivity analysis requires varying parameters individually and repeatedly solving the optimization problem, which is computationally expensive and makes it difficult to capture interactions in a high-dimensional space. By contrast, in the present study, the large set of “assumption–total cost” data generated by the GA–LP integrated approach is directly used as training data, and the sensitivity structure of total cost is estimated using a random forest and SHAP. Section 3.2 showed that the H2 price, the construction cost of offshore wind, the construction cost of Li-ion batteries, the newly built capacity of PV, and the newly built capacity of offshore wind were identified as principal drivers, and that dependence plots revealed interactions with deployment scale and CO2-capture conditions.
The sensitivity-analysis step proposed here is not intended to replace existing global sensitivity-analysis methods. Whereas conventional methods compute sensitivity indices through repeated function evaluations, the proposed approach is distinguished by its use of data generated as a by-product of diverse-solution exploration as learning samples. A quantitative analysis of the correspondence and complementarity between the two approaches remains an independent research question.
The significance of placing clustering downstream lies in translating the diverse solution set into a comparable group of illustrative solution archetypes rather than presenting it in raw form. As the feasible solution set below the threshold is represented as a high-dimensional point cloud, direct comparison by decision-makers is not straightforward. The present study therefore applied clustering based on principal equipment-configuration parameters and organized the solutions into five illustrative solution archetypes. For each cluster, the distribution of individuals, the distribution of total cost, the heatmap of standardized mean values, the time-series operational patterns of representative individuals, and the range of realization conditions under threshold variation were jointly examined. In this way, each cluster is interpreted not merely as a collection of similar solutions but as a design archetype characterized by a distinct combination of equipment configuration, operational pattern, cost level, and realization conditions. Importantly, clustering does not replace diverse-solution generation; rather, it serves as a downstream step for organizing which types of solutions are likely to emerge and under which conditions. As shown in Section 3.4, comparison among clusters enables the identification of foundational elements common to all scenarios and variable elements that differ among them, thereby transforming a large set of solutions into a comparable scenario structure usable for decision support.
In summary, the methodological contributions of this study can be organized into four points. First, while inheriting the MGA-style motivation for diversity exploration, the study extends the exploration target to the exogenous assumption space. Second, it reconciles the flexibility of alternative generation with the rigor of operational optimization through hierarchical separation. Third, instead of relying on one-at-a-time sensitivity analysis, it enables the characterization of sensitivity structures, including interactions, using the generated diverse solution set. Fourth, by connecting clustering downstream, it organizes the diverse solution set into illustrative solution archetypes and enables the identification of common and variable elements. In other words, this study extends energy supply–demand modeling from a method focused solely on optimization into an integrated analytical framework that generates and interprets multiple feasible possibilities under uncertain assumptions and converts them into comparable decision-support insights.
4.2. Application Possibilities and Future Developments
The implications discussed below do not assert the realistic validity of any specific scenario; rather, they are presented as methodological implications illustrating the kinds of insights that the proposed approach can provide (see also the limitations discussed in Section 4.3).
This demonstration confirmed that the proposed framework can execute the full analytical chain from diverse-solution generation to illustrative solution archetype extraction. In particular, the identification of five illustrative solution archetypes, each characterized by distinct equipment configurations, operational patterns, and realization conditions, suggests that the proposed approach can provide effective information compression for decision-support applications.
For application under realistic conditions, it will be necessary to incorporate electricity- and heat-demand profiles that reflect regional characteristics, region-specific deployment-potential constraints, and intra-regional grid interconnection conditions. Although this demonstration used a representative four-week time series, real-world applications would benefit either from time series selected to ensure seasonal representativeness or from full-year computations over 8760 h. As these extensions can be implemented without changing the structure of the proposed approach, the framework is readily extensible to practical applications.
The proposed framework is not intended to replace existing energy system optimization models such as DNE21+ and IEEJ-NE; rather, it is positioned as complementary to them. Whereas conventional models excel at detailed analysis of a single optimal solution or a limited number of scenarios, the proposed framework is well suited to characterizing the range of feasible possibilities across a broad assumption space. Combining the two approaches is therefore expected to broaden the scope of decision support provided by energy supply–demand models.
4.3. Limitations and Future Work
The present study has several limitations. First, its principal aim is to verify the methodological effectiveness of the proposed framework rather than to provide an empirical projection for the Kanto region in 2050. The Kanto-region setting is a hypothetical case adopted to demonstrate the methodology concretely, and some exogenous values and parameter options are assumed. Empirical projection and evaluation under realistic conditions should therefore be conducted separately using input data that reflect regional characteristics and detailed sensitivity verification. Additionally, validation of predictive accuracy through comparison with observed data lies beyond the scope of this study. The present work focuses on verifying that the methodology operates as intended, whereas predictive validation should be performed separately under realistic data and region-specific settings.
Second, the assumptions considered in this study are implemented as discrete variables with candidate values to leverage the GA’s strength in flexibly exploring a broad assumption space. Using relatively wide discrete intervals enabled the generation of a large and broadly distributed set of “assumption–total cost” data and demonstrated the effectiveness of the proposed framework linking GA–LP-based energy supply–demand modeling, machine-learning-based sensitivity analysis, and clustering-based scenario extraction. However, the discrete candidate levels should not be interpreted as probability distributions, nor do they exhaust the continuous range of possible future conditions. The numerical results are therefore conditional on the selected candidate levels, their spacing, and the assumed total-cost threshold. Moreover, finer discretization would substantially increase the computational cost and could cause the search to concentrate on a limited region of the solution space. For practical applications, it will therefore be important to establish more principled criteria for selecting discretization intervals and to extend the framework to finer discretization and probabilistic uncertainty propagation.
Third, owing to the heuristic nature of the GA, exhaustive coverage of the feasible-solution space and convergence to a global minimum-cost solution are not guaranteed. The number and distribution of retained feasible solutions, as well as overall search efficiency, depend on settings such as population size, number of generations, crossover and mutation parameters, and the spacing of discrete candidate values. In this study, these settings were selected through preliminary, problem-specific calibration that considered computational feasibility, solution diversity, and interpretability. However, systematic and full-scale tuning of the GA hyperparameters and discretization intervals was not conducted. Developing systematic procedures for configuring these settings and evaluating convergence and coverage of the feasible-solution space remains an important subject for future work.
Fourth, the results of the sensitivity analysis and clustering depend on the distribution of the dataset generated by the GA. Consequently, the principal drivers identified by the machine-learning model and the configuration of the illustrative solution archetypes may vary depending on the GA search settings, total-cost threshold, selected features, data scaling, clustering algorithm, and number of clusters. Although the leading SHAP drivers were stable under repeated subsampling, the exact ordering of mid- and lower-ranked features remained sample-dependent. Similarly, although the stability of the clustering results was examined across repeated initializations and alternative settings, k-means assignments are inherently affected by initialization, scaling, feature selection, and the specified number of clusters. The reported archetypes should therefore be interpreted as useful summaries of the generated feasible-solution space rather than as forecasts, probabilities, or uniquely correct partitions.
In addition, the realization-condition ranges reported for each cluster represent marginal distributions of individual parameters. A parameter value falling within a reported range does not, by itself, guarantee realization of the corresponding scenario because scenario realization may depend on interactions and combinations among multiple parameters. Future work should therefore investigate multivariate realization conditions that explicitly account for the joint distribution and interaction structure of the parameters.
Fifth, some candidate values used in the demonstration are derived from proprietary data and cannot be disclosed, and parameters with relatively minor influence are omitted from Table A5 for conciseness. Since the primary aim of this study is methodological verification rather than projection of a specific real-world case, these restrictions do not undermine the validity of the demonstration. Nevertheless, full reproducibility using the exact numerical values employed here is limited, and this limitation should be considered when interpreting the results.
Finally, uncertainty in the underlying input data is not comprehensively represented in the present demonstration. Errors or alternative assumptions concerning regional energy demand, technology costs, renewable-resource potentials, fuel prices, and CO2-storage availability could alter the total-cost distribution, SHAP rankings, and composition of the extracted archetypes. The robustness analyses conducted in this study quantify sensitivity to selected search, clustering, training-sample, and cost-threshold choices, but they do not constitute a comprehensive probabilistic propagation of input-data uncertainty. Accordingly, the numerical results should be interpreted as conditional outcomes under the hypothetical demonstration inputs rather than as probabilistic projections of the Kanto region in 2050.
Addressing these limitations comprehensively would not only strengthen the methodological contributions of this study but also provide a more robust foundation for applying energy supply–demand models to strategic decision-making toward net-zero carbon.
5. Conclusions
This study presented a novel analytical framework that generates diverse feasible solutions through a hierarchical method integrating a genetic algorithm (GA) and linear programming (LP), and organizes these solutions into illustrative solution archetypes by connecting explainable AI and clustering downstream.
The methodological contributions of this study are fourfold. First, the MGA-style motivation for diversity exploration was extended from equipment design to the exogenous assumption space. Second, the flexibility of upper-level exploration and the rigor of lower-level operational optimization were reconciled through hierarchical separation of GA and LP. Third, by using the generated diverse solution set as training data for sensitivity analysis, the framework enabled extraction of interaction structures that are difficult to capture using one-at-a-time approaches. Fourth, by incorporating clustering downstream, the framework established a step that compresses the diverse solution set into illustrative solution archetypes, transforming it into a form suitable for decision support.
In the demonstration under hypothetical conditions for the Kanto region in 2050 with a net-zero target, the proposed framework successfully executed the full analytical chain in an integrated manner. The GA–LP approach generated diverse feasible solutions with total costs at or below the prescribed threshold, and analysis of the novelty–cost relationship confirmed that structurally different alternatives exist within the admissible cost range, rather than only near the minimum-cost solution. SHAP analysis of the generated solution set identified the principal drivers of total cost and their interaction structures, while clustering organized the feasible solutions into five illustrative solution archetypes. Comparison among these scenarios identified foundational elements common across scenarios and variable elements that differed among them, indicating that pathways toward net-zero are not unique but may involve multiple feasible technology portfolios.
The principal contribution of this study lies not in numerical results for a specific case, but in extending energy supply–demand modeling into a decision-support-oriented analytical framework. As the present demonstration was conducted under hypothetical conditions, application under realistic conditions remains a subject for future work. Overall, this study presents a foundational methodology for examining long-term net-zero transitions under substantial uncertainty in underlying assumptions. Future application to real-world data and development of principled criteria for selecting model settings are expected to further strengthen the framework as a robust decision-support methodology.
Author Contributions
Conceptualization, R.G.; methodology, R.G.; software, R.G.; validation, R.G., W.S., Y.N. and T.M.; formal analysis, R.G.; investigation, R.G., W.S., Y.N. and T.M.; resources, R.G., W.S., Y.N. and T.M.; data curation, R.G., W.S., Y.N. and T.M.; writing—original draft preparation, R.G.; writing—review and editing, R.G., W.S., Y.N. and T.M.; visualization, R.G.; supervision, R.G.; project administration, R.G. All authors have read and agreed to the published version of the manuscript.
Funding
This research received no external funding.
Data Availability Statement
Conflicts of Interest
Wataru Sato, Yuuri Nagase, and Tomohiro Mizukami were employed by the company Tokyo Gas Co., Ltd. The remaining author, Ryosuke Gotoh, declares that the research was conducted in the absence of any commercial or financial relationships that could be construed as a potential conflict of interest.
Abbreviations
The following abbreviations are used in this manuscript:
| AIS | Artificial Immune System |
| BTG | Boiler-Turbine Generator |
| CAPEX | Capital Expenditure |
| CCS | Carbon Capture and Storage |
| CN | Carbon Neutrality |
| CO2 | Carbon Dioxide |
| DACCS | Direct Air Capture and Carbon Storage |
| DEAP | Distributed Evolutionary Algorithms in Python |
| DNE21+ | Dynamic New Earth 21 Plus |
| DR | Discount Rate |
| GA | Genetic Algorithm |
| GTCC | Gas-Turbine Combined-Cycle |
| H2 | Hydrogen |
| IEEJ-NE | Institute of Energy Economics, Japan—National Energy model |
| LP | Linear Programming |
| MGA | Modeling to Generate Alternatives |
| MILP | Mixed-Integer Linear Programming |
| O&M | Operation and Maintenance |
| OPEX | Operating Expenditure |
| PHS | Pumped Hydro Storage |
| PV | Photovoltaics |
| SHAP | SHapley Additive exPlanations |
| TIAM-UCL | TIMES Integrated Assessment Model—University College London |
Appendix A. Demonstration Setup Details
This appendix provides the detailed demonstration settings, which were reviewed in Section 2.5. The contents below describe the settings used to verify the proposed framework under hypothetical conditions for the Kanto region in 2050 with a net-zero target; they are not intended to forecast the actual future of the Kanto region, and some exogenous values and options use assumed values.
Appendix A.1. Analytical Scope and System Boundary
Because the proposed approach is intended for future application to decision support concerning the decarbonization strategies of firms, the Kanto region was selected as a specific area rather than the whole of Japan. The Kanto region is the largest demand area in Japan, accounting for approximately 30% of the country’s energy demand [25].
The permissive demonstration threshold for the year 2050 was set at 12 trillion JPY as the amount relevant to the present analysis. This value was set by estimating the share corresponding to the Kanto region from Japan’s assumed energy-related investment toward 2050.
The analysis horizon was set to one calendar year of 2050, with a temporal resolution of one hour. However, performing many simulations with hourly resolution over a full year (8760 time points) requires substantial computational time and resources. Because the principal aim of this study is to verify the effectiveness of the proposed approach rather than to perform a high-precision analysis, four representative weeks (672 time points) exhibiting characteristic electricity-demand and renewable-output profiles were extracted from one year of hourly data and used as the simulation input.
Although the Kanto region is the target area, this study aims to verify the proposed approach, and assumed values were used for some exogenous values and options. Figure 3 in Section 2.5 shows the energy flows of the energy supply–demand model constructed for the trial in this paper. Details of each component are described from Appendix A.2 onward. The various exogenous values and the candidates (options) for the assumptions targeted by combinatorial optimization in the energy supply–demand model were set on the basis of public information for the year 2050. The number of options for each assumption was set to two to five discrete values, taking into account the characteristics of each assumption. The unit construction cost of each newly installed facility [26,27] was also given as an option, so that a range of CAPEX could be obtained.
The principal sets and indices used in the modeling are summarized below.
Table A1.
Sets and indices.
Appendix A.2. Primary Energy
As shown in the left part of Figure 3, natural gas (LNG), coal, and oil are adopted as fossil fuels supplied through imports. The decarbonized fuels are e-methane, hydrogen, and ammonia, all of which are assumed to be derived from renewable energy. Import limits are imposed on the decarbonized fuels as follows.
where each symbol represents the following:
Table A2.
Primary energy and related symbols.
Appendix A.3. Secondary Energy and Energy Conversion
Appendix A.3.1. Thermal Power Generation
Gas-turbine combined-cycle generation (hereafter, GTCC) and conventional steam power (boiler-turbine generator, BTG) are the targeted thermal power technologies; GTCC is further classified into a conventional type and an advanced type. E-methane and hydrogen are permitted as substitute fuels for natural gas, and ammonia is permitted as a substitute for coal. The capacities of each facility were set as options by referring to public information from power utilities [28,29] and assuming future replacement and decommissioning plans of thermal power facilities based on the installed capacity and operating age as of 2024.
For GTCC, Equation (A4) gives the total fuel consumption, Equation (A5) gives the LNG consumption, and Equation (A6) gives the LNG consumption that accounts for the energy loss associated with CO2 capture.
For BTG, Equation (A7) gives total fuel consumption; Equation (A8) gives the residual fossil-fuel consumption obtained by subtracting the ammonia component from the total fuel consumption when NH3 co-firing is permitted; and Equation (A9) gives the fossil-fuel consumption that accounts for the energy loss associated with CO2 capture.
where each symbol represents the following:
Table A3.
Secondary energy and related symbols.
Appendix A.3.2. Variable Renewable Energy
The variable renewable energy (VRE) technologies considered are photovoltaics (PV), onshore wind, and offshore wind. PV includes both residential systems and utility-scale installations (mega-solar), while offshore wind includes both fixed-bottom and floating types.
The trends in generation per unit of installed capacity for PV and onshore wind were set on the basis of the 2023 hourly generation records for PV and onshore wind published by general transmission and distribution utilities [30]. For offshore wind, hourly generation and wind-speed records are scarce; therefore, the hourly output trend was assumed to be the same as that of onshore wind, while the capacity factors of onshore and offshore wind were set to 25.4% and 30%, respectively [26], and the per-unit output of offshore wind was set to 1.2 times that of onshore wind. The installed capacity of VRE was given as an option up to the deployment-potential ceiling.
Appendix A.3.3. Other Generation
Other generation technologies considered are nuclear, conventional hydropower, biomass, and geothermal. For nuclear power, no new construction is considered; the installed capacity in 2050 was given as an option based on existing restart and decommissioning plans [31]. Taking periodic inspections and similar factors into account, the capacity factor was held constant at 80%. For conventional hydropower, no new construction is considered, and the 2023 generation level is assumed to be maintained. For biomass and geothermal, the capacities are given as exogenous values that take deployment potential into account [32].
Appendix A.3.4. Sectors Outside the Scope of This Study
Although decarbonization of energy consumption in the iron-and-steel and chemical sectors is also expected to progress, sector coupling with electricity and heat demand is relatively weak in these sectors, and they are therefore not considered in this study. Energy consumption in the transport sector is likewise not considered, in order to simplify the model.
Appendix A.4. Energy Storage and Transport
The technologies considered for energy storage are batteries, pumped hydro storage (PHS), hydrogen production, and methanation.
The battery technology is assumed to be lithium-ion, and the installed capacity is given as an option. For PHS, no new construction is considered, and installed capacity is held at the 2023 level.
Hydrogen is produced by alkaline water electrolysis using surplus electricity from renewable energy, and the installed capacity is given as options. Methanation, in which the hydrogen produced is combined with CO2 from heat-demand emissions to produce methane, is also considered. The hydrogen and methane produced can be consumed as substitutes for natural gas in heat-demand sectors. The hydrogen produced is delivered to the demand side through newly built pipelines or by tank trucks, while methane is delivered through existing pipelines.
Appendix A.5. Final Energy Consumption
The final energy consumption considered in this study comprises electricity demand, residential heat demand, and low- and high-temperature heat demand for industrial uses such as factories.
For electricity demand, the 2023 area demand published by general transmission and distribution utilities, based on the “Approach to Disclosure of Grid Information” issued by METI and the Agency for Natural Resources and Energy, is used as the hourly supply–demand record [30]. A constraint requiring the instantaneous balance of electricity supply and demand within the Kanto region is imposed. Inter-regional electricity interconnection is not considered. From the perspective of regional analysis accuracy, the inclusion of inter-regional interconnections would be desirable; however, this study prioritized reduced computational load and focused on the Kanto region. Constraints on intra-regional power flow are also not taken into account.
Heat demand is divided into three categories—residential, low-temperature industrial heat demand (below 150 °C), and high-temperature industrial heat demand (at or above 150 °C)—and assumed values are assigned to each. The residential sector consumes natural gas (city gas) and oil as primary energy; the industrial sector consumes natural gas, oil, and coal. An electrification rate of 0–100% is given as options for each heat demand, and the energy corresponding to the electrified portion is added to the electricity-demand profile.
where each symbol represents the following:
Table A4.
Demand and related symbols.
Appendix A.6. CO2 Emission, Capture, and Storage
In this demonstration, achieving net-zero carbon by 2050 was set as the condition to be solved as an inverse problem. CO2 emitted in association with primary energy consumption in thermal power generation and in low- and high-temperature heat demand can be captured by capture equipment, and the captured CO2 is stored underground. As described in Appendix A.4, CO2 from heat demand can also be utilized for methanation. For each of thermal power generation, low-temperature heat demand, and high-temperature heat demand, the CO2-capture installation rate and the capture efficiency are given as options. CO2 released from each energy-consumption source into the atmosphere is captured and stored by direct air capture with carbon storage (DACCS) so as to satisfy net-zero CO2 emissions. CO2 capture and storage costs are included in OPEX.
Appendix A.7. Candidate Values of Assumptions
Table A5 summarizes the representative assumptions used in this demonstration, together with their candidate values and sources. Because the model contains a larger set of input parameters than can be concisely tabulated, Table A5 reports only those parameters considered most relevant to the analysis presented in Section 3. Two categories of parameters are omitted from the table: (i) parameters of minor influence on the principal results, and (ii) a subset of parameters derived from proprietary data provided by the partner company under a non-disclosure agreement. Parameters in category (i) were classified as minor when preliminary tests confirmed that variation within plausible ranges produced negligible changes in total cost relative to the parameters listed in Table A5. The omissions do not affect methodological verification, which is the principal aim of this study (see Section 1.3 and Section 4.3); equivalent verification can be carried out using publicly available substitutes for the proprietary values. Each listed assumption was set as either a constant or as two to five discrete values.
Table A5.
Representative parameters and candidate values.
Table A6.
Data sources and processing for the hypothetical demonstration.
Appendix B. Detailed Cluster Analysis
This appendix presents a detailed analysis of each cluster summarized in Table 2 of Section 3.3. The contents below are results obtained in the present demonstration and do not constitute universal claims under realistic conditions.
Appendix B.1. Clustering Settings
- (1)
- Five explanatory variables were selected for clustering: the newly built capacity of high-efficiency GTCC, the newly built capacity of PV, the newly built capacity of offshore wind, the newly built capacity of Li-ion batteries, and the upper limit of CO2 storage.
- (2)
- Each explanatory variable was standardized (mean 0, standard deviation 1).
- (3)
- The k-means method was applied with the number of clusters set to k = 5.
- (4)
- For each cluster, the cluster center, the parameter mean values, the total-cost distribution, the time-series operational pattern of the representative individual, and the range of realization conditions with respect to threshold variation were computed.
Appendix B.2. Equipment-Configuration Details
Figure 10 in Section 3.3 shows the heatmap of standardized mean values of the principal parameters by cluster. The equipment-configuration characteristics of each cluster are as follows.
- Cluster 0: The newly built capacity of PV is markedly positive relative to the overall mean, whereas the newly built capacity of offshore wind is negative; the newly built capacity of Li-ion batteries is slightly positive, and the upper limit of CO2 storage is negative. In other words, this cluster deploys PV relatively heavily while keeping reliance on offshore wind low and combining a moderate amount of battery storage.
- Cluster 1: The newly built capacity of offshore wind is positive, whereas the newly built capacities of PV and Li-ion batteries and the upper limit of CO2 storage are negative; the newly built capacity of high-efficiency GTCC is approximately at the overall mean. That is, the cluster keeps PV and battery storage modest and centers on offshore wind as the principal supply technology.
- Cluster 2: The newly built capacity of Li-ion batteries stands out as substantially higher than in the other clusters; the newly built capacity of PV is low, and the newly built capacity of high-efficiency GTCC is slightly positive. This cluster places relatively strong emphasis on securing flexibility through battery storage.
- Cluster 3: The newly built capacity of high-efficiency GTCC is markedly negative, while both the newly built capacity of offshore wind and the upper limit of CO2 storage are positive, and the newly built capacity of PV is approximately at the overall mean. That is, this cluster suppresses dependence on GTCC while securing relatively large amounts of offshore wind and CO2 storage capacity.
- Cluster 4: Both the newly built capacity of high-efficiency GTCC and the upper limit of CO2 storage are positive, whereas PV, offshore wind, and Li-ion batteries are all slightly below the overall mean. This cluster is realized through a combination of high-efficiency GTCC and CO2 storage capacity.
Appendix B.3. Operational-Pattern Details
Figure A1 shows the output composition by power source over the representative time series for the individual at the center of each cluster. The horizontal axis is time, and the vertical axis is the output [MW] at each time step. Colored stacked areas represent the output of each generation source and the discharge of each storage facility, and the dotted red line indicates demand.
The operational characteristics of each cluster are as follows.
- Cluster 0: PV output appears repeatedly as sharp peaks during the daytime, with PV covering a substantial portion of daytime demand, while shortfalls are complemented by GTCC and battery storage. The operational pattern thus involves residual-demand balancing by thermal power and battery storage superimposed on a PV-centered supply structure.
- Cluster 1: The contribution of PV is relatively small; offshore wind generates relatively continuous output across all time periods, and GTCC covers the residual demand. The operational pattern is one in which offshore wind serves as the principal source while thermal power performs supply–demand adjustment.
- Cluster 2: The output contribution of Li-ion batteries is larger than in the other clusters and is observed to support load-following by smoothing fluctuations from renewables and thermal power. Rather than large-scale variable renewable sources themselves, the provision of flexibility through battery storage plays the central role in operation.
- Cluster 3: The contribution of GTCC is suppressed, while the combination of offshore wind and PV forms the core of supply–demand balancing, indicating a high degree of reliance on variable renewables in the supply structure. Coverage of residual demand is provided by limited GTCC and a portion of battery storage.
- Cluster 4: The contribution of GTCC is relatively substantial and stably supports the residual demand across time periods. PV and offshore wind also contribute to a certain extent, but reliance on variable renewables is not as pronounced as in Cluster 0 or Cluster 3, with GTCC playing the central role in supply–demand adjustment.
Figure A1.
Time-series power-dispatch patterns of representative individuals by cluster. The horizontal axis shows time, and the vertical axis shows output [MW]. Colored stacked areas represent the output or discharge of each technology, and the dotted red line indicates electricity demand. The figure illustrates how differences in equipment configuration across clusters are reflected in distinct operational patterns of supply–demand balancing.
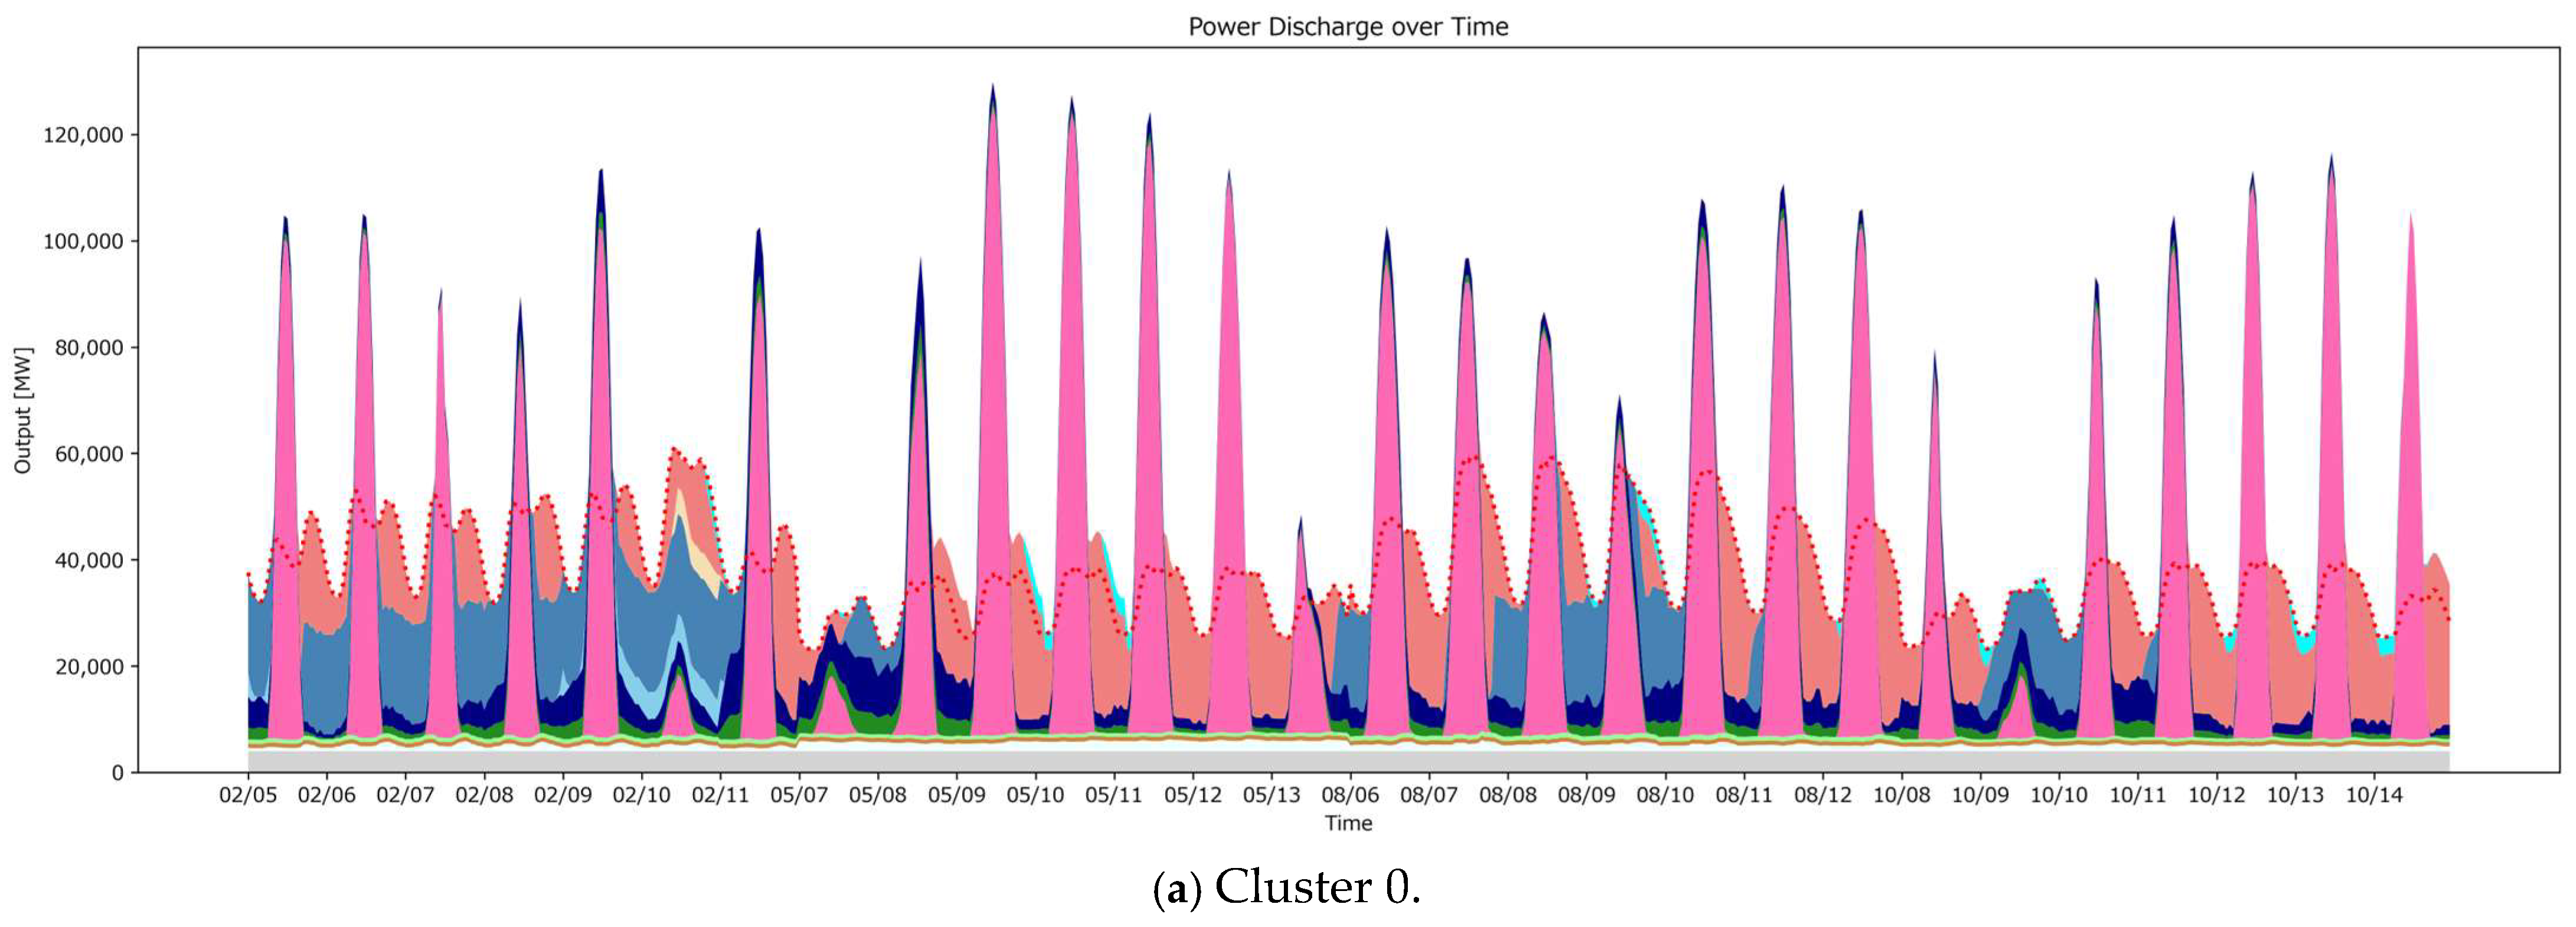
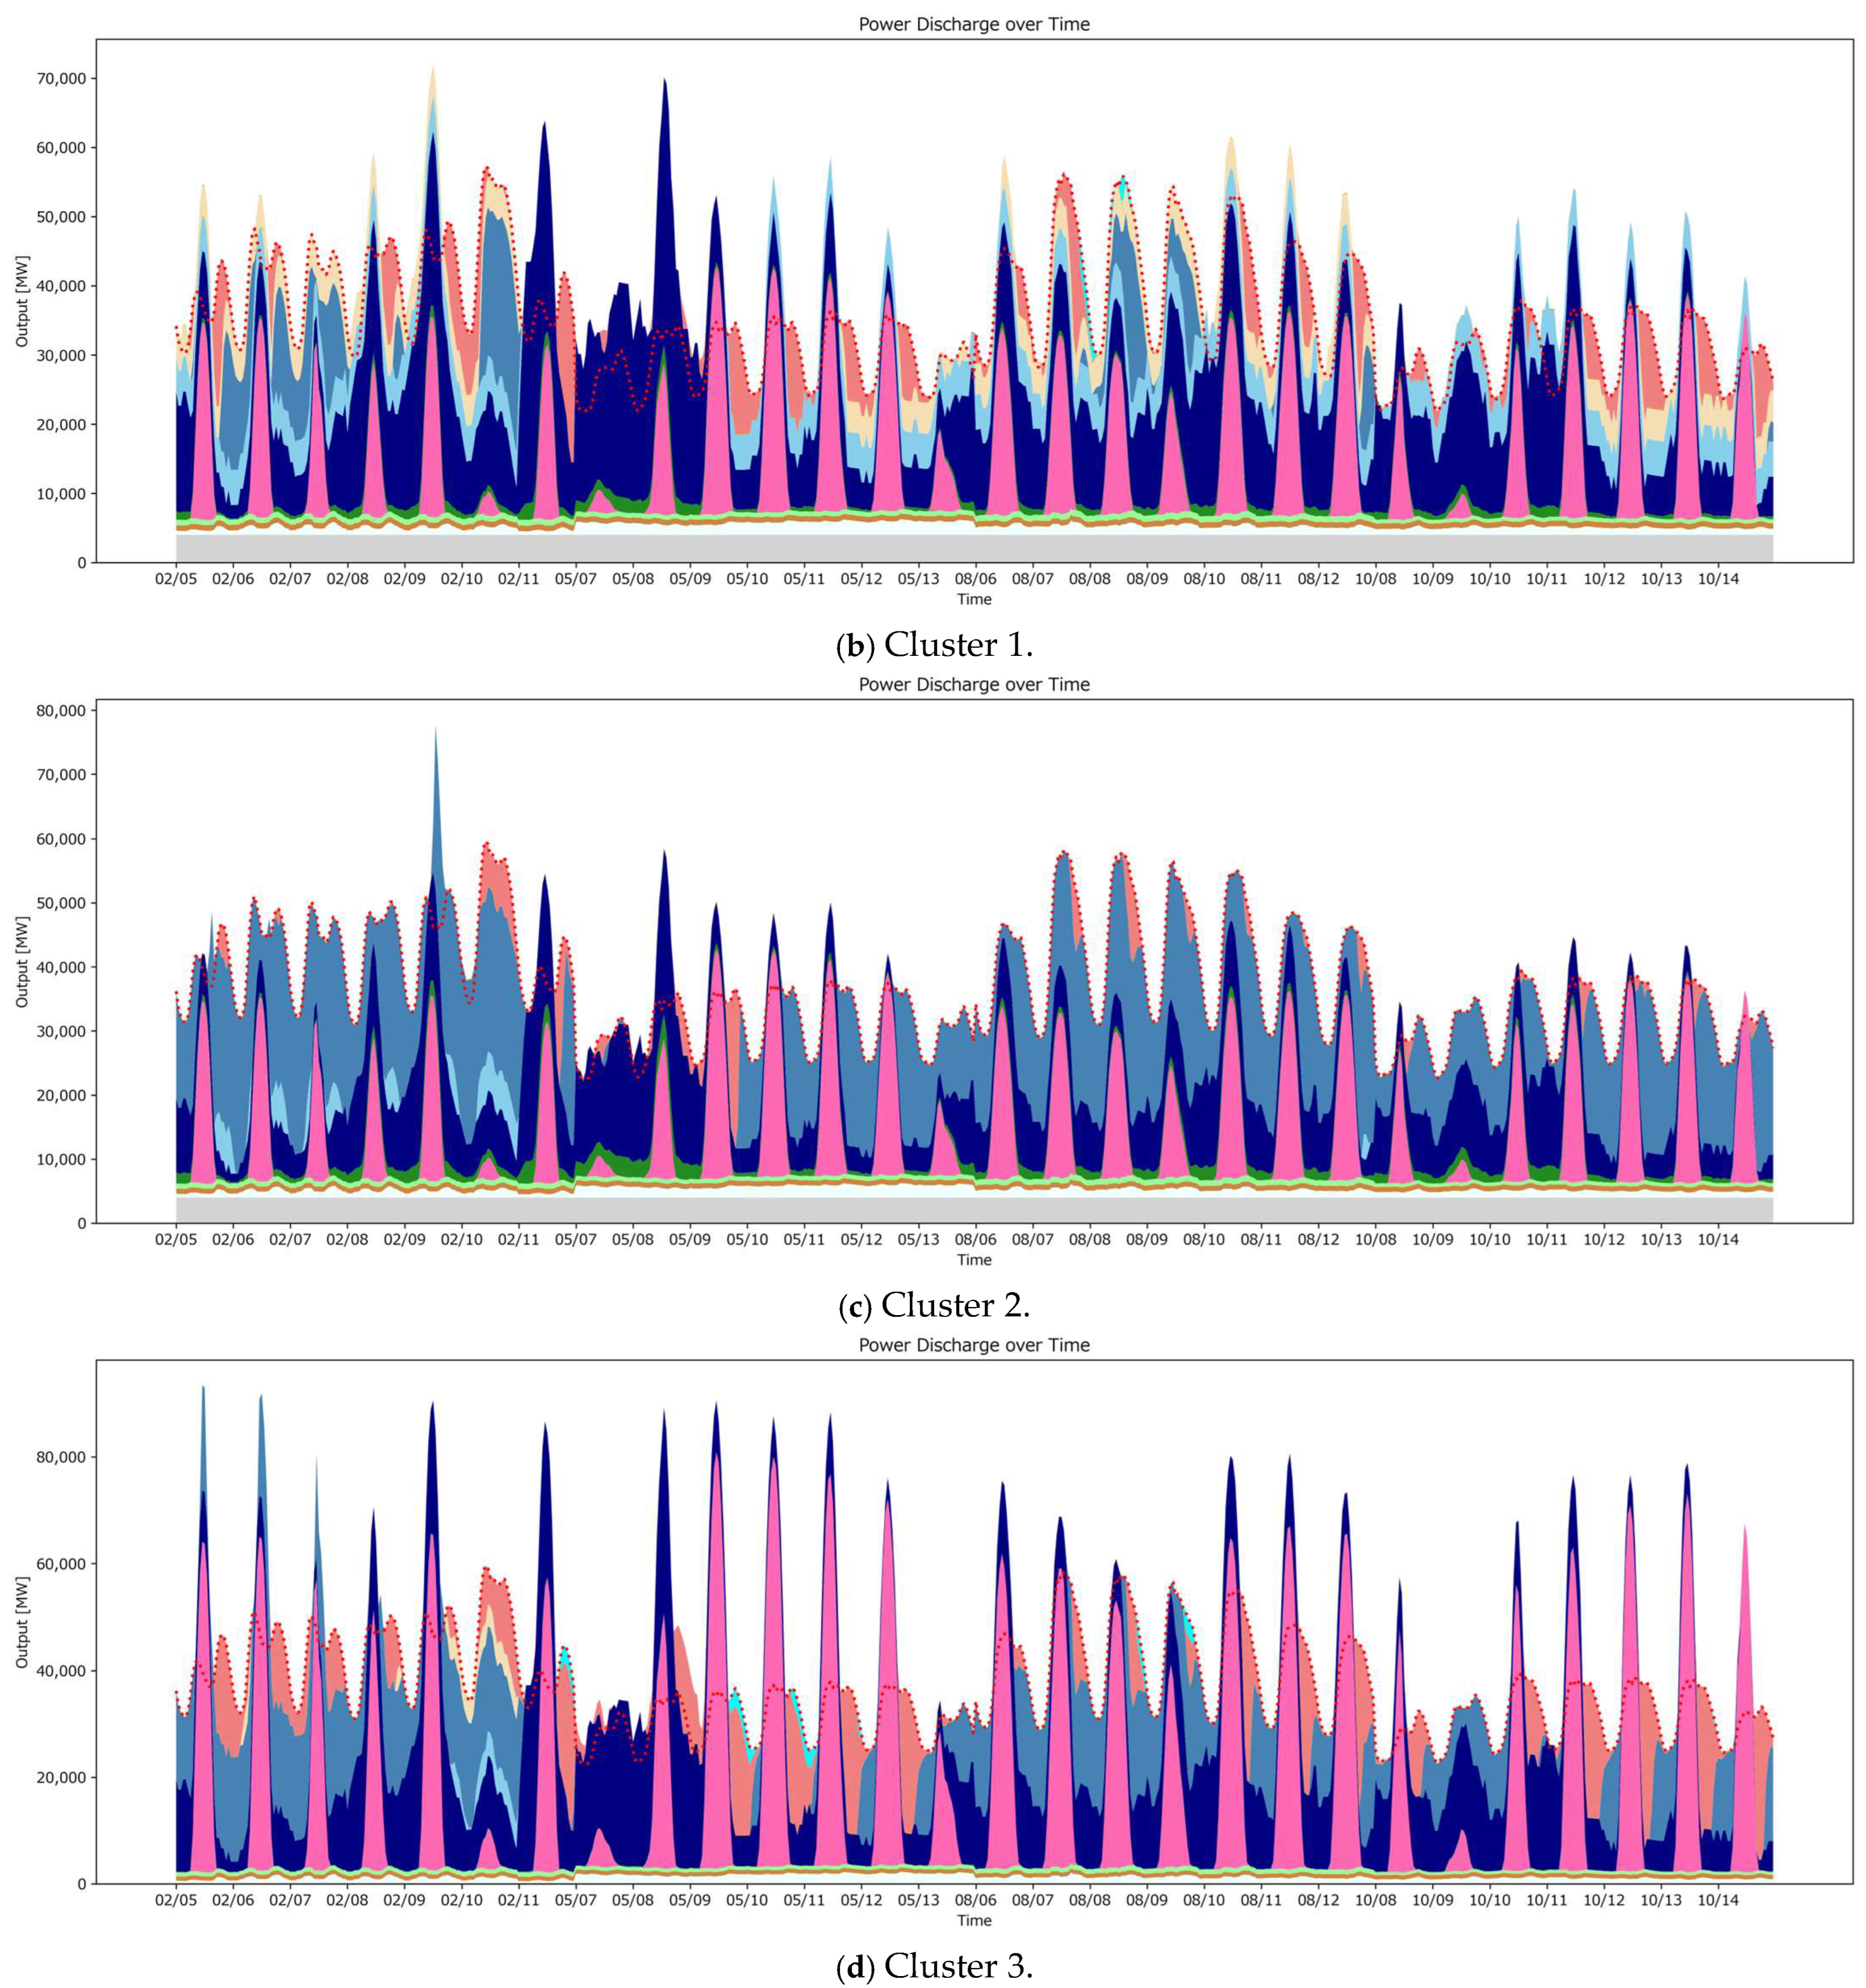
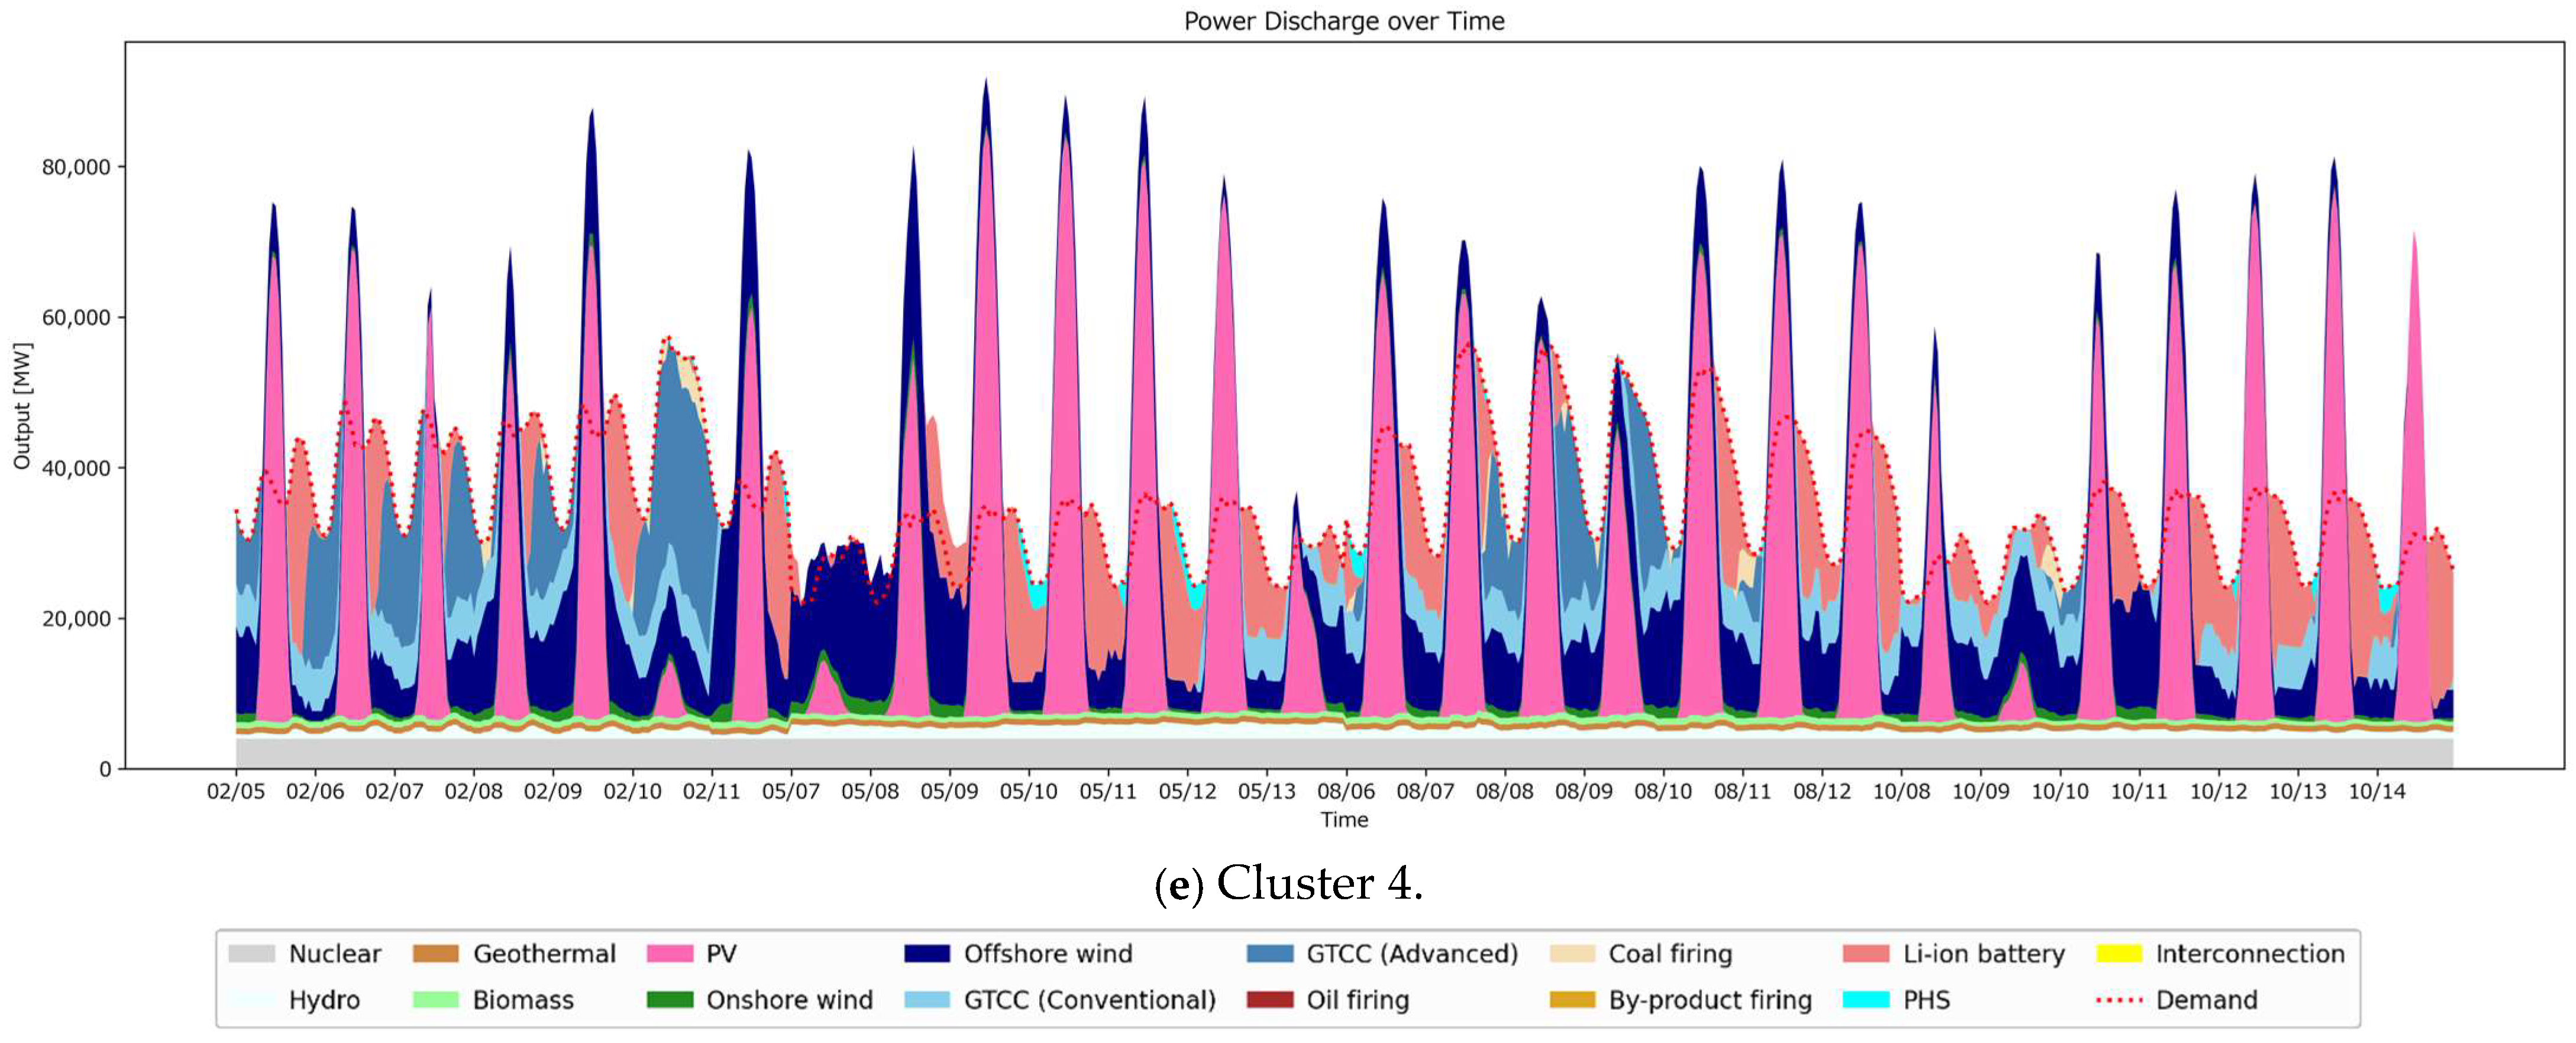
Appendix B.4. Range of Feasible Conditions Under Threshold Variation
Figure A2, Figure A3, Figure A4, Figure A5 and Figure A6 show, for each cluster, how the feasible ranges of principal parameters related to external factors change as the total-cost threshold varies. The ranges shown here aggregate the minimum, median, maximum, and mean of each parameter across the individuals realized below the threshold; a value falling within the indicated range does not in itself guarantee that individuals exist. In addition, because the number of realized individuals decreases as the threshold is tightened, some median values may exhibit instability due to small sample sizes. With these caveats in mind, these figures should be interpreted as conveying the directions in which conditions tend to be required for each type to be realized at lower cost.
Appendix B.4.1. Tendencies Common Across All Clusters
The most clearly evident common tendency across all clusters concerns the H2 price. As the total-cost threshold is tightened, the maximum H2 price decreases in many clusters, and the mean decreases continuously. That is, the H2 price is a representative constraint that influences low-cost realization across all types.
Appendix B.4.2. Cluster-Specific Characteristics
- Cluster 0: The realization ranges of the construction costs of PV and Li-ion batteries tend to narrow, suggesting that, for the PV-led type to be realized at low cost, relatively low deployment costs of PV and battery storage are important.
- Cluster 1: The narrowing of the range of construction costs of offshore wind is particularly pronounced; for the offshore wind-led type, the cost of offshore wind acts as a decisive constraint.
- Cluster 2: The realization ranges of the construction costs of Li-ion batteries and offshore wind tend to narrow, indicating that, in addition to the cost on the flexibility-provision side, the cost on the renewables side is also important for realizing the battery-centric type at low cost.
- Cluster 3: In addition to the H2 price, multiple fuel prices and construction costs—including the e-methane price, the NH3 price, the construction cost of offshore wind, and the construction cost of Li-ion batteries—are simultaneously narrowed; this cluster therefore faces more multifaceted constraints for low-cost realization than the other clusters.
- Cluster 4: The narrowing of the H2 price range is the most pronounced, whereas relatively wide ranges are admissible for the other parameters; in the GTCC plus CO2 storage type, the H2 price appears to act as the dominant constraint.
Figure A2.
Feasible ranges of representative parameters for Cluster 0 under varying total-cost thresholds. The horizontal axis shows the total-cost threshold, and the vertical axis shows the value of each parameter. The lines indicate the minimum, median, maximum, and mean values among feasible individuals in Cluster 0.
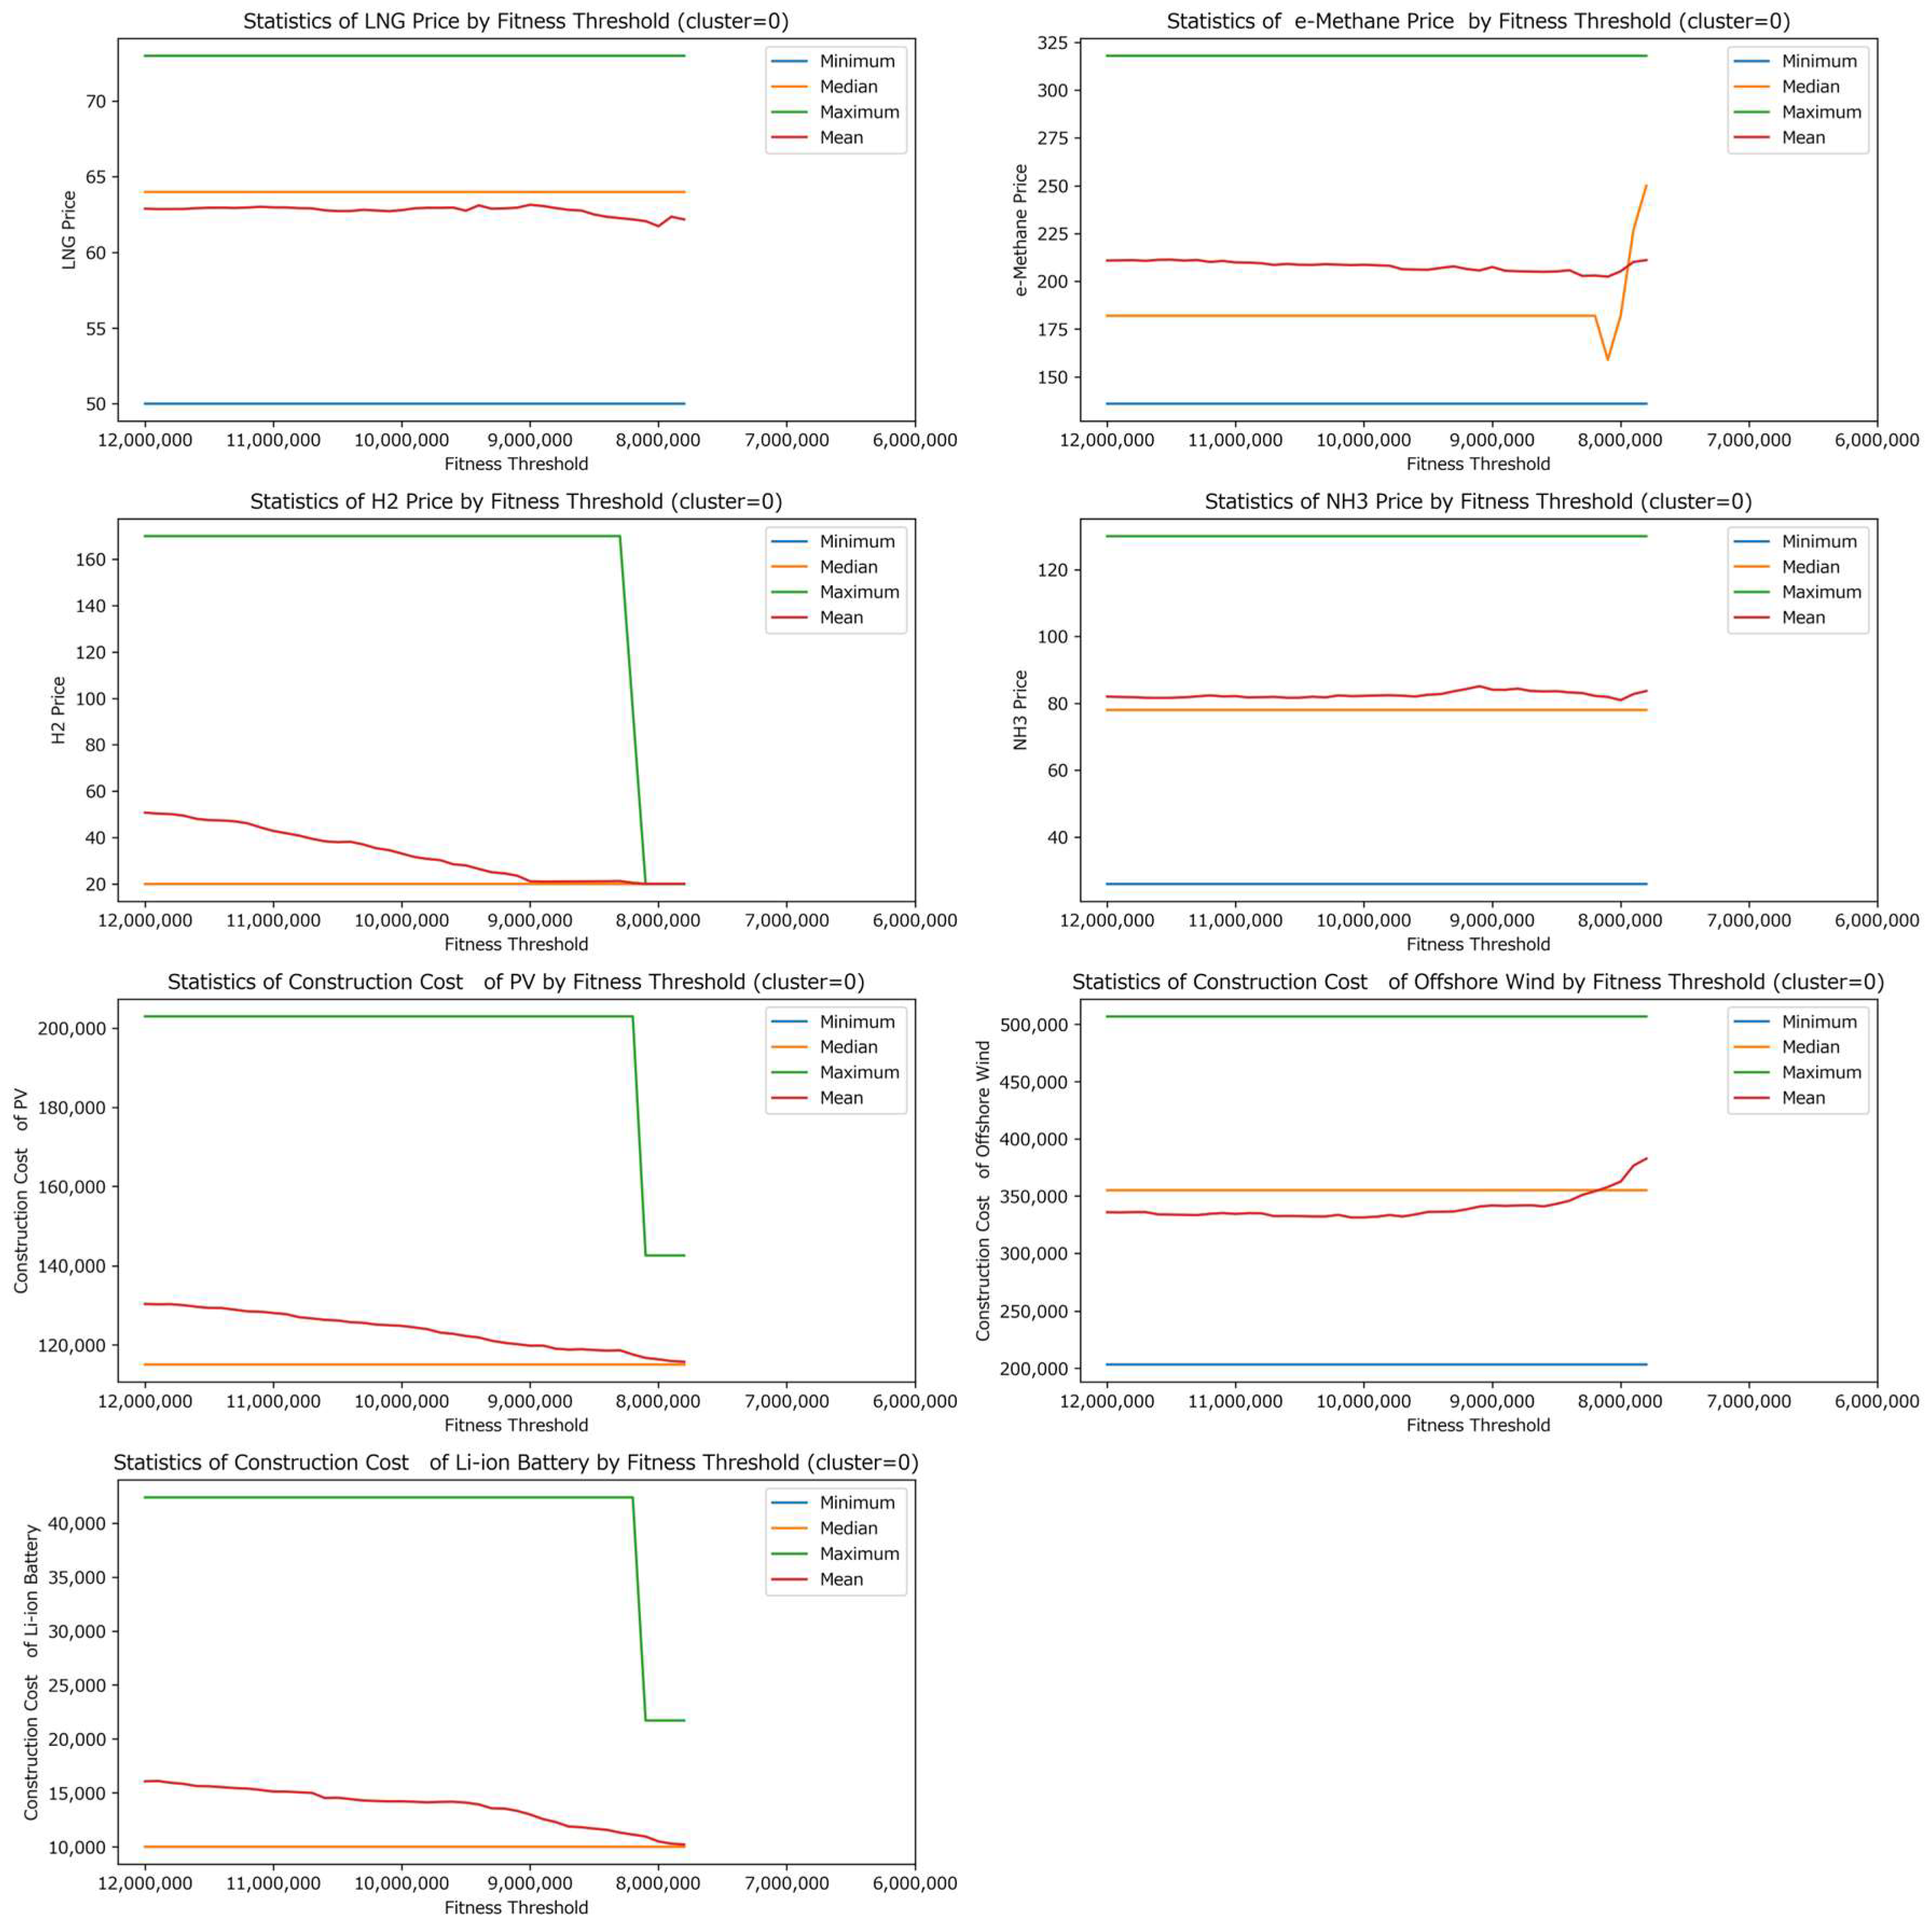
Figure A3.
Feasible ranges of representative parameters for Cluster 1 under varying total-cost thresholds. The horizontal axis shows the total-cost threshold, and the vertical axis shows the value of each parameter. The lines indicate the minimum, median, maximum, and mean values among feasible individuals in Cluster 1.
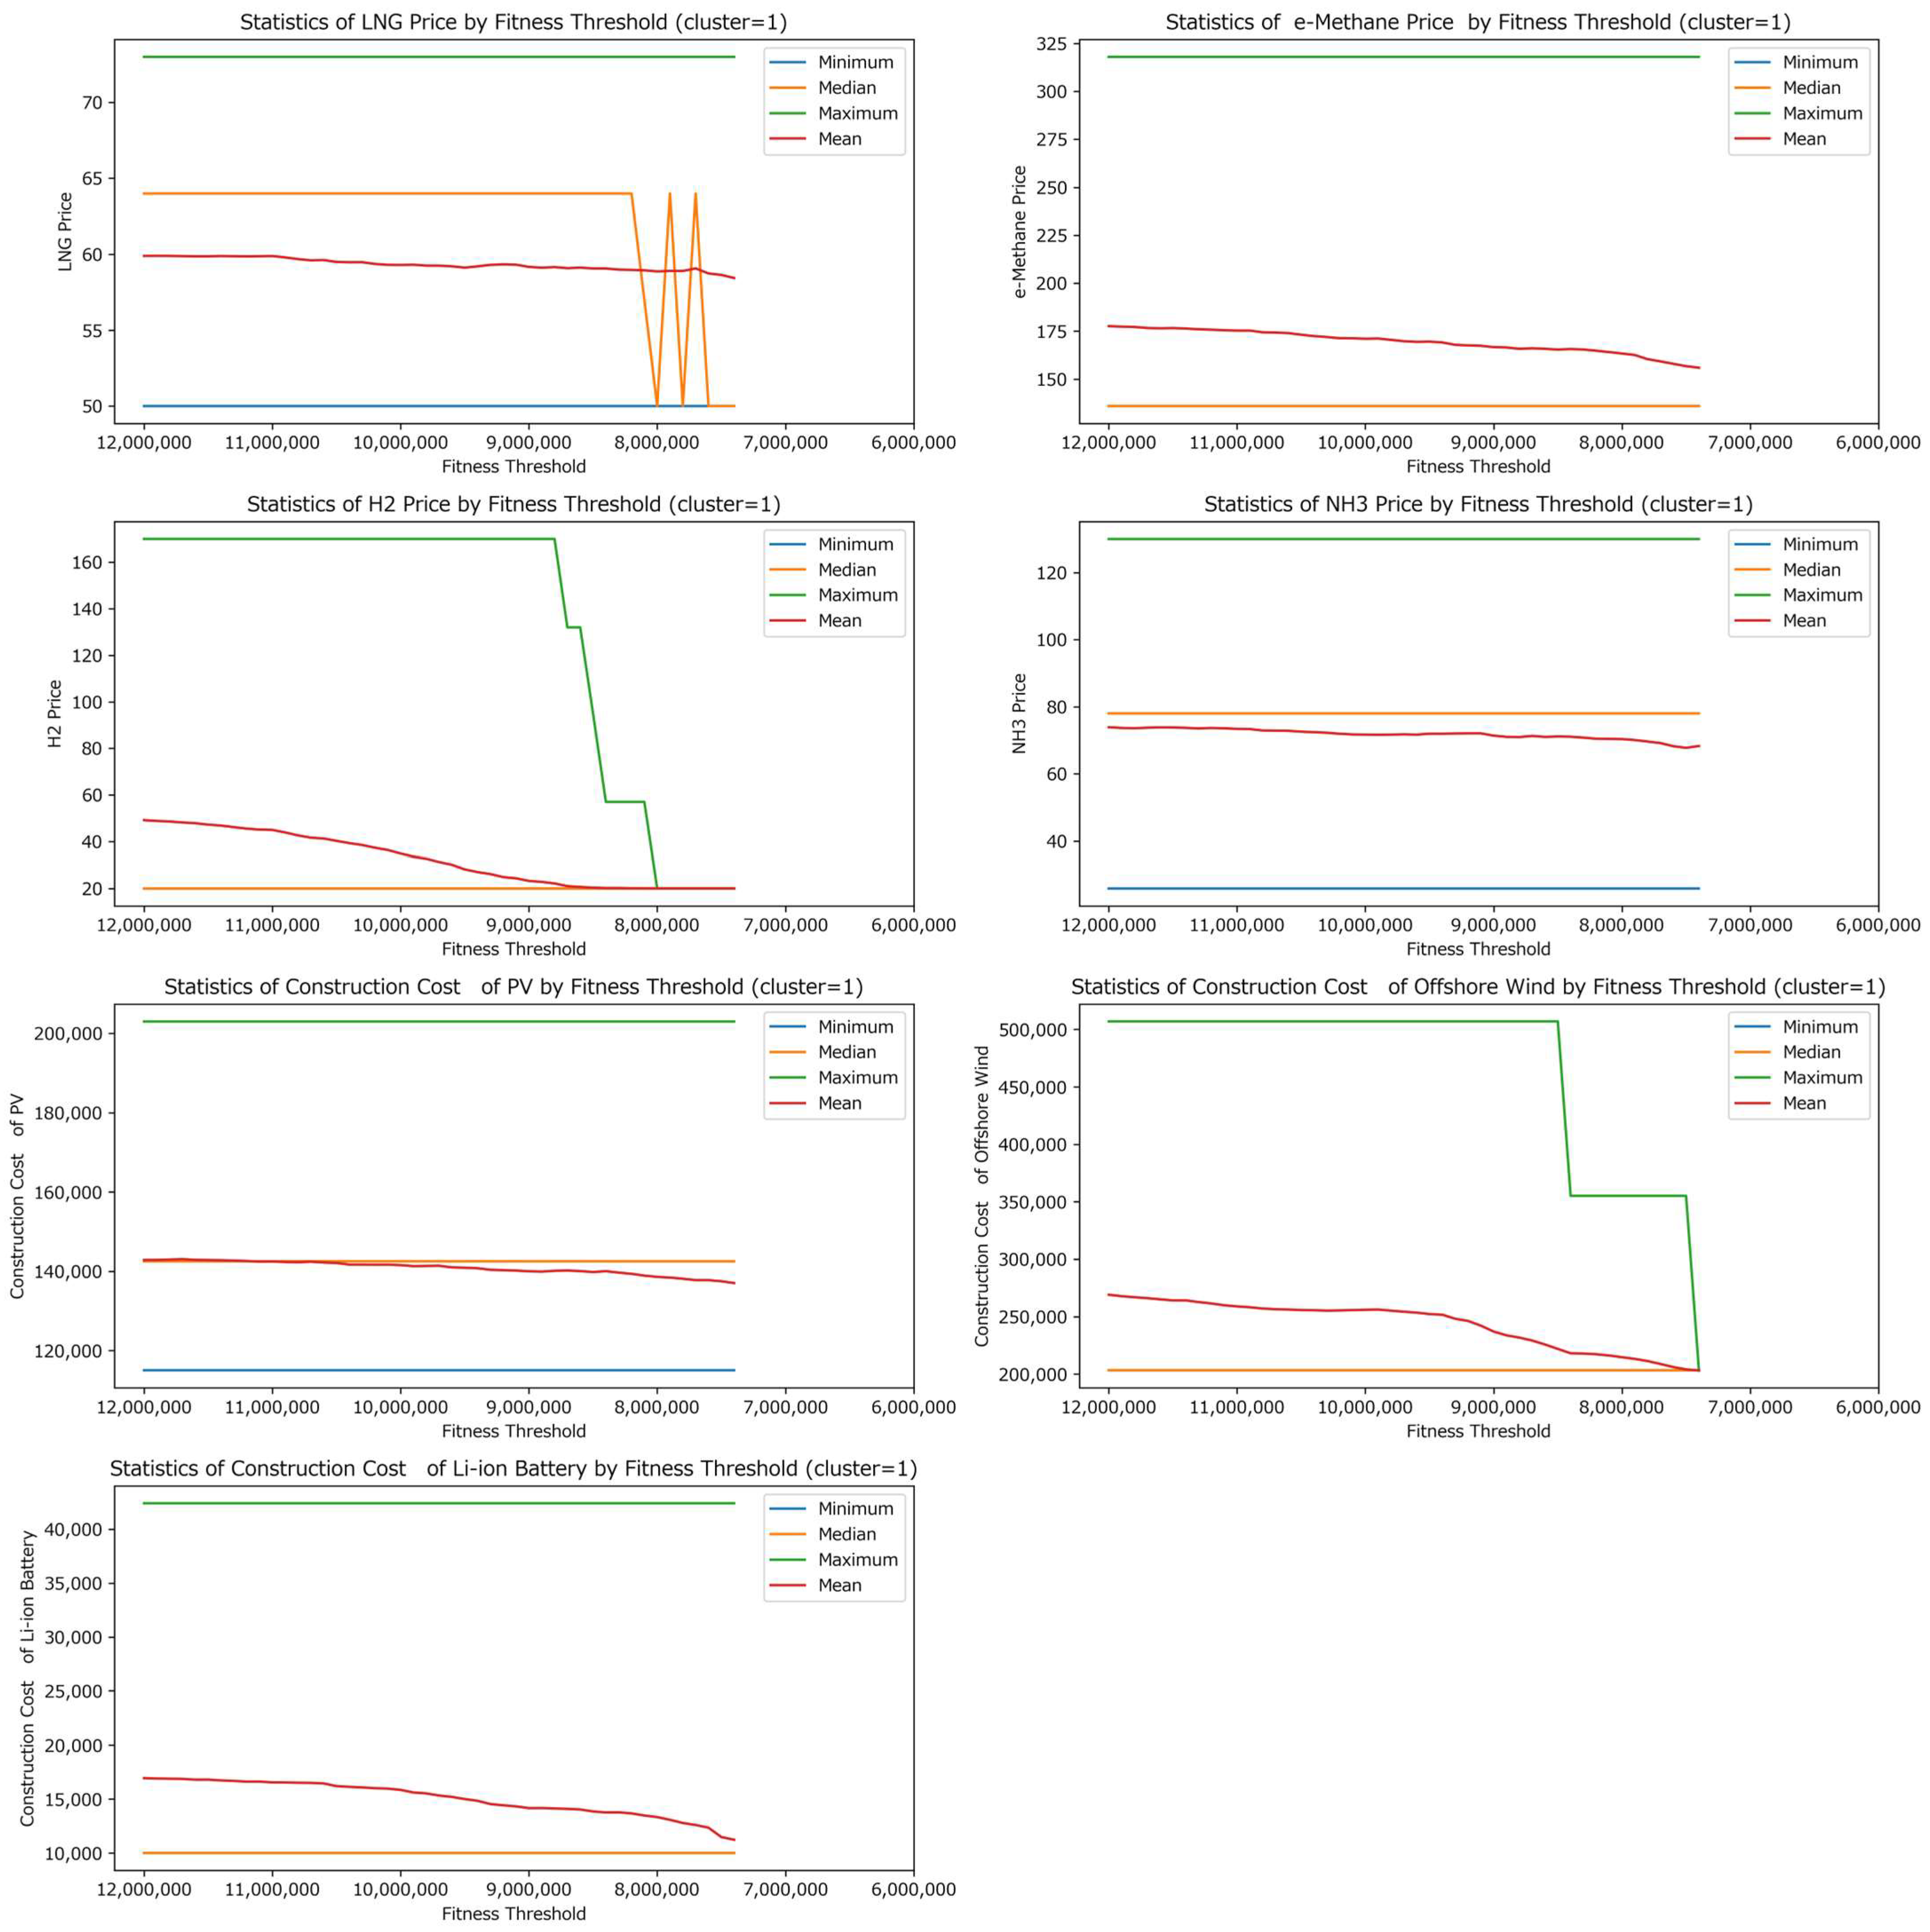
Figure A4.
Feasible ranges of representative parameters for Cluster 2 under varying total-cost thresholds. The horizontal axis shows the total-cost threshold, and the vertical axis shows the value of each parameter. The lines indicate the minimum, median, maximum, and mean values among feasible individuals in Cluster 2.
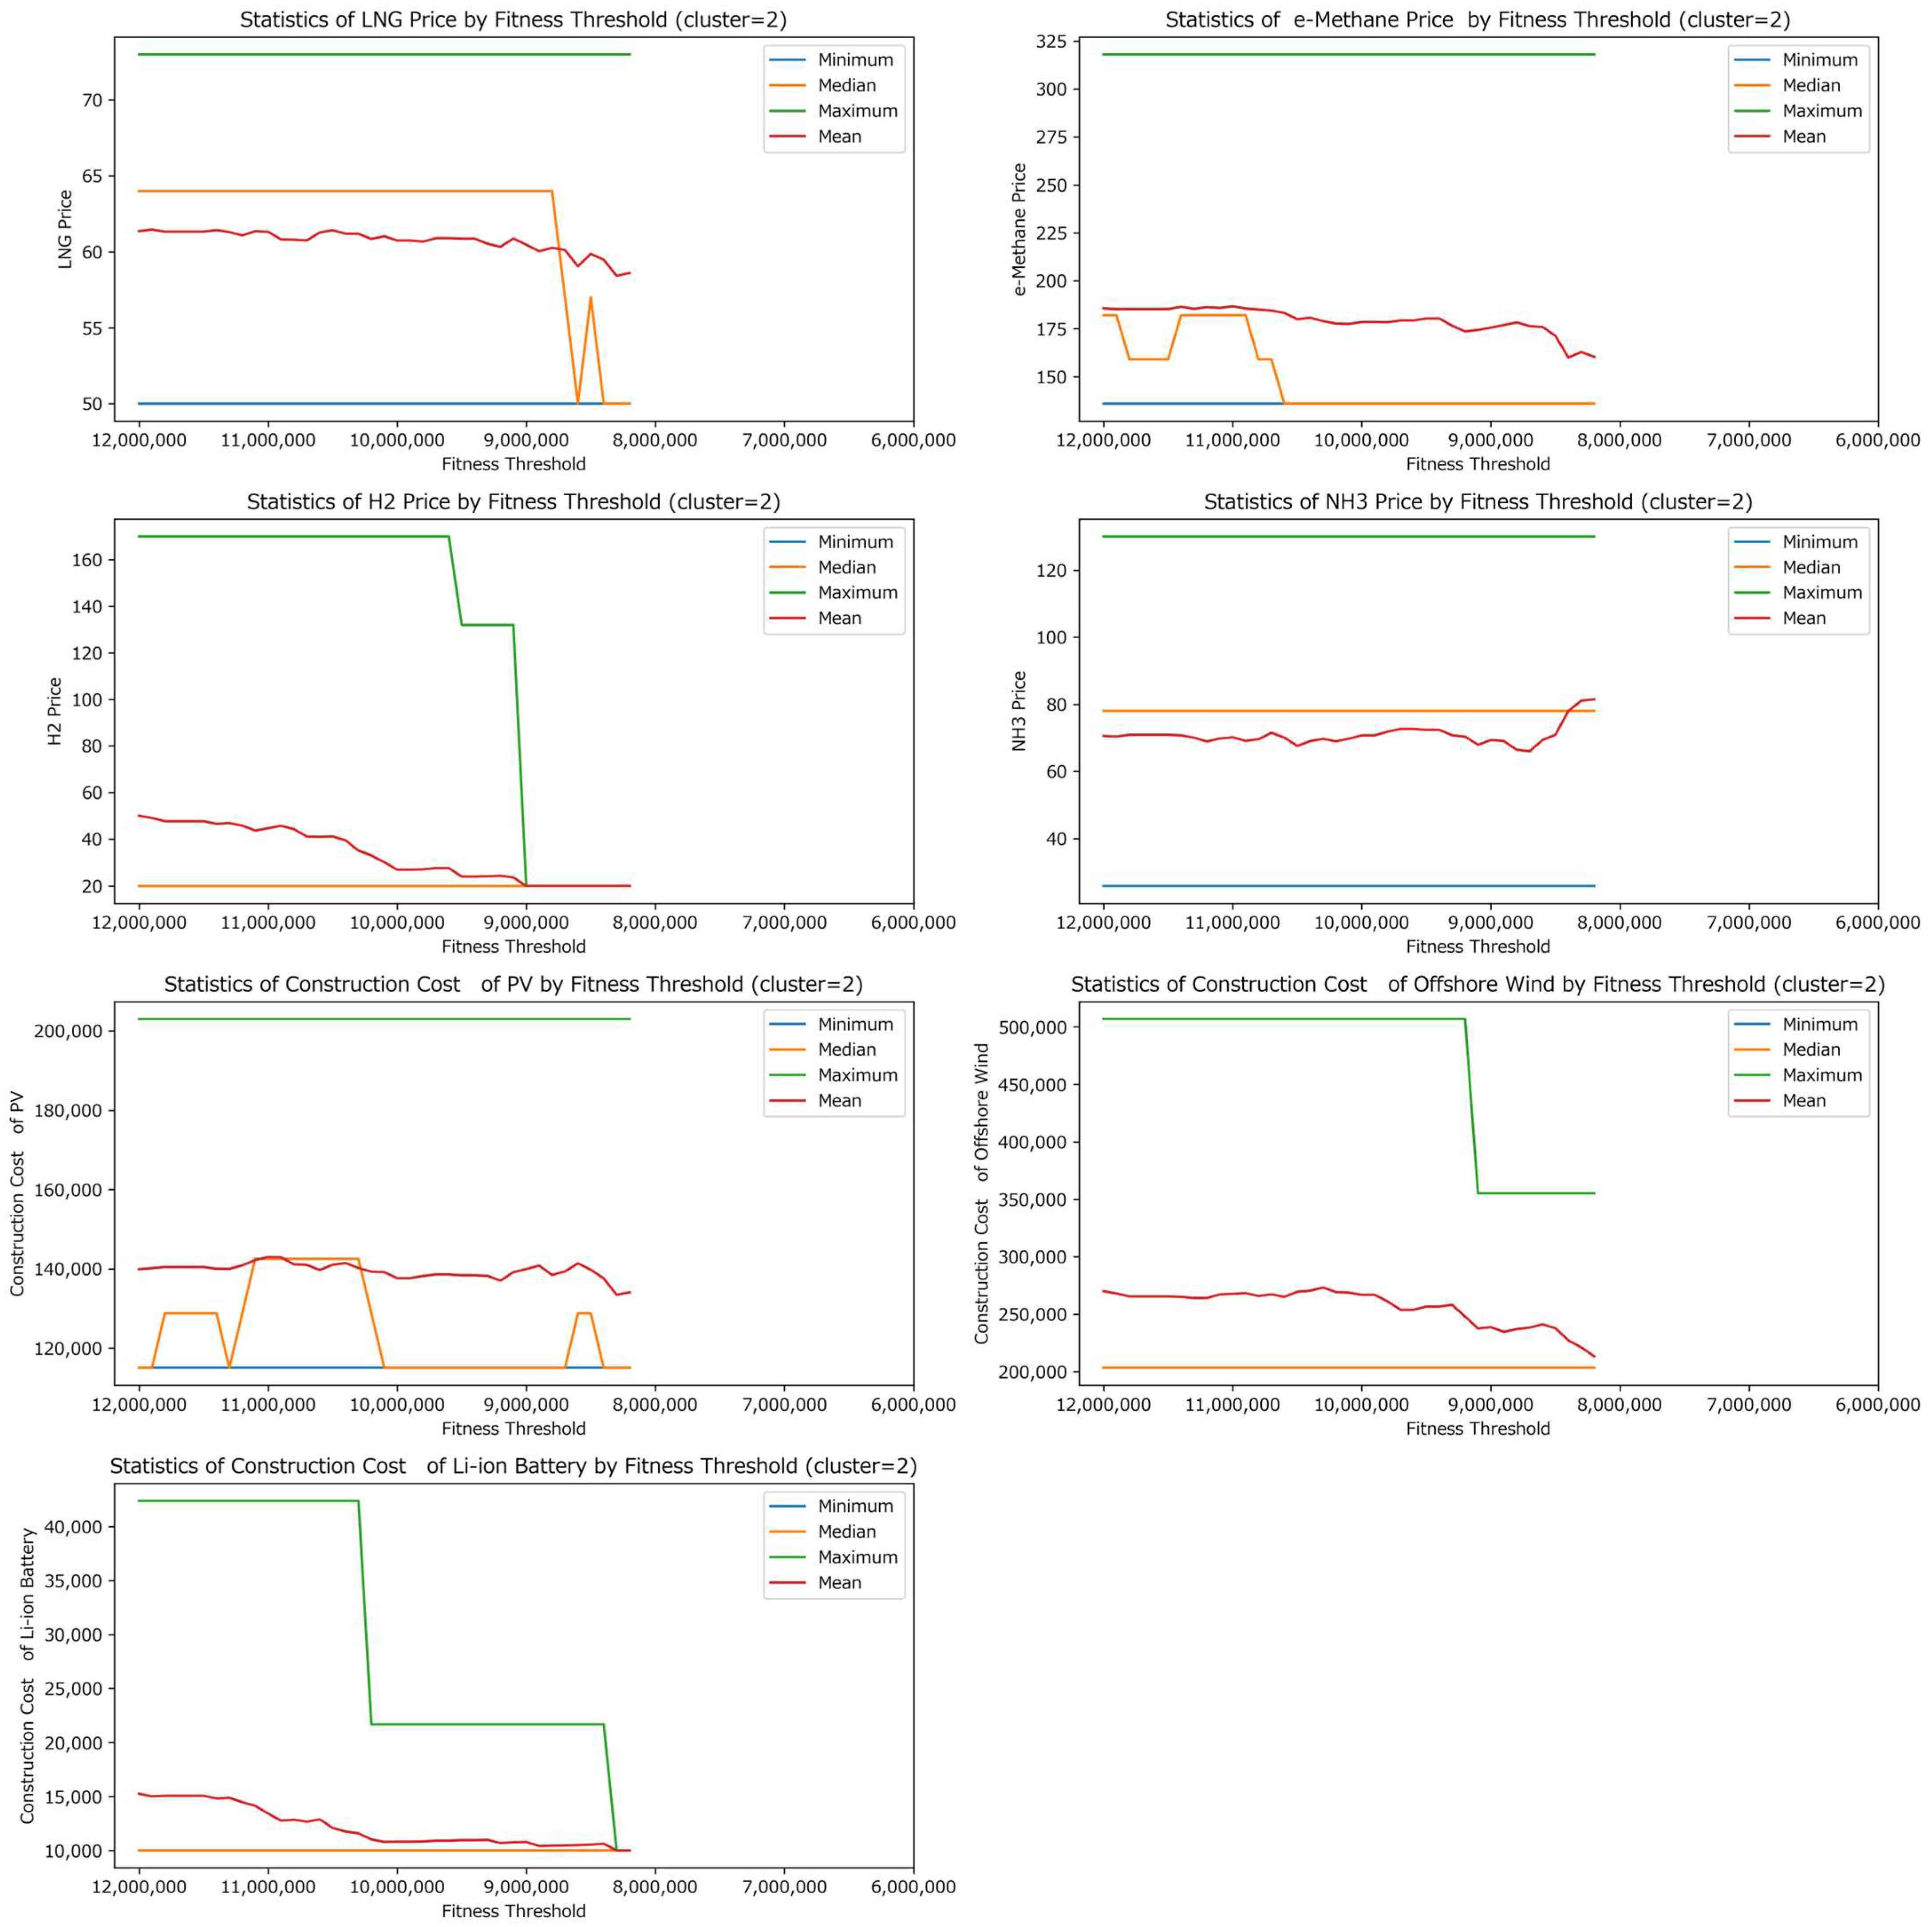
Figure A5.
Feasible ranges of representative parameters for Cluster 3 under varying total-cost thresholds. The horizontal axis shows the total-cost threshold, and the vertical axis shows the value of each parameter. The lines indicate the minimum, median, maximum, and mean values among feasible individuals in Cluster 3.
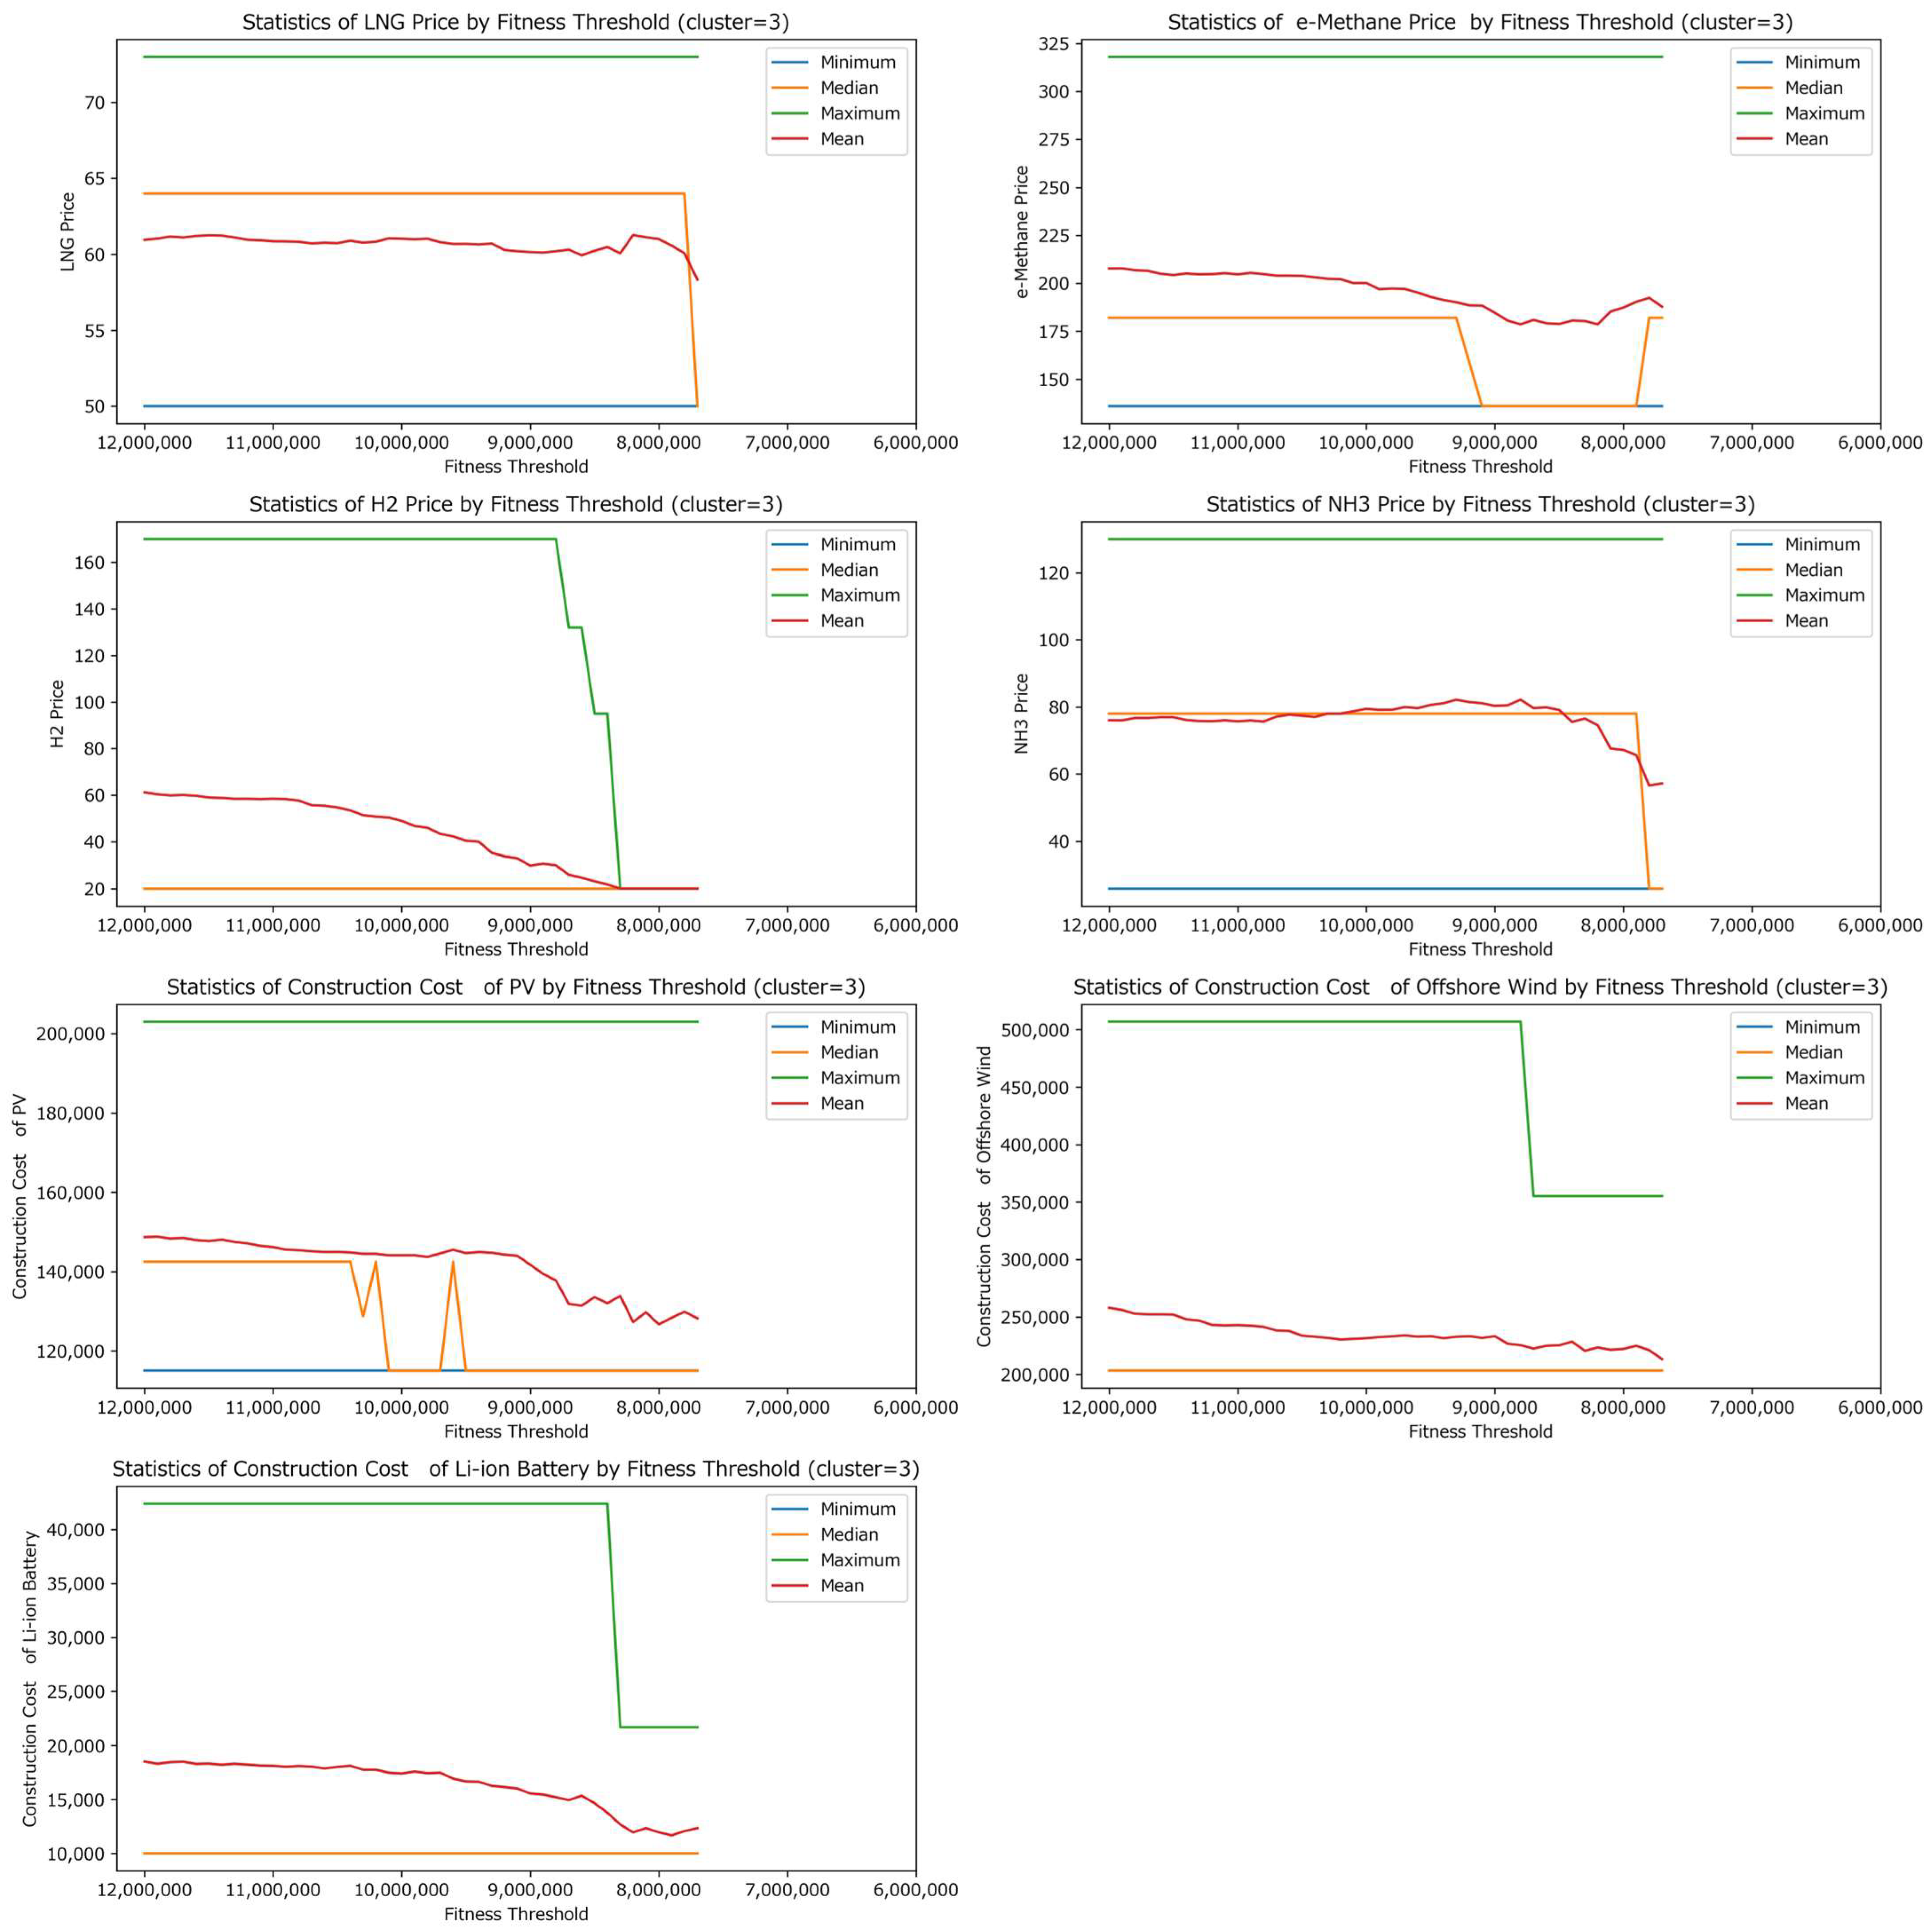
Figure A6.
Feasible ranges of representative parameters for Cluster 4 under varying total-cost thresholds. The horizontal axis shows the total-cost threshold, and the vertical axis shows the value of each parameter. The lines indicate the minimum, median, maximum, and mean values among feasible individuals in Cluster 4.
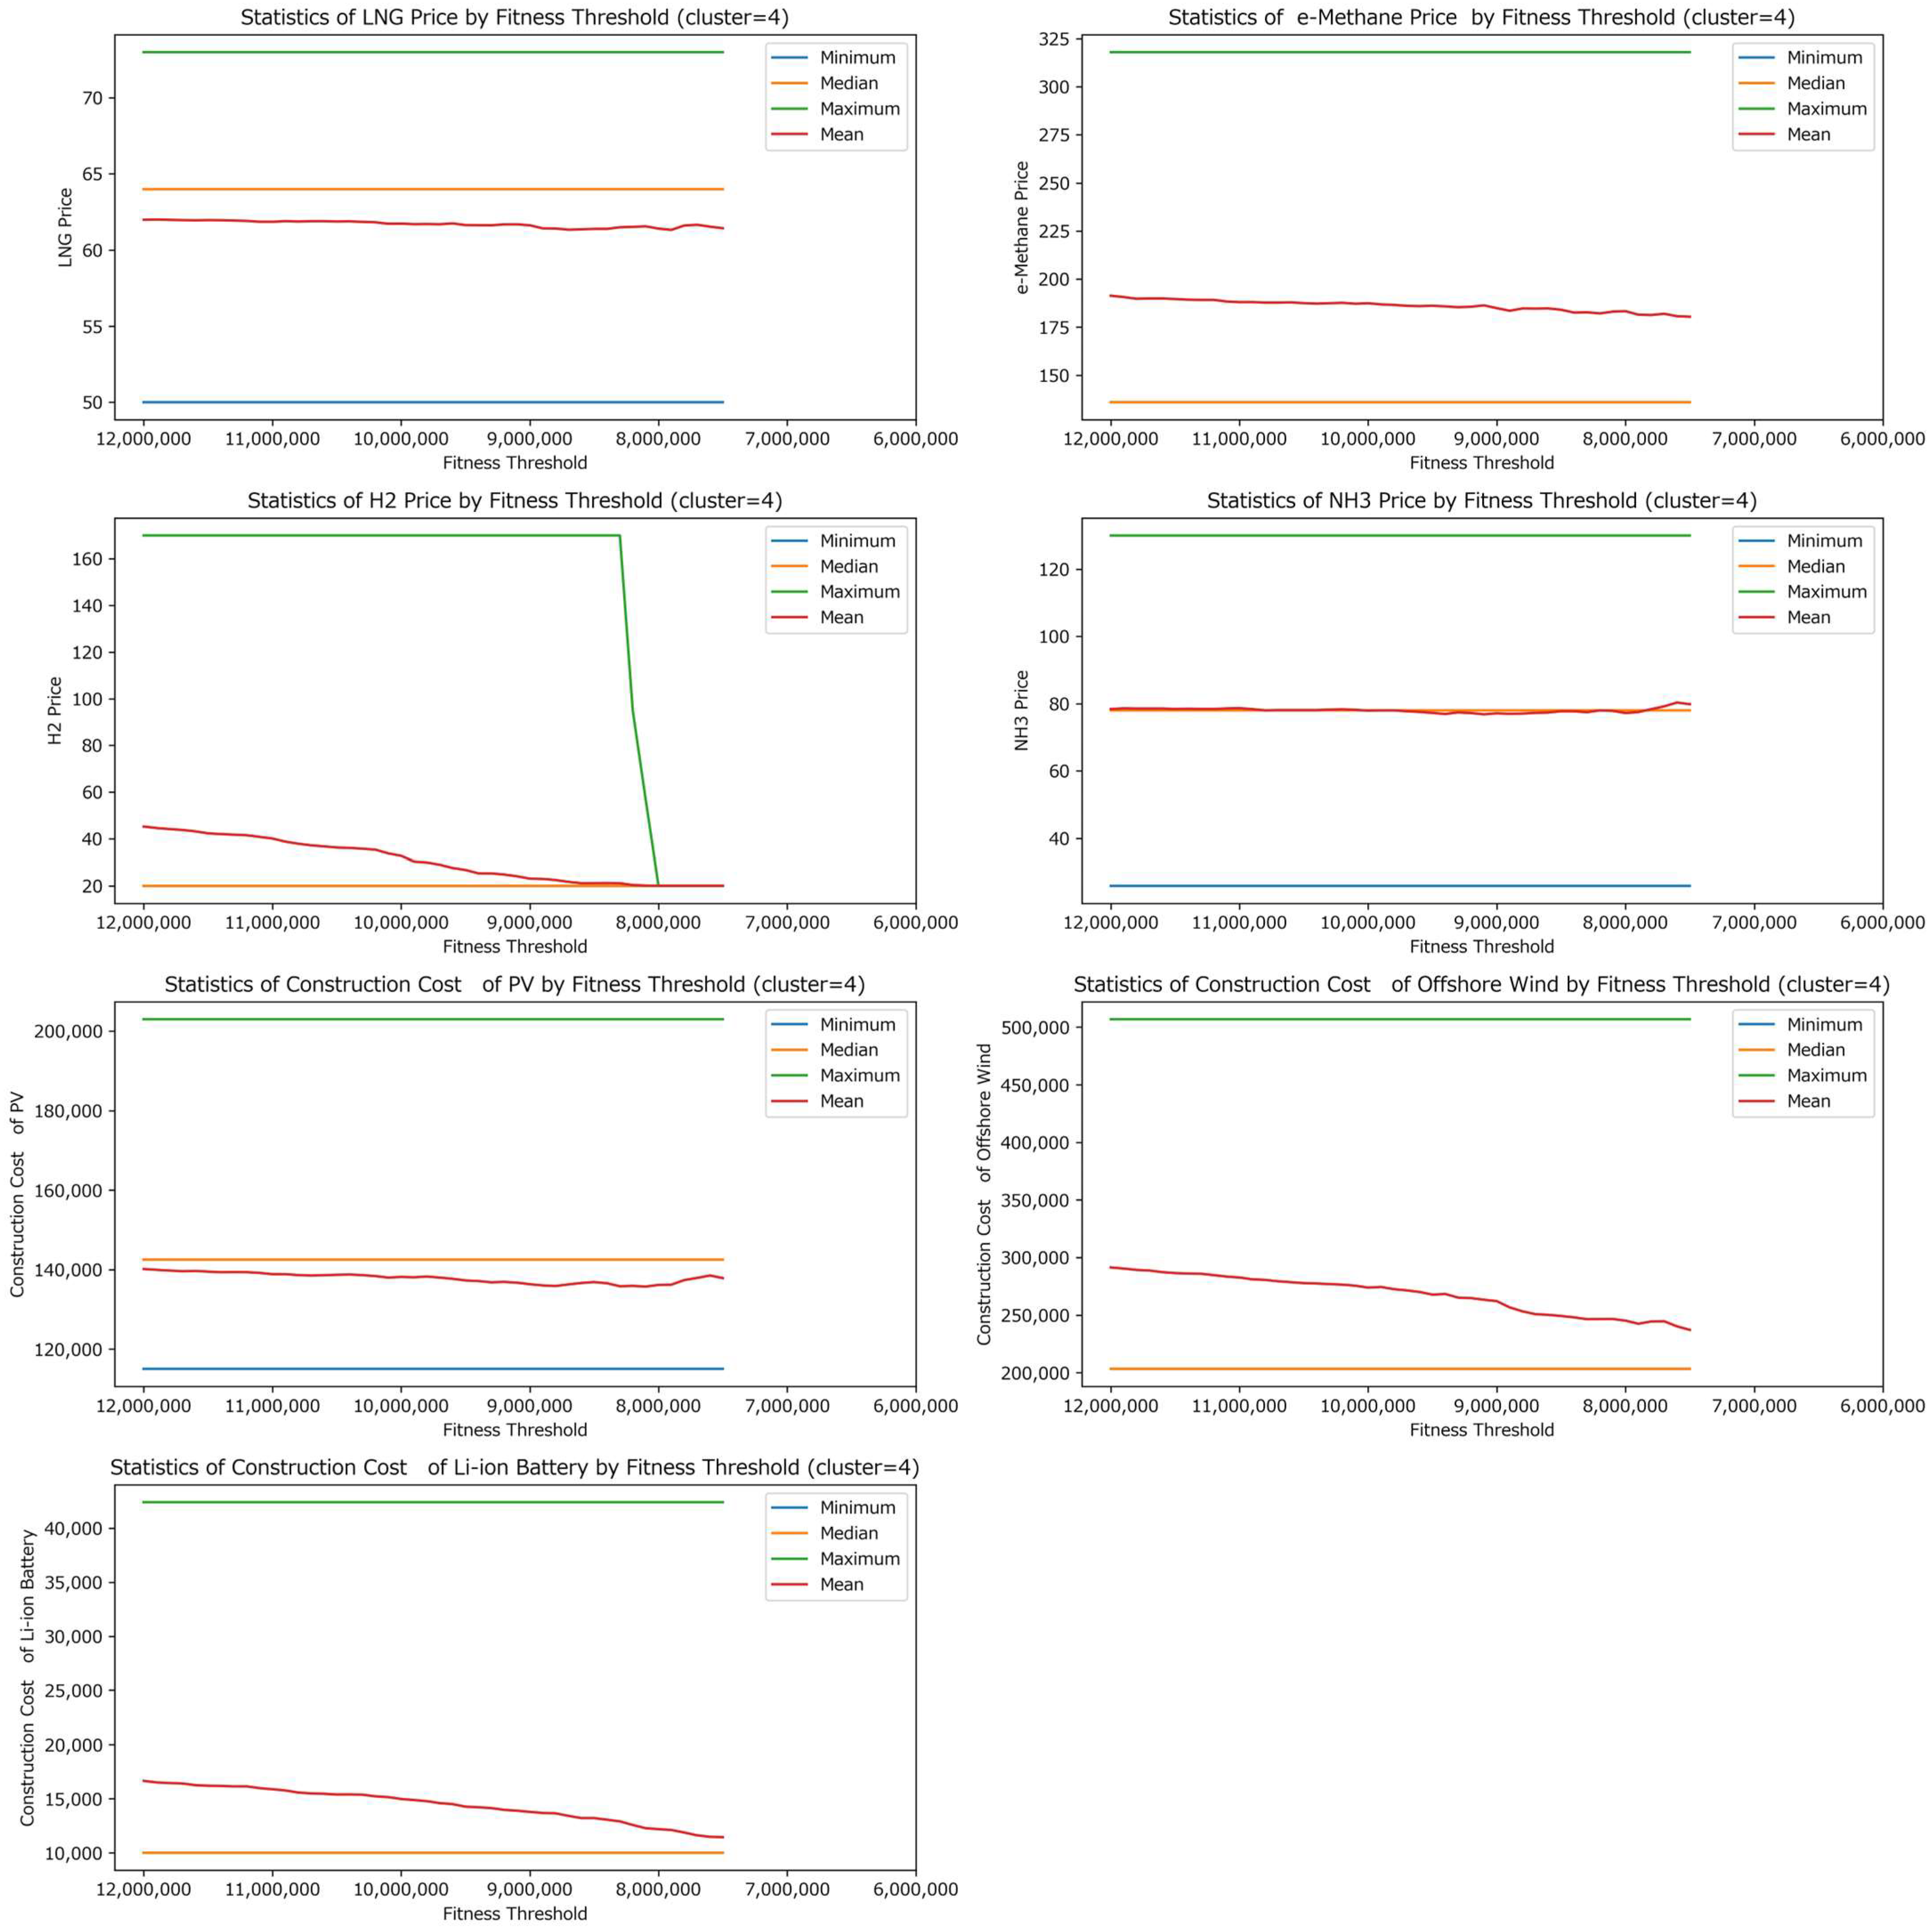
Appendix C. Detailed Analysis of Common and Variable Elements
This appendix presents the detailed discussion of the common and variable elements summarized in Section 3.4. The contents below are results obtained in the present demonstration and do not constitute universal claims under realistic conditions.
Appendix C.1. Common Elements
A comparison of the five representative clusters shown in Table 2 and Appendix B identifies the following elements as relatively robust requirements for achieving net-zero by 2050.
Appendix C.1.1. Deployment of Renewables at or Above a Certain Scale
All five scenarios make use of PV, offshore wind, or both to a certain extent, and configurations with almost no reliance on renewable energy do not appear among the illustrative solution archetypes. This indicates that, to achieve net-zero, the deployment of renewable energy is not an option specific to any single scenario but a foundational element common to multiple realization patterns.
Appendix C.1.2. Securing of Flexibility for Supply–Demand Fluctuations
Although the source of flexibility differs across scenarios, every scenario secures flexibility in some form. Specifically, supply–demand adjustment is performed by battery storage and GTCC in the PV with battery-backup type, by GTCC in the offshore wind-led type, by large-scale Li-ion batteries in the battery-centric flexibility type, by limited GTCC and battery storage in the low-GTCC with variable renewables type, and by GTCC in the GTCC with CO2 storage type. That is, while flexibility itself is indispensable, the principal means of providing it varies across scenarios.
Appendix C.1.3. Importance of the H2 Price as a Condition for Low-Cost Realization
As shown in Appendix B.4.1, when the total-cost threshold is tightened, the admissible range of the H2 price narrows in many clusters; the H2 price thus stands out as a principal driver of cost structure common across scenarios. This suggests that the conditions of hydrogen procurement and price formation are cross-cutting factors that influence the realizability of future net-zero systems.
Appendix C.2. Variable Elements
Appendix C.2.1. The Principal Renewable Technology
PV plays the leading role in the PV-led with battery-backup type, whereas offshore wind has a higher share in the offshore wind-led type and the low-GTCC with variable renewables type. Although renewable deployment is indispensable for achieving net zero, whether its core technology is PV or offshore wind can vary across scenarios.
Appendix C.2.2. The Approach to Providing Flexibility
In the battery-centric flexibility type, the Li-ion battery plays the central role, whereas in the GTCC with CO2 storage type, GTCC is the principal source of flexibility. In the PV-led with battery-backup type, battery storage is important in a complementary role, and in the offshore wind-led type, the complementary role of GTCC is more prominent. In other words, securing flexibility is a common task, but whether it is provided primarily by battery storage, primarily by GTCC, or by a combination of the two constitutes a variable element.
Appendix C.2.3. Extent of CO2 Storage Capacity Utilization
The low-GTCC with variable renewables type and the GTCC with CO2 storage type are characterized by relatively high upper limits of CO2 storage; in the latter, in particular, the combination of high-efficiency GTCC and CO2 storage capacity forms the foundation for scenario realization. By contrast, reliance on CO2 storage capacity is relatively low in the PV-led with battery-backup type and the offshore wind-led type. The extent to which CO2 management is positioned at the core of the system can therefore be understood as a difference among scenarios.
Appendix C.2.4. Combinations of Conditions That Tighten for Low-Cost Realization
The conditions that act as constraints on low-cost realization differ by scenario: the construction costs of PV and Li-ion batteries in the PV-led with battery-backup type; the construction cost of offshore wind in the offshore wind-led type; the construction costs of Li-ion batteries and offshore wind in the battery-centric flexibility type; multiple fuel prices and construction costs in the low-GTCC with variable renewables type; and primarily the H2 price in the GTCC with CO2 storage type (see Appendix B.4.2 for details).
Appendix C.3. Implications for Application
What is typically observed in the illustrative solution archetypes for achieving net-zero by 2050 comprises the deployment of renewable energy, the securing of flexibility, and favorable H2 price conditions. By contrast, whether the supply structure is centered on PV, on offshore wind, on battery storage for flexibility, or on GTCC together with CO2 storage remains a variable element. This implies that the solution archetype to net-zero is not unique: on top of foundational elements that must be secured across all solution archetypes, multiple technology portfolios and transition pathways may be realized.
Accordingly, the five illustrative solution archetypes extracted in this study should be interpreted as a comparative framework for organizing recurring and variable patterns within the demonstration solution set. The recurring elements indicate conditions that were commonly observed among the retained feasible solutions, whereas the variable elements indicate dimensions along which the retained solutions differed under the assumed prices, deployment limits, technology costs, and institutional settings.
It should be noted, however, that the specific contents of the common and variable elements presented in this appendix, as well as the interpretation of construction costs as proxy variables, are results obtained in a demonstration under hypothetical conditions and do not constitute universal claims under realistic conditions. When the framework is applied to actual investment decision-making, an examination tailored to realistic conditions is required.
Appendix D. Auxiliary Diagnostics and Robustness Analyses
This section reports the auxiliary diagnostics and robustness analyses referenced in the main text. The detailed results support the qualitative interpretation of search behavior, total-cost-threshold sensitivity, SHAP stability, and clustering, and do not replace the full-model results reported in the main text.
Appendix D.1. Auxiliary GA Search-Behavior Diagnostics
This section reports auxiliary diagnostics used to examine GA search behavior under multiple random seeds and computational budgets. A reduced model, which aggregated the temporal resolution from 1 h of the full model to 3 h, was applied to the auxiliary diagnostics in order to maintain a realistic total runtime. On a validation set of 72 full-model individuals, it reproduced the full-model total-cost ranking with a Spearman correlation of 0.9997 and a mean absolute percentage error of 0.83%.
Table A7 shows that the baseline GA setting generated a comparable number of unique feasible solutions across the three random seeds, which ranged from 2240 to 2294. The number of LP evaluations varied only from 2837 to 2894. The diagnostic best-cost value varied across seeds, from 6.123 to 6.875 trillion JPY, but this value is used here only to characterize search behavior; the objective of the GA in this study was to collect diverse feasible solutions below the prescribed threshold, rather than to certify a global minimum-cost solution.
Table A8 shows the trade-off between computational budget and the number of unique feasible solutions. Increasing the population size from 100 to 200 at 20 generations increased the number of unique feasible solutions from 1225 to 2243. Also, extending the 100-individual run from 20 to 40 generations increased it from 1225 to 2227. The unique solution in the baseline GA settings was greater than that in the longer run. These results show that the baseline GA settings were reasonable from the perspective of efficiently acquiring a diverse range of individuals, while they may not be optimal.
Table A9 shows the runtime breakdown of per-individual full-model evaluation. In the measured per-individual evaluation, LP model construction and LP solution accounted for 38.4% and 56.0% of the full-model evaluation time, respectively, confirming that LP evaluation is the dominant computational burden.
Table A7.
Random-seed comparison under the baseline GA setting (population = 200, generations = 20).
Table A8.
Search-budget comparison (seed = 42).
Table A9.
Runtime breakdown of per-individual full-model evaluation.
Appendix D.2. Total-Cost-Threshold Sensitivity
This section reports a post hoc one-sided sensitivity analysis of the total-cost threshold. The analysis refilters the existing full-model solution set using thresholds of 9, 10, 11, and 12 trillion JPY.
Table A10 shows that applying stricter total-cost thresholds monotonically reduced the retained solution set. Relative to the 12-trillion-JPY reference threshold, the number of unique feasible solutions retained was 2220 at 11 trillion JPY, 1861 at 10 trillion JPY, and 1372 at 9 trillion JPY, corresponding to 90.2%, 75.7%, and 55.8% of the reference set, respectively. Thus, the threshold affects the size of the retained solution pool, as expected.
At the same time, Table A10 shows that all five baseline-defined archetypes remained represented even under the strictest 9-trillion-JPY threshold. Figure A7 also shows that the relative composition of archetypes changed as the threshold became stricter, indicating that the threshold slightly influences the balance among retained archetypes even when no archetype disappears.
Table A11 shows that the SHAP-based feature ranking was most similar to the 12-trillion-JPY reference case at the 11-trillion-JPY threshold, with a Spearman rank correlation of 0.984 and complete top-10 overlap. The similarity decreased under stricter thresholds, with Spearman correlations of 0.953 at 10 trillion JPY and 0.920 at 9 trillion JPY, while the top-10 overlap remained nine out of ten. These results indicate that the main feature-ranking pattern is retained under moderate threshold tightening, whereas stricter filtering changes both the retained solution composition and some details of the ranking.
Table A10.
Retained solutions and archetype coverage by total-cost threshold.
Table A11.
SHAP rank stability under total-cost-threshold sensitivity.
Figure A7.
Archetype composition by total-cost threshold.
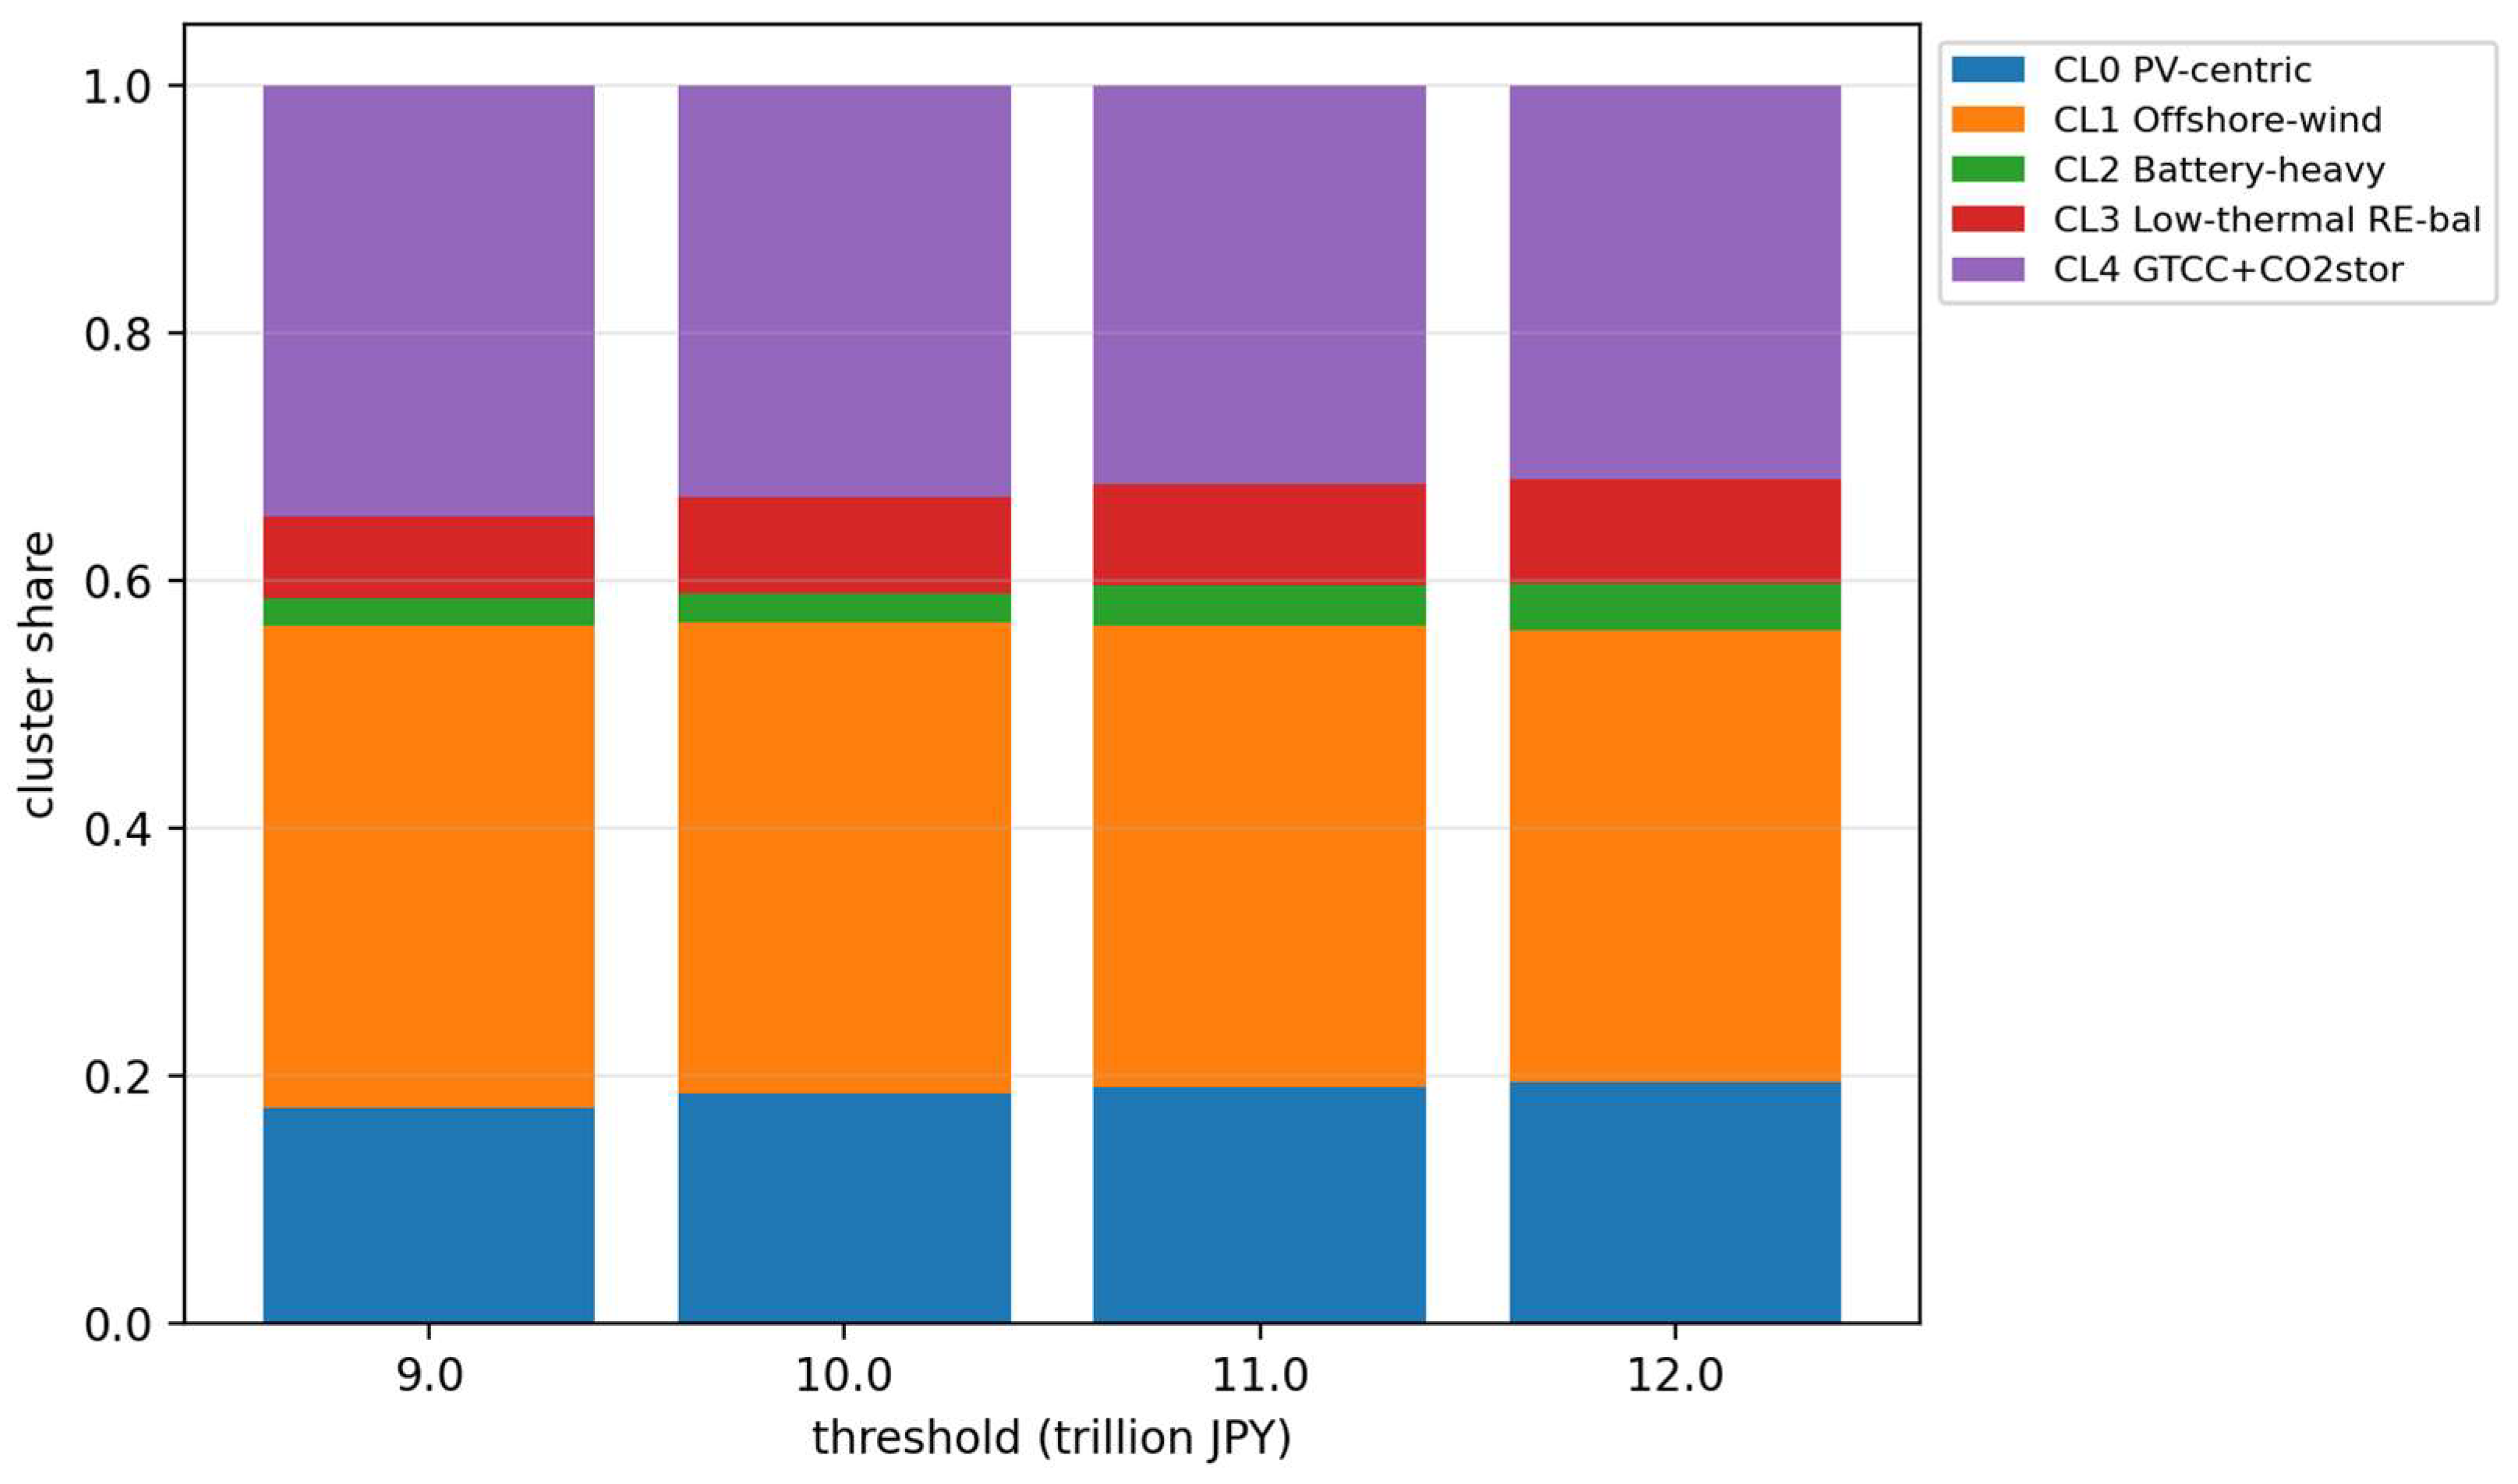
Appendix D.3. SHAP Stability Under Repeated Subsampling
In the repeated subsampling analysis, each random forest model was trained on a random 80% subsample of the 2460 full-gene unique feasible solutions. SHAP values were then evaluated on a common reference set of 600 solutions drawn once from the full unique-solution set. Using the same reference set in every repetition isolates the effect of changes in the training sample on the feature-importance ranking and avoids conflating this effect with changes in the evaluation sample. The reference-set size was selected to reduce computational burden while retaining broad coverage of the generated solution set. The resulting intervals are empirical subsampling stability intervals and should not be interpreted as population-level confidence intervals.
Table A12 shows that the repeated-subsampling analysis produced stable SHAP rankings across 50 repetitions. The median Spearman rank correlation was 0.990, with a 2.5–97.5 percentile range of 0.983–0.996, and the mean top-10 overlap was 10 out of 10. The held-out R2 was also stable across repetitions, with a mean of 0.907 and a standard deviation of 0.009.
The comparison between analyses using all feasible solutions and unique feasible solutions also supports this interpretation. The top-ranked features were unchanged at the highest ranks, and the top-10 overlap remained complete. Therefore, within the sampled solution set and the fixed random forest/SHAP settings used here, the qualitative feature-importance pattern is not driven by a single subsample or by duplicate solutions.
Table A12.
RF-SHAP settings and subsampling stability summary.
Appendix D.4. Cluster-Number Selection and Clustering Sensitivity
Table A13 and Figure A8 show that the clustering metrics did not identify a single unambiguous optimum number of clusters. Inertia (sum of squared errors) decreased monotonically as k increased, whereas the silhouette score remained within a narrow range across the tested values. The k = 5 case provided a local balance among compactness, separation, and cluster-size distribution, with no extremely small cluster in the selected feature space.
Figure A9 shows that the cluster centers for k = 5 correspond to distinct combinations of the selected capacity-related variables. The k = 4 solution combined configurations that were distinguishable in terms of PV and GTCC deployment, whereas k = 6 mainly subdivided the offshore-wind-centered archetype. The k = 5 solution provided a useful balance between statistical compactness and physical interpretability and was therefore retained for the illustrative archetype analysis.
Table A13.
Clustering-quality metrics for k = 2–10.
Figure A8.
Clustering-quality metrics for k = 2–10 (inertia, silhouette, Calinski–Harabasz, and Davies–Bouldin).
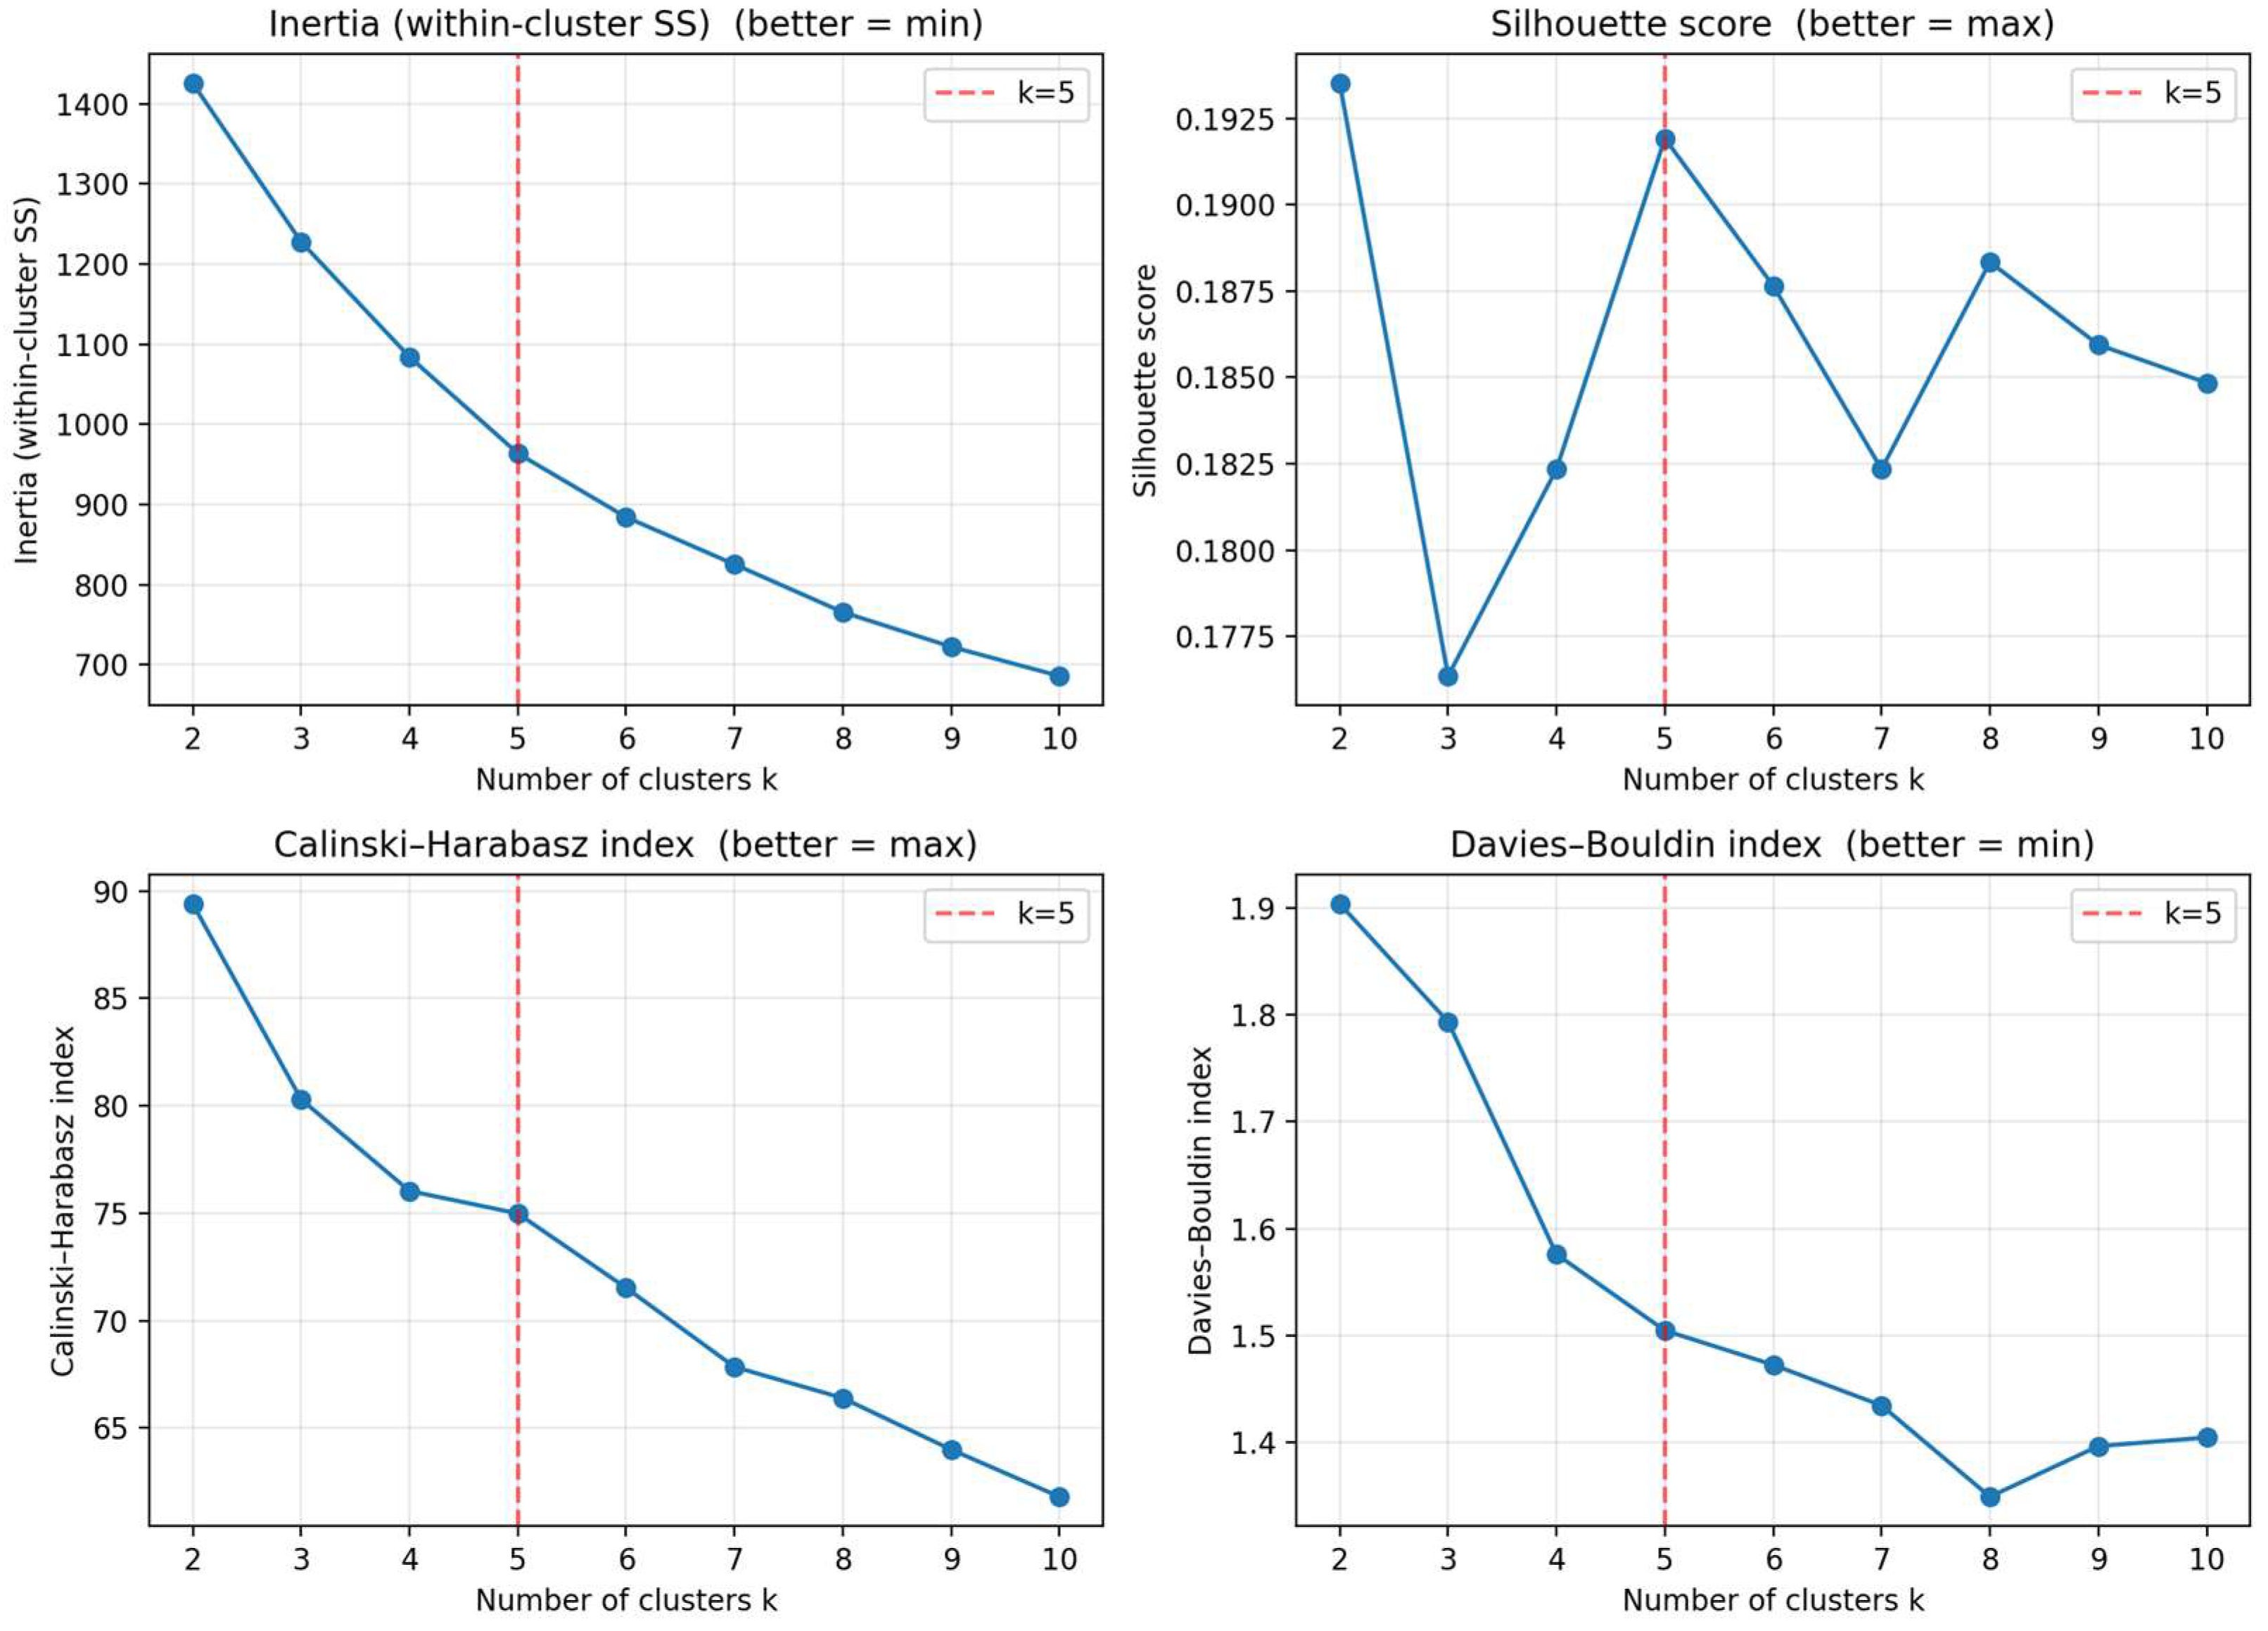
Figure A9.
Cluster-center heatmaps for k = 4, 5, and 6.
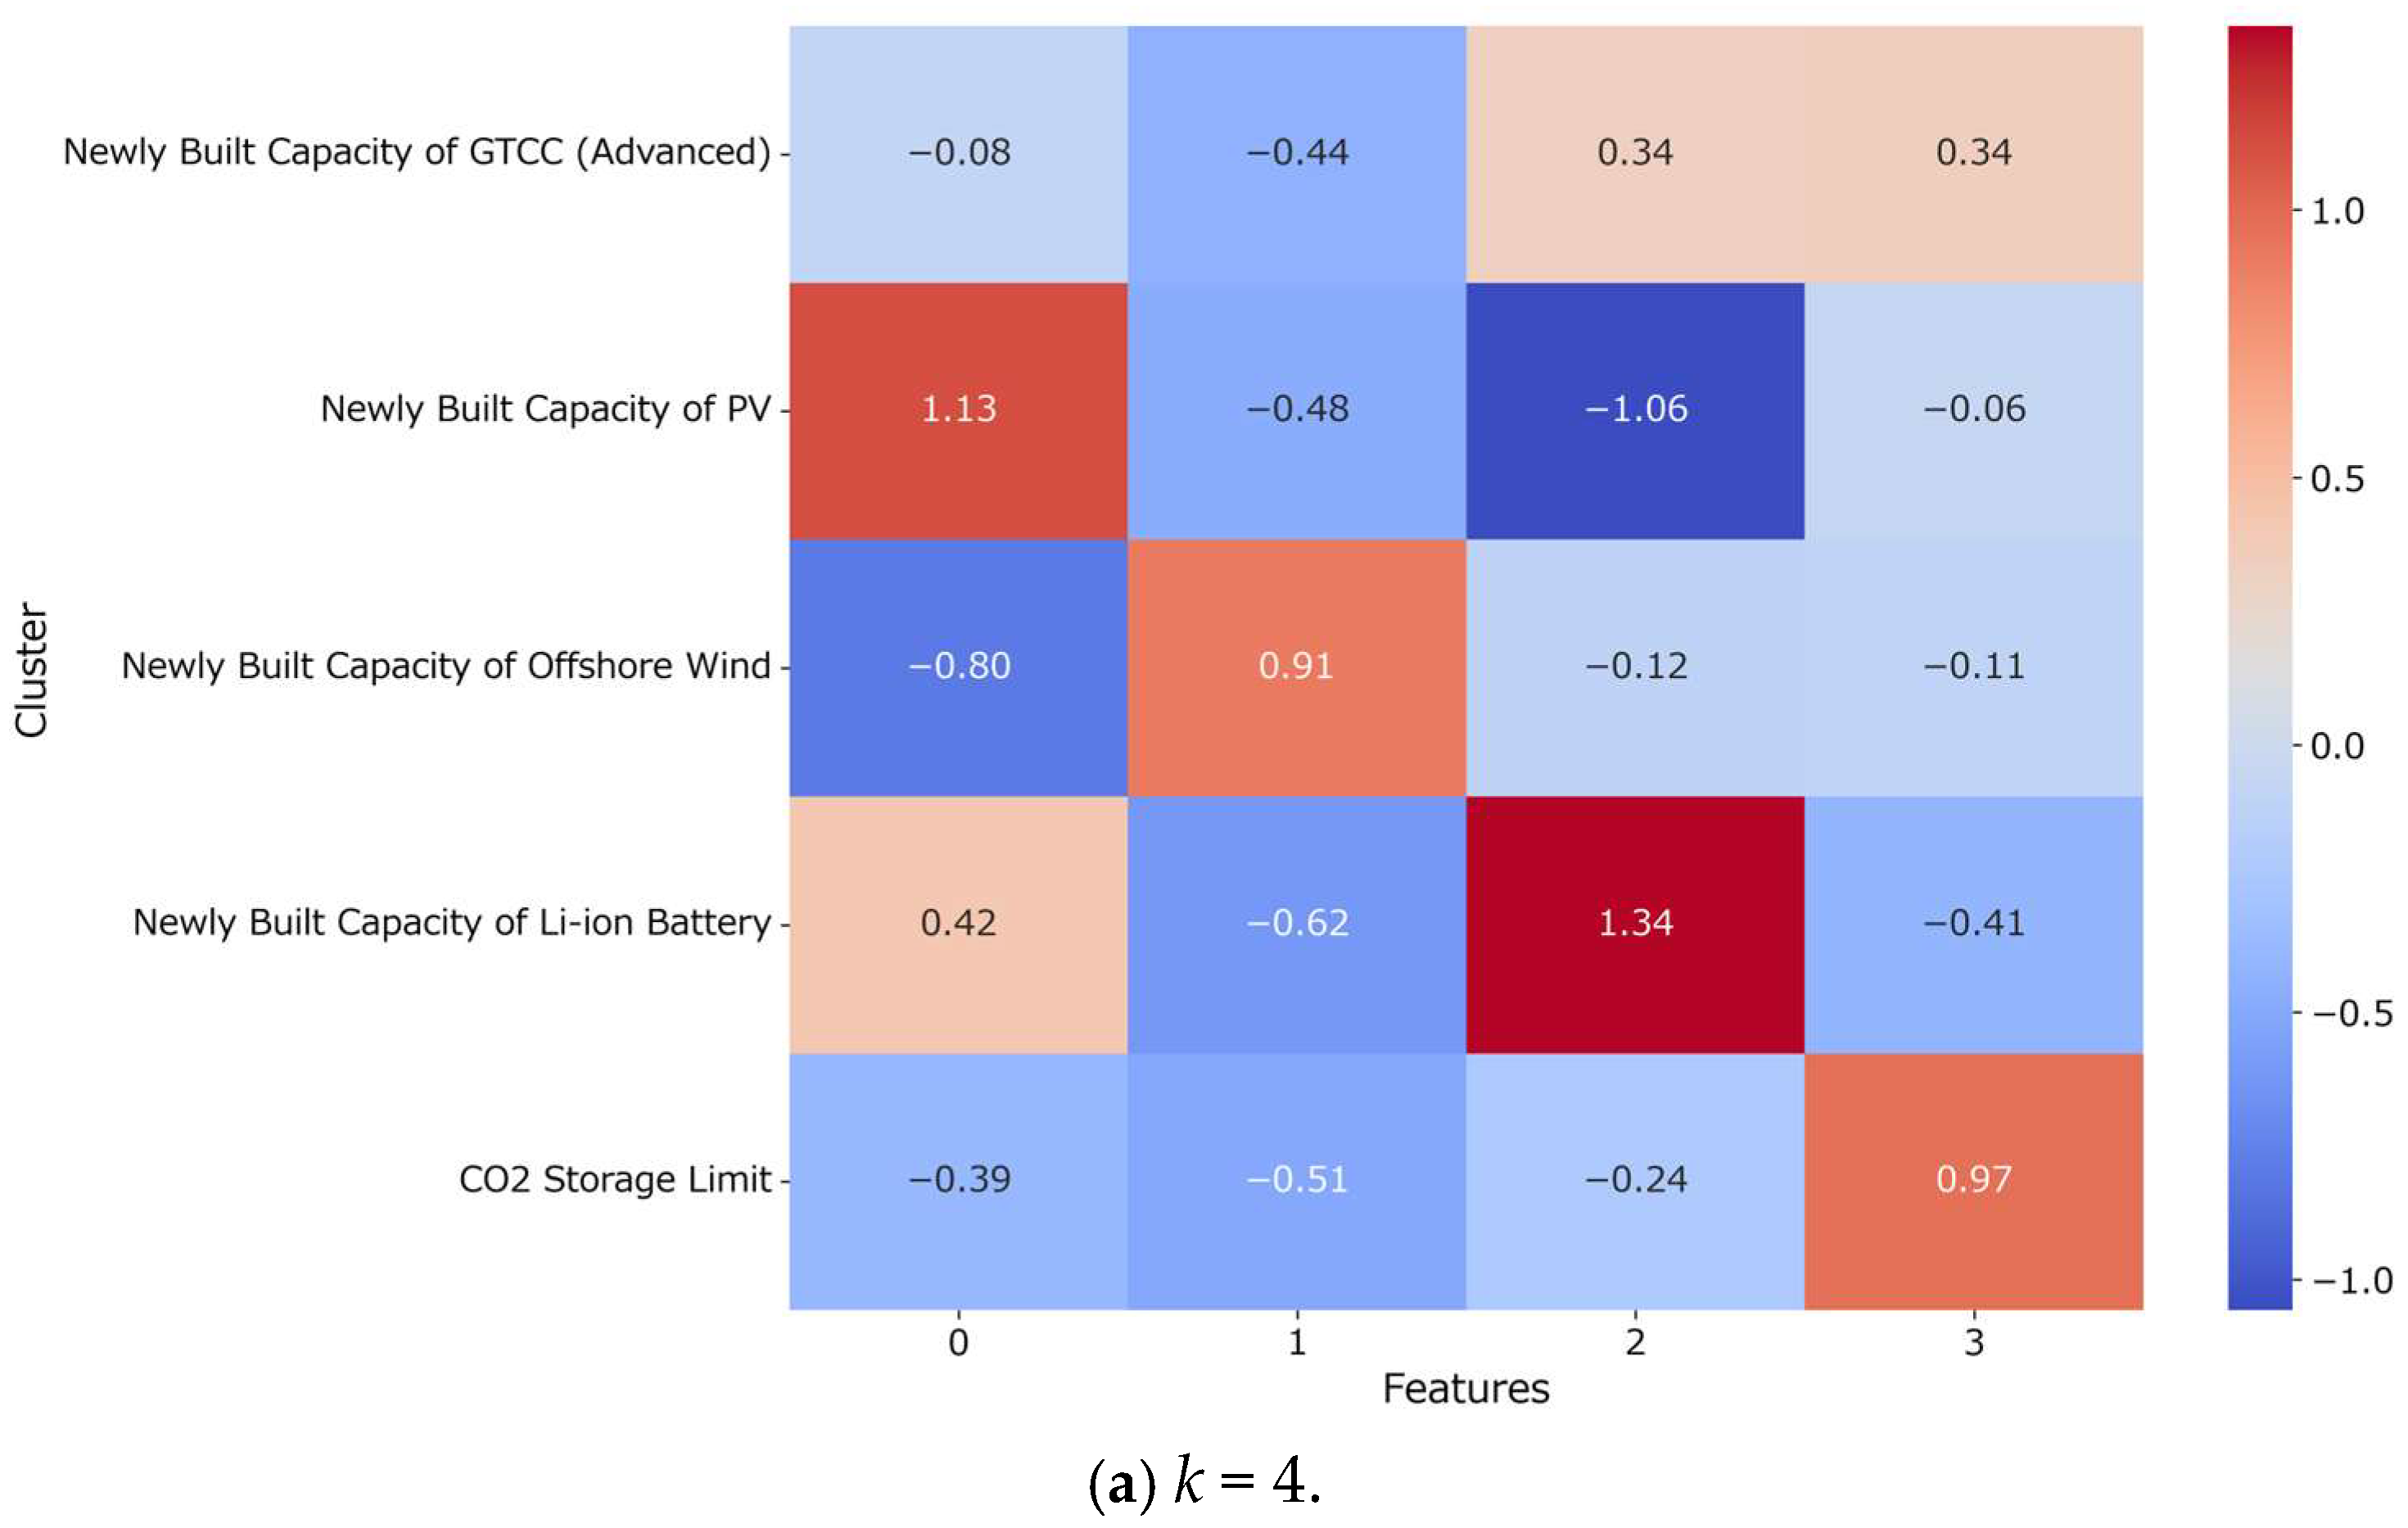
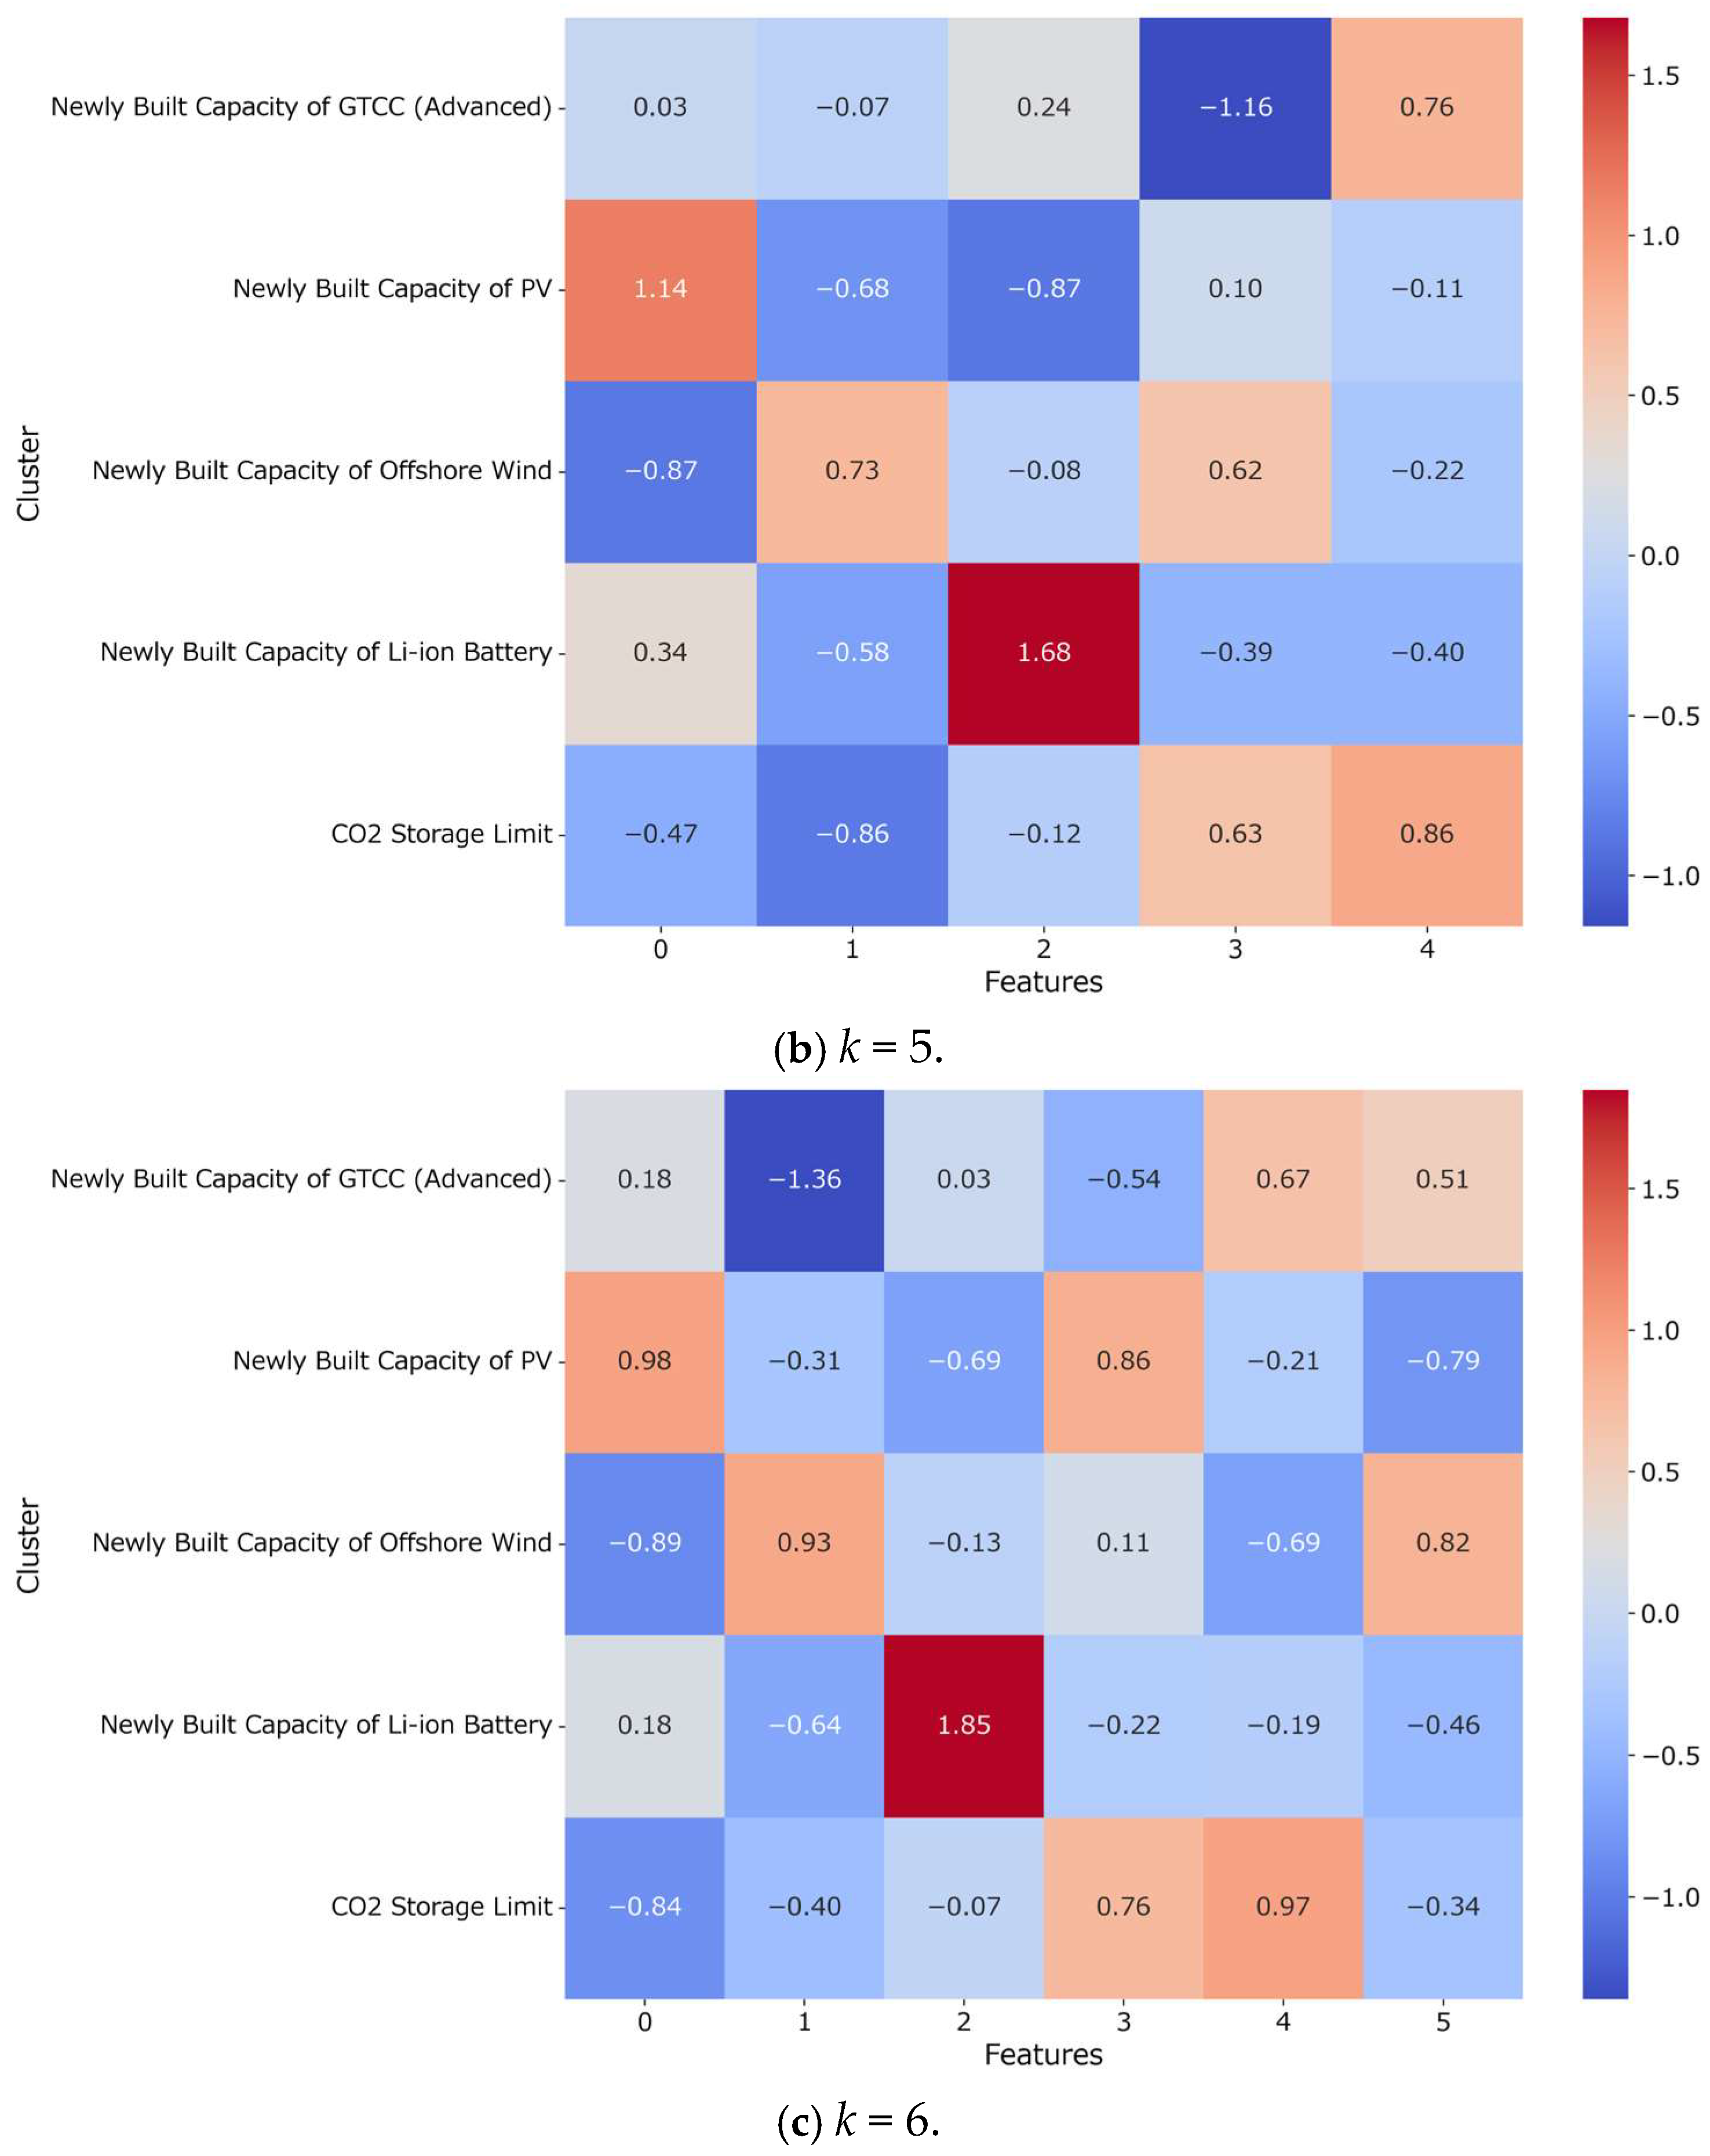
References
- Ministry of Economy Trade and Industry. Green Growth Strategy Through Achieving Carbon Neutrality in 2050; Ministry of Economy Trade and Industry: Tokyo, Japan, 2021. [Google Scholar]
- Yamamoto, H. Research Direction of Energy Supply and Demand Models for Japan toward Realizing Carbon Neutrality by 2050-1. Rev. J. Inst. Electr. Eng. Jpn. 2023, 143, 70. [Google Scholar] [CrossRef] [Scilit]
- Akimoto, K.; Sano, F.; Takashi, H.; Oda, J.; Nagashima, M.; Kii, M. Estimates of GHG Emission Reduction Potential by Country, Sector, and Cost. Energy Policy 2010, 38, 3384–3393. [Google Scholar] [CrossRef] [Scilit]
- Akimoto, K.; Sano, F.; Junichiro, O.; Haruo, K.; Yuko, N. Climate Change Mitigation Measures for Global Net-Zero Emissions and the Roles of CO2 Capture and Utilization and Direct Air Capture. Energy Clim. Change 2021, 2, 100057. [Google Scholar] [CrossRef] [Scilit]
- Matsuo, Y. Research Direction of Energy Supply and Demand Models for Japan toward Realizing Carbon Neutrality by 2050-3. Institute of Energy Economics, Japan (IEEJ): IEEJ-NE Model. J. Inst. Electr. Eng. Jpn. 2023, 143, 75–78. [Google Scholar] [CrossRef] [Scilit]
- Inoue, T.; Kurosawa, A.; Kato, E.; Iwafune, Y.; Ogimoto, K.; Yamaguchi, Y.; Uchida, H.; Ota, Y.; Shimoda, Y. Energy Analysis in 2050 by Soft-Link (1) Scenarios Considering Demand Change in Consumer-Sector and Their Evaluation. J. Jpn. Soc. Energy Resour. 2023, 44, 234–244. [Google Scholar]
- Ogimoto, K.; Iwafune, Y.; Takeuchi, T.; Segawa, S.; Azuma, H.; Inoue, T.; Kurosawa, A.; Kato, E.; Yamaguchi, Y.; Uchida, H.; et al. Energy Analysis in 2050 by Soft-Link: (2) Impact of Demand Change in Residential and Commercial Sector on Power Demand and Supply. J. Jpn. Soc. Energy Resour. 2023, 44, 245–254. [Google Scholar]
- Brill, E.D.; Chang, S.Y.; Hopkins, L.D. Modeling To Generate Alternatives: The Hsj Approach and an Illustration Using a Problem in Land Use Planning. Manag. Sci. 1982, 28, 221–235. [Google Scholar] [CrossRef] [Scilit]
- DeCarolis, J.F. Using Modeling to Generate Alternatives (MGA) to Expand Our Thinking on Energy Futures. Energy Econ. 2011, 33, 145–152. [Google Scholar] [CrossRef] [Scilit]
- Price, J.; Keppo, I. Modelling to Generate Alternatives: A Technique to Explore Uncertainty in Energy-Environment-Economy Models. Appl. Energy 2017, 195, 356–369. [Google Scholar] [CrossRef] [Scilit]
- Neumann, F.; Brown, T. The Near-Optimal Feasible Space of a Renewable Power System Model. Electr. Power Syst. Res. 2021, 190, 106690. [Google Scholar] [CrossRef] [Scilit]
- Lau, M.; Patankar, N.; Jenkins, J.D. Measuring Exploration: Review and Systematic Evaluation of Modelling to Generate Alternatives Methods in Macro-Energy Systems Planning Models. arXiv 2024, arXiv:2405.17342. [Google Scholar]
- Yokoyama, R.; Shinano, Y.; Taniguchi, S.; Ohkura, M.; Wakui, T. Optimization of Energy Supply Systems by MILP Branch and Bound Method in Consideration of Hierarchical Relationship between Design and Operation. Energy Convers. Manag. 2015, 92, 92–104. [Google Scholar] [CrossRef] [Scilit]
- Wakui, T.; Hashiguchi, M.; Sawada, K.; Yokoyama, R. Two-Stage Design Optimization Based on Artificial Immune System and Mixed-Integer Linear Programming for Energy Supply Networks. Energy 2019, 170, 1228–1248. [Google Scholar] [CrossRef] [Scilit]
- Yokoyama, R.; Shinano, Y.; Taniguchi, S.; Wakui, T. Search for K-Best Solutions in Optimal Design of Energy Supply Systems by an Extended MILP Hierarchical Branch and Bound Method. Energy 2019, 184, 45–57. [Google Scholar] [CrossRef] [Scilit]
- Holland, J.H. Adaptation in Natural and Artificial Systems; University of Michigan Press: Ann Arbor, MI, USA, 1975. [Google Scholar]
- Goldberg, D.E. Genetic Algorithms in Search, Optimization, and Machine Learning; Addison-Wesley: Reading, MA, USA, 1989. [Google Scholar]
- Lundberg, S.M.; Lee, S.I. A Unified Approach to Interpreting Model Predictions. In Proceedings of the Advances in Neural Information Processing Systems, Long Beach, CA, USA, 4–9 December 2017; Volume 2017-Decem, pp. 4766–4775. [Google Scholar]
- Fortin, F.A.; De Rainville, F.M.; Gardner, M.A.; Parizeau, M.; Gagńe, C. DEAP: Evolutionary Algorithms Made Easy. J. Mach. Learn. Res. 2012, 13, 2171–2175. [Google Scholar]
- DEAP Development Team DEAP Documentation. Available online: https://deap.readthedocs.io/en/master/ (accessed on 24 April 2026).
- Breiman, L. Random Forests. Mach. Learn. 2001, 45, 5–32. [Google Scholar] [CrossRef] [Scilit]
- Pedregosa, F.; Varoquaux, G.; Gramfort, A.; Michel, V.; Thirion, B.; Grisel, O.; Blondel, M.; Prettenhofer, P.; Weiss, R.; Dubourg, V.; et al. Scikit-Learn: Machine Learning in Python. J. Mach. Learn. Res. 2011, 12, 2825–2830. [Google Scholar]
- Kuwabara, T.; Mohr, D.; Sauer, B.; Yamada, Y. How Japan Could Reach Carbon Neutrality by 2050; McKinsey & Company: New York, NY, USA, 2021. [Google Scholar]
- Ministry of Economy; Trade and Industry. Green Transformation Budget and Policy Measures. Available online: https://www.meti.go.jp/policy/energy_environment/global_warming/gx_budget.html (accessed on 3 May 2026).
- Ministry of Land, Infrastructure, Transport and Tourism. Current Status of the Environmental Sector in the Capital Region; Ministry of Land, Infrastructure, Transport and Tourism: Tokyo, Japan, 2022. [Google Scholar]
- Agency for Natural Resources and Energy. Power Generation Cost Verification Working Group (FY2021); Document No. 8-6; Agency for Natural Resources and Energy: Tokyo, Japan, 2021. [Google Scholar]
- International Renewable Energy Agency. Electricity Storage and Renewables: Costs and Markets to 2030; International Renewable Energy Agency: Abu Dhabi, United Arab Emirates, 2017. [Google Scholar]
- JERA Thermal Power Plants List. Available online: https://www.jera.co.jp/en/corporate/business/thermal-power/list/ (accessed on 24 February 2026).
- Tokyo Gas Power Sources for Electricity Generation. Available online: https://home.tokyo-gas.co.jp/gas_power/plan/power/source.html (accessed on 26 April 2026).
- Tokyo Electric Power Company Holdings Electricity Demand and Supply Forecast for TEPCO Service Area. Available online: https://www.tepco.co.jp/forecast/html/area_jukyu_p-j.htm (accessed on 25 February 2026).
- Agency for Natural Resources and Energy. Nuclear Energy Policy and Current Status; Agency for Natural Resources and Energy: Tokyo, Japan, 2023. [Google Scholar]
- Ministry of the Environment Japan Environmental Data Repository (REPOS). Available online: https://repos.env.go.jp/web/ (accessed on 25 April 2026).
- The Institute of Energy Economics Japan. Evaluation of the Potential for Introducing Solar Power Generation, Taking into Account Local Regulations and Building Characteristics; The Institute of Energy Economics Japan: Tokyo, Japan, 2023. [Google Scholar]
- Renewable Energy Institute. Basic Information on Wind Power Generation; Renewable Energy Institute: Tokyo, Japan, 2024. [Google Scholar]
- Agency for Natural Resources and Energy. Comprehensive Energy Statistics of Japan (STTE 028); Agency for Natural Resources and Energy: Tokyo, Japan, 2023. [Google Scholar]
- Ministry of the Environment Japan. Greenhouse Gas Emissions Calculation and Reporting System. Available online: https://policies.env.go.jp/earth/ghg-santeikohyo/calc.html (accessed on 25 February 2026).
- Power Producer and Supplier Network Statistics on Gas Prices and Supply. Available online: https://pps-net.org/statistics/gas6 (accessed on 25 February 2026).
- The Institute of Energy Economics Japan. Economic and Environmental Evaluation of Hydrogen Carriers from Overseas Production to Domestic End-Use; The Institute of Energy Economics Japan: Tokyo, Japan, 2023. [Google Scholar]
- Japan Science and Technology Agency; Center for Low Carbon Society Strategy. Cost and Evaluation of the Direct Air Capture (DAC) Method for Carbon Dioxide (Vol. 2); Japan Science and Technology Agency: Tokyo, Japan, 2020. [Google Scholar]
- Agency for Natural Resources and Energy. Summary of the Final Report of the CCS Long-Term Roadmap Review Committee; Agency for Natural Resources and Energy: Tokyo, Japan, 2023. [Google Scholar]
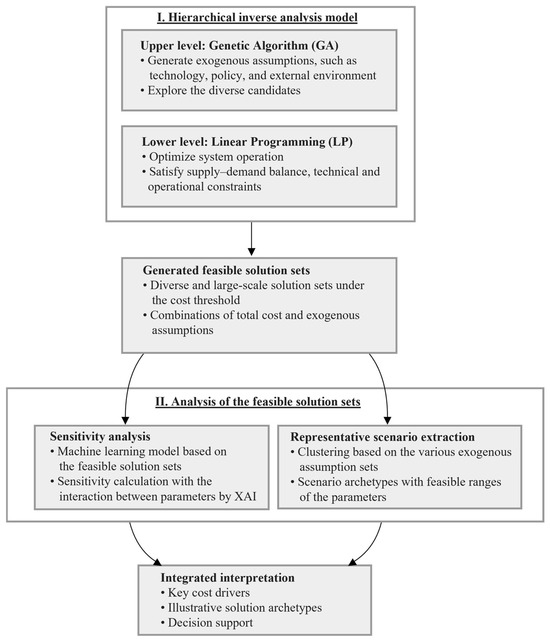
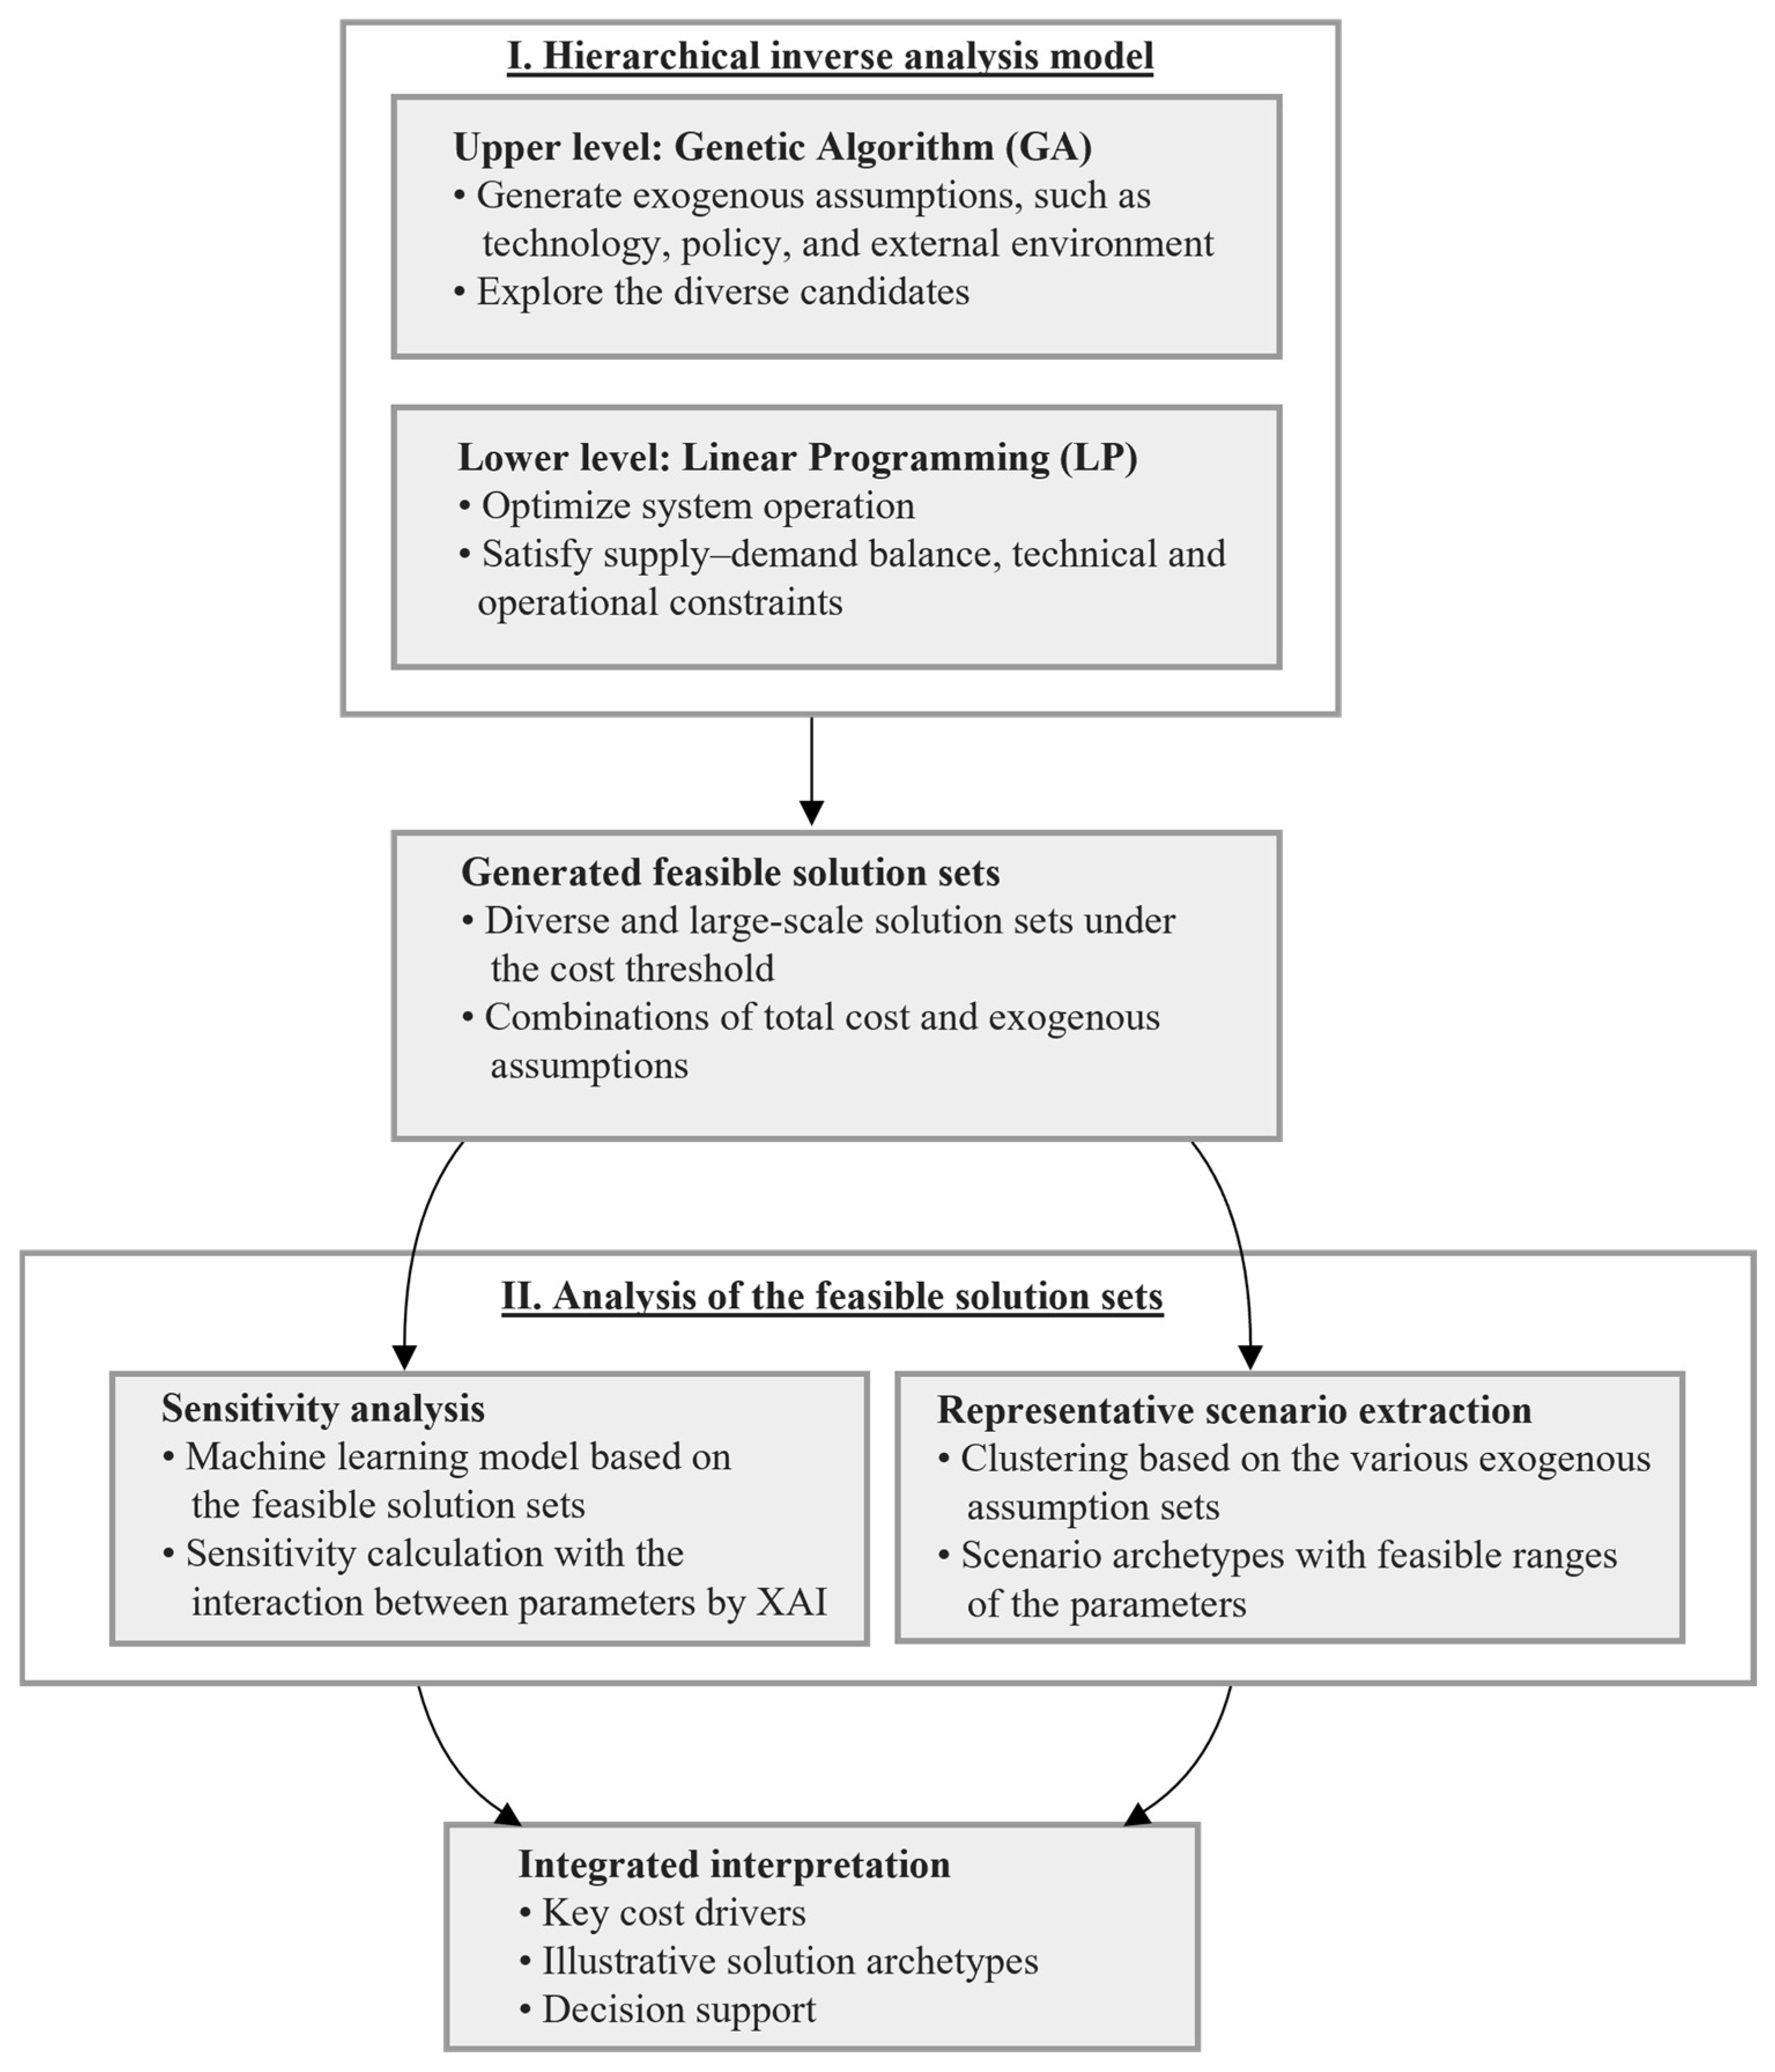
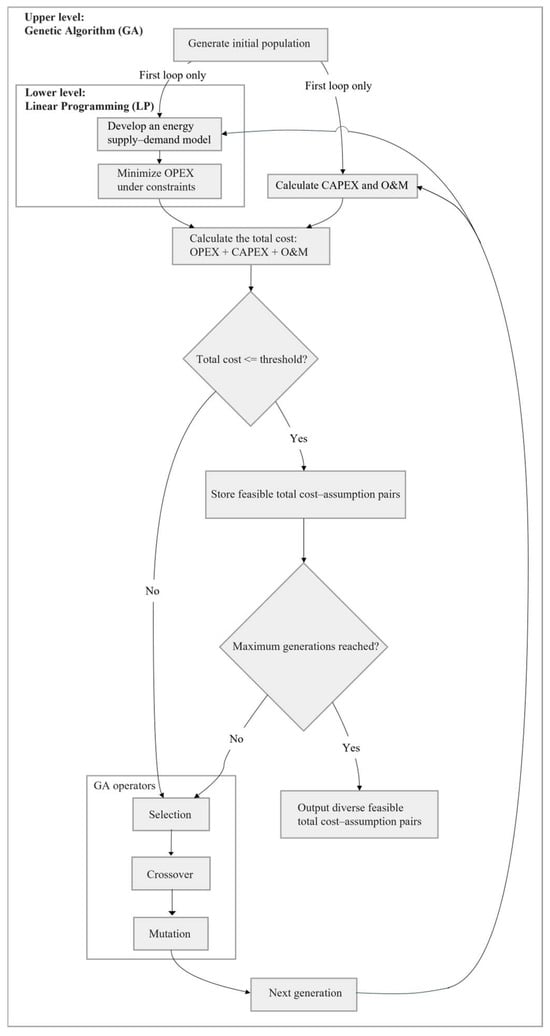
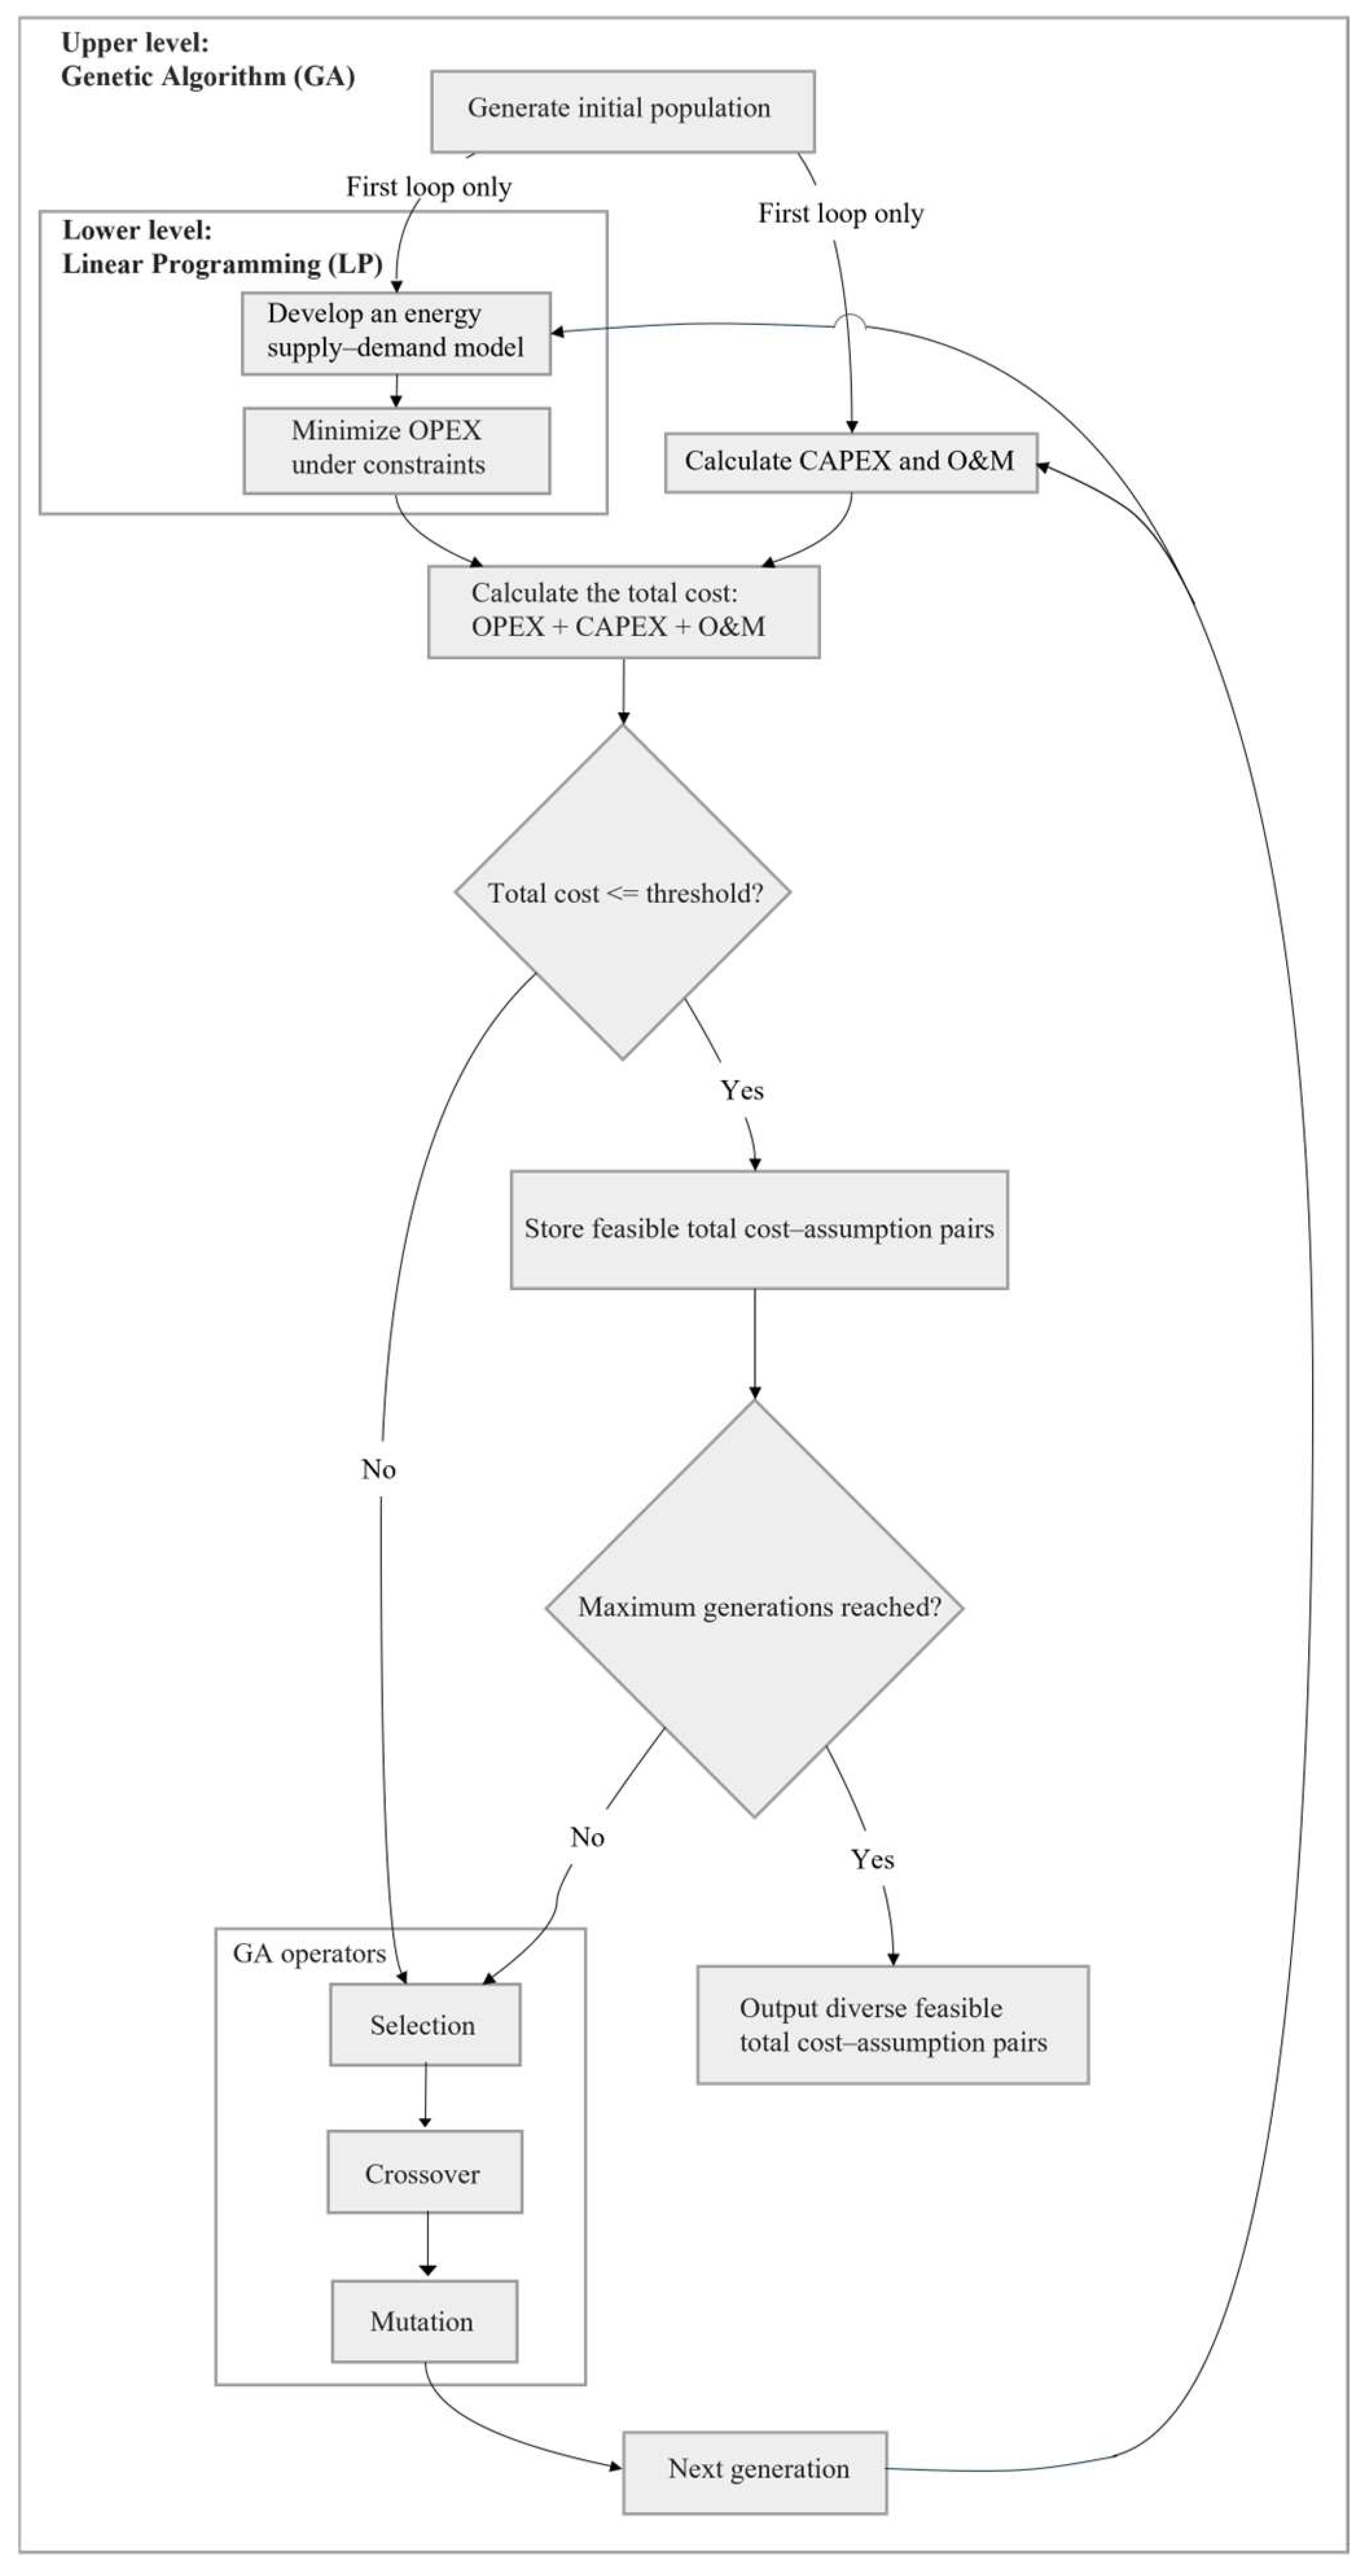
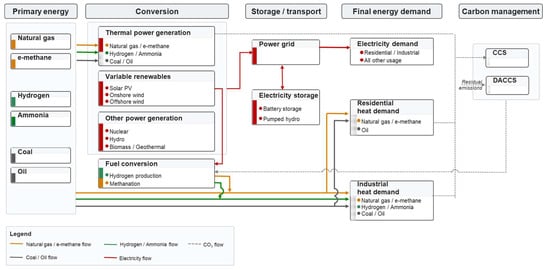
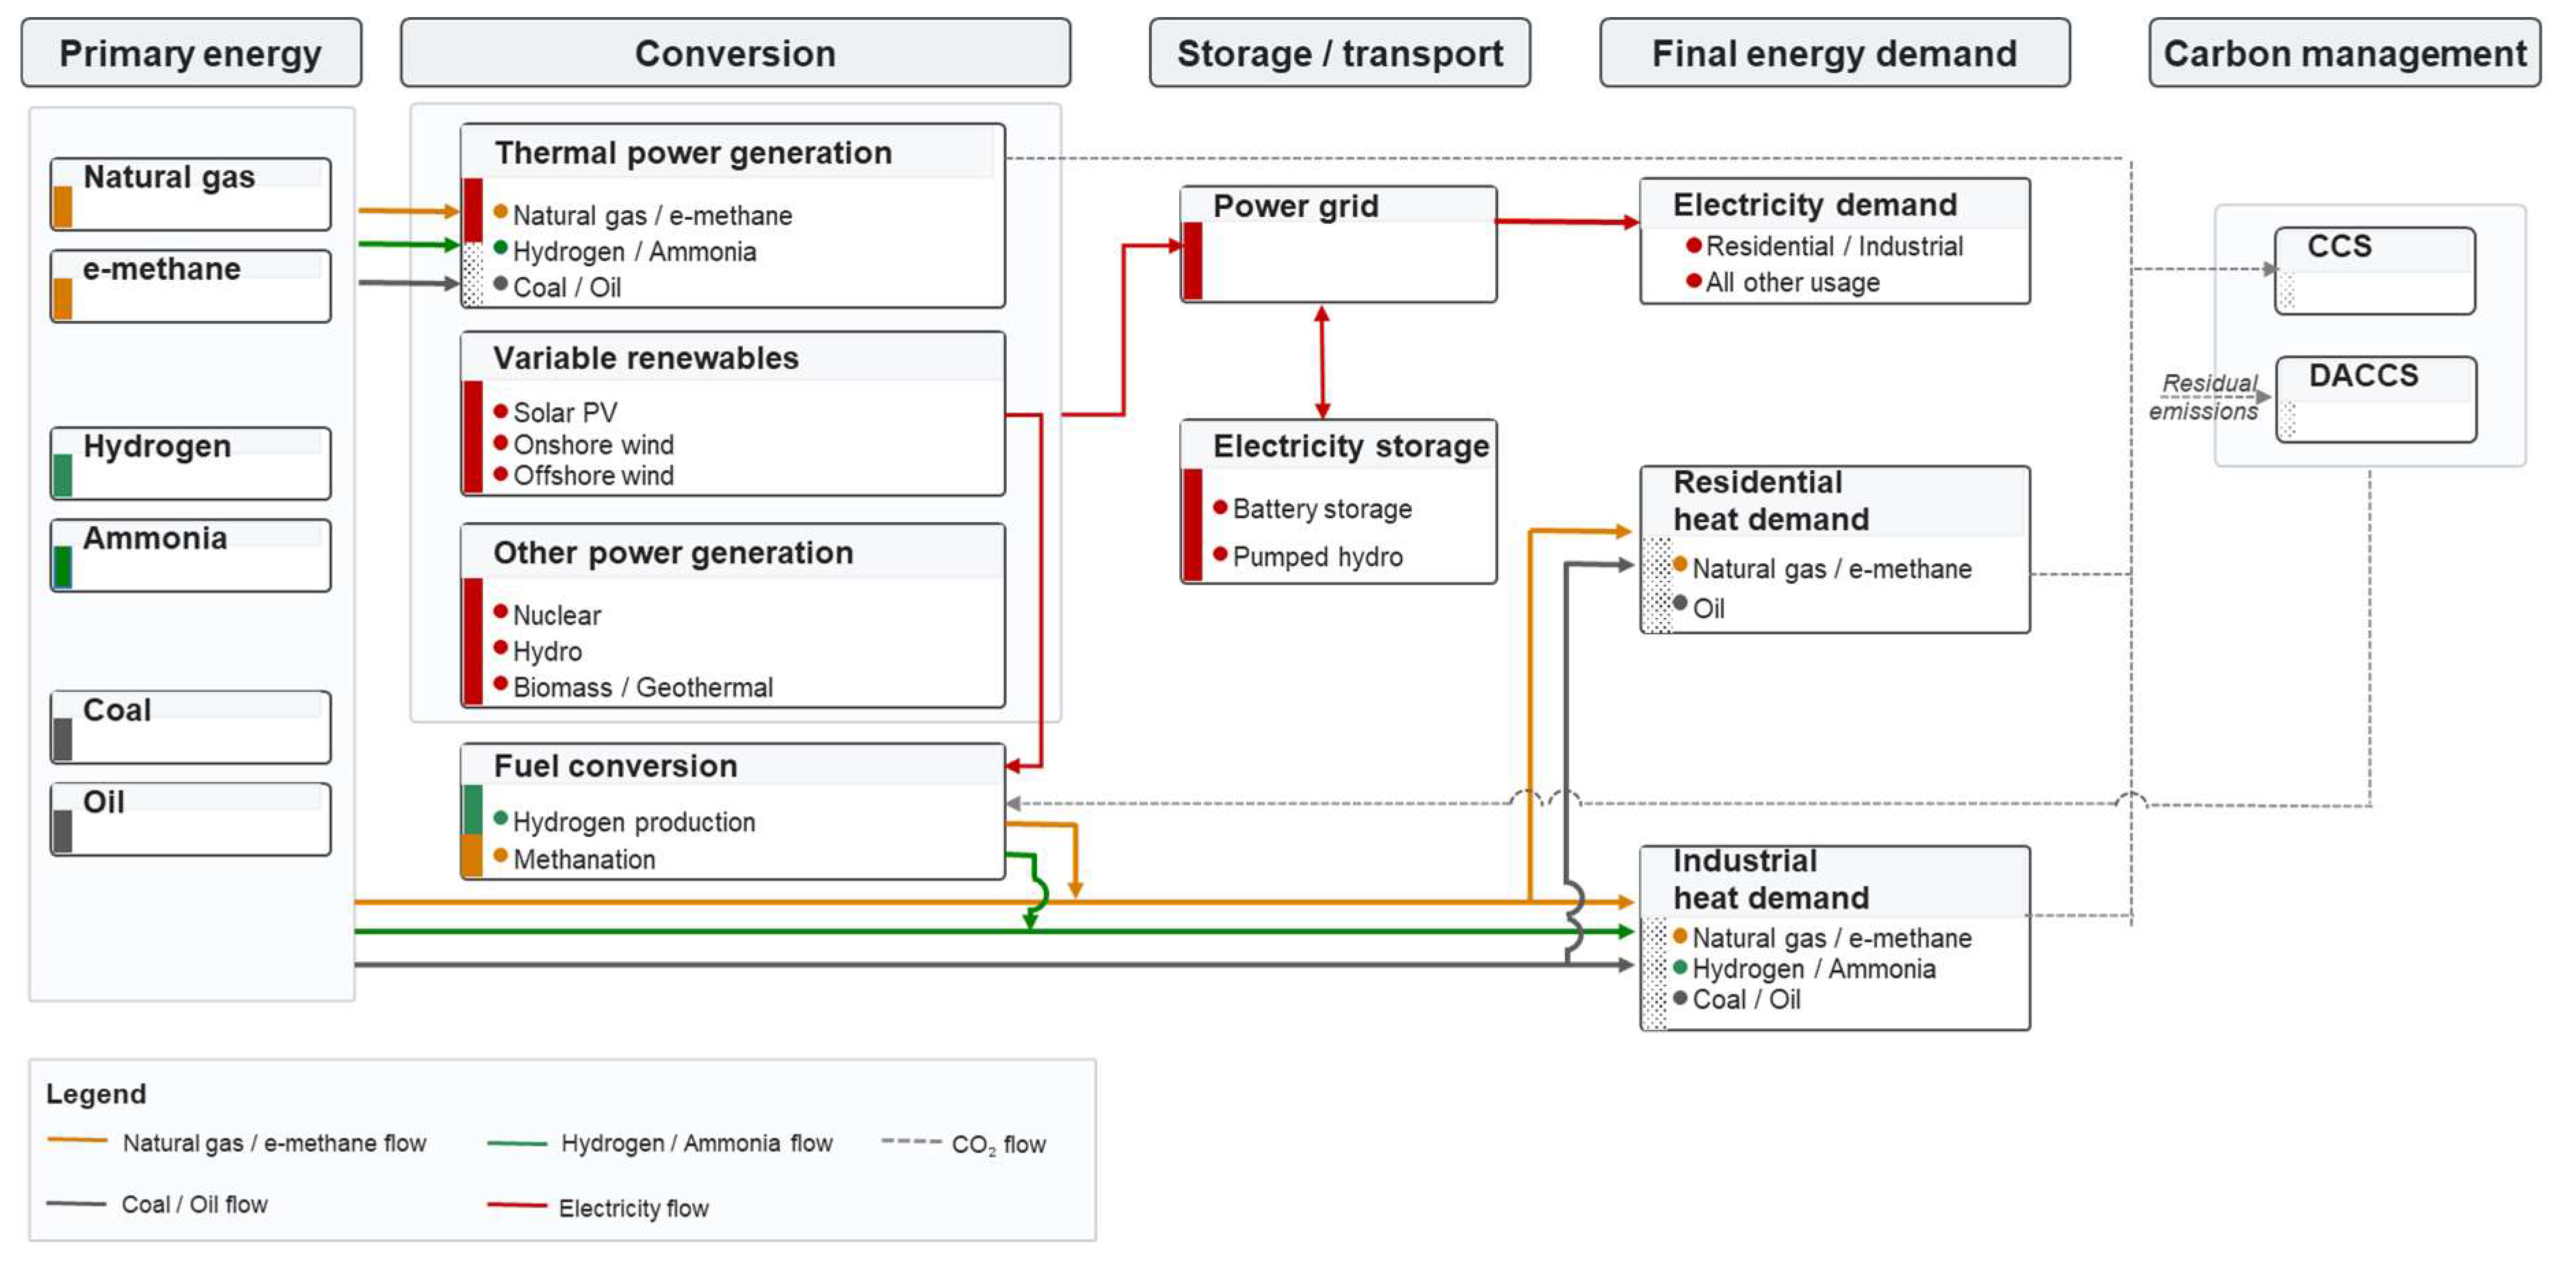
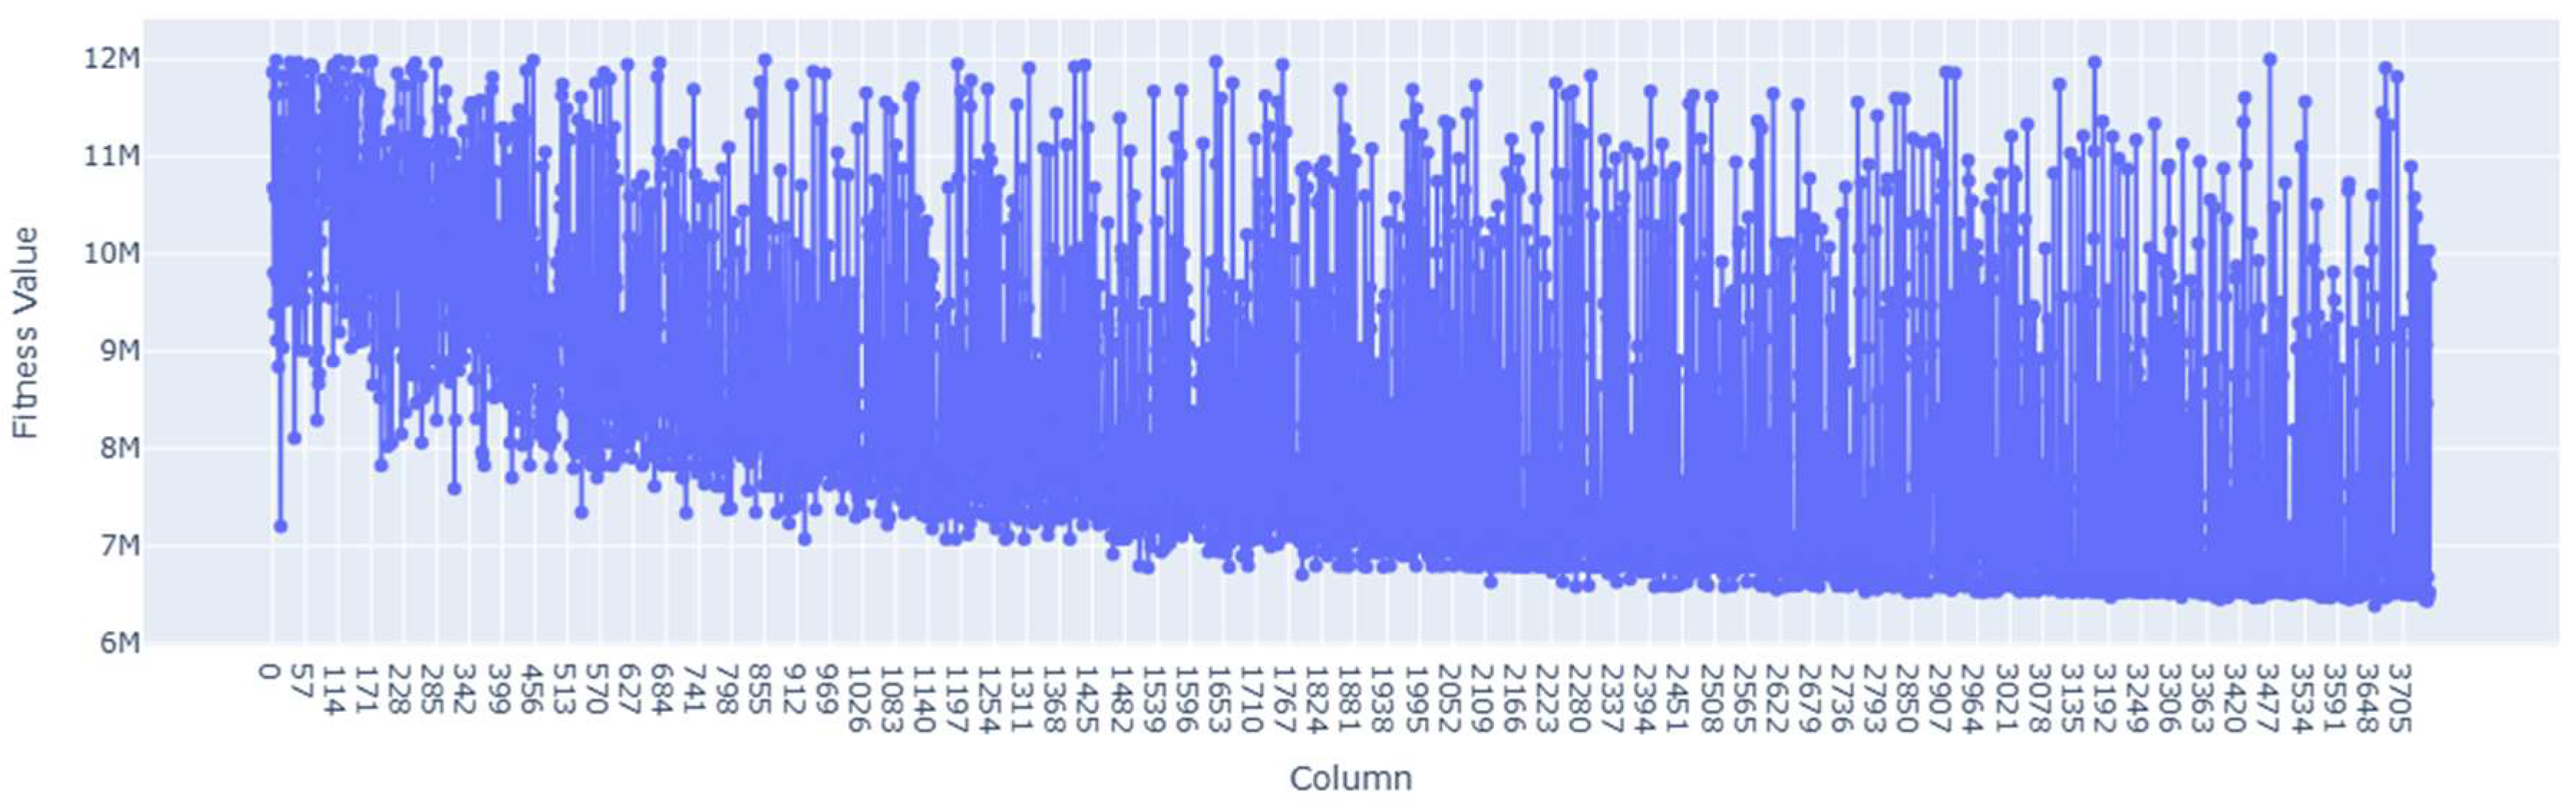
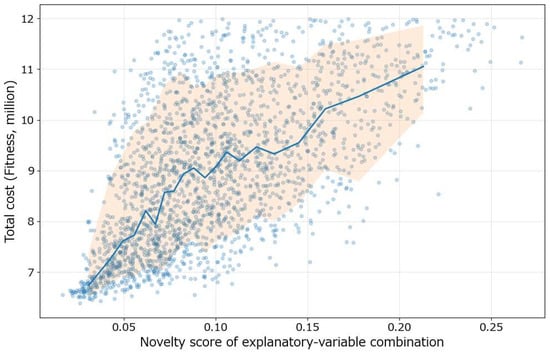
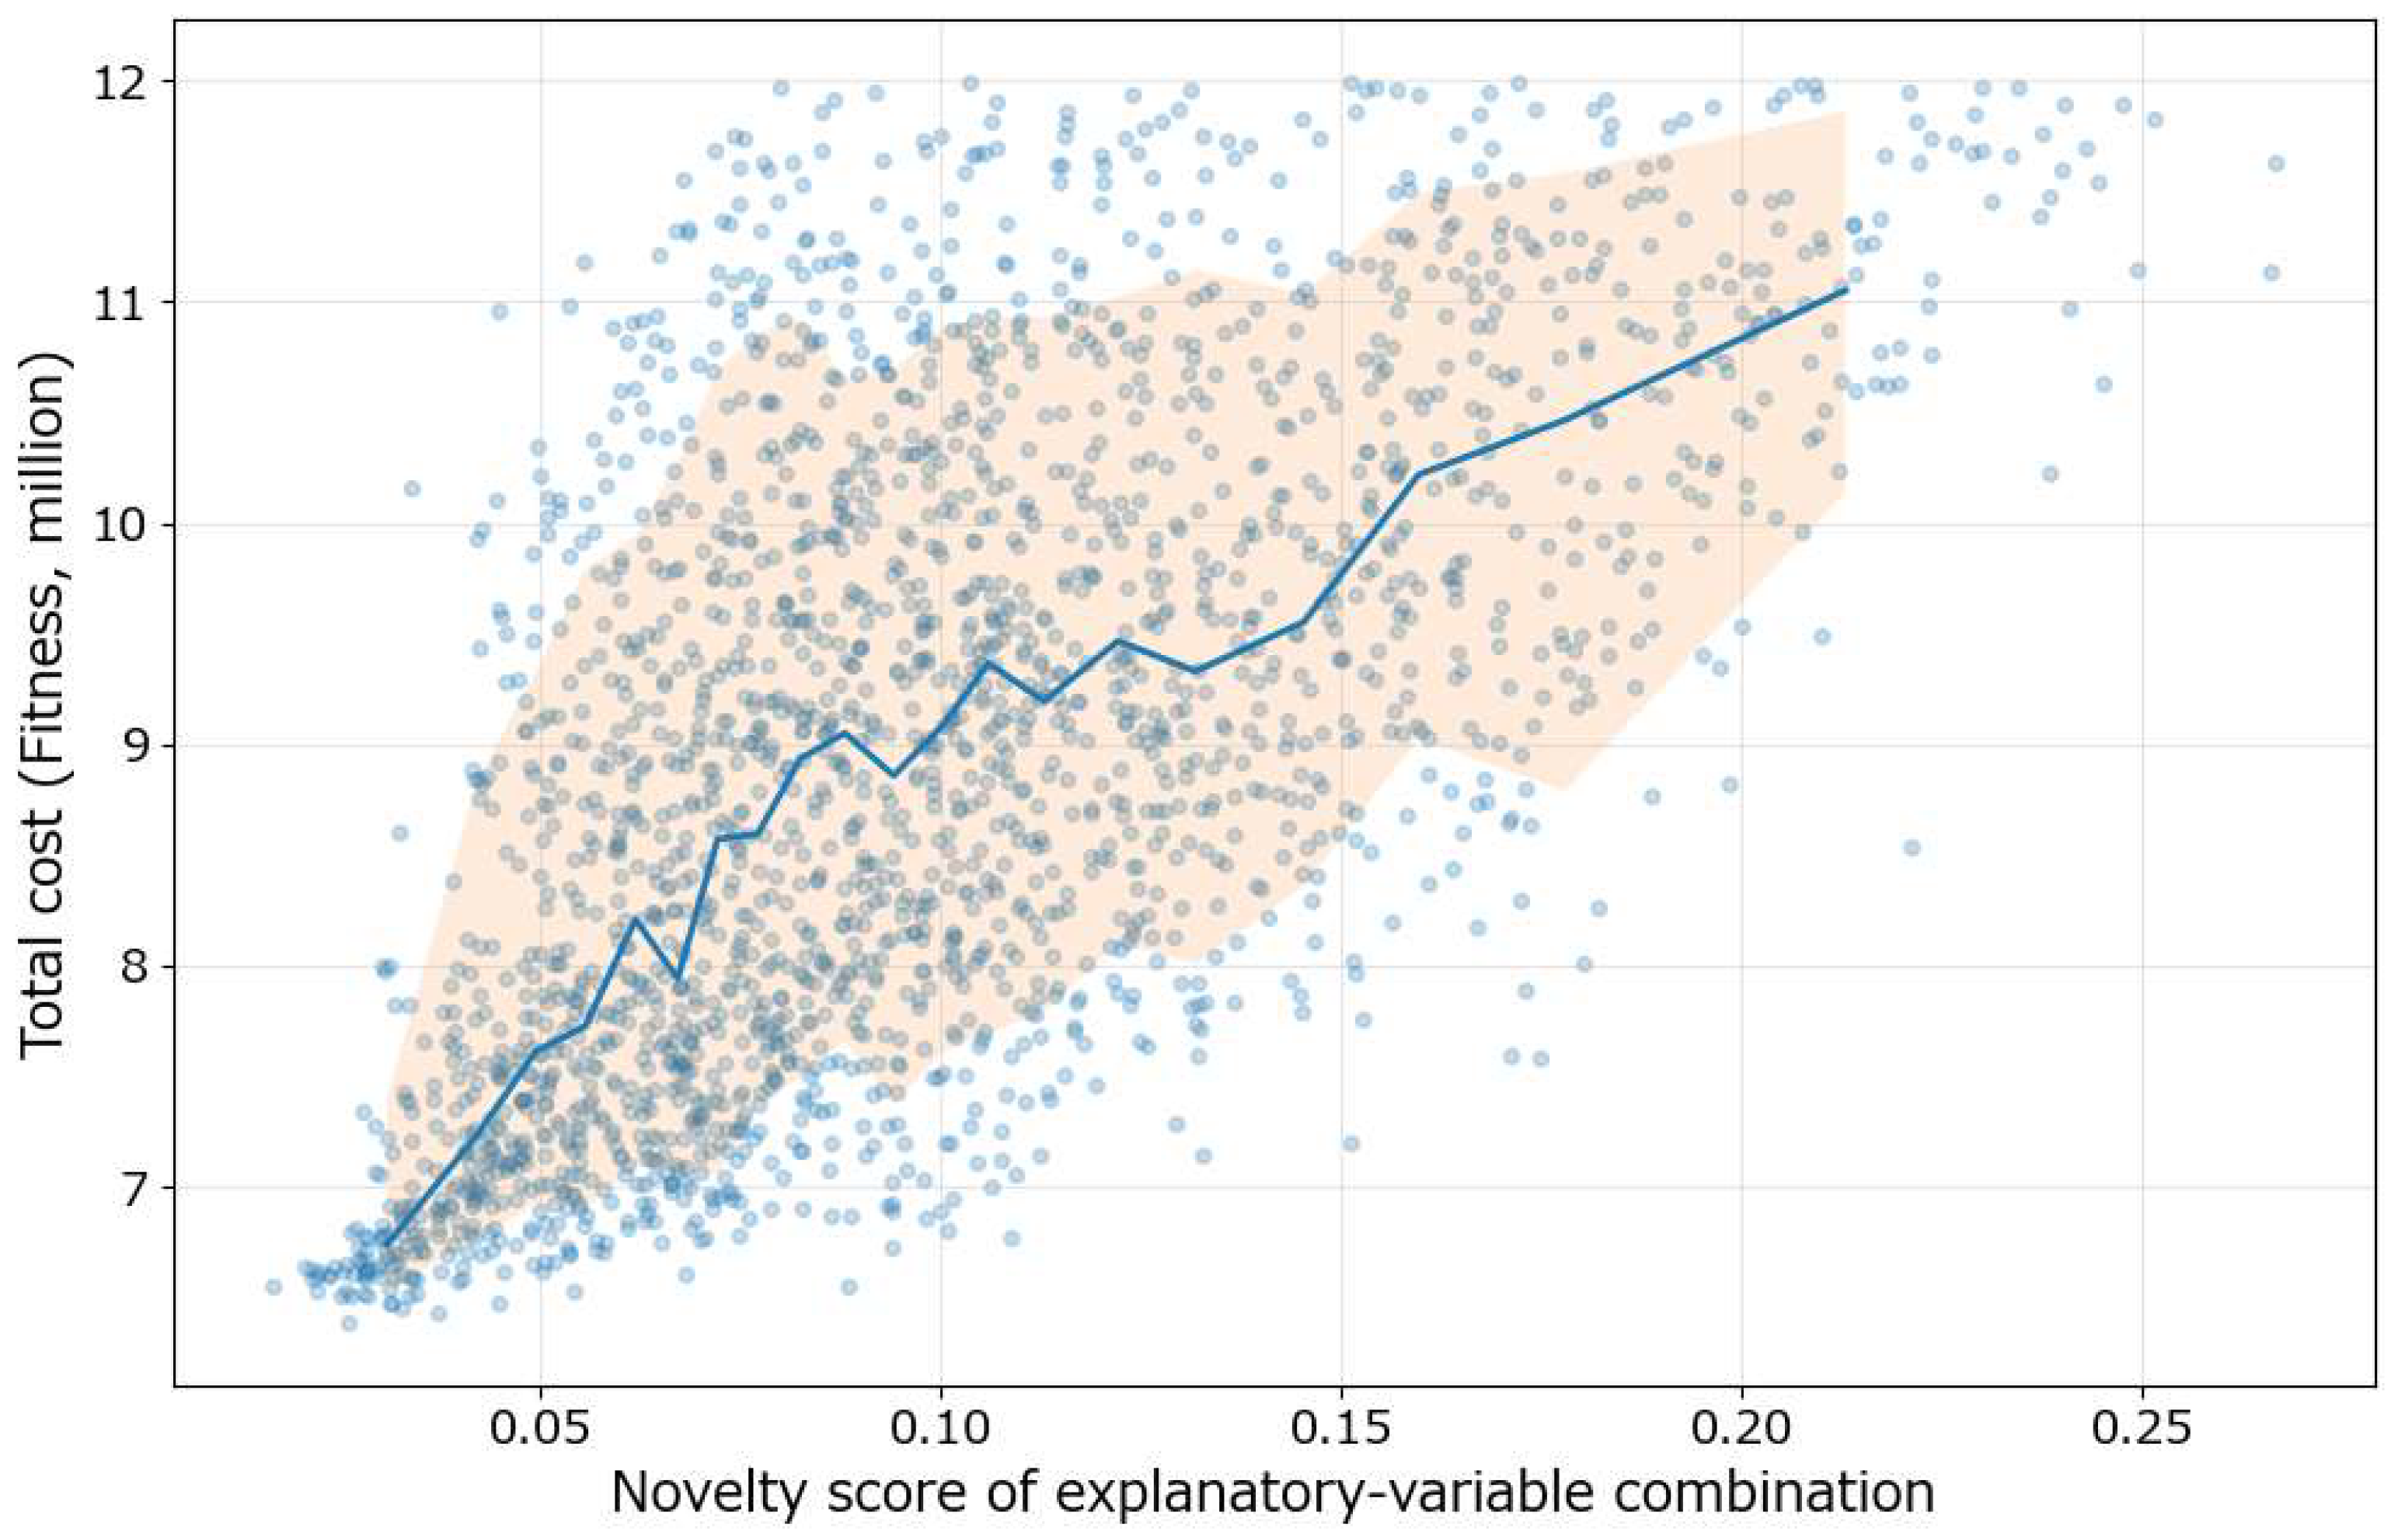
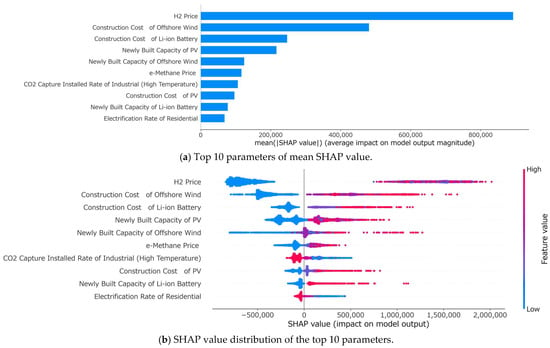
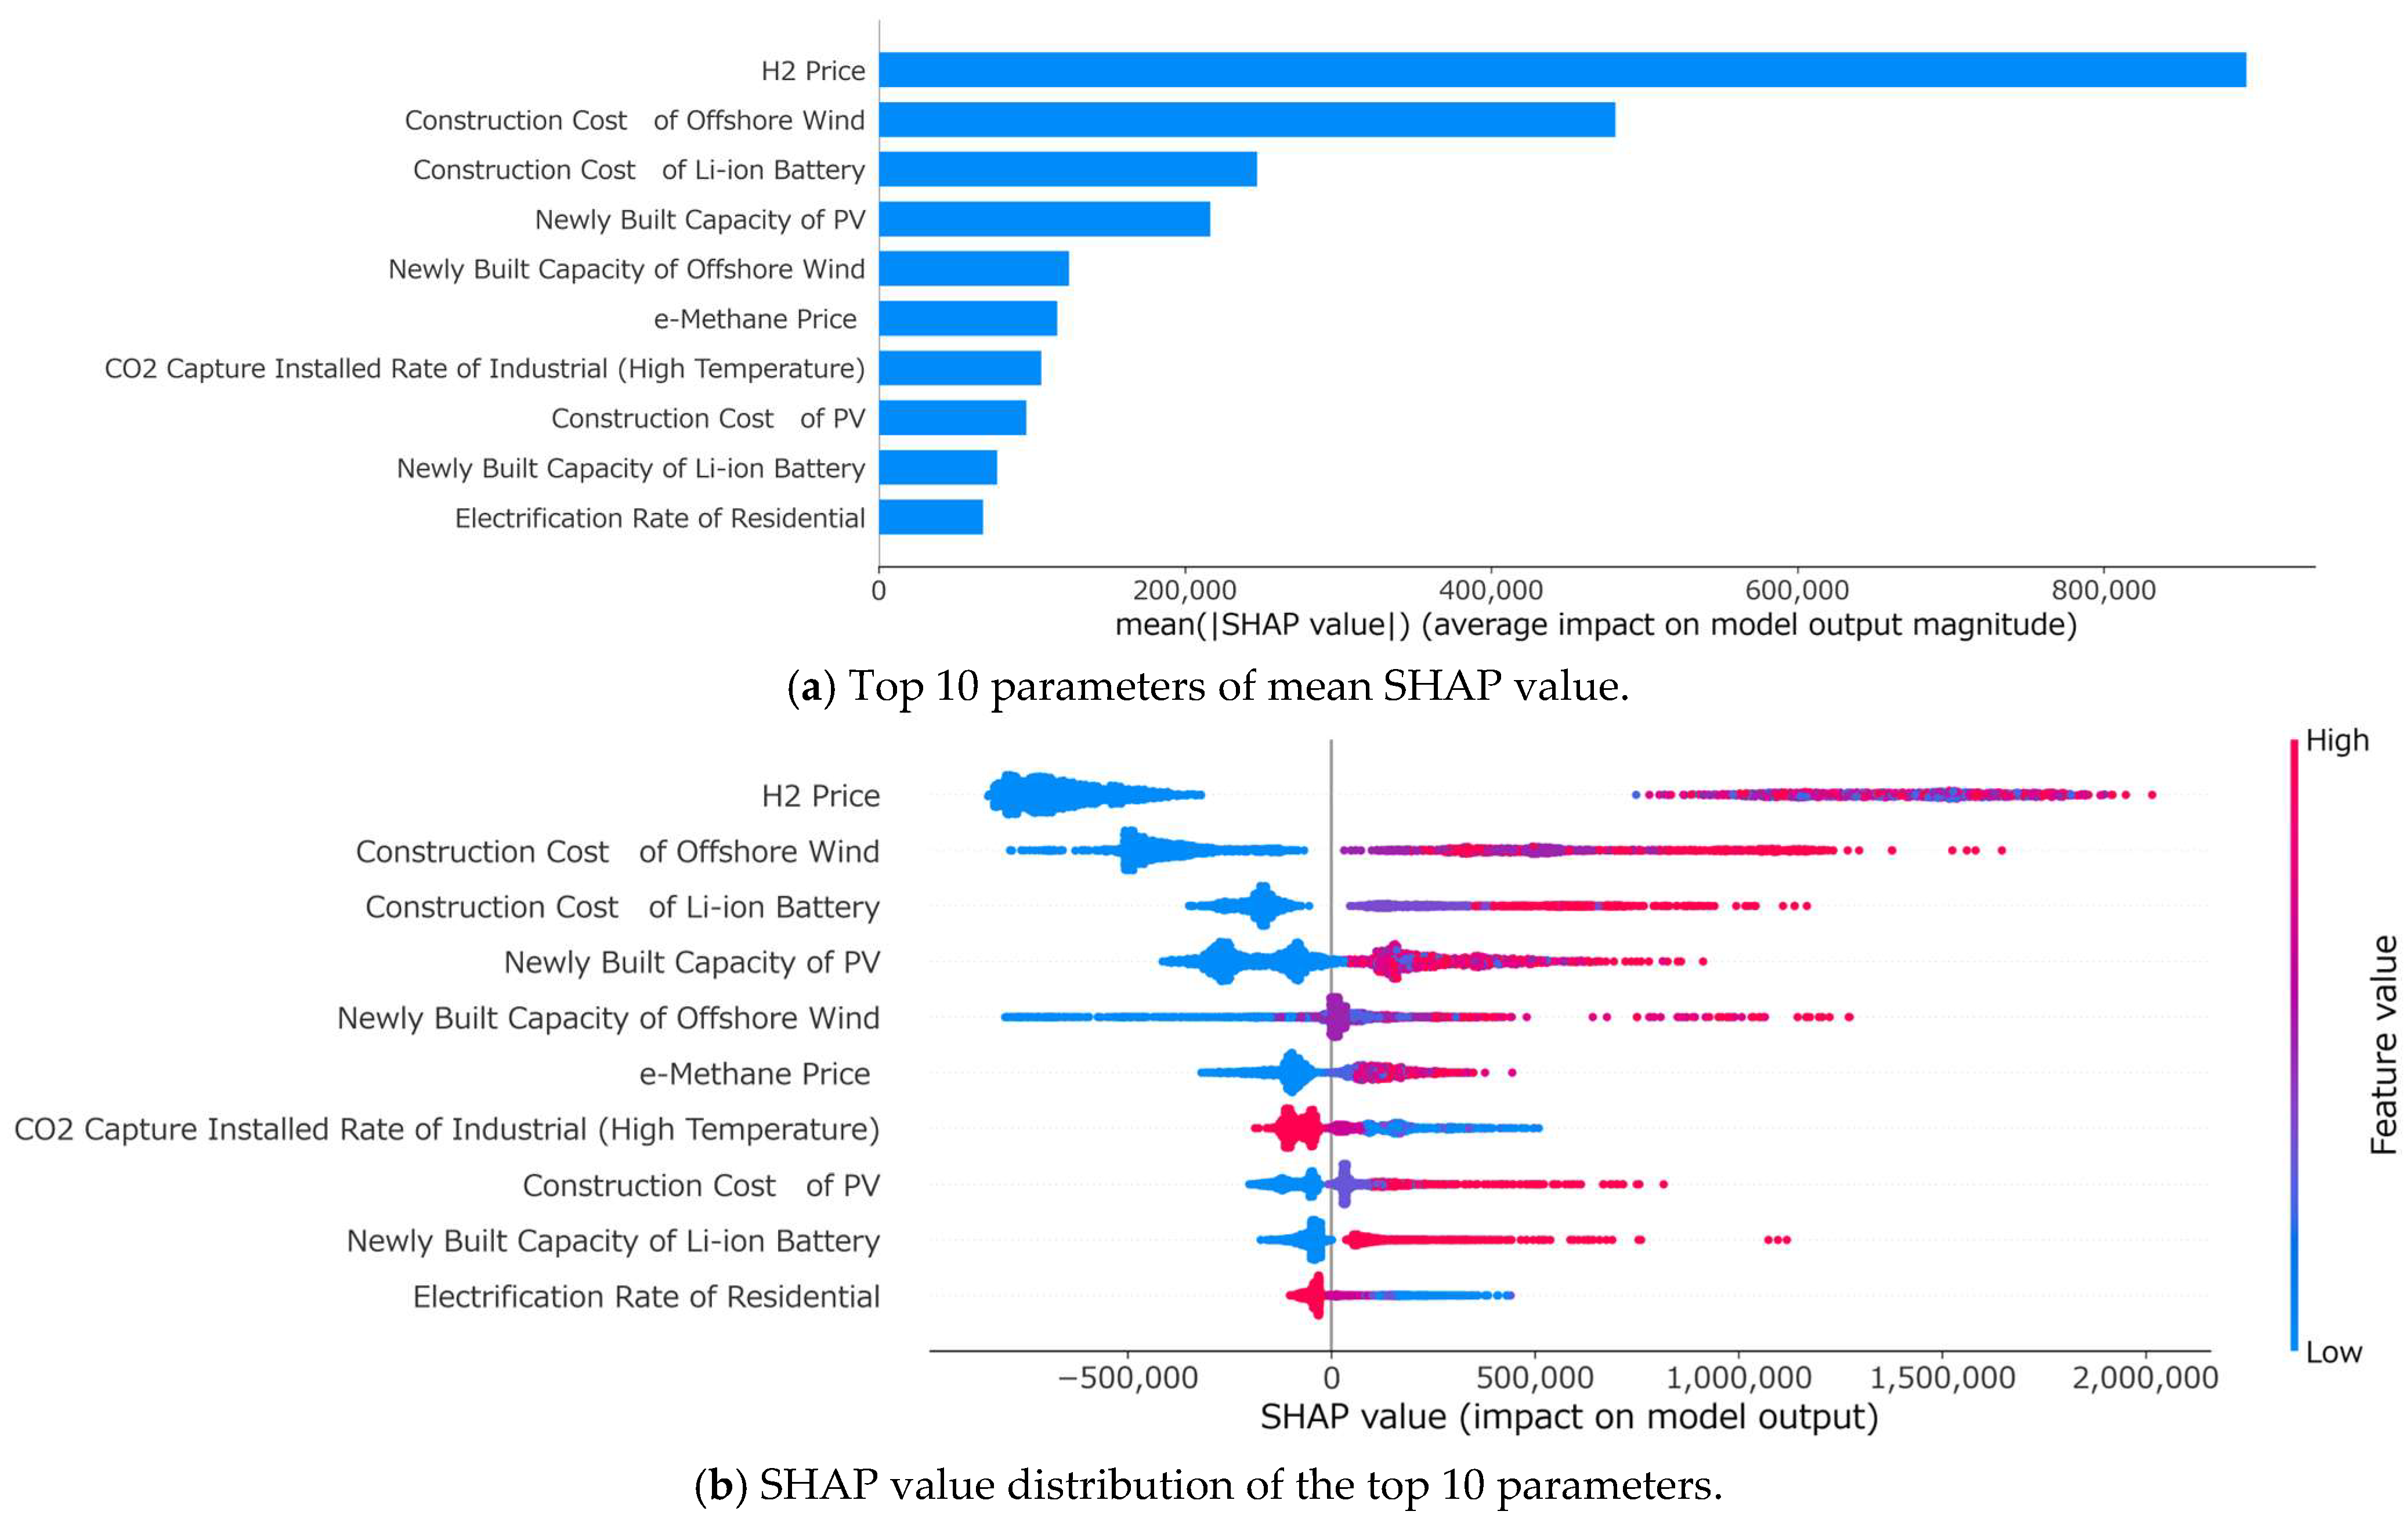
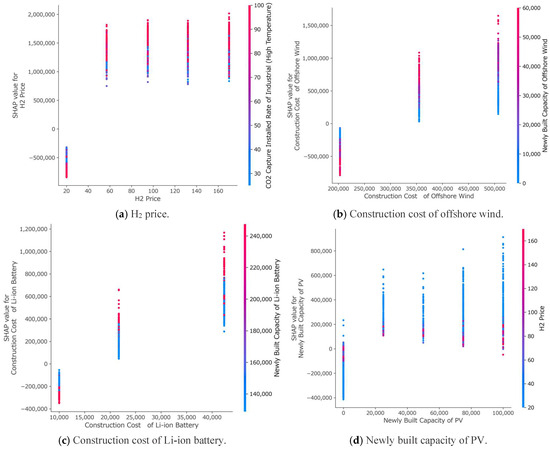
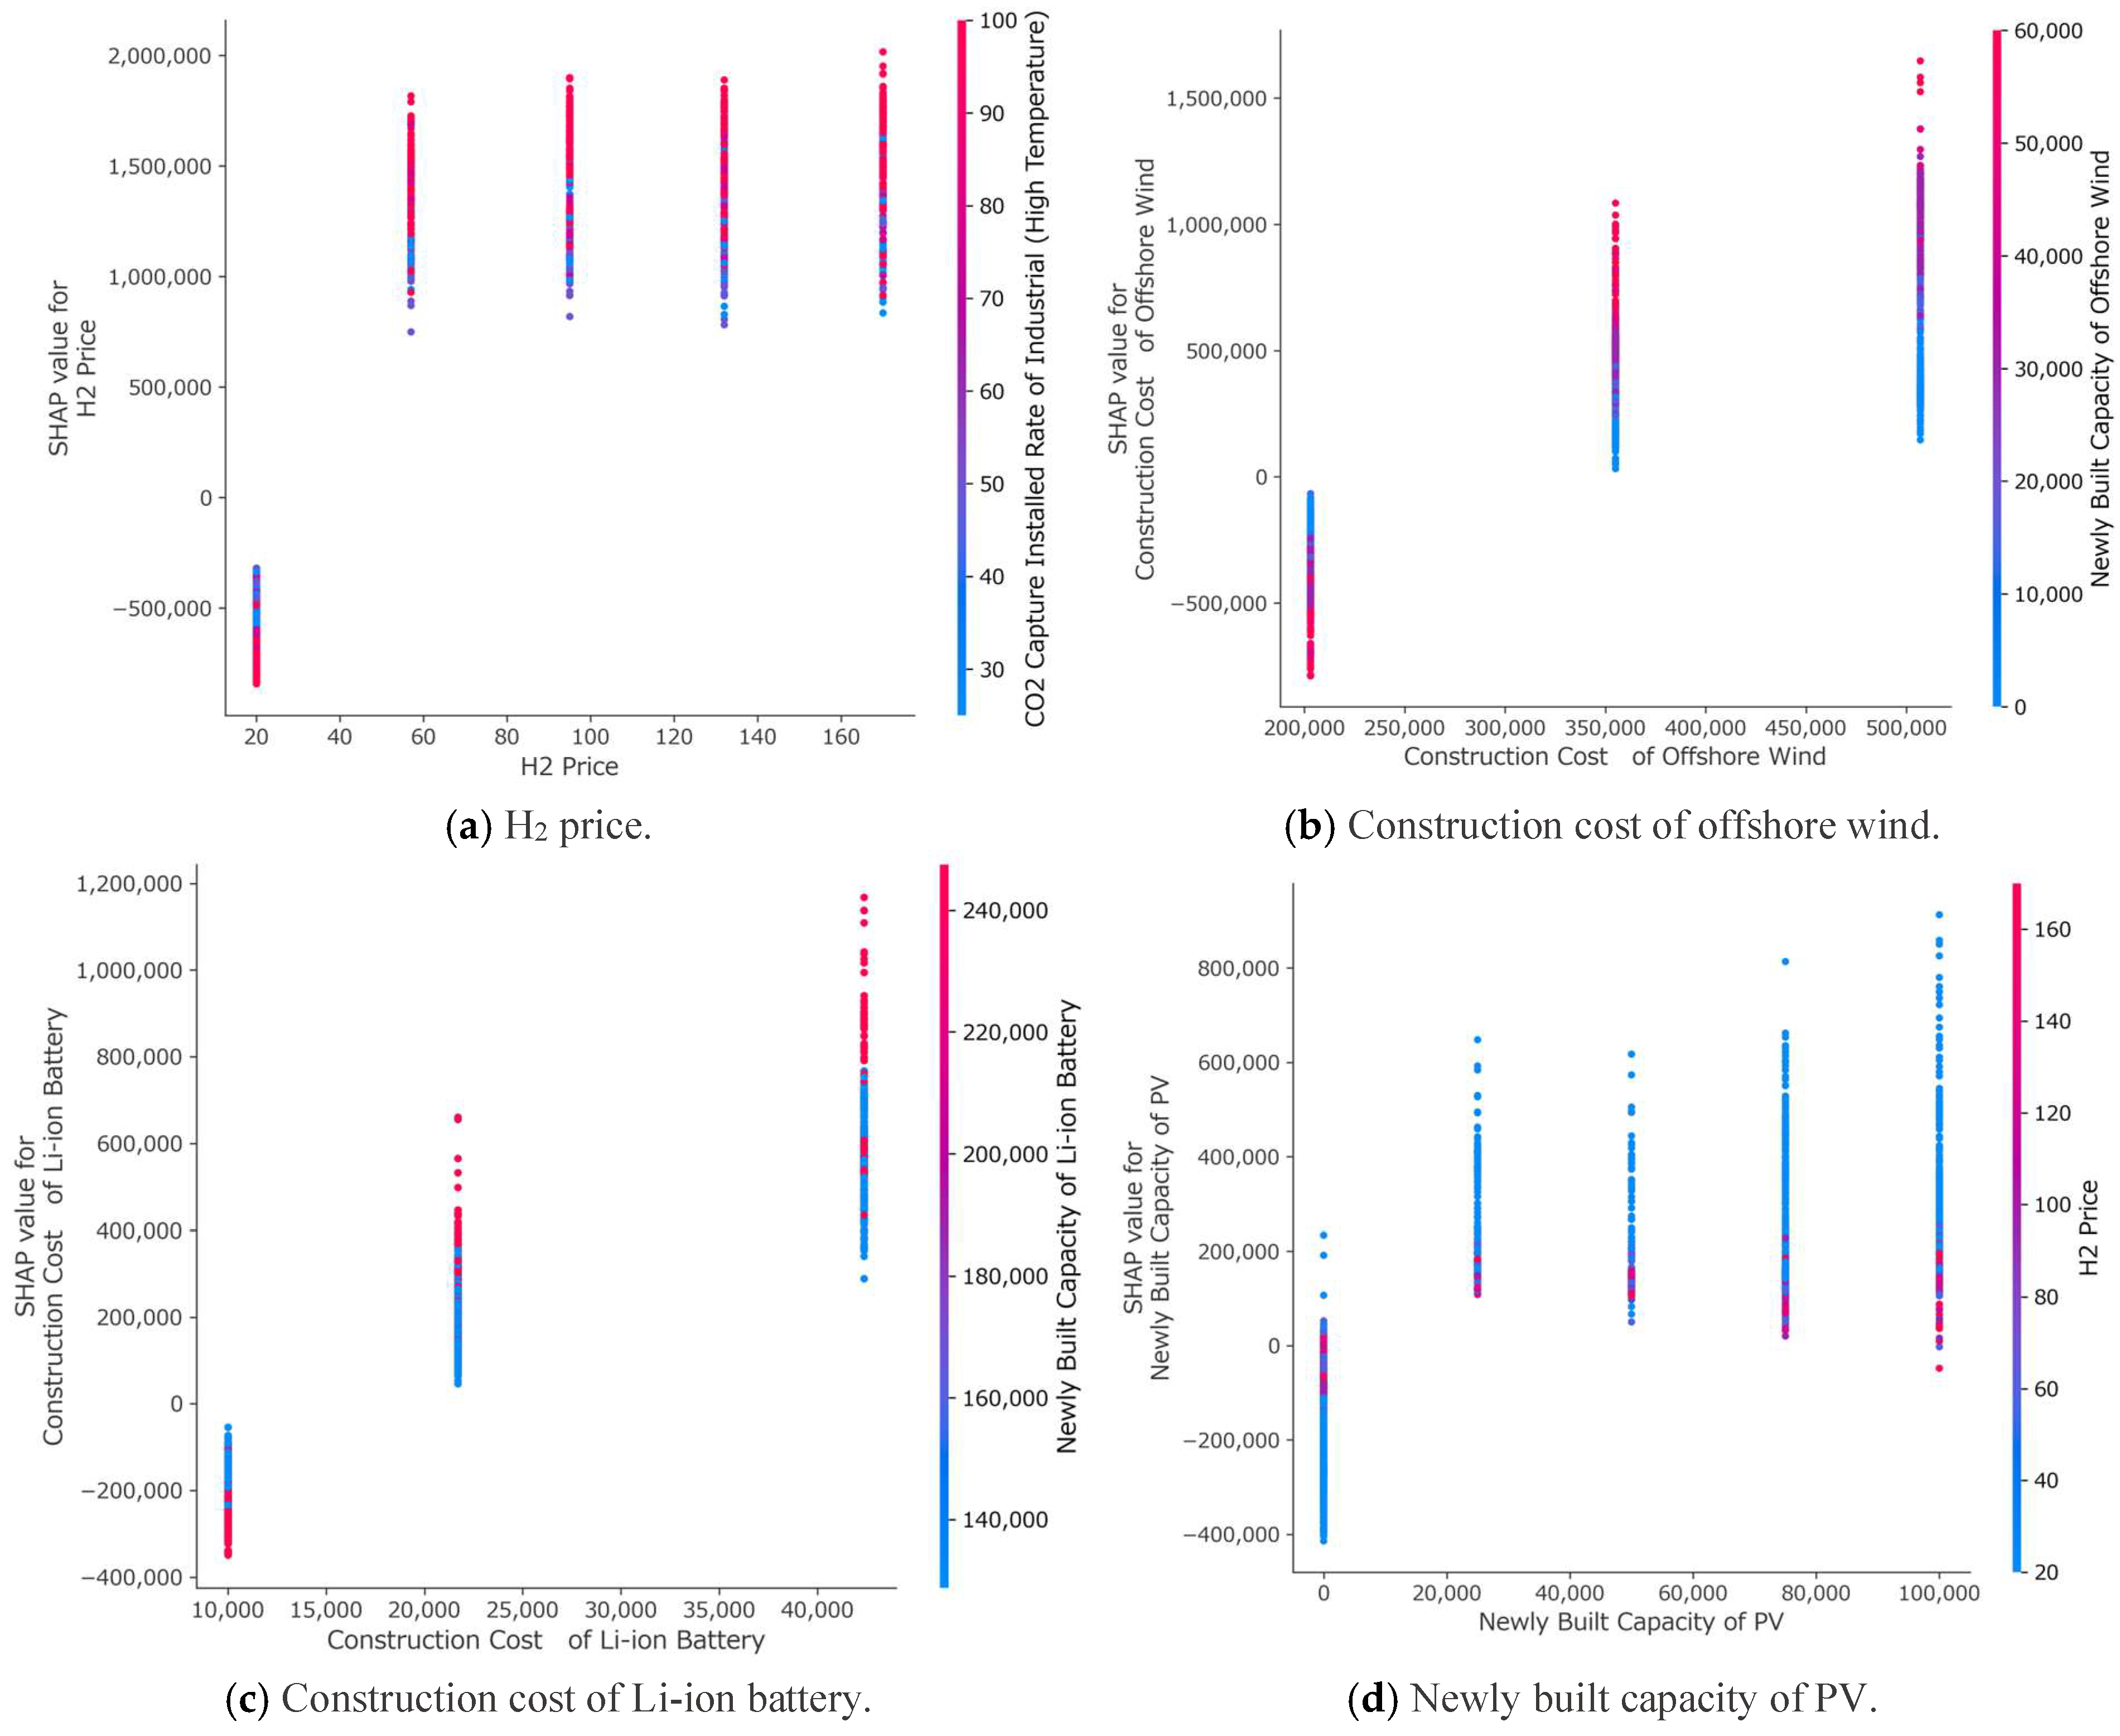
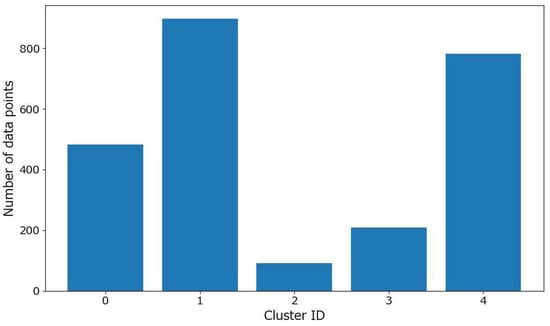
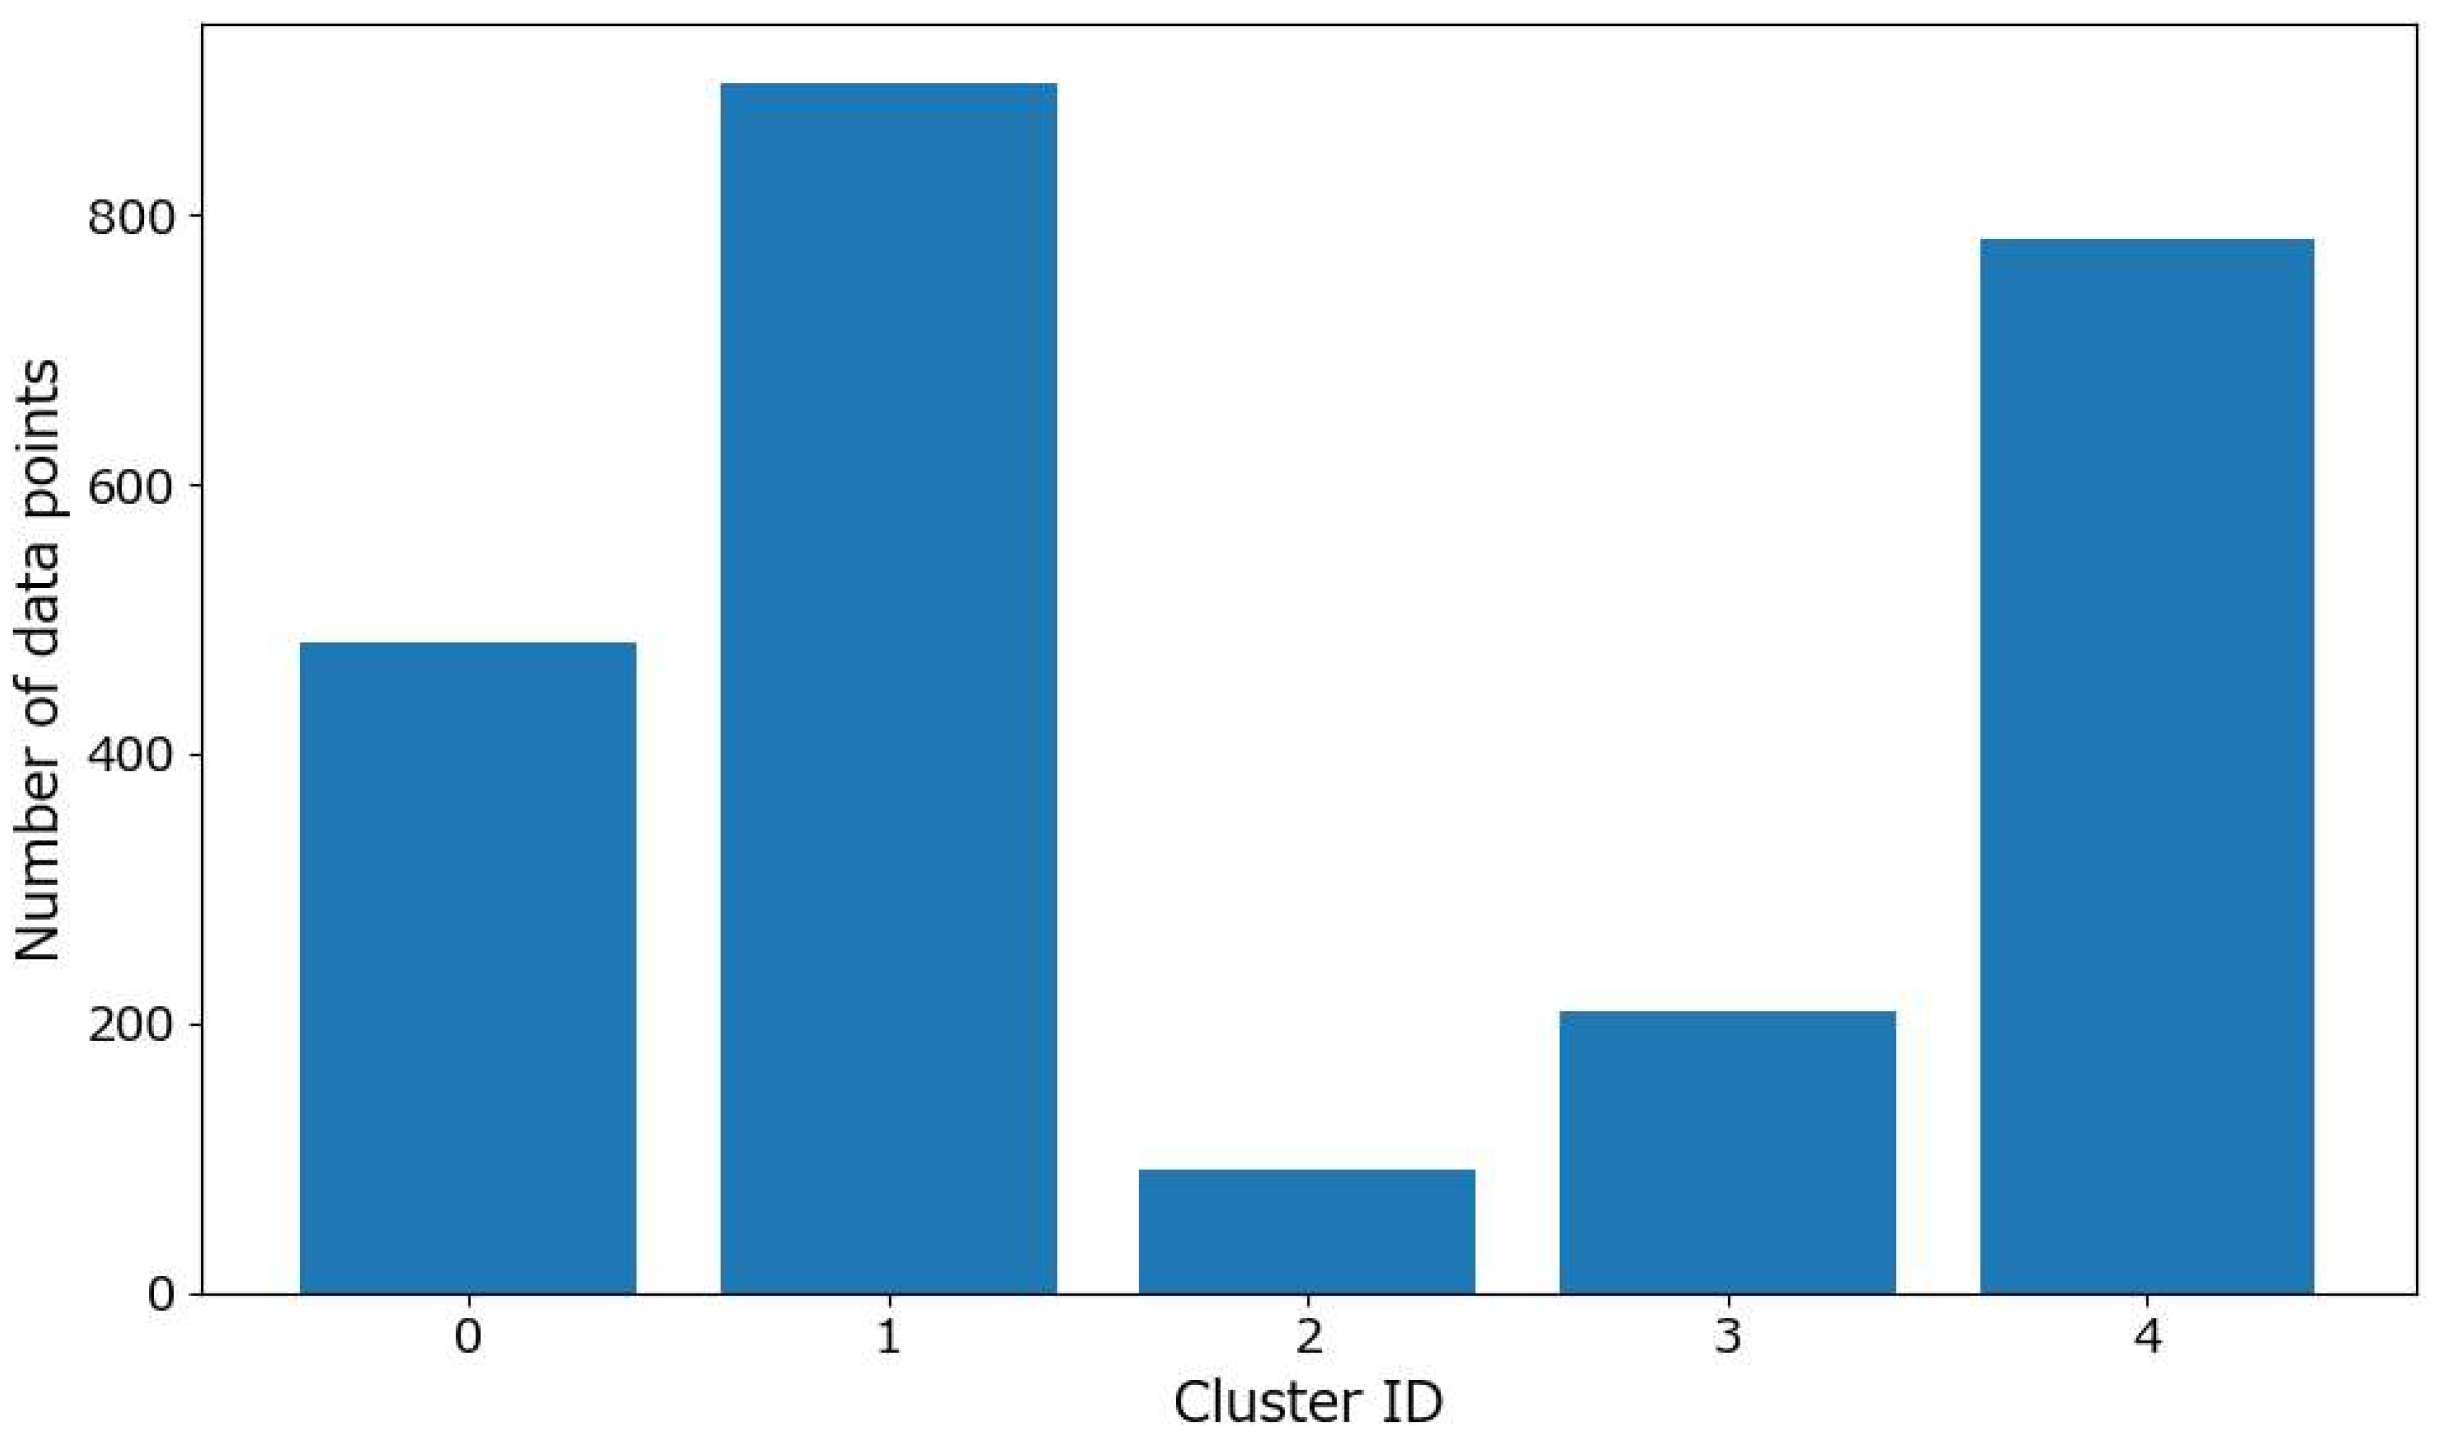
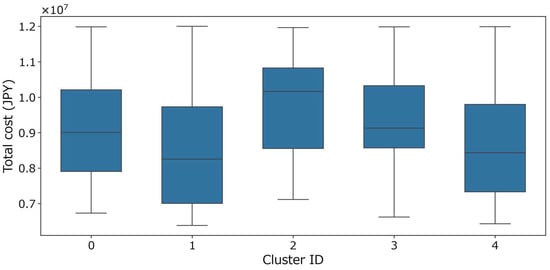
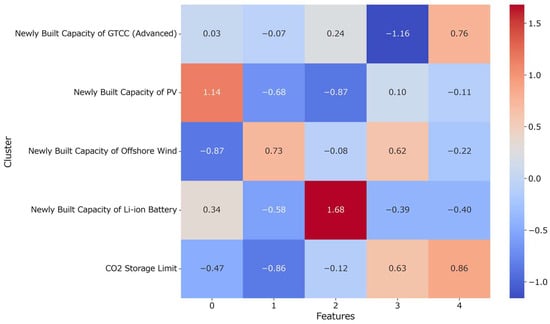

Disclaimer/Publisher’s Note: The statements, opinions and data contained in all publications are solely those of the individual author(s) and contributor(s) and not of MDPI and/or the editor(s). MDPI and/or the editor(s) disclaim responsibility for any injury to people or property resulting from any ideas, methods, instructions or products referred to in the content. |
© 2026 by the authors. Licensee MDPI, Basel, Switzerland. This article is an open access article distributed under the terms and conditions of the Creative Commons Attribution (CC BY) license.