


Abstract
Plate–fin heat exchangers (PFHEs) are widely used in petrochemical, energy and electric power, aerospace, and other industries with large heat transfer requirements. The development of performance prediction and optimization methods for PFHEs has become increasingly important in the design and operation of such heat exchangers (HEs). This paper establishes a database of flow and heat transfer characteristics for four types of PFHEs with different structural parameters. Based on this database, the back-propagation artificial neural network (BP-ANN) model was optimized using the particle swarm optimization (PSO) algorithm to form the PSO-BP-ANN model for the performance prediction of these four types of PFHEs. This combination has been found to improve the prediction accuracy and generalization ability of the BP-ANN model. Additionally, the non-dominated sorting genetic algorithm II (NSGA-II) method was used to characterize the relationship between four structural parameters to be optimized (the length, height, spacing, and thickness of the HE fin) and the two objective functions (j and f) of the serrated PFHE in laminar flow. This enables the Pareto optimal solution to be obtained. The results show that, under laminar flow conditions (Re = 800), the serrated fin HE achieves the best heat transfer performance when the fin height, spacing, thickness, and length are 9.29, 1.22, 0.16, and 3.06, respectively.
1. Introduction
The worldwide demand for energy saving and carbon reduction has pushed the traditional energy industry to pursue higher efficiency. Meanwhile, with the rapid rise of Internet of Things technology, intelligent heat exchangers (HEs) have emerged. Plate–fin heat exchangers (PFHEs) are widely used in areas such as petrochemical, energy and power, marine engineering and aerospace, etc. [1]. The core component that determines the flow and heat transfer performance of a PFHE is the plate bundle. It is fabricated by brazing fins and deflectors together, and it comes in various structural types. Common plate–fin structures include straight fins, wavy fins, serrated fins, porous fins, and louvered fins [2]. Therefore, it is extremely important to develop performance prediction and optimization methods for the design and manufacture of PFHEs.
PFHEs usually rely on existing empirical correlations for performance prediction and optimal design [3]. These correlations are obtained from experiments or numerical simulations. However, they are limited by the structure of the HE and the type of working fluid, and some predicted data exhibit large errors [4]. In recent years, machine learning algorithms (MLAs) have broken through the technical bottlenecks of the above methods. Owing to their fast convergence and high accuracy, MLAs have gradually become a research hotspot [5,6]. In 2003, Islamoglu [7] established an artificial neural network (ANN) model to predict the heat transfer rate of heat exchangers (HEs) and discussed the feasibility and applicability of ANN in the field of HEs. Zhao [8] also pointed out that the heat transfer coefficient of an HE depends on the physical properties of the working fluid at different operating pressures and temperatures. Nonetheless, ANN is more flexible and adaptable in dealing with such complex nonlinear problems.
The BP-ANN method is based on the error back-propagation algorithm, which gradually adjusts the network parameters to better fit the training data, and it has attracted attention in the performance prediction of HEs [9]. Peng and Ling [10] used this method to establish a prediction model for the j and f factors of five PFHE channels; the mean square errors between the predicted and experimental values were less than 1.5% and 1%, respectively. Based on the same method, Dong and Du [11] found that the BP-ANN model is easily affected by the choice of initial parameters and data distribution, and tends to fall into a local optimum.
In view of the above problems, the Genetic Algorithm (GA) is used to improve the global search and local optimization capability of the BP-ANN model. However, studies have shown that GA-BP-ANN suffers from high computational complexity and difficulties in parameter selection, which ultimately slows down computation. To further optimize the prediction model, Zhao et al. [12] introduced Particle Swarm Optimization (PSO) to optimize the weights and thresholds of the BP-ANN model. Not only does this make global search possible, but it also prevents the model from falling into a local optimum due to premature convergence, thereby avoiding large deviations in some predicted values and other consequent problems [13]. Wang et al. [14] established a prediction model for HE channels and compared the prediction results before and after PSO. They found that the mean squared errors for Nu and f obtained after PSO were reduced by 56.8% and 95.2%, respectively. In summary, in the engineering design of HEs, the PSO-BP-ANN model offers unique advantages, such as global search capability, fast training, high precision, and strong generalization ability.
How to design a heat exchanger with high efficiency and low energy consumption to achieve the engineering goals of enhancing heat transfer and reducing flow resistance is an important issue [15,16]. Segundo et al. [17] proposed the Falcon optimization algorithm and applied it to the single-objective and multi-objective optimization of PFHEs. Wang et al. [18] successfully used the genetic algorithm for multi-objective optimization; the maximum performance evaluation criterion (PEC) and the maximum field coordination number (Fc) were used as two objective functions to optimize the structure of the convex heat exchanger. The results showed that the optimized structure could significantly improve the comprehensive heat transfer performance of the convex heat exchanger. Lv et al. [19] combined machine learning and NSGA-II to study the influence of different design variables on the friction coefficient, PEC, and entropy production (S) of PCHE. The TOPSIS decision-making method was used to select the optimal solution from the Pareto frontier. Compared with the original situation, the optimal situation increased the PEC by 8.5% and reduced the S value by 9.98%. He et al. [20] studied PFHEs by combining NSGA-II with an ANN model. They took minimizing the heat source mean temperature and minimizing the pressure drop as the objective functions to optimize the fin geometry and maximize its overall performance, and they obtained an acceptable optimization solution. Wang et al. [14] considered airfoil fin PFHEs and combined the NSGA-II and PSO-BP-ANN models to optimize the fin arrangement parameters. They achieved a 113.25% reduction in the friction factor f at the expense of a 10.29% reduction in Nu. Yang et al. [21] combined the sensitivity analysis method with NSGA-II to predict and optimize the structural parameters of serrated fin PFHEs. Studies have shown that NSGA-II combined with the PSO-BP-ANN model can provide parameter optimization guidance for the development of green and high-efficiency HEs [22], but it has not received sufficient attention or been widely applied in HE optimization.
Therefore, this study develops a data-driven prediction and optimization framework for PFHE fin channels. Empirical correlations are useful for engineering calculations, but their applicability is often limited by the tested geometry, working fluid, and operating range. For fin channels with different structural parameters, the relationship between geometry and the j and f factors is nonlinear, and the use of a single correlation may lead to inconsistent prediction results. In this context, BP-ANN is used to learn the mapping between fin-channel parameters and thermal–hydraulic performance, while PSO is introduced to reduce the influence of initial weights and thresholds on the ANN prediction. Since heat transfer enhancement and flow resistance reduction are competing requirements, the optimized PSO-BP-ANN model is further coupled with NSGA-II to identify a reasonable compromise for serrated fin design within the database range.
2. Database Establishment
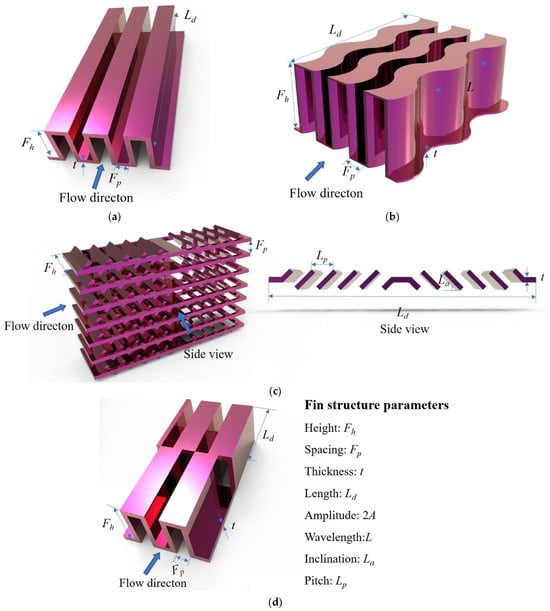
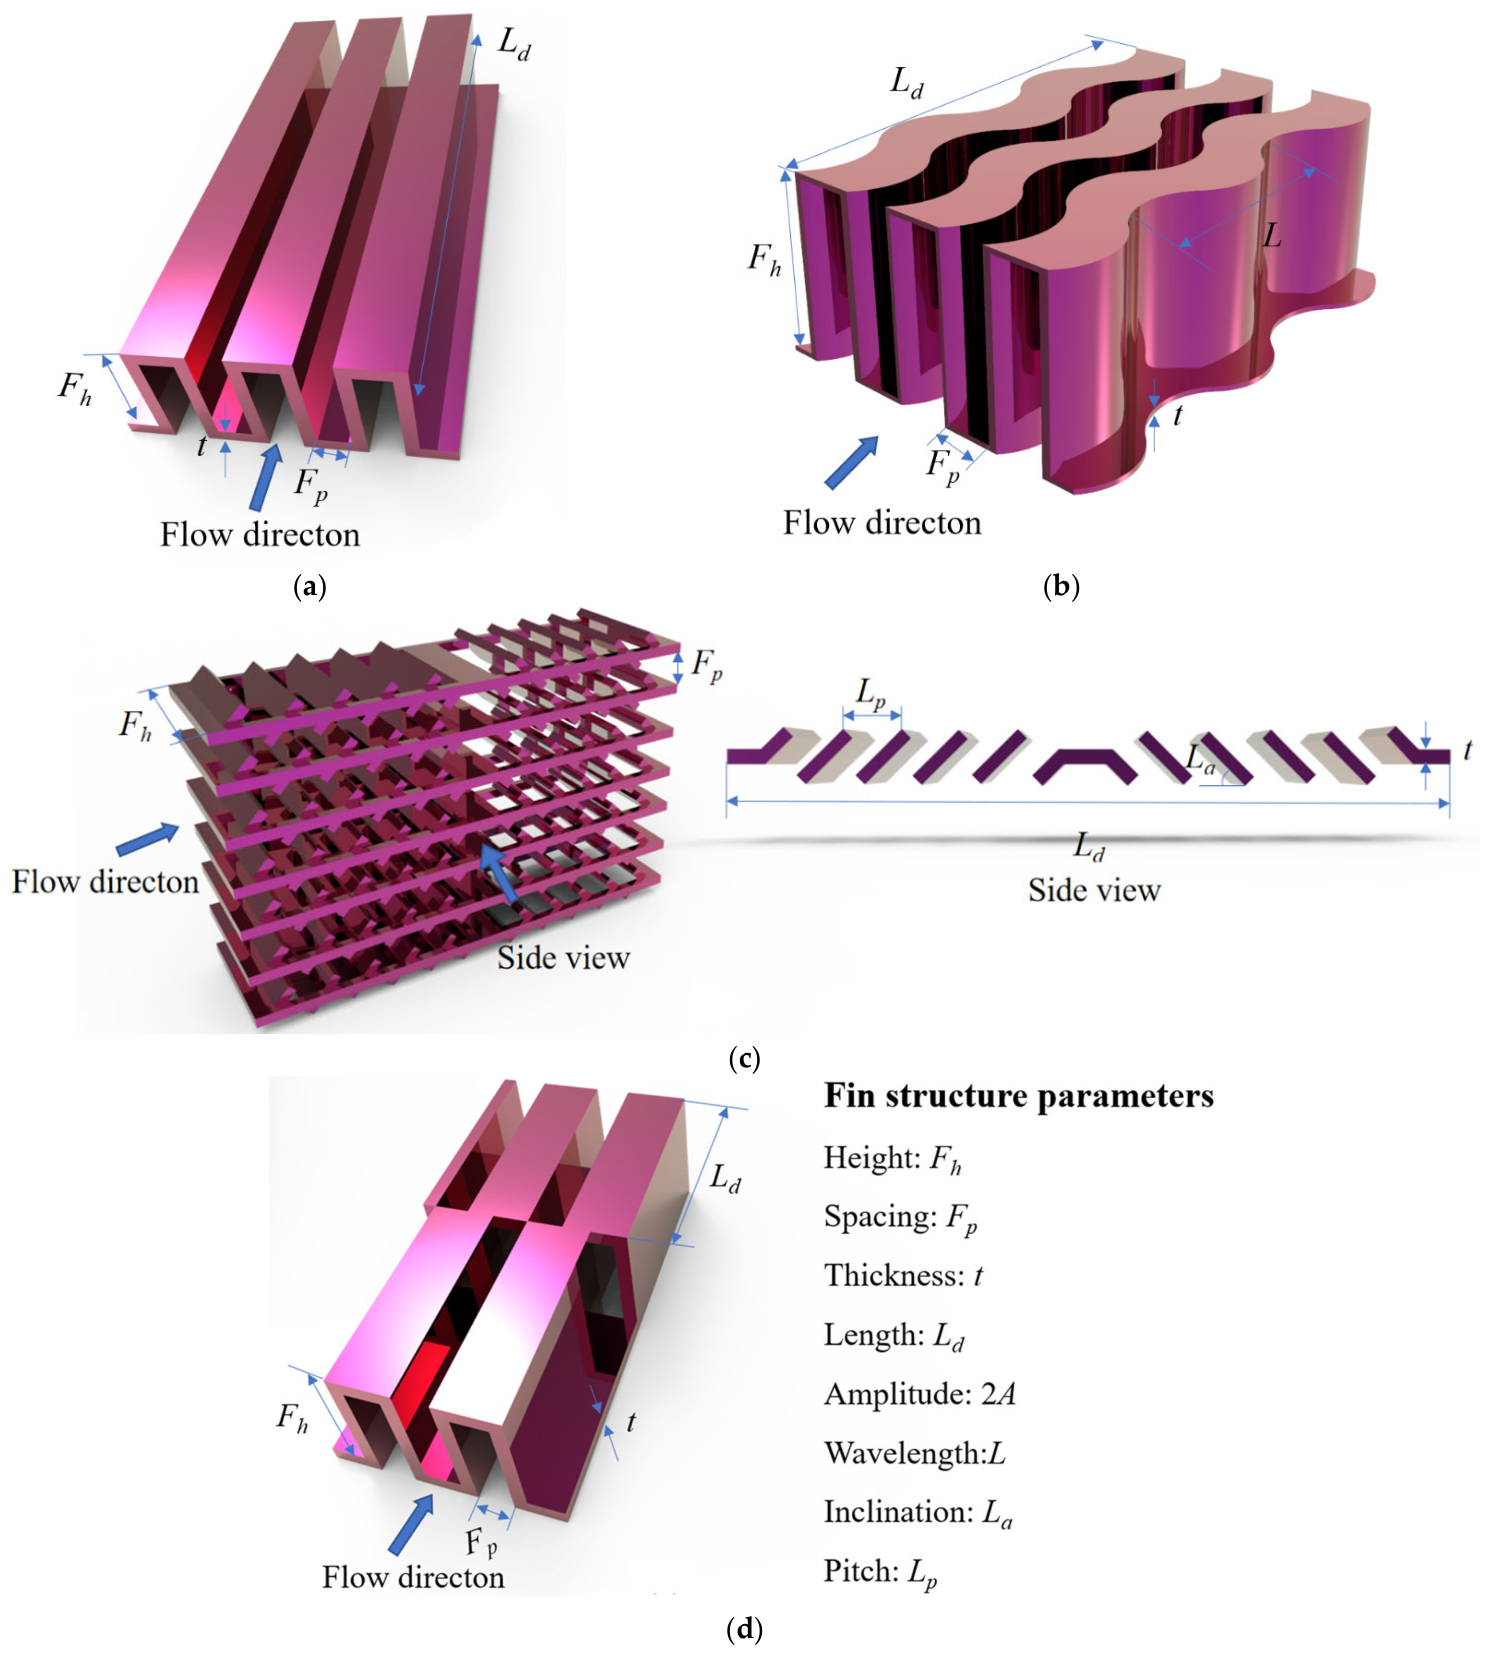
In this paper, the heat transfer and flow resistance performance database of the fin channels of four types of PFHEs using air as the working fluid is established through the literature data [23,24,25,26,27,28,29,30,31,32,33,34,35] and numerical simulation (see Appendix A for details). The database provides supporting data for the subsequent development of a performance prediction model for the heat exchangers. The four types of PFHEs are shown in Figure 1, and their main structural parameters and performance data sources are shown in Table 1. Here, the dimensionless parameters to assess heat transfer efficiency and fluid flow resistance are defined as j factor and f factor, respectively.
Figure 1.
Schematic structure diagram of PFHEs: (a) straight fin; (b) wavy fin; (c) louver fin; (d) serrated fin.
Table 1.
Main structural parameters and performance data sources.
Table 2 presents the Chinese standard for aluminum plate–fin heat exchangers. Song et al. [36] showed that the existing correlations in the literature yield significant errors when predicting the performance of Chinese serrated fin channels. To obtain a broader set of performance data, we will supplement the data for domestic serrated fin channels through numerical simulation.
Table 2.
Structural parameters of domestic serrated fins.
The solid material of the serrated fin channels is aluminum, and the working fluid is air. The physical properties of air are shown in Table 3.
Table 3.
The physical properties of air.
To improve computational efficiency, a steady-state model is adopted in this study, with the following assumptions:
- (1)
- The fluid in the channel is incompressible and undergoes no phase change.
- (2)
- The working medium is single-phase dry air, and its thermophysical properties remain constant.
- (3)
- The effects of thermal radiation and natural convection can be neglected during the flow.
In this section, ANSYS Fluent 17.0 is used to analyze the flow and heat transfer characteristics of the serrated fin channel. The continuity, momentum, and energy equations are given as follows:
The serrated fin channel model in this study should ensure that the ratio of flow length to hydraulic diameter is greater than 60. To prevent backflow, the lengths of both the inlet and outlet extension sections are each 20 times the hydraulic diameter. The calculation method for the inlet velocity of the extension section is as follows:
where u is the velocity at the fin inlet, uin is the velocity at the extension section inlet, Ac is the cross-sectional area of the fin, and Ain is the cross-sectional area of the extension section inlet.
The inlet face is set as a velocity inlet, and the outlet face as a pressure outlet. The inlet air temperature is 300 K, and the temperatures of the upper and lower parting sheets are 373.15 K. Periodic boundary conditions are applied to the left and right sides of the channel. For 300 ≤ Re < 1000, the laminar model is used; for Re > 1000, the SST k-ω turbulence model is employed. The transport equations for the turbulent kinetic energy k and the dissipation rate ω are respectively given as follows:
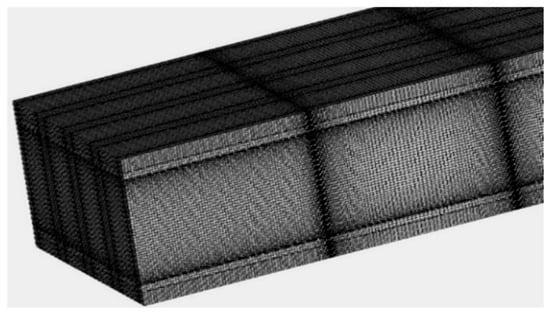
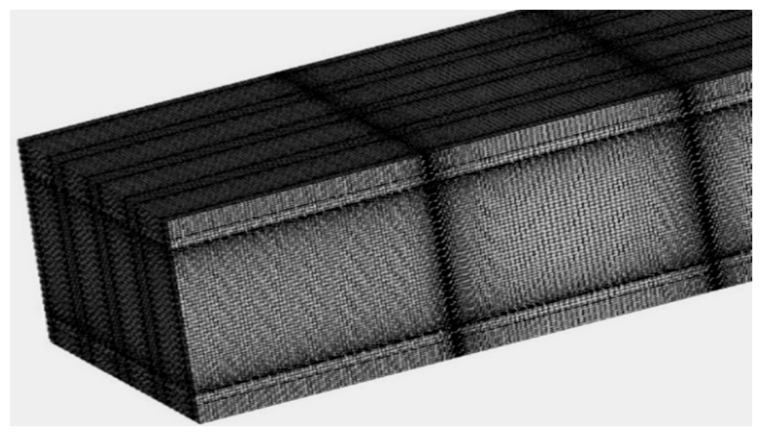
The pressure-velocity coupling is handled by the SIMPLE algorithm, and the second-order upwind scheme is adopted for the energy and momentum equations. The solution is considered converged when the computational residuals fall below 10−6. The computational model is meshed with structured grids generated by ICEM software 19.0. Boundary layer grids are applied near the walls and locally refined. A schematic of the mesh is shown in Figure 2.
Figure 2.
Schematic diagram of serrated fin grid.
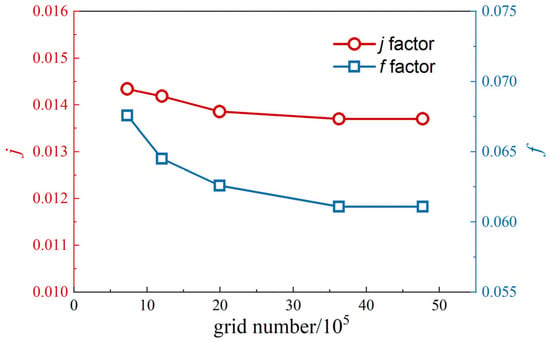
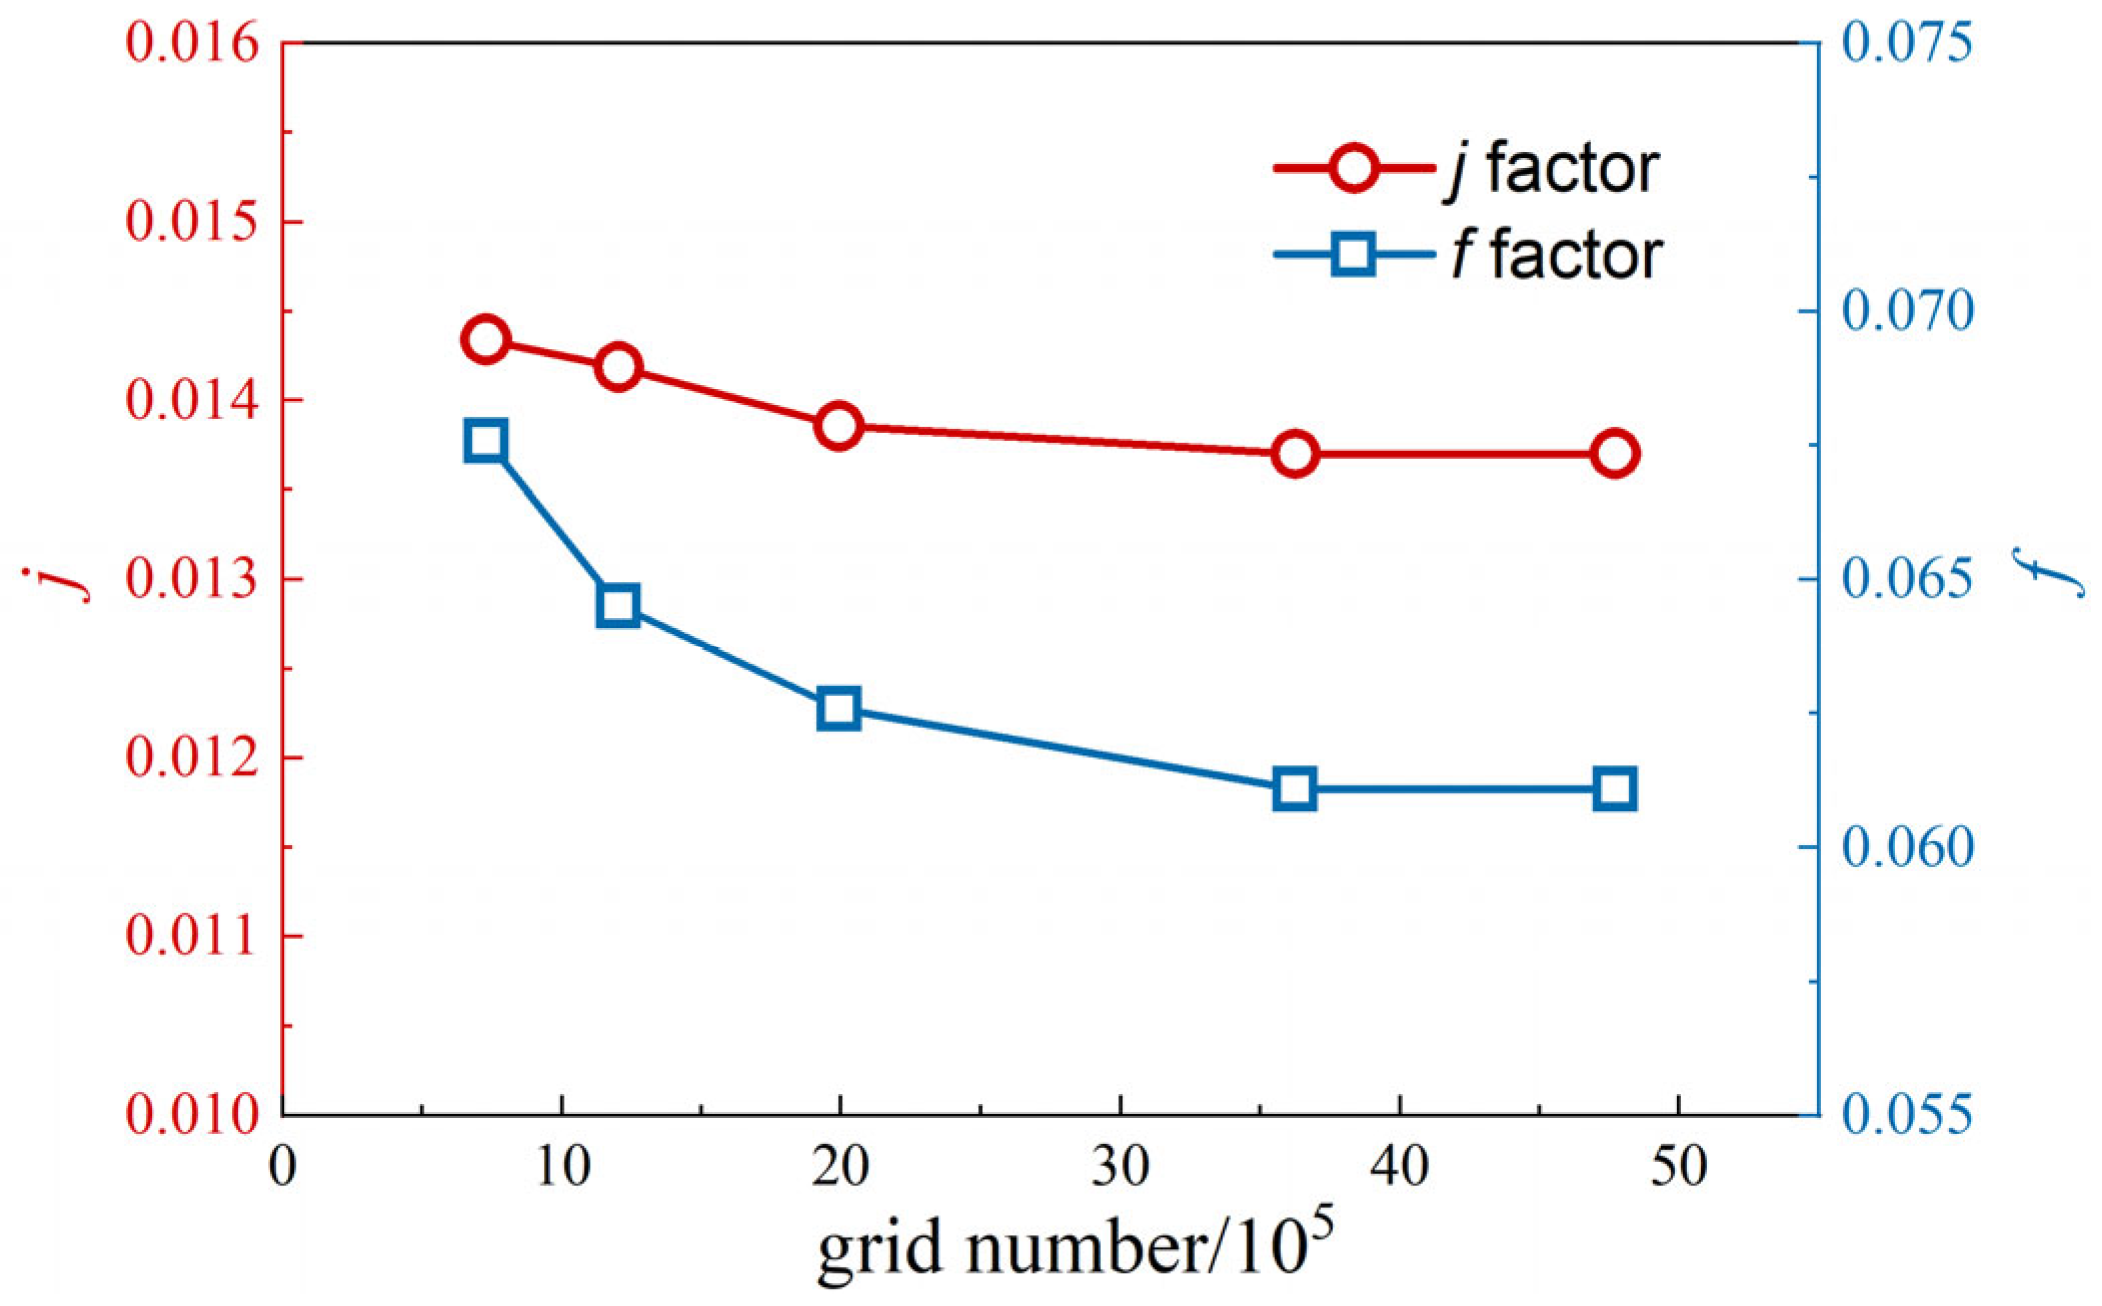
Figure 3 shows the grid independence verification for the 47JC2003 fin channel at Re = 800. The variations in both the heat transfer factor and the friction factor between the results obtained from the third and fourth sets of grids are less than 1%. To balance numerical accuracy and computational cost, a grid number of 3,626,320 is selected for the 47JC2003 fin channel. The grid numbers for all the serrated fin channels of the plate–fin heat exchangers in this study range from 2,519,130 to 8,296,832.
Figure 3.
Grid independence verification diagram.
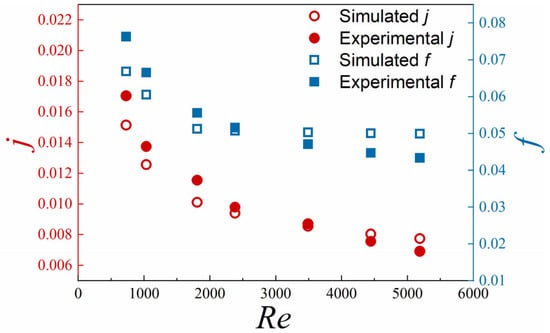
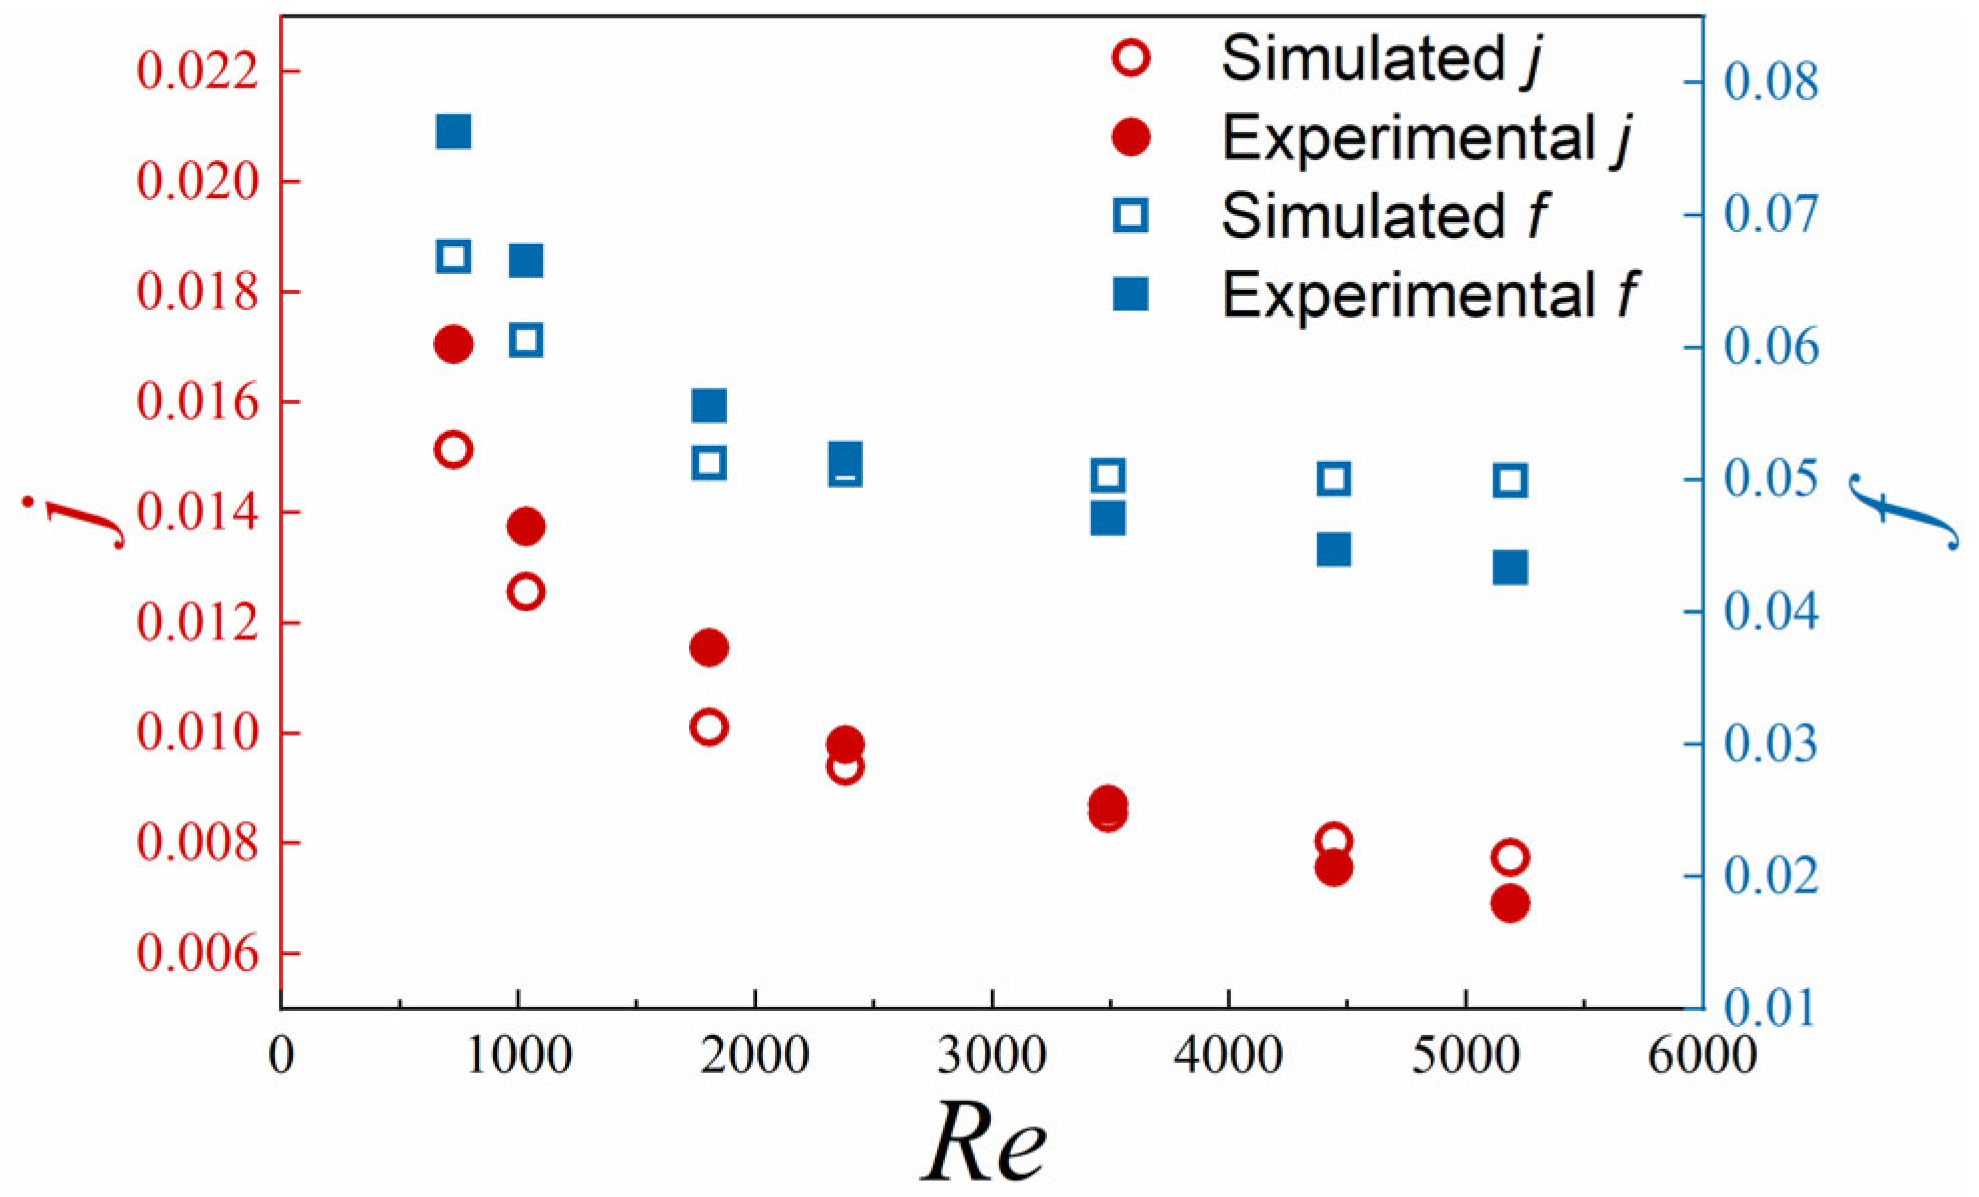
To verify the accuracy of the numerical simulation, the computed values are compared with the experimental data from reference, and the results are shown in Figure 4. As can be seen from Figure 4, the numerically simulated j and f factors agree well with the experimental values, with mean absolute percentage errors of 8.07% and 9.28%, respectively. Therefore, the numerical simulation results are considered reliable.
Figure 4.
Comparison of numerical simulation and experimental results.
Within the range of serrated fin geometries both domestic and international, four structural parameters were uniformly selected according to the rules of orthogonal experiments. The structural parameters of the serrated fins are listed in Table 4. Performance data of 25 serrated fin channels were obtained through numerical simulation and randomly mixed with literature data to expand the serrated fin channel database.
Table 4.
Design Points for Orthogonal Experiments.
3. Machine Learning Model Establishment
3.1. Sample Data Preprocessing
Before training the model, the input data need to be normalized to eliminate the differences in magnitude among the sample variables and to balance the influence of each parameter on the model prediction. At the same time, normalization can map the data into a region where the activation function has a large gradient, thereby preventing neurons from having zero gradients during training. As shown in Equations (7) and (8), the data are normalized (and denormalized) to fall within the range [0.15, 0.85]. Separate models were trained independently for each fin type. For each dataset, 85% of the data were used for training and the remaining 15% for testing. For the serrated fin channel, the 25 additional CFD cases were merged with the literature data before the dataset was split into training and testing sets.
In Equations (7) and (8), Smax and Smin are 0.85 and 0.15, respectively; Pmax and Pmin are the maximum and minimum values of input variables; Pn and Pm are the normalized data and denormalized data, respectively.
3.2. Establish PSO-BP-ANN Prediction Model
3.2.1. Establish BP-ANN Model
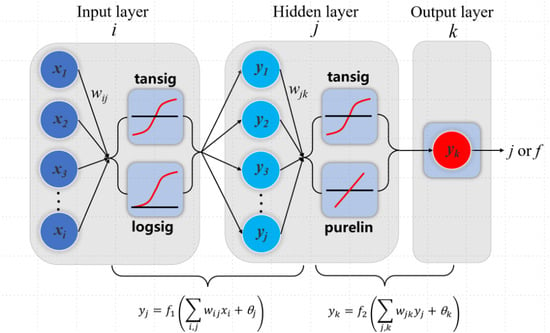
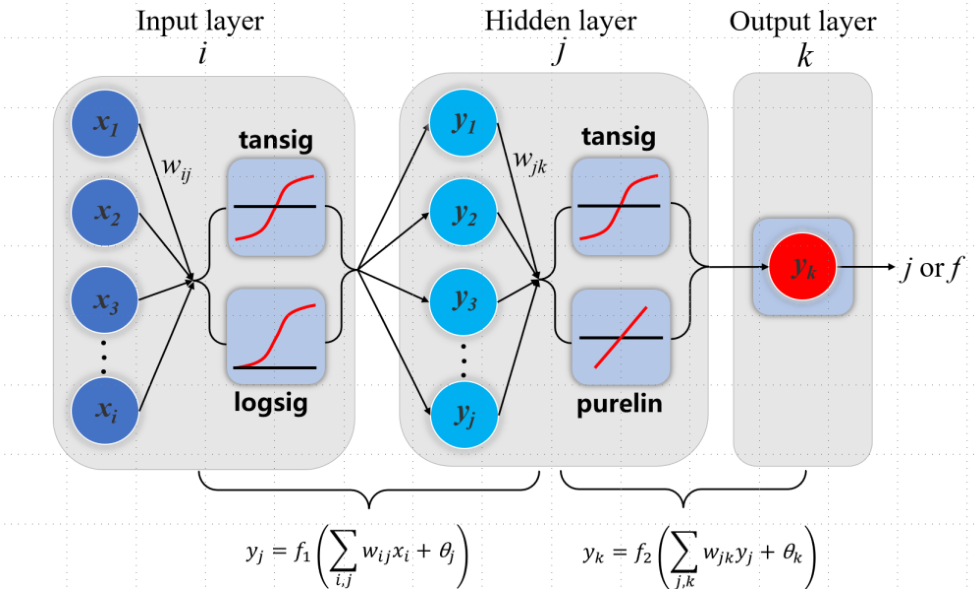
The BP-ANN prediction models established in this paper adopt a three-layer neural network structure, and the schematic diagram is shown in Figure 5. The input parameters and their upper and lower limits for the HE channels are listed in Table 5. A separate prediction model was established for each fin-channel type because the geometric variables and their dimensionless input forms differ among the straight, wavy, louvered, and serrated fins. The limits listed in Table 5 define the input range of each corresponding model, and the prediction results should be interpreted within these ranges. As can be seen from Table 5, the performance of PFHEs is greatly affected by the cross-sectional shape of the channel. Following the correlation-based approach, the corresponding dimensionless parameters are adopted as the input parameters. Through iterative training and tuning, the optimal configuration of the activation function, training algorithm, learning rate, and number of hidden-layer neurons is determined, as shown in Table 6. During training, the same training and test sets are maintained, and the coefficient of determination (R2), root mean square error (RMSE), and mean absolute percentage error (MAPE) on the test set are chosen as evaluation metrics [37,38,39].
where ti and oi are the target and predicted values, respectively; n is the number of samples.
Figure 5.
Basic structure diagram of BP neural network.
Table 5.
Input parameters and upper and lower limits of the PFHE channels.
Table 6.
Optimal parameters of BP-ANN model for four types of PFHEs.
3.2.2. Particle Swarm Optimization (PSO)
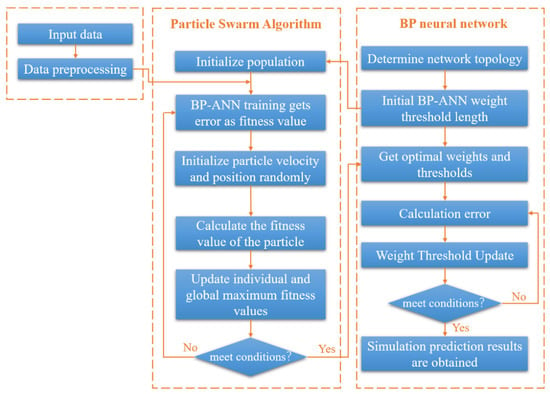
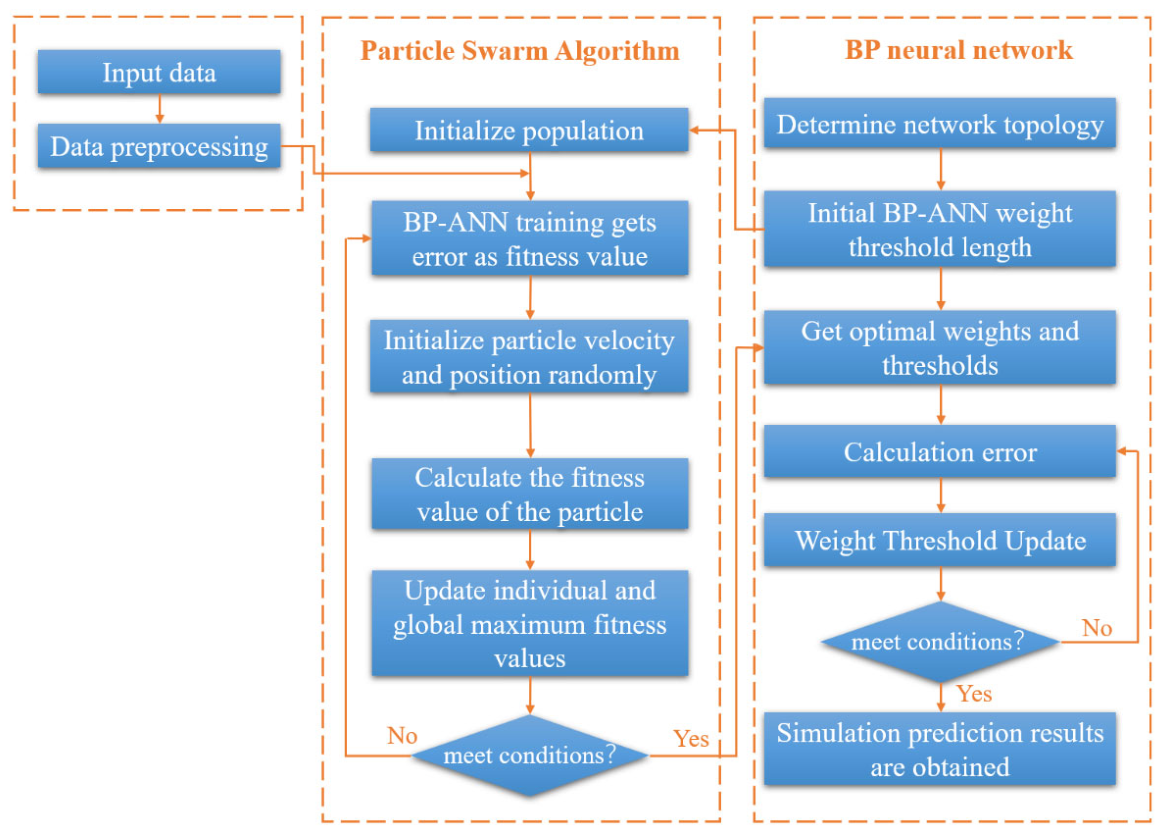
In order to prevent the model from being sensitive to initialization and falling into a local optimum, this paper uses the PSO algorithm, which simulates the collective behavior of bird flocks or fish schools, to find the optimal BP-ANN parameters [40]. The process is shown in Figure 6, and the design steps are as follows:
Figure 6.
Basic structure of PSO-BP-ANN.
- (1)
- Determine the size of the particle swarm and the parameters of the algorithm. The search space has a dimension D, the number of particles is m, the inertia weight is w, and the acceleration factors are C1 and C2, respectively. Here, each particle is a D-dimensional vector, and the weights and thresholds of the BP-ANN are encoded into the particles, so that the particle dimension D equals the total number of weights and thresholds. The initial parameters of the PSO algorithm are set as follows: the maximum number of evolutionary iterations is 200, the population size is 100, the inertia weight is 1, and the acceleration factors C1 and C2 are both 1.5. Through iterative training and tuning, the optimal parameter configuration of the model is determined, as shown in Table 7.Table 7. Optimal parameters of PSO-BP-ANN model for four types of PFHEs.
- (2)
- Determine the fitness function. In the PSO algorithm, the fitness of each particle is defined as the RMSE of the predictions on the training set. The fitness value indicates the quality of the particle and is used to guide the particle swarm search. It is calculated as follows [41]:
- (3)
- Initialize the database and unify the data within the interval [0.15, 0.85]. The generated m particles represent m BP neural networks with different weights and thresholds, and they serve as the initial solution set of the PSO algorithm.
- (4)
- Update the extremum. fitness(Pg(l)) is the global extremum of the population, fitness(Xi(l)) is the fitness value of the individual particle swarm, and fitness(Pi(l − 1)) is the individual extremum value before iteration. If fitness(Xi(l)) < fitness(Pi(l − 1)), then Pi(l) = Xi(l), otherwise, Pi(l) = Pi(l − 1). In those expressions, l is the number of iterations. The global extremum is the individual extremum with the best fitness.
- (5)
- Update the velocity and position. During each iteration, each particle updates its velocity and position based on its individual extremum and the global extremum. To prevent blind search, the velocity and position are constrained within specified ranges, as given by Equations (13) and (14) [41].
3.3. Prediction Results and Error Analysis
3.3.1. Performance Prediction Results Based on BP-ANN Model
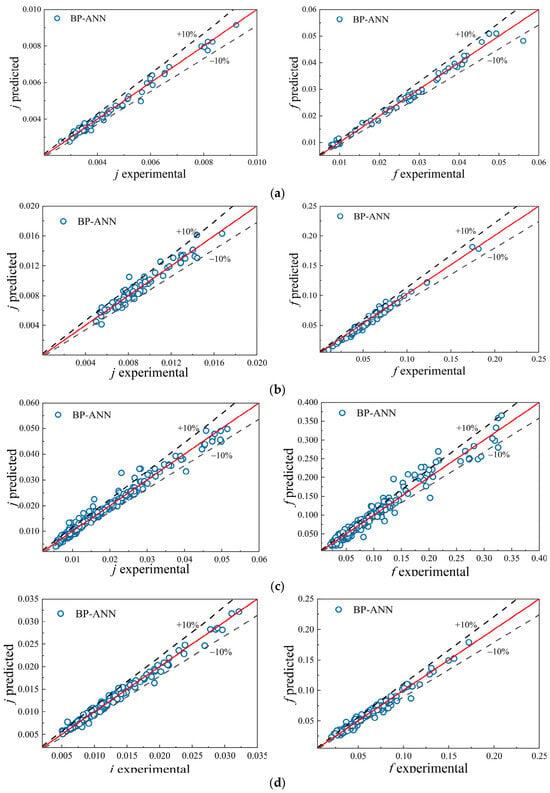
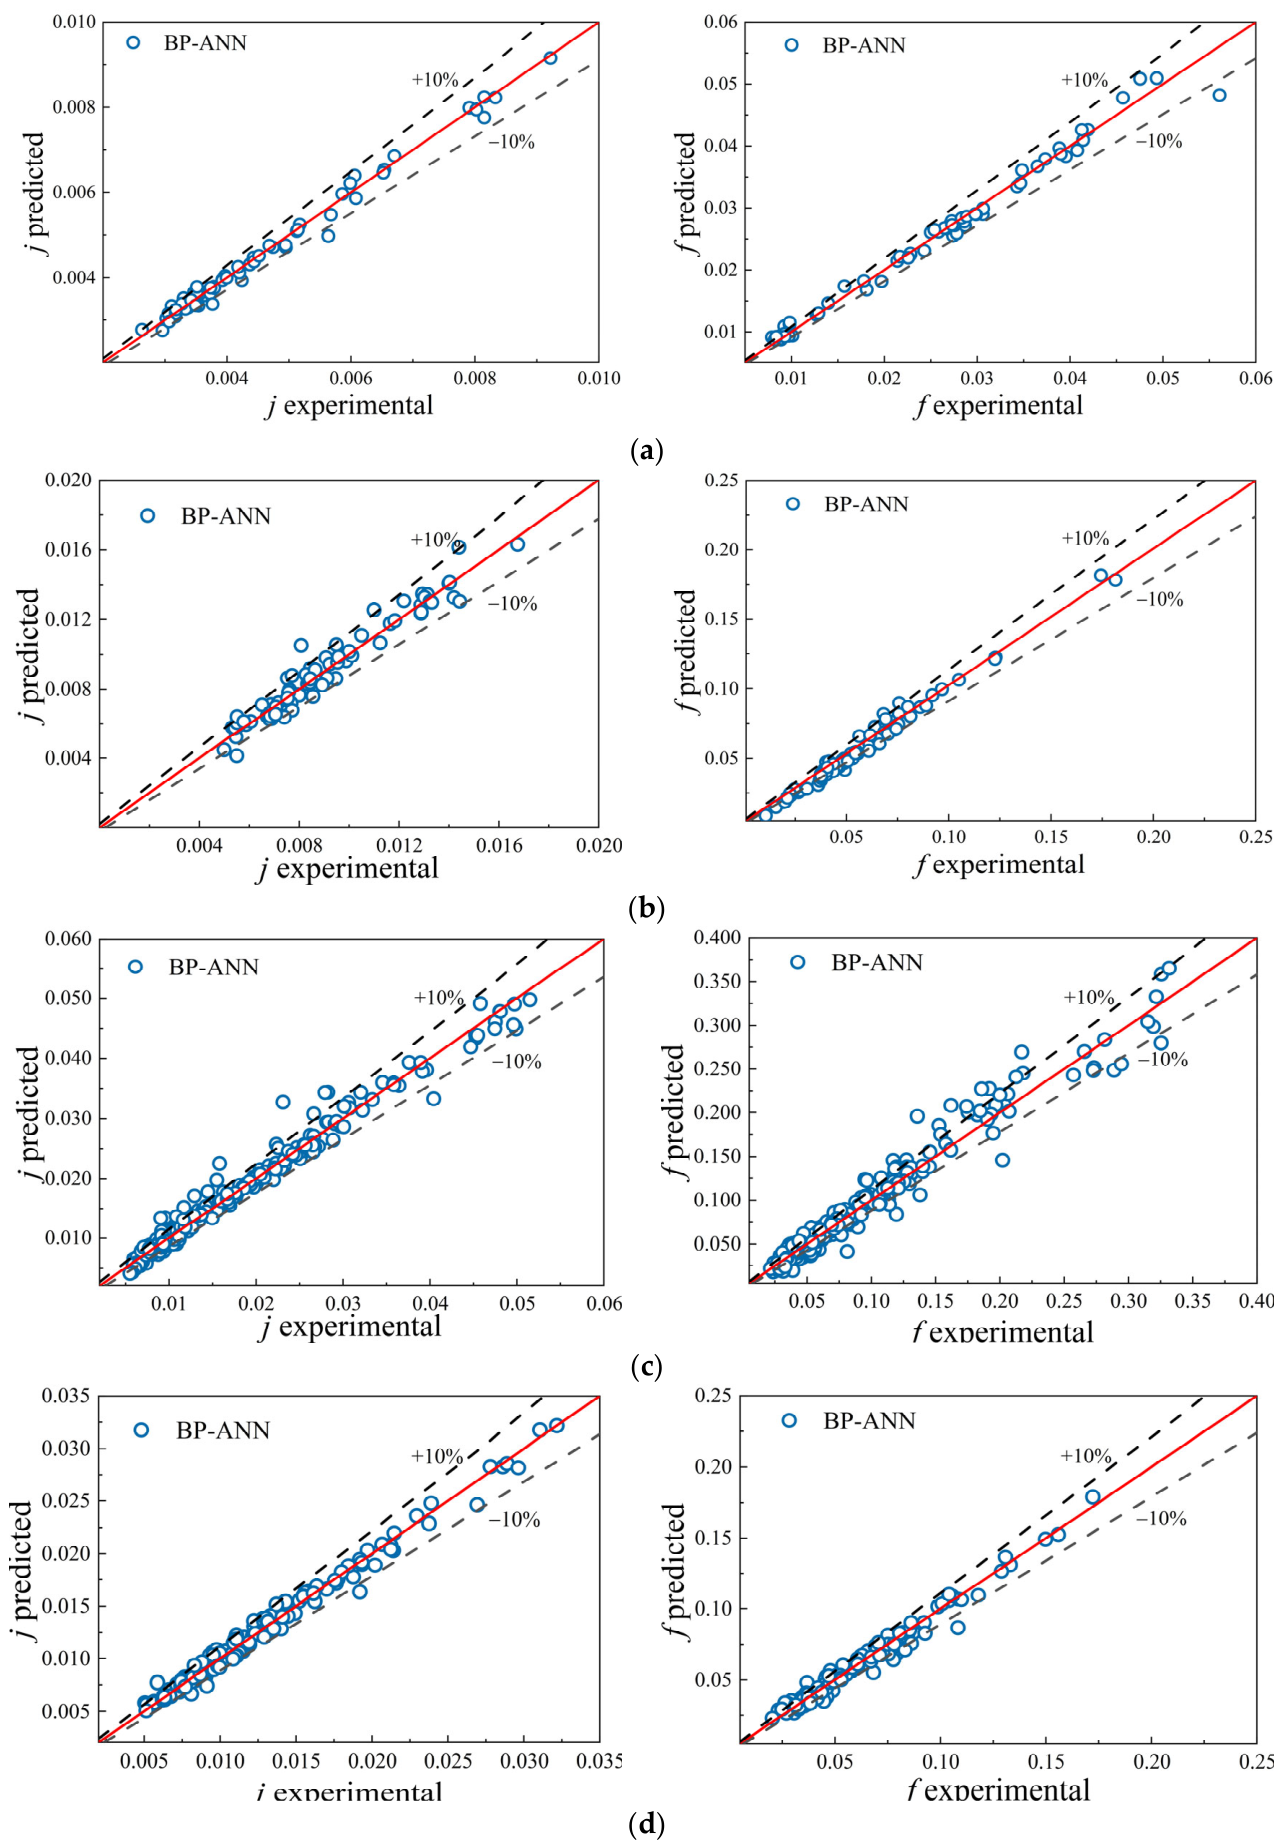
The trained BP-ANN model is used to predict the test set data, and the predicted values are compared with the experimental ones in the database, as shown in Figure 7. The mean absolute percentage errors (MAPE) of the BP-ANN model predictions for the four types of PFHEs are all within 10%, indicating an overall good predictive performance. However, some predicted values still exhibit deviations with errors exceeding 10%. Therefore, in applications where high precision is required, further optimization is still needed to improve the prediction accuracy and stability of the BP-ANN model.
Figure 7.
Comparison of predicted and experimental values of the test set data for the four types of PFHEs: (a) straight fin; (b) wavy fin; (c) louver fin; (d) serrated fin. The red solid lines denote the 1:1 reference lines between predicted and experimental values, and the dashed lines denote the ±10% error bounds.
3.3.2. Performance Optimization Results Based on PSO-BP-ANN Model
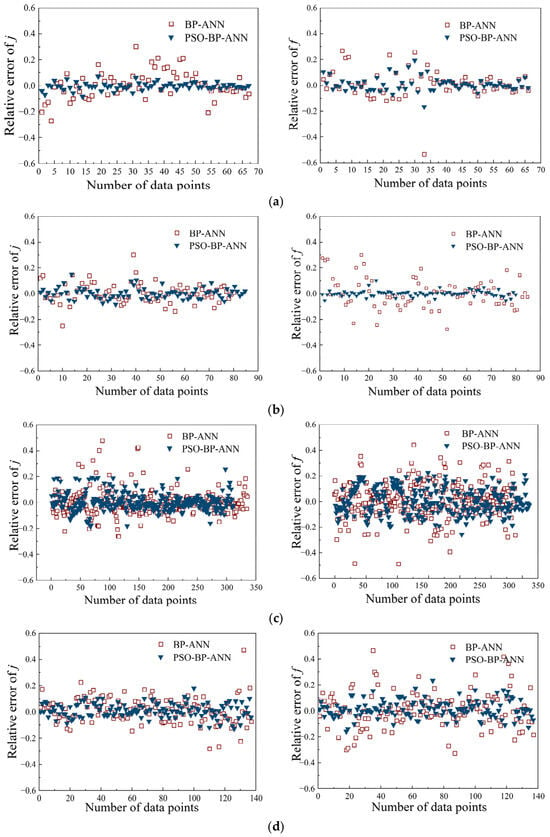
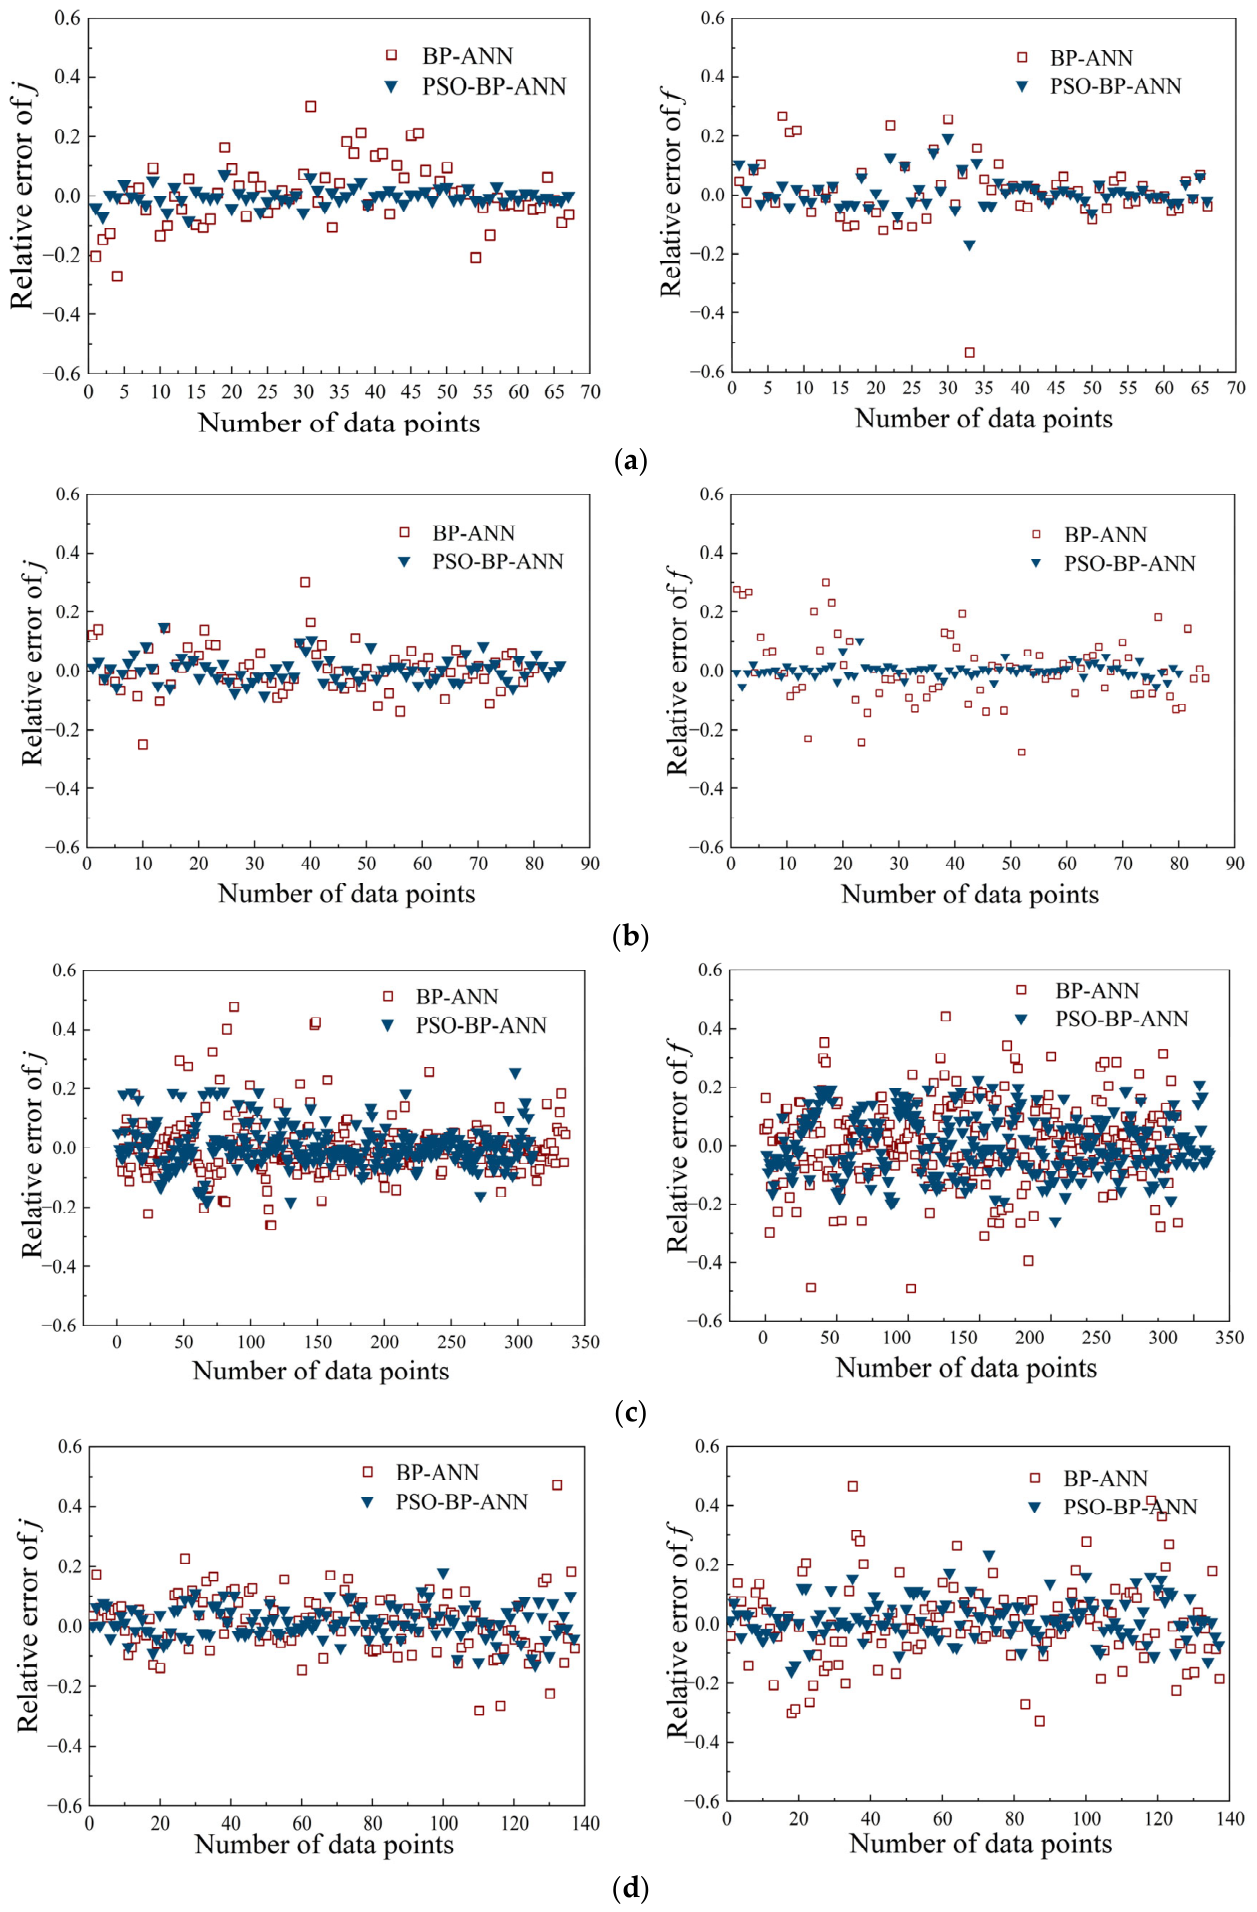
The relative errors between the predictions of the PSO-BP-ANN and BP-ANN models for the four types of PFHEs are compared in Figure 8. The error for each data point was calculated as the difference between the model-predicted value and the corresponding experimental value from the database. Table 8 provides a quantitative comparison of the predictive performance of the two models for the j and f factors. The results show that, based on the selected training/test split (85% training, 15% testing) and the database used in this study, the PSO-BP-ANN model overcomes the adverse impact of random initial weights and thresholds on BP-ANN predictions, and achieves higher prediction accuracy and better stability compared with BP-ANN.
Figure 8.
Relative error comparison between PSO-BP-ANN and BP-ANN results for the four types of PFHEs: (a) straight fin; (b) wavy fin; (c) louver fin; (d) serrated fin.
Table 8.
Comparison of Simulation Results Based on BP-ANN and PSO-BP-ANN Models.
3.3.3. Performance Comparison Between PSO-BP-ANN and Associative Predictions
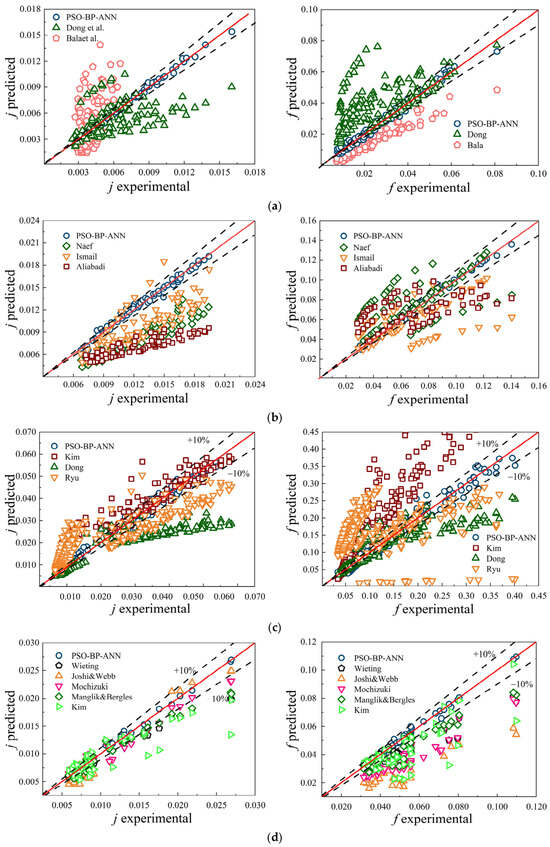
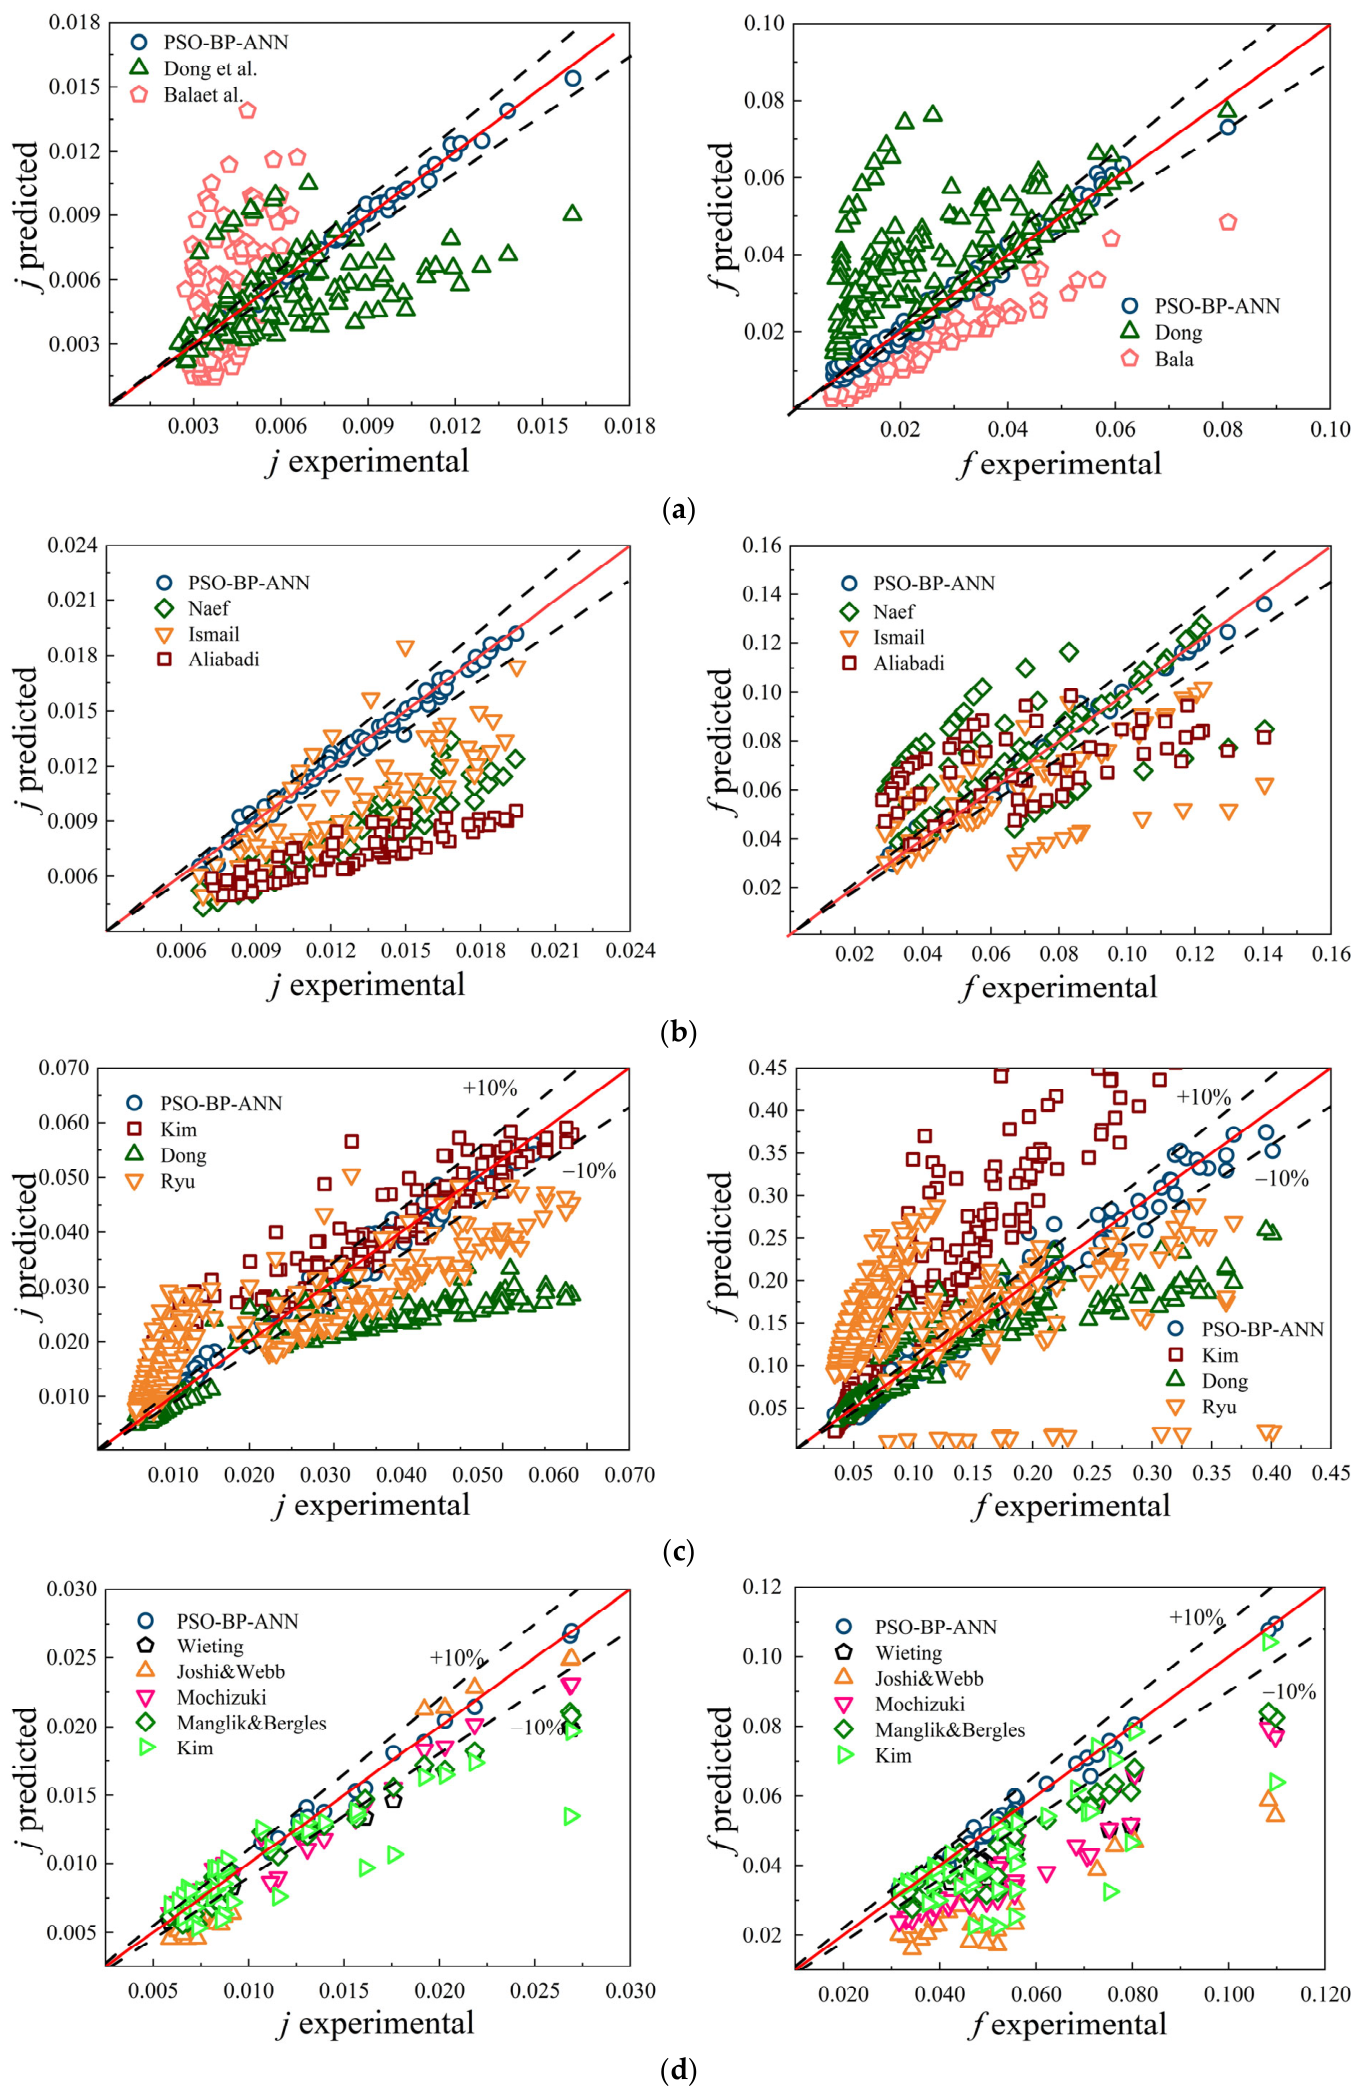
To further verify the generalization ability of the optimized model, the PSO-BP-ANN model and several empirical correlations were evaluated against independent experimental data from the channel database of the four types of PFHEs. As shown in Figure 9, the correlations yield calculated results that cover only a limited range and exhibit large errors. The main reasons are considered as follows: 1. PFHE structures involve complex parameters, and the correlations may rely on fewer dependent variables, making it difficult to accurately represent the j and f factors; 2. flow and heat transfer in the HE can be affected by temperature variations, introducing additional uncertainty; and 3. the experimental data are applicable only to limited operating conditions. By contrast, the PSO-BP-ANN model does not require any explicit relationship between input and output. Within the database and parameter ranges adopted in this study, it offers significant advantages over empirical correlations in both prediction accuracy and convenience.
Figure 9.
Comparison between PSO-BP-ANN and empirical correlation performance prediction of the four types of PFHEs: (a) straight fin; (b) wavy fin; (c) louver fin; (d) serrated fin. The red solid lines denote the 1:1 reference lines between predicted and experimental values, and the dashed lines denote the ±10% error bounds [24,27,28,33,34,38,39,40,41,42,43,44,45,46,47,48,49].
Although the PSO-BP-ANN model shows improved prediction accuracy, the database used in this study contains data from both literature sources and CFD simulations, and therefore different levels of uncertainty may exist. For the CFD data, numerical uncertainty was reduced through grid-independence verification, in which the variations in the j and f factors were less than 1%, and the CFD results were further validated against experimental data with MAPE values of 8.07% and 9.28% for j and f, respectively. For the ML predictions, the residual errors on the test set were quantified using MAPE, maximum deviation, and the proportion of samples with errors greater than 10%. Therefore, the Pareto-front solution should be regarded as a robust engineering trade-off within the investigated geometric and Re ranges, rather than a universal optimum outside the database domain.
4. Multi-Objective Optimization Strategy Analysis
4.1. Establishment of NSGA-II Optimization Method for Serrated Fin Channels
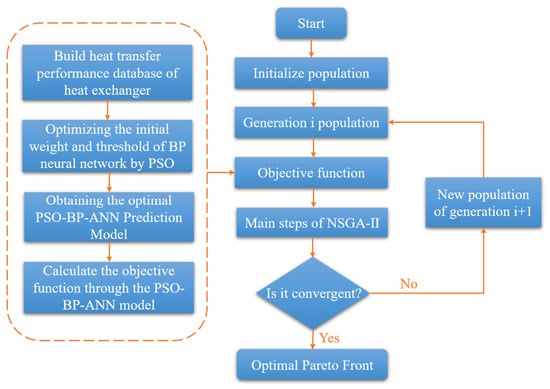
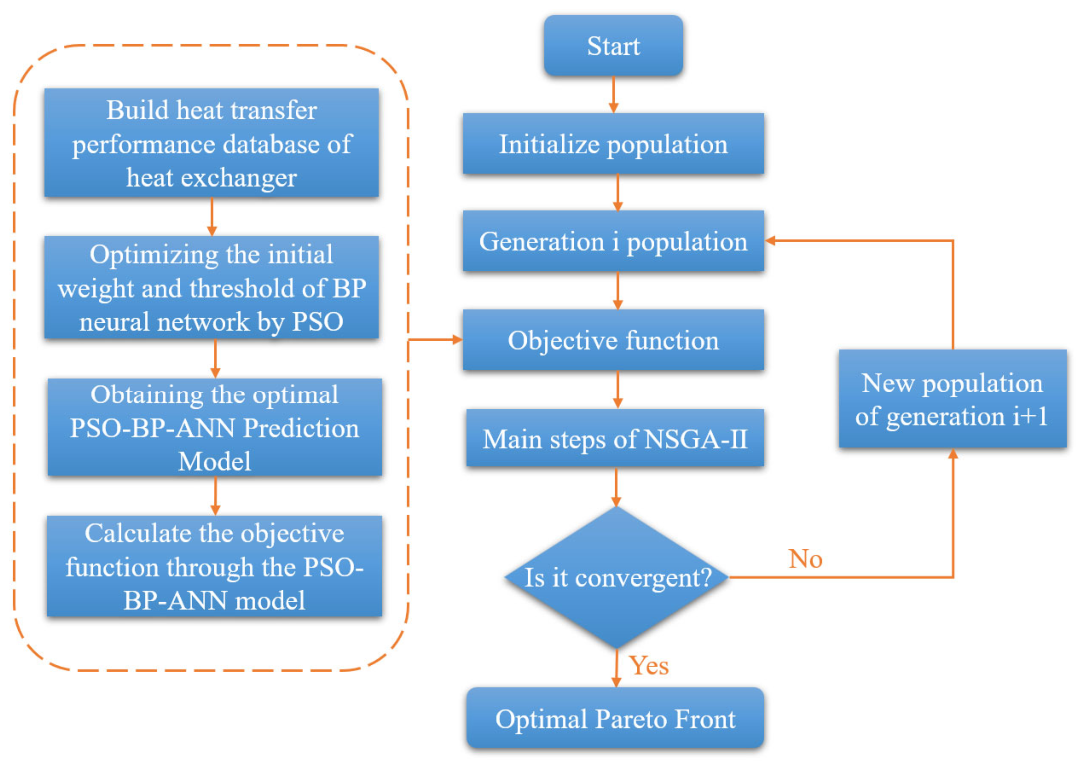
Among the numerous enhanced fin structures, serrated fins are the most widely used. This type of fin is recognized as having high surface density, strong reliability, and significantly enhanced heat transfer due to boundary layer disruption and reattachment in interrupted channels. Nonetheless, it is prone to large pressure drops, resulting in high operating costs. Therefore, it is necessary to find a trade-off between enhanced heat transfer and increased pressure drop in serrated fin PFHEs. In this section, the PSO-BP-ANN model for the serrated fin channel was coupled with NSGA-II to search for a set of non-dominated solutions. The optimization was carried out at Re = 800. The objective functions were defined as maximizing the heat transfer factor j and minimizing the friction factor f. The design variables were the fin height Fh, fin spacing Fp, fin thickness t, and fin length Ld, with the following bounds: 2.7 ≤ Fh ≤ 9.3 mm, 1.2 ≤ Fp ≤ 3.2 mm, 0.1 ≤ t ≤ 0.5 mm, and 3 ≤ Ld ≤ 9 mm. These bounds were consistent with the structural range used to construct the serrated fin database. The optimization design of the HE is performed subject to the constraints given in Equation (15). The entire optimization process is shown in Figure 10. By combining the PSO-BP-ANN prediction model with NSGA-II, the structural parameters of the Z-shaped channel PFHE are optimized, and a Pareto optimal solution set is obtained. The operating parameters of NSGA-II are shown in Table 9.
Figure 10.
Flow chart of the optimization process.
Table 9.
Parameter settings of the NSGA-II.
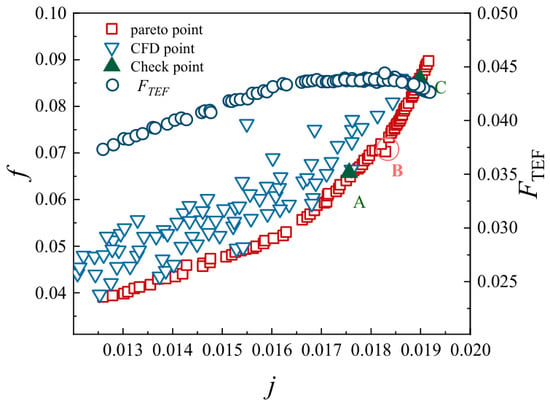
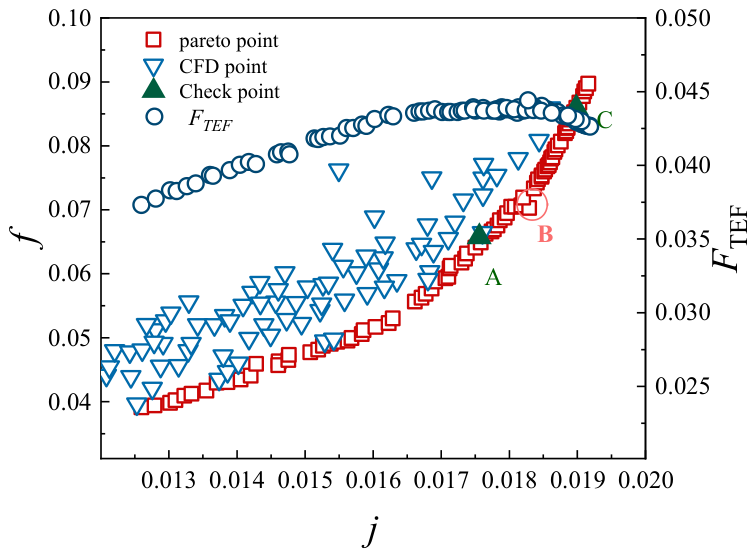
With NSGA-II, after 250 generations of evolution, a set of Pareto optimal points for the serrated fin channel is obtained at Re = 800. The optimization goal is to minimize the f factor while maintaining the same j factor, as shown in Figure 11. Each point in this figure contains comprehensive information on the two objective functions and the four structural parameters.
Figure 11.
Pareto optimization results. Points A, B, and C denote three representative Pareto optimal solutions selected for further parameter analysis, and the circles indicate the FTEF values.
In Figure 11, the open triangles represent some of the CFD numerical results from the single-factor analysis of the serrated fin channel. The open rectangles represent the Pareto optimal solution set obtained using the predicted values of the PSO-BP-ANN model. As can be seen, the Pareto front rises monotonically at first and then gradually becomes steeper toward the end. After the j factor reaches 0.019, the Pareto curve shows that the distribution of points rises almost vertically. The curve indicates that the j factor of the HE is positively correlated with the f factor. This suggests that simply pursuing higher heat transfer performance or minimum flow resistance alone often cannot yield HE products that meet engineering requirements.
Based on the Pareto curve in Figure 11, three points (A, B, and C) are selected for further parameter analysis. Mathematically, A, B, and C are all Pareto optimal solutions. Compared with the original design, all three points exhibit varying degrees of improvement in heat transfer performance. Relative to point A, the f factor at point B increases by 7.33%, while the j factor increases by 8.09%. Compared with point B, point C increases the j factor by only 3.71%, but the f factor increases by 21.74%. Beyond point C, further enhancement of heat transfer performance through changes in structural parameters alone becomes extremely limited.
The FTEF shown in Figure 11 is used to evaluate the comprehensive heat transfer performance of the Pareto point set. As can be seen, point B exhibits the best flow and heat transfer performance. The Pareto optimization results at point B are compared with the numerical simulation results in Table 10. The relative errors for the j factor, f factor, and FTEF are 4%, 4.9%, and 2.2%, respectively. Therefore, selecting the parameter combination at point B as the optimum is reasonable.
Table 10.
Numerical verification result of point B.
4.2. Analysis of Optimization Results
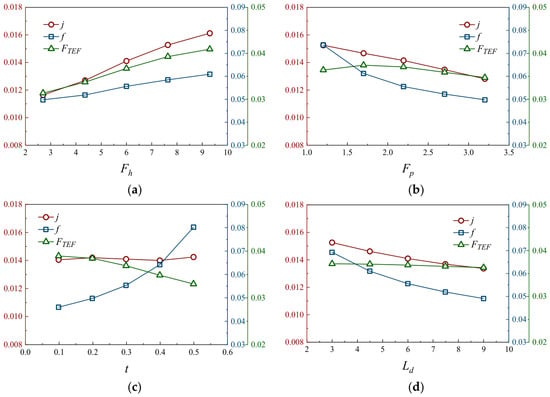
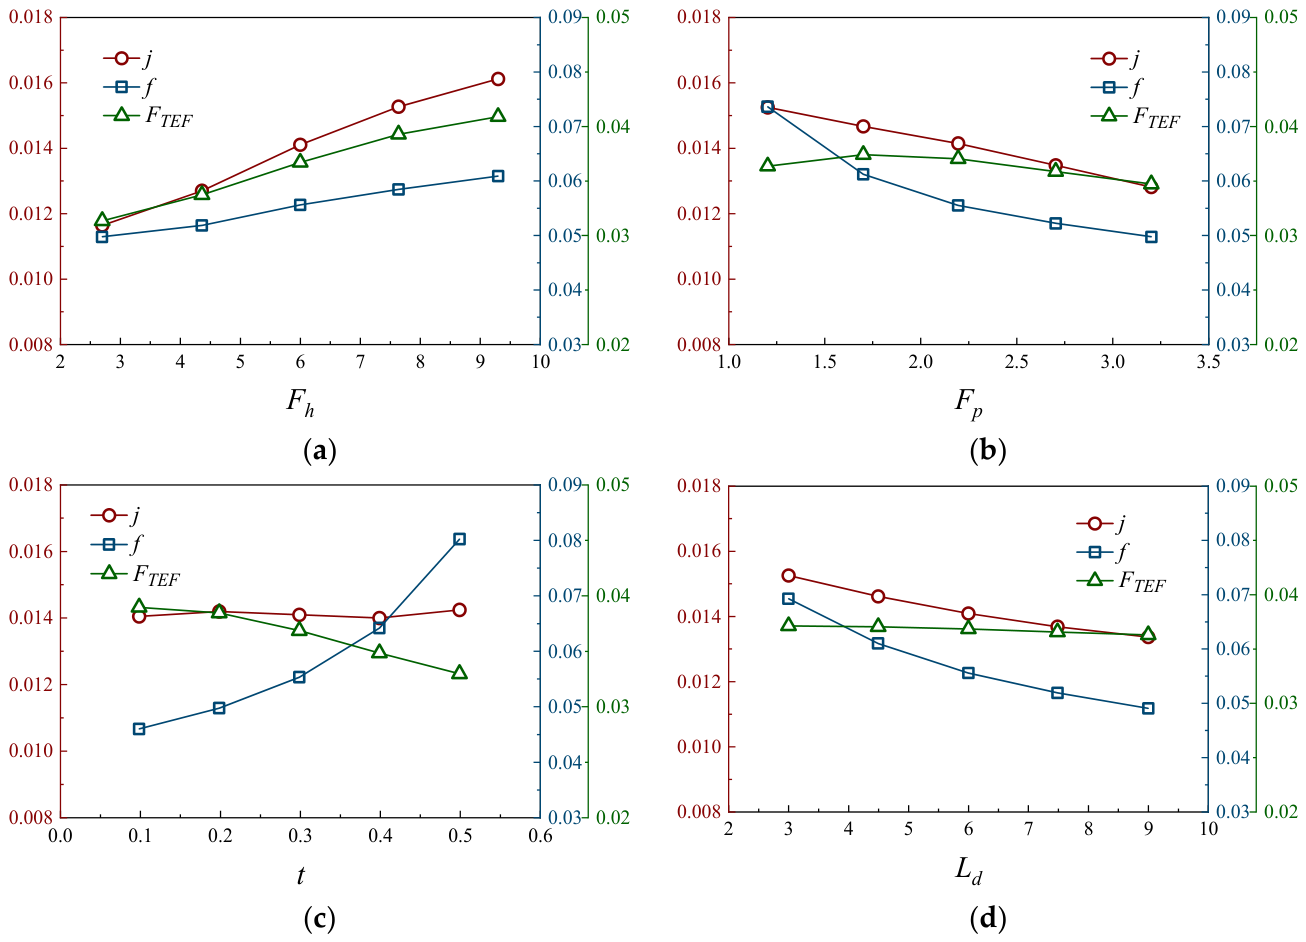
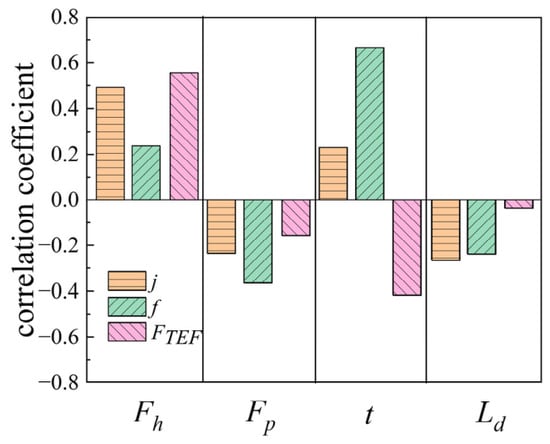
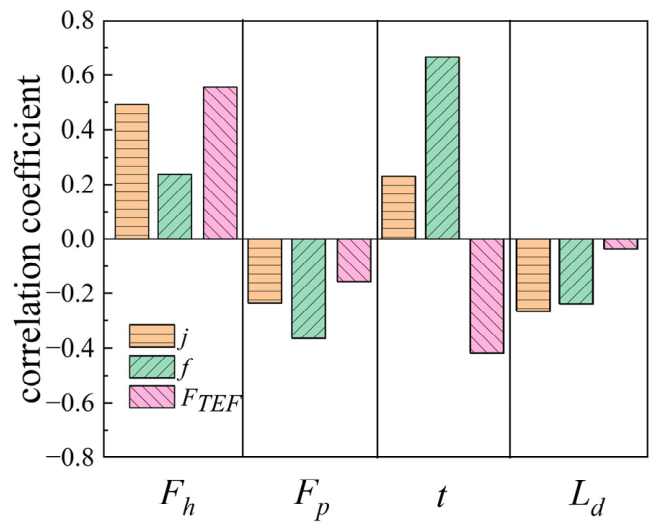
Figure 12 shows the CFD simulation results for the inlet working fluid at Re = 800 and the influences of fin height (Fh), fin pitch (Fp), fin thickness (t), and fin length (Ld) on the flow and heat transfer of the serrated fin HE. The variation in these parameters gives a physical explanation for the Pareto solution. Increasing Fh enlarges the fin surface exposed to the air stream and strengthens the interaction between the flow and the wall, so the heat transfer factor and the comprehensive performance tend to increase when the pressure drop is allowable. A smaller Fp narrows the flow passage and enhances the near-wall velocity gradient, which improves heat transfer but also increases flow resistance. A shorter Ld interrupts the boundary layer more frequently and promotes its redevelopment along the fin surface; however, this also produces an additional pressure-drop penalty. The effect of t is more sensitive to flow resistance. As t increases, both j and f increase, while reducing t can decrease f with only a limited change in j. Therefore, a smaller fin thickness is more suitable for low-pressure design. Furthermore, j and f exhibit different correlations with the four structural parameters, which is consistent with the correlation analysis results in Figure 13. The flow and heat transfer performance is further evaluated using the comprehensive heat transfer factor, FTEF, expressed in Equation (16) [50]. When the values of Fh, Fp, t, and Ld are 9.29, 1.22, 0.16, and 3.06, respectively, the flow and heat transfer performance reaches its optimum, which is also consistent with the Pareto optimal solution (Figure 11). This further demonstrates the high accuracy of the multi-objective optimization method combining CFD, PSO-BP-ANN, and NSGA-II.
Figure 12.
Influence of single fin parameters on heat transfer characteristics: (a) fin height; (b) fin spacing; (c) fin thickness; (d) fin length.
Figure 13.
Correlation of structural parameters.
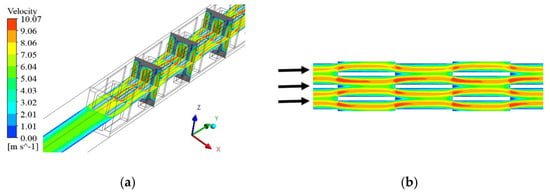
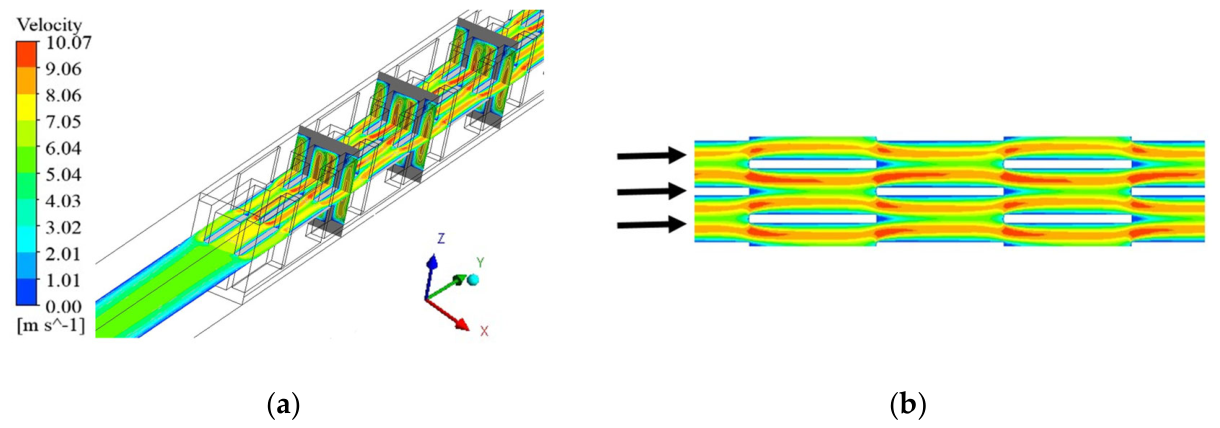
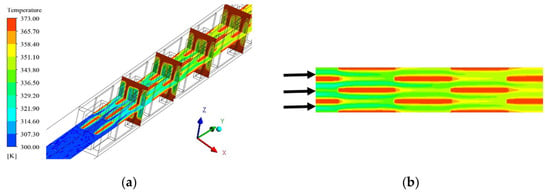
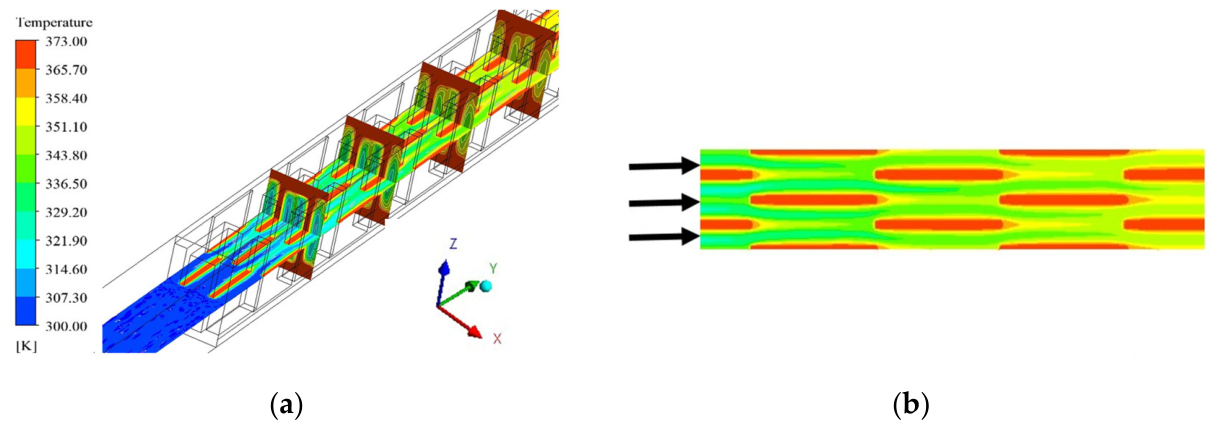
Figure 14 and Figure 15 further support this interpretation. The reduction in the flow cross-sectional area increases the velocity in the main flow region. When the air flows through each fin unit, it is redistributed near the fin leading edge, with a lower velocity at the front of the fin and higher velocities on both sides. The temperature field follows a similar development pattern. A thermal boundary layer forms on the fin surface and is then periodically destroyed and redeveloped. Therefore, the optimized geometry is not simply the structure with the largest j factor. It represents a balance between boundary-layer renewal, available fin surface, and flow-resistance penalty. The FTEF comparison in Figure 14, and the CFD verification in Table 10 also show that the selected parameter combination is consistent with the thermal–hydraulic trade-off of the serrated fin channel.
Figure 14.
Velocity distribution of each section: (a) X-Z section and X-Y section, (b) partial enlargement of X-Y section. The arrows indicate the flow direction.
Figure 15.
Temperature distribution of each section: (a) X-Z section and X-Y section, (b) partial enlargement of X-Y section. The arrows indicate the flow direction.
5. Conclusions
This paper employs a multi-objective optimization method combining CFD, PSO-BP-ANN, and NSGA-II to predict and optimize the performance of four types of PFHE channels. The main conclusions are as follows:
- (1)
- Based on the heat transfer and resistance databases of four types of PFHE channels established by the CFD simulation and empirical correlations, through training, the PSO-BP-ANN prediction model compared to the BP-ANN model, has higher prediction accuracy and generalization ability.
- (2)
- The comparison between the PSO-BP-ANN model predictions and the empirical correlations on independent experimental data proves that the ANN can effectively replace those correlations in predicting the thermal and hydraulic characteristics of PFHEs. The PSO-BP-ANN model shows a wider applicable range and higher accuracy.
- (3)
- Based on the predictions of the PSO-BP-ANN model for serrated fin channels, NSGA-II was used to optimize the structural variables (Fh, Fp, t, Ld) with respect to the two objective functions (j and f). The results show that, under laminar flow conditions (Re = 800), the serrated fin HE achieves the best heat transfer performance when the fin height, spacing, thickness, and length are 9.29, 1.22, 0.16, and 3.06, respectively.
Author Contributions
Conceptualization, X.D. and L.G.; methodology, X.D.; software, Z.H.; validation, Y.Z.; formal analysis, Z.H.; investigation, Z.H.; resources, L.G. and X.D.; data curation, C.Z.; writing—original draft preparation, Y.Z.; writing—review and editing, Y.Z. and L.L.; visualization, Z.H.; supervision, C.Z.; project administration, X.D.; funding acquisition, X.D. All authors have read and agreed to the published version of the manuscript.
Funding
This research was funded by the National Natural Science Foundation of China (No. U224120437, No. 52276090).
Data Availability Statement
The data presented in this study are available on request from the corresponding author. The data are not publicly available due to confidentiality restrictions associated with the experimental measurements, simulation models, and ongoing research project.
Conflicts of Interest
The authors declare no conflicts of interest.
Appendix A
Appendix A.1. Performance Database for Straight Fin Channels
The main geometric parameters of straight fin channels are fin spacing Fp, fin height Fh, fin thickness t, and channel length Ld. A database containing 880 performance data points was established through a literature survey; the corresponding fin structural parameters are listed in Table A1. Among them, the experimental data of Kays and London [23] are the most influential, covering straight fin channels with Ld > 65 mm and Ld/De > 20 (where De is the hydraulic diameter). Dong et al. [24] experimentally investigated straight fin channels with Ld < 65 mm and Ld/De < 20, effectively supplementing the data of Kays and London.
Table A1.
Structural parameters of straight fins in the database.
Appendix A.2. Performance Database for Wavy Fin Channels
The main geometric parameters of wavy fin channels are fin spacing Fp, fin height Fh, channel length Ld, fin thickness t, double amplitude 2A, and wavelength L. A database containing 1056 performance data points was established through a literature survey; the corresponding fin structural parameters are listed in Table A2. The earliest experimental data on wavy fin channels were reported in the classic reference book by Kays and London [23], including three wavy fin channels. Subsequently, Gough and Shemmeri [25] presented performance data for three wavy fin channels similar to those in Kays and London based on wind tunnel experiments. Aliabadi et al. [27] obtained performance data for 15 fin channels through numerical simulation. Dong et al. [24] provided experimental performance data for 11 wavy fin channels within a Re range of 800–6500. Naef et al. [28] computed the performance data for 21 fin channels with new geometries by numerical simulation.
Table A2.
Structural parameters of wavy fins in the database.
Appendix A.3. Performance Database for Louver Fin Channels
The main geometric parameters of louver fin channels are fin spacing Fp, fin height Fh, channel length Ld, fin thickness t, louver angle La, and louver pitch Lp. A database containing 4166 performance data points was established through a literature survey; the corresponding fin structural parameters are listed in Table A3. Chang and Wang [29,30,31,32] compiled 91 performance data points for louver fin channels. Kim et al. [33] obtained 45 performance data points through experimental investigation. Dong et al. [34] obtained 20 performance data points experimentally.
Table A3.
Structural parameters of louvered fins in the database.
Appendix A.4. Performance Database for Serrated Fin Channels
The main geometric parameters of serrated fin channels are fin length Ld, fin height Fh, fin pitch Fp, and fin thickness t. The fin offset is typically uniform, equal to half the fin pitch. A database containing 1840 performance data points was established through a literature survey; the corresponding dimensionless structural parameters of the fins are listed in Table A4, where α = Fp/Fh, δ = t/Ld, and γ = t/Fp. Kays and London [23] obtained 18 performance data points for serrated fin channels experimentally. Peng and Ling [35] obtained 5 performance data points experimentally.
Table A4.
Dimensionless structural parameters of serrated fins in the database.
References
- Abbas, A.S.; Mohammed, A.A. Enhancement of plate-fin heat exchanger performance with aid of various types of fin configurations: A review. J. Adv. Res. Fluid Mech. Therm. Sci. 2022, 99, 48–66. [Google Scholar] [CrossRef] [Scilit]
- Ozturk, M.M.; Doğan, B.; Erbay, L.B. Thermo-hydraulic performance assessment of a compact heat exchanger by varying plate fins. In 2017 IEEE 6th International Conference on Renewable Energy Research and Applications (ICRERA); IEEE: Piscataway, NJ, USA, 2017; pp. 70–75. [Google Scholar]
- Turk, C.; Aradag, S.; Kakac, S. Experimental analysis of a mixed-plate gasketed plate heat exchanger and artificial neural net estimations of the performance as an alternative to classical correlations. Int. J. Therm. Sci. 2016, 109, 263–269. [Google Scholar] [CrossRef] [Scilit]
- Kedam, N.; Uglanov, D.A.; Blagin, E.V.; Gorshkalev, A.A.; Panshin, R.A.; Liu, J. Unified ANN model for heat transfer factor (j) and friction factor (f) prediction in offset strip and wavy fin PFHEs. Case Stud. Therm. Eng. 2024, 53, 103845. [Google Scholar] [CrossRef] [Scilit]
- Shi, H.; Chang, H.; Ma, T.; Wang, Q. Prediction of Equivalent Thermal Conduction Resistance of Printed Circuit Heat Exchangers. J. Therm. Sci. 2022, 31, 2281–2292. [Google Scholar] [CrossRef] [Scilit]
- Hughes, M.T.; Kini, G.; Garimella, S. Status, challenges, and potential for machine learning in understanding and applying heat transfer phenomena. J. Heat Transf. 2021, 143, 120802. [Google Scholar] [CrossRef] [Scilit]
- Islamoglu, Y. A new approach for the prediction of the heat transfer rate of the wire-on-tube type heat exchanger—Use of an artificial neural network model. Appl. Therm. Eng. 2003, 23, 243–249. [Google Scholar] [CrossRef] [Scilit]
- Zhao, X. Performance of a Single-Row Heat Exchanger at Low In-Tube Flow Rates. Master’s Thesis, University of Notre Dame, Sydney, NSW, Australia, 1995. [Google Scholar]
- Peng, H.; Ling, X. Optimal design approach for the plate-fin heat exchangers using neural networks cooperated with genetic algorithms. Appl. Therm. Eng. 2008, 28, 642–650. [Google Scholar] [CrossRef] [Scilit]
- Peng, H.; Ling, X. Neural networks analysis of thermal characteristics on plate-fin heat exchangers with limited experimental data. Appl. Therm. Eng. 2009, 29, 2251–2256. [Google Scholar] [CrossRef] [Scilit]
- Dong, J.T.; Du, Z.Y. Heat exchange quantity prediction of earth-air heat exchanger based on GA-BP neural network. Renesable Energy Resour. 2021, 39, 307–314. [Google Scholar]
- Zhao, F.; Hong, Y.; Yu, D.; Yang, Y. An improved particle swarm optimization based training algorithm for neural network. In ICMIT 2005: Information Systems and Signal Processing; SPIE: Bellingham, WA, USA, 2006; Volume 6041, pp. 6–11. [Google Scholar]
- Zhang, L.; Zhao, J.; Zhang, X.; Zhang, S. Study of a New Improved PSO-BP Neural Network Algorithm. J. Harbin Inst. Technol. 2013, 20, 106–112. [Google Scholar]
- Wang, J.; Zeng, L.; Yang, K. Multi-objective optimization of printed circuit heat exchanger with airfoil fins based on the improved PSO-BP neural network and the NSGA-II algorithm. Nucl. Eng. Technol. 2023, 55, 2125–2138. [Google Scholar] [CrossRef] [Scilit]
- Chen, Z.; Zheng, D.; Wang, J.; Chen, L.; Sundén, B. Experimental investigation on heat transfer characteristics of various nanofluids in an indoor electric heater. Renew. Energy 2020, 147, 1011–1018. [Google Scholar] [CrossRef] [Scilit]
- Zheng, D.; Yang, J.; Wang, J.; Kabelac, S.; Sundén, B. Analyses of thermal performance and pressure drop in a plate heat exchanger filled with ferrofluids under a magnetic field. Fuel 2021, 293, 120432. [Google Scholar] [CrossRef] [Scilit]
- de Vasconcelos Segundo, E.H.; Mariani, V.C.; dos Santos Coelho, L. Design of heat exchangers using Falcon Optimization Algorithm. Appl. Therm. Eng. 2019, 156, 119–144. [Google Scholar] [CrossRef] [Scilit]
- Wang, D.; Zhang, H.; Wang, G.; Yuan, H.; Peng, X. Experimental and numerical study on the heat transfer and flow characteristics of convex plate heat exchanger based on multi-objective optimization. Int. J. Heat Mass Transf. 2023, 202, 123755. [Google Scholar] [CrossRef] [Scilit]
- Lv, J.; Sun, Y.; Lin, J.; Luo, X.; Li, P. Multi-objective optimization research of printed circuit heat exchanger based on RSM and NSGA-II. Appl. Therm. Eng. 2024, 254, 123925. [Google Scholar] [CrossRef] [Scilit]
- He, Z.; Yu, Q.; Ye, J.; Yan, F.; Li, Y. Optimization of plate-fin heat exchanger performance for heat dissipation of thermoelectric cooler. Case Stud. Therm. Eng. 2024, 53, 103953. [Google Scholar] [CrossRef] [Scilit]
- Yang, H.; Wen, J.; Wang, S.; Li, Y. Thermal design and optimization of plate-fin heat exchangers based global sensitivity analysis and NSGA-II. Appl. Therm. Eng. 2018, 136, 444–453. [Google Scholar] [CrossRef] [Scilit]
- Li, K.; Wen, J.; Wang, S.; Li, Y. Multi-parameter optimization of serrated fins in plate-fin heat exchanger based on fluid-structure interaction. Appl. Therm. Eng. 2020, 176, 115357. [Google Scholar] [CrossRef] [Scilit]
- Kays, W.M.; London, A.L. Compact Heat Exchangers; McGraw-Hill: New York, NY, USA, 1984. [Google Scholar]
- Dong, J.Q.; Chen, J.P.; Yuan, Q.F.; Chen, Z.J. Flow and Heat Transfer on Compact Smooth Fin Surfaces. Trans. Chin. Soc. Agric. Mach. 2007, 38, 53–56. [Google Scholar]
- BEng, R.G.; Al-Shemmeri, T.T. Thermal and friction factor data for three packed block construction wavy fin surfaces. Proc. Inst. Mech. Eng. Part A J. Power Energy 1994, 208, 225–229. [Google Scholar] [CrossRef] [Scilit]
- Junqi, D.; Jiangping, C.; Zhijiu, C.; Yimin, Z.; Wenfeng, Z. Heat transfer and pressure drop correlations for the wavy fin and flat tube heat exchangers. Appl. Therm. Eng. 2007, 27, 2066–2073. [Google Scholar] [CrossRef] [Scilit]
- Khoshvaght Aliabadi, M.; Gholam Samani, M.; Hormozi, F.; Haghighi Asl, A. 3D-CFD simulation and neural network model for the j and f factors of the wavy fin-and-flat tube heat exchangers. Braz. J. Chem. Eng. 2011, 28, 505–520. [Google Scholar] [CrossRef] [Scilit]
- Qasem, N.A.; Zubair, S.M. Generalized air-side friction and heat transfer correlations for wavy-fin compact heat exchangers. Int. J. Refrig. 2019, 97, 21–30. [Google Scholar] [CrossRef] [Scilit]
- Chang, Y.J.; Wang, C.C. A generalized heat transfer correlation for Iouver fin geometry. Int. J. Heat Mass Transf. 1997, 40, 533–544. [Google Scholar] [CrossRef] [Scilit]
- Wang, C.C.; Chi, K.Y.; Chang, Y.J.; Chang, Y.P. An experimental study of heat transfer and friction characteristics of typical louver fin-and-tube heat exchangers. Int. J. Heat Mass Transf. 1998, 41, 817–822. [Google Scholar] [CrossRef] [Scilit]
- Chang, Y.J.; Hsu, K.C.; Lin, Y.T.; Wang, C.C. A generalized friction correlation for louver fin geometry. Int. J. Heat Mass Transf. 2000, 43, 2237–2243. [Google Scholar] [CrossRef] [Scilit]
- Chang, Y.J.; Chang, W.J.; Li, M.C.; Wang, C.C. An amendment of the generalized friction correlation for louver fin geometry. Int. J. Heat Mass Transf. 2006, 49, 4250–4253. [Google Scholar] [CrossRef] [Scilit]
- Kim, M.H.; Bullard, C.W. Air-side thermal hydraulic performance of multi-louvered fin aluminum heat exchangers. Int. J. Refrig. 2002, 25, 390–400. [Google Scholar] [CrossRef] [Scilit]
- Dong, J.; Chen, J.; Chen, Z.; Zhang, W.; Zhou, Y. Heat transfer and pressure drop correlations for the multi-louvered fin compact heat exchangers. Energy Convers. Manag. 2007, 48, 1506–1515. [Google Scholar] [CrossRef] [Scilit]
- Peng, H.; Ling, X.; Li, J. Performance investigation of an innovative offset strip fin arrays in compact heat exchangers. Energy Convers. Manag. 2014, 80, 287–297. [Google Scholar] [CrossRef] [Scilit]
- Song, R.; Cui, M.; Liu, J. A correlation for heat transfer and flow friction characteristics of the offset strip fin heat exchanger. Int. J. Heat Mass Transf. 2017, 115, 695–705. [Google Scholar] [CrossRef] [Scilit]
- Fisher, R.A. Statistical methods for research workers. In Breakthroughs in Statistics: Methodology and Distribution; Springer: New York, NY, USA, 1970; pp. 66–70. [Google Scholar]
- Hastie, T.; Tibshirani, R.; Friedman, J. The Elements of Statistical Learning: Data Mining, Inference, and Prediction, 2nd ed.; Springer: New York, NY, USA, 2009. [Google Scholar]
- Makridakis, S.; Wheelwright, S.C.; Hyndman, R.J. Forecasting Methods and Applications; John Wiley & Sons: Hoboken, NJ, USA, 2008. [Google Scholar]
- Chen, B.; Zhang, H.; Li, M. Prediction of pK(a) values of neutral and alkaline drugs with particle swarm optimization algorithm and artificial neural network. Neural Comput. Appl. 2019, 31, 8297–8304. [Google Scholar] [CrossRef] [Scilit]
- Kennedy, J.; Eberhart, R. Particle swarm optimization. In Proceedings of ICNN’95-International Conference on Neural Networks; IEEE: Piscataway, NJ, USA, 1995; Volume 4, pp. 1942–1948. [Google Scholar]
- Bala Sundar Rao, R.; Ranganath, G.; Ranganayakulu, C. Colburn ‘j’ factor and fanning friction factor ‘f’ correlations of triangular plain fin surface of a compact heat exchanger using CFD. Appl. Mech. Mater. Trans. Tech Publ. Ltd. 2015, 787, 207–211. [Google Scholar] [CrossRef] [Scilit]
- Ismail, L.S.; Ranganayakulu, C.; Shah, R.K. Numerical study of flow patterns of compact plate-fin heat exchangers and generation of design data for offset and wavy fins. Int. J. Heat Mass Transf. 2009, 52, 3972–3983. [Google Scholar] [CrossRef] [Scilit]
- Ryu, K.; Lee, K.S. Generalized heat-transfer and fluid-flow correlations for corrugated louvered fins. Int. J. Heat Mass Transf. 2015, 83, 604–612. [Google Scholar] [CrossRef] [Scilit]
- Wieting, A.R. Empirical correlations for heat transfer and flow friction characteristics of rectangular offset-fin plate-fin heat exchangers. J. Heat Transf. 1975, 97, 488. [Google Scholar] [CrossRef] [Scilit]
- Joshi, H.M.; Webb, R.L. Heat transfer and friction in the offset stripfin heat exchanger. Int. J. Heat Mass Transf. 1987, 30, 69–84. [Google Scholar] [CrossRef] [Scilit]
- Mochizuki, S.; Yagi, Y.; Yang, W.J. Transport phenomena in stacks of interrupted parallel-plate surfaces. Exp. Heat Transf. Int. J. 1987, 1, 127–140. [Google Scholar] [CrossRef] [Scilit]
- Manglik, R.M.; Bergles, A.E. Heat transfer and pressure drop correlations for the rectangular offset strip fin compact heat exchanger. Exp. Therm. Fluid Sci. 1995, 10, 171–180. [Google Scholar] [CrossRef] [Scilit]
- Kim, M.S.; Lee, J.; Yook, S.J.; Lee, K.S. Correlations and optimization of a heat exchanger with offset-strip fins. Int. J. Heat Mass Transf. 2011, 54, 2073–2079. [Google Scholar] [CrossRef] [Scilit]
- Webb, R.L. Performance evaluation criteria for use of enhanced heat transfer surfaces in heat exchanger design. Int. J. Heat Mass Transf. 1981, 24, 715–726. [Google Scholar] [CrossRef] [Scilit]

Disclaimer/Publisher’s Note: The statements, opinions and data contained in all publications are solely those of the individual author(s) and contributor(s) and not of MDPI and/or the editor(s). MDPI and/or the editor(s) disclaim responsibility for any injury to people or property resulting from any ideas, methods, instructions or products referred to in the content. |
© 2026 by the authors. Licensee MDPI, Basel, Switzerland. This article is an open access article distributed under the terms and conditions of the Creative Commons Attribution (CC BY) license.