


Abstract
Variable-speed pumped storage units perform flexible and rapid regulation tasks in power grids. However, under the “power-priority” control mode, the superposition of maximum energy operating point and extreme transient events such as load rejection can induce severe vibrations. This study investigates the vibration characteristics of a variable-speed unit under a typical extreme condition (Case RT-5): power-priority mode, maximum energy superposition point, and load rejection at extreme rotational speed. A one-way fluid–structure interaction (FSI) numerical method is employed, combining unsteady Reynolds-averaged Navier–Stokes (URANS) with a shear stress transport (SST) k-ω turbulence model and finite element structural analysis. The innovation lies in quantitatively linking the transient hydraulic excitation (water hammer pressure waves, non-stationary pulsation field) to the mechanical response (centrifugal force, variable stiffness) to identify the root causes of vibration. Results show that under RT-5, the maximum equivalent stress reaches 97.09 MPa and maximum deformation 0.66 mm, occurring at the blade-crown connection root—a stress concentration zone. However, below the material yield strength (265 MPa), the stress rises 2.4-fold within 12 s, and secondary stress peaks appear, indicating high-cycle fatigue risk. Severe fluctuations of stress and displacement, driven by coupled hydraulic-mechanical excitation, are the main causes of vibration. This study provides a theoretical basis for safety assessment and control strategy optimization, and proposes that RT-5 be included as a mandatory verification case for variable-speed units.
1. Introduction
To achieve the goal of ‘carbon neutrality’, the large-scale integration of renewable energy sources, such as wind and solar power, into the grid has placed greater demands on grid stability and regulation capacity [1,2]. As a mature, large-capacity energy storage system, the role of pumped-storage power stations is becoming increasingly prominent [3,4]. Compared to traditional fixed-speed units, variable-speed pumped-storage units can achieve decoupled regulation of speed and power through doubly fed induction generator technology, enabling efficient and rapid response across a wider operating range; this represents an important direction for the development of pumped-storage technology [5,6].
However, the ‘dual regulation’ (speed and guide vane angle) of variable-speed units creates a complex hydraulic vibration environment. Particularly under ‘power-priority’ control strategies, the unit may operate at the maximum energy superposition point (the region of maximum product of head and flow) [7]. If sudden load shedding occurs at this point, the unit undergoes drastic energy conversion, severe pressure pulsations, water hammer effects, and structural vibrations, endangering the runner, head cover, and bearings [8,9].
Load shedding is one of the most dangerous transient processes for pumped-storage units, and scholars both domestically and internationally have conducted extensive research on this topic. Liu Zhang et al. [10,11] analyzed the dynamic characteristics of full-power variable-speed pumped-storage units during load shedding under various conditions, pointing out that the pressure peaks and speed surges during the load shedding process are closely related to the guide vane closing profile. Wang Peng et al. [12] investigated the impact of guide vane closing profiles on simultaneous load shedding conditions in large and small hydropower units, finding that a reasonable closing profile can effectively suppress water hammer pressure and speed overshoot. Wang Zhenying et al. [13,14] proposed an optimization method for guide vane closure profiles specifically for pump-turbine load shedding conditions, significantly improving the unit’s dynamic response [15,16]. These studies provide important references for the safety assessment of load shedding conditions; however, they predominantly focus on fixed-speed units or conventional control strategies, with insufficient attention paid to the transient behavior of variable-speed units under the specific combination of ‘power priority + energy superposition point’ [17,18].
Regarding vibration characteristic analysis, the causes of hydroturbine vibration are complex and diverse, involving multiple factors such as hydraulic, mechanical and electrical aspects. Zhou Tao et al. [19] summarized the primary causes of hydroturbine vibration, pointing out that hydraulic imbalance and Karman vortices are common triggers. Liu Demin et al. [20] analyzed hydroturbine vibration based on fluid–structure interaction methods, emphasizing the importance of fluid–structure interaction in vibration assessment. Lang Songtao [21] further introduced fractional-order vibration analysis and sliding-mode control into hydroturbine generator units, providing new insights for vibration suppression. Zhang Yuncheng [22,23] conducted a dedicated analysis of the pressure pulsations and vibration characteristics of the runner in the pump-turbine of a pumped-storage unit, revealing the influence of dynamic and static interference between the runner and guide vanes on vibration. At the powerhouse system level, Zhang Sha [24] analyzed the vibration characteristics of powerhouses in pumped-storage power stations with variable-speed units, pointing out that variable-speed operation broadens the range of excitation frequencies and increases the risk of resonance. Liu Baonan [25], on the other hand, studied multi-objective optimization decision-making for load shedding in pumped-storage units from the perspective of control strategies, emphasizing the coordinated optimization of structural safety and control quality during transient processes [26].
Nevertheless, current research on the fluid–structure interaction vibration characteristics during transient processes of variable-speed units—particularly under the severe operating conditions of the ‘power priority + energy stacking point + load shedding’ combination—remains insufficient [27]. The existing literature largely focuses on control strategies or the response of a single physical field, lacking a systematic analysis of the coupled effects of hydraulic and mechanical dual excitation [28,29]. Consequently, this paper utilizes the design parameters of a specific variable-speed pumped-storage unit (Unit 4 at the Zhaoqing Power Station) and employs three-dimensional fluid–structure interaction numerical simulations to conduct an in-depth analysis of the runner vibration response under these extreme operating conditions [30]. The aim is to identify vibration characteristics and potential hazards, thereby providing a theoretical basis for the safety assessment and optimization of control strategies for variable-speed units during extreme transient operations [31,32]. To fill these gaps, we investigate the RT-5 condition—a representative extreme scenario from a real variable-speed unit (Zhaoqing Power Station, Unit 4). By using three-dimensional FSI simulations, we aim to reveal the vibration excitation mechanisms, quantify stress/deformation responses, and assess structural hazards [33].
2. Computational Models and Operating Conditions
2.1. Computational Model
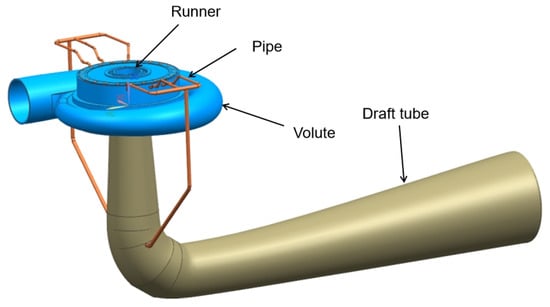
The unit studied is Unit 4 of Zhaoqing Pumped Storage Power Station. A schematic diagram of the machine layout (including volute, fixed guide vanes, movable guide vanes, runner, draft tube, upper crown, lower ring, and shaft) is provided in Figure 1 (see original figure). Key geometric dimensions are as follows: runner diameter 4.2 m, blade number 7, guide vane number 20. The operating parameters are as follows: (1) As pump: Head range 480–540 m, flow rate 40–55 m3/s. (2) As turbine: Rated head 500 m, rated flow 48 m3/s, rated speed 428.6 r/min. (3) Specific speed: nq = n/H3/4 ≈ 0.32 (dimensionless).
Figure 1.
Three-dimensional physical model of the runner structure of the prototype unit.
As shown in Figure 1, this study established a full-flow-channel hydraulic model comprising the volute, fixed guide vanes, movable guide vanes, runner and tail pipe, as well as a three-dimensional structural model comprising components such as the runner, upper crown and lower ring. Flow field calculations were performed using CFD methods based on the finite volume method, whilst structural field calculations employed the finite element method (FEM). Data exchange was carried out via a fluid–structure interaction interface to ensure the accurate transfer of hydraulic excitation loads from the runner surface to the structural model.
2.2. Grid Division
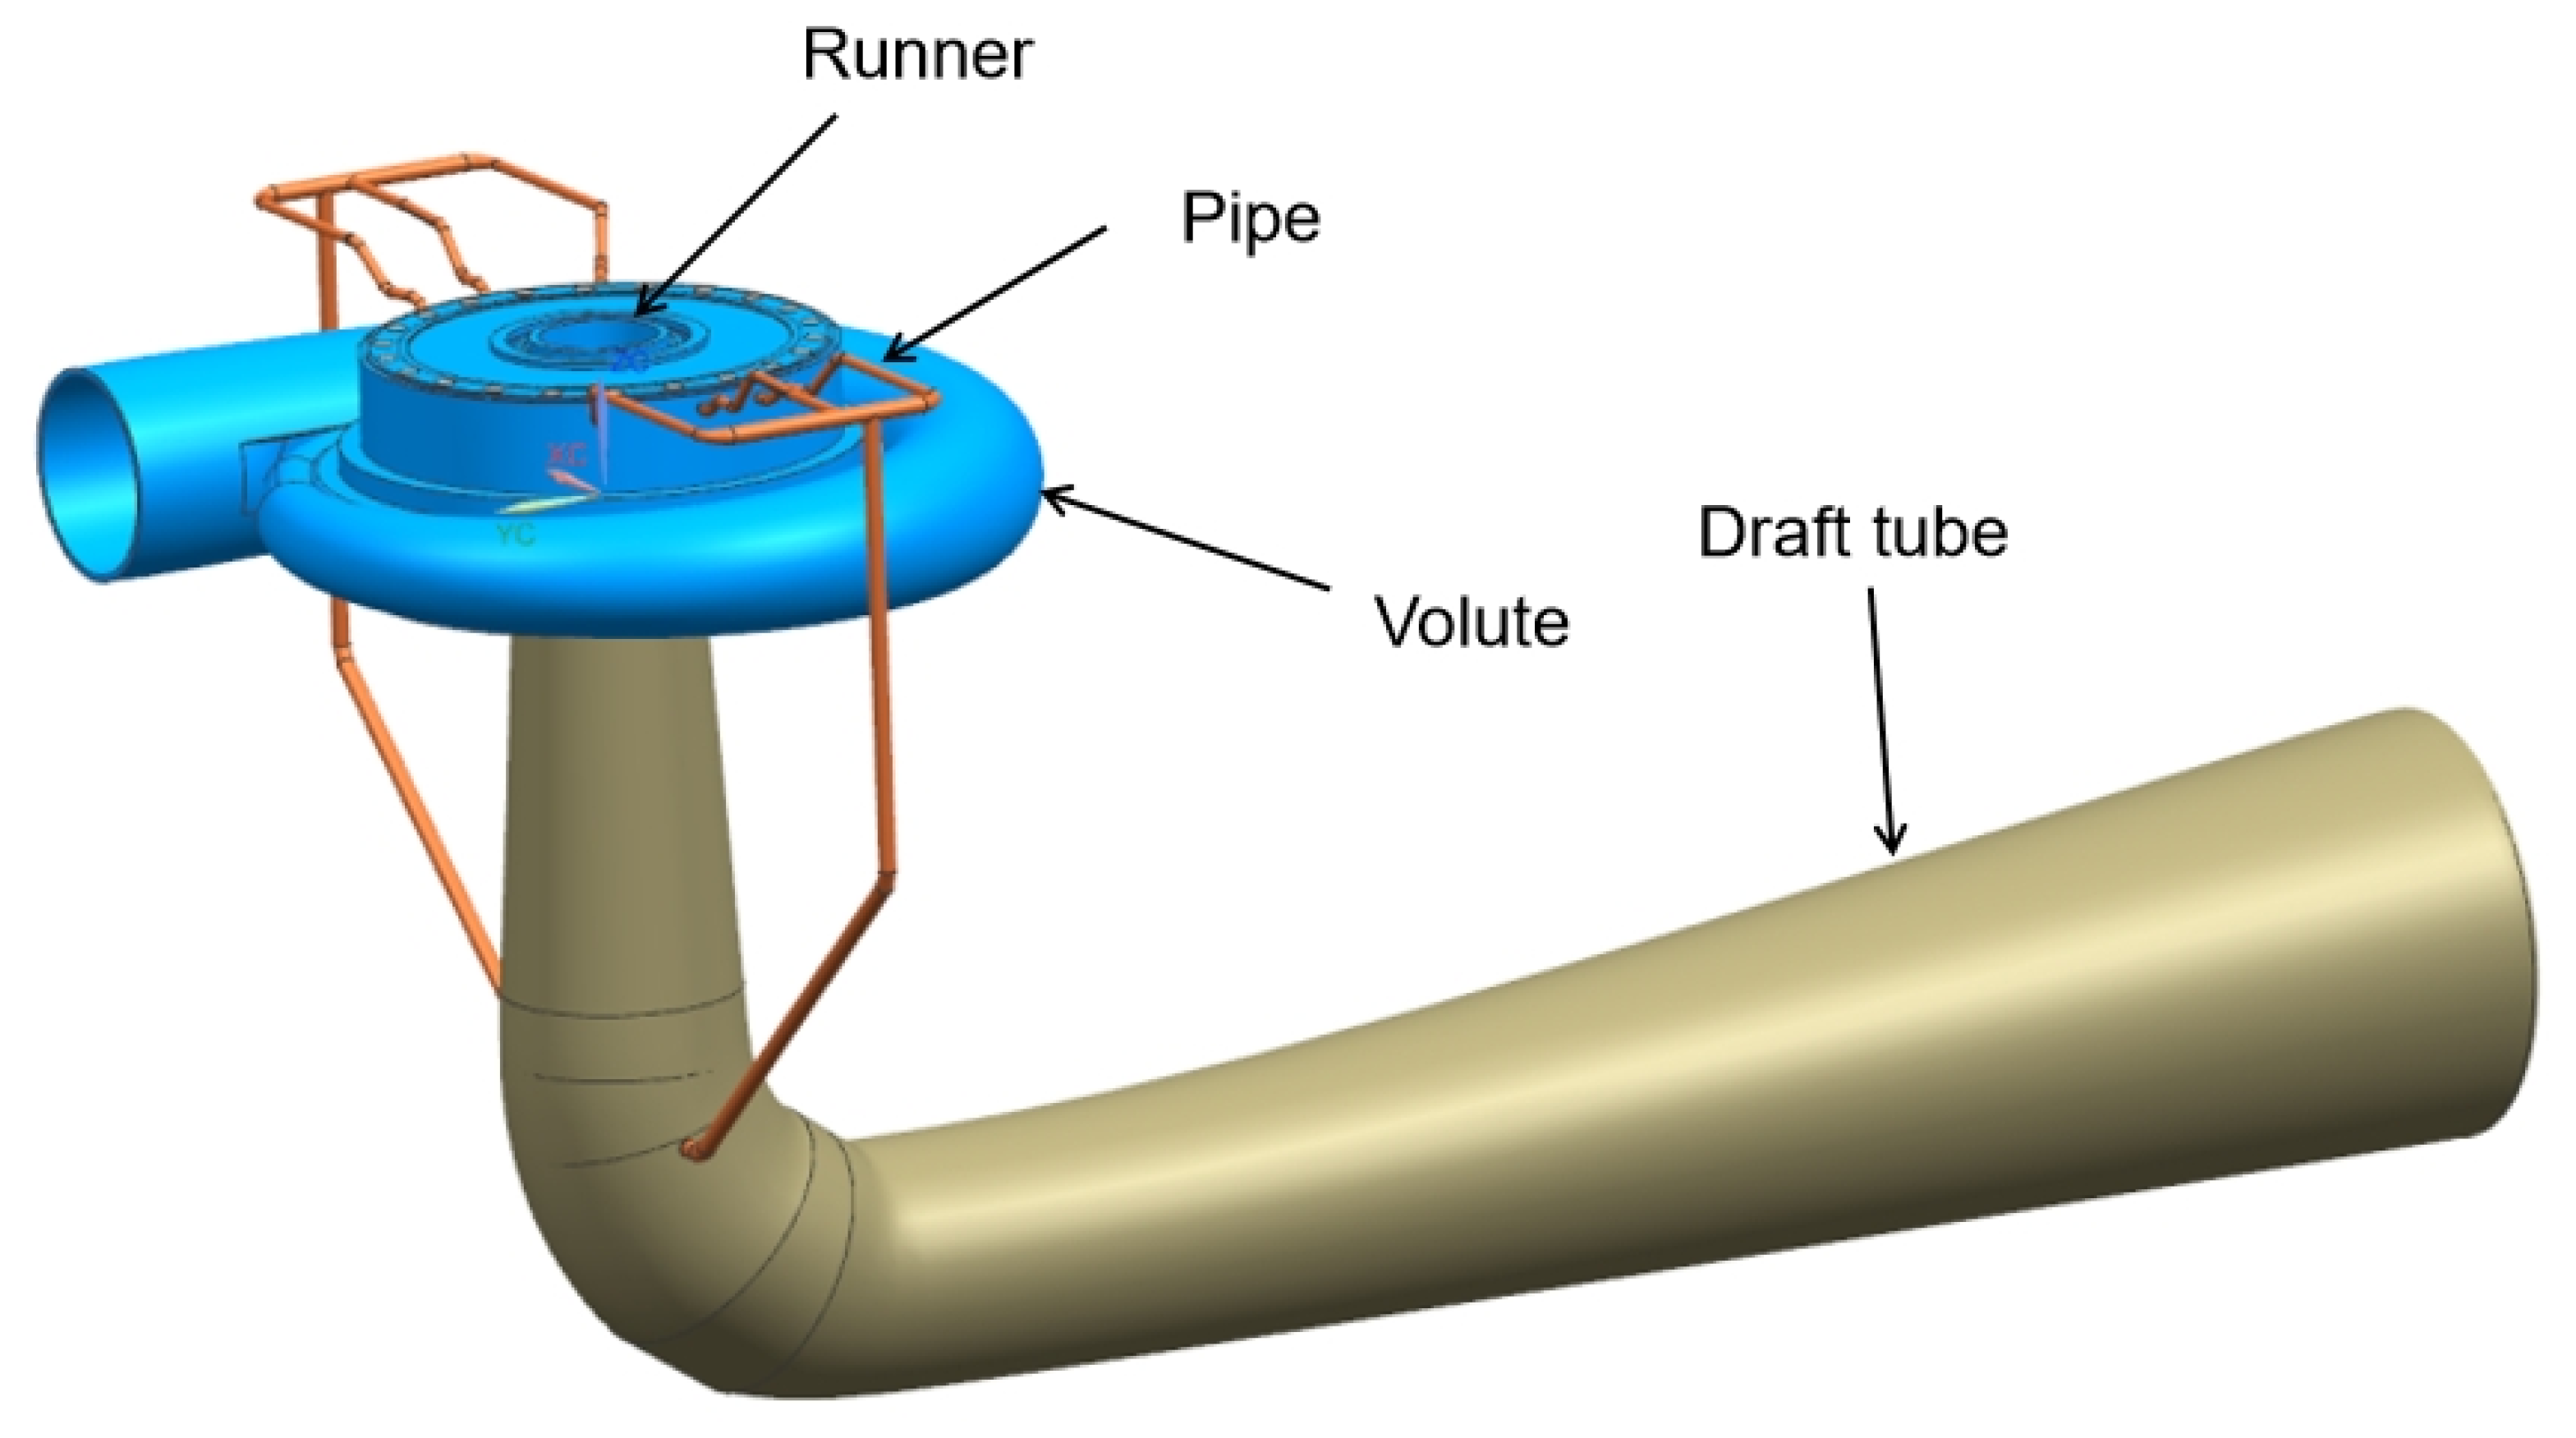
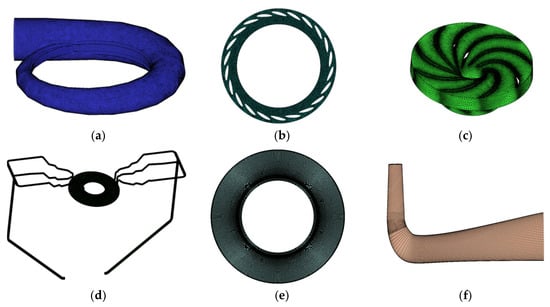
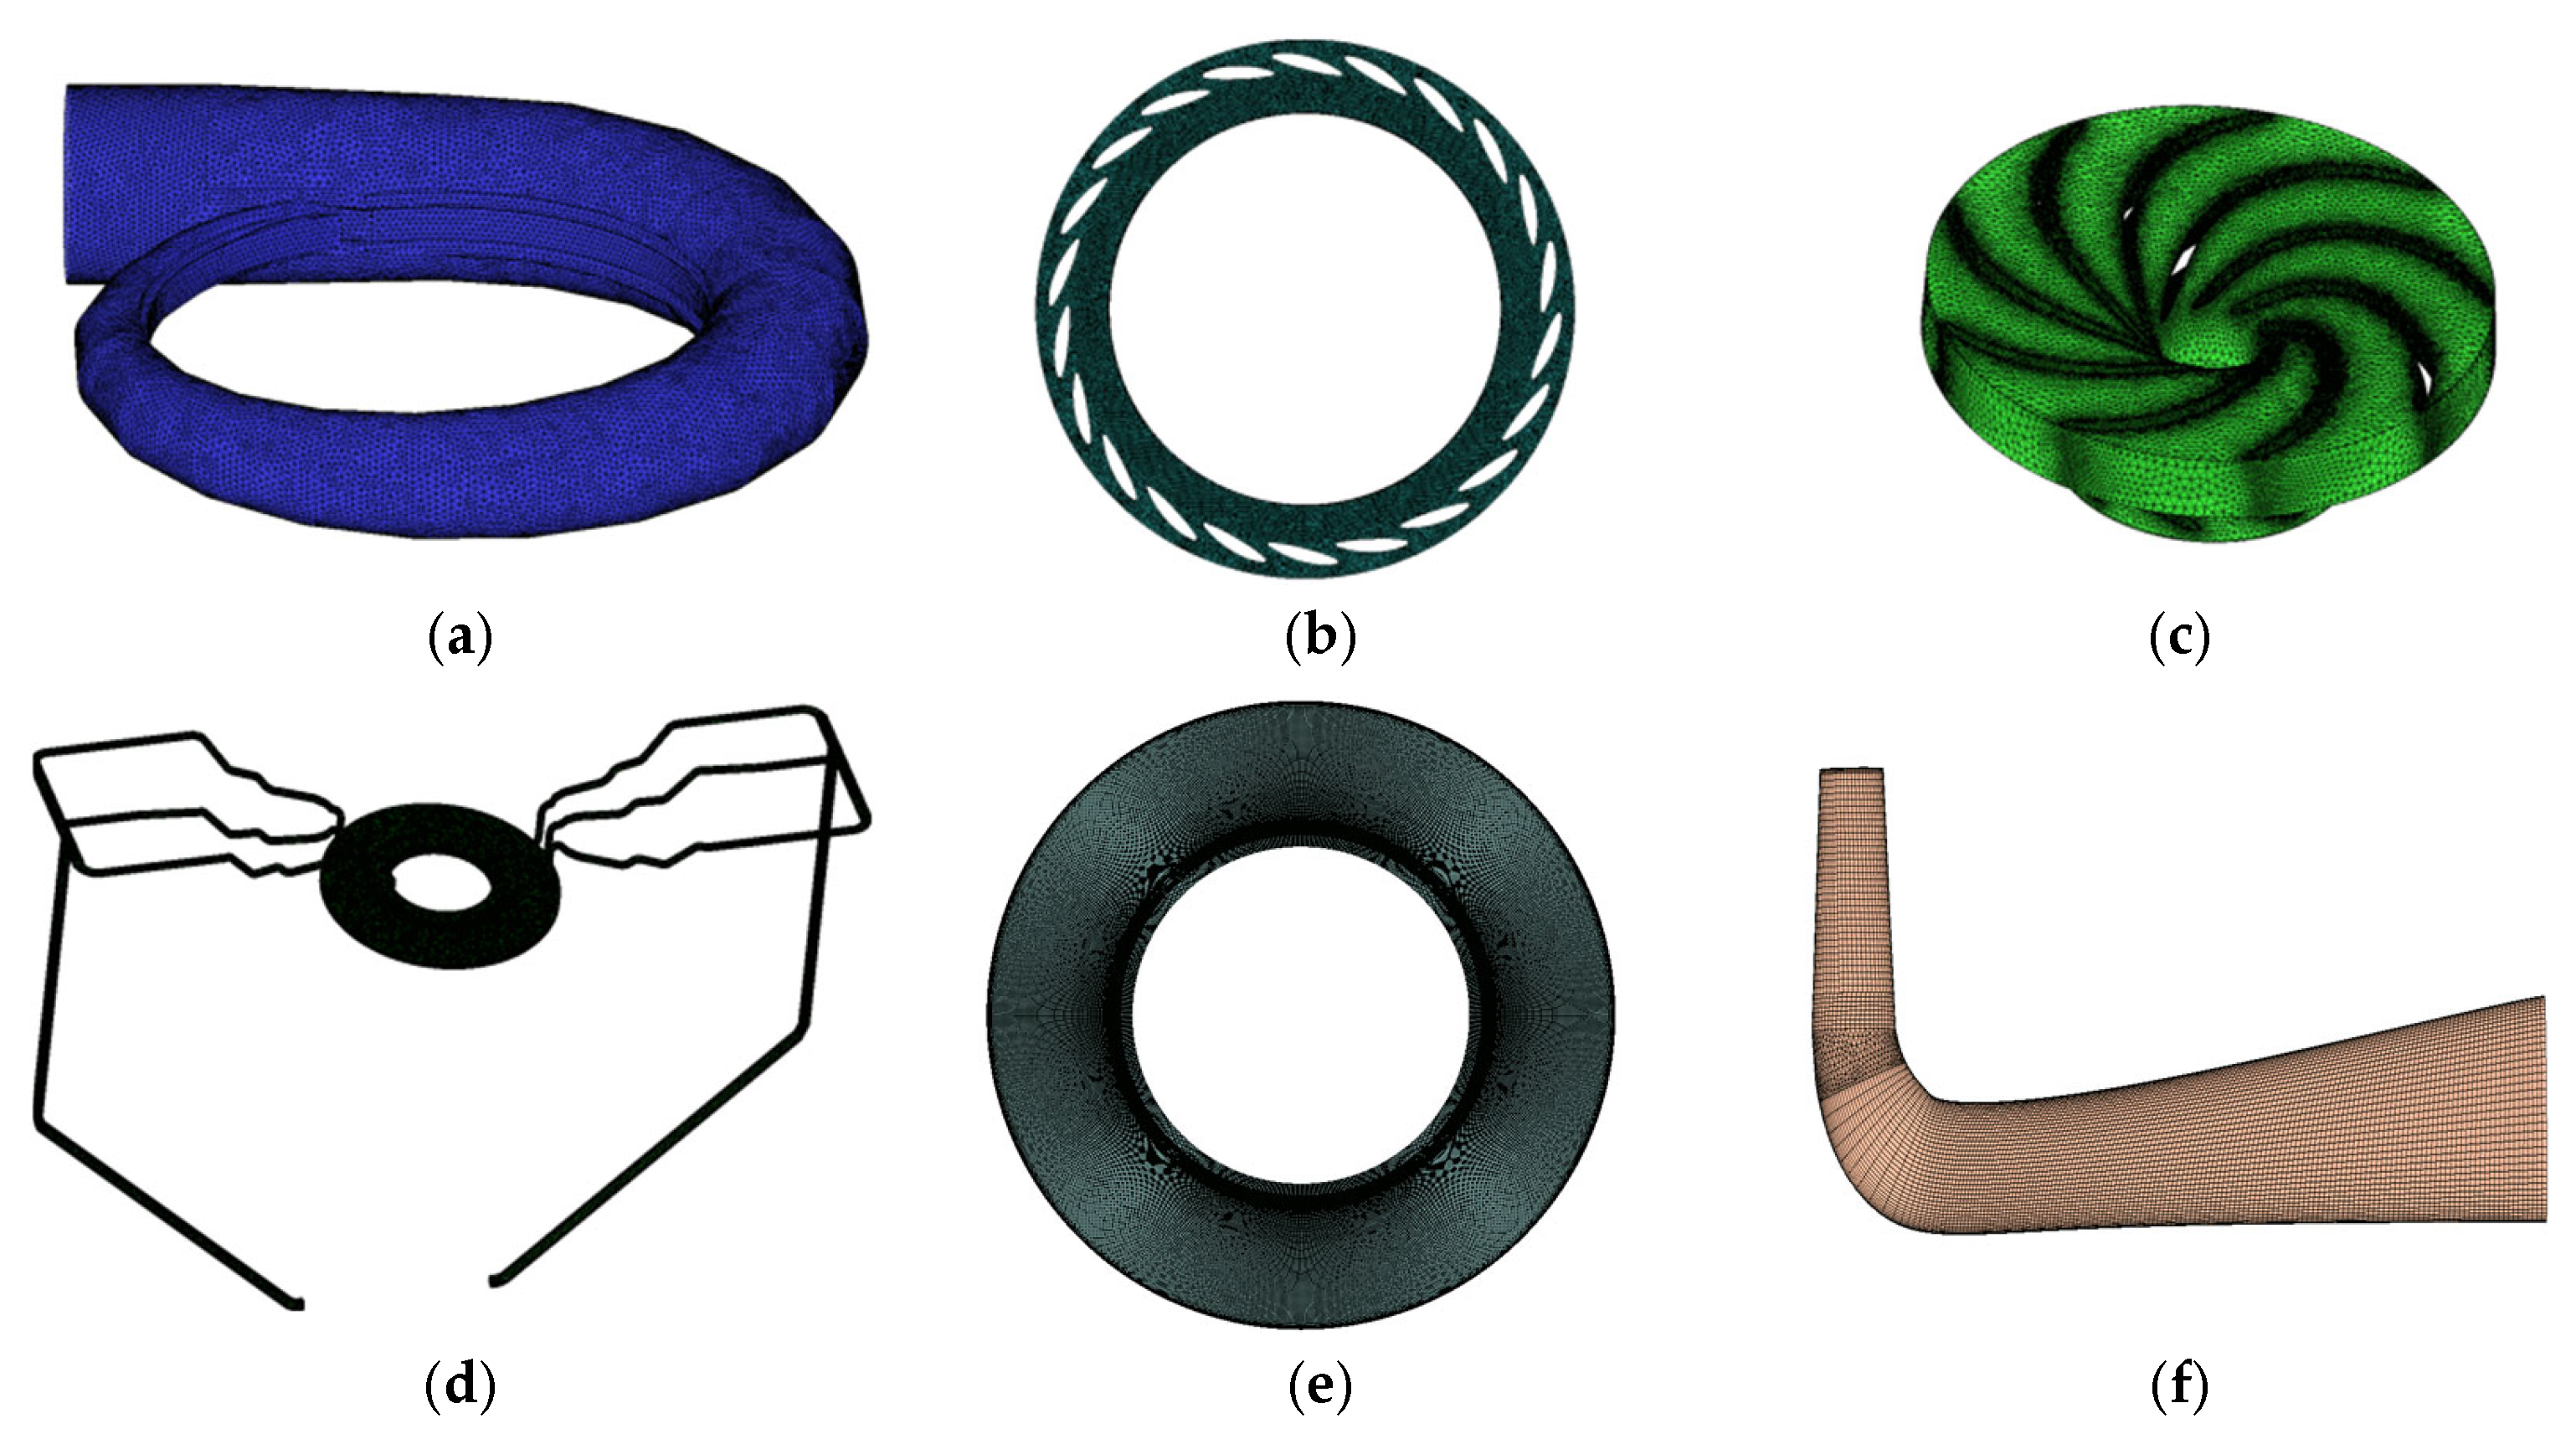
This study employs both structured and unstructured meshing methods to generate 3D fluid flow models of the hydroturbine volute, fixed guide vanes, movable guide vanes, runner, upper crown clearance, lower ring clearance, tailrace pipe and balance pipe, as shown in Figure 2.
Figure 2.
Mesh division. (a) Water in the volute; (b) water in the guide vane passage; (c) runner water body; (d) top cover–drain pipe water body; (e) water in the lower ring chamber; (f) water in the draft tube.
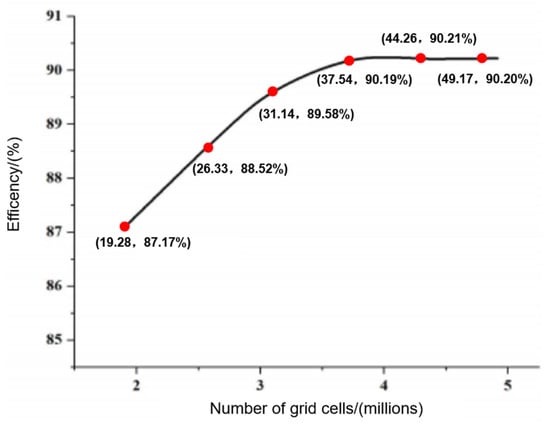
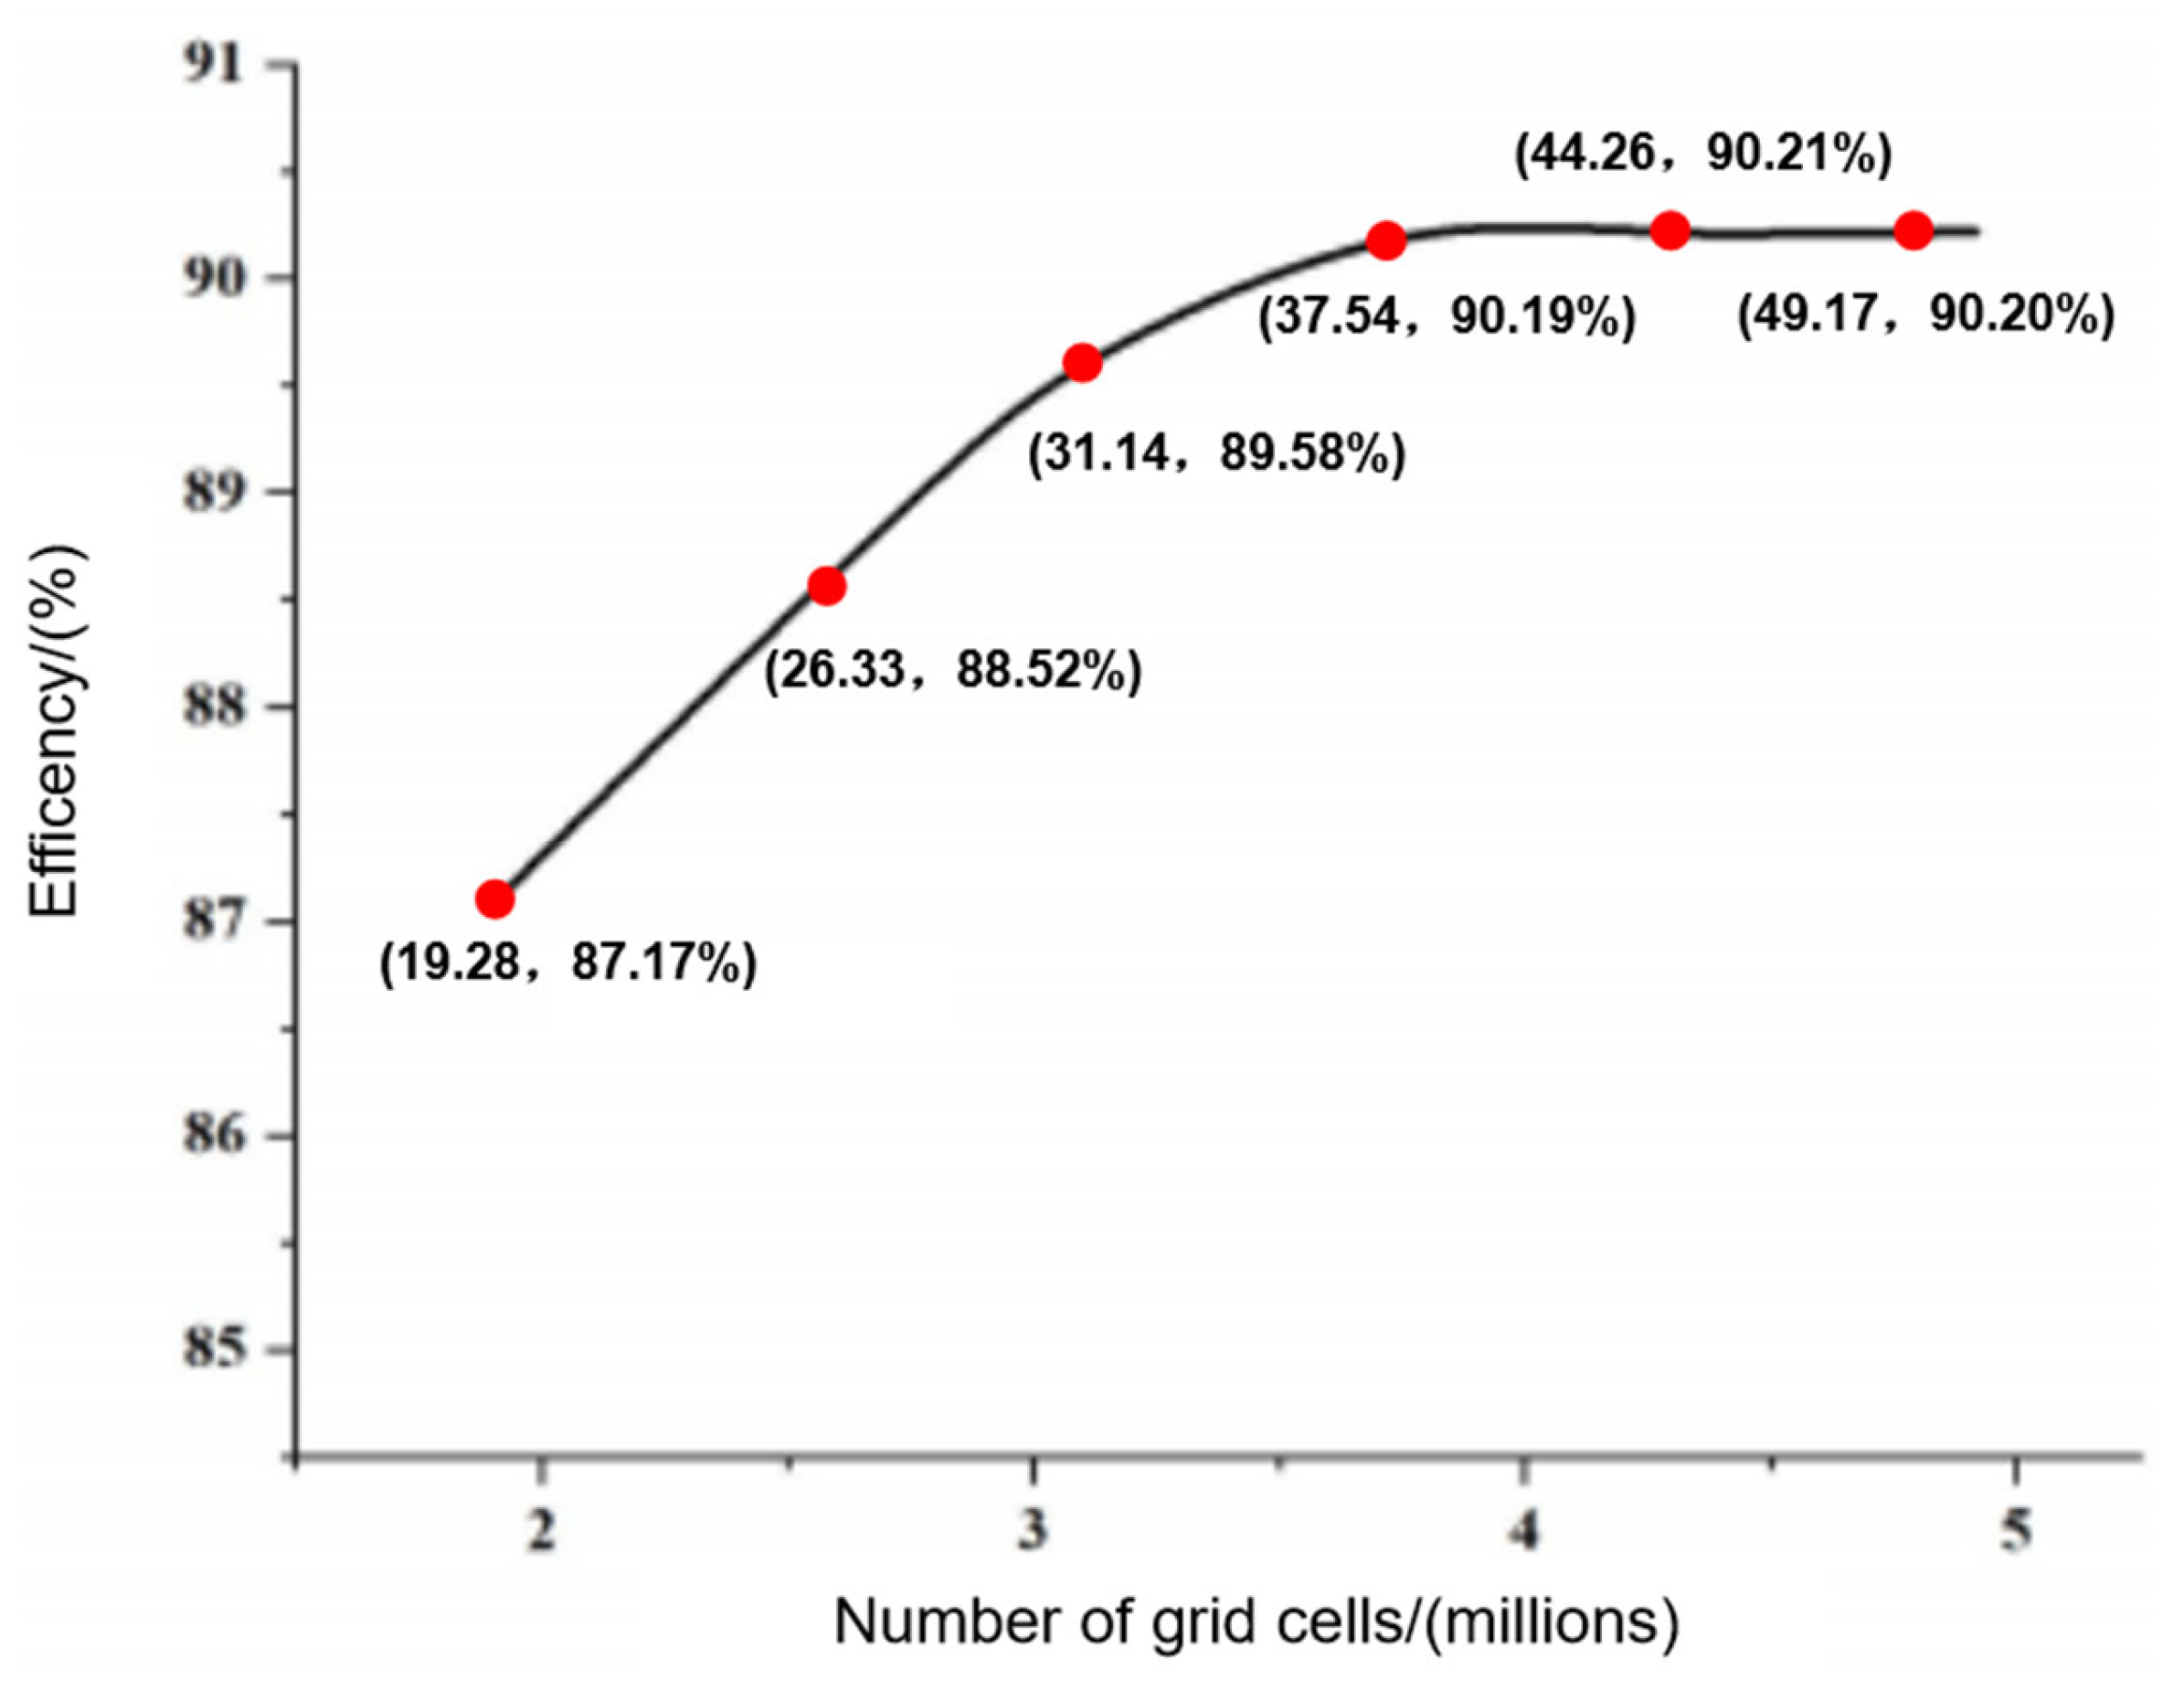
A grid-independence verification was conducted with turbine efficiency as the objective, testing six sets of grids with different numbers of elements: 19.28 million, 26.33 million, 31.14 million, 37.54 million, 44.26 million and 49.17 million, respectively. The verification results are shown in Figure 3. It can be seen that once the number of elements reaches 37.51 million, the efficiency stabilizes at 90.19%. At this point, further increases in the number of elements result in efficiency changes of less than 0.03%. Therefore, limiting the total number of elements to 37.51 million is sufficient to meet the computational requirements.
Figure 3.
Verification of grid independence.
2.3. Research Methods
This study employs a weakly coupled method to perform transient fluid–structure interaction calculations. First, the unsteady Reynolds-averaged Navier–Stokes (URANS) equations are solved using CFD to obtain the pressure distribution on the impeller surface at each time step. Subsequently, this pressure field is applied as a boundary condition to the structural model, and the structural dynamic equations are solved using CSD to calculate the transient stress and displacement responses of the impeller.
This project requires a modal analysis of the rotating components and the impeller. Both are multi-degree-of-freedom systems, and their equations of motion are:
If we transform this matrix equation in the time domain to the Lagrangian domain (with the variable p), and assume that the initial displacement and initial velocity are zero, we have:
where is the dynamic stiffness matrix.
If the effect of the surrounding water is disregarded and the force function is set directly to zero, the solution to the above equations becomes an eigenvalue problem. The eigenvalues obtained represent the natural frequencies of the structure in air, whilst the eigenvectors corresponding to each eigenvalue represent the mode shapes of the structure in air.
The governing equation for the fluid domain is the unsteady Reynolds-averaged Navier–Stokes (URANS) equation for incompressible flow, including the continuity equation and momentum equation:
where u is the flow velocity t is time, ρ is the fluid density, p is the flow pressure, v is kinematic viscosity, St is the source term, and τ is the Reynolds stress.
For the structural domain, the governing equation is given in Equation (3). The boundary conditions for the structural calculation (i.e., constraints) are specified as follows: the runner is fixed at the interface between the upper crown and the main shaft, where all translational and rotational degrees of freedom are constrained. The lower ring is free, and no additional constraints are imposed. The transient pressure distribution obtained from the CFD simulation is applied as a load on the runner blade surfaces, the upper crown, and the lower ring.
The fluid–structure interaction (FSI) is solved using a weakly coupled, one-way approach. At each time step, the CFD solver first computes the flow field and extracts the pressure distribution on the runner surfaces. This pressure field is then interpolated onto the structural mesh via the FSI interface. Subsequently, the CSD solver (using the finite element method) calculates the transient stress and displacement responses of the runner. Because the deformation of the runner is relatively small under the present operating conditions, its effect on the flow field is neglected, and the fluid mesh is not updated. This one-way coupling scheme effectively captures the dominant hydraulic excitation on the structure while maintaining computational efficiency.
2.4. Design Conditions (RT-5)
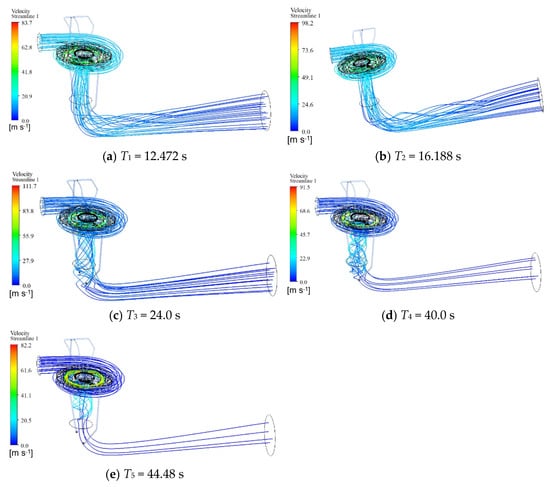
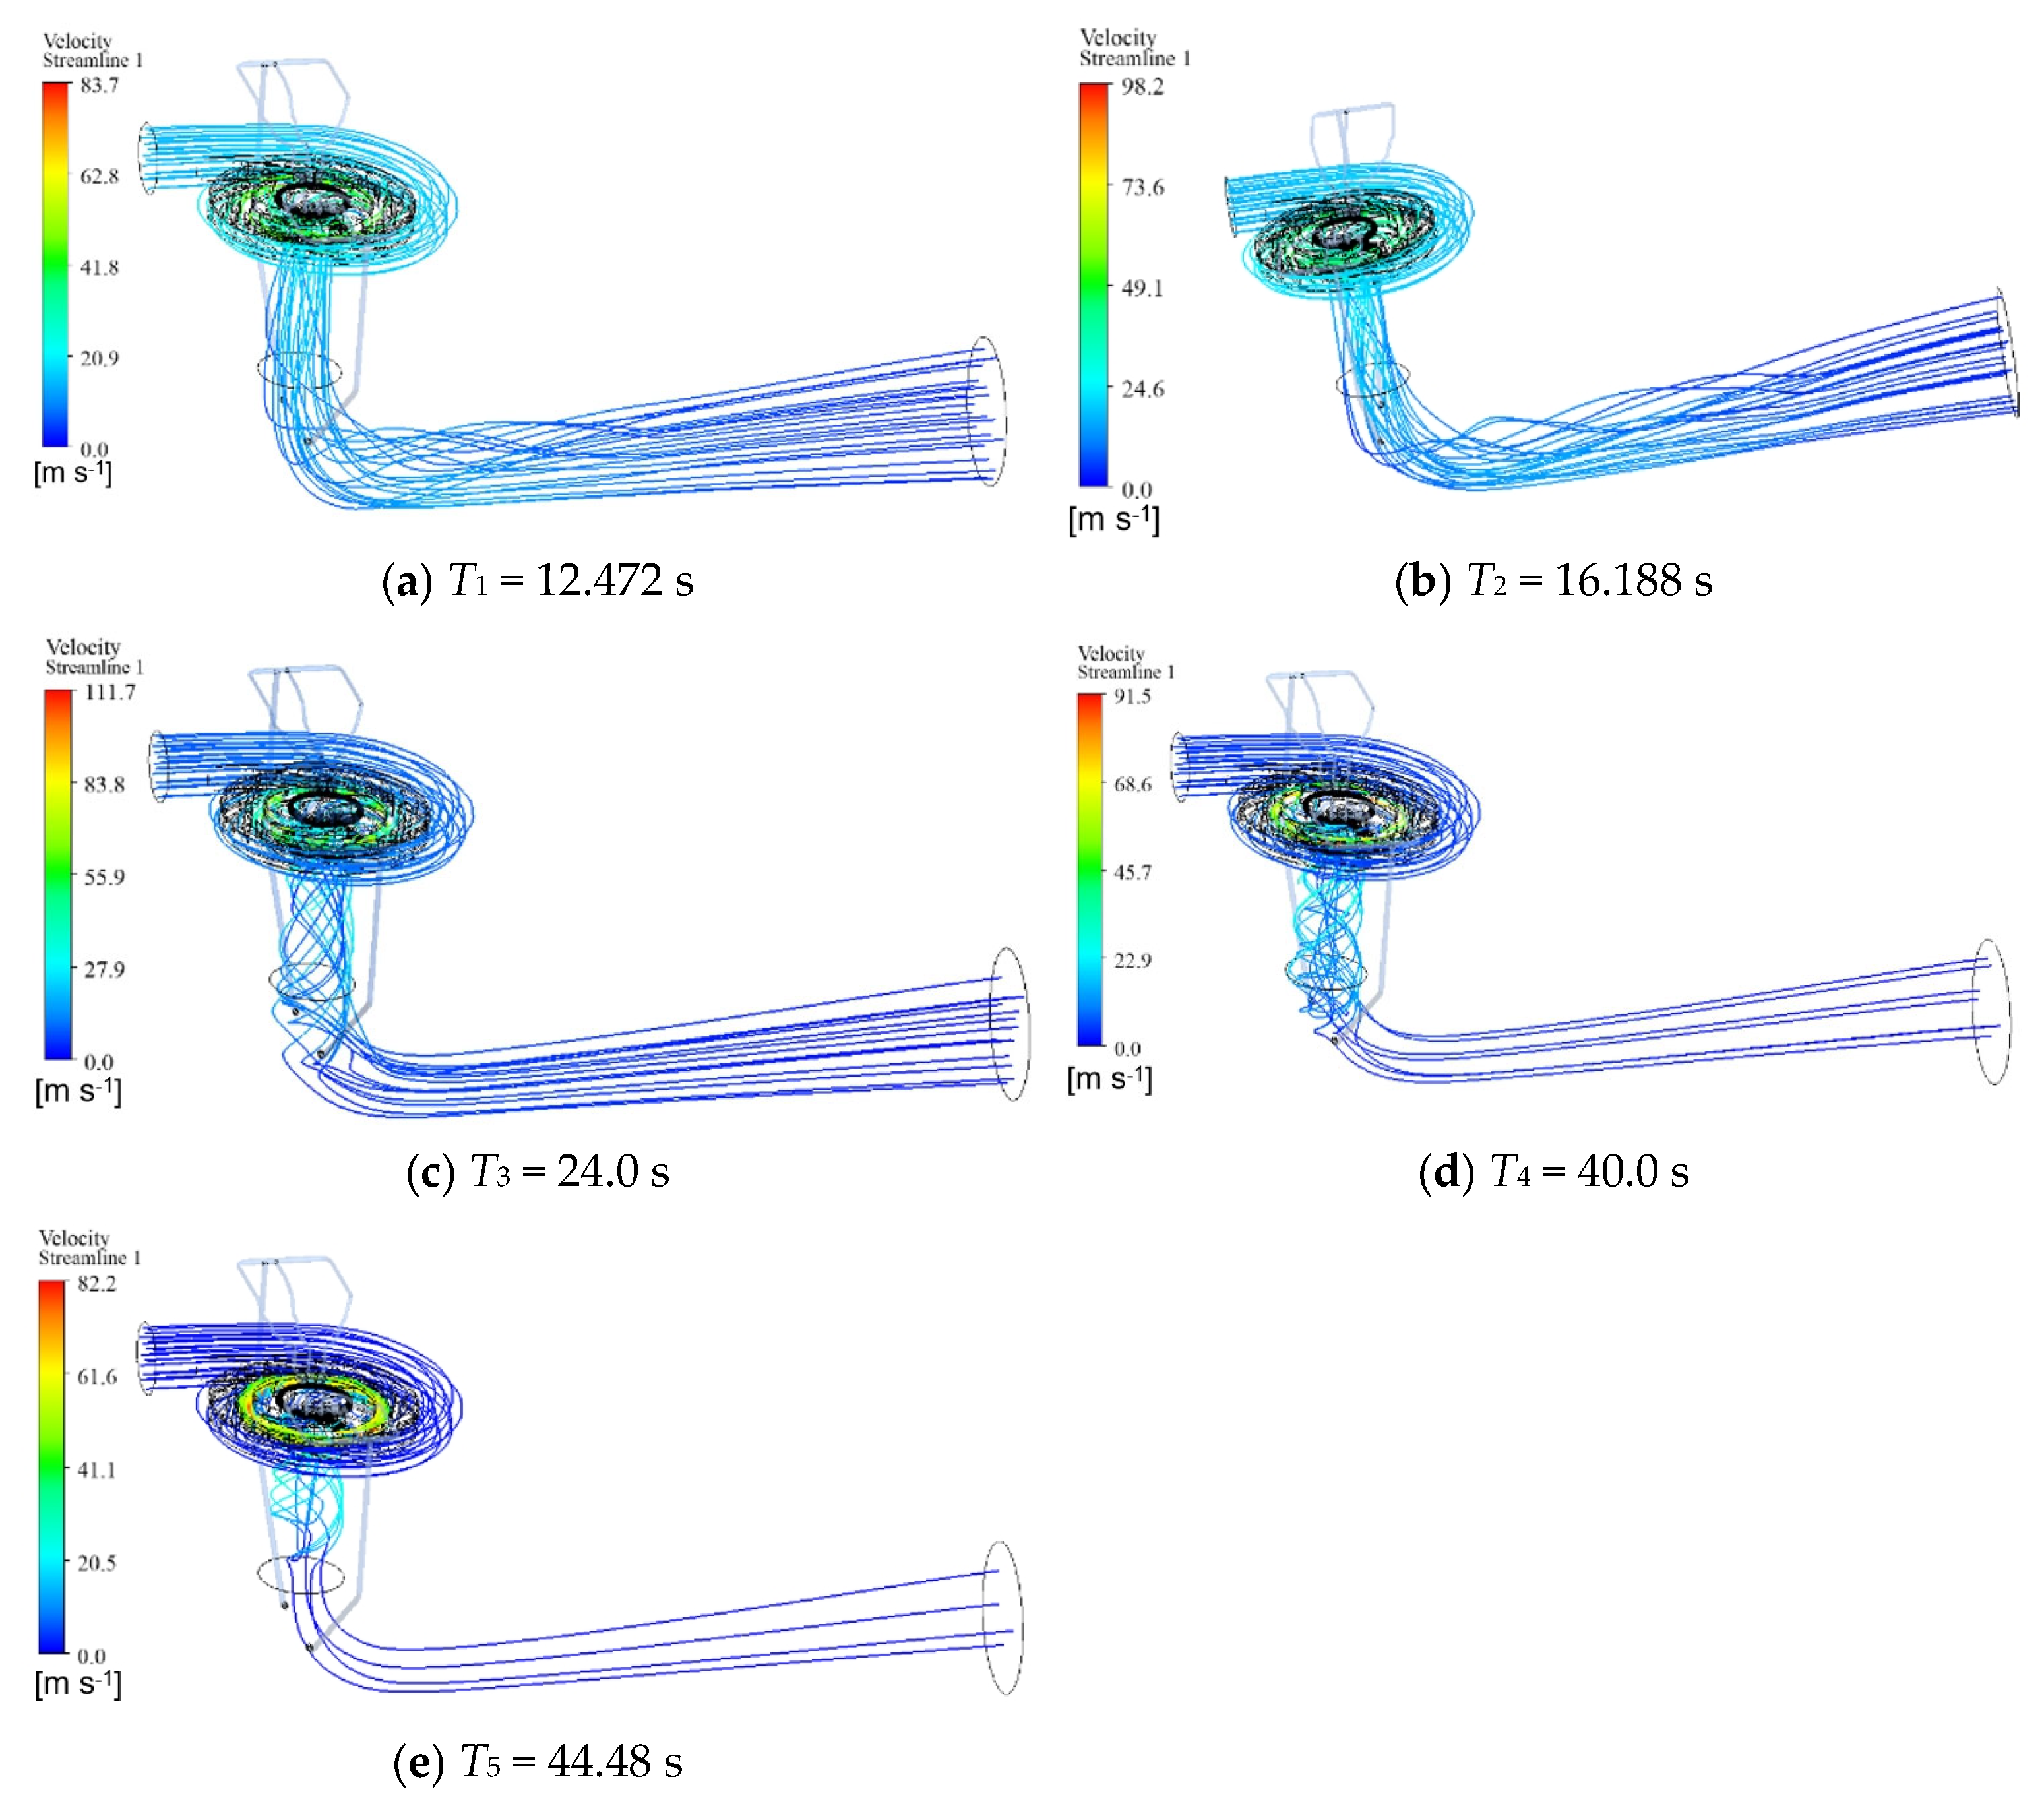
As shown in Figure 4, the RT-5 condition simulates an extreme transient process where the unit operates at full load in power-priority mode under high head and large flow, followed by sudden load shedding. Five characteristic moments are selected to analyze the flow field evolution. At 12.472 s (before load shedding), a stable turbine flow pattern is observed with uniform streamlines, no obvious separation or vortex structures, and favorable flow conditions. At 16.188 s (initial stage of load shedding), the runner accelerates rapidly due to water inertia, streamlines become distorted with local vortices, and flow separation initially develops. At 24.0 s (peak rotational speed near runaway speed), the flow field is highly disordered with extensive vortices and recirculation, non-uniform velocity distribution and severe flow separation, representing a high-risk moment for pressure pulsations and structural vibrations. At 40.0 s (reverse pump region), the flow reverses to impact the runner, resulting in an overall flow reversal with strong recirculation and prominent impingement effects. At 44.48 s, the flow gradually mitigates, reverse vortex structures decay, and the flow field transitions toward a quasi-steady state. The overall flow field evolves as steady state → disordered flow → strong vortex flow → reverse pump flow → flow stabilization, with 24.0 s identified as the critical moment featuring the most severe flow conditions and highest operational risk.
Figure 4.
Flow field distribution diagrams for each time period.
3. Analysis of Vibration Characteristics
3.1. Macroscopic External Response
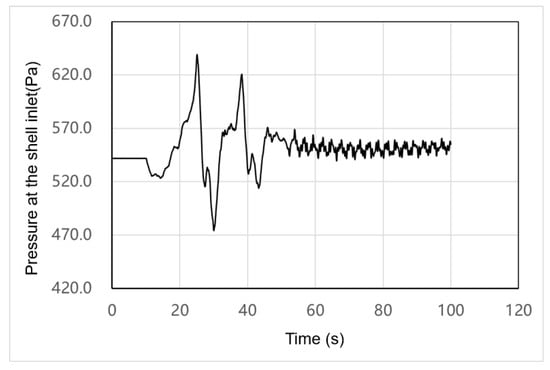
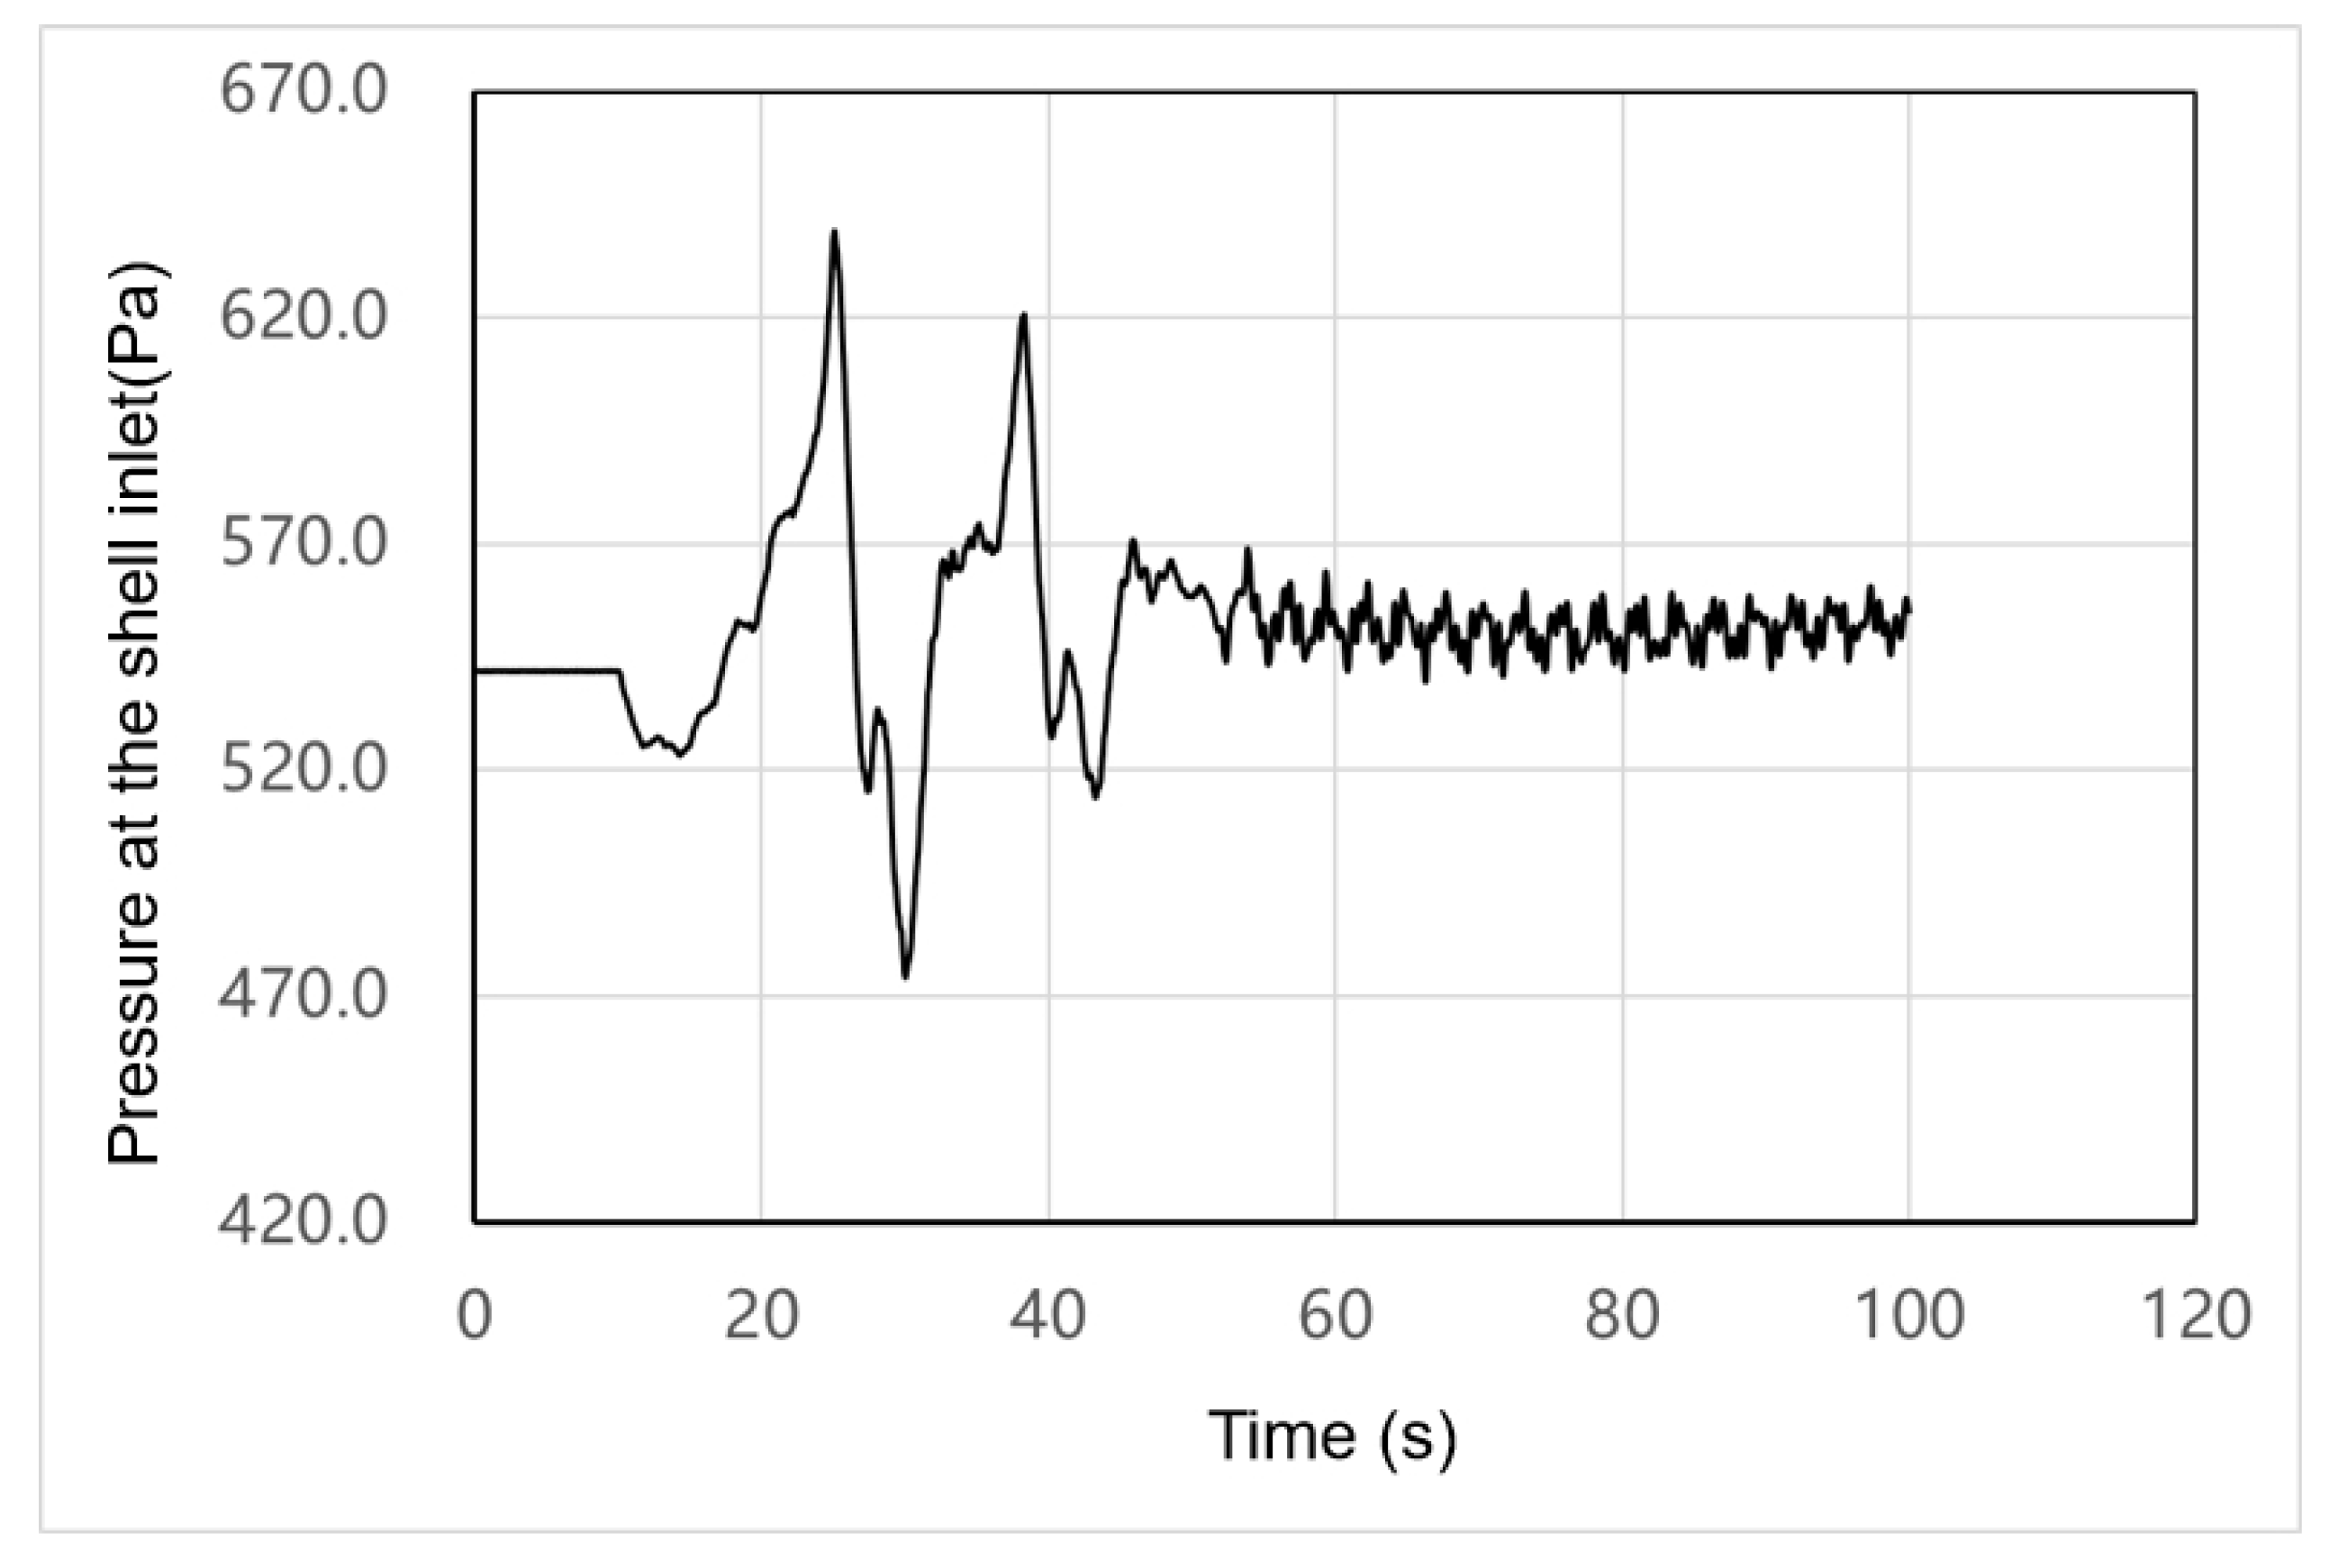
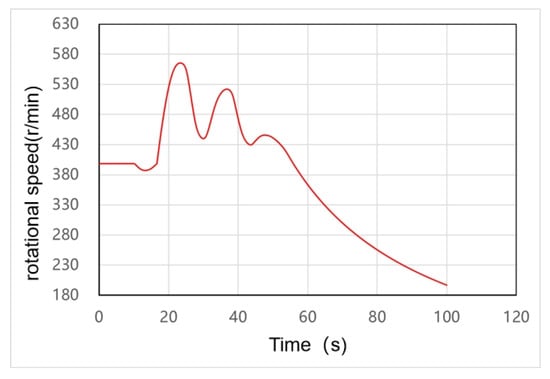
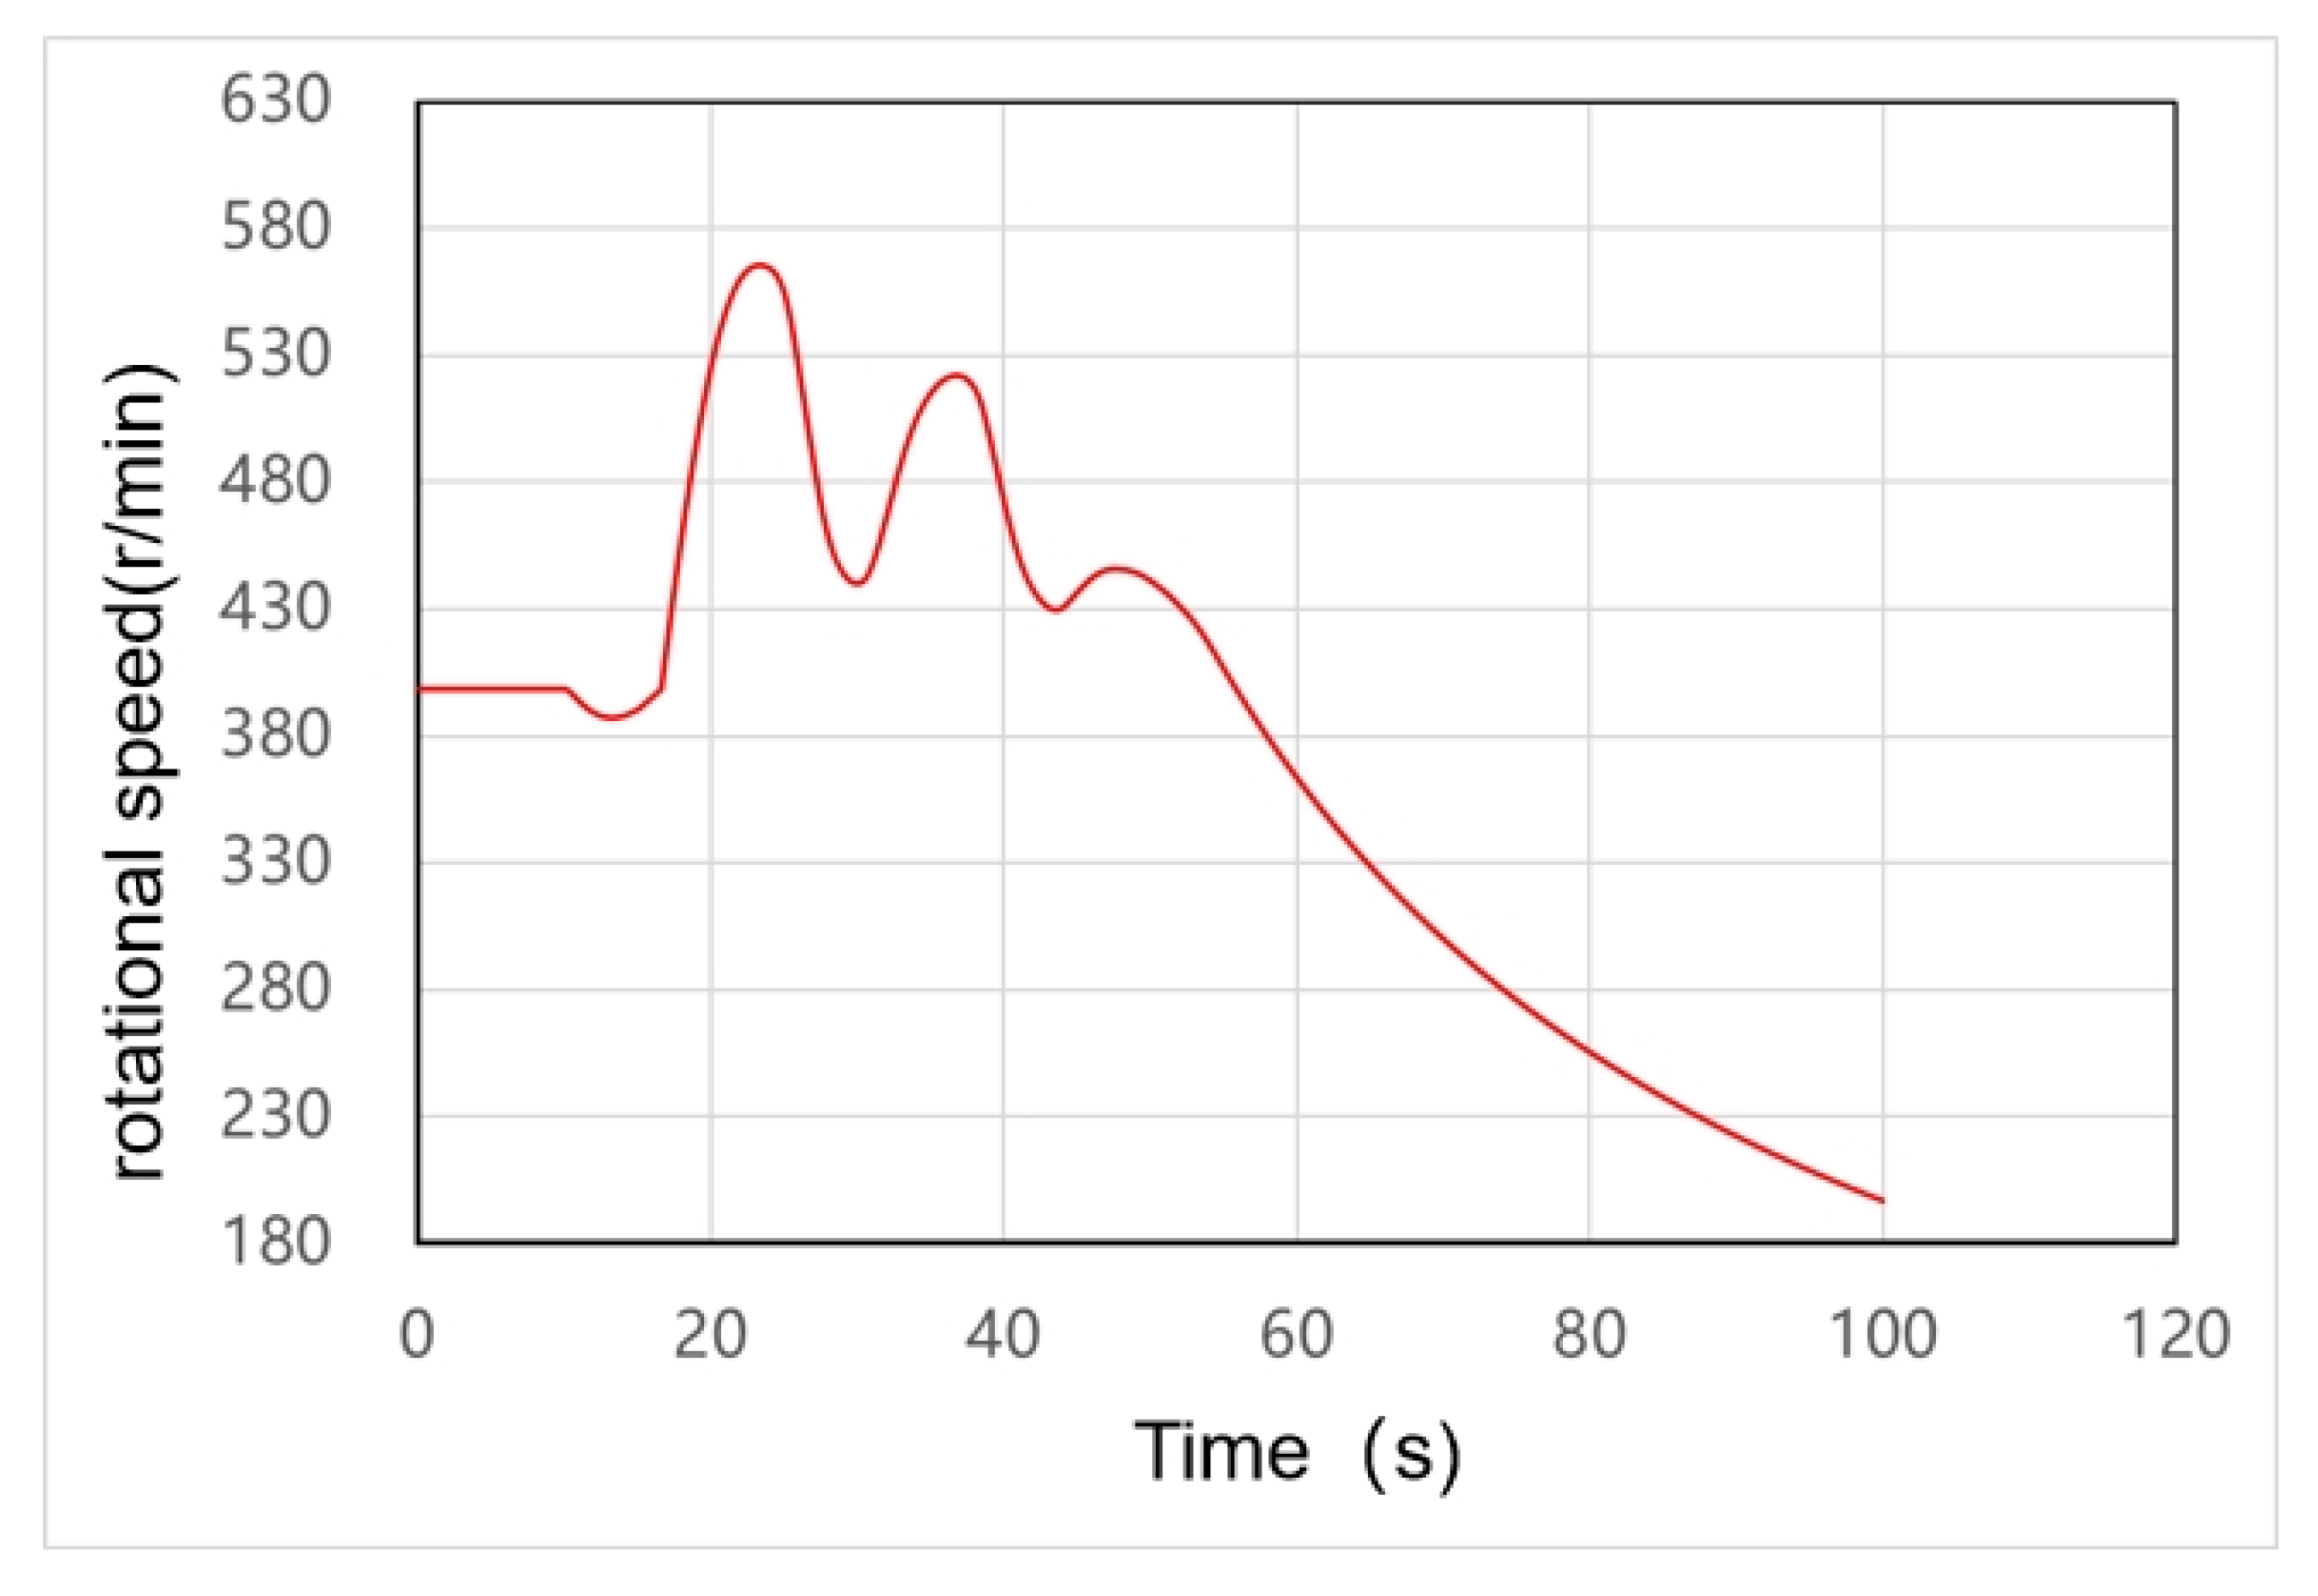
This operating condition involves a rapid increase in load during power generation combined with sudden load shedding. In power-priority mode, load shedding occurs at the point of maximum power or at the highest or lowest point of the speed curve. The external characteristic curves of the unit are shown in Figure 5, Figure 6, Figure 7, Figure 8, Figure 9 and Figure 10.
Figure 5.
Pressure variation curve at the inlet of Unit 4’s volute.
Figure 6.
Speed variation curve for the runner of Unit 4.
Figure 7.
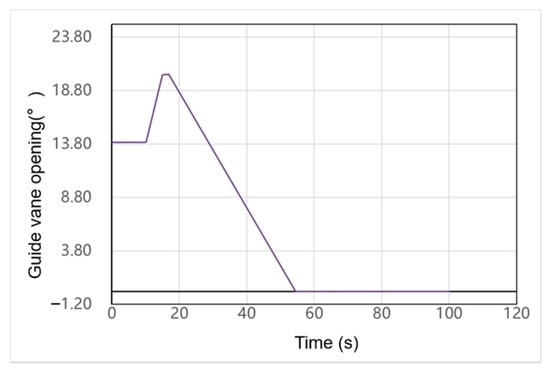
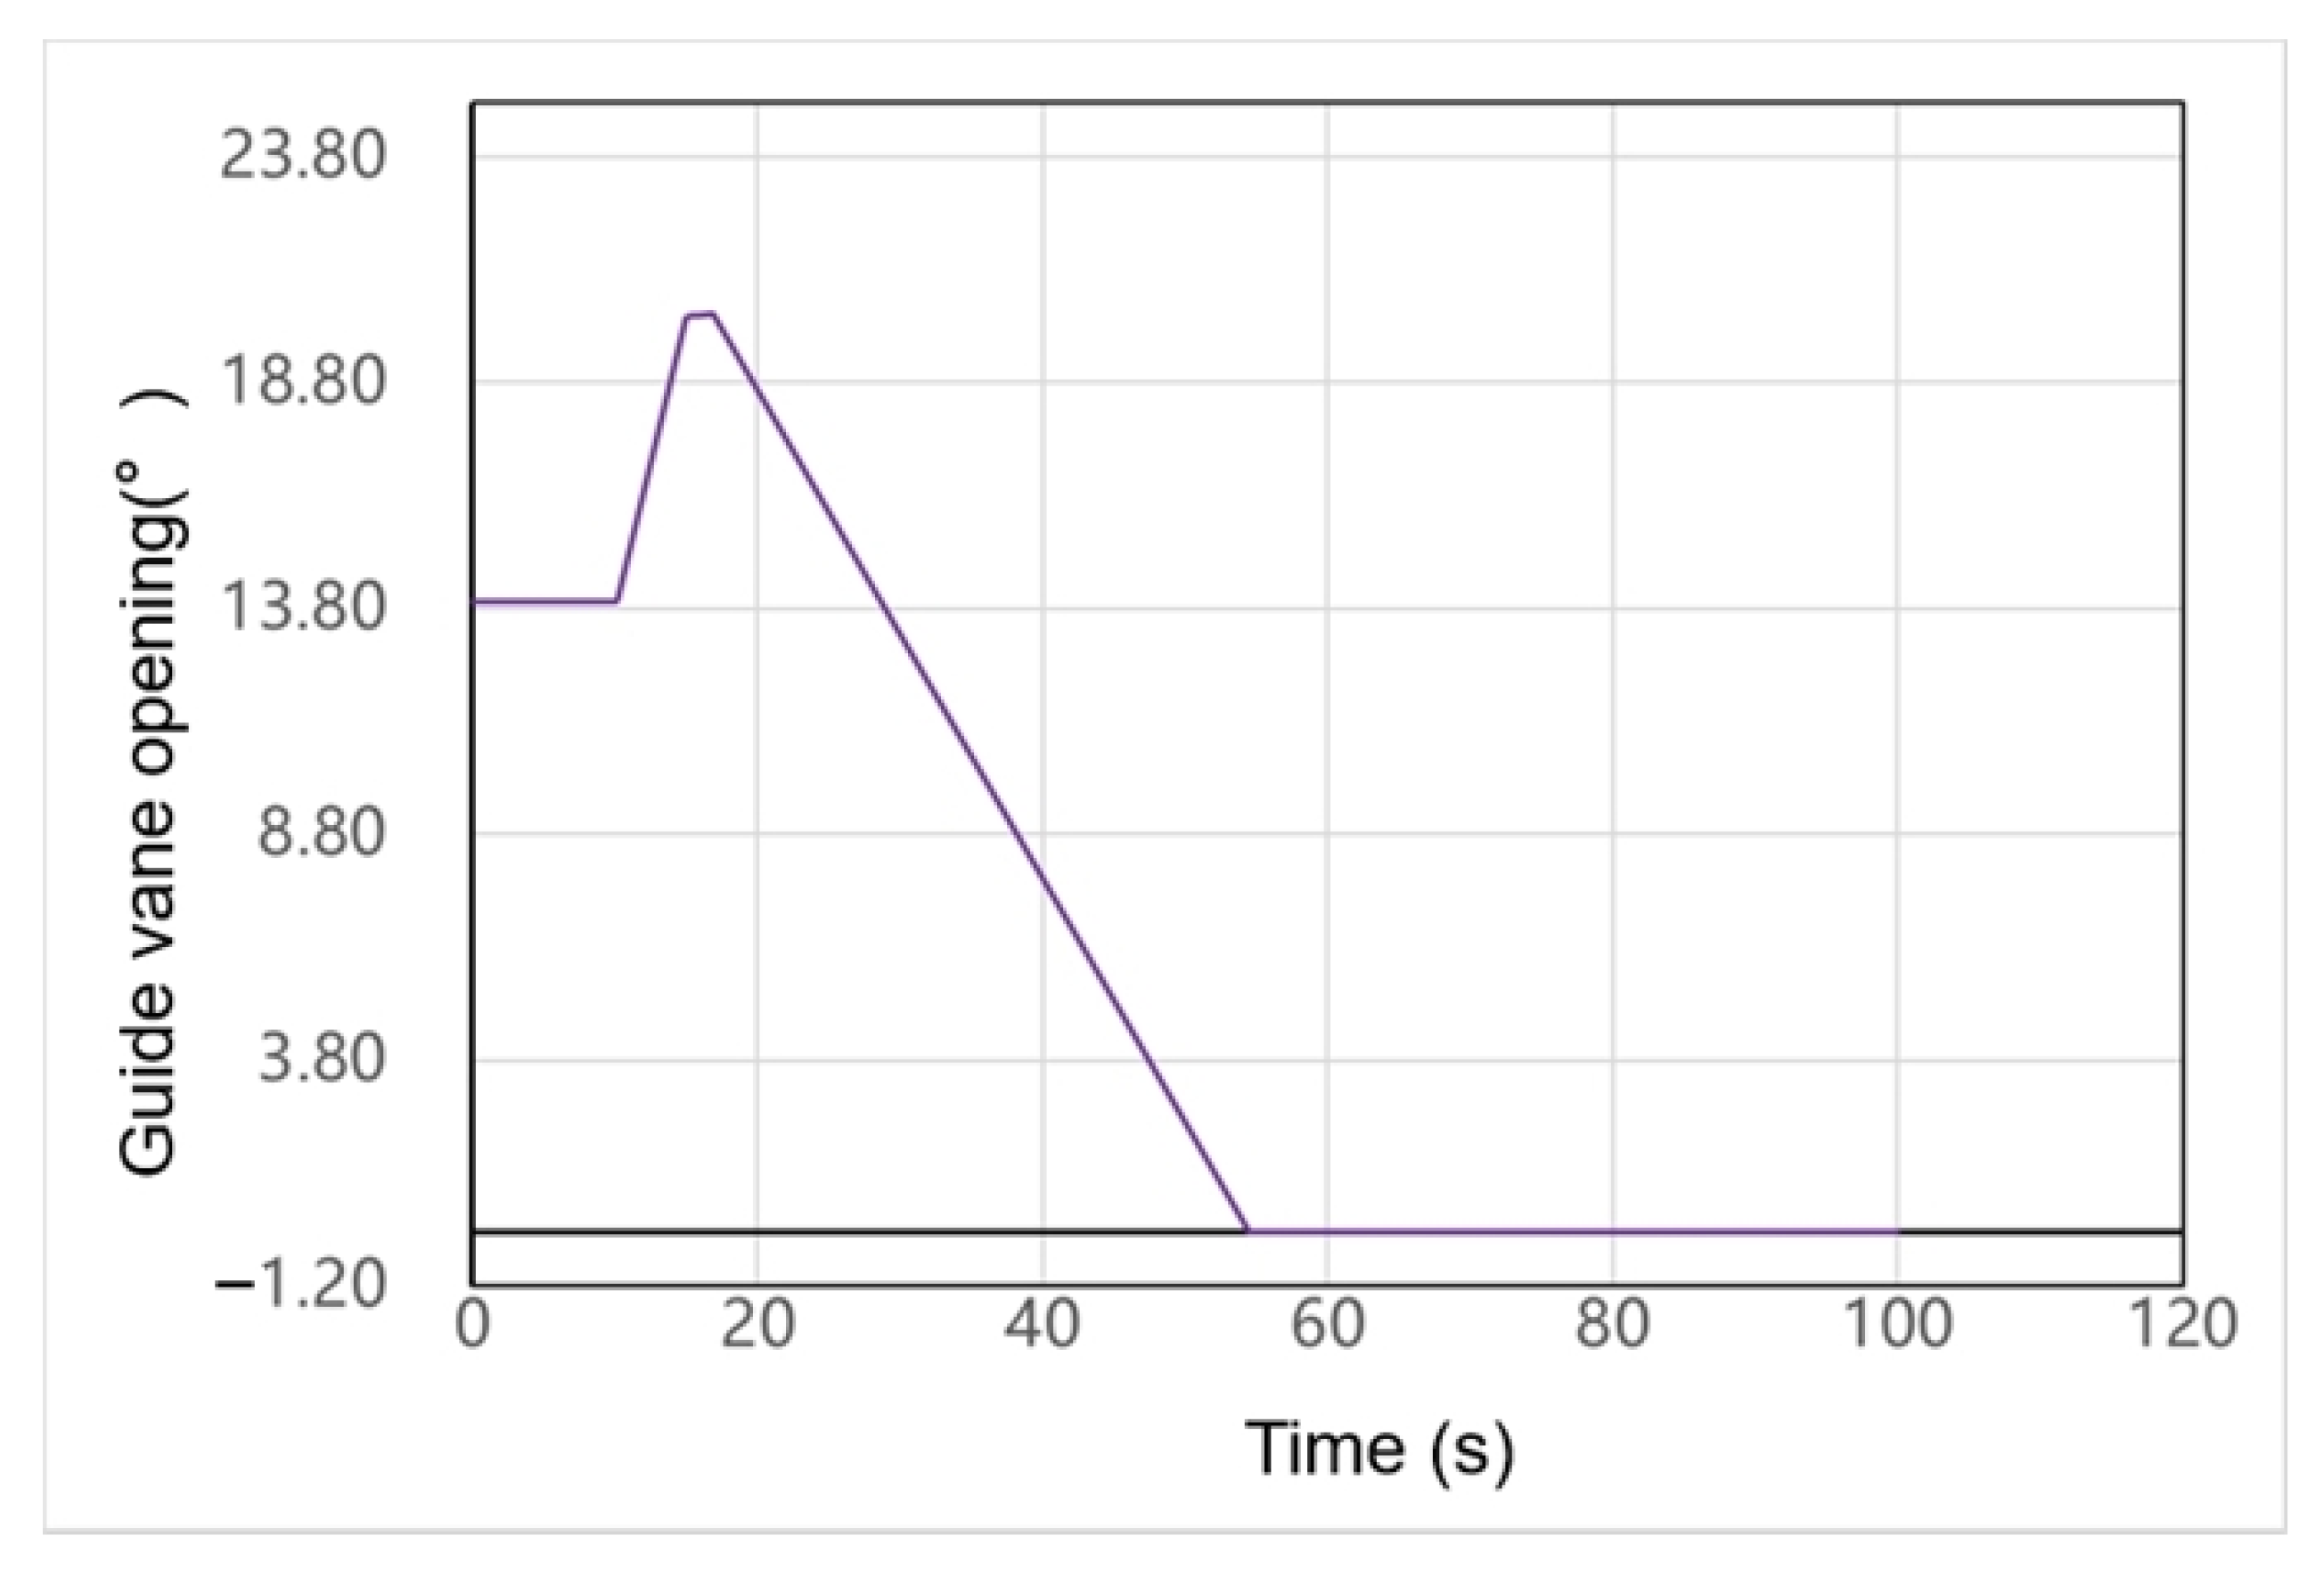
Variation curve of the guide vane opening for Unit 4.
Figure 8.
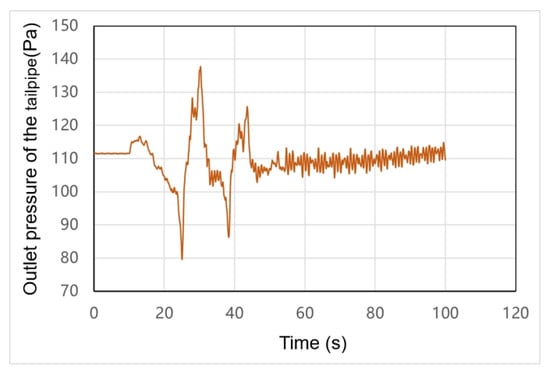
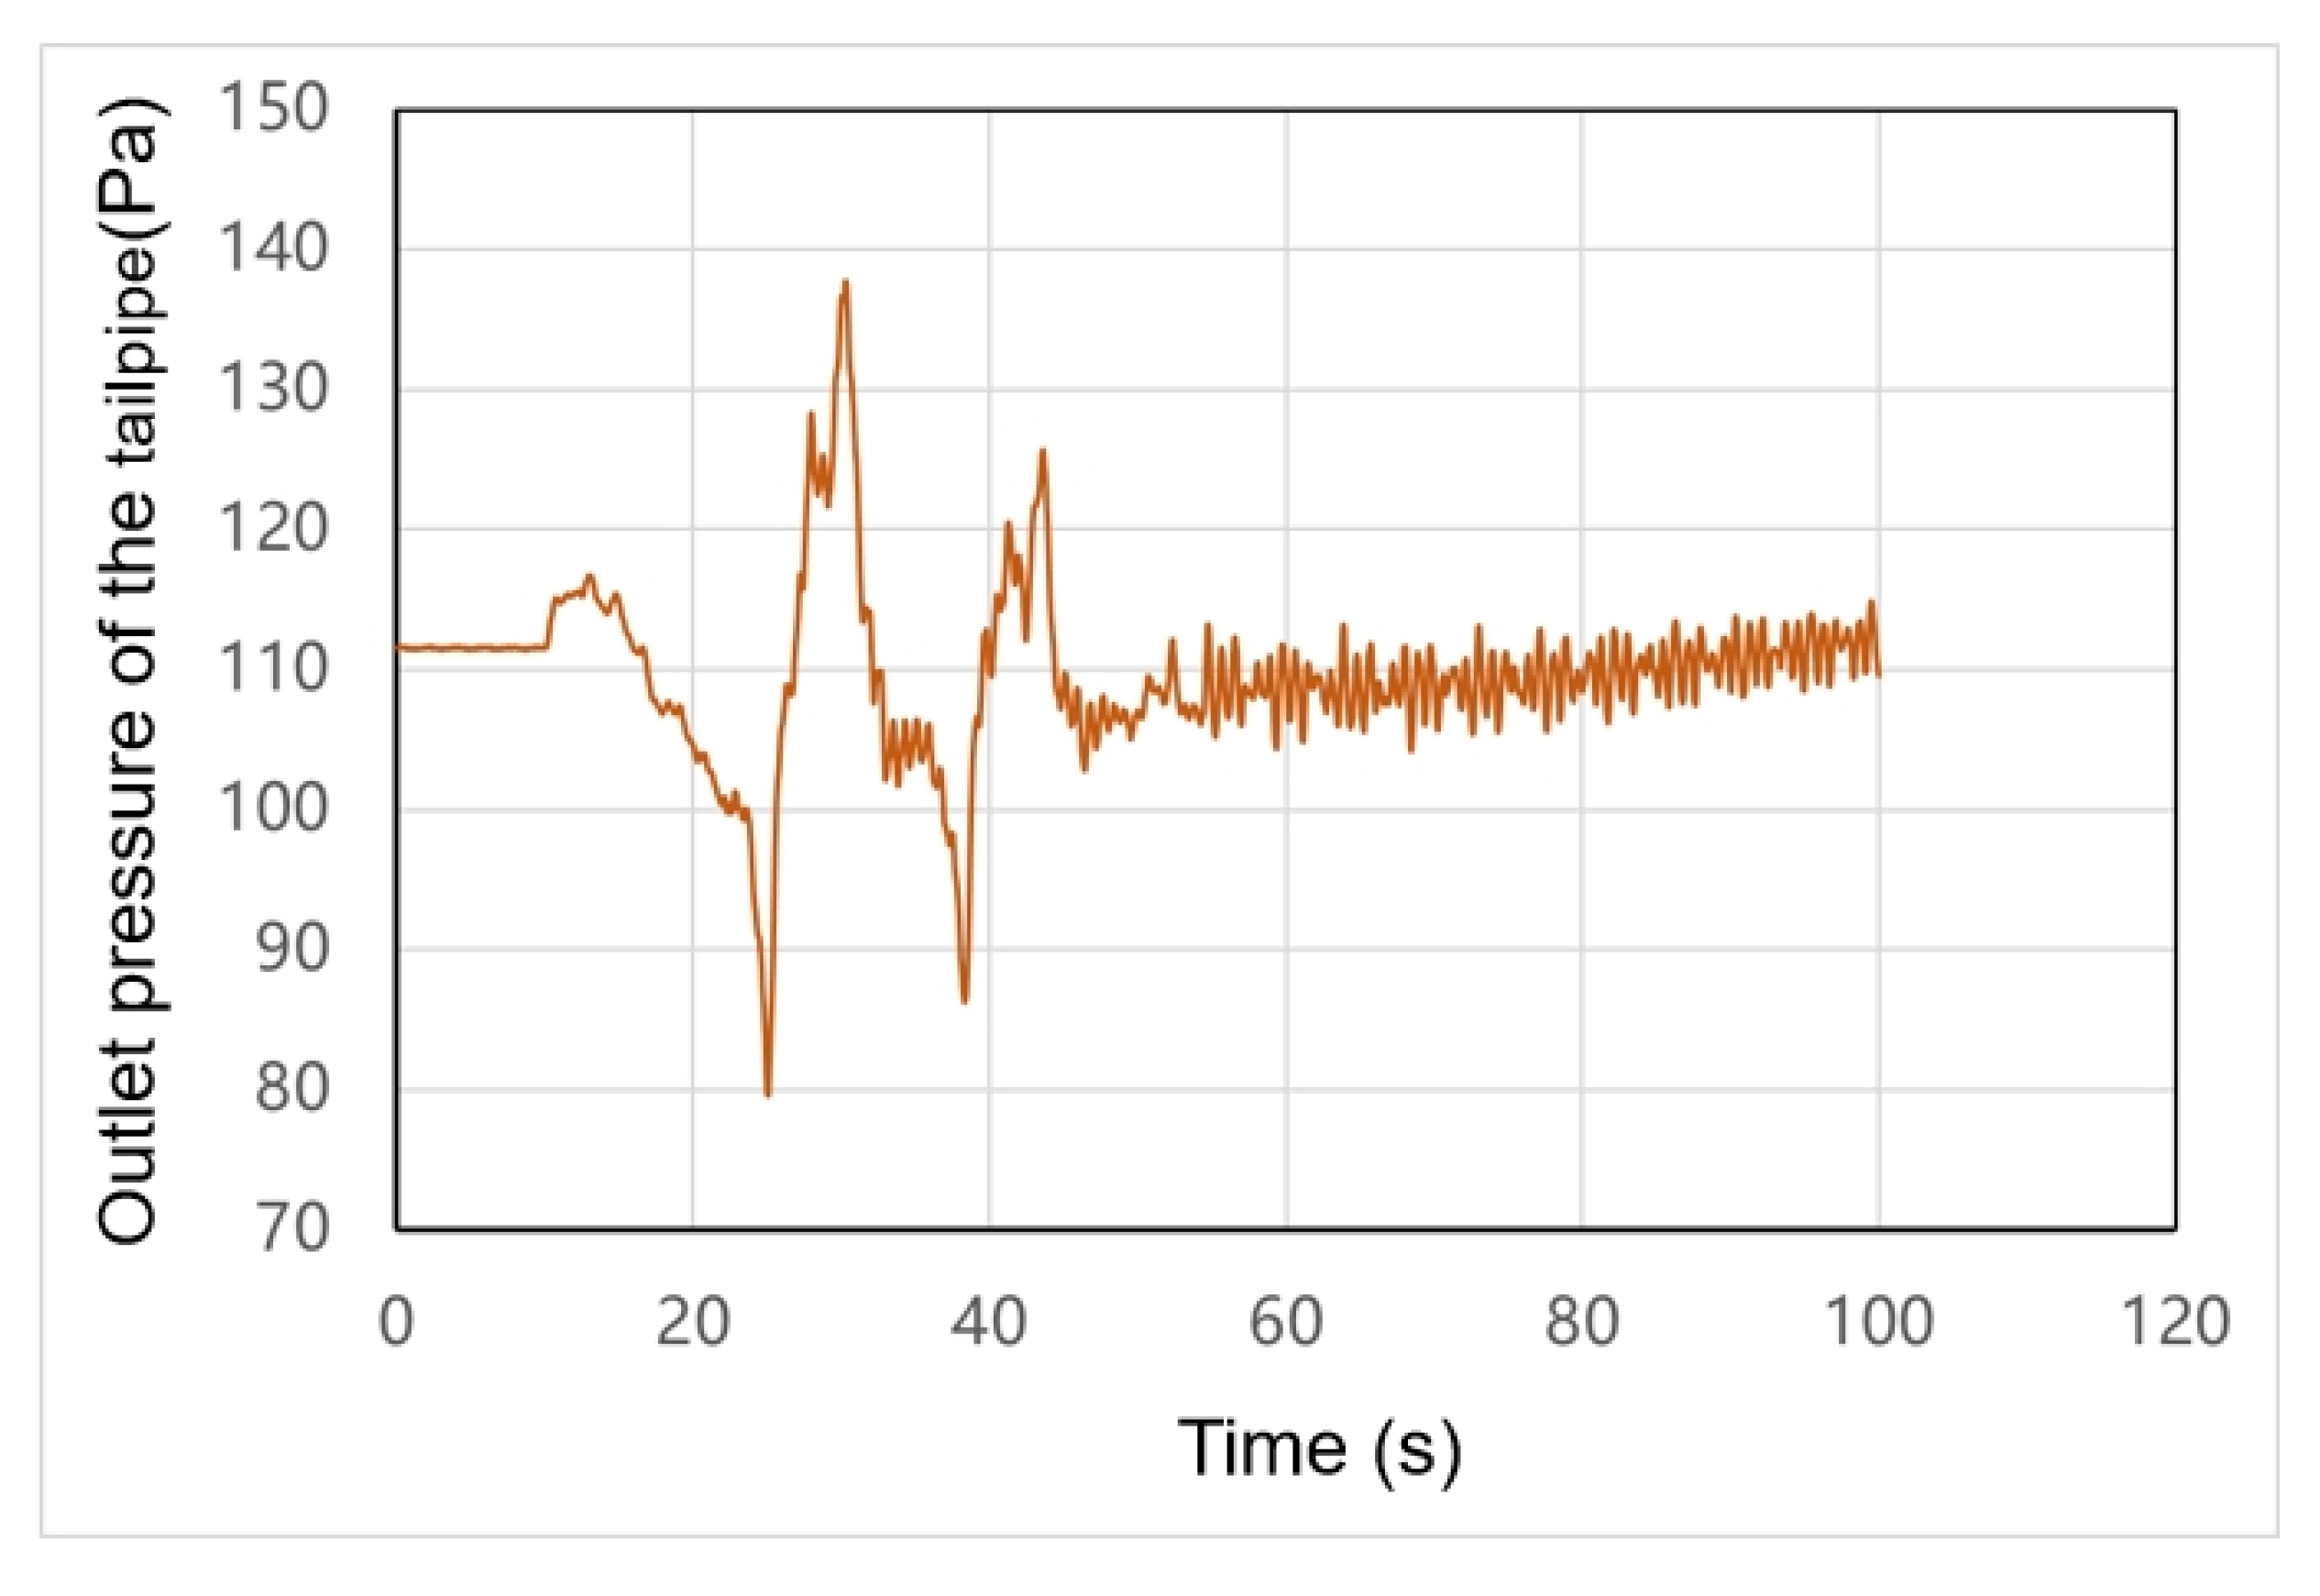
Pressure variation curve at the outlet of Unit 4’s tailwater pipe.
Figure 9.
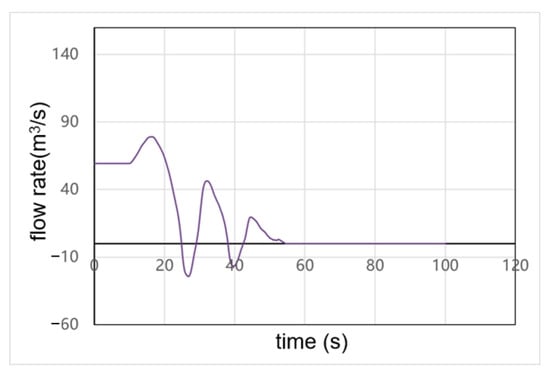
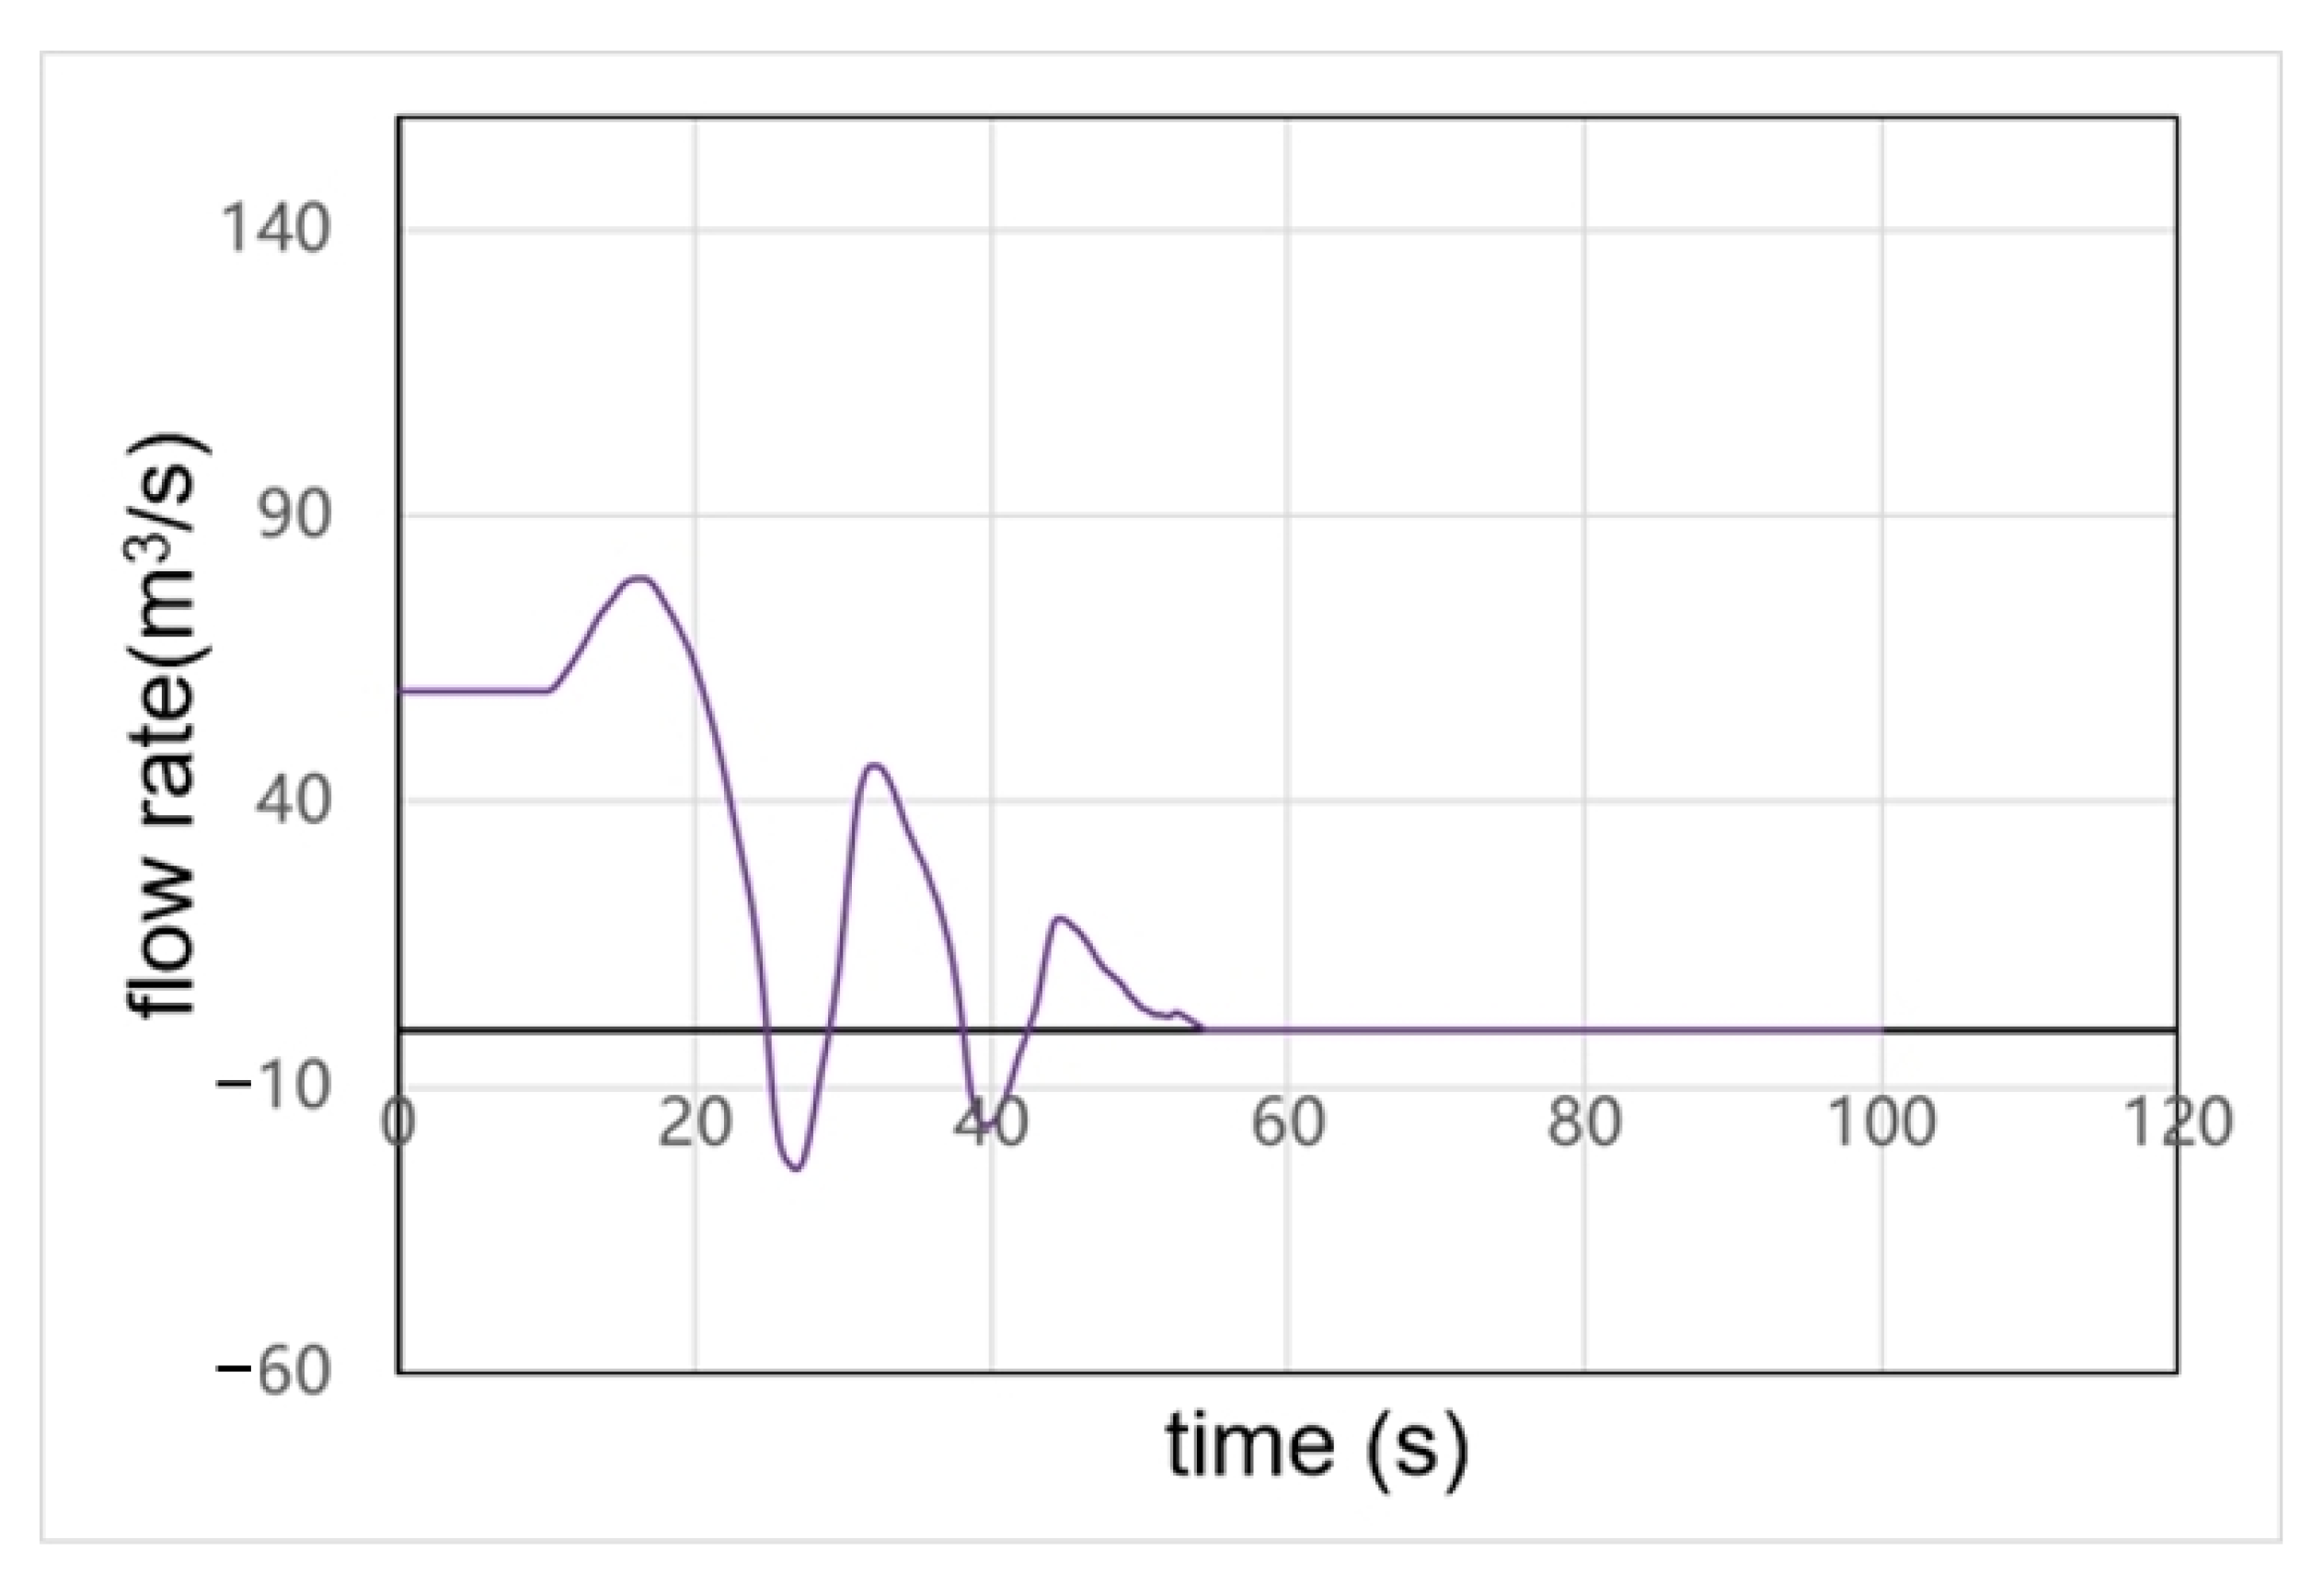
Flow variation curve for Unit 4.
Figure 10.
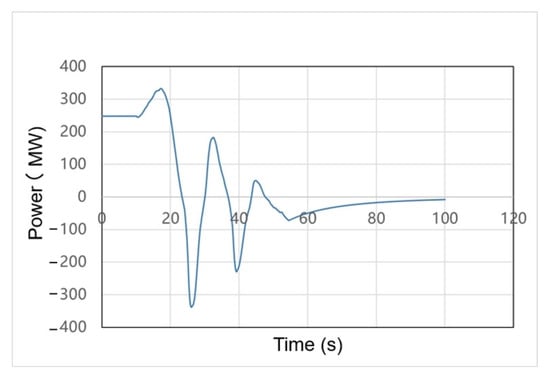
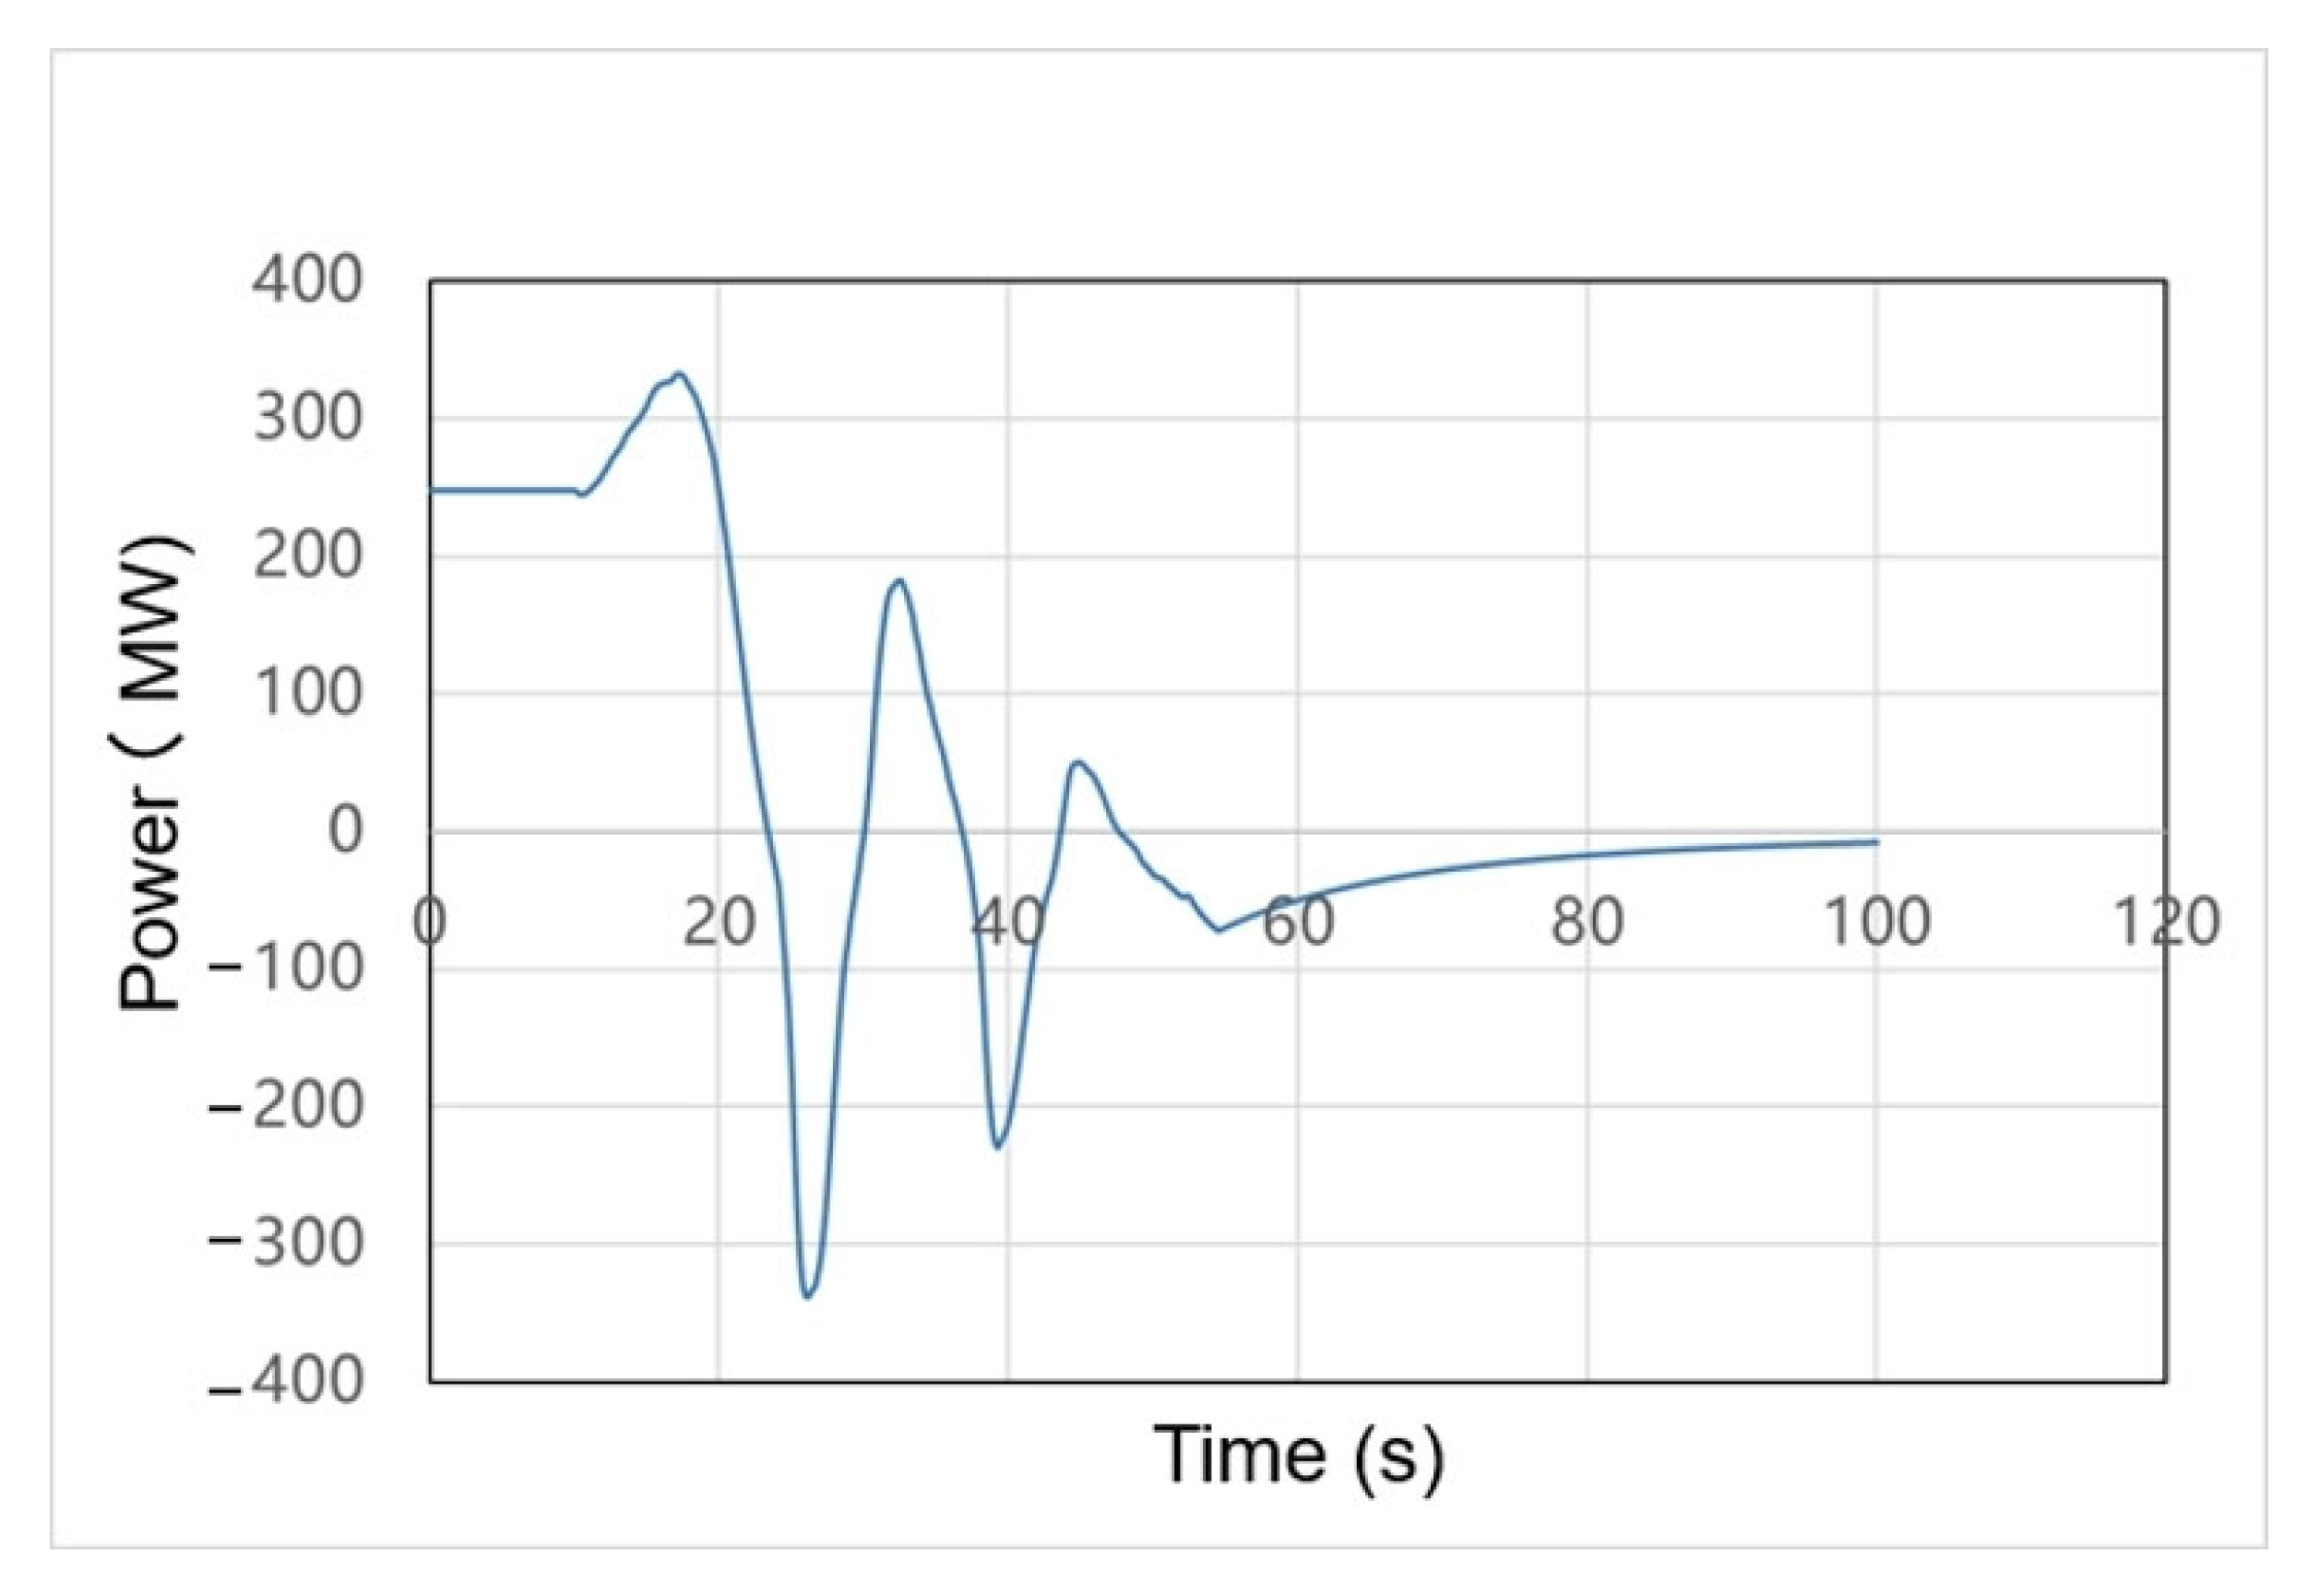
Output variation curve for Unit 4.
Figure 5 presents the volute inlet pressure fluctuation under a rapid load increase followed by sudden load shedding. The pressure, initially high, trends downward with slight mid-stage oscillation and then gradually stabilizes, ranging within approximately 420–670 (m). These fluctuations directly correspond to the abrupt load changes—a brief rise during the load increase, a sharp drop after shedding, and gradual stabilization—reflecting the hydraulic system’s dynamic response to drastic load variations.
Figure 6 shows the runner speed dynamics under the special operating condition, ranging from about 180 to 630 (r/min). Initially high, the speed fluctuates slightly during rapid load increase, then drops sharply upon sudden load shedding, oscillates, and slowly recovers and stabilizes. These variations are synchronized with the turbine power output: the abrupt power reduction during load shedding causes the sharp speed drop, and subsequent governing action restores the speed, reflecting the response of the speed governing system.
Figure 7 shows the guide vane opening variation over time, ranging roughly from −1.20° to 23.80°. Starting at a moderate opening, it rises slightly during rapid load increase to boost output. Upon sudden load shedding, it drops sharply, briefly goes negative, then gradually recovers to a stable range. The opening accurately tracks load demand; the negative value reflects rapid guide vane closure during load rejection, a key control method for handling abrupt load changes.
Figure 8 shows the tailwater pipe outlet pressure, ranging roughly from 70 to 150 m. The pressure is initially stable, dips slightly mid-stage, then rises with fluctuations and stabilizes. Rapid load increases cause a slight pressure drop due to flow velocity changes; sudden load shedding triggers brief fluctuations that subside as operation stabilizes, illustrating the correlation between tailwater pressure and operating conditions.
Figure 9 shows the dynamic flow rate changes under the operating condition: it rises rapidly during load increase to meet power demands, then drops sharply and oscillates at a low level after sudden load shedding before slowly stabilizing. These flow changes synchronize closely with guide vane opening and load demands, and the sharp fluctuations reflect the rapid response of the unit’s flow passage system under extreme conditions.
Figure 10 shows the unit output power, ranging roughly from −400 to 400 MW. It rises rapidly to meet a sudden load increase, then plummets sharply to a brief negative value (reverse power) after load shedding, before gradually recovering and stabilizing. This drastic swing captures the extreme “rapid load increase + sudden load shedding” condition.
3.2. Spatial and Temporal Distribution of Stress and Strain in the Runner
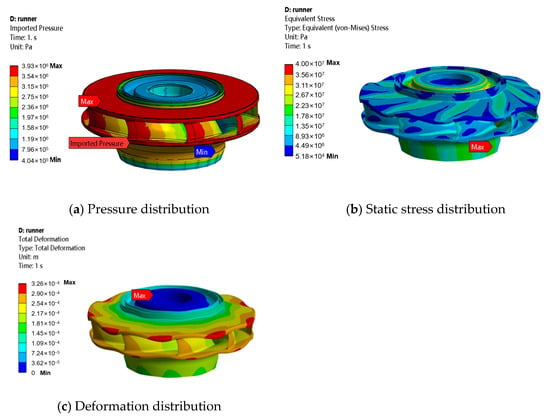
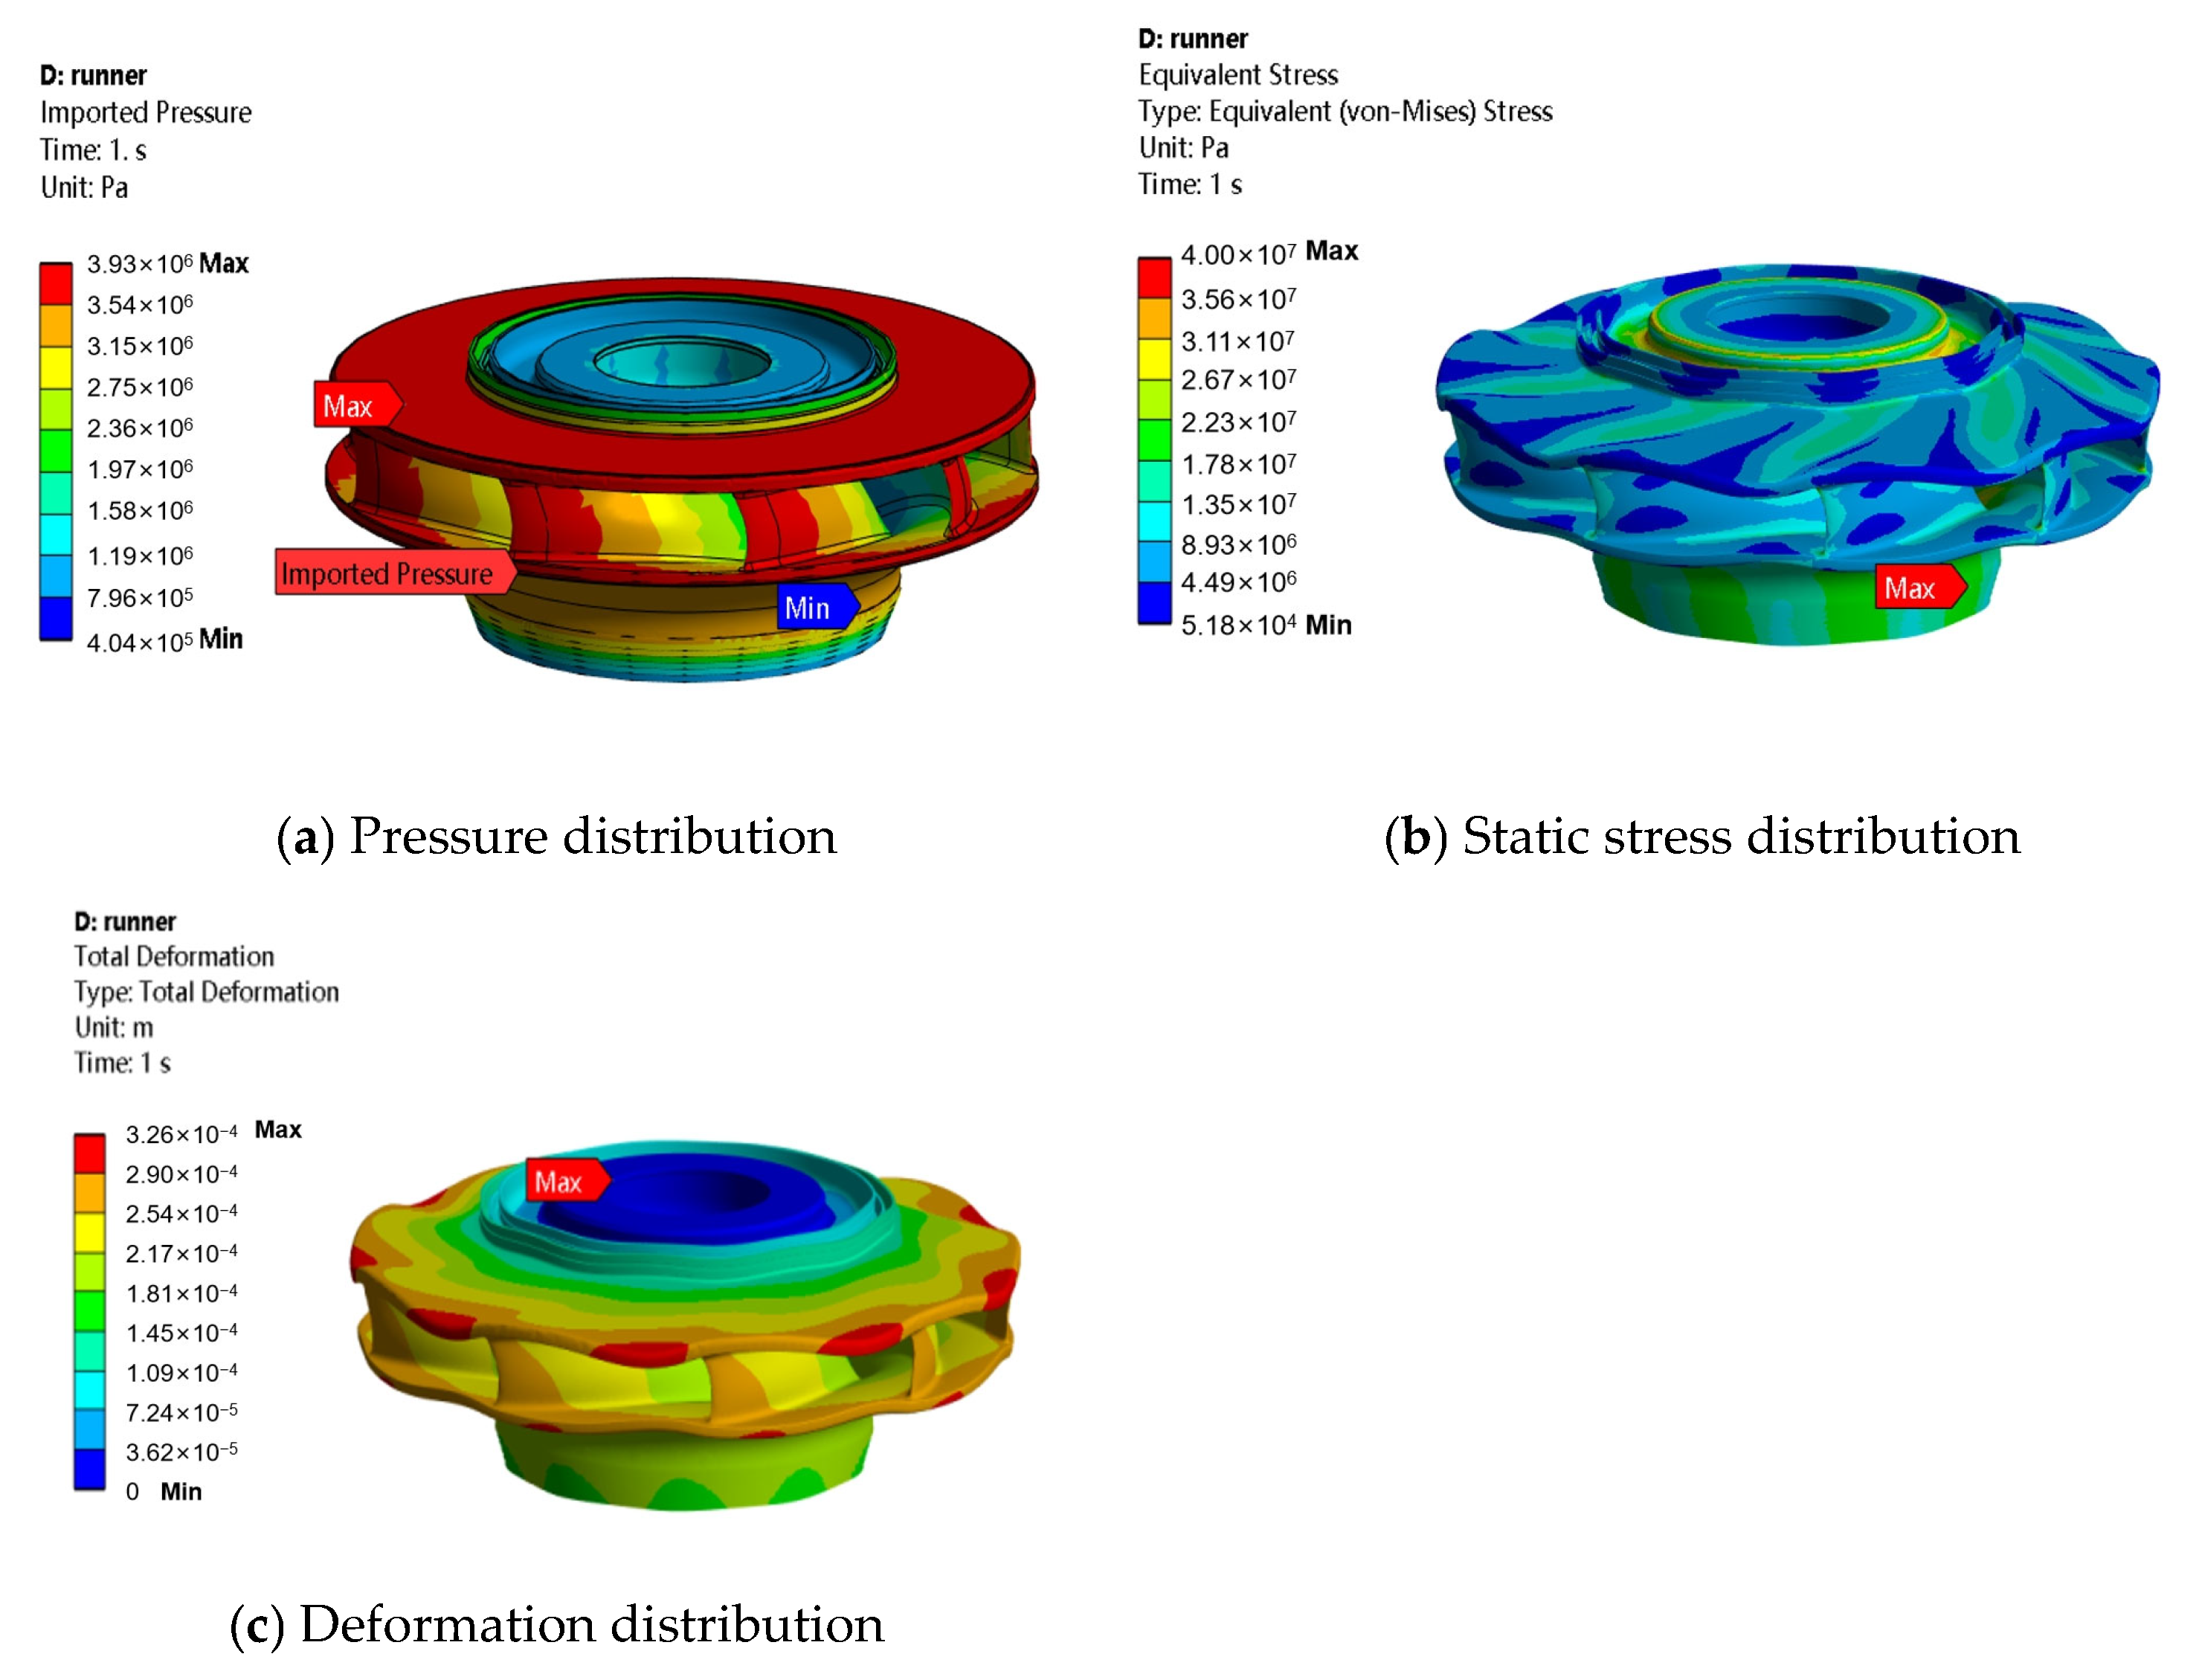
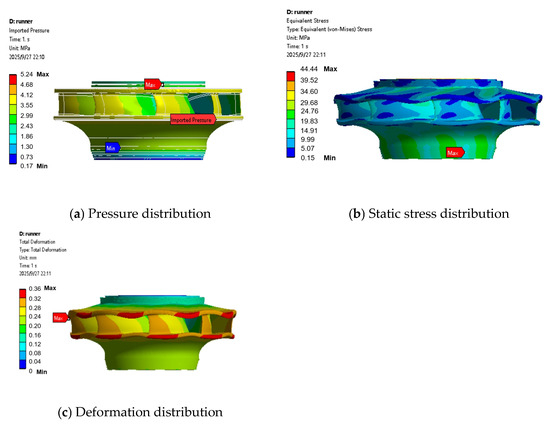
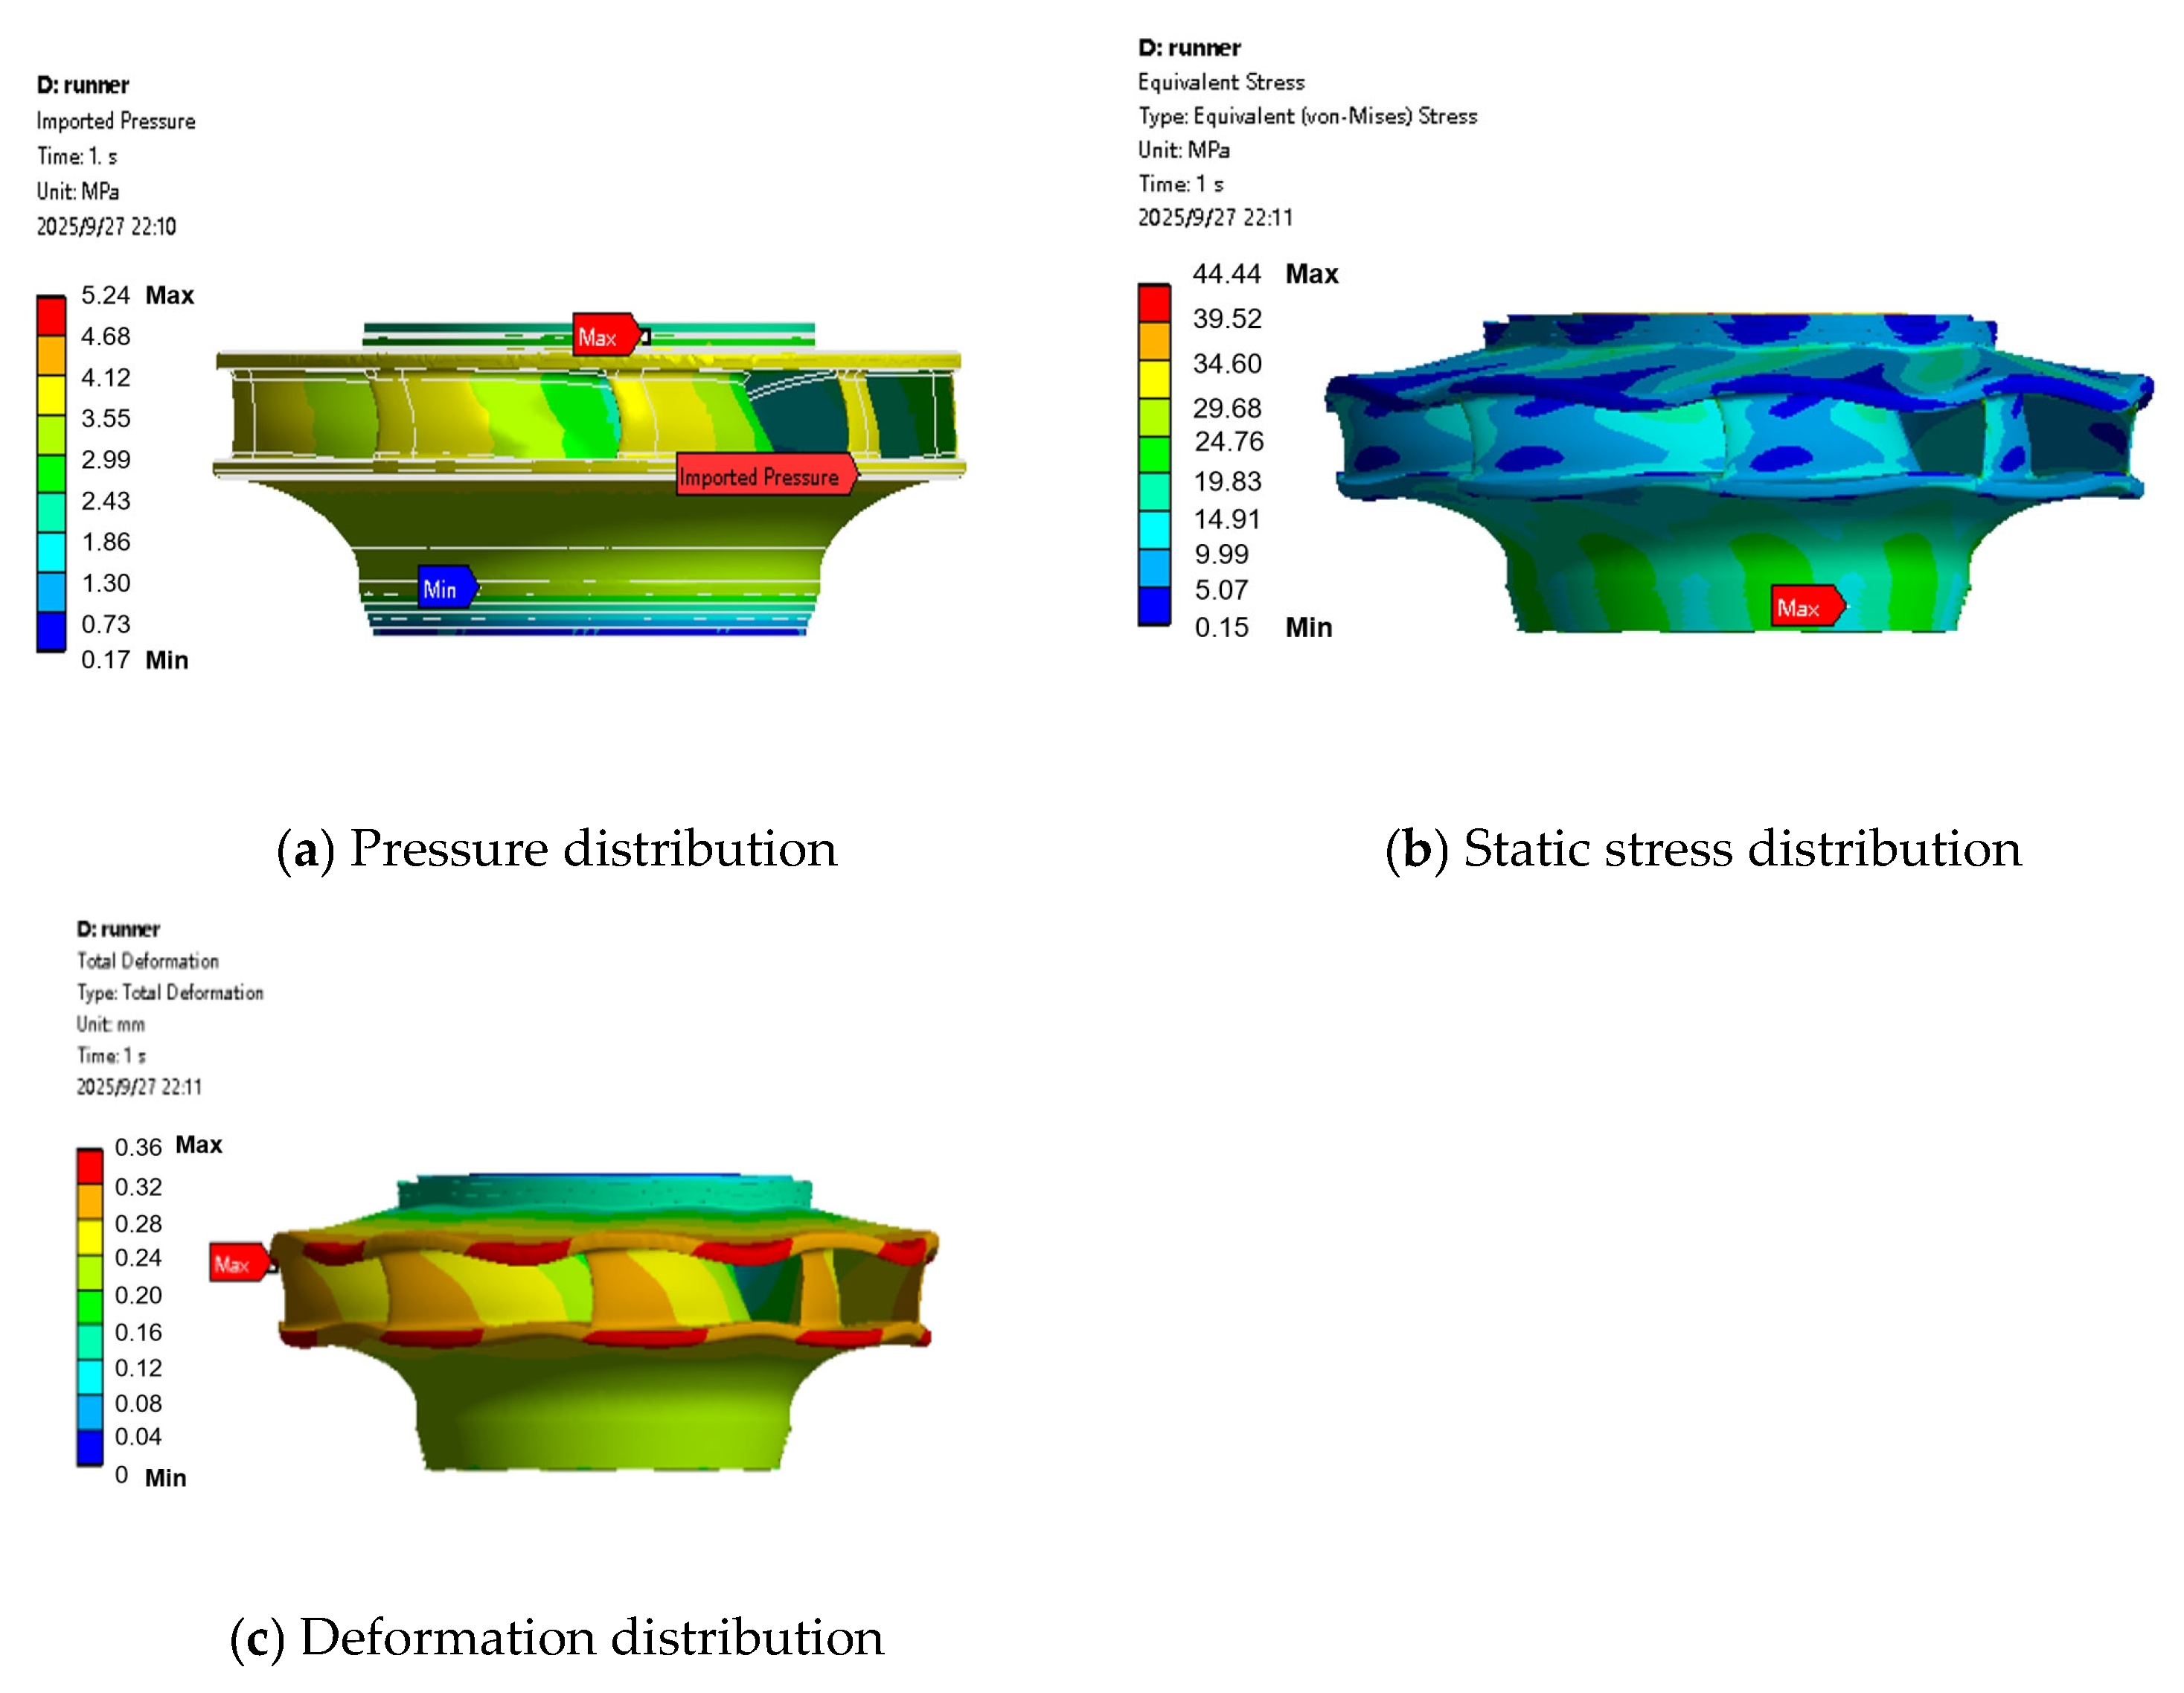
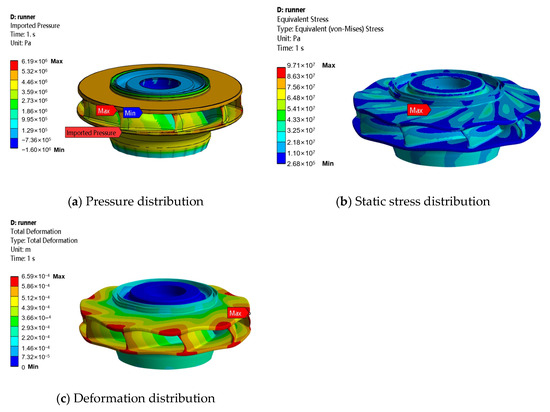
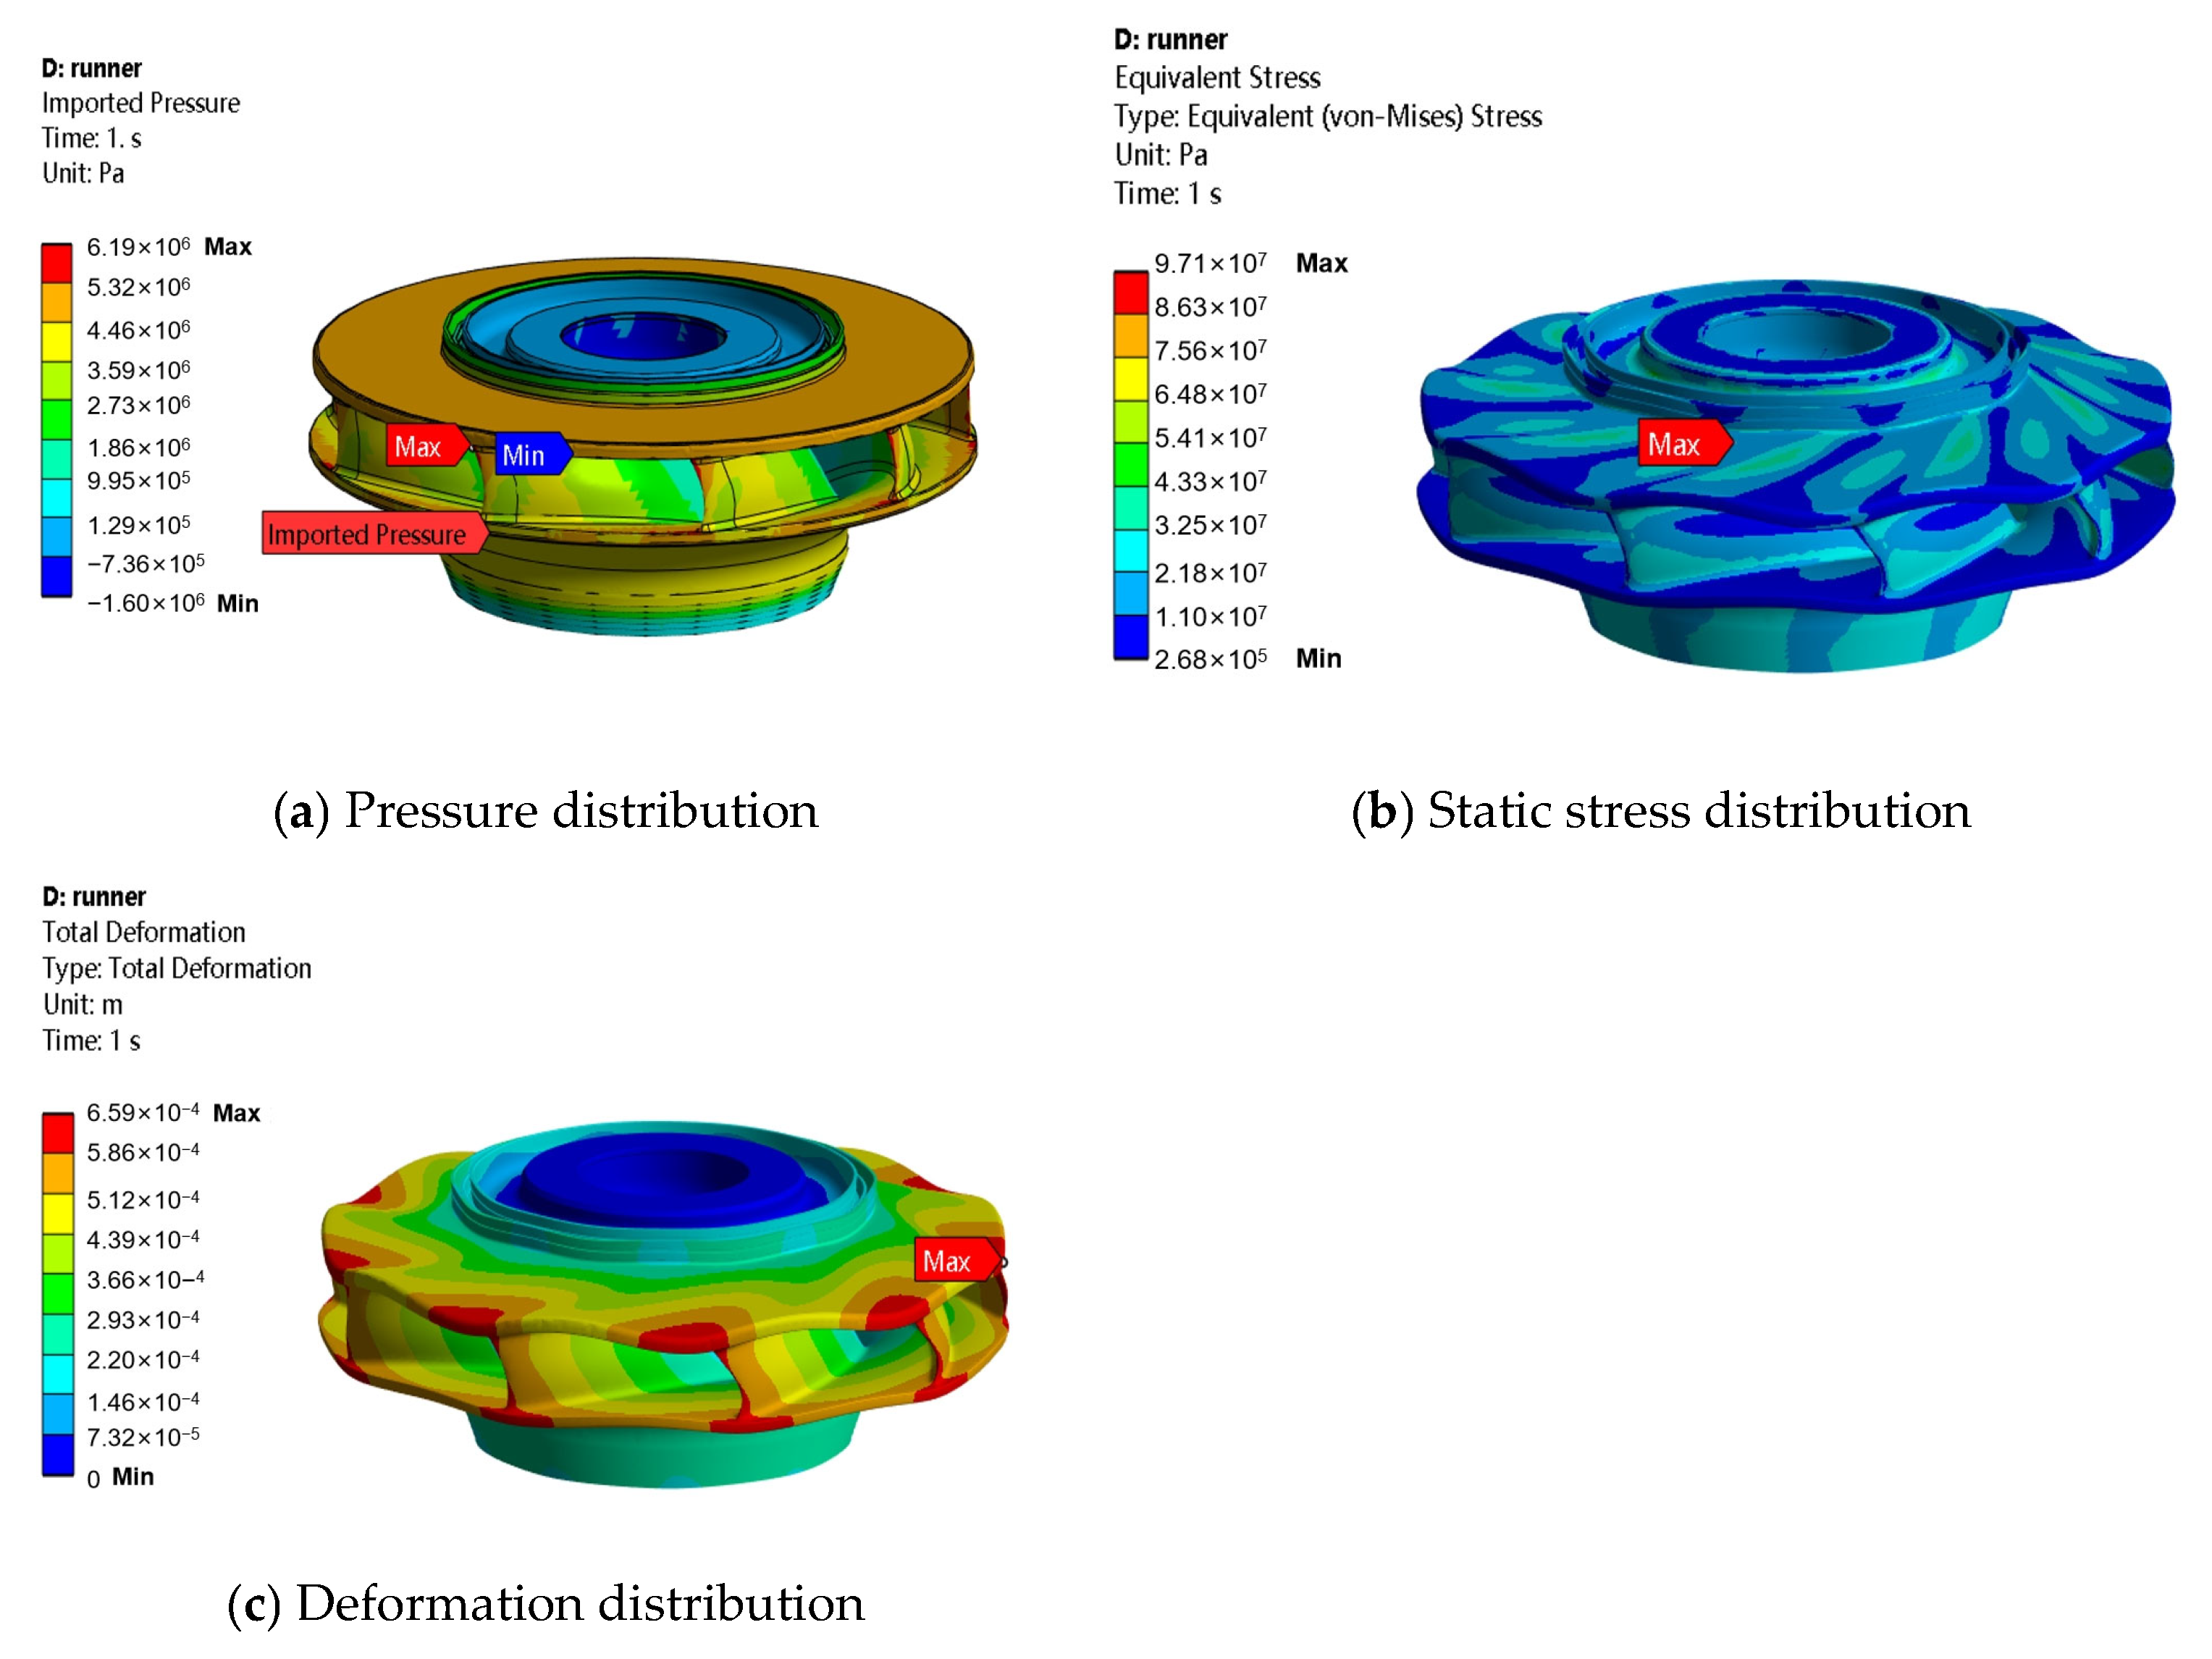
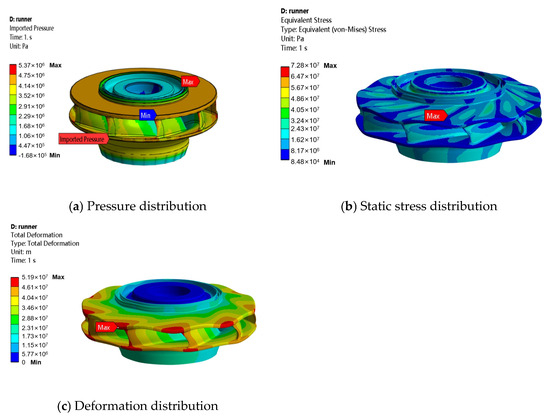
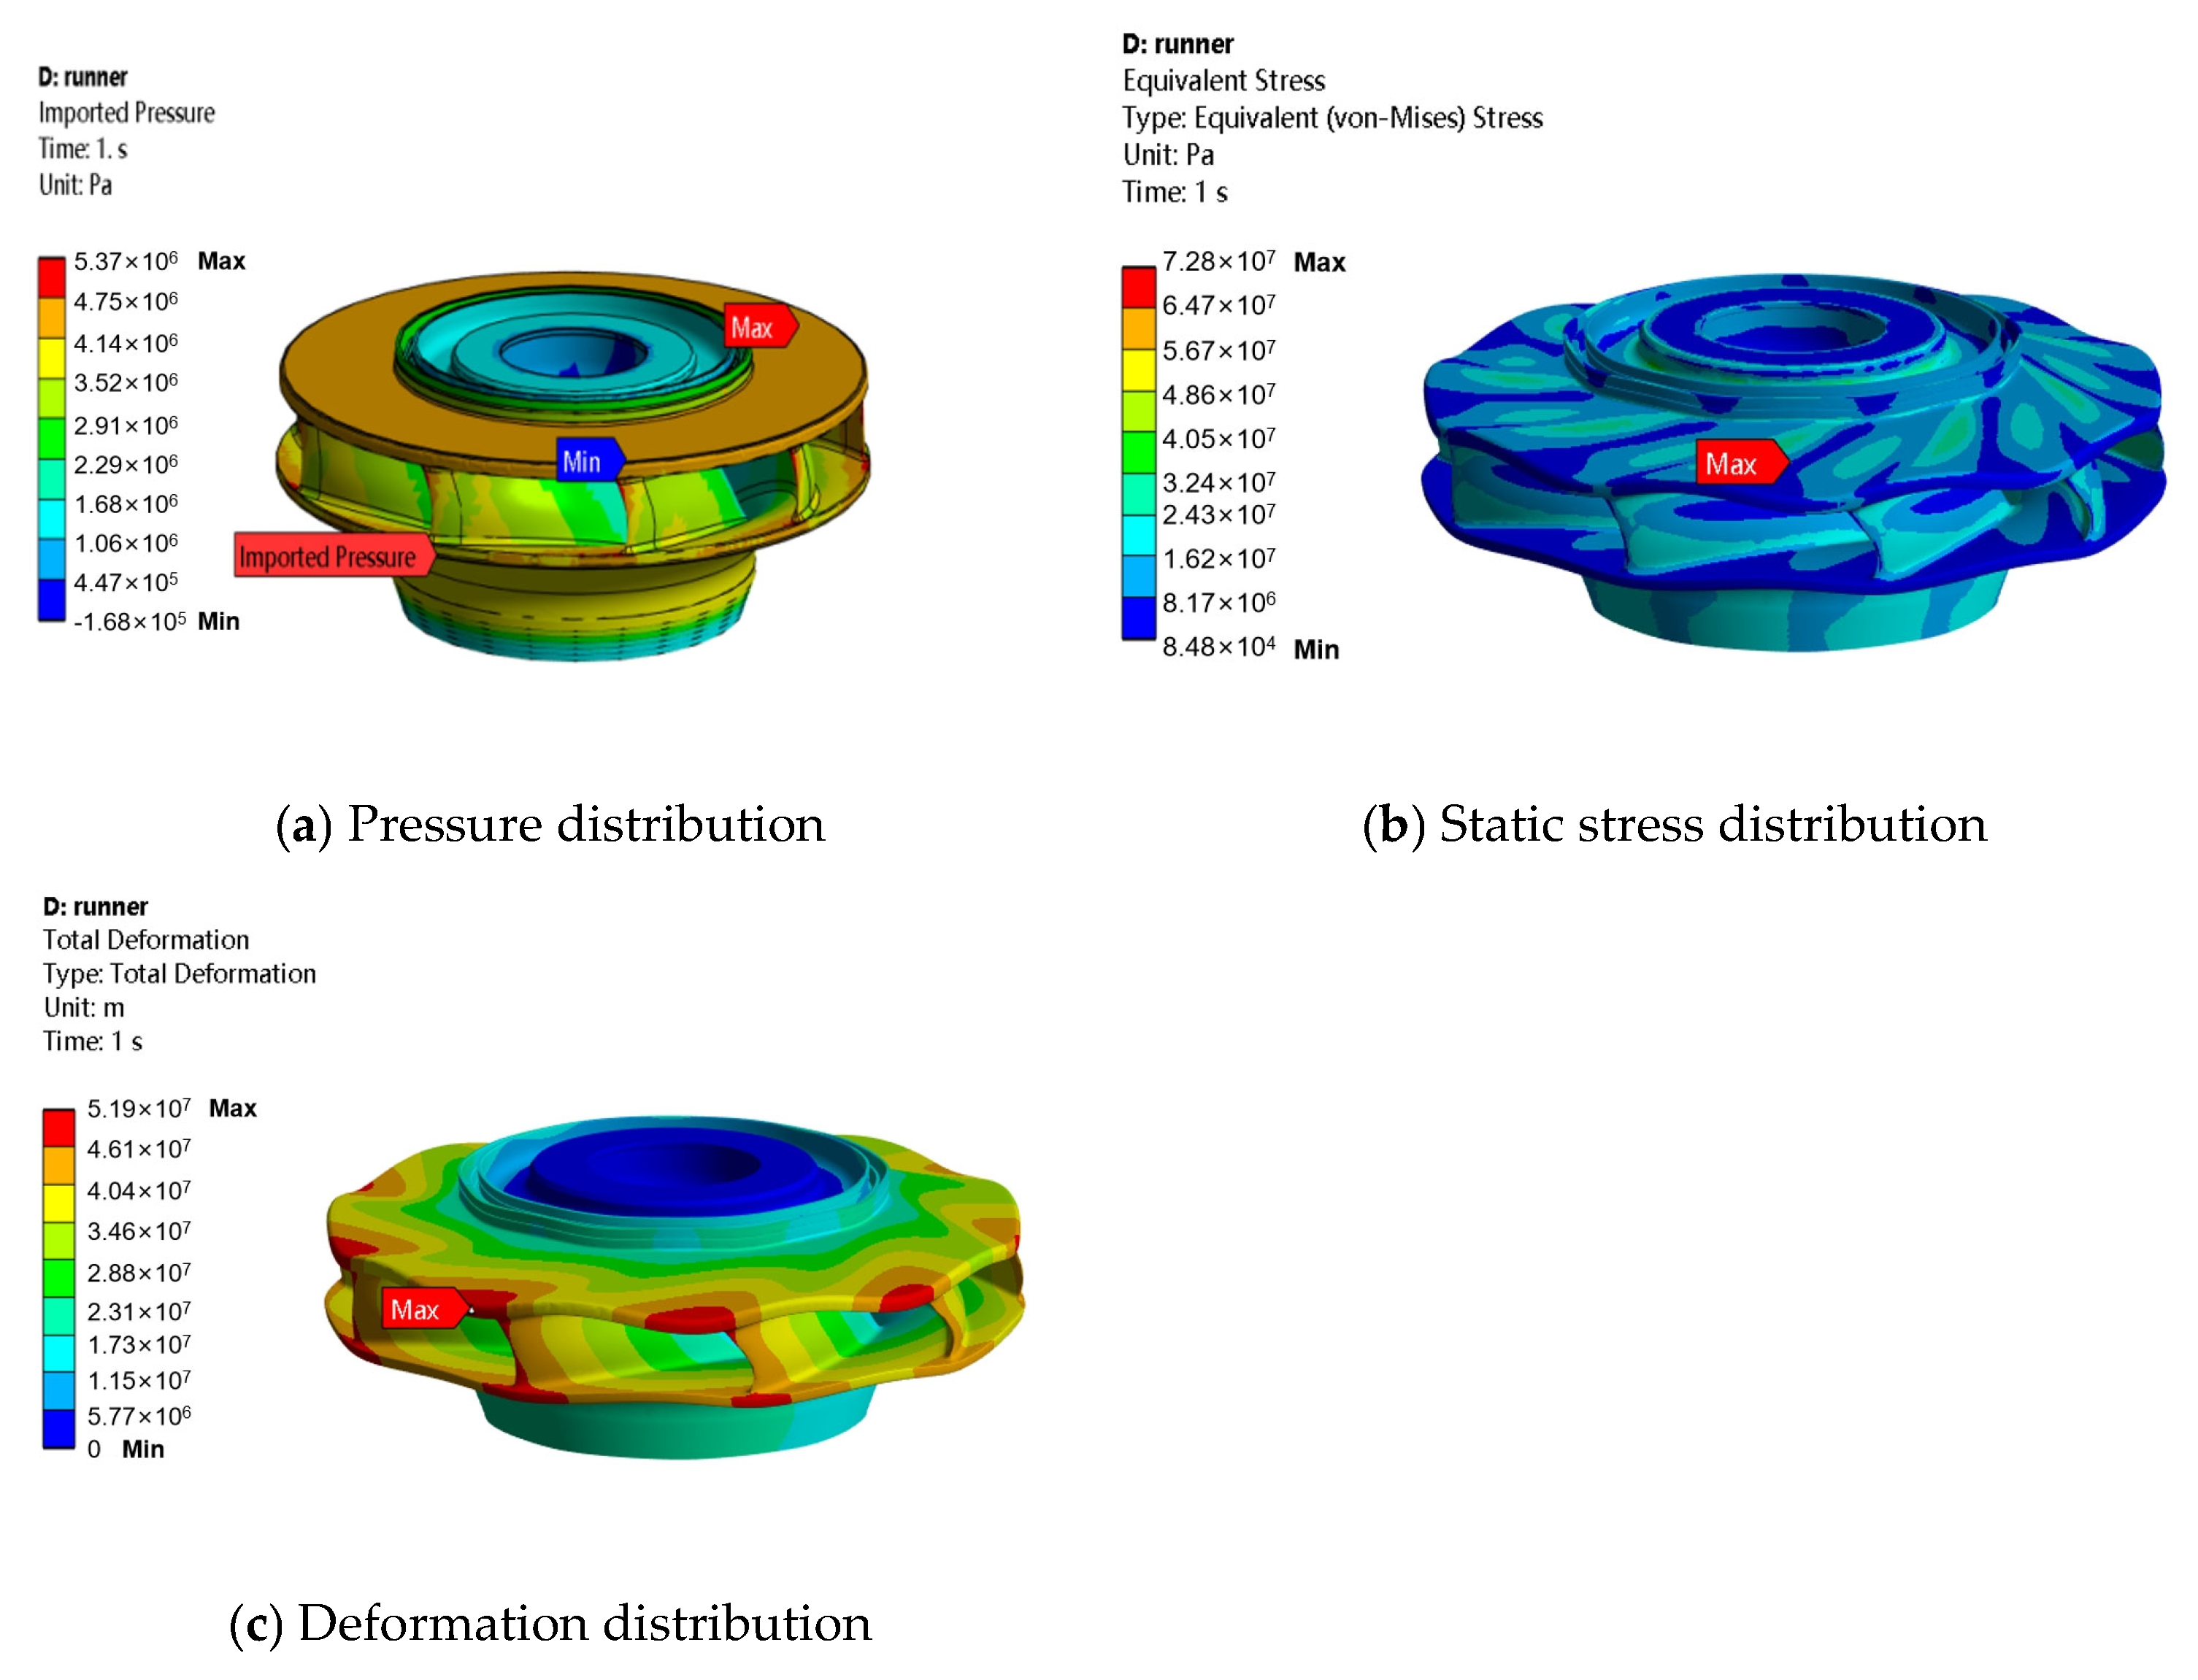
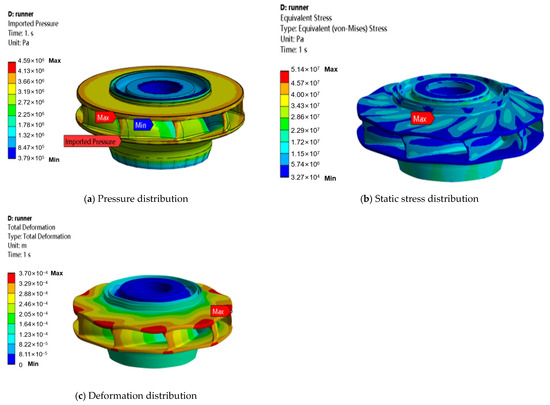
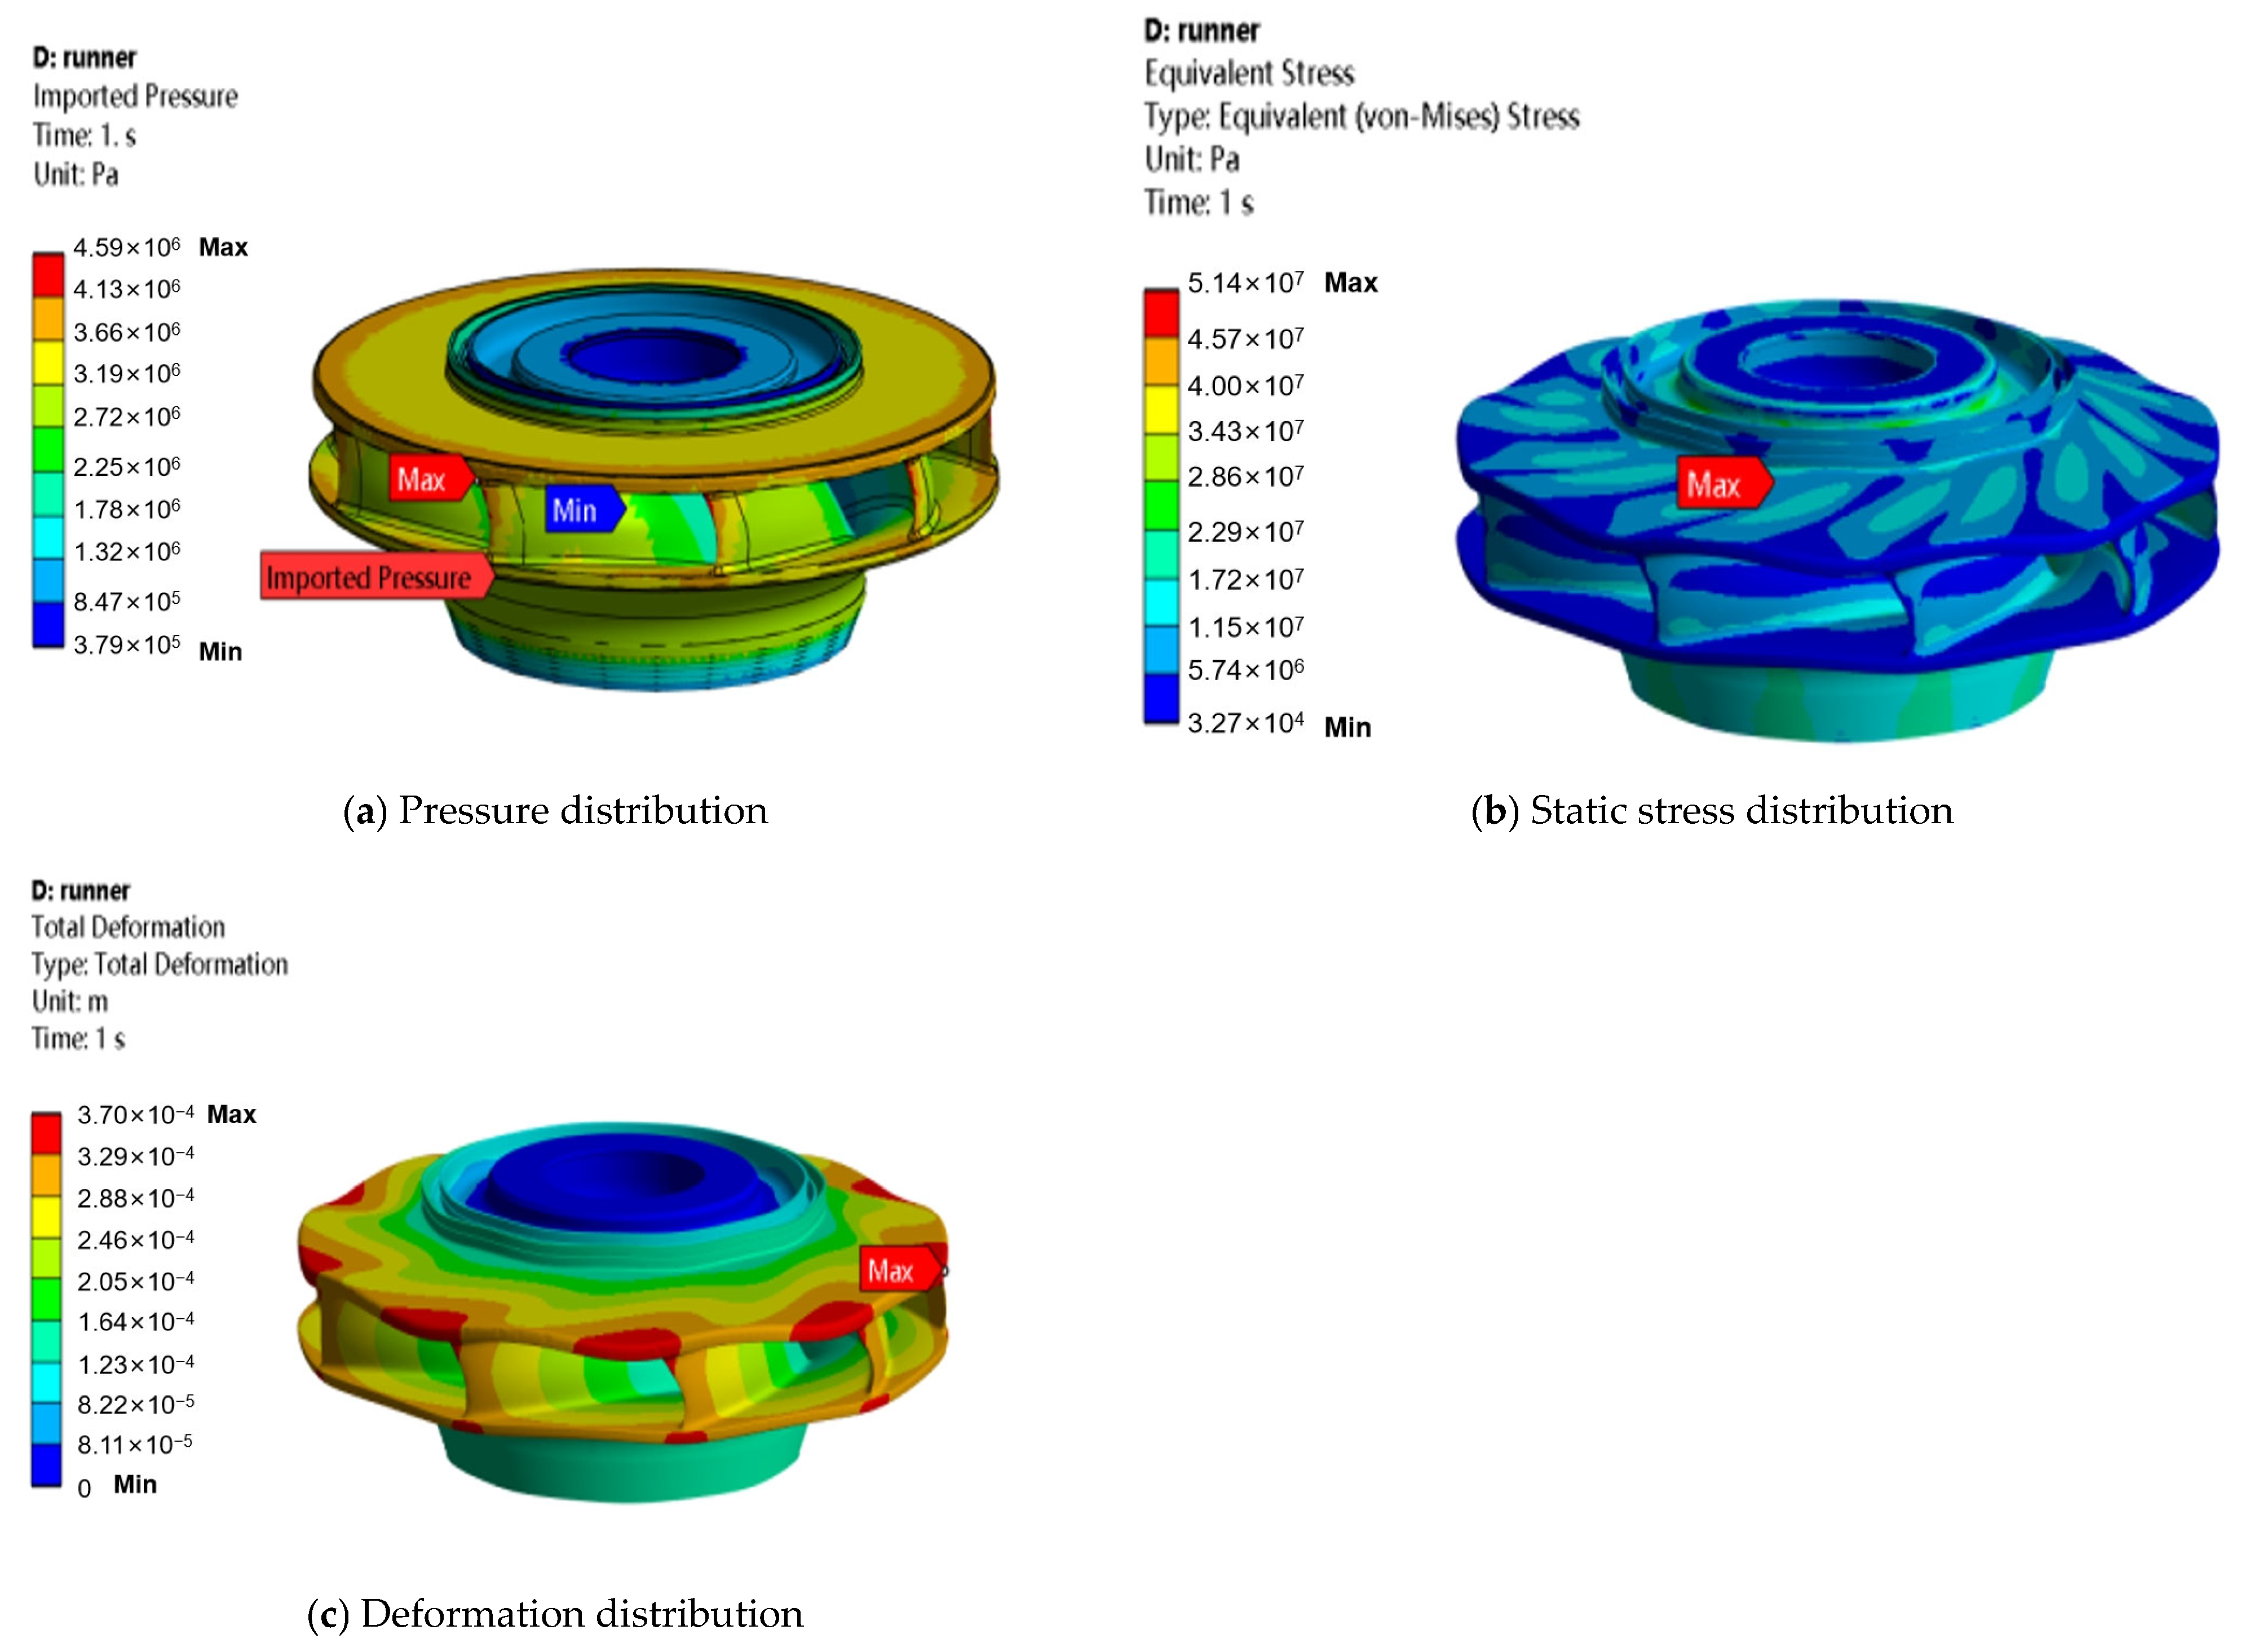
Figure 11, Figure 12, Figure 13, Figure 14 and Figure 15 show the contour map of equivalent stress distribution in the runner. At all calculation times, the maximum equivalent stress in the runner is consistently located at the root of the connection between the blade and the upper crown. This region represents a point of abrupt geometric change, where significant stress concentration occurs, making it a high-risk area for vibration-induced fatigue failure.
Figure 11.
Stress calculation results for the runner at 12.472 s.
Figure 12.
Stress calculation results for the runner at 16.188 s.
Figure 13.
Stress calculation results for the runner at 24.0 s.
Figure 14.
Stress calculation results for the runner at 40.0 s.
Figure 15.
Stress calculation results for the runner at 44.48 s.
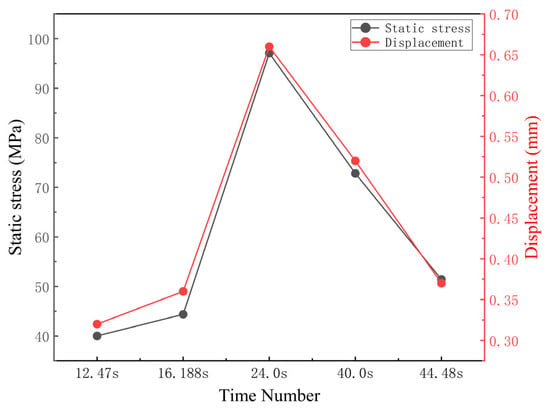
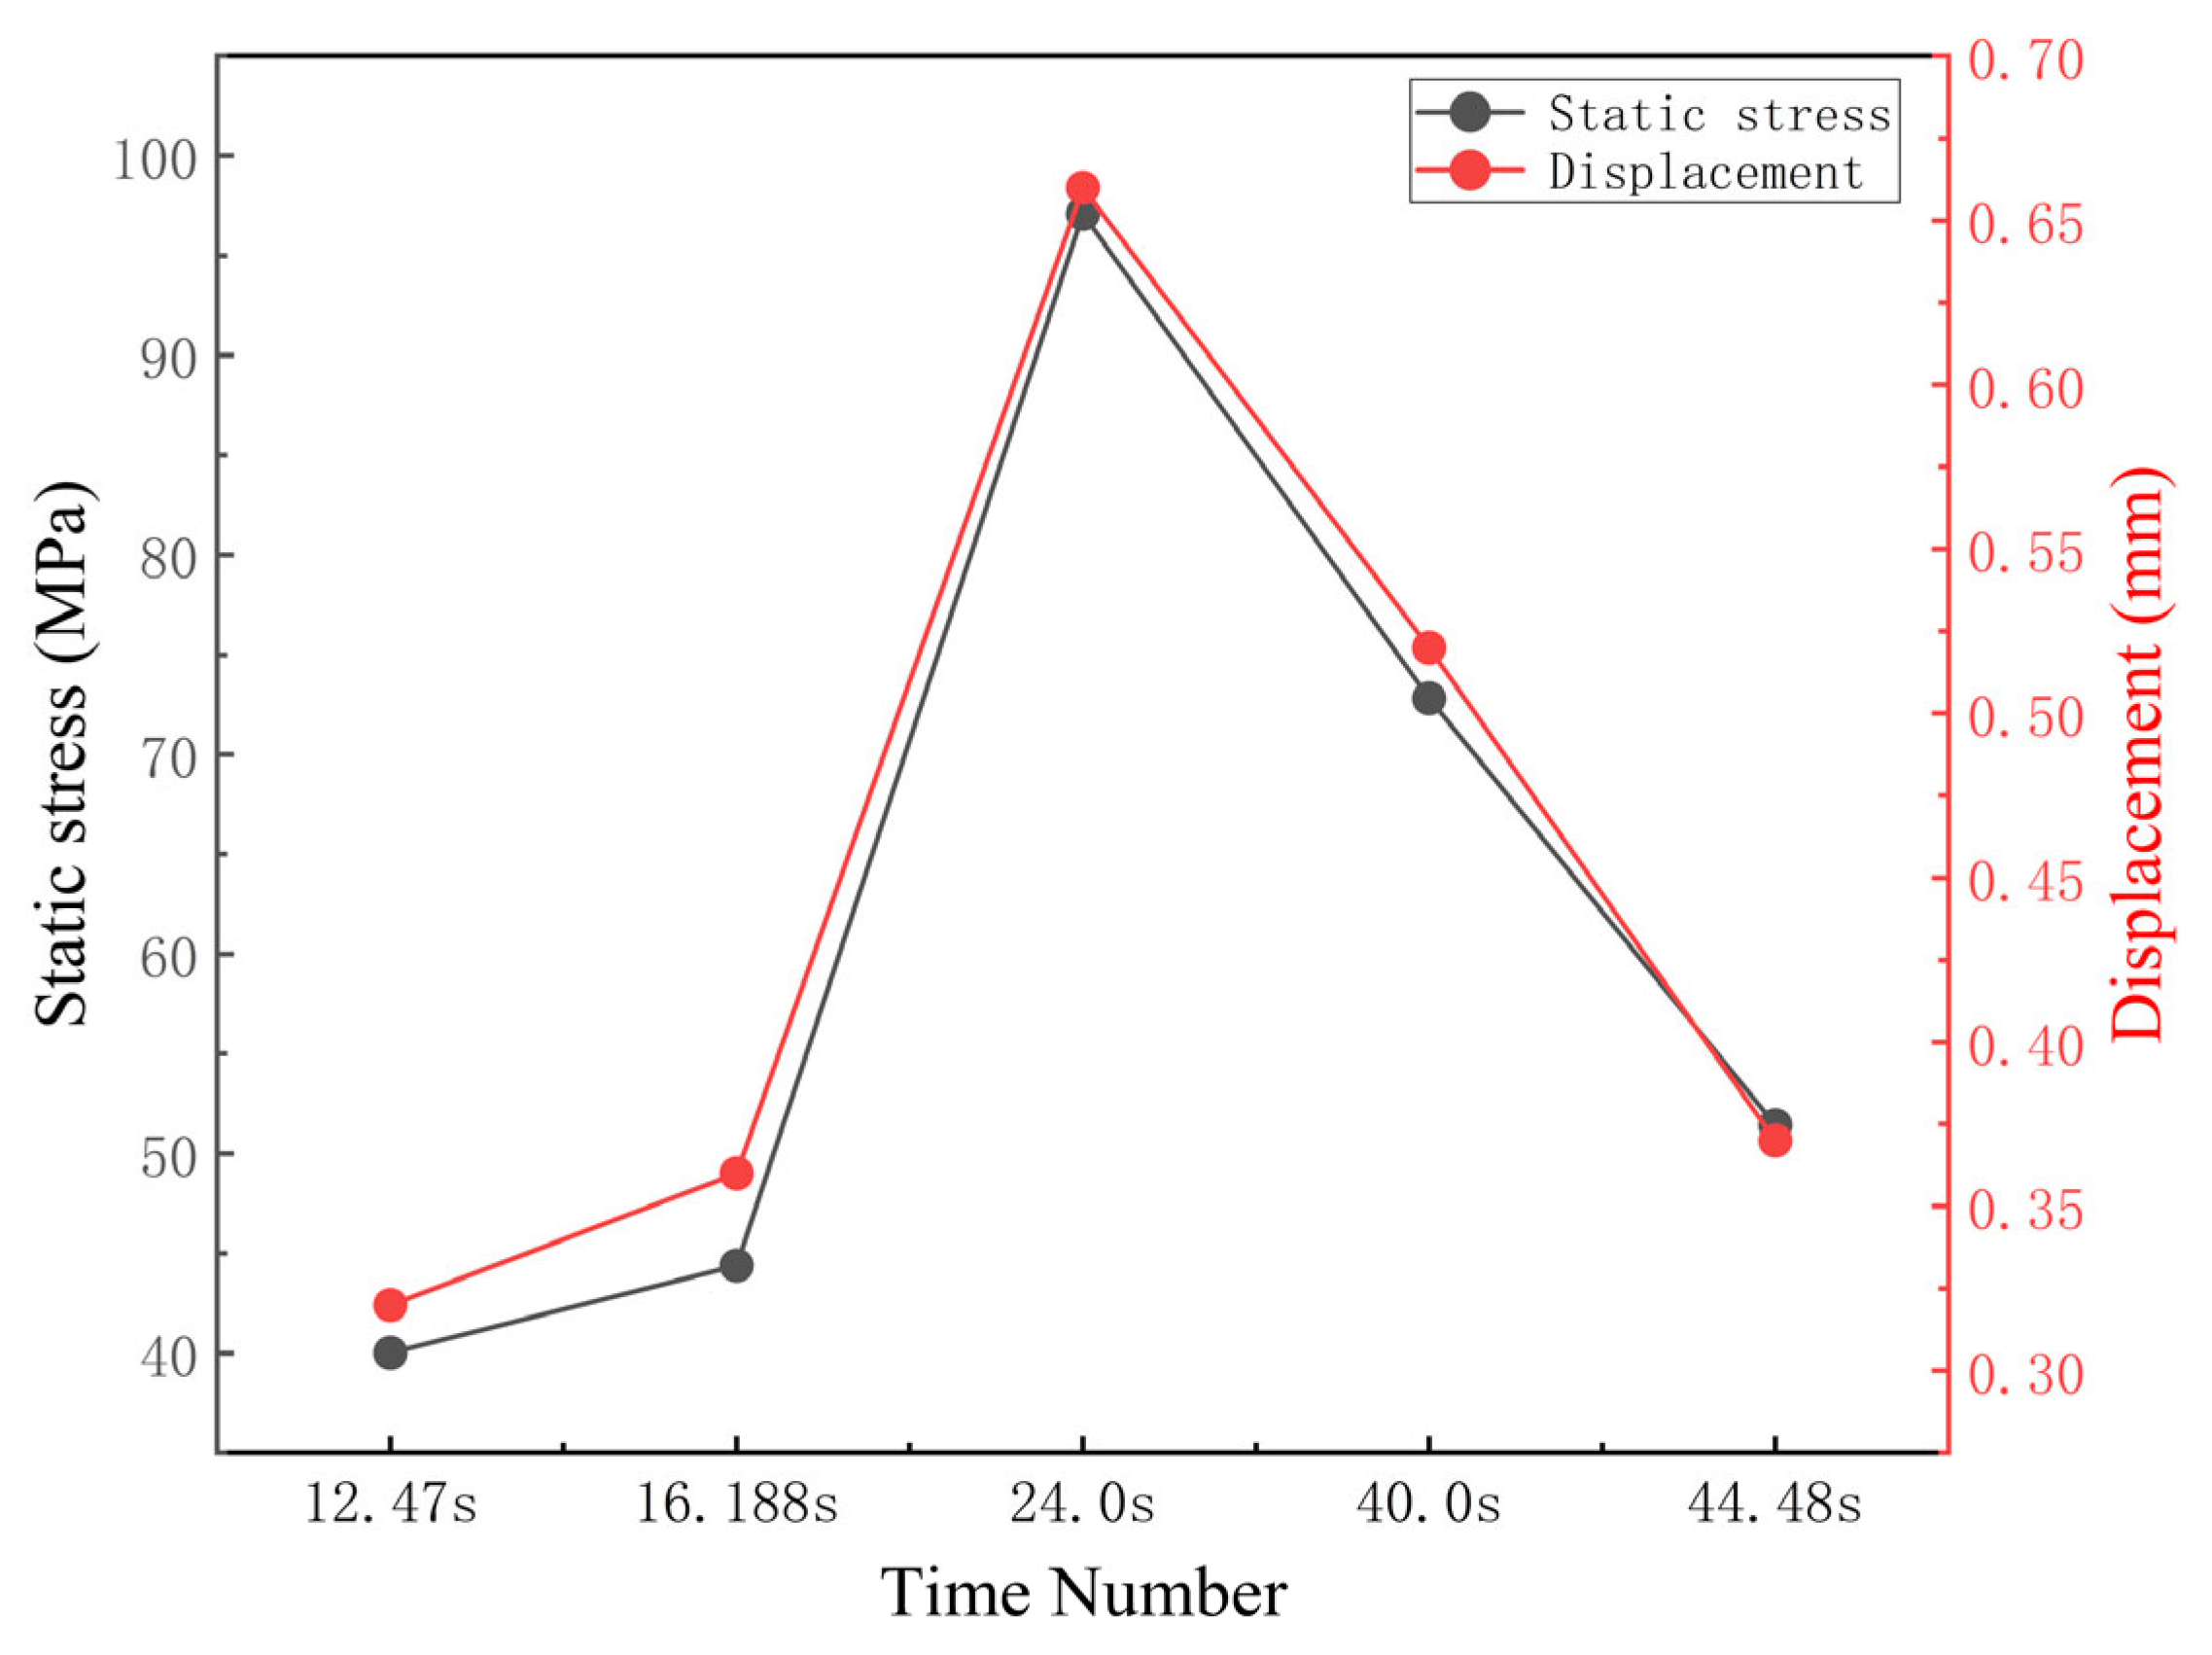
During the load-shedding transient, the maximum equivalent stress in the rotor consistently occurs at the root of the connection between the blade and the upper crown—a region of geometric discontinuity—indicating significant stress concentration at this location, which is a high-risk area for vibration-induced fatigue failure. From 12.472 s to 24.0 s, the maximum equivalent stress rose rapidly from 40.01 MPa to 97.09 MPa, an increase of approximately 2.4 times, whilst the maximum deformation increased from 0.32 mm to 0.66 mm. Subsequently, as the guide vanes closed and the flow rate decreased, although the stress and deformation declined, secondary peaks of 72.82 MPa and 51.43 MPa were still observed at 40.0 s and 44.48 s, respectively. Throughout the entire process, both the peak stress and deformation occurred at 24.0 s, when the rotational speed reached its maximum, indicating that the combined effect of centrifugal force and hydrostatic pressure dominated the structural response under extreme transient conditions.
The peak stress and deformation values are summarized in Figure 16. The maximum equivalent stress of 97.09 MPa and the maximum deformation displacement of 0.66 mm in the runner both occur at the moment when the rotational speed reaches its peak (24.0 s). At this point, the unit’s kinetic energy is at its maximum, as is the centrifugal force, whilst the high water pressure within the volute also reaches its peak. These results indicate that, during the load shedding process, the combined effect of centrifugal force and hydrostatic pressure is the dominant factor causing the structural stress to reach its peak.
Figure 16.
Summary of the dynamic characteristics of the RT5 operating conditions.
The dynamic stress variation characteristics are illustrated in Figure 16. Between 12.472 s and 24.0 s, the stress in the runner rises rapidly from 40.01 MPa to 97.09 MPa, an increase of approximately 2.4 times; the deformation also increases from 0.32 mm to 0.66 mm. Subsequently, as the guide vanes close and the flow rate decreases, although the stress and deformation decline somewhat, secondary peaks occur at 40.0 s and 44.48 s (72.82 MPa and 51.43 MPa, respectively), which reflects the repeated oscillation and dissipation of energy within the system following the centrifugal load.
4. Conclusions
This paper investigates a specific variable-speed pumped-storage unit (Unit 4 at Zhaoqing Power Station). Using a three-dimensional fluid–structure interaction numerical simulation method, it systematically analyzes the runner vibration characteristics under the extreme transient operating condition of power-priority, energy accumulation point, and load shedding (RT-5). After comprehensively examining the unit’s external characteristic responses, the spatiotemporal distribution of runner stress and deformation, and the underlying vibration excitation mechanisms, the main conclusions are as follows:
- (1)
- The RT-5 condition represents a severe transient scenario characterized by extreme dynamic parameters and substantial structural hazards. It emulates a power-priority operation with load shedding at the energy accumulation point: prior to shedding, the unit operates at maximum energy reserve under high head and high flow. Post-shedding, water inertia accelerates the rotational speed from 388.08 rpm to 564.47 rpm within approximately 12 s, greatly exceeding the rated speed of 428.6 rpm, while the volute inlet pressure surges from 5.16 MPa to 5.85 MPa. These dual extreme loads impose unprecedented dynamic forces on the runner, demonstrating that RT-5 should be incorporated as a mandatory verification case for structural safety assessment and control system optimization of variable-speed pumped-storage units.
- (2)
- Stress and deformation responses under RT-5 exhibit distinct temporal and spatial characteristics governed by combined centrifugal and hydrostatic loading. The maximum equivalent stress (97.09 MPa) and maximum deformation (0.66 mm) both occur at the peak speed moment (24.0 s), with stress consistently concentrated at the blade–crown connection root. Although the peak stress of 97.09 MPa remains below the material yield strength (265 MPa), it undergoes drastic fluctuations, rising from 40.01 MPa before shedding to 97.09 MPa (a 2.4-fold increase), followed by secondary peaks of 72.82 MPa and 51.43 MPa. Such rapid, large-amplitude stress cycling induces high-cycle fatigue, which may initiate and propagate cracks under repeated operational accumulation.
- (3)
- Severe runner vibration under RT-5 originates from coupled hydraulic and mechanical excitation mechanisms. Hydraulically, sudden load shedding triggers intense water hammer effects, with pressure waves reflecting between the volute, runner, and tailwater pipe to form a nonstationary pressure pulsation field on blade surfaces—this serves as the primary forced vibration source. Mechanically, the speed surge from 388 rpm to 564 rpm amplifies centrifugal forces, exacerbating runner deformation and altering structural dynamic stiffness. Concurrently, continuous speed variation causes excitation frequencies to sweep across the runner’s wet modal frequencies, elevating the risk of resonance and potentially amplifying dynamic stresses by several times. The RT-5 speed range encompasses both normal operation and partial runaway zones, resulting in a significantly higher resonance risk compared with fixed-speed units.
Author Contributions
Conceptualization, X.S.; methodology, X.S.; software, Z.W.; validation, T.L.; formal analysis, F.Y.; investigation, T.L.; resources, H.C.; data curation, Y.J.; writing—original draft preparation, Y.J.; writing—review and editing, T.L.; supervision, H.B.; funding acquisition, Z.Z. All authors have read and agreed to the published version of the manuscript.
Funding
This research was funded by the CHINA SOUTHERN POWER GRID Guangdong Zhaoqing Langjiang Pumped Storage Variable Speed Water Pump Turbine Fluid Structure Coupling Performance Prediction and Optimization Evaluation Project (0295002024030301JD00004).
Data Availability Statement
The data that support the findings of this study are available from the corresponding author upon reasonable request.
Conflicts of Interest
Authors Tao Liu, Fei Ye, Hongyu Chen, Zan Zhou were employed by the company Guangzhou Qi’an Zhongzhi Construction Management Co., Ltd. The remaining authors declare that the research was conducted in the absence of any commercial or financial relationships that could be construed as a potential conflict of interest.
Nomenclature
| Symbol | Description | Unit (SI) |
| Ms | Mass matrix of structure | kg |
| Cs | Damping matrix of structure | N·s/m |
| Ks | Stiffness matrix of structure | N/m |
| u(t) | Displacement vector | m |
| F(t) | Force vector | N |
| p | Lagrangian variable (Laplace domain) | - |
| ρ | Fluid density | kg/m3 |
| ν | Kinematic viscosity | m2/s |
| τ | Reynolds stress tensor | Pa |
| St | Source term in momentum equation | N/m3 |
| σeq | Equivalent von Mises stress | Pa |
| n | Rotational speed | r/min |
| H | Head | m |
| Q | Flow rate | m3/s |
| y+ | Non-dimensional wall distance | - |
References
- Man, Z.Q.; Tan, S.X.; Mou, W.; Cheng, S.M.; Lu, D.P.; Huang, W.F.; Qiao, G.J.; Feng, C.; Zhang, Y.Q. A Collaborative Optimization Method for Anti-overshoot Control of Doubly-fed Variable-speed Pumped-storage Units. China Rural Water Hydropower, 2026; pp. 1–19, Online ahead of print. Available online: https://kns.cnki.net/kcms2/article/abstract?v=YwS3ffssB6jjec3jVX2gTm4p2e2FzhqqGsuQj3wd2Nal62ZYroVnrLt09HPPpNWnL9hSy9P7e2eknzVcJbLRnzEKP46dwDtyejVWeLN-dZ-sCu_CrOwcJPelXVDG09dwxeKp31LciuwWvyjTxBpEwAcA77h2hfTQ673ol0LbjD0=&uniplatform=NZKPT&language=CHS (accessed on 10 June 2026).
- Lyu, H.B. Research on Clearance Adjustment Technology for Guide Vane End Faces of Pump-Turbines in Pumped-Storage Power Stations. Mod. Manuf. Technol. Equip. 2026, 62, 1–3. [Google Scholar] [CrossRef]
- Dai, C.M.Z.; Xu, Z.J.; Guo, Q.; Ding, S.F.; Li, Z. Simulation and Experimental Study on Personnel Evacuation in Underground Fire of a Pumped-Storage Power Station. Hydropower, 2026; pp. 1–11, Online ahead of print. Available online: https://link.cnki.net/urlid/11.1845.TV.20260411.1717.002 (accessed on 10 June 2026).
- You, J.Y. Design and Power Regulation Strategy of Virtual Pumped-Storage Power Station. Northeast. Electr. Power Technol. 2026, 47, 9–13. [Google Scholar]
- Wang, H.T.; Chen, Z.X.; Qiao, H.; Zhang, W.H. Research on Precision Control Technology for Runner Installation of Vertical-shaft Turbine Units in Pumped-Storage Power Stations. Mech. Electr. Inf. 2026, 82–85. [Google Scholar] [CrossRef]
- Yu, X.H.; Yu, J.C.; Meng, L.; Liang, R.G. Study on Comprehensive Conversion Efficiency of Pumped-Storage Power Stations. Hydropower Pumped Storage 2026, 12, 5–12. [Google Scholar]
- Fan, R.R.; Shi, S.B.; Li, S.H. Cause Analysis and Improvement Measures for Shear Pin Failure at Xikou Pumped-Storage Power Station. Small Hydro Power 2026, 75–78. [Google Scholar] [CrossRef]
- Zhang, Y.D.; Zhao, W.; Xie, B.; Zhou, Z.H.; Liu, D. Development and Current Status Analysis of Excitation Technology for Hydraulic Turbine Units. Power Equip. Manag. 2026, 277–281. [Google Scholar] [CrossRef]
- Xu, T.F.; Shu, Z.; Liu, M.J.; Kang, C.X.; Ding, G.L.; Wang, Y. Key Technologies and Engineering Applications of Small Hydropower Storage-oriented Retrofit. Water Resour. Power 2026, 44, 226–231. [Google Scholar] [CrossRef]
- Xu, C.; Lu, W.F.; Zeng, X.Y.; Cao, L.; Zhu, S.; Feng, C.; Guo, L.; Yu, A. Research on Hydraulic-Electrical Coupling Simulation Technology for Variable-Speed Pumped-Storage Units. J. Drain. Irrig. Mach. Eng. 2026, 44, 164–172. [Google Scholar]
- Li, Y.H.; Yang, J.B. A Type Selection Method for Variable-Speed Pump-Turbines Based on Firefly Algorithm. Water Resour. Power, 2026; pp. 1–10, Online ahead of print. Available online: https://link.cnki.net/urlid/42.1231.TK.20260112.1329.002 (accessed on 10 June 2026).
- Zhu, M.J.; Duan, Z.J.; Mao, Y.T.; Zhou, J.X.; Wang, F.; Ma, J.; Wei, H.W. Research on Hydraulic Vibration Characteristics of Water Conveyance and Power Generation System in Pumped-Storage Power Stations. J. North China Univ. Water Resour. Electr. Power, 2026; pp. 1–13, Online ahead of print. Available online: https://link.cnki.net/urlid/41.1432.TV.20260109.1730.002 (accessed on 10 June 2026).
- Zheng, J.X.; Liu, P.; Hu, J.H.; Ren, S.; Leung, K.W. Vibration Test Analysis and Technical Retrofit Verification for Pumped-Storage Power Stations. Water Resour. Power, 2026; pp. 22–26, Online ahead of print. [CrossRef]
- Tian, K.; Jin, H. Electrical Design and Its Application Research in Pumped-Storage Power Stations. Electr. Technol. Econ. 2025, 147–149+153. [Google Scholar] [CrossRef]
- Ren, Z.W. Safety and Hydraulic Stability of Key Components in Pumped-Storage Units. Hydropower Pumped Storage 2025, 11, 2–3. [Google Scholar]
- Meng, F.; Zhang, C.; Li, Y.F. Research and Implementation of a Simulation Test Platform for Monitoring System of Pumped-Storage Power Stations. Mech. Electr. Technol. Hydropower Stn. 2025, 48, 20–23+37+167. [Google Scholar] [CrossRef]
- Xia, X.J.; Yan, K.H.; Zhang, C.Y.; Mi, G.Y. Review of Crack Repair Technology for Pumped-Storage Runner Blades. Mech. Electr. Eng. Technol. 2025; pp. 1–9, Online ahead of print. Available online: https://link.cnki.net/urlid/44.1522.TH.20251121.1703.009 (accessed on 10 June 2026).
- Wan, S.H. Sensitivity Study on Hydraulic Transients in Pumped-Storage Power Stations. Jilin Water Resour. 2025, 11, 19–24. [Google Scholar] [CrossRef]
- Nie, Z.P.; Xiao, L.Y.; Zhang, J.Y.; Ye, H.; Qiu, Q.Q.; Ji, H. A Review on the Development of Novel Pumped-Storage Systems. Adv. Technol. Electr. Eng. Energy 2025, 44, 14–25. [Google Scholar]
- Xun, H.Y.; Geng, B.; Liu, W.L.; Wang, Y. Simulation and Experimental Study on Radial Hydraulic Thrust of Pumped-Storage Units. Mech. Electr. Technol. Hydropower Stn. 2025, 48, 19–22. [Google Scholar] [CrossRef]
- Cao, Y.Y. Hydraulic Design and Optimization of the Runner for a Pumped-Storage Power Station. Water Resour. Hydropower Eng. 2025, 56, 441–445. [Google Scholar] [CrossRef]
- Ren, Z.W.; Xue, H.Y.; Zhang, F.; Jing, X. A Review on Flexible Operation of Pumped-Storage Units in New-Type Power Systems. New Type Power Syst. 2025, 3, 285–309. [Google Scholar] [CrossRef]
- Zhang, X.F. Storing Energy in Green Mountains and Waters to Drive a Green Future. State Grid News, 17 July 2025; p. 001. [CrossRef]
- Meng, Z.J.; Tang, P.C. Research on Startup Commissioning Technology for Units in Pumped-Storage Power Stations. Mech. Electr. Technol. Hydropower Stn. 2025, 48, 1–4. [Google Scholar] [CrossRef]
- Sun, R.L.; Xue, T.T. Quality Control Analysis for Electromechanical Equipment Installation in Pumped-Storage Power Stations. Mech. Electr. Technol. Hydropower Stn. 2025, 48, 79–82. [Google Scholar] [CrossRef]
- Ge, Y. Type Selection Optimization of Pump-Turbine for Doubly-Fed Variable-Speed Pumped-Storage Units. Master’s Thesis, Xi’an University of Technology, Xi’an, China, 2025. [Google Scholar] [CrossRef]
- Wang, J.L. Research on Electrical Braking Control Strategy for Doubly-Fed Variable-Speed Pumped-Storage Units. Master’s Thesis, Xi’an University of Technology, Xi’an, China, 2025. [Google Scholar] [CrossRef]
- Zhang, N. Optimization of Primary Frequency Regulation Strategy in Speed Control Mode for Doubly-Fed Variable-Speed Pumped-Storage Units. Master’s Thesis, Xi’an University of Technology, Xi’an, China, 2025. [Google Scholar] [CrossRef]
- Cai, L.; Li, Z.G.; Wang, K.; Qing, J.; Li, X. Numerical Analysis on Wear of Injection Mechanism in Pelton Turbines. J. Drain. Irrig. Mach. Eng. 2025; pp. 1–12, Online ahead of print. Available online: https://link.cnki.net/urlid/32.1814.TH.20250620.1832.008 (accessed on 10 June 2026).
- Zhao, Y.Y.; Yan, B.; Chai, X.L.; Li, Y.L.; Wang, Y. Discussion on Turbine Abrasion Issues in Pumped-Storage Power Stations. Hydropower Pumped Storage 2025, 11, 63–67. [Google Scholar]
- Zhang, M. Research on Flexibility and Stability Under Expanded Operating Zone of Pumped-Storage and Comprehensive Evaluation. Master’s Thesis, Northwest A&F University, Yangling, China, 2025. [Google Scholar] [CrossRef]
- Wen, G.Q. Calculation Method of Water Hammer Energy Difference for Typical Transients in Pumped-Storage Power Stations. Master’s Thesis, Northwest A&F University, Yangling, China, 2025. [Google Scholar] [CrossRef]
- Dai, Y. Numerical Simulation of Flow Field in Turbine of a Pumped-Storage Power Station Based on Computational Fluid Dynamics (CFD). Autom. Instrum. 2025, 29–33. [Google Scholar] [CrossRef]
Disclaimer/Publisher’s Note: The statements, opinions and data contained in all publications are solely those of the individual author(s) and contributor(s) and not of MDPI and/or the editor(s). MDPI and/or the editor(s) disclaim responsibility for any injury to people or property resulting from any ideas, methods, instructions or products referred to in the content. |
© 2026 by the authors. Licensee MDPI, Basel, Switzerland. This article is an open access article distributed under the terms and conditions of the Creative Commons Attribution (CC BY) license.