


Abstract
Towards achieving carbon neutrality, it is important to produce carbon-free hydrogen from renewables at an acceptable cost. At the same time, power retailers that own renewables must manage their imbalances between planned and actual generation. This paper proposes an economically viable carbon-free hydrogen method for such retailers, utilizing both positive imbalances of renewables and electricity from the market with non-fossil certificates. The proposed method enables geographically flexible hydrogen production through the power grid while utilizing renewable imbalances within actual power business operations. This paper develops solutions to an optimization problem that minimizes the hydrogen variable cost and offsets the imbalances using an electrolyzer and a battery while accounting for imbalance uncertainty. The case study in Tokyo, Japan demonstrates that imbalance compensation reduces the hydrogen variable cost by 30%. The minimum levelized cost of hydrogen (LCOH) is approximately 60 JPY/Nm3 when the electrolyzer operates at a 40% capacity factor. Furthermore, sensitivity analysis of market prices indicates that the LCOH can decline to 50 JPY/Nm3 under lower price conditions. The results suggest that market-independent cost components, such as wheeling and renewable energy charges and non-fossil certificates, remain major obstacles to further reducing hydrogen costs.
1. Introduction
In order to mitigate global warming, energy systems are transitioning toward carbon neutrality across all sectors. Renewables such as solar and wind generate electricity without CO2 emissions and are increasingly replacing conventional thermal power plants. As of 2022, solar and wind accounted for 4.44% and 7.32% of global power generation, respectively [1]. Solar capacity is also projected to reach 500 GW by 2030 under the stated policies [1]. As renewables continue to expand, they will serve not only as power generation sources but also as carbon-free energy sources for other sectors. However, electricity alone cannot satisfy all forms of energy demand. Thus, converting electricity into other energy carriers, known as Power-to-X, is the key to achieving carbon neutrality across the entire energy system.
Hydrogen has recently attracted attention as a promising energy carrier derived from electricity. It can serve as a feedstock for fuels and chemicals such as methane and ammonia, which meet heat and chemical demands. Hydrogen is also suitable for long-term and seasonal energy storage owing to its low storage losses. There are various production methods, including steam methane reforming, coal gasification, waste processing [2,3], and water electrolysis. Among them, water electrolysis can produce carbon-free hydrogen when powered by renewable electricity, making it a key technology for achieving system-wide carbon neutrality.
A common approach to producing carbon-free hydrogen is to connect electrolyzers directly to renewables and operate them using only renewable electricity. The off-grid system achieves fully renewable electrolysis but requires electrolyzers to follow fluctuating power generation [4,5]. In addition, electrolyzers operate at low capacity factors, increasing hydrogen costs due to the high capital intensity of electrolyzers. Electrolyzers with solar power plants operate at a 5% capacity factor [5], and the ones with wind power plants operate at 30% [6] to 40% [7] capacity factors. When relying solely on excess renewable electricity, they operate at lower capacity factors, such as 23% in Germany [8], 4% in Jordan [9], 25% in the Kingdom of Saudi Arabia [10], and 30% in the UK [11]. Finally, electrolyzers near renewables require transporting the produced hydrogen by trucks, ships, or pipelines, which increases infrastructure investment.
The growing penetration of renewables significantly affects power system operations and business structures. In Japan, more than 70 GW of solar power plants had been installed by 2023 [12], leading to excess electricity during daytime hours. This surplus often results in lower prices in the day-ahead electricity market. Some power retailers also own renewable power plants. They must manage the uncertain generation of renewables to maintain power system stability. Specifically, they are responsible for the discrepancy between the planned and actual generation, known as the imbalance. Although transmission system operators finally offset the imbalances using flexible resources, this incurs additional system costs.
This paper proposes a system to produce carbon-free hydrogen based on the power business. In the proposed system, power retailers produce hydrogen using electricity from the market and their own renewables. Electricity is supplied to electrolyzers through the power grid, allowing electrolyzers to maintain stable operation by relying on market electricity when renewable generation fluctuates [13,14]. Procuring electricity at low market prices further contributes to reducing hydrogen costs. In addition, electrolyzers use positive imbalances of renewables in the power business. This corresponds to electrolysis using excess renewable generation as a zero-marginal-cost electricity source. It enables power retailers to simultaneously mitigate their renewable imbalances and produce carbon-free hydrogen. Reducing imbalances also helps maintain the stability of the power grid. Furthermore, the installation sites of electrolyzers are not restricted by the locations of renewable power plants because electricity is delivered through the grid. This geographical flexibility is important because hydrogen transportation costs are not negligible when renewable-rich sites are located far from hydrogen demand. For example, previous studies report compressed-hydrogen transportation costs of 0.75 USD/kg-H2 for 50 km [15] and more than 1 USD/kg-H2 for more distant cases [16,17]. Therefore, although retailers must pay wheeling charges, the grid-connected configuration can reduce the need for long-distance hydrogen transportation by allowing electrolyzers to be installed closer to hydrogen demand while placing renewables in locations with favorable weather conditions.
Reducing the cost of carbon-free hydrogen remains a critical requirement. Governments have established cost targets, including 1 USD/kg-H2 in the United States by 2031 [18] and 30 JPY/Nm3 in Japan by 2030 [19]. Previous techno-economic analyses reveal that the electricity costs dominate the cost structure of hydrogen production [20,21,22]. Several papers estimate the hydrogen cost in off-grid solar- or wind-based systems [4,5,23], showing large variations due to differences in renewable resource abundance. Reported costs range −3.1–56.27 -H2 when excess electricity is sold in Turkiye [4], 0.75–72.37 in Iraq [5], and 4.99–12.38 -H2 in Germany [23]. Hydrogen production with electricity from the market and solar power plants directly connected to electrolyzers can achieve 5.16 USD/kg-H2 [14]. Although previous research evaluates electrolysis powered by renewables, few studies incorporate power-business factors, including the treatment of imbalances, into hydrogen cost assessment.
Imbalances present a significant economic risk for power retailers. Prior studies propose various approaches to mitigate imbalance risks, including the use of batteries and flexible demand to absorb deviations [24,25], as well as strategic bidding in electricity markets [26,27]. Hydrogen systems comprising electrolyzers, hydrogen tanks, and fuel cells can also contribute to imbalance reduction through flexible operation [28,29,30]. Thakur et al. [28] proposed an operational strategy for electrolyzers and fuel cells in Norway to mitigate renewable energy imbalances while maximizing electricity business profits. Pavić et al. [29] developed an optimization framework that simultaneously considers participation in electricity and gas markets together with imbalance compensation of owned photovoltaics for profit maximization. Čović et al. [30] proposed an optimal operation model that jointly considers gas balancing requirements and electricity imbalance management. However, previous research on imbalances has paid limited attention to the hydrogen cost. In addition, previous research assumes that the hydrogen production system is directly coupled with renewables.
This paper aims to enable power retailers in Japan to produce carbon-free hydrogen at an economically viable cost as part of actual power business operations. The power retailers use their positive imbalances of renewables and electricity from the market with carbon-offset certificates. To this end, this paper develops a hydrogen production model that reflects the operational and economic conditions of Japanese power retailers. The proposed method enables cost-effective hydrogen production that uses renewable imbalances and flexible procurement from the electricity market.
In the proposed model, electrolyzers can be located independently of renewable sites because electricity is delivered through the grid. Retailers can flexibly procure low-price electricity while compensating for renewable imbalances using electrolyzers and batteries. Unlike previous studies mainly based on directly coupled renewable-electrolyzer systems, the model considers hydrogen production within the electricity market and imbalance-settlement framework of actual power retail operations, enabling geographically flexible system configurations. The proposed method is evaluated through an annual simulation with a 10 MW-scale electrolyzer and renewable generation data of an actual retailer in Tokyo. The results demonstrate that the method can reduce hydrogen costs while mitigating price volatility, highlighting its practical advantage over conventional configurations. Furthermore, sensitivity analyses on electrolyzer capacity factors and market prices reveal the practical cost range of hydrogen production for power retailers.
This paper is organized as follows. Section 1 states the background, purpose, and novelty of this paper. Section 2 briefly overviews the Japanese balancing system and power market. Section 3 provides the model of a power retailer and imbalances from renewables and defines the optimization problem to minimize the hydrogen cost. Section 4 shows the hydrogen cost and operations through a case study based on Japan’s actual market and renewable power plant data. Section 5 concludes this paper and presents future research.
2. Electricity Balancing and Market System in Japan
After the deregulation of the electricity business, numerous companies entered the power generation and retail businesses in Japan. This change created competition in the power business, which has contributed to lower electricity prices. In contrast, the transmission and distribution business is a monopoly because of its public nature. Japan consists of ten transmission and distribution regions. Each region is managed by a transmission system operator (TSO). The TSOs must maintain the balance between power supply and demand using the resources of generators and retailers.
Generators and retailers must maintain the balance between supply and demand in a 30 min time slot. They form a balancing group to maintain a more precise balance. They use their resources and electricity markets to achieve the balance. The day-ahead market (DAM) is the primary market for generators and retailers. There are other markets, such as real-time and forward markets. However, almost all power exchanges occur in the DAM, so this paper focuses on the DAM. In the DAM, market participants submit bids to sell or buy electricity. The DAM has 48 product slots, corresponding to 30 min slots in a day (e.g., 18:00–18:30). Participants can submit different bids in different slots. Bid submission closes at 10:00, and the market is cleared simultaneously in all slots. The clearing prices, called area prices, can differ in each region.
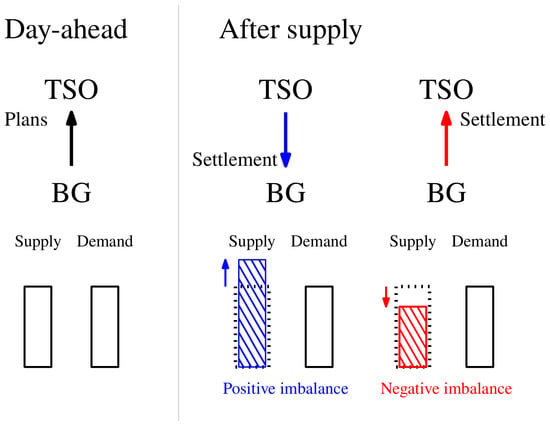
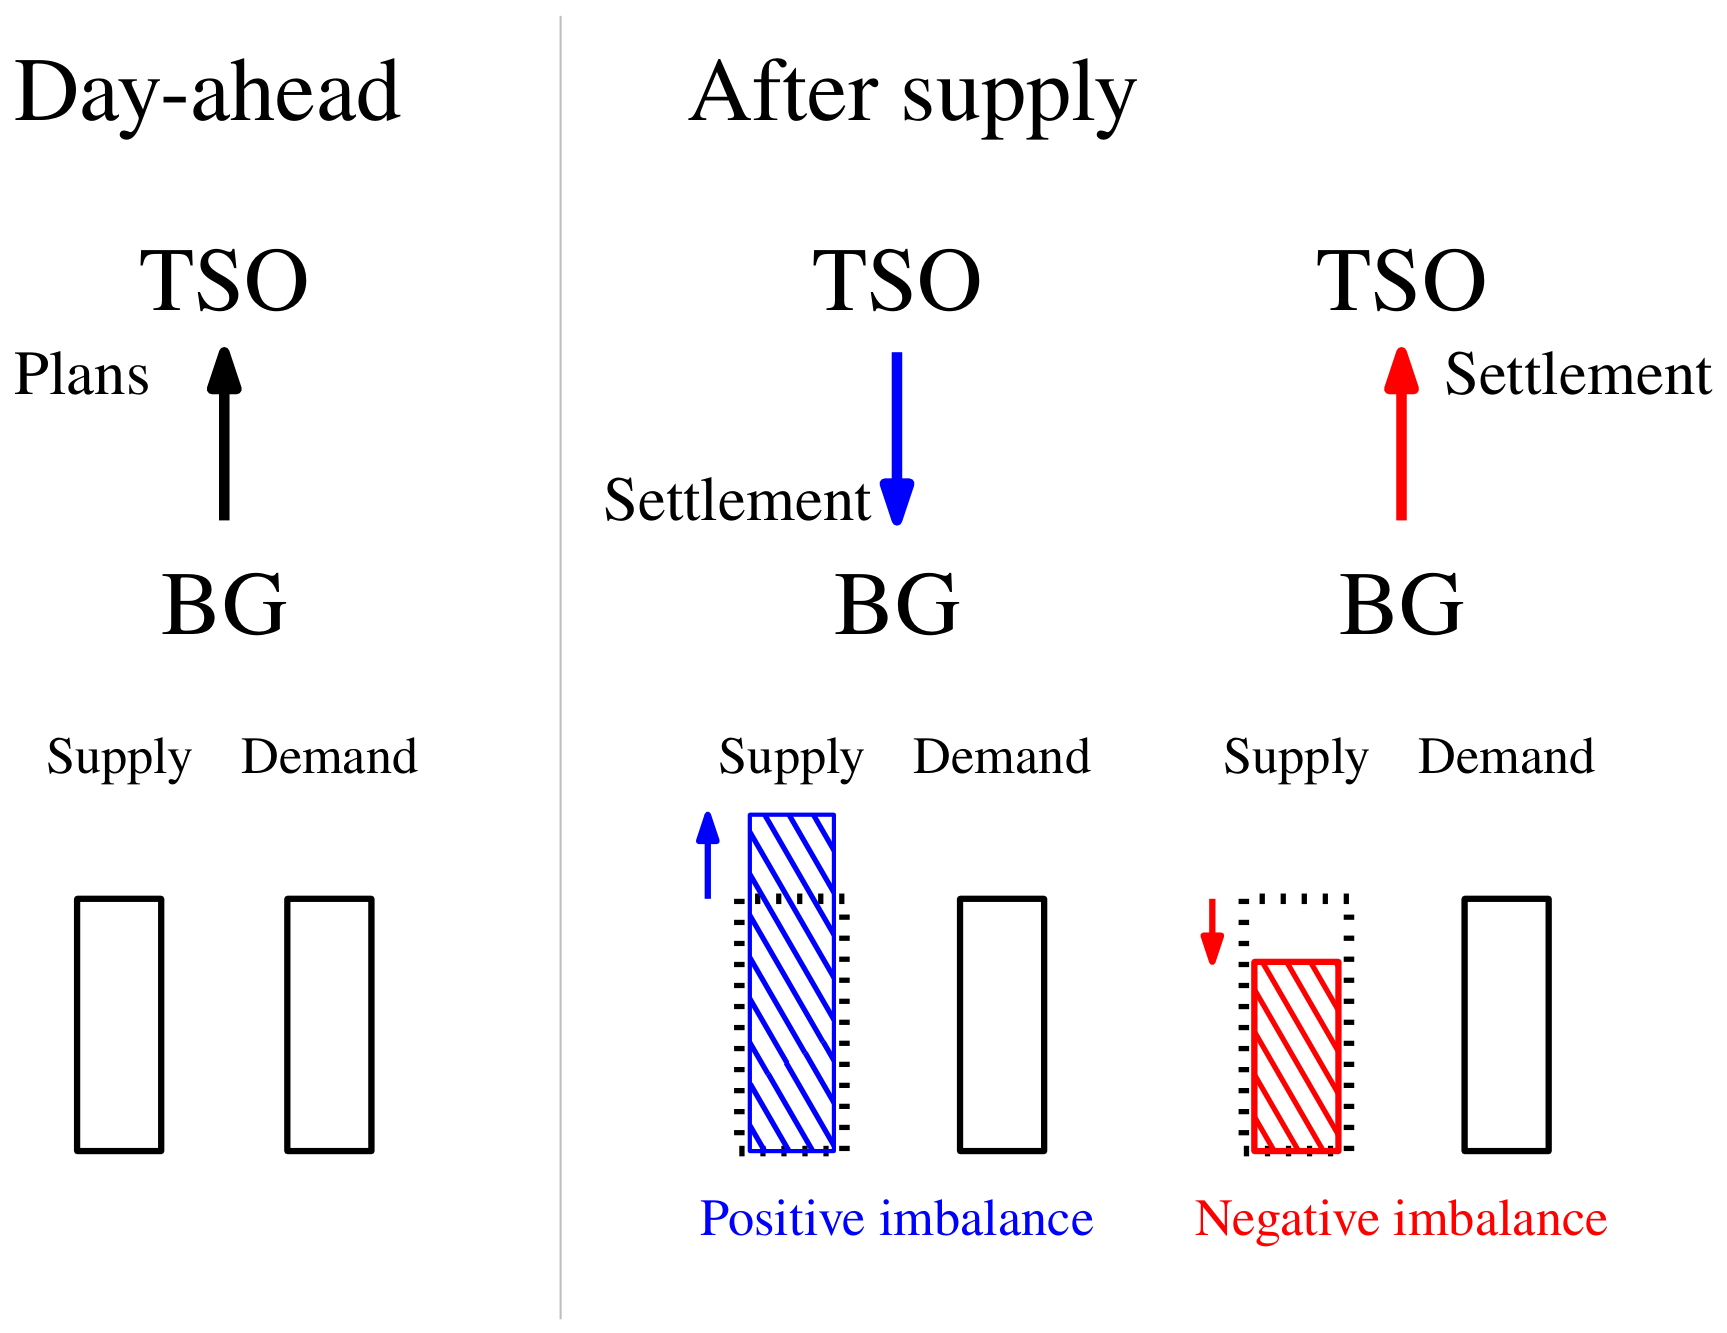
After trading in the market, balancing groups should make the day-ahead supply and demand plans for each 30 min slot. Figure 1 shows the interaction between balancing groups and TSOs. These plans are shared with TSOs one day before the actual supply. However, the actual generation and demand can differ from the plan because of forecast errors in renewables’ generation and demand. The mismatch between the planned and actual supply or demand values is called imbalance. Each balancing group therefore causes imbalances in each 30 min slot after the actual supply. TSOs manage them by balancing resources to maintain the balance between supply and demand.
Figure 1.
Interaction between power business companies before and after the actual supply. TSO means a transmission system operator. BG means a balancing group.
Balancing groups must settle imbalances after the real-time operation, as shown on the right side of Figure 1. The imbalances are classified into two types: positive imbalances (i.e., actual supply > planned supply or actual demand < planned demand) and negative imbalances. The associated cash flows differ between them. When balancing groups cause positive imbalances, TSOs pay them. When they cause negative imbalances, they pay imbalance charges to TSOs. The settlement price is called the imbalance price. It equals the marginal prices of balancing resources, so the positive and negative imbalance prices are the same. The imbalance price is not necessarily punitive. For example, when the planned supply is expected to be short, the imbalance price exceeds the clearing price of the DAM. The balancing group with positive imbalances will receive higher returns in this situation. However, balancing groups cannot know imbalance prices before the real-time operation. Thus, imbalances fundamentally pose an economic risk to power business companies.
3. Hydrogen Production Method
3.1. Power Supply Scheme to Electrolyzer
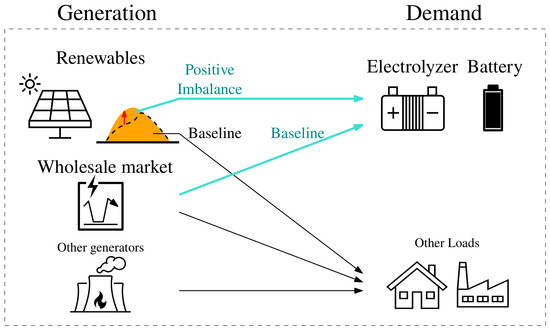
This paper considers a power retailer (say just “retailer”) that has renewable power plants and an electrolyzer. Figure 2 shows the model of the retailer’s power business. The retailer must make day-ahead plans for its supply and demand. Supply plans include the generation of their own power plants and procurement from the wholesale market. Demand plans include electrolyzers, batteries, and other electricity consumers (e.g., households). However, the retailer’s renewables cause imbalances in the real-time operation. The scope is limited to the electrolyzer and battery input.
Figure 2.
The power retailer model accounting for renewable power plants. The blue arrows show the energy flow in the scope of this paper.
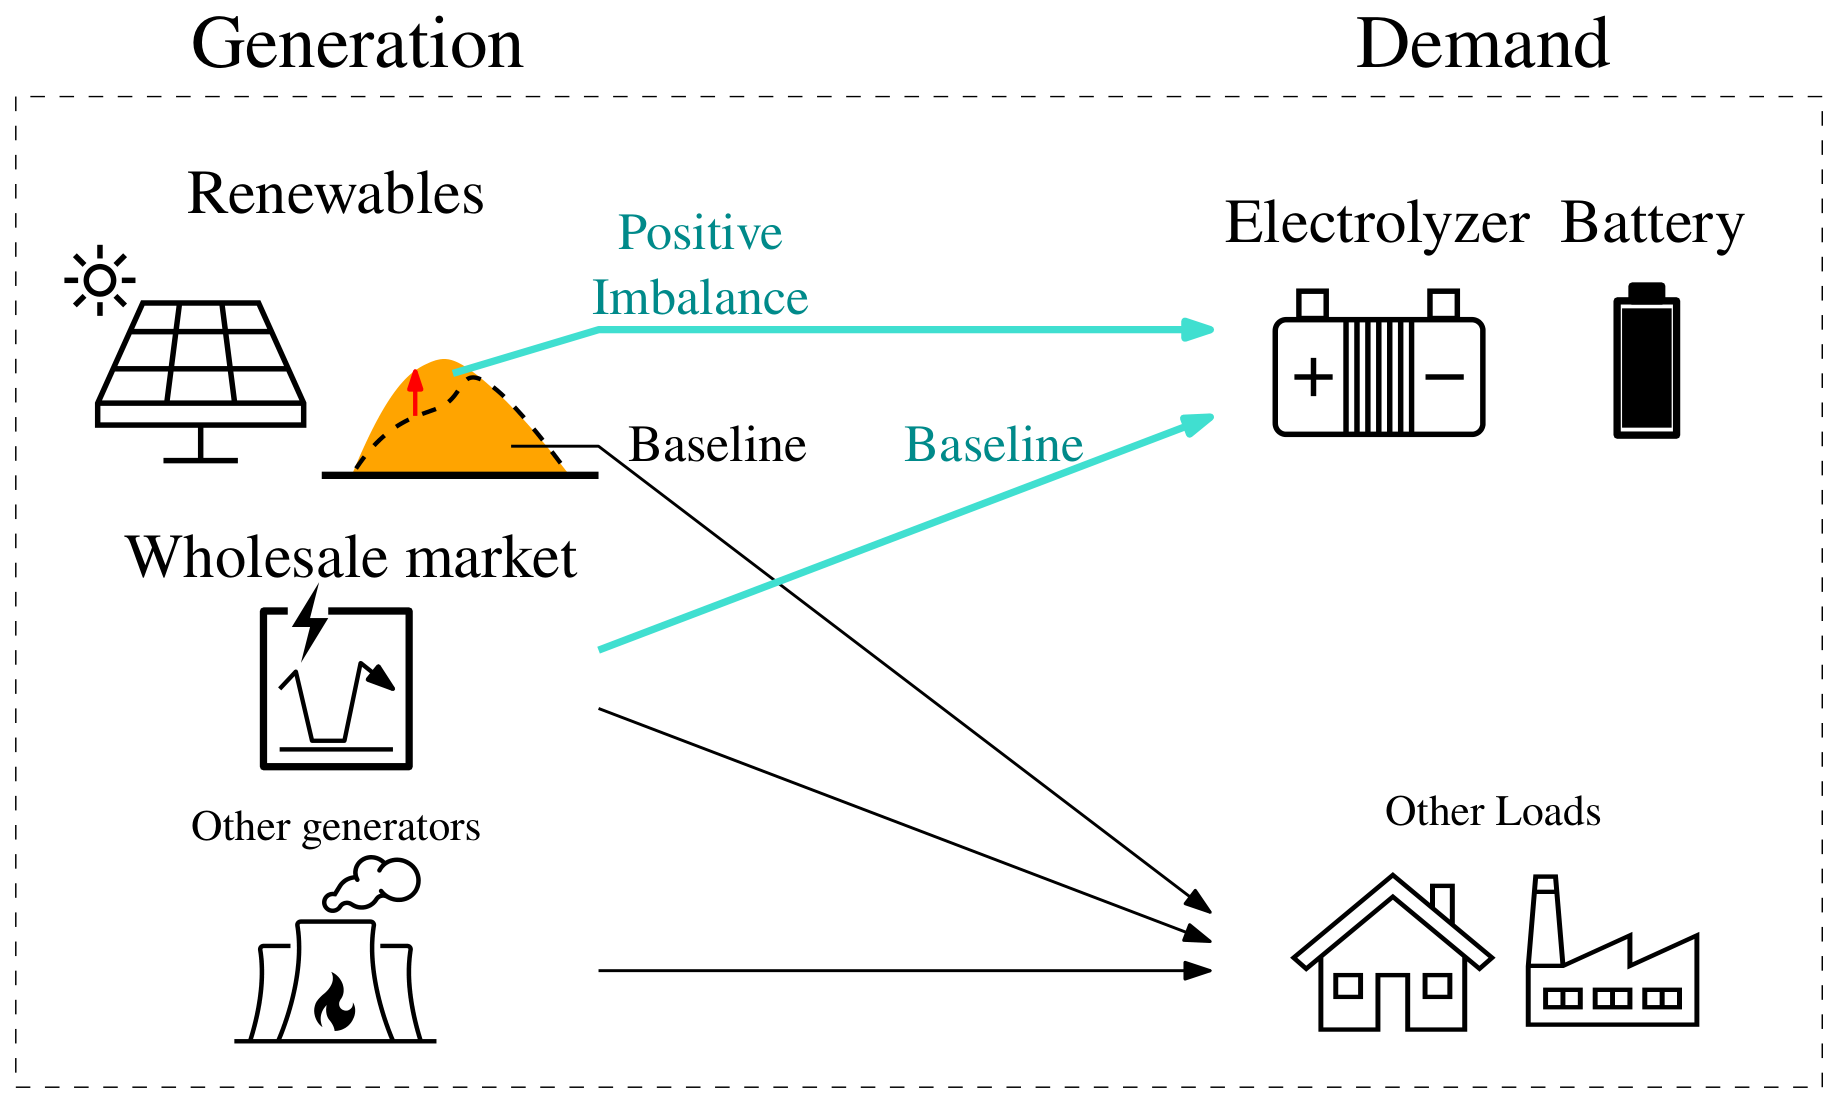
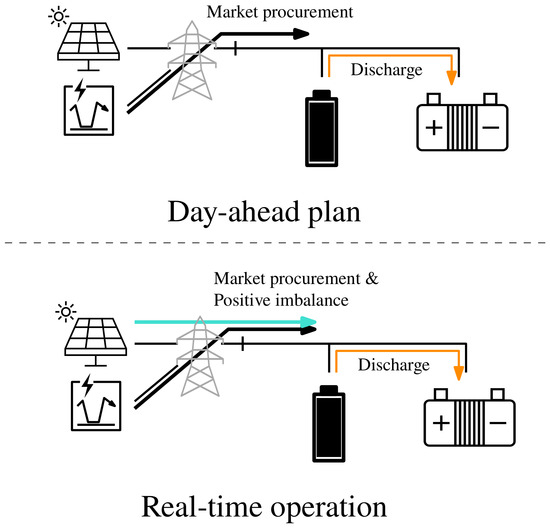
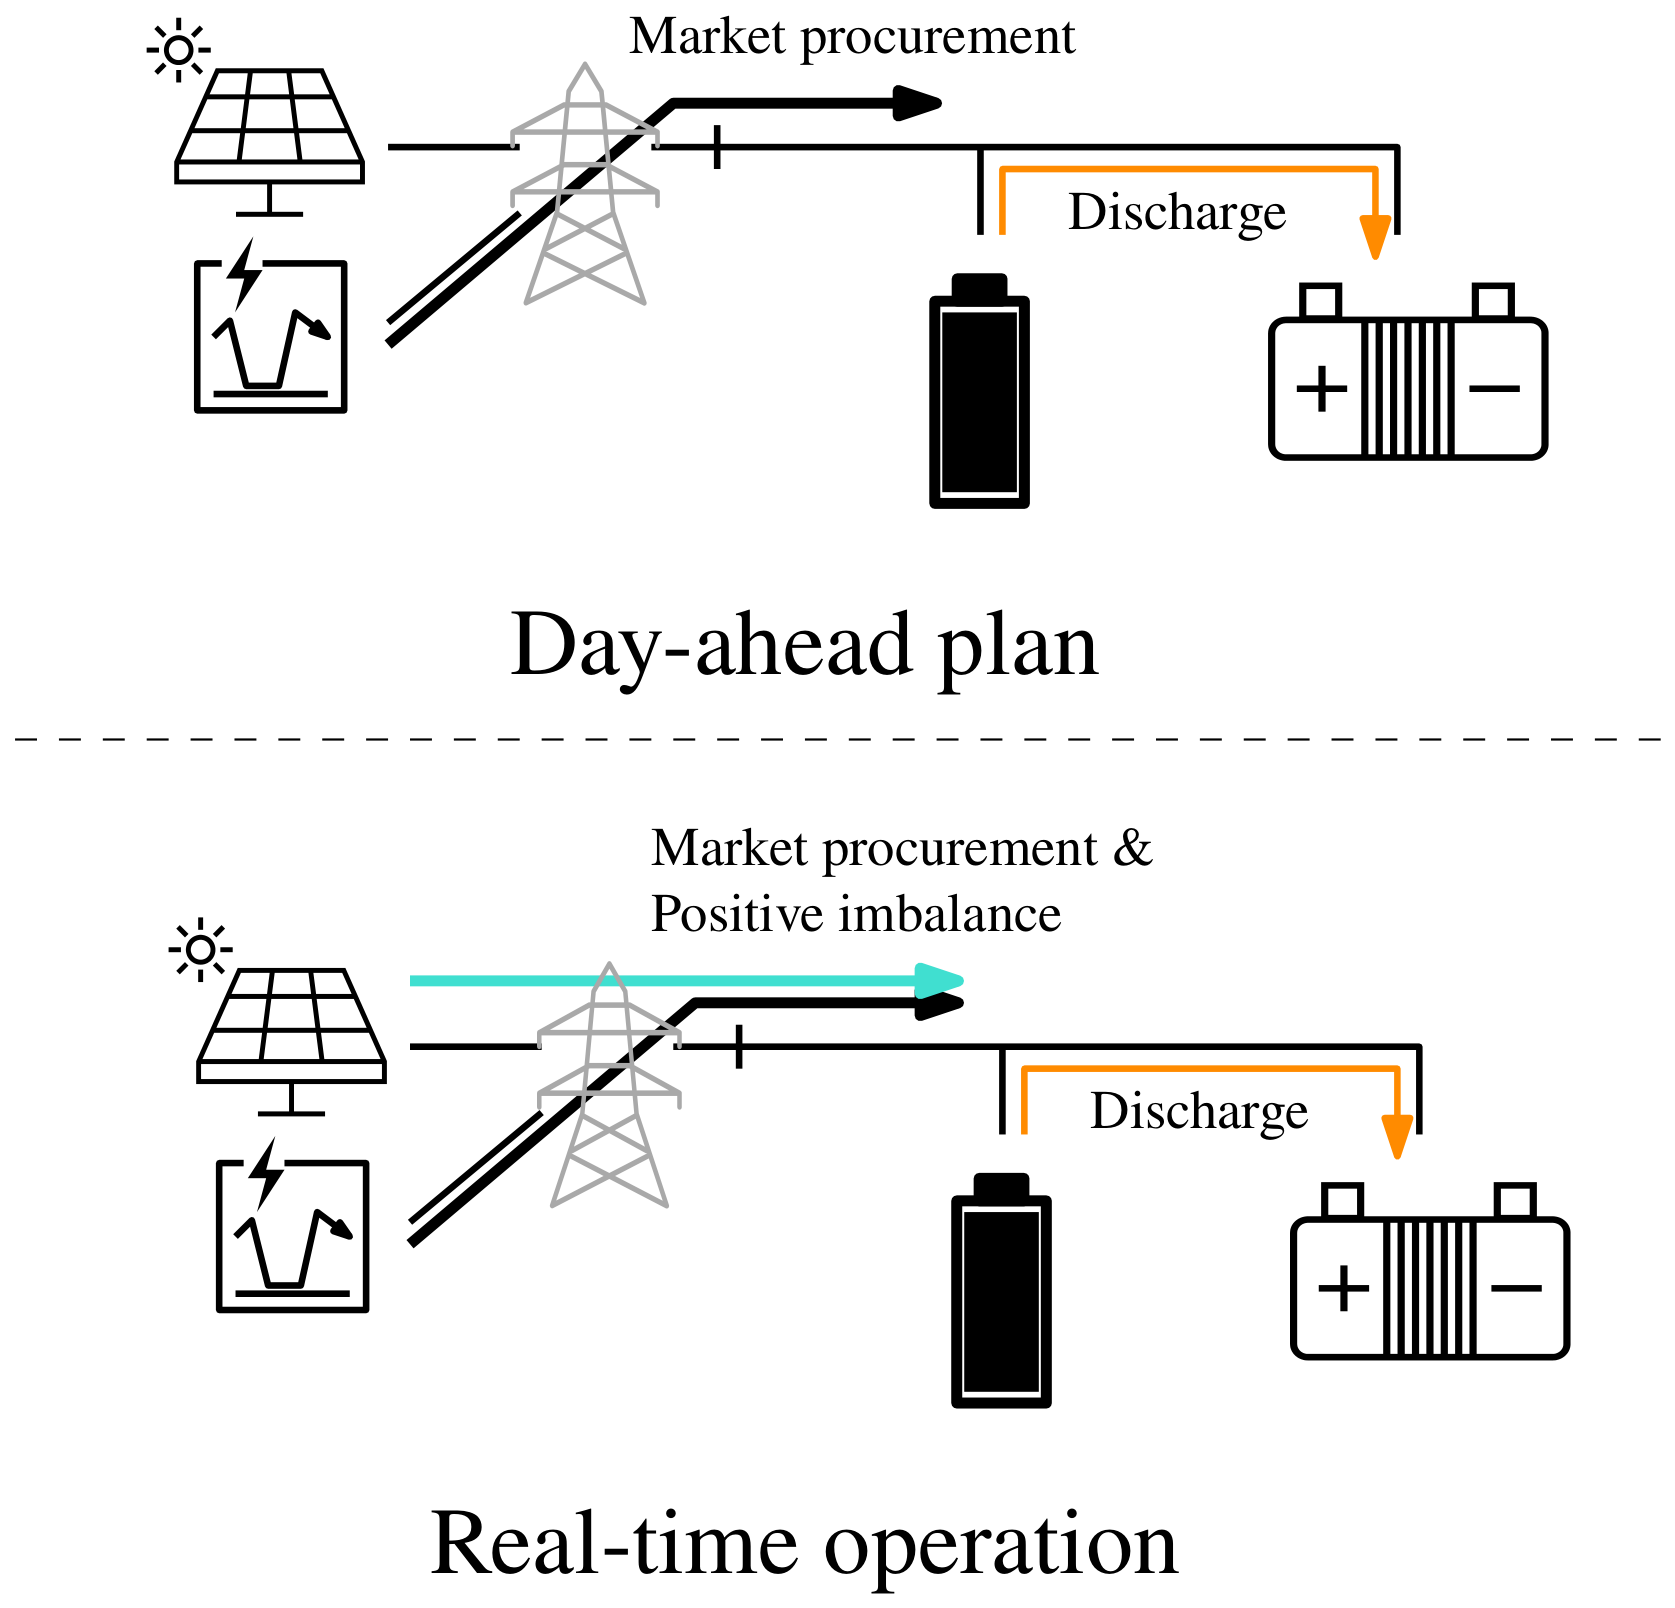
Figure 3 shows the more detailed electricity flow to the electrolyzer and the battery. The electrolyzer and the battery use electricity from the market for their planned operation. In the real-time operation, they also compensate for the positive imbalances of renewables. Electricity from the market and renewables is transferred via power grids. Such a system enables electrolyzers to be placed far from renewable sites. The battery discharges only to supply electricity for electrolysis through lines behind the receiving point. The retailer can sell or use the hydrogen produced in the company’s other business (e.g., methanation for the gas business). This paper does not specify the end use of hydrogen to focus on its production. In addition, this paper assumes that the sufficient water is available because electrolyzers can be placed near the water supply.
Figure 3.
Electricity flow to the electrolyzer and the battery.
This paper proposes a method for utilizing positive imbalances from renewables for electrolysis. This paper uses the term “compensation”, which means intentionally causing demand imbalances in the reverse direction against supply imbalances. For example, a demand increase in the real-time operation, causing negative demand imbalances, compensates for positive supply imbalances. It contributes to keeping a real-time supply and demand balance. In practical operation, the compensation requires real-time metering, communication, and automated control systems that coordinate renewable generation deviations with the electrolyzer and battery input. Since the compensation targets energy deviations over 30 min market and balancing time slots, it should be implemented as the retailer’s energy management rather than as a substitute for the TSO’s short-term frequency control. From the retailer’s view, compensation not only mitigates risks of imbalance settlements but also enables electrolyzers to use excess generation of their renewables. In addition, compensation does not impact the costs because positive and negative imbalances are settled at the same price. Hence, electrolyzers can virtually use excess generation of renewables at effectively zero cost when excluding prices for wheeling.
In addition to the renewable imbalances, consumer demand also causes imbalances because of demand uncertainty. This paper assumes that the retailer has other controllable resources to compensate for these imbalances.
3.2. Renewable Imbalance Model
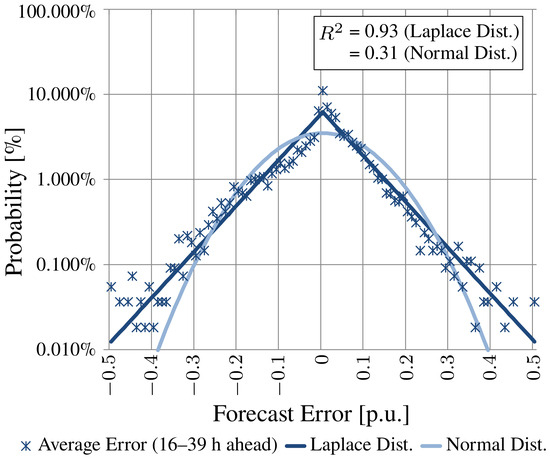
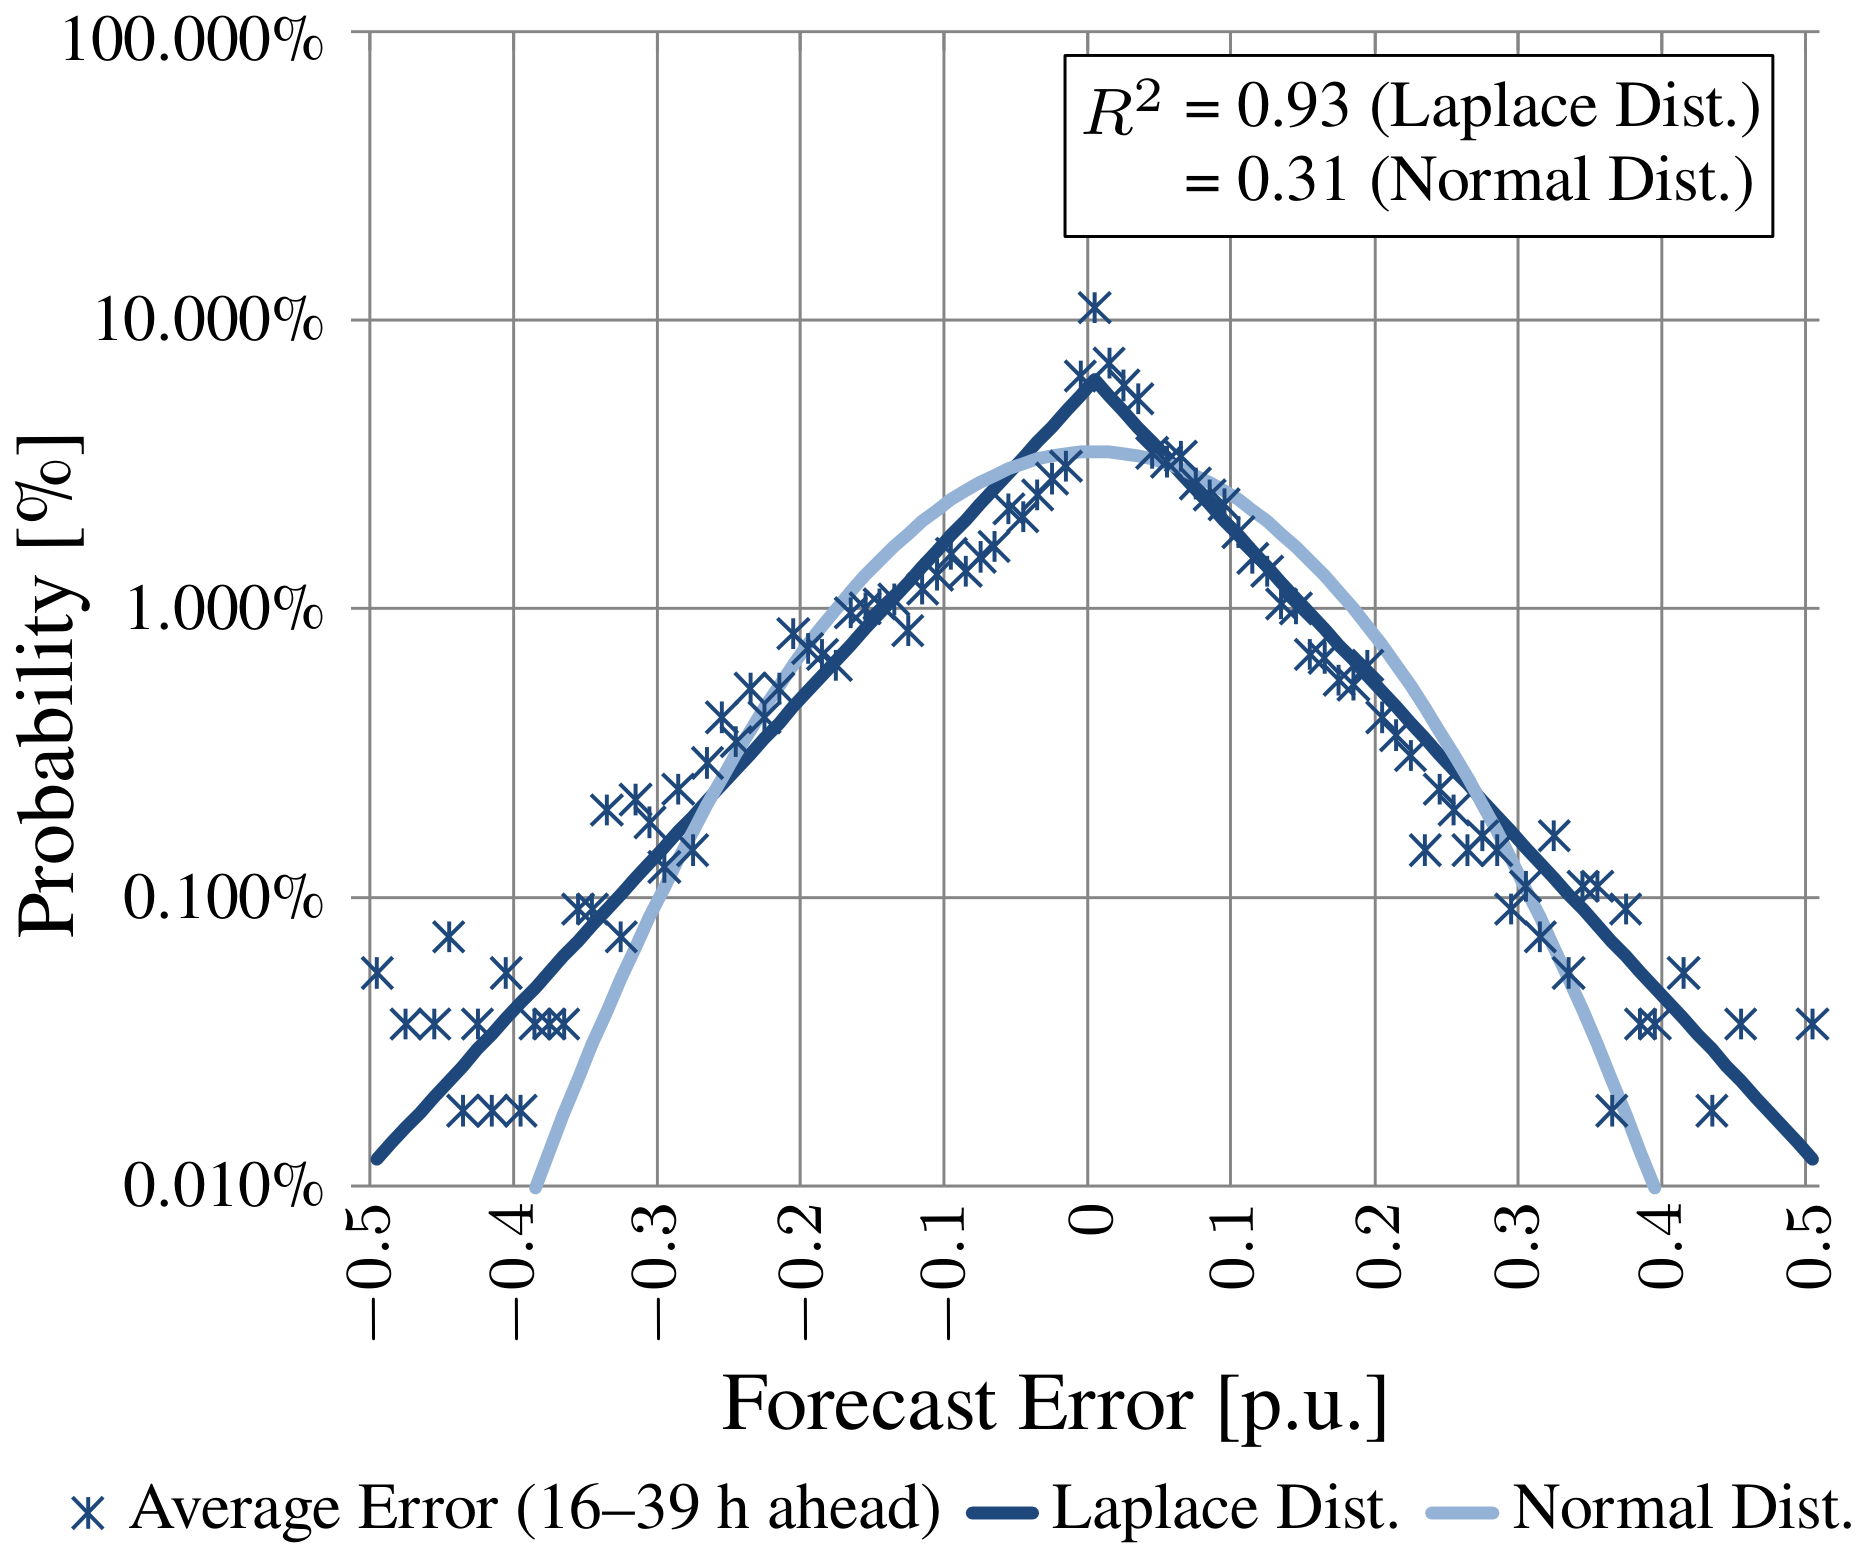
Renewables cause supply imbalances because their generation is difficult to forecast accurately at the day-ahead plan. The amount and distribution of forecast errors are important to model their imbalances. Previous research has reported Rayleigh [31], Laplace, and hyperbolic [32,33] distributions for wind power forecasts. For solar power plants, the day-ahead forecast errors by linear regression follow a Laplace distribution [34]. Figure 4 shows the forecast errors and fitting curves of a Laplace and Gaussian distribution.
Figure 4.
Area-wide forecast errors of solar power [34]. Each point shows the frequency of errors in one year data.
This paper adopts a Laplace distribution to model the forecast errors of solar power plants [35]. Its probability density function with the zero mean is shown in (1).
denotes the forecast error, and denotes the standard deviation. Positive values mean the actual output exceeds the forecast. The standard deviation is assumed to equal the root mean square error of area-wide forecasts (8.4% [36]). Temporal dependence is not considered in this study. Forecast errors can have spatial and temporal variabilities, such as smoothing effects [37] and positive auto-correlations [38,39]. However, regardless of the forecast error model, the proposed hydrogen production method remains applicable.
The forecast error distribution is discretized to integrate it into the optimization. The distribution is split into six intervals [31], as shown in Table 1. Each interval represents an imbalance scenario in the optimization. In each scenario, the forecast error is represented by its representative value. The cumulative probabilities at the partitions equal those of a Gaussian distribution at , , 0, , .
Table 1.
Distribution discretization of forecast errors (). denotes the standard deviation of forecast errors.
The sign and amount of supply imbalances also depend on supply plans. This paper proposes that the supply plan of renewables equals generation with the maximum negative errors (i.e., in Table 1). In this plan, their imbalances are almost certainly positive. Thus, the electrolyzer has more opportunities to compensate for positive imbalances. It simultaneously helps produce carbon-free hydrogen using renewables and offset imbalances. In addition, that supply plan describes reliably available renewable generation. Although the conservative supply plan may reduce some market trading opportunities, it can also increase the amount of renewable generation for stable retail supply contracts, which can improve power business profitability.
3.3. Hydrogen Production Simulation
This paper develops an optimization problem to decide the electrolyzer and battery operation considering imbalance uncertainty. The optimization aims to minimize the hydrogen variable cost. In hydrogen production, compensation is prioritized because the price of compensated positive imbalances is lower than that of the market. Thus, the proposed model will simultaneously reduce costs and imbalances. Table 2 shows the nomenclature of the index, variables, and constants in the optimization. All continuous variables are not negative.
Table 2.
Nomenclature of index, variables, and constants in the proposed optimization problem.
3.3.1. Hydrogen Variable Cost
The optimization problem minimizes the expected hydrogen variable costs, calculated as (2).
The numerator and denominator show the total variable costs and total hydrogen amount, respectively. The optimization excludes the capital costs and other fixed costs, such as a wheeling fixed charge. The efficiency of producing hydrogen is constant.
The unit cost of electricity from the market includes market prices, wheeling charge, renewable energy charge, and non-fossil certificates. The wheeling charge is the cost to use the grid. The renewable energy charge is a surcharge for all electricity consumers in Japan. It is proportional to the electricity consumed. In addition, the retailer buys non-fossil certificates to offset the emission of electricity from the market. They are charged in proportion to the amount of market procurement. The unit cost of positive imbalances includes only the wheeling charge and renewable energy charge. Thus, is not zero but lower than because of excluding the non-fossil certificates.
3.3.2. Constraints
The constraints are set as follows.
Constraints (3)–(8) define the electricity flow to the electrolyzer and the battery. Electricity from the market equals their day-ahead plan, as shown in (3). They also compensate for the positive imbalances, as shown in (4) and (5). The compensation differs in imbalance scenarios, so the expected values are calculated by (6)–(8).
Constraints (9) and (10) limit the operation range of the electrolyzer. The constraints do not include the electrolyzer’s ramp-up and ramp-down rate because one time slot has 30 min. For simplicity, the electrolyzer continues working during the optimization time range while start-up/shut-down operation and cold-start time are not dynamically modeled. Although this paper assumes an alkaline electrolyzer in the case study, retailers owning other types of electrolyzers can use the same constraints.
Constraints (11)–(17) regulate the battery operation. The charge and discharge output has an upper limit, as shown in (11). The binary variable prevents simultaneous charging and discharging. The state-of-charge (SoC) change is expressed in (14). Compensation affects the SoC by its expected value. It increases the SoC because the battery absorbs only positive imbalances. The SoC has an upper and lower limit, as shown in (15) and (16). The constraint (17) requires sufficient headroom over two consecutive intervals to compensate for positive imbalances.
The optimization problem defined by (2)–(17) is classified as mixed integer non-linear programming (MINLP). The MINLP problems are difficult to solve to optimality because of binaries and non-linearity [25,40,41]. An additional constraint is introduced to avoid the non-linearity. Non-linearity arises from the denominator of the objective function (2). Thus, the total hydrogen amount is fixed, as shown in (18).
The target amount is constant. Thus, replacing the denominator with can linearize the objective function.
3.3.3. Problem Definition
Overall, the optimization problem for determining annual operation is defined as follows:
It is classified as mixed integer linear programming (MILP) and has binary variables to describe battery charge and discharge states. Its time resolution is 30 min based on the market time slots.
The electrolyzer capacity factor is defined as (19) using .
T denotes the number of time slots in the optimization. The denominator of shows the maximum possible amount of hydrogen produced. The maximum of is 1 when the electrolyzer always works at its maximum input. The minimum hydrogen cost can be identified by sweeping or the capacity factor of the electrolyzer.
3.4. Hydrogen Cost Evaluation
The hydrogen production is evaluated by the levelized cost of hydrogen (LCOH), defined as (20). It includes the capital expenditure (CAPEX) and operating expenses (OPEX) as present values, divided by the total hydrogen amount. r denotes the annual discount rate, and K denotes the project year. The subscript k denotes the value in the k-th year. OPEX can be decomposed into the fixed part and variable part, as shown in (21).
In this paper, CAPEX means capital and replacement costs of the electrolyzer and the battery. The fixed OPEX includes operation and management (O&M) costs of the electrolyzer and the battery () and wheeling fixed charge (), as shown in (22). The variable OPEX is the electricity costs to produce hydrogen, that is, the hydrogen variable costs. They include market procurement costs, wheeling variable charges, renewable energy charges, and non-fossil certificate costs. They are decided by the optimized operation, as shown in (23).
In (23), and are the optimized market procurement and expected imbalance compensation in the retailer’s balancing group at slot t. is the unit cost of market electricity, including the day-ahead market price, wheeling variable charge, renewable energy charge, and non-fossil certificate price. is the unit cost applied to compensated positive imbalances, including the wheeling variable charge and renewable energy charge.
The retailer pays wheeling fixed charges every month, as shown in (24). They are proportional to the sum of rated outputs [] of the electrolyzer () and the battery (). denotes the monthly wheeling fixed price []. The time resolution of the optimization problem is 30 min, so the equations and hold. In this paper, all elements of OPEX are assumed to be constant in project years.
4. Result
4.1. Case Study Setting
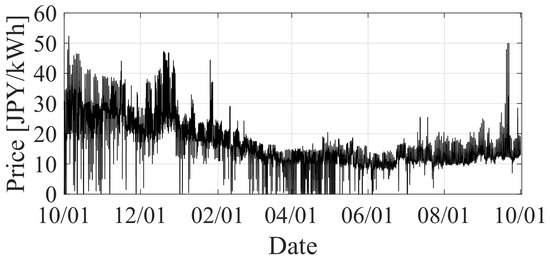
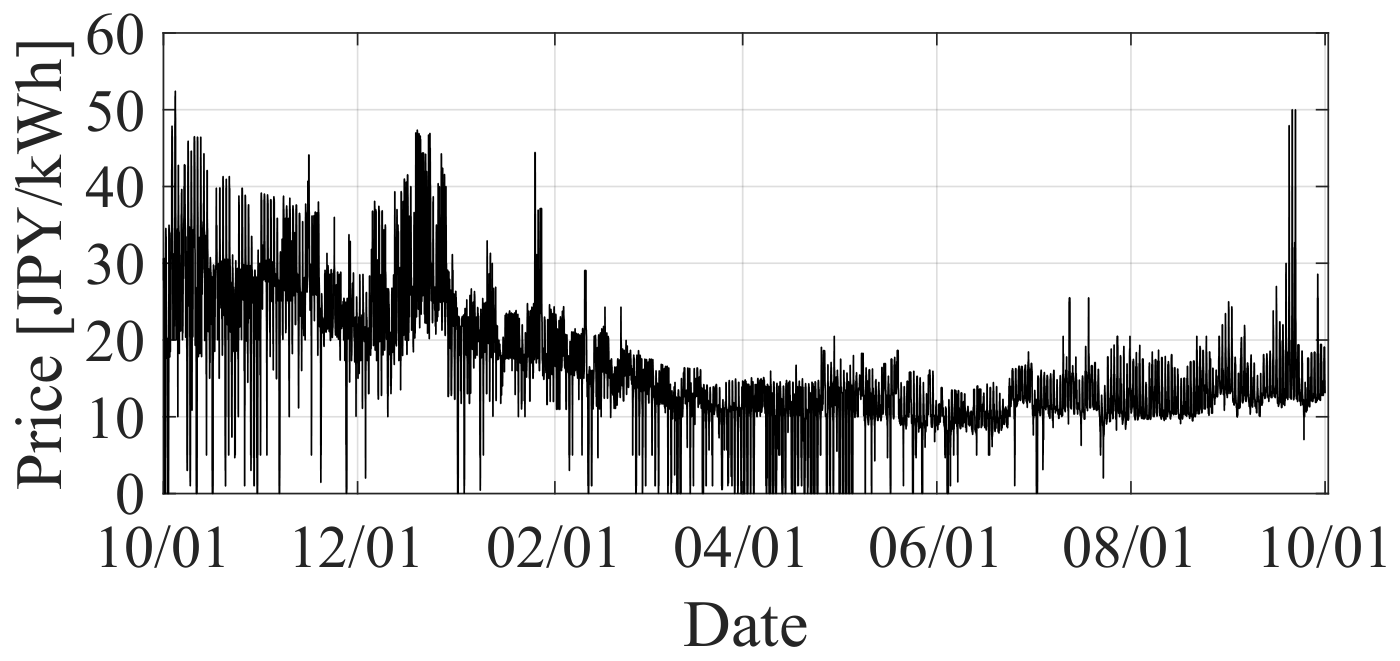
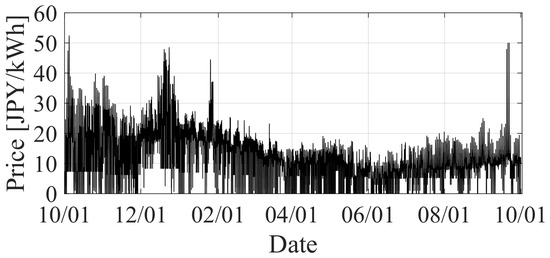
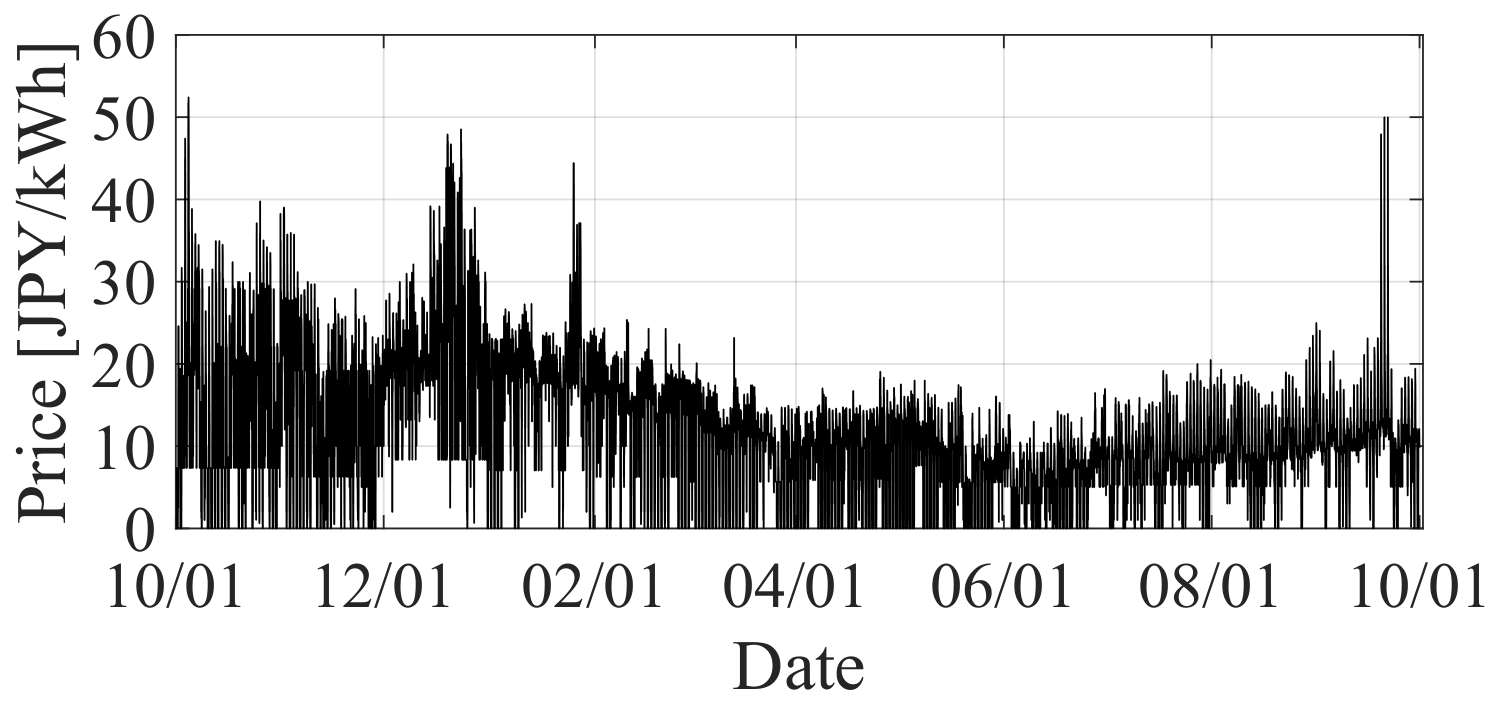
This paper simulates the electrolyzer and battery operation to produce carbon-free hydrogen at an acceptable cost. In the case study, the retailer has solar power plants, an electrolyzer, and a battery in the Tokyo region, Japan. The electrolyzer and battery receive electricity at an extra-high voltage. The solar generation profile is based on the actual data from Gunma Prefecture, Japan from 1 October 2022 to 30 September 2023. Its nominal capacity is 63.21 MW on the DC side and 42.82 MW on the AC side. Its capacity factor is 14.83% based on the nominal capacity on the DC side. This paper uses the day-ahead market prices in the Tokyo region from 1 October 2022 to 30 September 2023. Figure 5 shows the market prices in the case study [42]. They rise in the winter and sometimes reach the bottom (0.01 JPY/kWh) in the spring.
Figure 5.
Day-ahead electricity market prices in the Tokyo region from October 2022 to September 2023.
Water electrolysis technologies include alkaline, polymer electrolyte membrane (PEM), solid oxide, and anion exchange membrane (AEM) electrolysis [43]. Alkaline electrolysis is the most mature technology and offers lower capital costs, longer lifetimes, and larger plants. PEM electrolysis has a wide operational range and a rapid response [41]. Solid oxide electrolysis operates at high temperatures and has high efficiency. AEM electrolysis has a simple structure without precious materials [43]. However, solid oxide and AEM electrolysis have challenges with capital costs, lifetimes, and maturity [21,43,44]. Imbalance compensation does not require a fast response because imbalances are calculated in 30 min intervals. Thus, this paper chooses alkaline electrolysis because of lower capital costs and large-scale applications.
Table 3 shows the time-invariant parameters. The electrolyzer unit cost is based on the 2030 target [18,45]. The efficiency is the hydrogen produced per electricity input, including compression. This paper assumes a 73.3% efficiency based on the higher heating value of hydrogen. This value is higher than the actual system [44]. The electrolyzer minimum input is 15% of its rated input [46,47]. The battery capital cost is based on the 2030 target, less than one-third of the current cost (186,000 JPY/kWh) [48]. A preliminary analysis was conducted to determine the battery size that minimizes the LCOH. The equipment lifespan is assumed based on [49]. Hence, the electrolyzer and battery are replaced in the tenth year. Their replacement costs are the same as their capital costs. The wheeling charges are based on actual values of extra-high-voltage service in the Tokyo region from April 2023 to March 2024. The renewable energy charge is based on actual values from May 2023 to April 2024. The price of non-fossil certificates is based on trading data from 2023 [50].
Table 3.
Values of parameters in the optimization.
The optimization problem is solved by the “intlinprog” function with the “legacy” algorithm in the Optimization Toolbox of MATLAB R2024b [51]. The program was executed on a laptop PC with AMD Ryzen 7 8840U @ 3.30 GHz, 16.0 GB RAM @ 6400 MT/s. It took 20 min to solve one problem on a battery-powered laptop PC.
4.2. Variable Cost Comparison
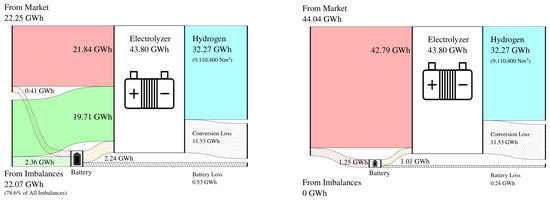
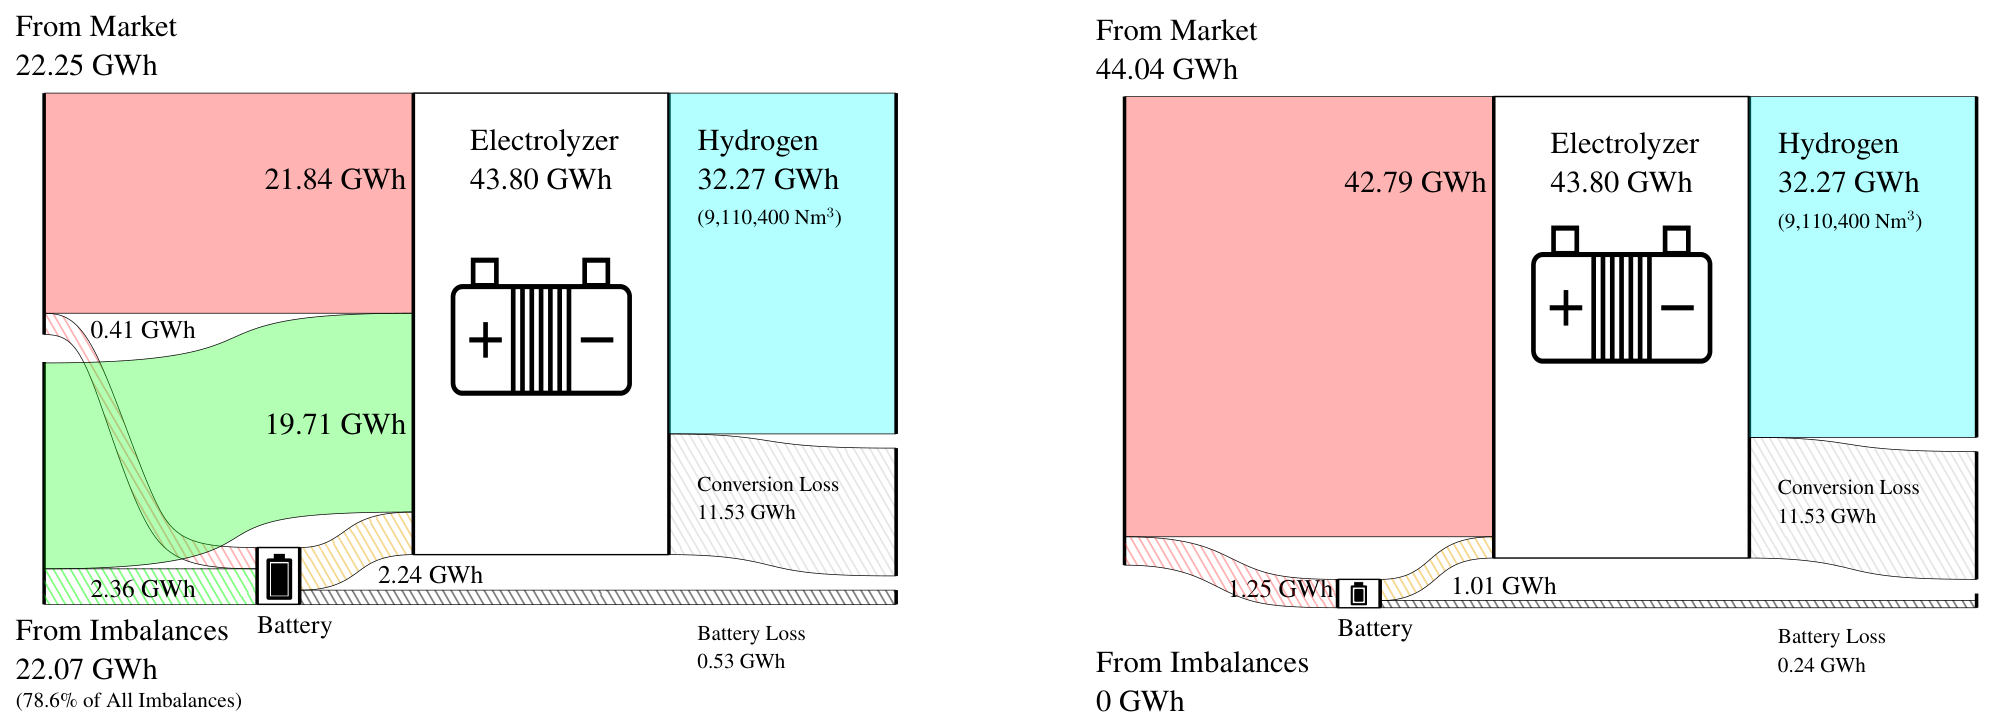
First, hydrogen variable costs are compared between cases with and without positive imbalance compensation. The case with compensation is referred to as the market and compensation case, whereas the case without compensation is referred to as the market-only case. The capacity factor of the electrolyzer is 50%. Figure 6 shows the annual energy flows, and Table 4 shows the hydrogen costs in both cases. In the market and compensation case, the LCOH is 60.95 JPY/Nm3, and its variable part accounts for 73%. Compared to the market-only case, the LCOH decreases by 30%. The electrolyzer and battery can compensate for around 75% of the positive imbalances at the expected value. As a result, half of the electricity comes from imbalance compensation. However, the market procurement costs are six times higher than those of imbalance compensation. In conclusion, compensation for positive imbalances decreases hydrogen costs.
Figure 6.
Annual energy flows with a 50% capacity factor of the electrolyzer. (Left): Market & compensation; (Right): Market-only.
Table 4.
Hydrogen costs with a 50% capacity factor of the electrolyzer. LCOH means the levelized cost of hydrogen.
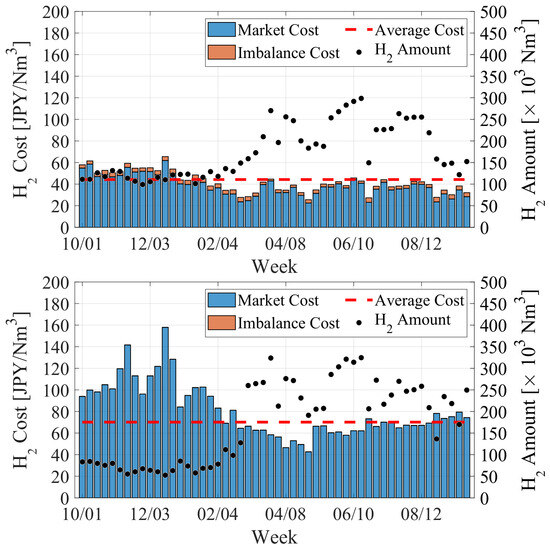
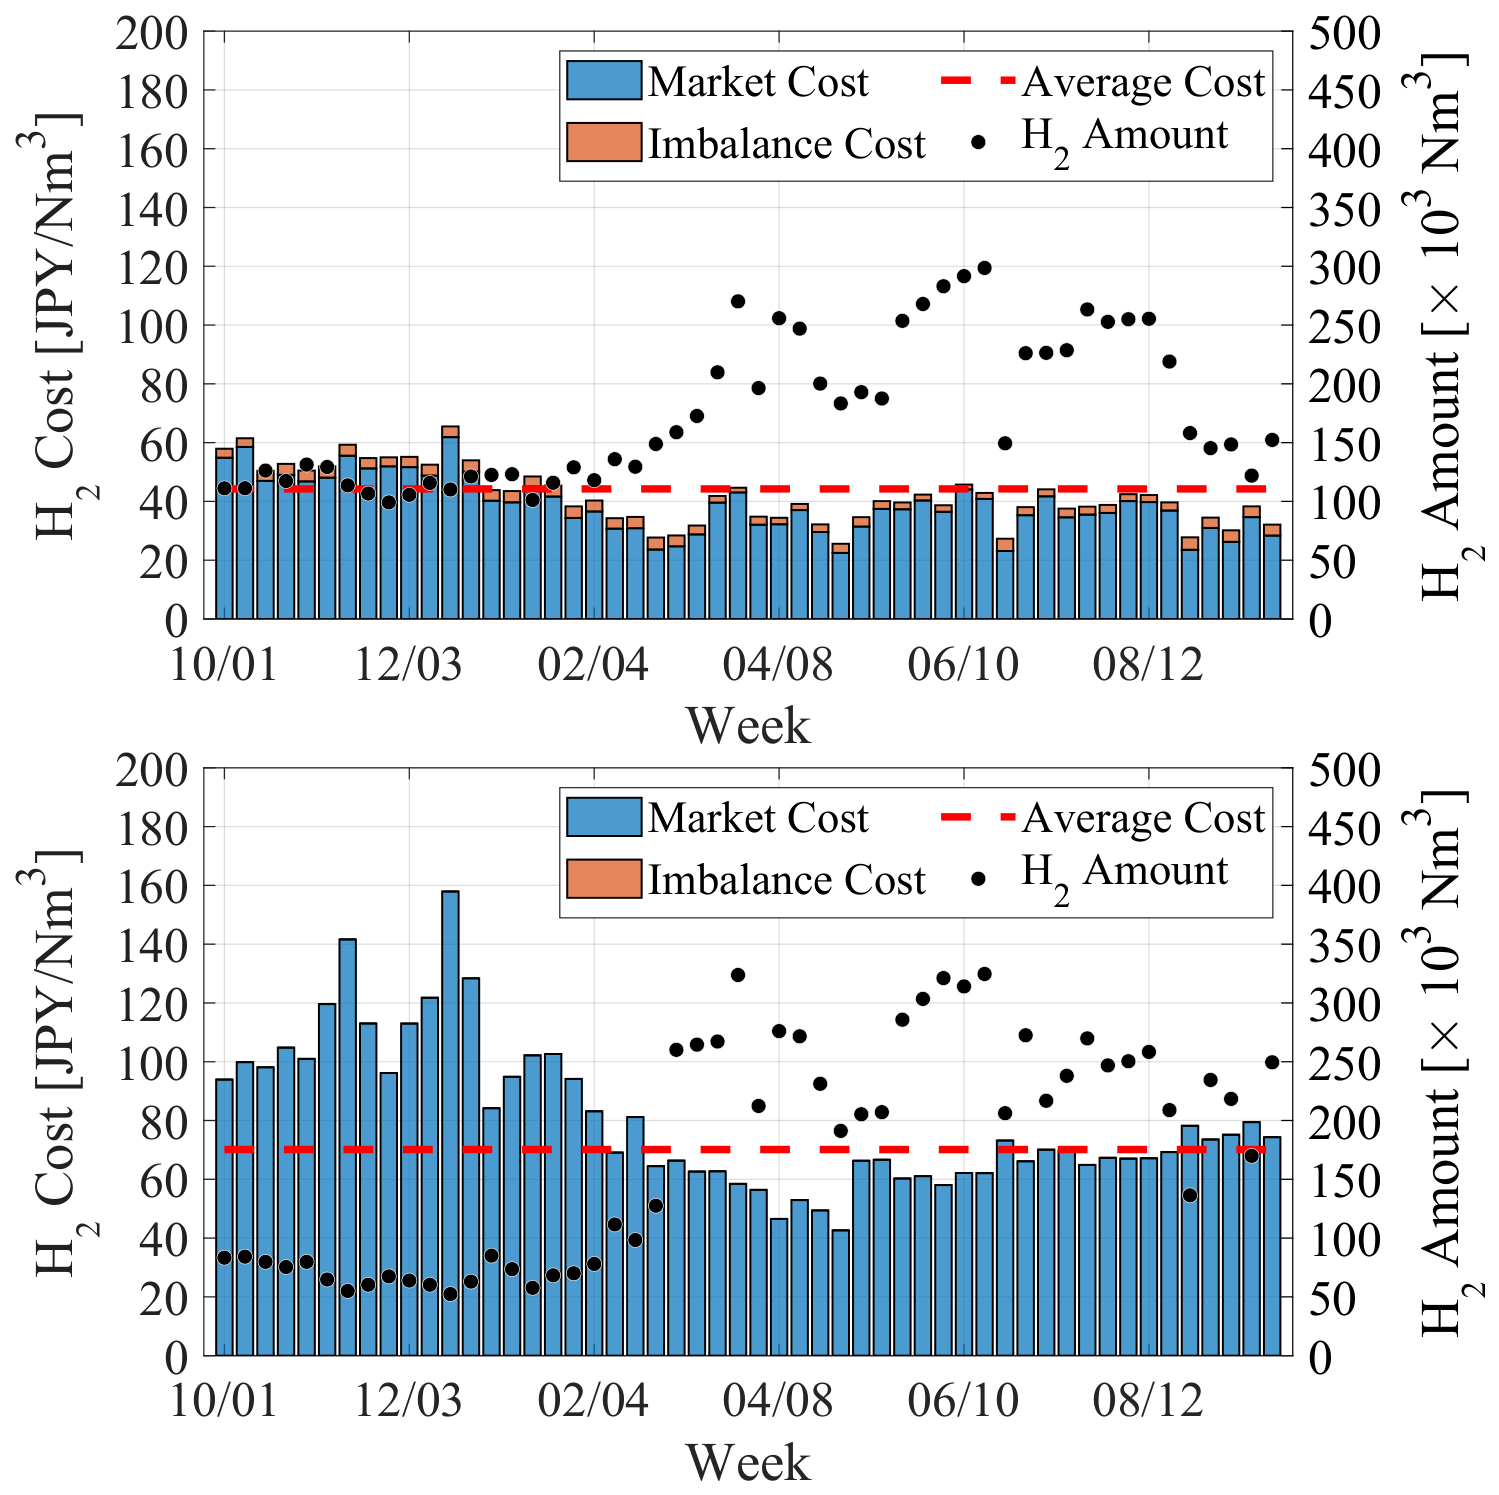
Figure 7 shows the hydrogen variable costs and the hydrogen amounts each week in both cases. Each bar shows the hydrogen variable costs in a week. The hydrogen amounts differ weekly because the electrolyzer uses more electricity at lower market prices. Thus, fluctuation of the amount follows the market prices in Figure 5 in reverse. The weekly cost distribution is narrower (20–60 ) in the market and compensation case than the market-only case (40–160 ) because compensation reduces the market dependence. In other words, imbalance compensation gives an option to avoid procuring expensive electricity from the market.
Figure 7.
Variable costs and amounts of hydrogen each week, with a 50% capacity factor of the electrolyzer. (Upper): Market & compensation; (Lower): Market-only.
4.3. Electrolyzer and Battery Operation
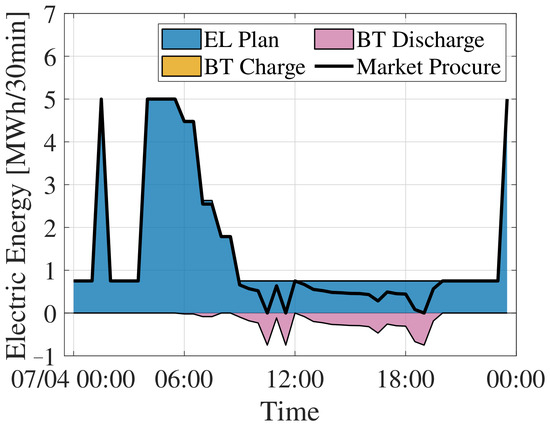
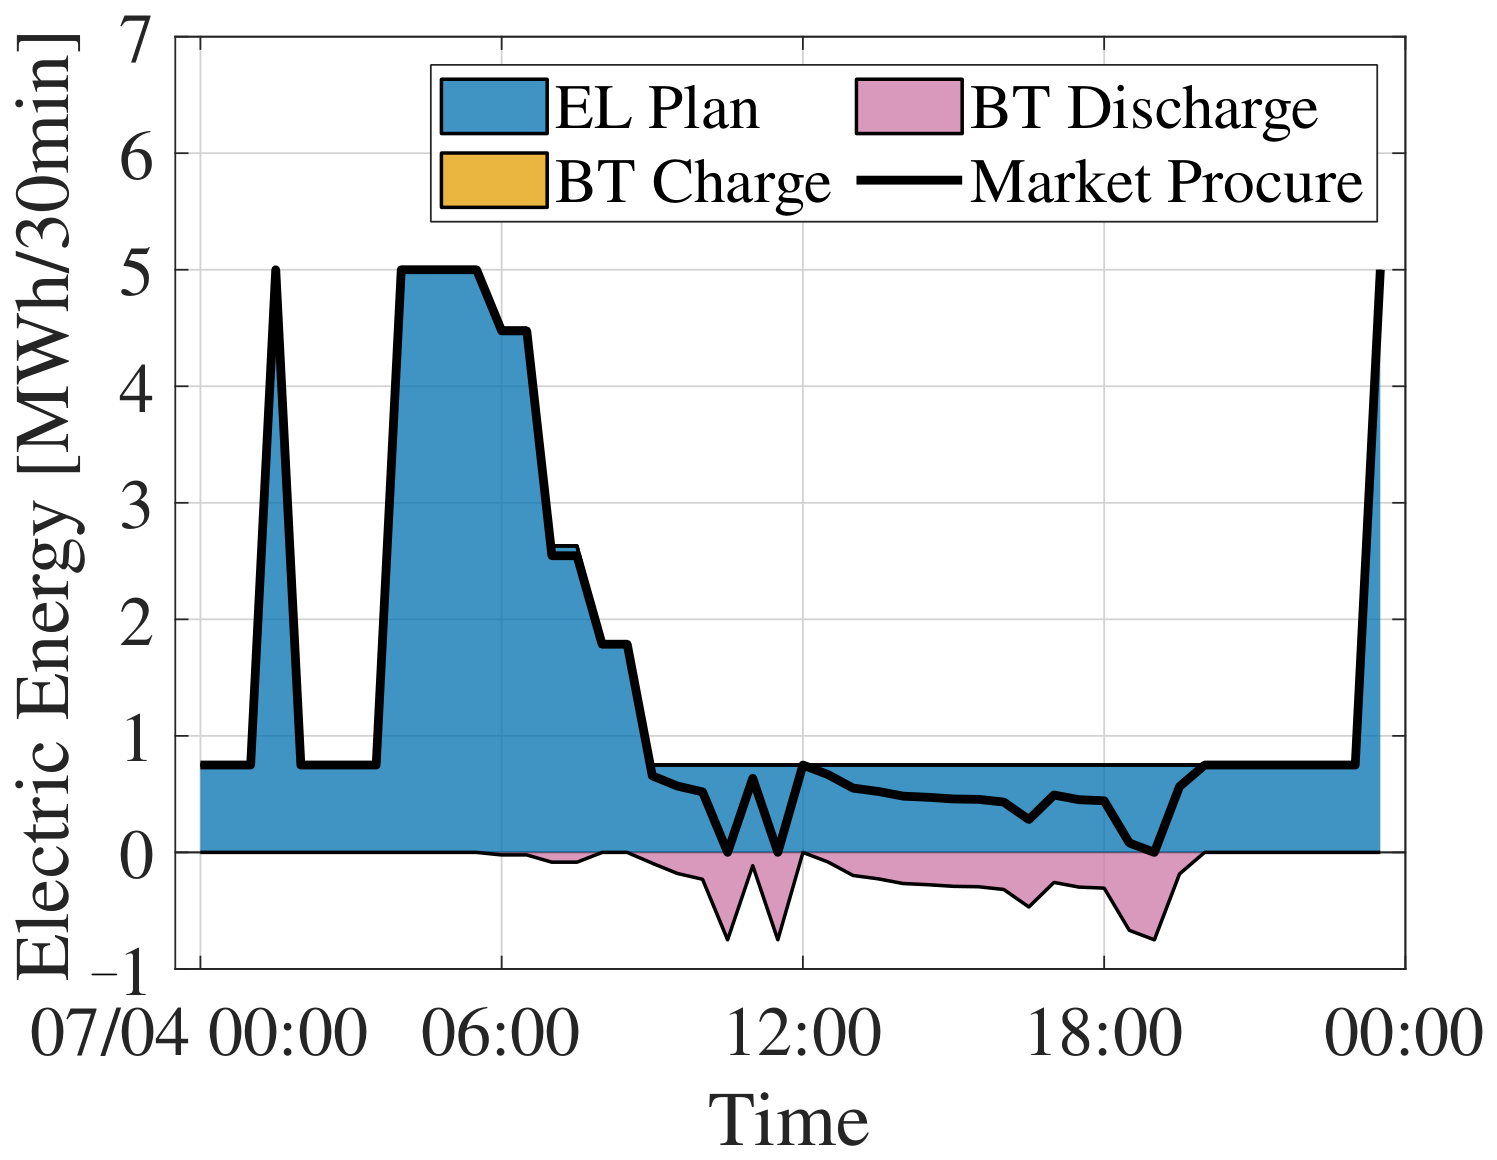
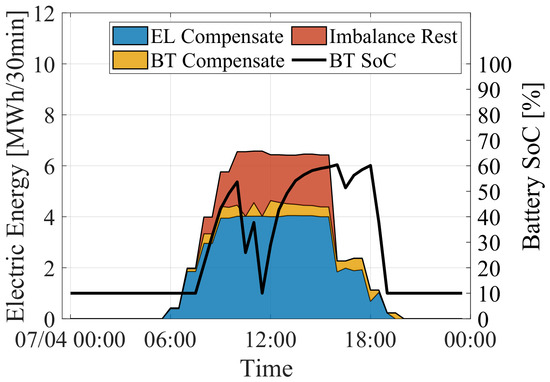
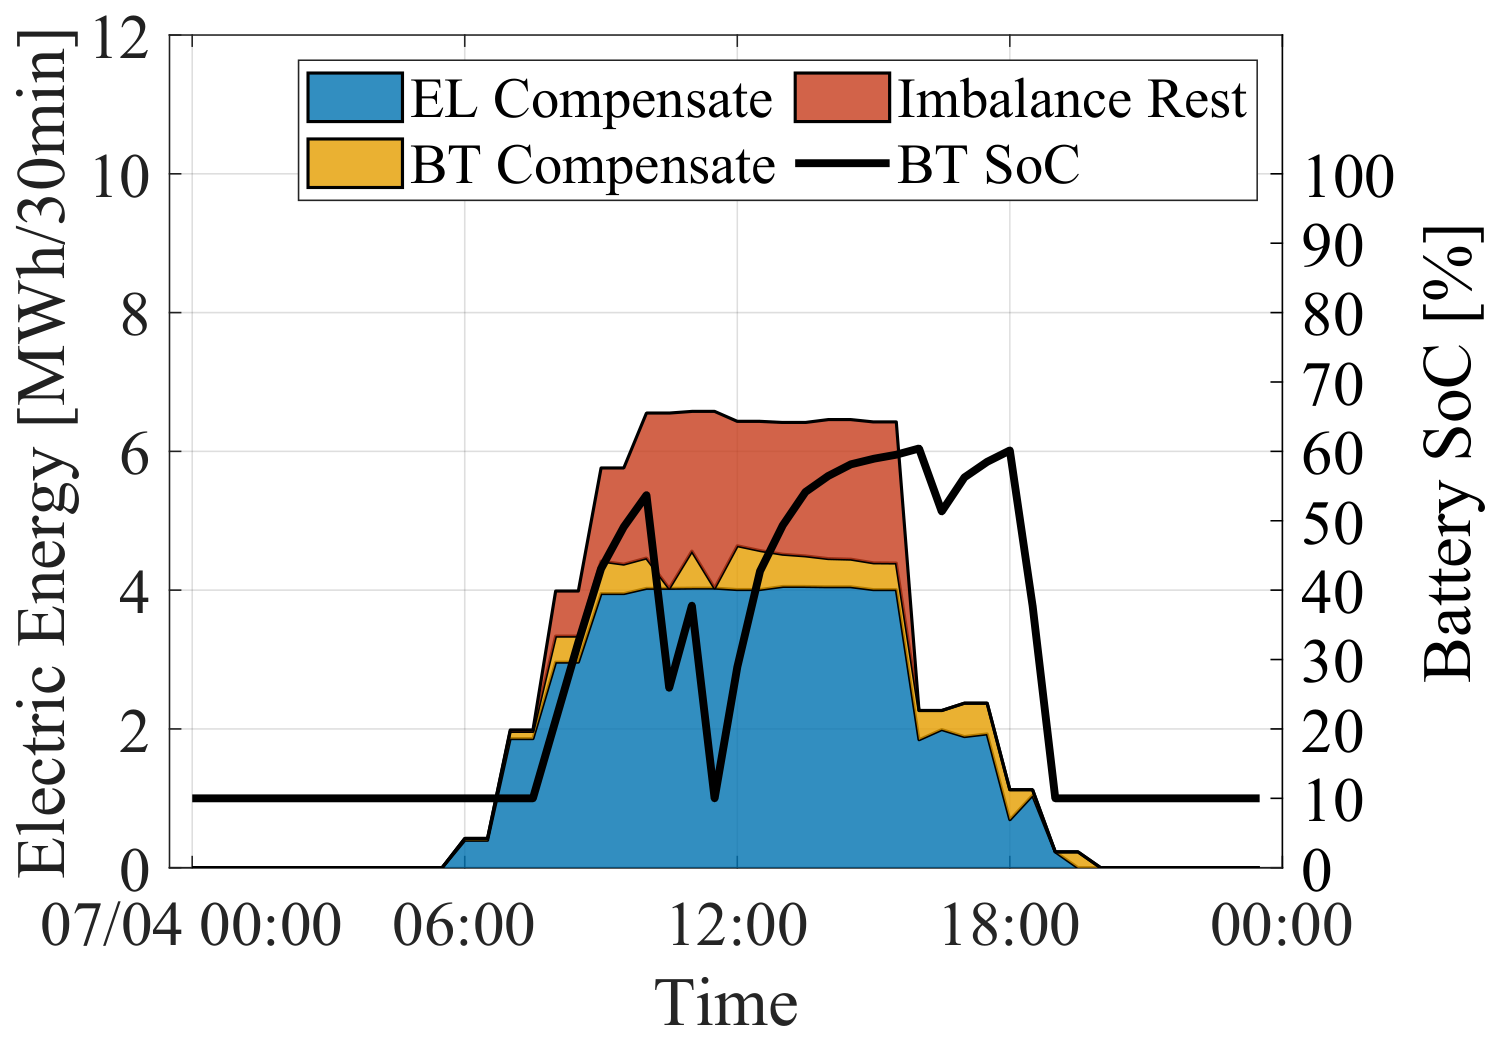
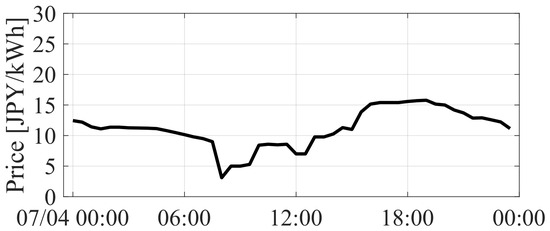
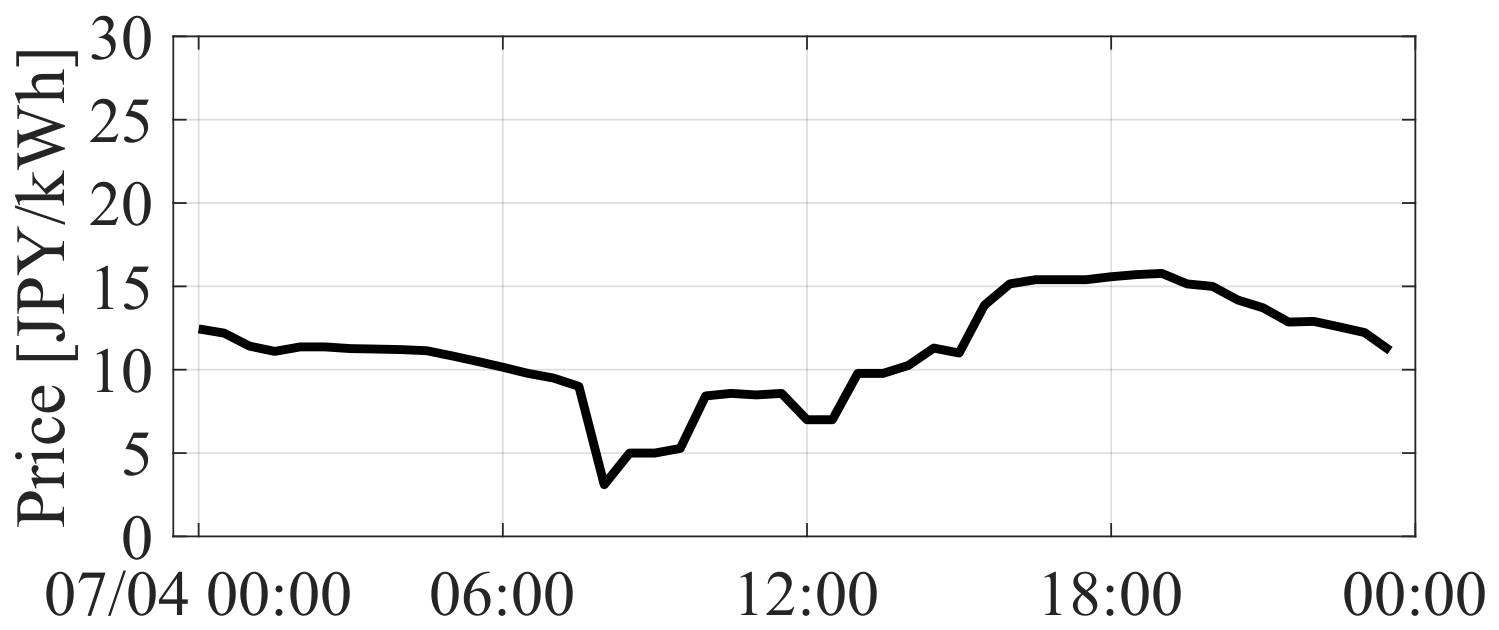
Next, this paper investigates the operation of the electrolyzer and battery using a summer day as an example. The capacity factor of the electrolyzer is 50%. Figure 8 and Figure 9 show the day-ahead planned operation and the real-time compensation as the expected value, respectively. The planned electricity is procured from the market. The compensated electricity originates from positive imbalances. Figure 10 shows the market prices on that day. The electrolyzer uses electricity from the market actively in the morning because of the lower prices. In contrast, it mainly compensates for the positive imbalances in the daytime. At the same time, the electricity from the market meets the lower limit of the electrolyzer input. The battery mainly compensates for the positive imbalances. It discharges intermittently so that its state-of-charge does not reach the upper limit. This discharge also contributes to reducing market procurement, especially in the evening, when the market prices rise.
Figure 8.
Daily planned operation, with a 50% capacity factor of the electrolyzer. Negative values show discharge from the battery to the electrolyzer.
Figure 9.
Daily real-time compensation for imbalances, with a 50% capacity factor of the electrolyzer. The area shows the expected value across imbalance scenarios.
Figure 10.
Day-ahead electricity market prices of the Tokyo region in a summer day.
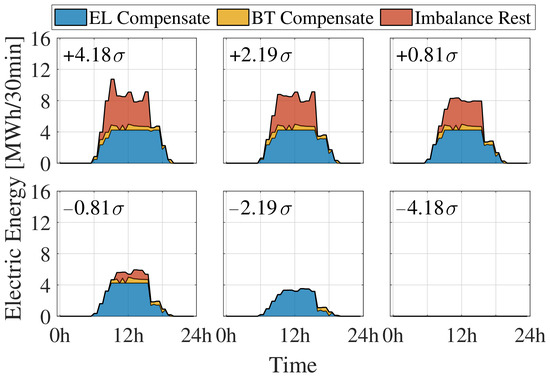
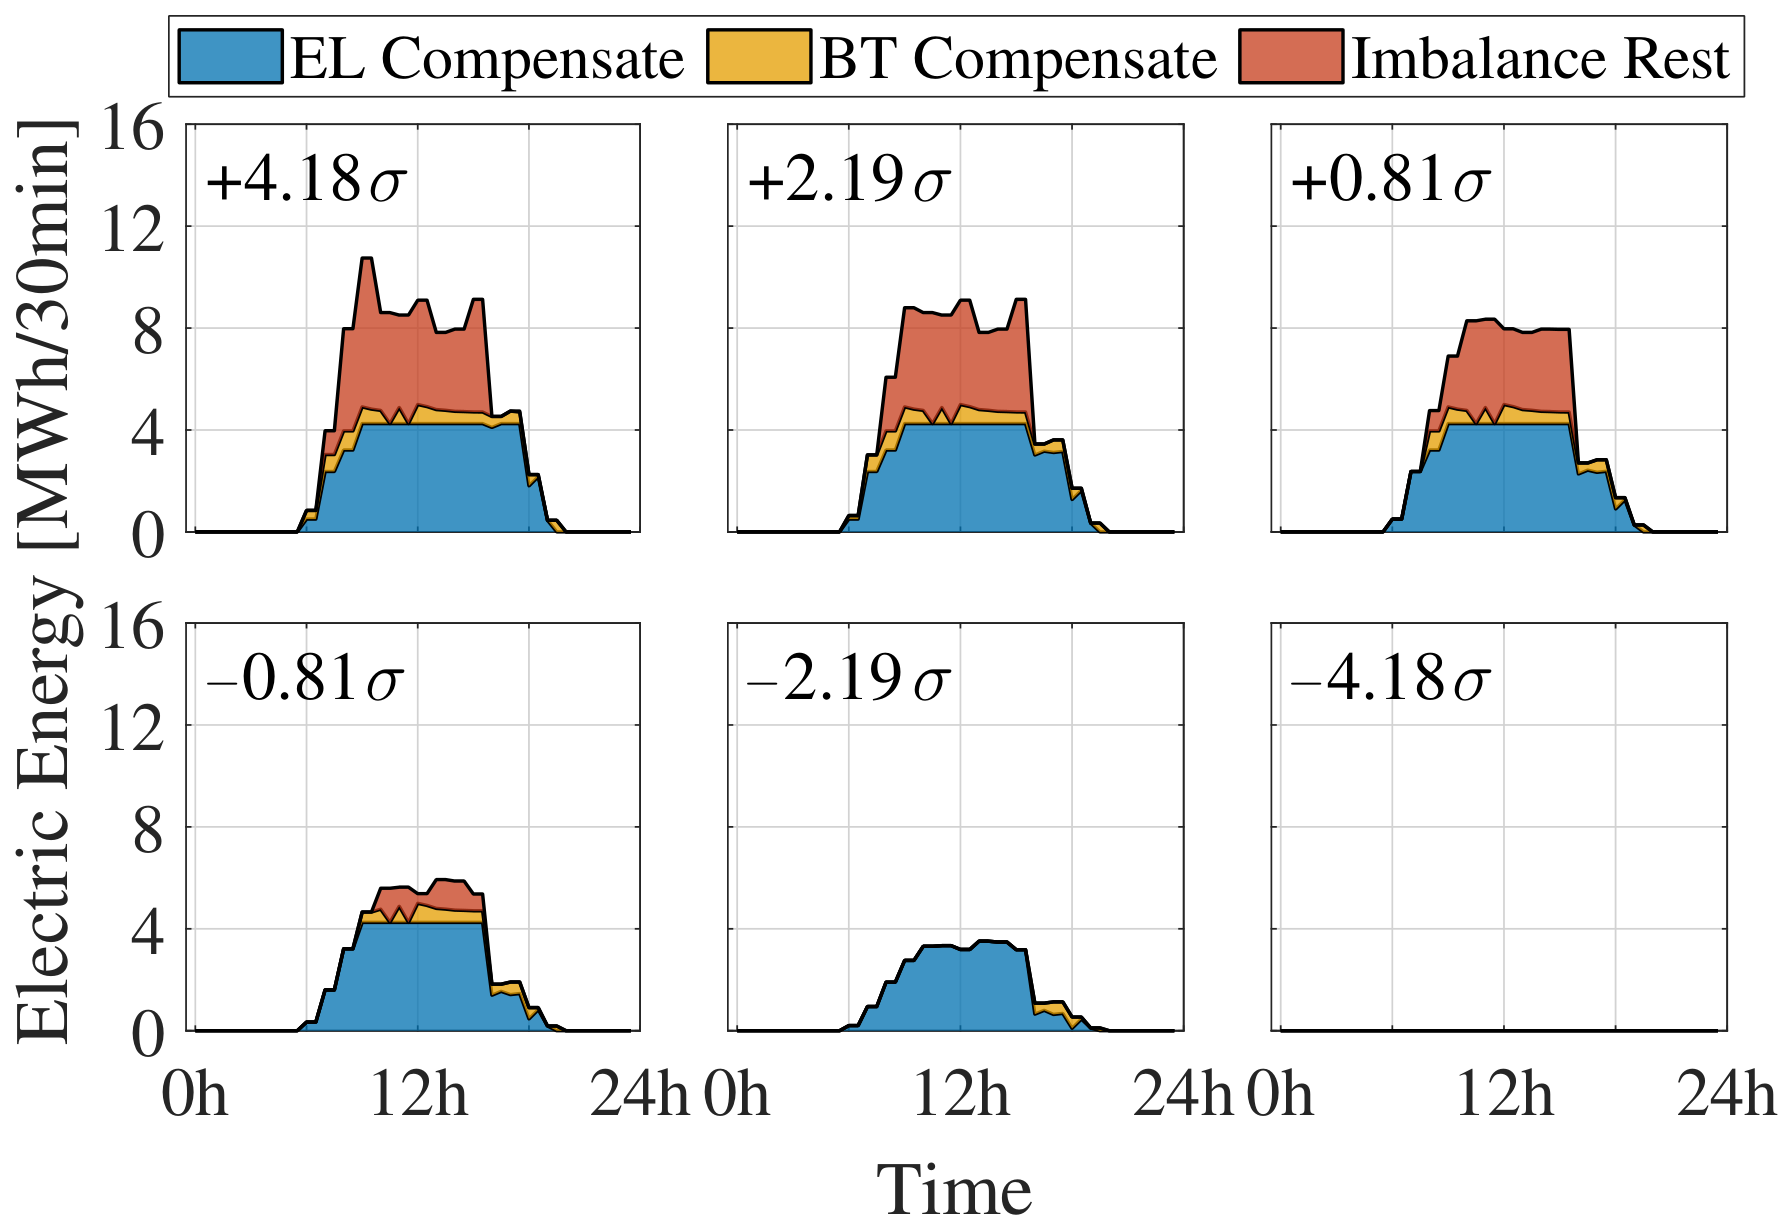
The electrolyzer uses not only the positive imbalances but also electricity procured from the market because the positive imbalance amount is uncertain. Figure 11 shows the daily real-time compensation in each scenario. Regardless of the scenario, the electrolyzer compensates with less than its maximum input (5 MWh/30 min). This is because the market procurement meets its minimum input (0.75 MWh/30 min) to prepare for sunless situations. As a result, the electrolyzer cannot use their full capacity for imbalance compensation. In the scenario when the forecast error equals in Table 1, the electrolyzer and battery compensate for all the positive imbalances. As the positive imbalances increase, compensation for all imbalances is no longer possible. When the forecast errors are between and , some imbalances remain. This demonstrates that the electrolyzer and battery compensate using its full capacity with a probability of 50% or more.
Figure 11.
Daily real-time scenario-wise compensation for imbalances, with a 50% capacity factor of the electrolyzer. The text in the upper left of each figure denotes a forecast error in the scenario.
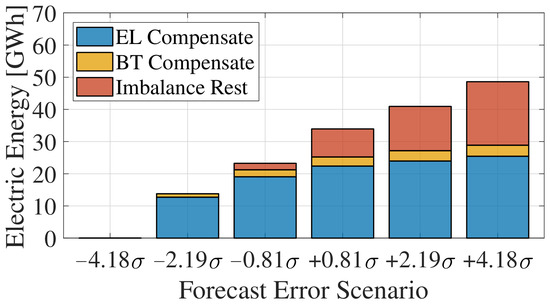
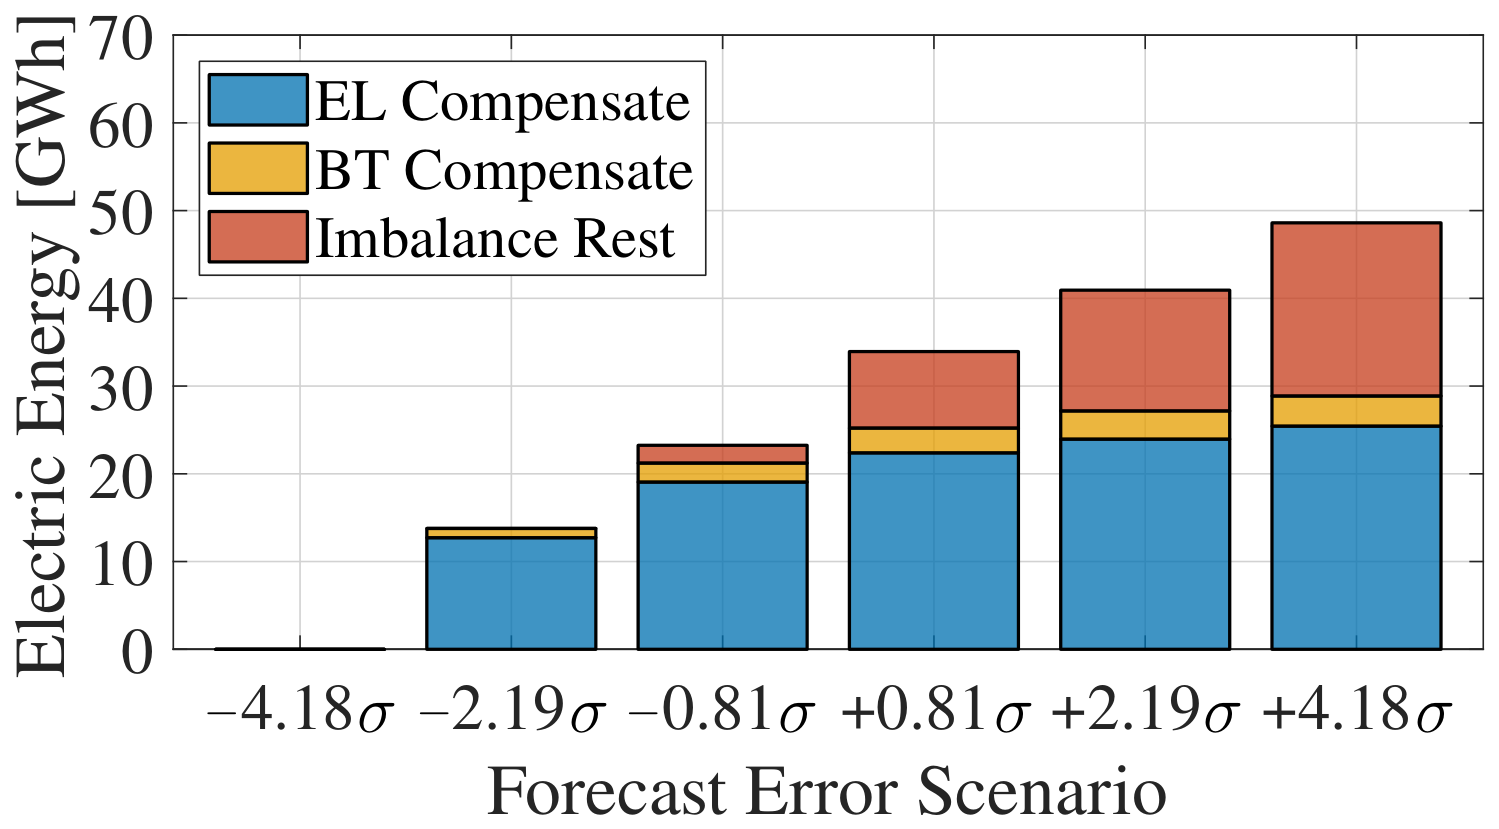
Figure 12 shows the annual compensation amount and the remaining imbalances. The electrolyzer and battery compensate for all of the positive imbalances in the scenario where forecast errors are . In the scenarios where the forecast errors are equal to or greater than , compensation ranges from 20 GWh to 30 GWh. However, compensation amounts are saturated under the large imbalances because of the equipment size, as shown in Figure 11.
Figure 12.
Annual compensation amount and remaining imbalances in each scenario.
4.4. Sensitivity Analysis
4.4.1. Hydrogen Production Amount
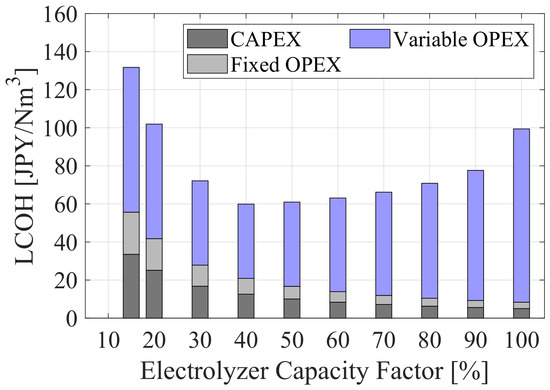
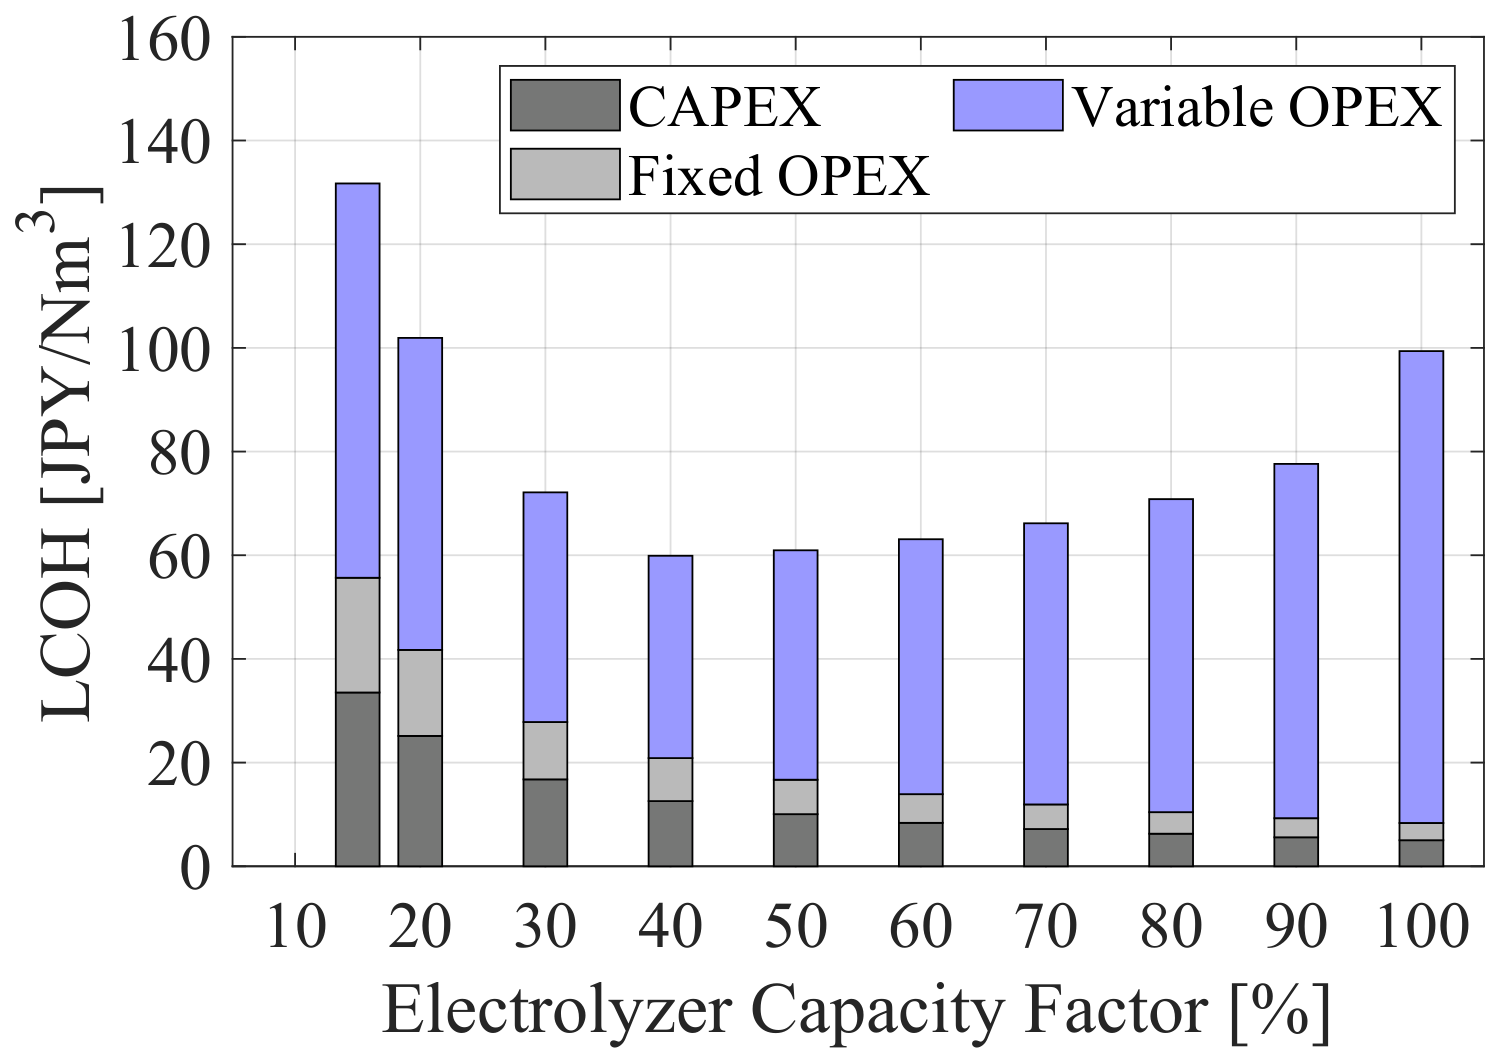
The annual amount of hydrogen affects the operation and LCOH. This paper investigates the optimal amount of hydrogen through sensitivity analysis. Figure 13 shows the parts of LCOH when changing the capacity factor of the electrolyzer. The CAPEX part and fixed OPEX part decrease as the capacity factor increases because more hydrogen is produced. In contrast, the variable OPEX part reaches a minimum at a 40% capacity factor. The minimum LCOH is around 60 JPY/Nm3 at a 40% capacity factor. LCOH slightly increases from 40% to 80% capacity factors but remains below 70 JPY/Nm3 over this range.
Figure 13.
Parts of levelized costs of hydrogen (LCOH) when changing the capacity factor of the electrolyzer.
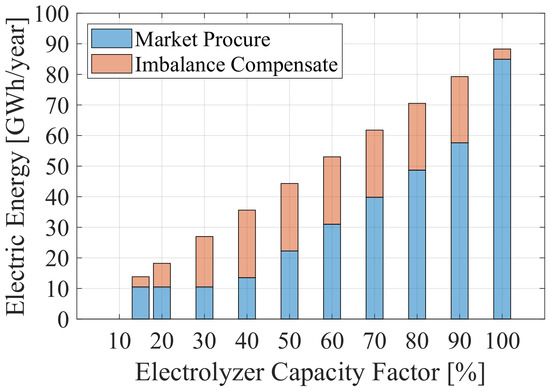
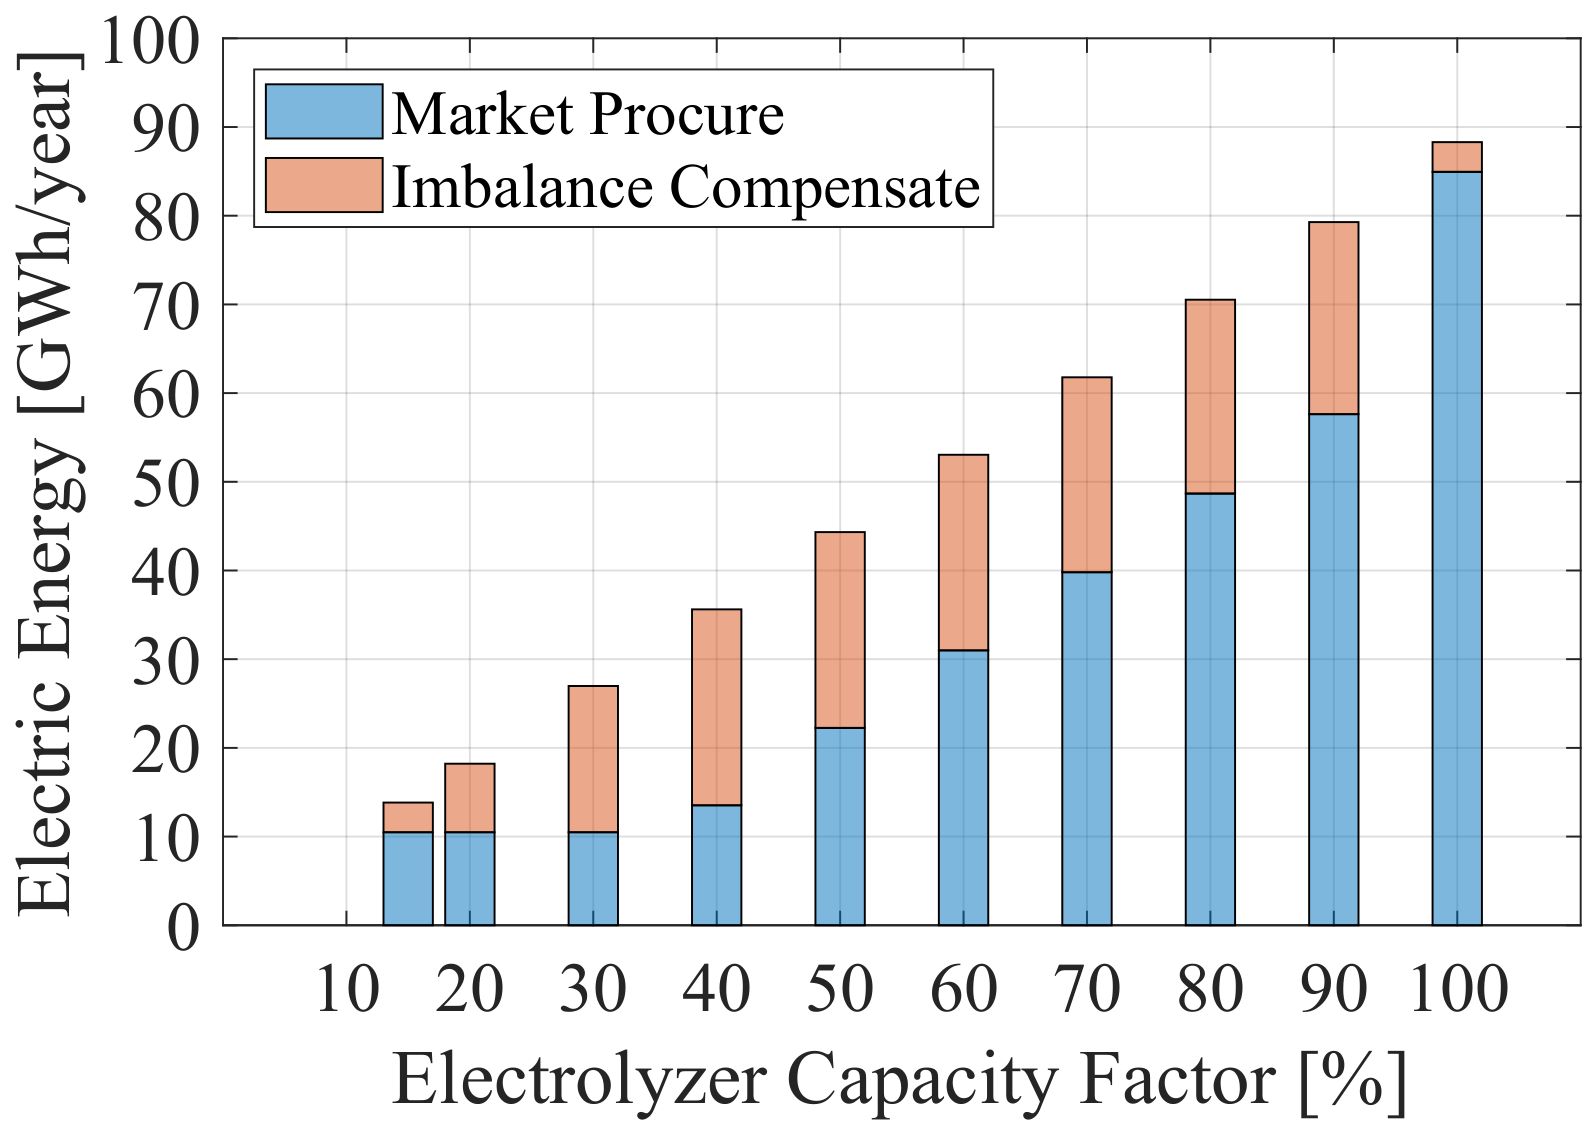
The variable OPEX has the minimum value because of the balance between imbalance compensation and market procurement. Figure 14 shows the amount of electricity from the market and compensation when changing the capacity factor of the electrolyzer. Compensation increases from 15–40% capacity factors and peaks (22.09 GWh) at 40%. Between 40–90%, the compensation amount is saturated with around 20 GWh. In this range, market procurement increases monotonically as a capacity factor rises.
Figure 14.
Electricity amounts when changing the capacity factor of the electrolyzer. The positive imbalances are expressed as expected values across imbalance scenarios.
The relation between LCOH and capacity factors forms a concave curve. One reason is that higher capacity factors reduce the CAPEX and fixed OPEX effects. The other reason is that expensive electricity highly affects LCOH around the minimum and maximum capacity factors. Although lower capacity factors result in lower electricity costs, the electrolyzer must keep its minimum input by procuring electricity regardless of its price. With the small amount of hydrogen, the impact of expensive electricity becomes significant. In contrast, with the larger capacity factor, the retailer must procure more electricity because of the saturated compensation. Thus, the electrolyzer inevitably uses expensive electricity more. In addition, the electrolyzer hardly compensates around the minimum and maximum capacity factors. Hence, LCOH rises at both low and high capacity factors.
In contrast, LCOH rises within 10% between 40–70% capacity factors. For example, a 60% capacity factor results in around 5% higher LCOH than that of 40% but produces 50% more hydrogen. Thus, the LCOH demonstrates a relatively low sensitivity to the hydrogen amount at the middle range of capacity factors.
To validate the results, this study compares the obtained LCOH with previous studies focusing on hydrogen production in Japan. Zhang et al. [52] reported hydrogen costs ranging from 23.7 JPY/Nm3 to 43.7 JPY/Nm3 using an off-grid system with optimally sized renewable generation, battery, and electrolyzer. Zhu et al. [53] reported a hydrogen cost of 42.9 JPY/Nm3 in Kyushu using a combination of renewable energy and grid electricity. Compared to these studies, the LCOH obtained in this study is higher (around 60 JPY/Nm3). This difference mainly arises from the system assumptions. While previous studies consider systems directly coupled with renewable energy sources, this study incorporates market procurement, imbalance compensation, and grid-related charges. In addition, the lower LCOH values in previous studies [52,53] are partly attributable to differences in system-boundary assumptions, including low costs of private transmission-lines and renewable generation assets. Therefore, the results of this study provide a more practical estimation of hydrogen production costs under real power business conditions.
4.4.2. Electrolyzer Size
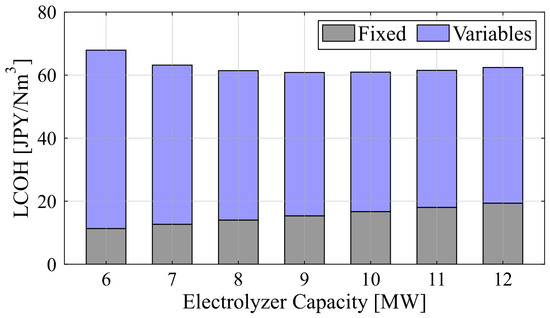
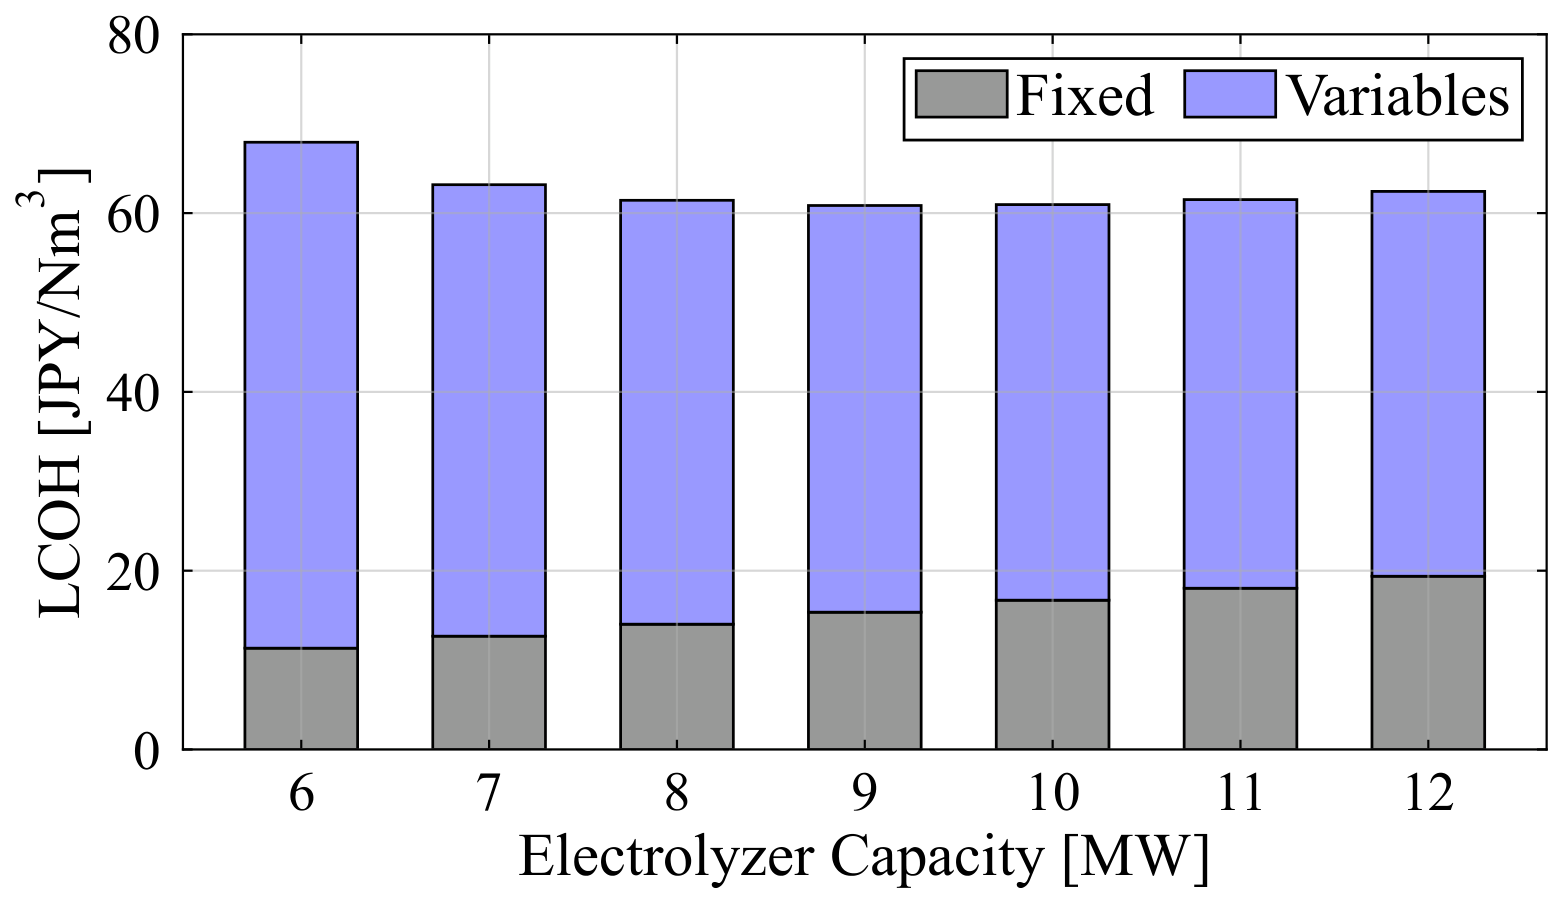
The electrolyzer capacity affects both the hydrogen production costs and the imbalance compensation. To discuss the influence of system sizing, this paper compares the LCOH under different electrolyzer capacities. The annual hydrogen production amount is fixed to 9.11 × 10⁶ . The other settings are the same as in the base case. The electrolyzer capacity is varied from 6 MW to 12 MW.
Figure 15 shows the LCOH under different electrolyzer capacities. The variable costs decrease as the electrolyzer capacity increases because the larger electrolyzer can compensate for more imbalances. In contrast, the fixed costs increase because of the higher capital and fixed operational costs of the electrolyzer. Thus, the total LCOH reaches a minimum around 8–10 MW. Although this paper does not optimize the equipment size itself, the sensitivity analysis demonstrates that the proposed method maintains its economic advantage within a practical range of electrolyzer capacities.
Figure 15.
Comparison of LCOH under different electrolyzer capacities with the same production amount of hydrogen (9.11 × 10⁶ ).
4.4.3. Market Prices
The hydrogen variable costs and the electrolyzer operation strongly depend on electricity prices. Electricity prices consist of time-variant terms (market prices) and time-invariant terms (wheeling variable charge, renewable energy charge, and non-fossil certificates). This paper analyzes the sensitivity of hydrogen variable costs to market prices. In all cases below, the capacity factor of the electrolyzer is fixed to 50%.
Five cases are set using different annual market prices. Table 5 shows the price settings in each case. The other parameters are the same as in the case study.
Table 5.
Market price settings in each sensitivity analysis case.
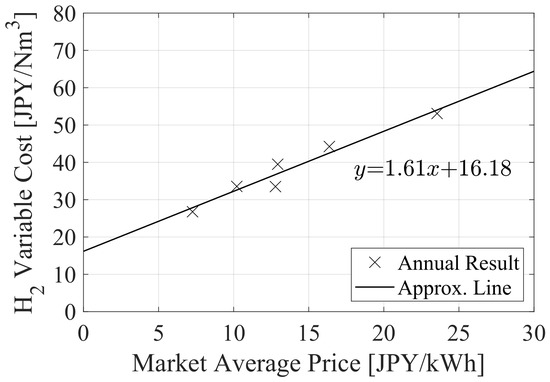
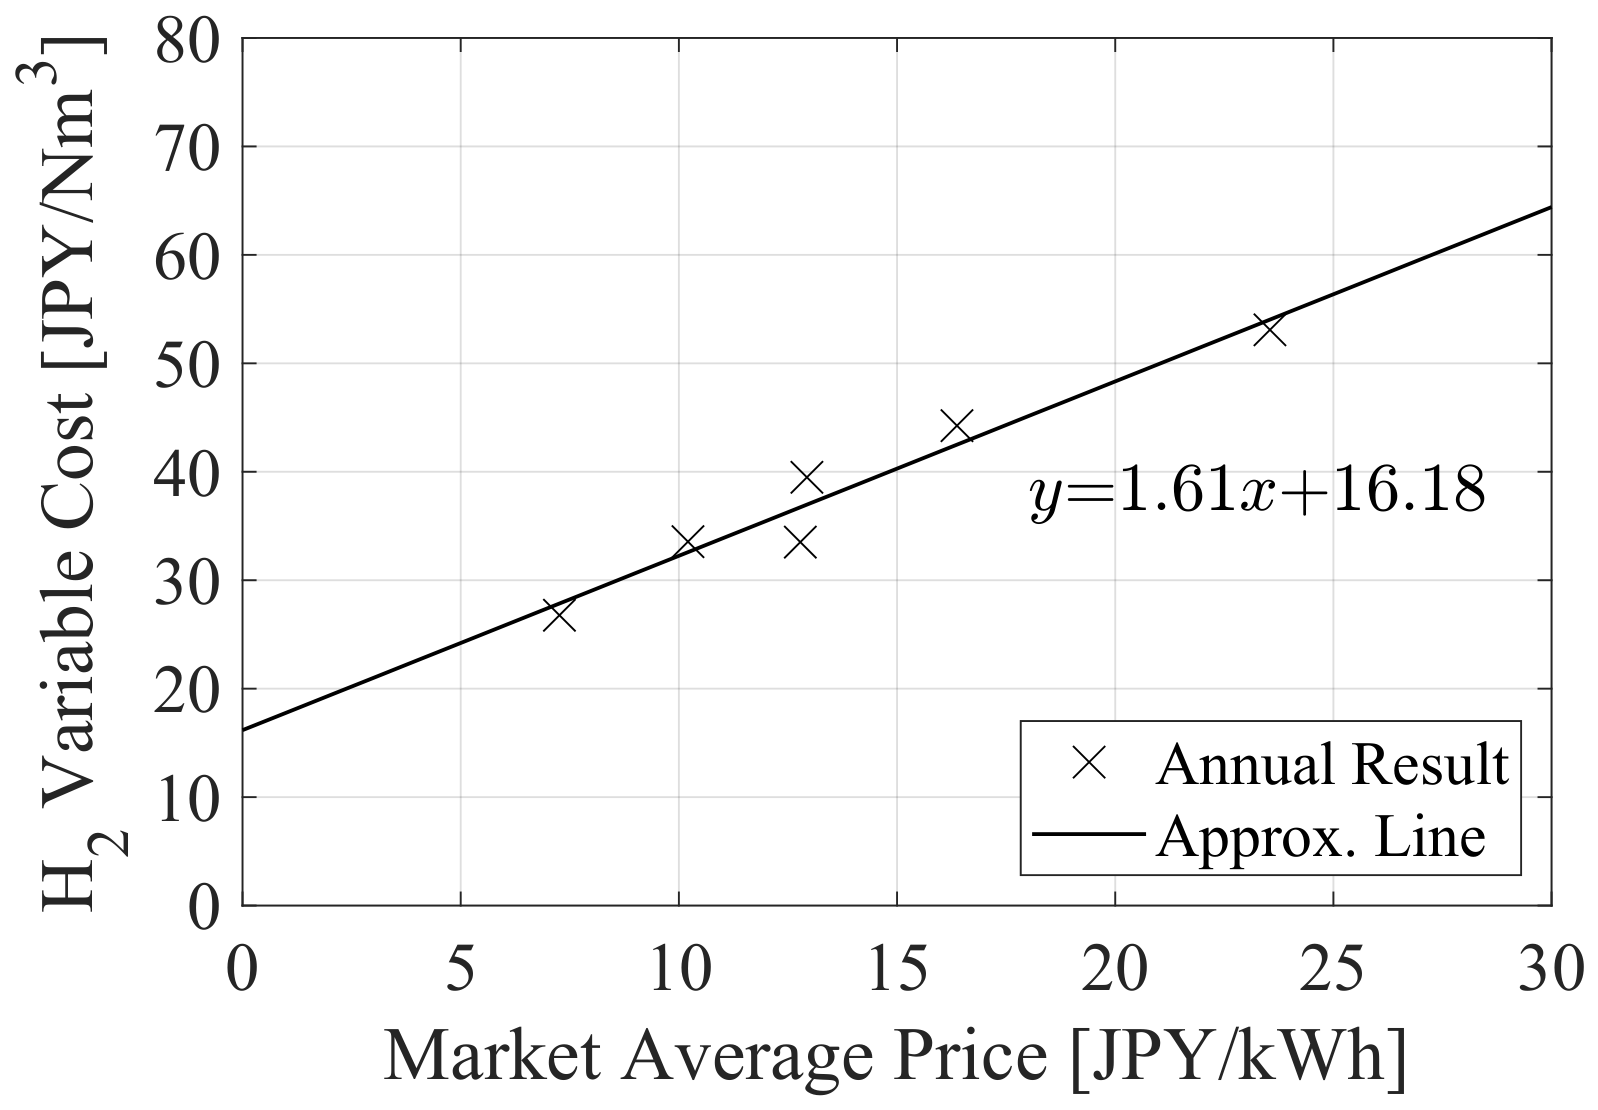
Hydrogen variable costs are highly related to market prices because the electrolyzer must use electricity from the market. Figure 16 shows the relation between the market annual average prices and the hydrogen variable costs. A black line describes a linear approximation whose coefficient of determination is 0.95. Thus, hydrogen variable costs are related strongly and positively to the market annual average prices. The slope of the line indicates the sensitivity of hydrogen costs to the average prices. It is less than half the electrolyzer efficiency (4.81 kWh/Nm3). One reason is that the electrolyzer uses positive imbalances in around half of its annual input. Thus, imbalance compensation alleviates an increase in the market average price. The other reason is that the electrolyzer uses electricity from the market mainly at lower prices. As a result, the market average prices have less effects on hydrogen variable costs than expected from the electrolyzer efficiency. The intercept of the line is around 16.2 JPY/Nm3. It describes the prices independent of the market price, such as the wheeling variable charge, renewable energy charge, and non-fossil certificates. Thus, hydrogen variable costs would be around 15JPY/Nm3 even if the market price were zero.
Figure 16.
Relation between annual average market prices and hydrogen variable costs.
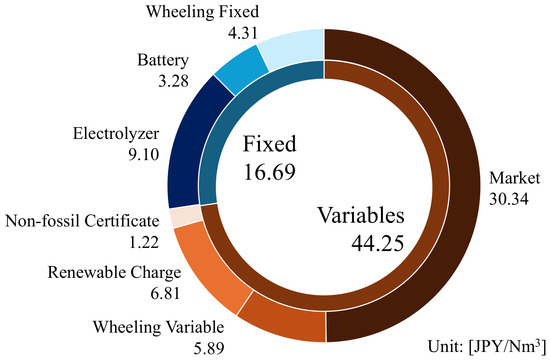
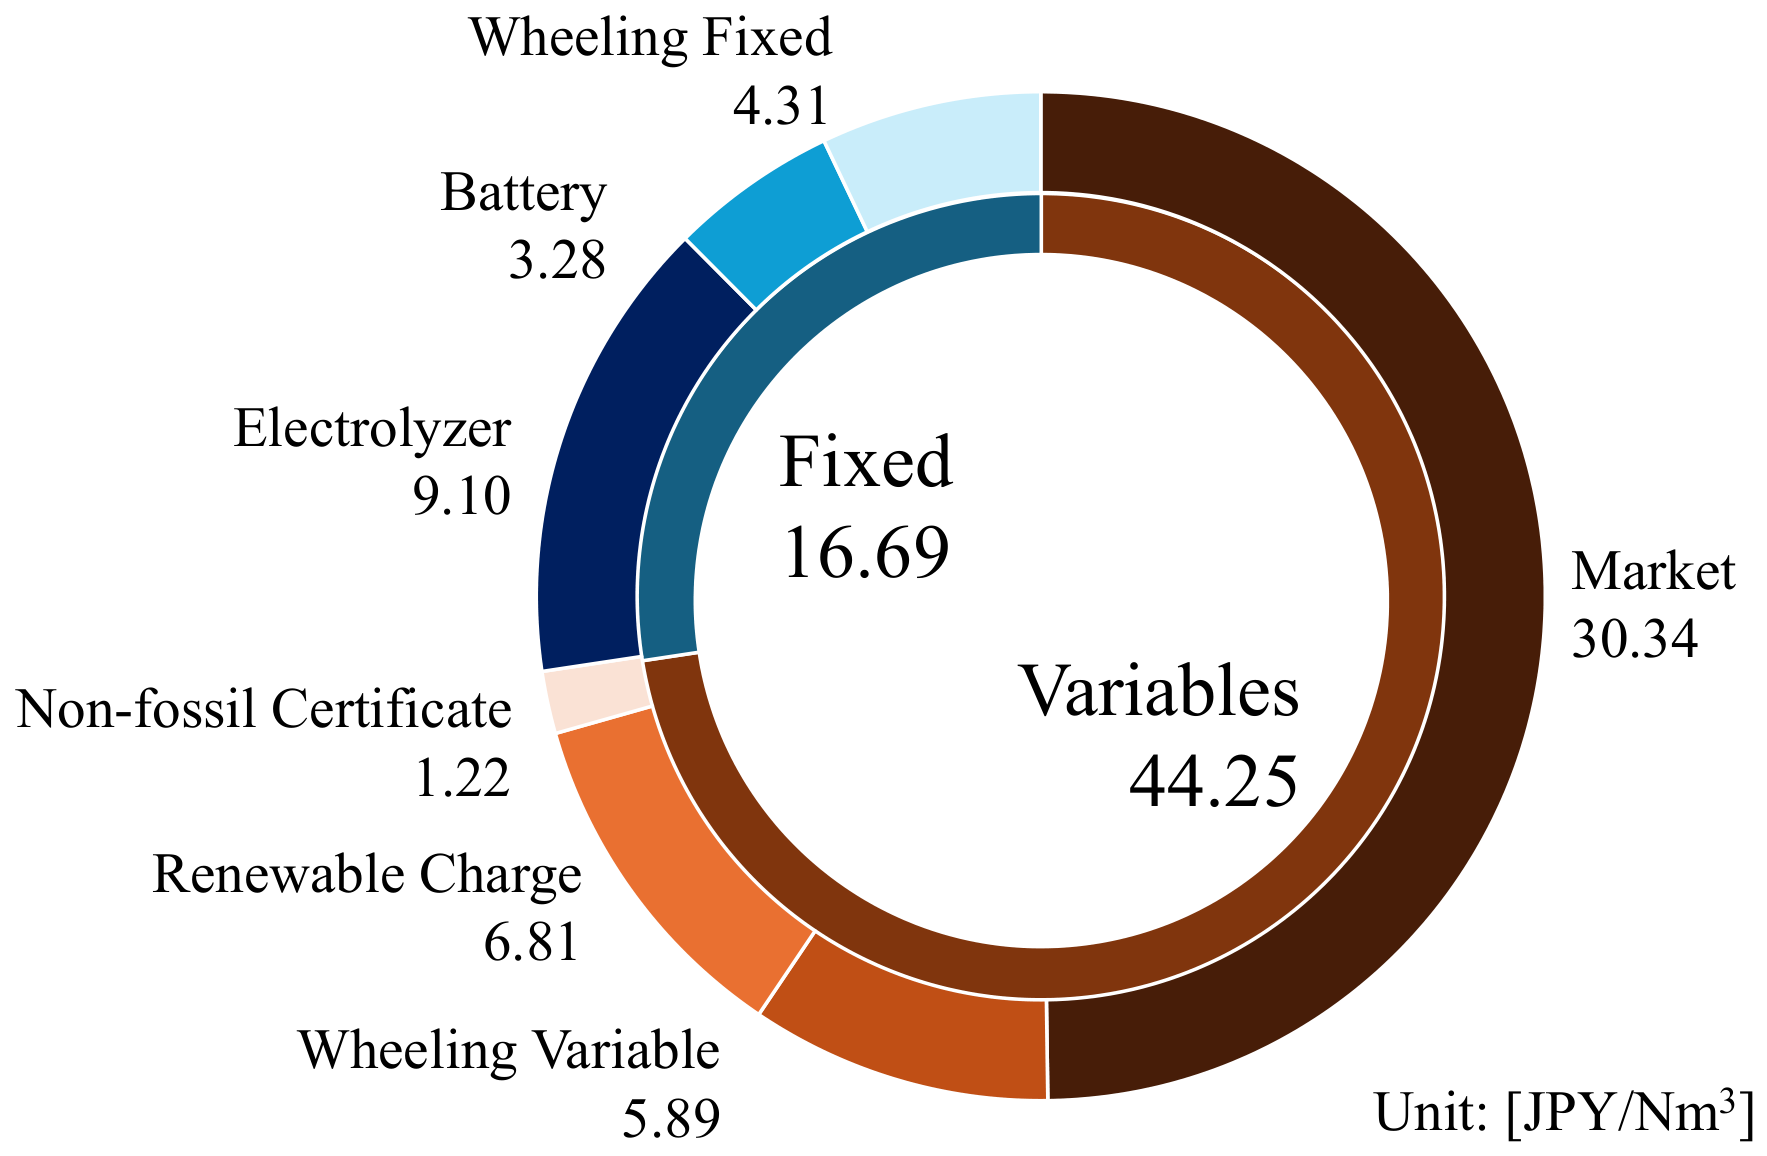
The sensitivity analysis provides a realistic range of hydrogen costs produced by retailers. The hydrogen variable cost is around 35 JPY/Nm3 when the market average price is 10 JPY/kWh, and the CAPEX and fixed OPEX parts are around 17 JPY/Nm3. Thus, the LCOH can achieve 50 JPY/Nm3 when the market prices go down because of increased renewables. The governmental target of Japan is 30 JPY/Nm3 in 2030 [19]. However, even if the market average price was near zero, the hydrogen variable cost might still exceed 15 JPY/Nm3. Thus, achieving the governmental target is challenging when considering the fixed costs. One of the main obstacles is prices independent of the market price. Figure 17 shows the cost structure of hydrogen with market prices from 1 October 2022 to 30 September 2023. Although the market prices have the largest impact, the wheeling variable charge, renewable energy charge, and non-fossil certificates account for around 14 JPY/Nm3. These institutional cost components, rather than market prices alone, are major barriers to achieving the governmental target. Hence, policy measures such as partial exemptions or reductions of grid-related charges and certificate-related costs for green or low-carbon domestic hydrogen production will be important for improving the economic viability of grid-connected electrolysis.
Figure 17.
Decomposition of LCOH with a 50% capacity factor of the electrolyzer and market prices from 1 October 2022 to 30 September 2023. “Electrolyzer” and “Battery” include its capital, replacement, and O&M costs.
Although the numerical values in this analysis are based on the Japanese market, the formulation can be adapted to other regions by replacing the market price, certificate or carbon-related cost, and grid-use charge terms with the corresponding local parameters. Similar imbalance settlement concepts exist in several European markets [54,55,56]. On the other hand, markets with different settlement designs, such as two-settlement markets [57], would require replacing the imbalance-price term with the relevant real-time prices.
4.4.4. Forecast Error Representation
To evaluate the influence of the simplified forecast-error representation, two additional sensitivity analyses are conducted. First, the number of forecast-error scenarios is increased from 6 to 12 and 24. The LCOH is 60.95, 60.25, and 60.01 for the 6-, 12-, and 24-scenario cases, respectively. Thus, reducing the quantization error of the forecast-error distribution does not significantly change the evaluation.
Second, the standard deviation of forecast errors is multiplied by 1.5 and 2.0 to represent cases where spatial smoothing effects are weaker. The LCOH is 56.43 JPY/Nm3 and 53.89 JPY/Nm3 for the errors multiplied by 1.5 and 2.0, respectively. Larger forecast errors increase the amount of positive imbalances available for compensation, thereby reducing market procurement and lowering the LCOH. Even when the forecast errors are doubled, the electrolyzer and battery compensate for 52% of all imbalances (55.15 GWh). Thus, the system can contribute to the supply and demand balance.
4.4.5. Area Difference
To discuss the applicability of the proposed method to other renewable resources and market conditions, an additional case study is conducted using wind power imbalance data in the Kyushu region of Japan. The original dataset is obtained from an actual 1 MW wind power plant. To enable comparison with the Tokyo region, the generation profile is scaled to 40 MW by multiplying the profile by 40. The renewable forecast uncertainty is modeled using a Laplace distribution in the same manner as the base case. The standard deviation of the forecast error is set to 8.6% based on the RMSE estimated from area-wide wind power forecast errors in the Kyushu region in 2022. Figure 18 shows the day-ahead electricity market prices in the Kyushu region. Overall, the prices are lower than that of the Tokyo region (Figure 5). In addition, the wheeling charge differs from the Tokyo region. The wheeling fixed charge is 395 JPY/kW, and the variable charge is 1.35 JPY/kWh. The other settings are the same as the Tokyo region (Table 3).
Figure 18.
Day-ahead electricity market prices in the Kyushu region from October 2022 to September 2023.
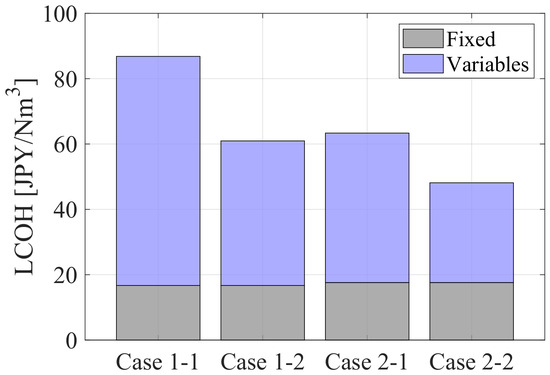
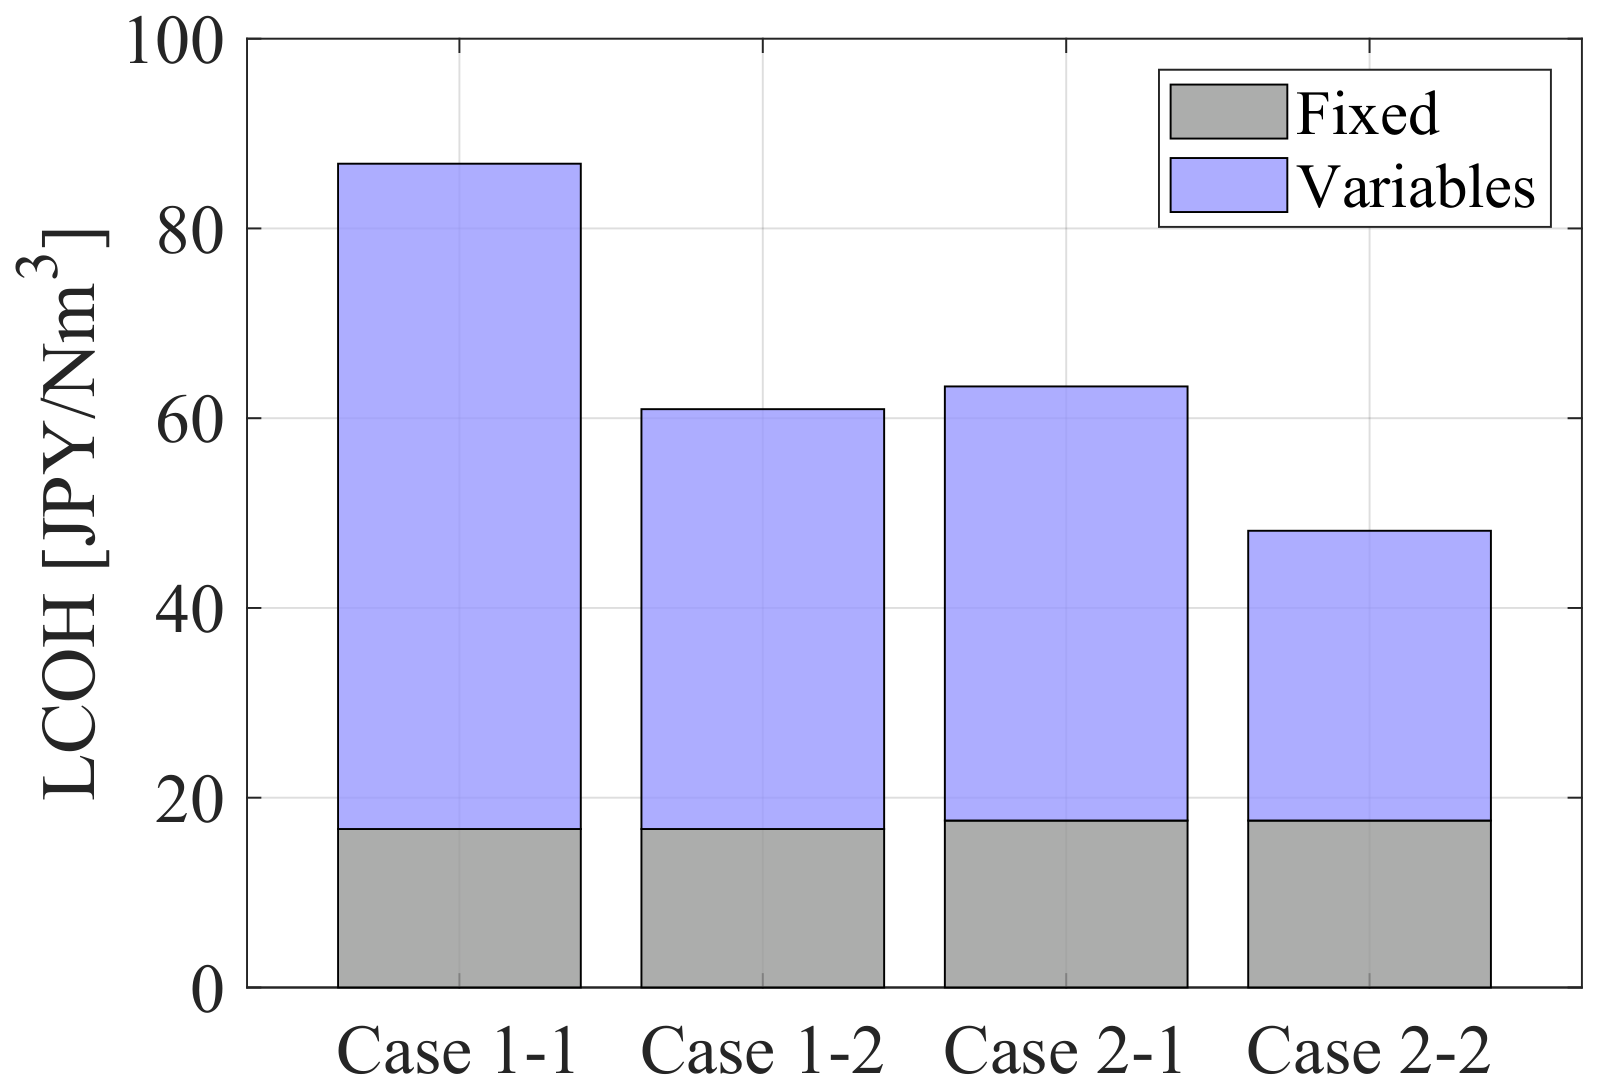
This paper defines four cases to compare LCOH across areas and imbalance-compensation settings, as shown in Table 6. Cases 1-1 and 1-2 represent the Tokyo region, while cases 2-1 and 2-2 represent the Kyushu region. The formulation of the optimization problem is the same in all cases.
Table 6.
Case settings to compare the area differences.
This paper compares the LCOH in each case with a 50% capacity factor of the electrolyzer. Figure 19 shows the LCOH comparisons. The LCOH values in Kyushu are lower than those in Tokyo. This is mainly because the market prices in Kyushu are lower than those in Tokyo. In both regions, imbalance compensation reduces the LCOH by 20% or more. Thus, the proposed method is applicable not only to solar power plants in the Tokyo region but also to other renewable resources and market environments.
Figure 19.
Comparison of LCOH between the Tokyo and Kyushu regions. The electrolyzer capacity factor is 50% in both cases.
4.4.6. Equipment Capital Cost
The electrolyzer capital costs also affect the LCOH. Therefore, an additional sensitivity analysis is conducted by varying the electrolyzer capital costs around the base value (52,000 JPY/kW). As a result, the LCOH deviates by ±1.5 JPY/Nm3 (±2.4%) when the electrolyzer capital costs deviate by ±20%. Although the main components of hydrogen costs are electricity costs, the capital costs have a moderate impact on the LCOH.
The battery lifespan depends on charge and discharge cycles and affects its capital costs. Considering the optimized battery operation, the annual equivalent full cycles exceeds 830 cycles/year. The operation is more aggressive than 1 cycle/day operation and can accelerate the capacity fade. Therefore, an additional sensitivity case is conducted by assuming battery replacement every five years. This degradation treatment increases the CAPEX of batteries by around 75%. As a result, the LCOH increases by 2.09 JPY/Nm3. It demonstrates that the battery lifespan also impacts the LCOH due to an increase in CAPEX.
4.5. Limitation
Degradation of electrolyzer performance affects the energy consumption per unit of hydrogen amount and operational constraints. A simulation study [58] on wind-powered alkaline electrolyzers reports that degradation can reduce hydrogen production by approximately 30% over the system lifetime. Assuming a 10% increase in electricity consumption, the variable costs of hydrogen production will increase proportionally. Given that the variable costs account for approximately 70% of the LCOH in this study, the overall LCOH increase is estimated to be on the order of 5–10%. Therefore, the results can be interpreted as a lower-bound estimation, and degradation effects would significantly increase the cost. The study [58] also reports that degradation can increase the minimum load required for safe operation avoiding gas-crossover. Therefore, the reported LCOH values in this study should be interpreted as optimistic with respect to the long-term operational flexibility and degradation behavior of alkaline electrolyzers under dynamic operation, because the model assumes constant efficiency and a relatively low minimum-input level. An optimization problem explicitly considering the degrading efficiency and minimum-load constraints enables the precise evaluation.
The optimization problem simplifies the start-up and shutdown operation and the part-load efficiency changes. In the constraints, the alkaline electrolyzer works all the time keeping its minimum input. Allowing start-up and shutdown operation will enable more flexible electrolyzer operation, which decreases hydrogen variable costs. However, alkaline electrolyzers are not well suited to frequent on-off operation. In addition, the efficiency in part-load operation is higher than the one in full-load operation [14]. Although optimization including these constraints will provide the more realistic cost evaluation, it requires the detailed data on actual electrolyzer stacks and plants.
The proposed system also includes a battery that is operated aggressively to absorb positive imbalances. Such intensive cycling can shorten the battery lifetime and increase replacement costs; however, battery capacity fade is not dynamically integrated into the optimization constraints in this study and is evaluated only through a post-processing sensitivity analysis. Operational optimization that accounts for non-linear capacity fade depending on the depth of discharge [59] and cycle history may improve the overall economic performance of the system and should be investigated in future work.
Hydrogen production fluctuates depending on renewable imbalances and market conditions. Under the assumption of constant hydrogen demand, the proposed operation may require large-scale hydrogen storage. However, because the electrolyzer can be installed close to hydrogen demand through grid-connected electricity supply, flexible downstream hydrogen utilization processes may reduce the required storage capacity. Detailed optimization of hydrogen storage and downstream utilization systems, such as methanation, should be investigated in future work.
From the perspective of the forecast error model, the proposed method is not highly sensitive to the discretization of forecast-error scenarios, while the error amplitude has a significant impact on hydrogen production costs. However, temporal correlations of forecast errors are not explicitly modeled in this study. Because this study evaluates the annual LCOH, the impact of short-term temporal correlations of forecast errors on the cost estimate is expected to be partly averaged over the annual horizon. Although the battery headroom constraint (17) partially accounts for consecutive compensation requirements, such correlations are important for real-time control feasibility and should be handled using a stochastic model predictive control framework or scenario-tree-based stochastic optimization in future work.
The proposed method takes into account social implementation, considering the power business model. However, it still faces several challenges for large-scale deployment. First, the number of large renewable power plants that have completed the FIT period remains limited in Japan. Public statistics from the portal [60] and grid-connection data [61] show that solar capacity in Japan has reached approximately 80 GW. Nevertheless, post-FIT large-scale solar capacity remains limited as of 2025, because the FIT purchase period for large-scale solar power plants is generally 20 years and most installations expanded after the introduction of the FIT scheme in 2012. Second, only a limited number of companies simultaneously operate power retail businesses and hydrogen production facilities. However, the amount of post-FIT renewables is expected to increase in coming years. In addition, some companies are expected to pursue integrated hydrogen production and power business, indicating the practical importance of the proposed hydrogen production framework. Although the system boundary of this paper is hydrogen production, the impact of the conservative supply plan and imbalance settlement on power business should be evaluated to implement the proposed method. In addition, this paper does not evaluate broader system-level impacts, such as transmission congestion, balancing-market stability, and the effects of large-scale electrolyzer deployment. These interactions in actual power systems also impact the power retail business but remain topics for future work.
5. Conclusions
This paper aims to enable power retailers in Japan to produce carbon-free hydrogen at competitive costs by using both electricity procured from the market with non-fossil certificates and positive renewable imbalances. An optimization model is developed to determine the cost-minimizing operation of electrolyzers and batteries under multiple imbalance scenarios. The proposed approach is evaluated through an annual simulation using actual solar generation and market data from the Tokyo region in Japan.
The results show that, at a 50% electrolyzer capacity factor, compensation for positive imbalances reduces the LCOH by 30%. Sensitivity analysis of the electrolyzer capacity factor indicates that the minimum LCOH is around 60 JPY/Nm3 at a 40% capacity factor. It also indicates that LCOH remains within 10% of this minimum for capacity factors between 40–70%. Sensitivity analysis of market prices demonstrates a strong relationship between the average market prices and hydrogen variable costs. When the average market price falls below 10 JPY/kWh, the LCOH can decrease to below 50 JPY/Nm3. Hence, within the power business framework, the proposed approach enables geographically flexible hydrogen production at low cost even when renewable generation sites and hydrogen demand locations are separated. Although the case study focuses on Japan, the proposed framework can be adapted to other markets by replacing the market prices, imbalance pricing, certificate cost, and grid-use charges with the corresponding regional values. For example, in European markets, electricity procurement costs can be represented by day-ahead market prices, grid-use charges, and Guarantees of Origin costs, while imbalance-related costs can be adjusted according to the corresponding imbalance settlement rules [54,55,56].
However, cost components independent of market prices, such as wheeling charges, renewable energy charges, and non-fossil certificates, remain major barriers to further cost reduction. Achieving the governmental cost target will require reducing such market-independent charges or deploying systems in which electrolyzers are directly connected to renewables.
Although this case study focuses on solar power, incorporating wind power could increase positive imbalances due to wind generation occurring throughout the day, thereby providing additional compensation opportunities. Regional differences in day-ahead market prices also play a role; for example, areas such as Kyushu and Tohoku exhibit lower clearing prices due to high renewable penetration. These regional characteristics suggest that hydrogen could be produced at even lower costs in those regions. Ongoing research includes analyses incorporating integrated solar and wind imbalances and lower market-price scenarios to explore further cost-reduction potential.
Author Contributions
Conceptualization, M.M. (Masashi Matsubara) and R.M.; methodology, M.M. (Masashi Matsubara) and T.Y.; software, M.M. (Masashi Matsubara); validation, M.M. (Masashi Matsubara); formal analysis, M.M. (Masashi Matsubara); investigation, M.M. (Masashi Matsubara), R.M., and T.I.; resources, M.M. (Masashi Matsubara), T.I., and D.S.; data curation, T.I. and D.S.; writing—original draft preparation, M.M. (Masashi Matsubara); writing—review and editing, M.M. (Masahiro Mae), R.M., and T.I.; visualization, M.M. (Masashi Matsubara); supervision, R.M. and T.I.; project administration, R.M.; funding acquisition, R.M. All authors have read and agreed to the published version of the manuscript.
Funding
This research was funded by the Japan Gas Association and received no other external funding.
Institutional Review Board Statement
Not applicable.
Data Availability Statement
Restrictions apply to the availability of these data. Data were obtained from the Japan Gas Association and are available with the permission of the Japan Gas Association.
Acknowledgments
During the preparation of this manuscript, the authors used Microsoft 365 Copilot for the purposes of manuscript correction. The authors have reviewed and edited the output and take full responsibility for the content of this publication.
Conflicts of Interest
This research is based on the collaborative research between The University of Tokyo and the Japan Gas Association. The authors declare that they have no other known competing financial interests or personal relationships that could have appeared to influence the work reported in this paper.
References
- IEA. World Energy Outlook 2025. Available online: https://iea.blob.core.windows.net/assets/5306bae2-1f99-402f-8d14-542bfa0ae96e/WorldEnergyOutlook2025.pdf (accessed on 10 May 2026).
- Dogu, O.; Pelucchi, M.; Van de Vijver, R.; Van Steenberge, P.H.; D’hooge, D.R.; Cuoci, A.; Mehl, M.; Frassoldati, A.; Faravelli, T.; Van Geem, K.M. The chemistry of chemical recycling of solid plastic waste via pyrolysis and gasification: State-of-the-art, challenges, and future directions. Prog. Energy Combust. Sci. 2021, 84, 100901. [Google Scholar] [CrossRef] [Scilit]
- Shchegolkov, A.V.; Shchegolkov, A.V.; Zemtsova, N.V.; Stanishevskiy, Y.M.; Vetcher, A.A. Recent Advantages on Waste Management in Hydrogen Industry. Polymers 2022, 14, 4992. [Google Scholar] [CrossRef] [Scilit] [PubMed]
- Genç, M.S.; Çelik, M.; Karasu, I. A review on wind energy and wind-hydrogen production in Turkey: A case study of hydrogen production via electrolysis system supplied by wind energy conversion system in Central Anatolian Turkey. Renew. Sustain. Energy Rev. 2012, 16, 6631–6646. [Google Scholar] [CrossRef] [Scilit]
- Hasan, M.M.; Genç, G. Techno-economic analysis of solar/wind power based hydrogen production. Fuel 2022, 324, 124564. [Google Scholar] [CrossRef] [Scilit]
- Janssen, J.L.; Weeda, M.; Detz, R.J.; van der Zwaan, B. Country-specific cost projections for renewable hydrogen production through off-grid electricity systems. Appl. Energy 2022, 309, 118398. [Google Scholar] [CrossRef] [Scilit]
- Rezaei, M.; Akimov, A.; Gray, E.M.A. Levelised cost of dynamic green hydrogen production: A case study for Australia’s hydrogen hubs. Appl. Energy 2024, 370, 123645. [Google Scholar] [CrossRef] [Scilit]
- Estermann, T.; Newborough, M.; Sterner, M. Power-to-gas systems for absorbing excess solar power in electricity distribution networks. Int. J. Hydrogen Energy 2016, 41, 13950–13959. [Google Scholar] [CrossRef] [Scilit]
- Al-Ghussain, L.; Ahmad, A.D.; Abubaker, A.M.; Hassan, M.A. Exploring the feasibility of green hydrogen production using excess energy from a country-scale 100% solar-wind renewable energy system. Int. J. Hydrogen Energy 2022, 47, 21613–21633. [Google Scholar] [CrossRef] [Scilit]
- Al-Buraiki, A.S.; Al-Sharafi, A. Hydrogen production via using excess electric energy of an off-grid hybrid solar/wind system based on a novel performance indicator. Energy Convers. Manag. 2022, 254, 115270. [Google Scholar] [CrossRef] [Scilit]
- Sun, W.; Harrison, G.P.; Dodds, P.E. A multi-model method to assess the value of power-to-gas using excess renewable. Int. J. Hydrogen Energy 2022, 47, 9103–9114. [Google Scholar] [CrossRef] [Scilit]
- IEA. Renewables 2024: Analysis and Forecast to 2030. 2024. Available online: https://www.iea.org/reports/renewables-2024 (accessed on 10 May 2026).
- Menanteau, P.; Quéméré, M.M.; Duigou, A.L.; Bastard, S.L. An economic analysis of the production of hydrogen from wind-generated electricity for use in transport applications. Energy Policy 2011, 39, 2957–2965. [Google Scholar] [CrossRef] [Scilit]
- Abomazid, A.M.; El-Taweel, N.A.; Farag, H.E. Optimal Energy Management of Hydrogen Energy Facility Using Integrated Battery Energy Storage and Solar Photovoltaic Systems. IEEE Trans. Sustain. Energy 2022, 13, 1457–1468. [Google Scholar] [CrossRef] [Scilit]
- Xie, Z.; Jin, Q.; Su, G.; Lu, W. A Review of Hydrogen Storage and Transportation: Progresses and Challenges. Energies 2024, 17, 4070. [Google Scholar] [CrossRef] [Scilit]
- Bai, F.; Zhao, F.; Liu, X.; Mu, Z.; Hao, H.; Liu, Z. A techno-economic analysis of cross-regional renewable hydrogen supply routes in China. Int. J. Hydrogen Energy 2023, 48, 37031–37044. [Google Scholar] [CrossRef] [Scilit]
- Shibata, Y.; Kan, S.; Yoshida, M.; Nakamura, H.; Sakamoto, T. Study on the Economics of the Green Hydrogen International Supply Chain; Final Report; The Institute of Energy Economics: Tokyo, Japan, 2021. [Google Scholar]
- DOE. U.S. National Clean Hydrogen Strategy and Roadmap; Technical Report; U.S. Department of Energy: Washington, DC, USA, 2023. Available online: https://www.hydrogen.energy.gov/docs/hydrogenprogramlibraries/pdfs/us-national-clean-hydrogen-strategy-roadmap.pdf (accessed on 10 May 2026).
- The Japanese Ministry of Economy, Trade and Industry. Basic Hydrogen Strategy. 2023. Available online: https://www.meti.go.jp/shingikai/enecho/shoene_shinene/suiso_seisaku/pdf/20230606_5.pdf (accessed on 10 May 2026).
- Schoots, K.; Ferioli, F.; Kramer, G.J.; van der Zwaan, B.C. Learning curves for hydrogen production technology: An assessment of observed cost reductions. Int. J. Hydrogen Energy 2008, 33, 2630–2645. [Google Scholar] [CrossRef] [Scilit]
- Nami, H.; Rizvandi, O.B.; Chatzichristodoulou, C.; Hendriksen, P.V.; Frandsen, H.L. Techno-economic analysis of current and emerging electrolysis technologies for green hydrogen production. Energy Convers. Manag. 2022, 269, 116162. [Google Scholar] [CrossRef] [Scilit]
- Prosser, J.H.; James, B.D.; Murphy, B.M.; Wendt, D.S.; Casteel, M.J.; Westover, T.L.; Knighton, L.T. Cost analysis of hydrogen production by high-temperature solid oxide electrolysis. Int. J. Hydrogen Energy 2024, 49, 207–227. [Google Scholar] [CrossRef] [Scilit]
- Schnuelle, C.; Wassermann, T.; Fuhrlaender, D.; Zondervan, E. Dynamic hydrogen production from PV & wind direct electricity supply – Modeling and techno-economic assessment. Int. J. Hydrogen Energy 2020, 45, 29938–29952. [Google Scholar] [CrossRef] [Scilit]
- Okur, Ö.; Voulis, N.; Heijnen, P.; Lukszo, Z. Aggregator-mediated demand response: Minimizing imbalances caused by uncertainty of solar generation. Appl. Energy 2019, 247, 426–437. [Google Scholar] [CrossRef] [Scilit]
- Patil, G.S.; Mulla, A.; Dawn, S.; Ustun, T.S. Profit Maximization with Imbalance Cost Improvement by Solar PV-Battery Hybrid System in Deregulated Power Market. Energies 2022, 15, 5290. [Google Scholar] [CrossRef] [Scilit]
- Matevosyan, J.; Söder, L. Minimization of imbalance cost trading wind power on the short-term power market. IEEE Trans. Power Syst. 2006, 21, 1396–1404. [Google Scholar] [CrossRef] [Scilit]
- Zhang, X. Optimal Wind Bidding Strategy Considering Imbalance Cost and Allowed Imbalance Band. In 2012 IEEE Energytech; IEEE: New York, NY, USA, 2012; pp. 1–5. [Google Scholar] [CrossRef] [Scilit]
- Thakur, T.; Goyal, S.; Gambhir, J.; Kaur, I. Optimisation of Imbalance Cost for Wind Power Marketibility using Hydrogen Storage. In Power System Technology and IEEE Power India Conference; IEEE: New York, NY, USA, 2008; pp. 1–5. [Google Scholar] [CrossRef] [Scilit]
- Pavić, I.; Čović, N.; Pandžić, H. PV–battery-hydrogen plant: Cutting green hydrogen costs through multi-market positioning. Appl. Energy 2022, 328, 120103. [Google Scholar] [CrossRef] [Scilit]
- Čović, N.; Pavić, I.; Pandžić, H. Multi-energy balancing services provision from a hybrid power plant: PV, battery, and hydrogen technologies. Appl. Energy 2024, 374, 123966. [Google Scholar] [CrossRef] [Scilit]
- Lujano-Rojas, J.; Osório, G.; Matias, J.; Catalão, J. Wind Power Forecasting Error Distributions and Probabilistic Load Dispatch. In 2016 IEEE Power & Energy Society General Meeting; IEEE: New York, NY, USA, 2016; pp. 1–5. [Google Scholar] [CrossRef] [Scilit]
- Hodge, B.M.; Florita, A.; Orwig, K.; Lew, D.; Milligan, M. A Comparison of Wind Power and Load Forecasting Error Distributions: Preprint; National Renewable Energy Labolatory: Golden, CO, USA, 2012; pp. 1–10. [Google Scholar]
- Hodge, B.M.S.; Ela, E.G.; Milligan, M. Characterizing and Modeling Wind Power Forecast Errors from Operational Systems for Use in Wind Integration Planning Studies. Wind Eng. 2012, 36, 509–524. [Google Scholar] [CrossRef] [Scilit]
- Takahashi, M.; Matsuhashi, R. Area-wide Total Wind and Photovoltaic Power Forecasting Using Multiple Regression Technique and Analysis of Forecast Error Characteristics. J. Jpn. Soc. Energy Resour. 2017, 38, 1–8. (In Japanese) [Google Scholar] [CrossRef] [Scilit]
- Matsuhashi, R.; Yoshioka, T. Optimal design of a coproduction system of electricity and hydrogen to manage imbalances resulting from forecast errors in photovoltaic outputs. Proc. ICPRE 2018, 64, 06009. [Google Scholar] [CrossRef] [Scilit]
- Takahashi, M.; Matsuhashi, R. A cost reduction analysis of introduction of battery energy storage and controllable heat pump water heaters by operation planning model of power generation system considering the uncertainty in renewable power generation. IEEJ Trans. Power Energy 2017, 137, 756–765. (In Japanese) [Google Scholar] [CrossRef] [Scilit]
- Han, Y.; Chang, L. A study of the reduction of the regional aggregated wind power forecast error by spatial smoothing effects in the Maritime Canada. In The 2nd International Symposium on Power Electronics for Distributed Generation Systems; IEEE: New York, NY, USA, 2010; pp. 942–947. [Google Scholar] [CrossRef] [Scilit]
- Nuño, E.; Koivisto, M.; Cutululis, N.A.; Sørensen, P. On the Simulation of Aggregated Solar PV Forecast Errors. IEEE Trans. Sustain. Energy 2018, 9, 1889–1898. [Google Scholar] [CrossRef] [Scilit]
- Haessig, P.; Multon, B.; Ahmed, H.B.; Lascaud, S.; Bondon, P. Energy storage sizing for wind power: Impact of the autocorrelation of day-ahead forecast errors. Wind Energy 2015, 18, 43–57. [Google Scholar] [CrossRef] [Scilit]
- Nistor, S.; Dave, S.; Fan, Z.; Sooriyabandara, M. Technical and economic analysis of hydrogen refuelling. Appl. Energy 2016, 167, 211–220. [Google Scholar] [CrossRef] [Scilit]
- Li, Z.; Xia, Y.; Bo, Y.; Wei, W. Optimal planning for electricity-hydrogen integrated energy system considering multiple timescale operations and representative time-period selection. Appl. Energy 2024, 362, 122965. [Google Scholar] [CrossRef] [Scilit]
- JEPX. Day Ahead Market|Trading Market Data|Trading Information. Available online: https://www.jepx.jp/en/electricpower/market-data/spot/ (accessed on 10 May 2026).
- Taibi, E.; Blanco, H.; Miranda, R.; Carmo, M. Green Hydrogen Cost Reduction: Scaling Up Electrolysers to Meet the 1.5 °C Climate Goal; Technical Report; IRENA: Masdar City, United Arab Emirates, 2020; Available online: https://www.irena.org/-/media/Files/IRENA/Agency/Publication/2020/Dec/IRENA_Green_hydrogen_cost_2020.pdf (accessed on 10 May 2026).
- Buttler, A.; Spliethoff, H. Current status of water electrolysis for energy storage, grid balancing and sector coupling via power-to-gas and power-to-liquids: A review. Renew. Sustain. Energy Rev. 2018, 82, 2440–2454. [Google Scholar] [CrossRef] [Scilit]
- NEDO. Fuel Cell & Hydrogen Technology Development Roadmap—Sorting Out Issues for Formulating Water Electrolysis Technology Development Roadmap. 2023. Available online: https://www.nedo.go.jp/content/100956716.pdf (accessed on 10 May 2026). (In Japanese)
- AsahiKasei. Aqualyzer: Large-Scale Alkaline Water Electrolyzer System for Producing Hydrogen. Available online: https://ak-green-solution.com/assets/pdf/brochure_en.pdf (accessed on 10 May 2026).
- Nel. A485 Series Alkaline Electrolyser Stack and Electrolyte System Module. 2024. Available online: https://nelhydrogen.com/wp-content/uploads/2024/08/A-Series-Spec-Sheet%E2%80%93DOC001974_03.pdf (accessed on 10 May 2026).
- Mitsubishi Research Institute. Consideration of Target Price and Introduction Outlook for Stationary Energy Storage Systems. Available online: https://www.meti.go.jp/shingikai/energy_environment/storage_system/pdf/003_04_00.pdf (accessed on 10 May 2026). (In Japanese)
- Kawai, E.; Ozawa, A.; Matsuhasi, R. Techno-economic analysis with a dynamic optimization approach integrating electrical and chemical engineering: A case study for aviation decarbonization in Japan. Appl. Energy 2026, 402, 126966. [Google Scholar] [CrossRef] [Scilit]
- JEPX. Non-Fossil Value Trading|Market Information. Available online: https://www.jepx.jp/nonfossil/market-data/ (accessed on 10 May 2026). (In Japanese)
- MathWorks. Mixed-Integer Linear Programming (MILP)—MATLAB Intlinprog. Available online: https://www.mathworks.com/help/optim/ug/intlinprog.html (accessed on 10 May 2026).
- Zhang, T.; Mae, M.; Matsuhashi, R. A Research on Domestic Green Hydrogen Production in Japan. J. Jpn. Soc. Energy Resour. 2025, 46, 110–118. [Google Scholar] [CrossRef]
- Zhu, P.; Mae, M.; Matsuhashi, R. Techno-Economic Analysis of Grid-Connected Hydrogen Production via Water Electrolysis. Energies 2024, 17, 1653. [Google Scholar] [CrossRef] [Scilit]
- ACER. ACER’s Monitoring Shows Broad Implementation of the Electricity Imbalance Settlement Harmonisation Methodology Across the EU. 2024. Available online: https://www.acer.europa.eu/news/acers-monitoring-shows-broad-implementation-electricity-imbalance-settlement-harmonisation-methodology-across-eu (accessed on 6 June 2026).
- Elexon. BSC Section T: Settlement and Trading Charges V45.0. 2025. Available online: https://bscdocs.elexon.co.uk/bsc/bsc-section-t-settlement-and-trading-charges (accessed on 6 June 2026).
- Netztransparenz.de. Uniform Imbalance Price (reBAP). Available online: https://www.netztransparenz.de/en/Balancing-Capacity/Imbalance-price/Uniform-imbalance-price-reBAP (accessed on 6 June 2026).
- PJM. PJM Manual 11: Energy & Ancillary Services Market Operations. 2025. Available online: https://www.pjm.com/-/media/DotCom/documents/manuals/m11.pdf (accessed on 6 June 2026).
- Dannappel, L.M.; Cammann, L.; You, S.; Zong, Y.; Jäschke, J. Design of wind-powered alkaline electrolyzers: Balancing economic performance, degradation, and safety. Energy Convers. Manag. 2026, 349, 120820. [Google Scholar] [CrossRef] [Scilit]
- Matsubara, M.; Mae, M.; Matsuhashi, R. Comprehensive Benefit Evaluation of Residential Solar and Battery Systems in Japan Considering Outage Mitigation and Battery Degradation. Energies 2025, 18, 6579. [Google Scholar] [CrossRef] [Scilit]
- Agency for Natural Resources and Energy in Japan. Feed-In-Tariff Law Information Publication Website. Available online: https://www.fit-portal.go.jp/publicinfosummary (accessed on 8 May 2026). (In Japanese)
- Agency for Natural Resources and Energy in Japan. Current Status of Renewable Energy in Japan and Overseas, and Proposed Issues for This Year’s Procurement Price Calculation Committee. 2025. Available online: https://www.meti.go.jp/shingikai/santeii/pdf/105_01_00.pdf (accessed on 6 June 2026). (In Japanese)

Disclaimer/Publisher’s Note: The statements, opinions and data contained in all publications are solely those of the individual author(s) and contributor(s) and not of MDPI and/or the editor(s). MDPI and/or the editor(s) disclaim responsibility for any injury to people or property resulting from any ideas, methods, instructions or products referred to in the content. |
© 2026 by the authors. Licensee MDPI, Basel, Switzerland. This article is an open access article distributed under the terms and conditions of the Creative Commons Attribution (CC BY) license.