


Abstract
With the increasing penetration of renewable energy generation (REG) in novel distribution systems, active distribution networks (ADNs) integrated with microgrids (MGs) play a crucial role in enhancing the flexibility of regulation resources and promoting the accommodation of REG. To meet the operational requirements for efficient collaboration between ADNs and MGs under different dispatch time scales, this paper proposes a collaborative optimal dispatch strategy for multi-microgrid active distribution systems based on a hybrid game and variable time scales. Firstly, a transaction operation framework is constructed for the distribution network operator (DNO) and a multi-microgrid alliance (MMA), considering the peer-to-peer (P2P) transaction mode. On this basis, a day-ahead hybrid game model with a two-layer structure is constructed, the upper layer is a master–slave game with the DNO as the leader and the MMA as the follower, while the lower layer is a cooperative game for MGs within the MMA. An asymmetric Nash bargaining strategy based on contribution degree in P2P transactions is introduced to ensure equitable benefit allocation among cooperative MGs. Secondly, an intra-day rolling optimization model for reactive power and voltage based on variable time scales is proposed, which enhances the system’s responsiveness to real-time source–load power fluctuations by dynamically adjusting the dispatch time scale. Finally, the alternating direction method of multipliers (ADMM), integrated with a strategy separation mechanism, is adopted to efficiently solve the hybrid game model involving numerous 0–1 variables. The case study results indicate that, under the proposed strategy, the MMA’s power purchase cost from the DNO and ESS operational cost are decreased by 9.7% and 11.6%, respectively, while the system’s average deviation rate of node voltage decreases by 0.82%. Therefore, the proposed collaborative dispatch strategy can not only effectively reduce the system’s operational cost and ensure voltage stability but also significantly promote the accommodation of REG.
1. Introduction
To accelerate the development of novel distribution systems and support the carbon peaking and carbon neutrality goals, higher requirements have been placed on the flexibility and capacity of ADNs [1]. As autonomous operating units, MGs provide an effective approach for the distributed integration and local accommodation of REG by aggregating regulation resources such as photovoltaics (PV), energy storage systems (ESSs) and controllable loads [2]. To overcome the limitations of individual MGs in terms of carrying capacity and regulation capability, researchers have proposed integrating MGs of different scales into regional distribution networks to form multi-microgrid active distribution systems. However, the complex multi-stakeholder interest interactions and multi-time scale energy management patterns in such systems pose significant challenges to operational control [3,4]. Therefore, fully exploiting the interaction potential between MGs and ADNs in energy transactions and collaborative operation is crucial for improving both REG accommodation and power supply capacity.
Game theory is generally classified into non-cooperative games [5,6] and cooperative games [7,8] and is widely used to describe interest interactions among different entities. In recent years, game theory has been extensively applied in electricity markets. The master–slave game, also known as the Stackelberg game, is a typical non-cooperative game suitable for scenarios where participating entities hold unequal decision-making status [9]. Reference [10] establishes an energy interaction framework for multi-MG systems based on a master–slave game. The multi-MG agent serves as the leader and guides MG agents to adjust their dispatch plans by setting transaction prices, thereby effectively reducing the system’s operational cost. Reference [11] proposes a master–slave game mechanism based on electricity price incentives and establishes an active–reactive power collaborative optimization model for distribution network–MG clusters, which effectively mitigates three-phase voltage unbalance. Reference [12] proposes an electricity–carbon coupled trading mechanism for multi-microgrid systems led by the DNO, which improves the system’s environmental benefits by enhancing the willingness of consumers to participate in low-carbon demand response. Cooperative games are suitable for participants of equal status and facilitate transactions and benefit allocation through cooperative alliances, which balances the interests of the MMA and its individual MG members [13]. Reference [14] adopts the Shapley value method to allocate cooperative benefits according to each MG’s marginal contribution to the alliance optimization objective, effectively alleviating conflicts of interest between the cooperative alliance and its members. Reference [15] establishes a P2P transaction framework for multi-microgrid systems based on Nash bargaining theory, which not only achieves regional power interconnection and mutual support but also significantly enhances the transaction benefits of each MG. Reference [16] proposes an asymmetric Nash bargaining mechanism based on contributions to P2P power transactions and adopts the ADMM algorithm for distributed solution, which effectively ensures fairness and privacy in cooperative benefit allocation within the alliance. References [17,18] establish hybrid game models for multi-microgrid systems incorporating shared energy storage, which further enhances coordinated operation among MGs.
To address the disturbances caused by source–load uncertainties to system power balance, existing studies commonly adopt multi-time scale regulation modes characterized by “multi-level coordination and progressive optimization” [19]. Reference [20] applies the model predictive control (MPC) method to perform intra-day rolling optimization and real-time correction of the day-ahead dispatch plan. Through multi-time scale collaborative dispatch, the system’s capability to mitigate REG fluctuations is significantly enhanced. Reference [21] constructs a two-stage distributionally robust optimization model for the day-ahead and intra-day periods according to the control characteristics of different regulation resources. By utilizing capacitor banks and SVCs to rapidly respond to power disturbances, voltage fluctuations and active power losses are effectively reduced. Reference [22] converts the intra-day dispatch model into a minute-level Markov decision process (MDP) based on the day-ahead dispatch results, thereby significantly enhancing decision-making efficiency in real time. Reference [23] proposes a multi-time scale collaborative dispatch strategy for multi-microgrid systems considering demand response, which effectively promotes flexible interaction and resource coordination among MGs.
To clarify the research focus and innovations of this paper, Table A1 provides a comparative summary of existing relevant studies in terms of methodology, addressed problems and differences from the proposed work. As shown in Table A1, although existing studies provide valuable references for the coordinated operation of multi-microgrid systems across multiple time scales, several limitations remain. First, existing studies based on game theory mainly focus on either hierarchical transactions between the DNO and MGs or P2P cooperative transactions among MGs, while insufficient attention has been paid to the coupling relationship between DNO transaction pricing and P2P benefit allocation within alliances. Second, most studies assume a fixed distribution network topology and rarely consider the coordination between the regulation capability of ADN reconfiguration and energy transactions among multiple microgrids. Third, existing multi-time scale dispatch methods typically adopt fixed dispatch intervals, which limits their adaptability under significant REG and load fluctuations, making it difficult to balance operational stability and dispatch economy. To address these research gaps, this paper proposes a collaborative dispatch strategy for multi-microgrid active distribution systems based on the hybrid game theory and variable time scale rolling optimization.
The main contributions of this paper are as follows:
- (1)
- A day-ahead and intra-day coordinated dispatch method is proposed for multi-microgrid active distribution systems based on a hybrid game transaction strategy and a variable time scale dispatch strategy. This method enables multi-time scale coordination between the ADN and multiple microgrids in energy management and operational optimization.
- (2)
- A day-ahead two-layer hybrid game model is proposed by considering network reconfiguration and P2P transactions. In the upper layer, a master–slave game is adopted to describe the DNO-led transaction pricing and the MMA response process. In the lower layer, a contribution-based asymmetric Nash bargaining model is introduced to describe cooperative benefit allocation among MG members within the MMA. The proposed model fully exploits the interaction potential among different participants while ensuring transaction fairness.
- (3)
- An intra-day reactive power and voltage rolling optimization model based on a variable time scale strategy is proposed. This model adaptively selects dispatch intervals according to the deviations between the real-time operating state and the day-ahead dispatch plan, which effectively enhances the system’s responsiveness to REG and load fluctuations and enables more accurate voltage control.
- (4)
- A distributed solution method that integrates the strategy separation mechanism with ADMM is proposed to efficiently solve the hybrid game model involving numerous 0–1 discrete variables and coupled P2P transaction variables. Case study results validate the effectiveness and improvements of the proposed method in improving operational economy, benefit allocation fairness, REG accommodation and voltage stability.
2. Materials and Methods
2.1. Structure of the Multi-Microgrid Active Distribution System
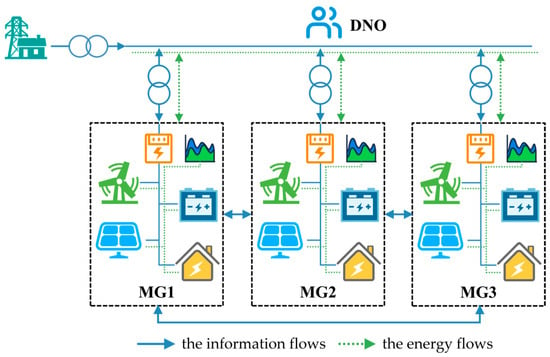
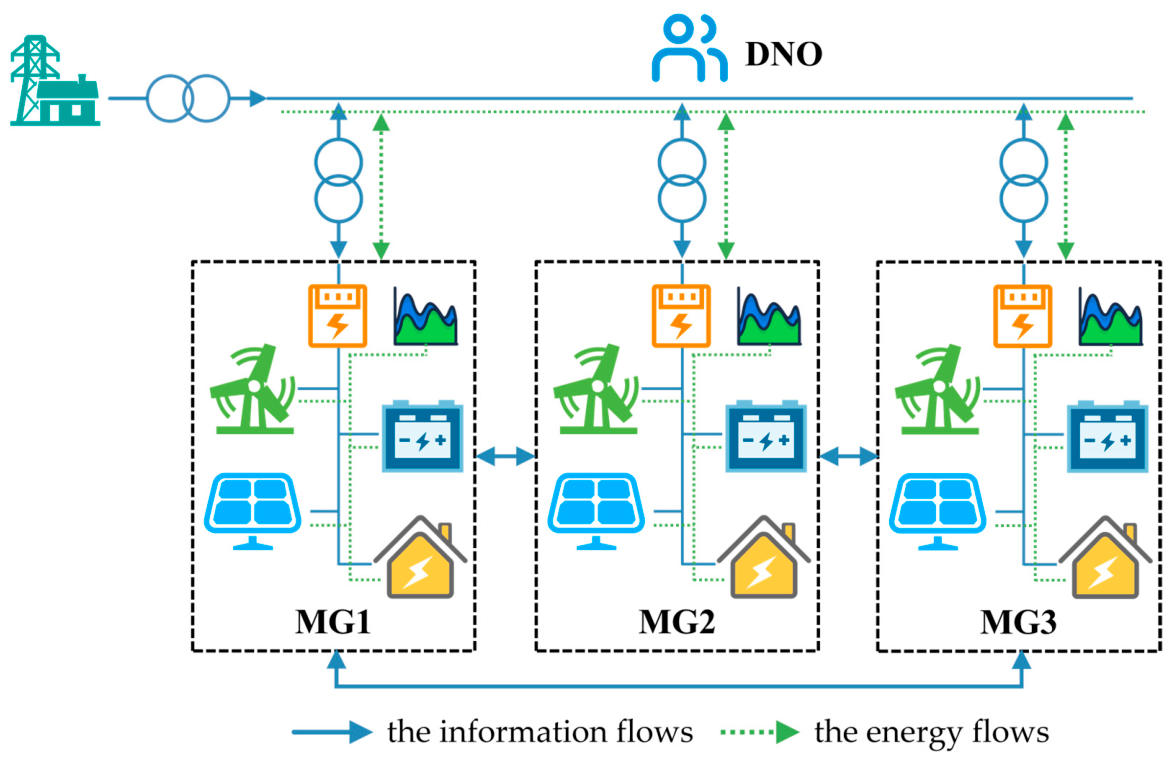
This paper focuses on an active distribution system integrated with multiple MGs. The system consists of the upstream grid, the distribution network, the DNO and MGs. Each MG includes distributed REG units, ESS and local loads. The DNO exchanges power with MGs through power interconnection lines and is responsible for the operational control of the distribution network and the formulation of transaction prices. Individual MGs can form an MMA to participate in power transactions with the DNO as an aggregator. Meanwhile, MGs can also achieve mutual power support through P2P transactions to accommodate surplus REG or compensate for local power shortages [23]. The system structure is shown in Figure 1, where the energy flows include power purchased by the DNO from the upstream grid, power purchased and sold between the DNO and MGs, and P2P exchange power among MGs. The information flows include forecast data, transaction prices, network topology and dispatch instructions.
Figure 1.
The multi-microgrid active distribution system structure.
2.2. Operation Framework of the Multi-Microgrid Active Distribution System with P2P Transactions
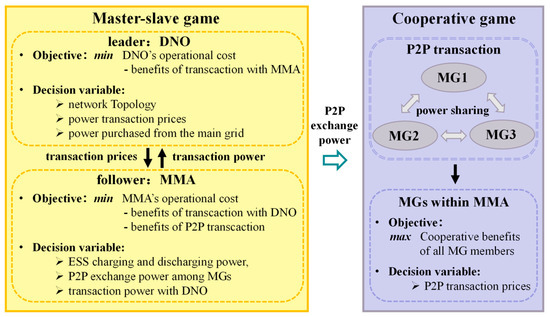
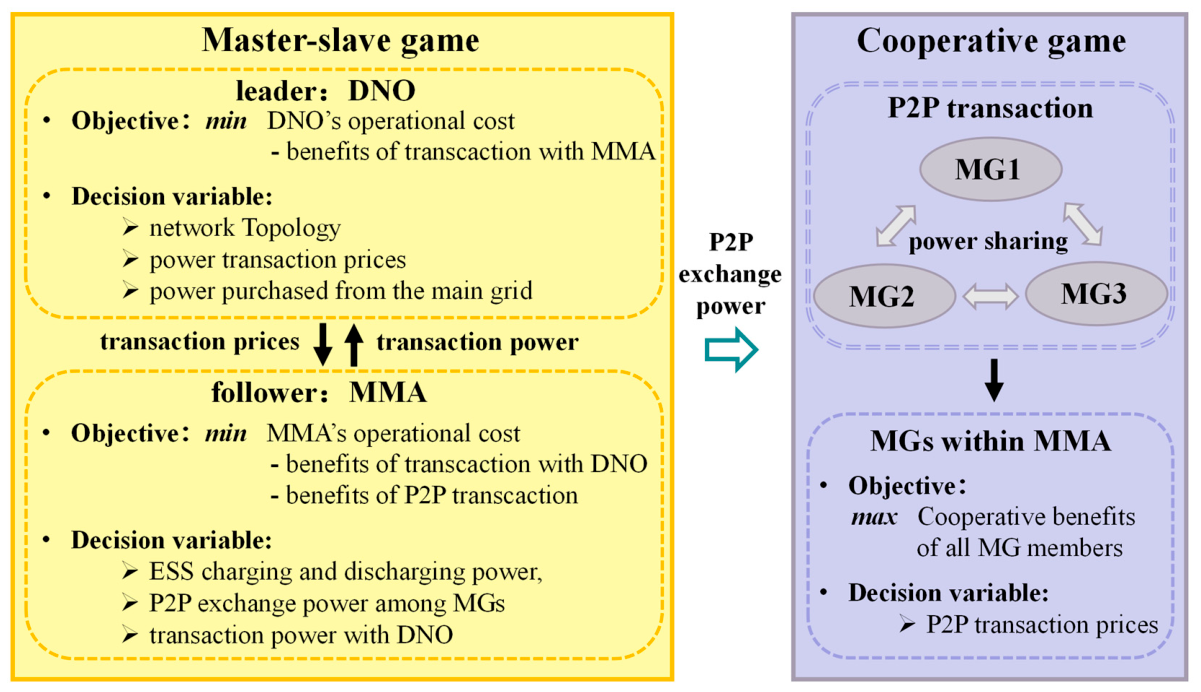
According to the aforementioned operation mechanism, this paper proposes a collaborative dispatch framework for the multi-microgrid active distribution system based on a hybrid game model, as shown in Figure 2. The framework includes hierarchical transactions between the DNO and the MMA, as well as P2P transactions among MGs within the MMA.
Figure 2.
Hybrid game dispatch framework.
Specifically, the upper layer of the framework establishes a master–slave game model with the DNO as the leader and the MMA as the follower. The DNO aims to minimize its operational cost by setting transaction electricity prices with the MMA and optimizing the distribution network topology and power purchase plan from the upstream grid. Given the electricity prices and topology information, the MMA aims to minimize the alliance operational cost by optimizing the transaction power with the DNO, the P2P exchange power among MGs, the ESS charging and discharging power, and the REG curtailment power. The resulting operation strategy is then fed back to the DNO as a basis for adjusting the transaction prices.
The lower layer of the framework establishes a cooperative game model for multiple microgrids based on P2P transactions. Through P2P transactions, MGs with power surpluses can preferentially sell excess REG to MGs with power shortages, thereby reducing the dependence of the MMA on power purchases from the DNO and improving REG accommodation. In this cooperative game model, Nash bargaining theory is adopted to negotiate P2P transaction prices among MGs, and cooperative benefits are allocated according to each MG’s contribution to P2P transactions. In this way, the overall benefit of the alliance is improved while ensuring the participation incentive and benefit allocation fairness of individual MGs in P2P transactions.
2.3. Hierarchical Relationship Between the Day-Ahead Game Model and the Intra-Day Dispatch Model
The collaborative dispatch strategy proposed in this paper consists of two stages: the day-ahead stage and the intra-day stage. The day-ahead stage focuses on multi-entity transactions and operation planning. Considering the different interests of the DNO and MGs, a hybrid game model is established, as described in Section 2.2. In this model, the upper layer is a DNO-led master–slave game pricing model, which determines transaction prices, network topology and day-ahead dispatch plans. The lower layer is a multi-microgrid cooperative game model based on Nash bargaining, which determines P2P transaction prices and cooperative benefit allocation among MGs.
The intra-day stage focuses on real-time operation adjustment and voltage control under forecast deviations of REG output and load power. Taking the transaction prices, network topology and operation plans of the ADN and MGs determined in the day-ahead stage as boundary conditions, a variable time scale rolling optimization model for reactive power and voltage control is established. This model can adaptively switch between 15 min and 5 min dispatch intervals according to the deviations between the real-time operating state and the day-ahead dispatch plan, thereby balancing voltage stability and dispatch economy.
Therefore, the day-ahead model primarily addresses transaction and dispatch plan formulation as well as P2P benefit allocation, while the intra-day model focuses on real-time operation adjustment and voltage stability control caused by source–load forecast deviations. Together, they form a hierarchical coordination framework for day-ahead planning and intra-day adjustment [24].
3. Day-Ahead Hybrid Game Energy Transaction Strategy
3.1. A Network Reconfiguration and Transaction Pricing Model Based on the Master–Slave Game
In the day-ahead transaction stage, the DNO acts as the leader in the master–slave game. It is responsible for setting transaction prices with the MMA, as well as optimizing the network topology and power purchase plan from the upstream grid. On the one hand, the DNO guides MGs to adjust their transaction plans and operation strategies through price signals. On the other hand, the DNO optimizes power flow distribution through network reconfiguration, thereby reducing active power losses and enhancing REG accommodation capacity.
3.1.1. The DNO Decision Model
- (1)
- Objective function
The DNO decision model aims to minimize its operational cost, with the objective function considering the transaction benefits and costs associated with the MMA, the power purchase cost from the upstream grid, the active power loss cost and the switch actuation cost. The objective function of the DNO decision model is formulated as follows:
where represents the DNO’s benefits derived from power transactions with the MMA; represents the DNO’s power purchase cost from the main grid; and represent the active power loss cost and switch actuation cost, respectively; and represent the DNO’s power purchased from and sold to the MMA, respectively; represents the DNO’s power purchased from the main grid at substation j; and and are the 0–1 variables used to identify changes in switch status, where indicates that a switch changes from open to closed status and suggests that a switch changes from closed to open status.
- (2)
- Constraints
- (1)
- Branch flow constraints
This paper adopts second-order cone programming (SOCP) to relax the Dist-Flow model and obtains the linearized branch flow constraints as follows [25]:
where and represent the DNO’s power purchased from and sold to MGj, respectively. represents the injected reactive power from the main grid at substation j.
Since open branches fail to satisfy the voltage constraint in Equation (4), the Big-M method is introduced to relax the constraint, and Equation (4) is replaced by Equations (7) and (8) [26]:
where is a 0–1 variable; indicates that the branch switch is closed, while z = 0 indicates that it is open; and , , and are sufficiently large positive values.
- (2)
- Network topology constraints [27]
- (3)
- Switch actuation constraints
- (4)
- Power purchase from the main grid constraints
In this paper, the distribution network is considered a feeder network; therefore, the reverse power flow to the main grid is not taken into account.
- (5)
- Security constraints
- (6)
- Power transaction price constraints
Under the game framework constructed in this paper, the DNO holds the pricing initiative. To prevent the DNO from adopting extreme pricing strategies driven by benefit motivation, specifically, by setting the power selling prices to the maximum and the purchase prices to the minimum, an average constraint is imposed on the power transaction prices set by the DNO, as shown in Equations (20) and (21).
where and represent the upper and lower limits of the DNO’s purchase prices from the MMA, respectively; and represent the upper and lower limits of the DNO’s selling prices to the MMA, respectively; and and represent the upper limits of the DNO’s average purchase and selling prices from/to the MMA, serving to constrain the range of power transaction prices.
3.1.2. The MMA Response Model
The MMA response model describes the response strategy of the MMA as the follower, given the transaction prices and network topology determined by the DNO.
- (1)
- Objective function
Specifically, each MG coordinately optimizes its transaction power with the DNO, ESS charging and discharging power, P2P exchange power with other MGs, and REG curtailment power to minimize the overall operational cost of the alliance.
In this context, the P2P exchange power not only affects the power balance and operation strategy of each MG but also provides boundary conditions for P2P transaction pricing and benefit allocation in the lower-layer cooperative game model. The objective function of the MMA response model is formulated as follows:
where represents the operational cost of MGn; represents MGn’s benefits derived from power transactions with the DNO; represents MGn’s benefits derived from P2P transactions with other MGs; represents the operational cost of ESS; represents the curtailment cost of REG; represents the P2P transaction prices between MGn and MGm; represents the P2P exchange power between MGn and MGm; and represents the set of MG members within the MMA.
- (2)
- Constraints
- (1)
- Power balance constraints
According to Equation (1), is equivalent to the power sold by MGn to the DNO, while is equivalent to the power purchased by MGn from the DNO.
- (2)
- ESS operational constraints
- (3)
- REG curtailment constraints
- (4)
- Transaction power constraints between MGn and the DNO
- (5)
- P2P exchange power constraints among MG members
3.2. An Energy Interaction Model for Multi-Microgrid Based on a Cooperative Game
Through the cooperative game, both the collective benefits of the alliance and the individual benefits of each MG can be effectively enhanced. To ensure fairness in cooperative benefit allocation within the MMA, this paper introduces Nash bargaining theory to establish a P2P power sharing and benefit allocation mechanism. By maximizing the product of all cooperative members’ benefit utilities, it provides a fair allocation scheme that balances the collective and individual benefits. The constructed cooperative game model is shown in Equation (36), where the solution that minimizes the Nash product represents the optimal equilibrium solution of the cooperative game.
where represents the operational cost when MGn does not participate in cooperation, corresponding to the disagreement point of the Nash bargaining and represents the utility benefits obtained by MGn through cooperation. In the cooperative game, each MG is required to determine the P2P transaction prices and exchange power, with its bargaining strategies denoted as .
Since the multi-microgrid cooperative game model established in Equation (37) constitutes a non-convex nonlinear optimization problem with coupled variables, it is difficult to solve directly. Referring to [16], this paper equivalently reformulates the Nash bargaining model into two independent convex optimization sub-problems, namely the MMA cooperative alliance cost minimization sub-problem (SP1) and the cooperative benefit allocation sub-problem (SP2).
It should be noted that this paper assumes all MGs to be rational participants with access to reliable information, including transaction prices, REG output and load power forecasts and operational constraints. Each MG makes decisions based on its own economic interests. MGs are willing to participate in P2P cooperative transactions only when the benefits obtained from cooperation are no lower than those in the non-cooperative scenario. This assumption provides a clear basis for calculating and allocating cooperative surplus benefits.
- SP1: Cooperative alliance cost minimization
The SP1 maintains consistency in form with the master–slave game model constructed above.
where represents the operational cost of MGn after participating in cooperation. It should be noted that when solving SP1, the P2P transaction cost among MGs is not considered, denoted as . Additionally, an auxiliary variable is introduced to decouple the P2P exchange power between MGn and MGm, as shown in Equation (38).
- SP2: Cooperative benefit allocation based on asymmetric Nash bargaining
This paper introduces a nonlinear function based on contribution degree to quantify the bargaining metric for each MG in P2P transactions. MGs will negotiate based on this metric to determine the P2P transaction prices. It should be noted that both power supply and acceptance contribute to the P2P transactions. However, considering that the transaction prices among MG members within the MMA are lower than those with the DNO, it is generally recognized that the contribution degree of power supply exceeds that of power acceptance for the same amount of electricity [16]. The expression for is as follows:
where and represent the power supplied and accepted by MGn through P2P transactions, respectively; and and represent the maximum power that each MG can supply and accept through P2P transactions, respectively.
The cooperative benefits and the P2P exchange power obtained by solving the SP1 are denoted as and , respectively. Substituting them into SP2, the cooperative benefit allocation model for multi-microgrids based on asymmetric Nash bargaining can be obtained, as shown in Equation (40). Due to page limitations, the derivation and proof of this model are detailed in Reference [28].
Thus, the P2P power transaction results can be obtained by solving SP1, while the P2P transaction prices and cooperative benefit allocation results can be obtained by solving SP2.
4. Intra-Day Voltage Rolling Optimization Control Strategy
In the intra-day stage, rolling adjustments are performed to correct real-time power imbalance and voltage deviations caused by forecast deviations in REG output and load power, using the transaction prices, distribution network topology and MG operation strategies determined in the day-ahead stage as boundary conditions.
Specifically, when a power shortage or surplus REG output occurs in an MG, its internal ESS is firstly employed to smooth the power imbalance. If power balance still cannot be maintained after ESS regulation, the MG exchanges power with the DNO through interconnection lines. However, variations in interconnection line power directly cause fluctuations in the injected power at the MG connection node, which may further induce instantaneous deviations in the node voltages of the distribution network. In severe cases, this may lead to operational risks such as voltage limit violations. To address this issue, reactive power regulation devices, such as capacitor banks and SVCs, are introduced. Accordingly, the intra-day objective function is formulated to minimize the sum of the average deviation rate of node voltage and the average adjustment rate of dispatch cost, as shown in Equation (41).
where the superscripts rt and da represent intra-day and day-ahead variables, respectively; represents the node voltage magnitude of the distribution network; represents the reference voltage; represents the system adjustment cost resulting from source–load power deviations, incorporating the ESS adjustment cost and power transaction adjustment cost; and represent the deviations in the DNO’s power purchased from and sold to MGn, respectively; and is the deviation penalty coefficient used to constrain power fluctuations in the interconnection lines. The operational constraints related to the intra-day stage are detailed in Appendix B.
It should be noted that the dispatch cost in the intra-day stage is used to quantify the additional adjustment cost incurred to maintain power balance and voltage stability when actual REG output and load power deviate from their day-ahead forecast values. It includes the ESS charging and discharging adjustment cost, the penalty cost for power deviations on the interconnection lines between MGs and the DNO, and the operational cost of reactive power regulation devices.
A shorter dispatch interval enables the system to respond more sensitively to source–load power fluctuations. However, frequent equipment adjustments may also increase the dispatch cost and computation burden [29]. To this end, this paper proposes a variable time scale rolling dispatch strategy to reduce voltage deviations by adjusting reactive-power regulation devices and ESS operation while avoiding a significant increase in dispatch cost caused by overly frequent adjustments.
Under this strategy, the DNO can select either a 15 min or 5 min dispatch interval, and the switching criterion is determined by the deviation between the current operating state and the day-ahead dispatch plan. Specifically, this deviation is represented by the difference between the real-time power and the day-ahead scheduled power of the interconnection lines, as expressed in Equation (42).
where is defined as the power deviation index; represents the initial dispatch time; represents the basic dispatch time scale; represents an optional shorter dispatch time scale; represents the number of time intervals corresponding to contained within , which is taken as 3 in this paper; and is an infinitesimal positive value.
Based on the ultra-short-term forecasts of load power and REG output, the power deviation index is initially calculated under the basic dispatch interval of 15 min. If the deviation falls within the allowable threshold, the 15 min dispatch interval is maintained. Otherwise, the system switches to the 5 min dispatch interval and recalculates the deviation index . The reduction rate of the power deviation index and the increase rate of the dispatch cost are then calculated. If the former exceeds the latter, the 5 min dispatch interval is implemented; otherwise, the original 15 min dispatch interval remains unchanged.
It should be noted that the two dispatch intervals adopted in the intra-day operation stage only change the adjustment frequency of dispatch instructions within the basic dispatch cycle. Transaction settlement continues to be conducted at a fixed 15 min interval, which does not affect the existing transaction rules of the electricity markets [28].
5. Model Solution Methods
5.1. A Master–Slave Game Model Solution Based on Strategy Separation
For the master–slave game model, traditional solution methods typically use the Karush–Kuhn–Tucker (KKT) conditions to transform the two-layer model into a single-layer mathematical programming optimization problem [30]. However, the game model constructed in this paper contains numerous 0–1 discrete variables, such as branch switch status and ESS charging/discharging status, which fail to satisfy the applicability conditions of the KKT-based transformation.
Therefore, this paper adopts a distributed solution method based on strategy separation. At the DNO layer, the continuous and discrete variables are separated. The differential evolution algorithm is then adopted to alternately optimize day-ahead strategies, including power transaction prices and network topology, while the Gurobi solver is embedded in the iterative process to handle the operation decisions at the MMA layer. This approach avoids centralized optimization of large-scale mixed-integer programming problems and significantly improves solution efficiency. Moreover, in each iteration, the MMA layer only receives information such as transaction prices and network topology from the DNO layer and then feeds back the corresponding operation strategies to the DNO layer. Sensitive information, such as internal equipment parameters and load characteristics, does not need to be exchanged. Therefore, the proposed method effectively protects the privacy and security of all entities involved in the game.
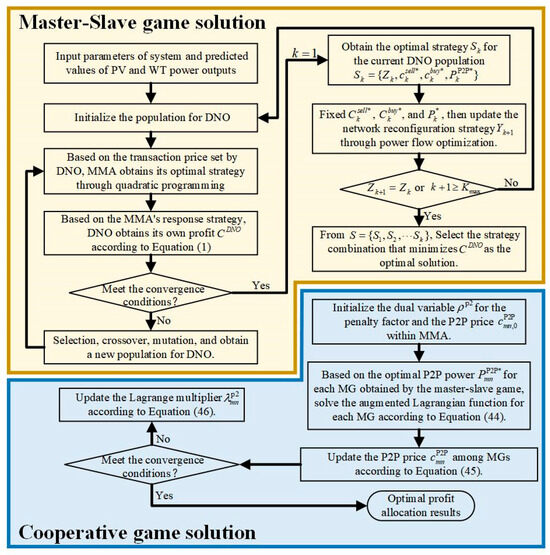
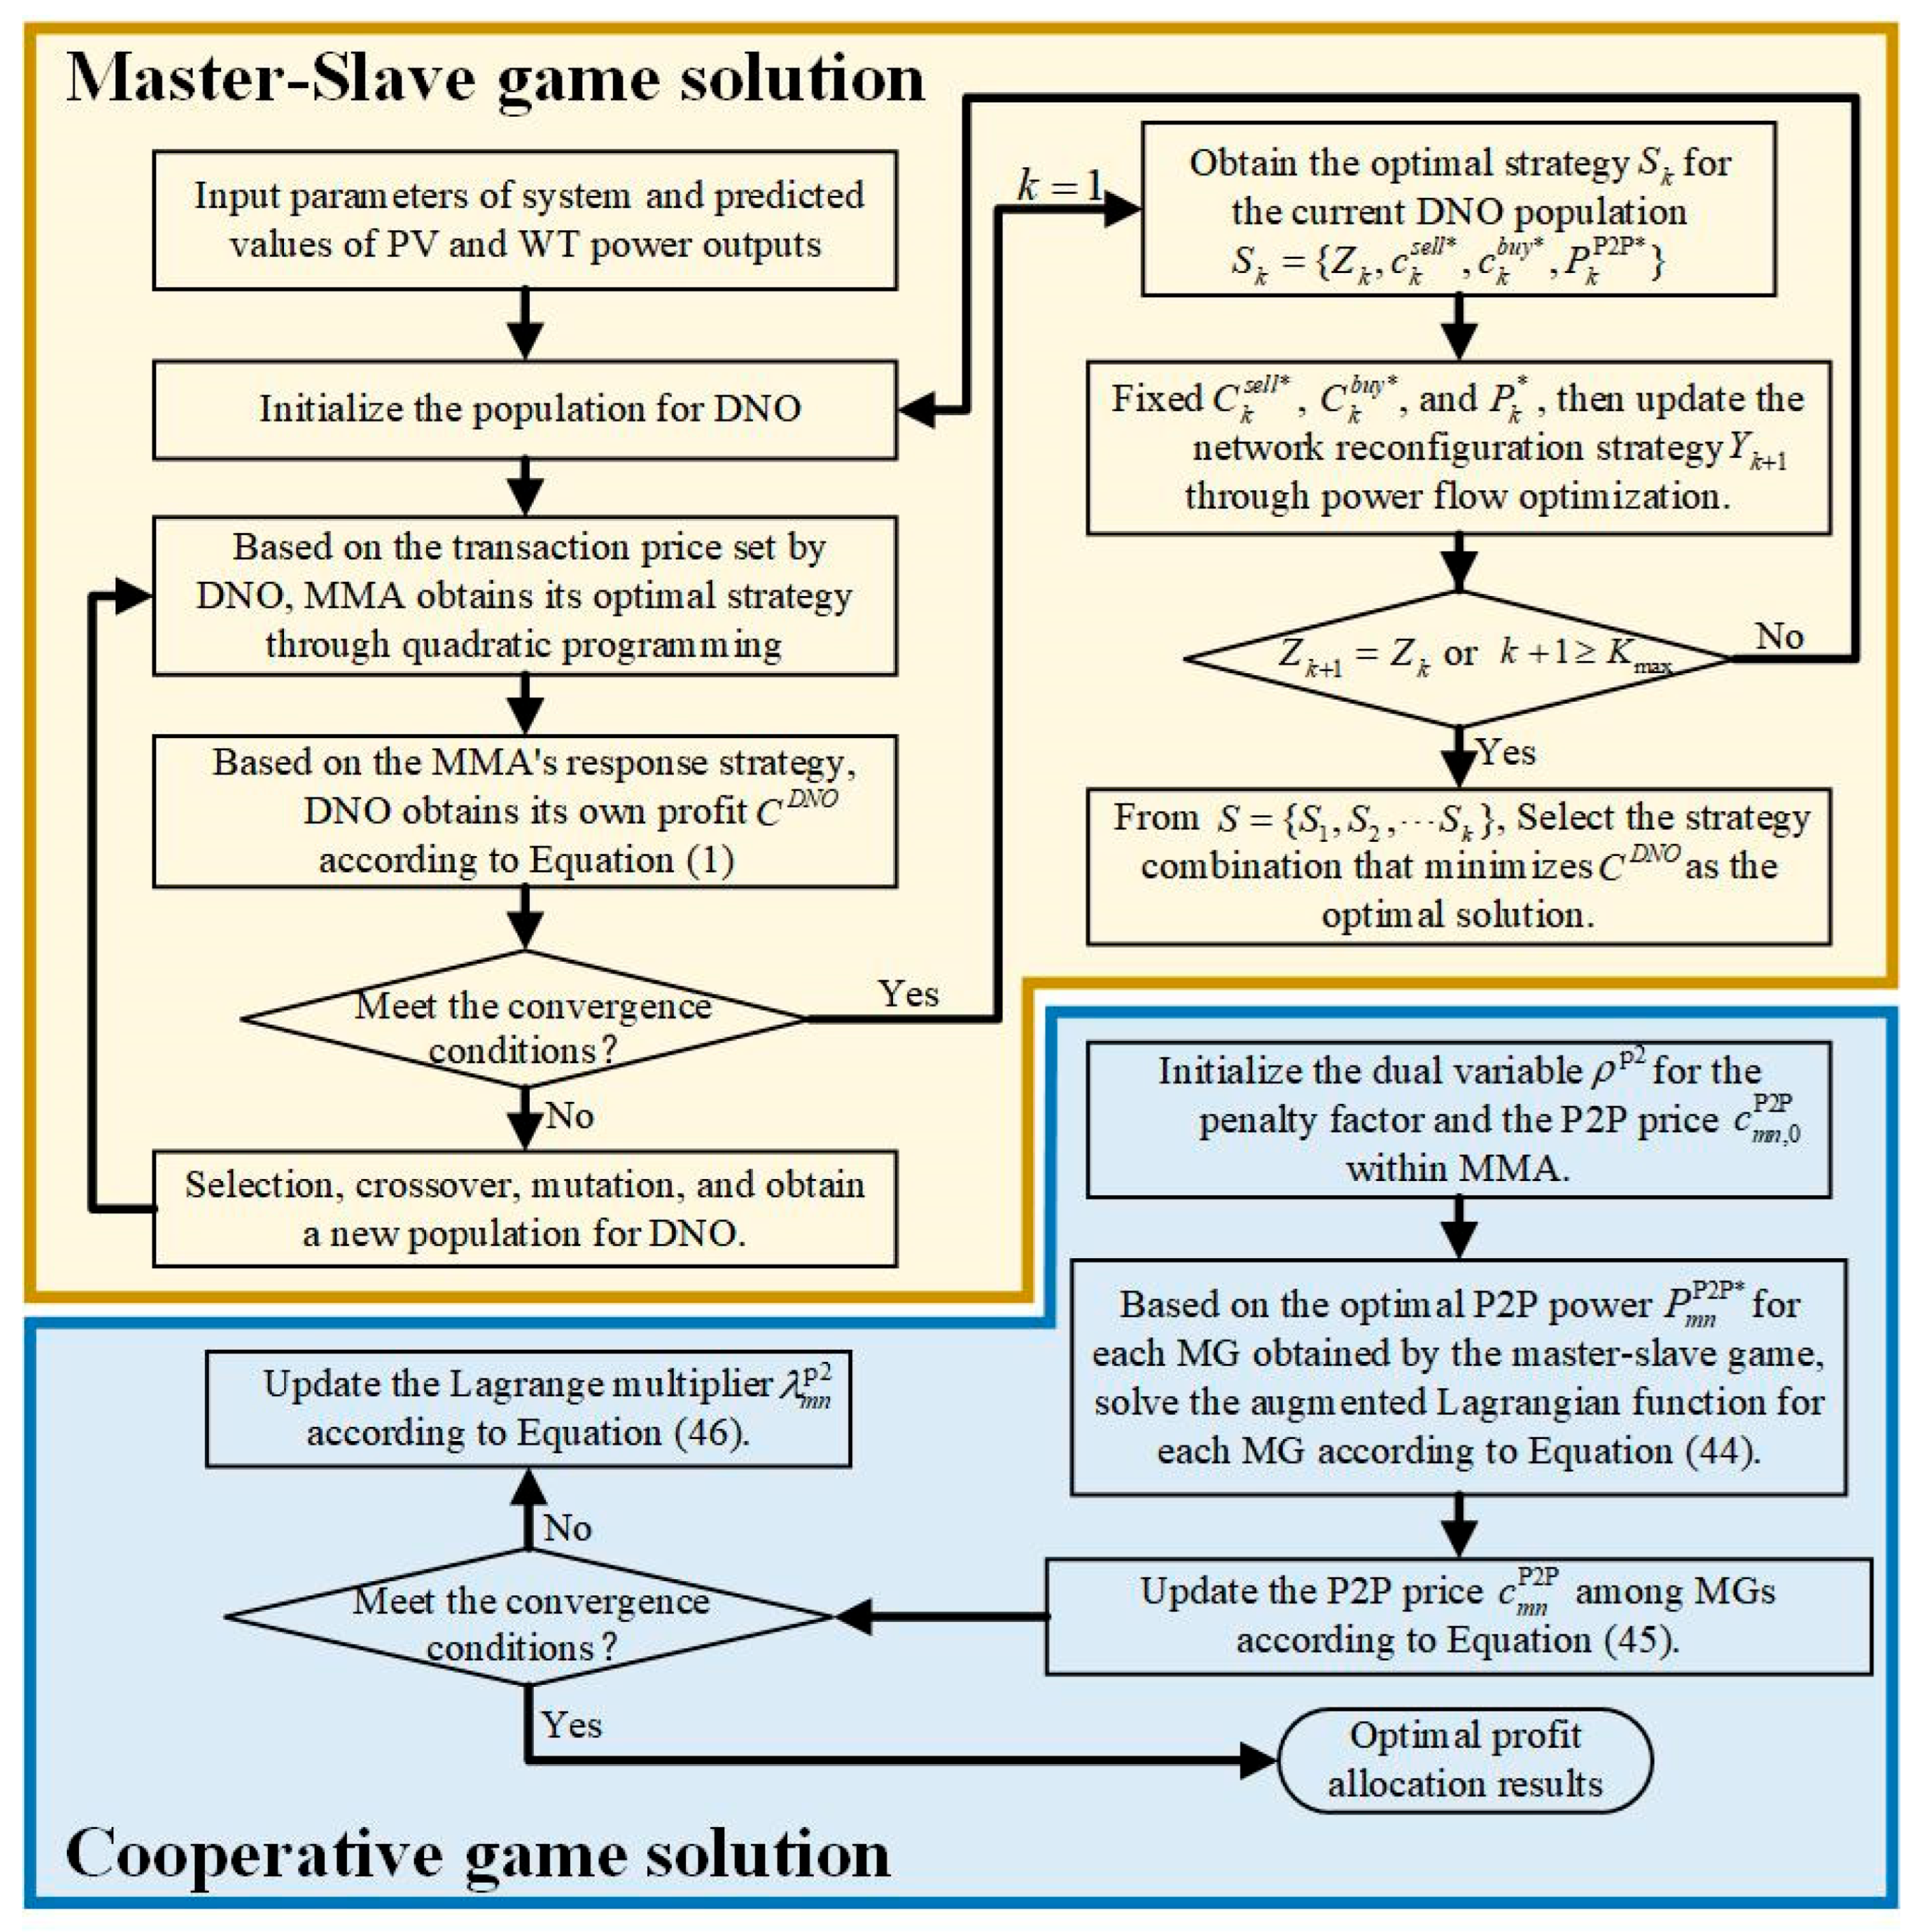
The solution steps for the day-ahead master–slave game model based on strategy separation are as follows:
Step 1: Initialize the network topology , then adopt the differential evolution algorithm to determine the current optimal transaction prices and , and the optimal P2P transaction power . The current optimal strategy combination is denoted as .
Step 2: Fix the continuous-variable strategy transmitted from Step 1, then calculate and update the network reconfiguration strategy.
Step 3: Fix the network reconfiguration strategy transmitted from Step 2, then calculate and update the transaction prices and P2P transaction power. The optimal strategy combination under the current iteration is denoted as .
Step 4: Terminate the iteration when the network reconfiguration strategy obtained in the -th iteration no longer changes relative to , or when the iteration count reaches the upper limit . Then, select the strategy combination that minimizes the DNO’s operational cost from all historical optimal strategy combinations as the final decision. Otherwise, return to Step 2 and continue the iterations.
5.2. A Multi-Microgrid Cooperative Game Model Solution Based on ADMM
To protect the data privacy of each MG, this paper adopts the ADMM algorithm to solve the SP2 [16], thereby obtaining the P2P transaction prices and cooperative benefit allocation scheme for MG members within the MMA. Since the P2P transaction prices between MGn and MGm in Equation (40) are mutually coupled, the following consistency constraint is introduced to achieve decoupling, as shown in Equation (43).
when , it indicates that MGn and MGm have reached a consensus on the P2P transaction prices. The solution process for the day-ahead multi-microgrid cooperative game model based on ADMM is as follows:
Step 1: Substitute the P2P transaction power and obtained by solving SP1 into Equation (39) to calculate the bargaining metric for each MG participating in P2P transactions.
Step 2: Introduce the Lagrange multiplier and penalty factor to construct the augmented Lagrangian function for SP2.
where represents the Lagrange multiplier related to the P2P transaction prices in the SP2, and represents the penalty factor, which is set to in this paper.
Step 3: Update the expected transaction price for MGn according to Equation (45), while the other MGs update their respective expected transaction prices based on through local computation.
where represents the current iteration count.
Step 4: After each iteration, update the Lagrange multiplier according to Equation (46).
Step 5: Update the iteration count .
Step 6: If the convergence condition in Equation (47) is satisfied, terminate the iteration and obtain the equilibrium solution for the P2P transaction prices among all MGs. Otherwise, repeat Step 3 to Step 6 until the iteration converges.
where represents the dual residual convergence threshold for SP2.
Thus, the solution strategy for the hybrid game model is illustrated in Figure 3.
Figure 3.
Hybrid game strategy solution flow chart.
6. Discussion
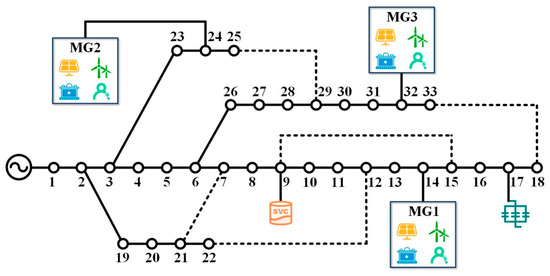
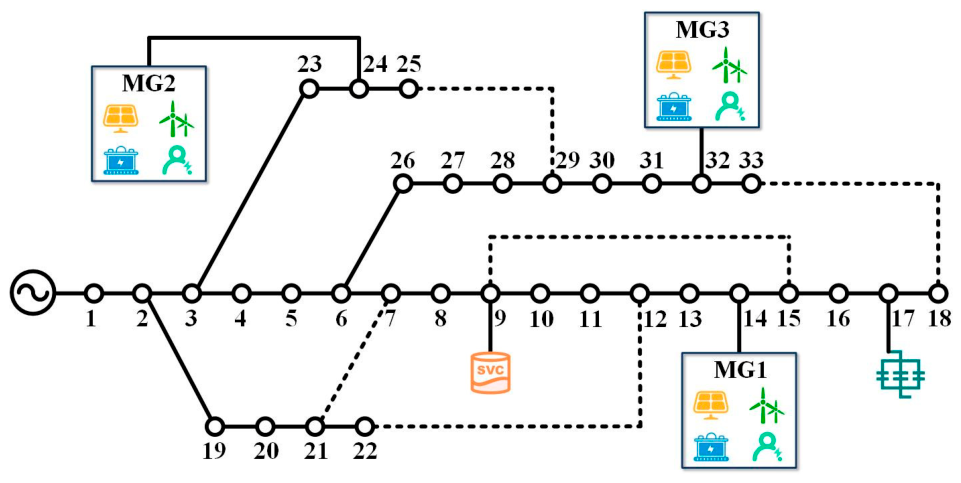
An IEEE 33-node system with three MGs, as shown in Figure 4, is adopted as the simulation system to validate and analyze the proposed strategy. The installed capacities of REG and ESS in each MG are given in Table A2. The forecasted REG outputs and load power are shown in Figure A1 and Figure A2. The power purchase prices from the upstream grid are listed in Table A3. Capacitor banks and SVC are installed at nodes 9 and 17, respectively. The relevant equipment parameters and cost coefficients are provided in Table A4. P2P power transactions among MGs are facilitated through dedicated interconnection lines; therefore, the transmission cost through the DNO is not considered.
Figure 4.
IEEE 33-node case system with three MGs.
6.1. Analysis of the Hybrid Game Strategy Results
6.1.1. Comparison of Different Cases
To validate the effectiveness and superiority of the proposed hybrid game strategy, the following four cases are designed for comparative analysis. The operational results are shown in Table 1, and Table 2 further provides the optimized day-ahead network topology obtained in Case 3.
Table 1.
Comparison of operation results for the four cases.
Table 2.
Day-ahead reconfiguration plan.
Case 1: The DNO operating cost is minimized without considering the master–slave or the cooperative game.
Case 2: The master–slave game between the DNO and the MMA is considered, while the cooperative game among MGs is not included.
Case 3: The master–slave game between the DNO and the MMA is considered, and the cooperative game among MGs based on asymmetric Nash bargaining is also included, as proposed in this paper.
Case 4: The same setting as Case 3 is adopted, but network reconfiguration is not considered.
- (1)
- Compared with Case 1, Case 2 increases the operational cost of the DNO by ¥ 77.5 while decreasing the operational cost of the MMA by ¥ 248.3 and the REG curtailment cost by ¥ 75.3. This is because the master–slave game strategy enhances the transaction interaction between the MMA and the DNO and helps balance their economic interests. By selling surplus REG to the DNO, the MMA improves REG accommodation, although this increases the DNO’s power purchase cost to some extent.
- (2)
- Compared with Case 2, the total operational cost of the MMA in Case 3 decreases by 323.2 ¥. Specifically, the power purchase cost from the DNO and the ESS operational cost decreases by 9.7% and 11.6%, respectively, while full REG accommodation is achieved. This result indicates that the cooperative game strategy incentivizes MGs to prioritize P2P transactions to compensate for power shortages or absorb surplus REG. As a result, the internal power mutual support capability of the MMA is fully activated, thereby reducing the dependency of MGs on ESS regulation and power purchases from the DNO.
- (3)
- Compared with Case 3, the ESS operational cost and REG curtailment cost of the MMA in Case 4 increase by ¥ 9.3 and ¥ 22.4, respectively. The reason is that network reconfiguration optimizes power flow distribution among distribution lines and effectively enhances the maximum power injection capacity at MG connection nodes. Therefore, network reconfiguration not only reduces active power losses but also further promotes REG accommodation in MGs, achieving mutual benefits for both the DNO and the MMA.
Therefore, compared with dispatch methods that do not consider game interactions or incorporate only a single game mechanism, the proposed hybrid game method not only ensures the dominant role of the DNO in transaction pricing but also reduces the MMA’s dependence on power purchase from the DNO through P2P power exchanges among MGs. In this way, the transaction interaction potential among multiple entities is fully exploited, which effectively enhances local REG accommodation and system operational economy.
6.1.2. Analysis of Transaction Price Results
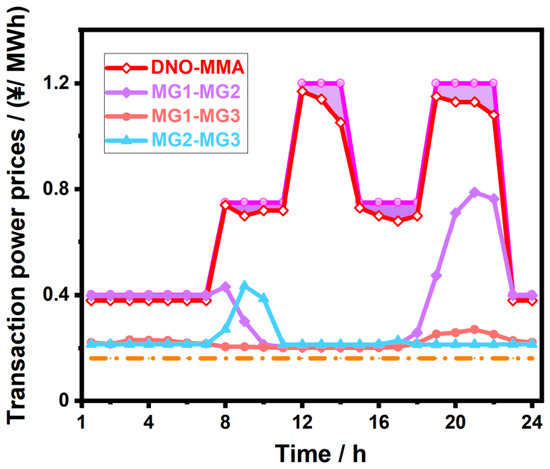
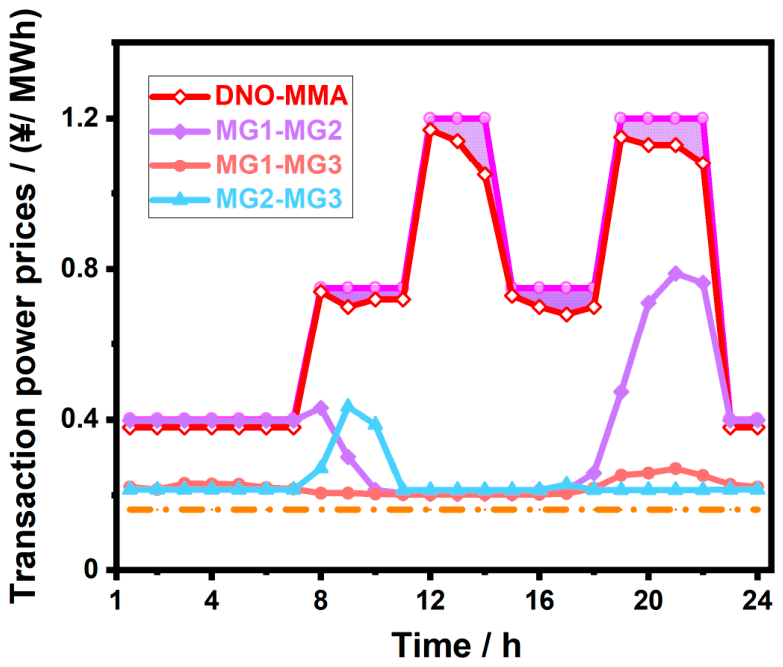
To analyze the impact of the proposed hybrid game strategy on power transaction prices, Figure 5 presents the optimized DNO’s purchase prices from the MMA and the P2P transaction prices among MGs in Case 3. The magenta and orange dashed lines represent the DNO’s purchase and selling prices from/to the MMA in Case 1, respectively, where no game strategy is considered.
Figure 5.
Transaction price results.
As shown in Figure 5:
- (1)
- In Case 3, the DNO’s power selling prices to the MMA are lower than those in Case 1 across all dispatch periods. This is because the hybrid game strategy incentivizes MGs to form an alliance and strengthens their transaction interactions with the DNO. Meanwhile, the mutual power support and sharing mechanism among MGs effectively reduces the MMA’s demand for power purchased from the DNO, significantly improving the MMA’s bargaining leverage in transactions.
- (2)
- During the dispatch cycle, the P2P transaction prices among MGs remain within the range bounded by the DNO purchase and selling prices for the MMA. This enables each MG to purchase power from other MGs at a price lower than the DNO selling price and sell power to other MGs at a price higher than the DNO purchase price. Such a price mechanism effectively incentivizes MG members within the MMA to participate in P2P transactions.
6.1.3. Analysis of Benefit Allocation Results
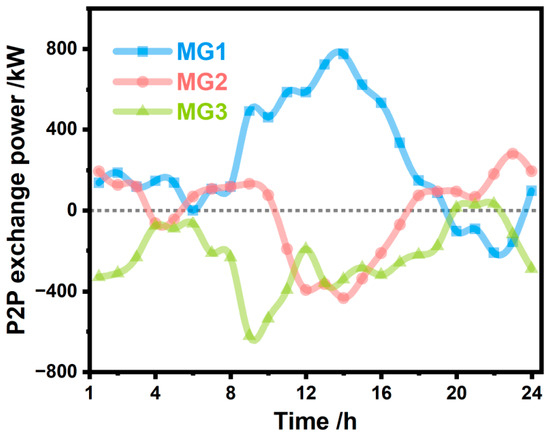
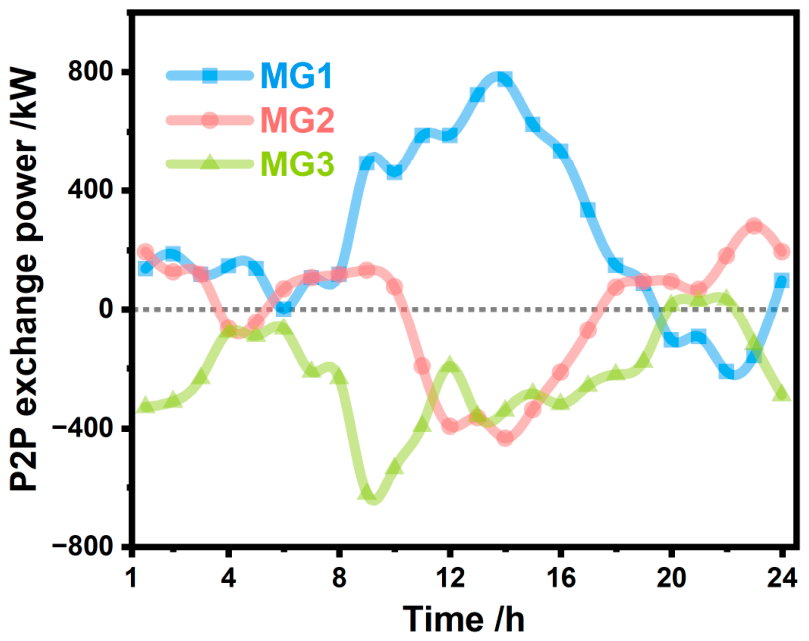
To validate the effectiveness of the proposed asymmetric Nash bargaining strategy in ensuring fairness in P2P transactions among MGs, Table 3 compares the results of Case 3 with those obtained using the standard Nash bargaining strategy. Figure 6 further presents the P2P exchange power results among MGs in Case 3.
Table 3.
Comparison of cooperative game results for different Nash bargaining strategies.
Figure 6.
P2P transaction results among MGs.
As shown in Table 3, both bargaining strategies can effectively improve the cooperative benefits of MGs within the MMA. Specifically, under the standard Nash bargaining strategy, since each MG possesses equal bargaining leverage, the cooperative benefits allocated to different MGs are relatively similar. However, combined with the P2P exchange power results in Figure 6, MG3 contributes the most power in P2P transactions, while MG1 and MG2 primarily serve as power recipients. This indicates significant differences in the contribution degrees of the three MGs to P2P transactions. Therefore, the cooperative benefit allocation derived from the standard Nash bargaining strategy proves inequitable. In contrast, under the proposed asymmetric Nash bargaining strategy, MG3, with the highest contribution degree, achieves a bargaining factor of 1.54 and cooperative benefits of ¥ 361.7. Meanwhile, MG2, with the lowest contribution degree, achieves a bargaining factor of only 0.63 and cooperative benefits of ¥ −239.1.
Compared with the standard Nash bargaining strategy, the proposed asymmetric Nash bargaining strategy assigns higher bargaining weights to MGs with greater contributions in P2P transactions, enabling them to obtain more cooperative benefits. This improves the consistency between the benefit allocation results and the actual contributions of different MGs. Therefore, the proposed method can not only enhance the willingness of MGs to participate in P2P cooperative transactions but also effectively ensure the fairness of benefit allocation within the MMA.
6.2. Analysis of MG Operation Results
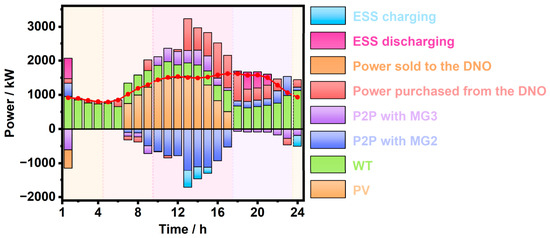
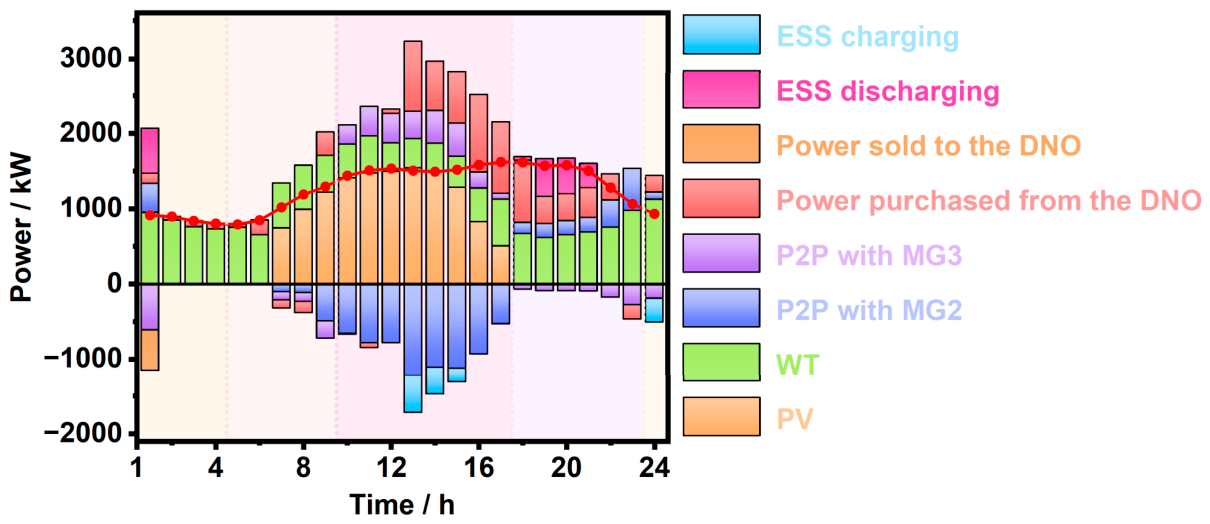
To analyze the operational performance of each MG under the hybrid game strategy, this section takes MG1 as an example and analyzes its day-ahead dispatch results in conjunction with the P2P power transaction results shown in Figure 6.
According to the results in Figure 7, MG1 mainly relies on WT and PV outputs as its primary power supplies, since the REG cost is not taken into account. When power shortages occur, MG1 adjusts its operating state by preferentially discharging the ESS or purchasing power from other MGs according to the unit dispatch cost. If the power imbalance still remains, MG1 then purchases power from the DNO to minimize its own operational cost. The specific analysis is as follows:
Figure 7.
Day-ahead dispatch results of MG1.
- (1)
- During the period from 23:00 to 09:00 the next day, insufficient WT and PV outputs lead to tight power supply within each MG, reducing their willingness to participate in P2P transactions. Since the unit ESS discharge cost is lower than the DNO’s selling prices, MG1 preferentially discharges the ESS to compensate for the power shortage. From 04:00 to 09:00, as the ESS reaches its minimum SOC limit and can no longer discharge, MG1 turns to the DNO for power support.
- (2)
- During the period from 10:00 to 17:00, due to sufficient PV output, MG1 primarily sells surplus power to MG2 and MG3 through P2P transactions to obtain higher benefits. However, after 14:00, the power sold by MG1 declines significantly, while both the ESS charging power and MG1’s power purchases from the DNO increase. This is attributed to two factors. On the one hand, the overall load reduction in the system reduces the power purchase demand of MG2 and MG3. On the other hand, MG1 charges its ESS during low-price periods and discharges it during subsequent high-price periods to achieve peak-to-valley arbitrage benefits.
- (3)
- From 18:00 to 22:00, PV output sharply drops while MG1’s load rapidly increases. Meanwhile, MG3 maintains sufficient WT output with a relatively low load level. Therefore, MG1 mainly satisfies its internal power demand by purchasing power from MG3. It is worth noting that although the unit ESS discharging cost during this period is lower than the P2P transaction price, MG1 does not adopt the ESS discharging strategy. This decision is made from the perspective of overall operational economy, as the DNO’s selling prices during subsequent power shortage periods are significantly higher than the P2P transaction prices.
6.3. Analysis of Intra-Day Dispatch Results
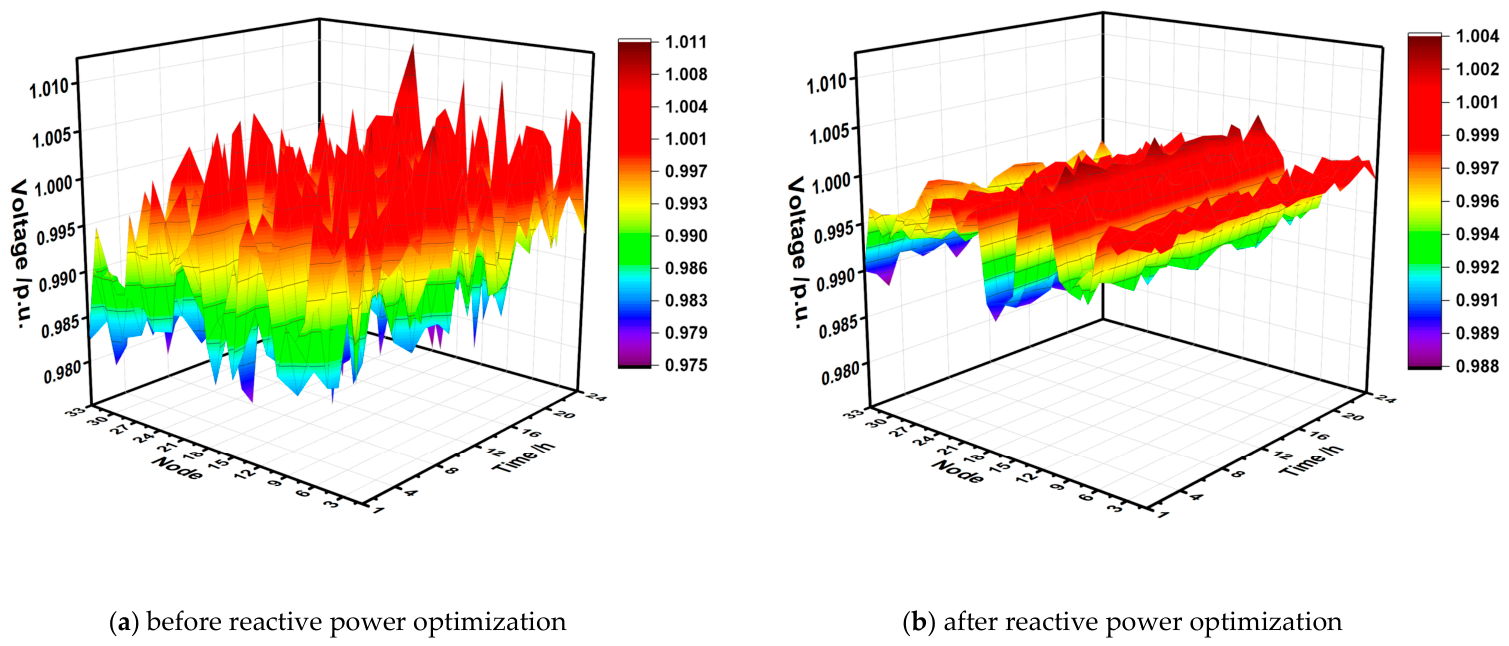
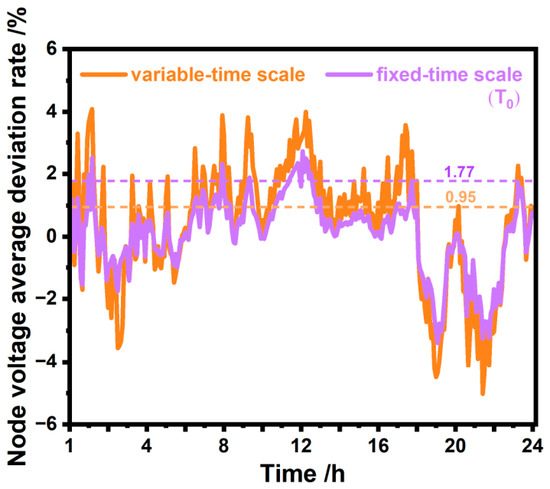
Based on the day-ahead dispatch results of Case 3 and the ultra-short-term forecasts of intra-day WT and PV outputs, this paper adopts fixed time scale strategies (, ) and the proposed variable time scale strategy to perform real-time dispatch optimization for the multi-microgrid active distribution system. The changes in voltage magnitudes at each node of the distribution network before and after optimization are shown in Figure A3. Figure 8 and Table 4 present the average node voltage deviation rate and the system’s total operational cost under different strategies.
Figure 8.
Comparison of node voltage average deviation rates under different strategies.
Table 4.
Comparison of intra-day dispatch results under different strategies.
From the above results, it can be observed that:
- (1)
- By adjusting the SVC output and capacitor banks, voltage fluctuations at each node of the distribution network are effectively reduced, significantly improving the system’s power supply quality.
- (2)
- Compared with the 15 min fixed time scale strategy, the 5 min fixed time scale strategy and the variable time scale strategies reduce the average node voltage deviation rate by 0.91% and 0.82%, respectively. However, the total operational cost increases by 446.5 and ¥ 202.9, respectively. This indicates that a shorter dispatch time scale can effectively mitigate power fluctuations on interconnection lines by enhancing the system’s responsiveness to source–load variations, thereby reducing disturbances to the operational voltage of the distribution network. However, overly frequent regulation also leads to a significant increase in system’s operational cost. In contrast, the variable time scale strategy can adaptively adjust the dispatch interval according to real-time power fluctuations, achieving an effective balance between operational economy and voltage stability.
To further illustrate the operation mechanism of the proposed variable time scale dispatch strategy, MG1 is selected as an example for analysis. Table 5 presents the selection criteria and corresponding dispatch interval results for MG1 during a typical period from 19:00 to 20:00.
Table 5.
Intra-day dispatch results of MG1 (19:00–20:00).
According to the results in Table 5, it can be observed that:
- (1)
- During period t1, the deviations between the actual and forecasted WT and PV outputs are relatively small. Accordingly, the deviation between MG1’s real-time power purchase and the day-ahead dispatch plan is only 4.6%, which is lower than the 5% activation threshold of the variable time scale dispatch strategy. Therefore, the system continues to operate with the 15 min dispatch interval during this period.
- (2)
- During periods t2 and t3, the real-time power deviation of MG1 exceeds 5% in both cases. Moreover, the reduction rate of power deviation calculated under the 5 min time scale is lower than the corresponding increase rate of its operational cost. Therefore, the system switches to the 5 min dispatch interval during these periods.
- (3)
- During period t4, although the power deviation of MG1 is reduced by 2.6% under the 5 min dispatch interval, frequent regulation results in a 5.2% increase in MG1’s operational cost. Therefore, the system switches back to the 15 min dispatch interval during this period.
Compared with fixed time scale dispatch strategies, the proposed variable time scale dispatch strategy can adaptively select the dispatch interval according to real-time power deviations and changes in dispatch cost. Specifically, a shorter dispatch interval is adopted under large source–load fluctuations to enhance voltage control capability, while a longer dispatch interval is adopted under small source–load fluctuations to reduce the system’s regulation cost. Therefore, the proposed strategy can better balance voltage stability and dispatch economy and exhibits stronger adaptability to source–load fluctuations, making it suitable for the operation of multi-microgrid distribution systems with high REG penetration.
6.4. Computational Efficiency Validation
To verify the efficiency of the proposed solution method combining strategy separation and ADMM, this section compares it with the centralized MISOCP method, the PSO-embedded method and the GA-embedded method. The results are shown in Table 6.
Table 6.
Comparison of different solution methods.
The comparison results show that, compared with the centralized solution method, the deviation in the optimal objective function value obtained by the proposed method is only 0.24%, while the computation time is reduced by 391s. This indicates that the proposed method significantly improves solution efficiency while ensuring solution accuracy comparable to that of the centralized method. Compared with the PSO-embedded method and the GA-embedded method, the proposed method reduces the optimal objective function value by 2.43% and 3.16%, respectively, and requires fewer iterations, indicating superior solution quality and convergence performance.
Therefore, the proposed solution method ensures solution optimality while performing superior convergence efficiency and computational speed, thereby enabling efficient solution of the hybrid game model with 0–1 variables and coupled P2P transaction variables.
6.5. Sensitivity Analysis
6.5.1. Impact of REG Intermittency on Operation Results
In this paper, REG intermittency is characterized by random upward or downward fluctuations of actual output relative to the forecast value. To analyze the impact of REG intermittency on the operation results of the proposed strategy, different disturbance levels are introduced based on the day-ahead PV and WT output forecasts to represent varying intensities of REG intermittency. The operation results under different disturbance levels are compared in Table 7.
Table 7.
Comparison of operational results under different disturbance levels.
As shown in Table 7, as the REG output disturbance increases from 0 to 30%:
- (1)
- The MMA’s power purchase cost from the DNO increases by ¥ 253.7, and the ESS operating cost increases by ¥ 36.1. This is because when REG output fluctuates downward, MGs need to purchase more power from the DNO to meet load demand. When REG output fluctuates upward and local accommodation capacity is limited, MGs need to increase ESS regulation or REG curtailment to maintain power balance. Therefore, stronger REG intermittent reduces the applicability of the day-ahead dispatch plan to actual operation, leading to an increase in system operational cost.
- (2)
- The P2P transaction energy within the MMA increases from 4.60 MWh to 6.32 MWh, indicating that as REG intermittency intensifies, the MMA can enhance P2P power sharing among MGs and preferentially accommodate surplus power within the alliance. This reduces the dependence on power purchases from the DNO to some extent and mitigates the adverse impact of REG intermittency on the operational economy of the MMA.
- (3)
- The average node voltage deviation rate increases from 0.95% to 1.61%, and the number of switches to the 5 min dispatch intervals under the variable time scale strategy increases from 16 to 45. This indicates that stronger REG intermittency aggravates system power imbalance, which leads to larger node voltage deviations. Accordingly, the proposed variable time scale strategy switches to shorter dispatch intervals more frequently to enhance the system’s responsiveness to REG intermittency.
In summary, REG intermittency increases the external power purchase cost and operation adjustment cost of the MMA and adversely affects system voltage stability. Under the proposed strategy, P2P transactions alleviate local power imbalance by promoting mutual power support among MGs, while variable time scale dispatch suppresses the expansion of voltage deviations by enhancing system responsiveness. Therefore, the proposed strategy can effectively improve the system’s adaptability to REG intermittency.
6.5.2. Impact of Seasonal Differences on Operation Results
To comprehensively analyze the impacts of different weather conditions and load characteristics on system operation, four seasonal typical days are selected using a clustering method, as shown in Figure A1 and Figure A2 in Appendix A. Each typical day represents the REG output and load variation characteristics of a specific season, and the corresponding calculation results are presented in Table 8.
Table 8.
Comparison of operational results under different seasonal typical days.
The results show that seasonal variations have a significant impact on system operation. Specifically, in winter, relatively low PV output and high load demand lead to insufficient local power supply in MGs, resulting in the highest power purchase cost from the DNO and ESS operating cost for the MMA, as well as a relatively large average voltage deviation rate. In summer, although the load demand is also high, sufficient PV output partially alleviates the need for external power purchases. Meanwhile, concentrated REG output during certain periods leads to an increase in REG curtailment cost. In spring and autumn, better source–load matching contributes to lower system operational cost and reduced voltage deviations.
Overall, the proposed method maintains a low REG curtailment level under different seasonal typical days and achieves an effective balance between operational cost and voltage stability, indicating its strong adaptability to seasonal source–load variations.
To further verify the applicability of the proposed strategy under long-term operating conditions, this section calculates the annual equivalent operational indicators according to the clustering weights of the four typical seasonal days. The results are shown in Table 9.
Table 9.
Results of annual equivalent operational indicators.
The annual equivalent results show that the fixed 5 min dispatch strategy achieves the best voltage control performance, but it also leads to the highest annual operational cost due to its high regulation frequency. Although the fixed 15 min dispatch strategy can reduce the operational cost, it results in relatively large voltage deviations, making it difficult to fully meet the requirements for stable system operation. In contrast, the proposed variable time scale strategy achieves voltage control performance close to that of the fixed 5 min strategy at the annual operation level while significantly reducing the dispatch cost and maintaining a high REG accommodation level.
These results indicate that the proposed strategy can effectively balance dispatch economy, voltage stability and REG accommodation under long-term operating conditions, confirming its applicability to extended operating periods with varying REG output and load characteristics.
7. Conclusions
This paper proposes a day-ahead and intra-day coordinated dispatch strategy for multi-microgrid active distribution systems. The proposed strategy comprehensively considers the leader–follower transaction relationship between the DNO and the MMA, P2P transactions and cooperative benefit allocation among MGs and voltage rolling control under a variable dispatch interval. In this way, multi-time scale coordination in energy management and operational optimization for multi-microgrid active distribution systems is achieved. The main conclusions are as follows:
- (1)
- The proposed hybrid game strategy can effectively enhance transaction interactions between the MMA and the DNO. While ensuring REG accommodation, it reduces the MMA’s power purchase cost from the DNO and improves the system’s operational economy. Meanwhile, MGs achieve mutual power support through P2P transactions, effectively reducing their dependence on power purchase and ESS regulation.
- (2)
- The proposed asymmetric Nash bargaining strategy based on P2P contribution degree not only improves the willingness of MGs to participate in P2P cooperative transactions but also effectively ensures the fairness of benefit allocation within the MMA.
- (3)
- The proposed variable time scale dispatch strategy can adaptively adjust the dispatch interval according to real-time power deviations and changes in dispatch cost, which achieves a favorable balance between voltage stability and dispatch economy and improves the system’s responsiveness to source–load power fluctuations.
- (4)
- The proposed strategy separation with ADMM-based solution method improves computational efficiency while maintaining high solution accuracy. Moreover, the distributed iterative solution effectively protects the privacy of each transaction entity.
Author Contributions
Conceptualization, F.T., Y.W. (Yudong Wang) and H.G.; methodology, Y.W. (Yudong Wang) and C.Y.; software, Y.W. (Yudong Wang); validation, C.Y., and Y.W. (Yingli Wei); formal analysis, Y.W. (Yudong Wang) and C.Y.; investigation, C.Y. and Q.K.; resources, F.T. and Q.K.; data curation, H.G. and Y.W. (Yingli Wei); writing—original draft preparation, Y.W. (Yudong Wang); writing—review and editing, F.T., H.G. and Y.W. (Yingli Wei). All authors have read and agreed to the published version of the manuscript.
Funding
This research was supported by National Natural Science Foundation of China (No. 52107092), and the Science and Technology Project of State Grid Hebei Electric Power Company Limited, titled “Research on Coordinated Optimization Scheduling of Integrated Main and Distribution System for Multi-Point Interaction of Adjustable Load Resources” (No. kj2024-004).
Data Availability Statement
The data presented in this study are available on request from the corresponding author. Data are not publicly available due to privacy and ethical reasons.
Conflicts of Interest
Authors Yudong Wang, Fan Tang, Hancong Guo, Yingli Wei and Qibao Kang were employed by the company Xiong’an New Area Power Supply Company, State Grid Hebei Electric Power Co., Ltd. The remaining authors declare that the research was conducted in the absence of any commercial or financial relationships that could be construed as a potential conflict of interest.
Nomenclature
The following nomenclatures are used in this manuscript:
| Abbreviations | Cost of unit MWh ESS operation | ||
| REG | Renewable energy generation | Penalty cost of unit MWh REG curtailment | |
| ADN | Active distribution network | Cost of unit MWh purchased/sold by the MMA from/to the DNO | |
| MG | Microgrid | Cost of unit MWh purchased by the DNO from the upstream grid | |
| DNO | Distribution network operator | , | Resistance and reactance of branch ij |
| MMA | Multi-microgrid alliance | Maximum number of daily switching actions for all branches | |
| P2P | Peer-to-peer | , | Maximum active/reactive power injected at substation node |
| ADMM | Alternating direction method of multipliers | Maximum and minimum voltage magnitude at node j | |
| PV | Photovoltaic | Maximum current amplitude of branch ij | |
| WT | Wind turbine | Maximum flow-carrying capacity of branch ij | |
| CB | Capacitor bank | Maximum charging/discharging power of ESS j | |
| ESS | Energy storage system | , | Maximum/minimum SOC of ESS j |
| MPC | Model predictive control | , | Charging/discharging efficiency of ESS j |
| MDP | Markov decision process | Capacity of ESS | |
| Set | Self-discharge rate of ESS j | ||
| Set of branches | Variables | ||
| Set of PV nodes | , | Active/reactive power at the sending end from bus i to j | |
| Set of WT nodes | Voltage magnitude at node i | ||
| Set of ESS nodes | Current amplitude on branch ij | ||
| Set of substation nodes | , | Active/reactive power injected at node j | |
| Set of capacitor bank nodes | , | Active/reactive power of the load connected to node j | |
| Set of MG members within MMA | Charging/discharging power of ESS at node j | ||
| Terminal nodes of branches with j as the head node | , | Curtailed PV/WT output in MGn | |
| Head nodes of branches with j as the terminal node | PV/WT output in MGn | ||
| Parameters and constants | Forecasted PV/WT output in MGn | ||
| Cost of a single switching action | Load of MGn | ||
| Cost of unit MWh active power loss | State of charge of ESS j | ||
Appendix A
Table A1.
Cmparative summary of existing relevant studies.
Figure A1.
Forecasts of PV and WT outputs.
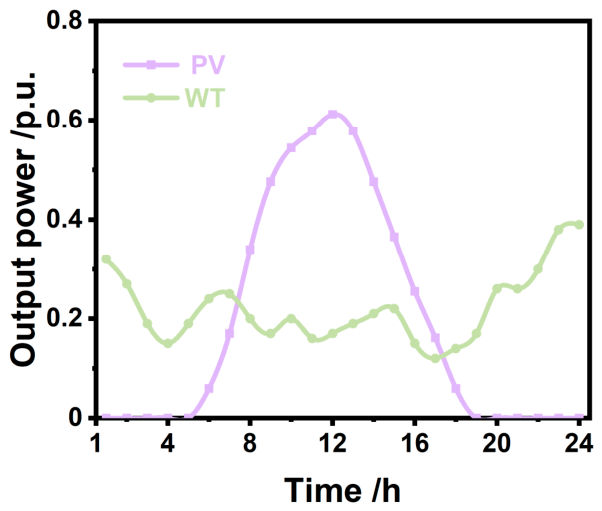
Figure A2.
Forecasts of load in each MG.
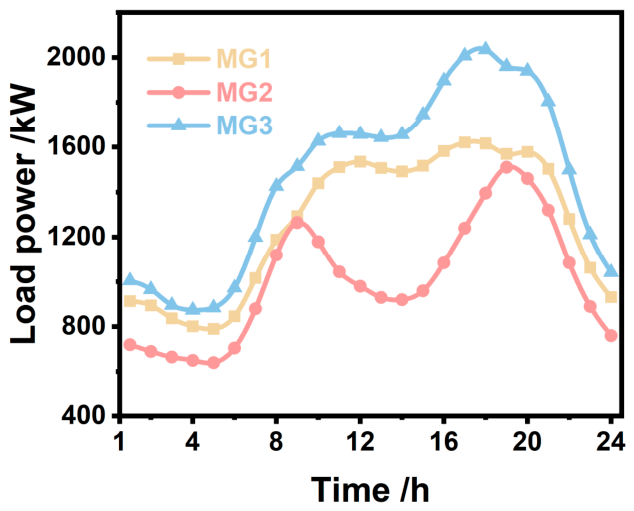
Table A2.
Capacity of REG and ESS in each MG.
Table A3.
Power purchase prices from the main grid.
Table A4.
Device parameters.
Appendix B
Since the distribution network topology, the power transaction prices between the DNO and the MMA, and the DNO’s power purchase from the main grid have already been optimized in the day-ahead stage, the relevant constraints are no longer considered in the intra-day stage.
Appendix B.1. ADN Constraints
- (1)
- Power balance constraints
- (2)
- Capacitor banks constraints
- (3)
- SVC constraints
- (4)
- Safety constraints
- Refer to Equation (19)
Appendix B.2. MG Constraints
- (1)
- Power balance constraints
- Refer to Equation (23)
- (2)
- ESS constraints
- Refer to Equations (24)–(28)
- (3)
- REG curtailment constraints
- (4)
- Transaction power constraints between MGn and the DNO
- Refer to Equations (31)–(32)
- (5)
- P2P exchange power constraints among MG members
- Refer to Equations (34)–(36)
It is important to note that in Equations (19), (23–28), (31), (32) and (34)–(36), the day-ahead variables should be replaced with their corresponding intra-day variables.
Appendix C
Figure A3.
System node voltage before and after reactive power optimization.
References
- Dong, Y.; Shan, X.; Yan, Y.; Leng, X.; Wang, Y. Architecture, key technologies and applications of load dispatching in China power grid. J. Mod. Power Syst. Clean Energy 2022, 10, 316–327. [Google Scholar] [CrossRef] [Scilit]
- Abbasi, A.; Baleanu, D. Recent developments of energy management strategies in microgrids: An updated and comprehensive review and classification. Energy Convers. Manag. 2023, 297, 117723. [Google Scholar] [CrossRef] [Scilit]
- Ahmad, D.; Hariyanto, N.; Khayam, U. Issues, Challenges, and Solution Options for On-Grid Multi-Microgrid Game Theory: A Systematic Review. IEEE Access 2025, 13, 76574–76608. [Google Scholar] [CrossRef] [Scilit]
- Jani, A.; Jadid, S. Two-stage energy scheduling framework for multi-microgrid system in market environment. Appl. Energy 2023, 336, 120683. [Google Scholar] [CrossRef] [Scilit]
- Dong, P.; Sui, K.; Liu, M.; He, R.; Liu, S.; Zhang, S.; Xie, W. Coupled game optimization method on electricity trading for distribution network and micro-grids considering trading satisfaction degree. Electr. Power Syst. Res. 2025, 247, 111734. [Google Scholar] [CrossRef] [Scilit]
- Li, J.; Ji, S.; Wang, X.; Zhang, H.; Li, Y.; Qian, X.; Xiao, Y. A Stackelberg game-based optimal scheduling model for multi-microgrid systems considering photovoltaic consumption and integrated demand response. Energies 2024, 17, 6002. [Google Scholar]
- Du, Y.; Wang, Z.; Liu, G.; Chen, X.; Yuan, H.; Wei, Y.; Li, F. A cooperative game approach for coordinating multi-microgrid operation within distribution systems. Appl. Energy 2018, 222, 383–395. [Google Scholar] [CrossRef] [Scilit]
- Lyu, W.; Cui, Z.; Yuan, M.; Shan, E. Cooperation for trans-regional electricity trading from the perspective of carbon quota: A cooperative game approach. Int. J. Electr. Power Energy Syst. 2024, 156, 109773. [Google Scholar] [CrossRef] [Scilit]
- Shui, J.; Peng, D.; Zeng, H.; Song, Y.; Yu, Z.; Yuan, X.; Shen, C. Optimal scheduling of multiple entities in virtual power plant based on the master-slave game. Appl. Energy 2024, 376, 124286. [Google Scholar] [CrossRef] [Scilit]
- Wu, Q.; Xie, Z.; Li, Q.; Ren, H.; Yang, Y. Economic optimization method of multi-stakeholder in a multi-microgrid system based on Stackelberg game theory. Energy Rep. 2022, 8, 345–351. [Google Scholar] [CrossRef] [Scilit]
- Ouyang, Z.; Zhong, H.; Wang, Y.; Li, X.; Du, T. Active and Reactive Power Coordinated Optimization of Distribution Network–Microgrid Clusters Considering Three-Phase Imbalance Mitigation. Energies 2025, 18, 5514. [Google Scholar] [CrossRef] [Scilit]
- Zhang, X.; Li, Y.; Wang, Y.; Li, J.; Zhang, Y.; Cao, Y.; Shahidehpour, M. Carbon-oriented optimal operation strategy for distribution network with multiple integrated energy microgrids based on double-layer game. Int. J. Electr. Power Energy Syst. 2024, 160, 110075. [Google Scholar]
- Movahednia, M.; Karimi, H.; Jadid, S. A cooperative game approach for energy management of interconnected microgrids. Electr. Power Syst. Res. 2022, 213, 108772. [Google Scholar] [CrossRef] [Scilit]
- Li, J.; Liu, D.; Kong, Z.; Bao, G.; Cui, X. Robust dispatching optimization and benefit allocation of multi-microgrid systems with shared owned energy storage in remote areas. J. Renew. Sustain. Energy 2025, 17, 054104. [Google Scholar] [CrossRef] [Scilit]
- Xu, X.; Xia, J.; Hong, C.; Sun, P.; Xi, P.; Li, J. Optimization of cooperative operation of multiple microgrids considering green certificates and carbon trading. Energies 2025, 18, 4083. [Google Scholar] [CrossRef] [Scilit]
- Fan, W.; Fan, Y.; Yao, X.; Yi, B.; Jiang, D.; Wu, L. Distributed transaction optimization model of multi-integrated energy systems based on nash negotiation. Renew. Energy 2024, 225, 120196. [Google Scholar] [CrossRef] [Scilit]
- Han, J.; Fang, Y.; Li, Y.; Du, E.; Zhang, N. Optimal planning of multi-microgrid system with shared energy storage based on capacity leasing and energy sharing. IEEE Trans. Smart Grid 2024, 16, 16–31. [Google Scholar] [CrossRef] [Scilit]
- Wen, Y.; Ding, R.; Liang, Y.; Chen, J. Multi-microgrid shared energy storage operation optimization strategy based on a mixed game theory. Electr. Power Syst. Res. 2025, 246, 111643. [Google Scholar] [CrossRef] [Scilit]
- Ma, H.; Xu, F.; Chen, Q.; Hu, K.; Chen, L.; Dai, Y.; Hao, J.; Min, Y. Dispatch framework of power system with heat storage facilities in combined heat and power plants for wind power accommodation. IET Renew. Power Gener. 2020, 14, 335–343. [Google Scholar]
- Yuan, Z.; Xia, J.; Li, P. Two-time-scale energy management for microgrids with data-based day-ahead distributionally robust chance-constrained scheduling. IEEE Trans. Smart Grid 2021, 12, 4778–4787. [Google Scholar] [CrossRef] [Scilit]
- He, Y.; Li, Z.; Zhang, J.; Shi, G.; Cao, W. Day-ahead and intraday multi-time scale microgrid scheduling based on light robustness and MPC. Int. J. Electr. Power Energy Syst. 2023, 144, 108546. [Google Scholar]
- Hu, D.; Ye, Z.; Gao, Y.; Ye, Z.; Peng, Y.; Yu, N. Multi-agent deep reinforcement learning for voltage control with coordinated active and reactive power optimization. IEEE Trans. Smart Grid 2022, 13, 4873–4886. [Google Scholar] [CrossRef] [Scilit]
- Li, P.; Li, Y.; Li, Z.; Jia, Q. Multi-time scale game dispatching strategy for microgrid cluster with shared energy storage considering demand response uncertainty. Energy 2025, 328, 136568. [Google Scholar] [CrossRef] [Scilit]
- Wang, S.; Ma, X.; Yan, Y.; Kari, T.; Zhang, W. Collaborative Game Theory Between Microgrid Operators and Distribution System Operator Considering Multi-Faceted Uncertainties. Energies 2025, 18, 1577. [Google Scholar] [CrossRef] [Scilit]
- Cheng, Q.; Li, X.; Zhang, M.; Fei, F.; Shi, G. Optimal configuration strategy of soft open point in flexible distribution network considering reactive power sources. Energies 2025, 18, 529. [Google Scholar] [CrossRef] [Scilit]
- Yang, T.; Guo, Y.; Deng, L.; Sun, H.; Wu, W. A linear branch flow model for radial distribution networks and its application to reactive power optimization and network reconfiguration. IEEE Trans. Smart Grid 2020, 12, 2027–2036. [Google Scholar] [CrossRef] [Scilit]
- Ding, T.; Lin, Y.; Li, G.; Bie, Z. A new model for resilient distribution systems by microgrids formation. IEEE Trans. Power Syst. 2017, 32, 4145–4147. [Google Scholar] [CrossRef] [Scilit]
- Cheng, S.; Zuo, X.; Wei, Z.; Ni, K.; Wang, C. Nash bargaining-based cooperative game for distributed economic scheduling of microgrid with charging-swapping-storage integrated station. Int. J. Energy Res. 2022, 46, 23927–23938. [Google Scholar]
- Wang, X.; Han, L.; Wang, C.; Yu, H.; Yu, X. A time-scale adaptive dispatching strategy considering the matching of time characteristics and dispatching periods of the integrated energy system. Energy 2023, 267, 126584. [Google Scholar] [CrossRef] [Scilit]
- Meng, Q.; Jin, X.; Luo, F.; Wang, Z.; Hussain, S. Distributionally robust scheduling for benefit allocation in regional integrated energy system with multiple stakeholders. J. Mod. Power Syst. Clean Energy 2024, 12, 1631–1642. [Google Scholar] [CrossRef] [Scilit]

Disclaimer/Publisher’s Note: The statements, opinions and data contained in all publications are solely those of the individual author(s) and contributor(s) and not of MDPI and/or the editor(s). MDPI and/or the editor(s) disclaim responsibility for any injury to people or property resulting from any ideas, methods, instructions or products referred to in the content. |
© 2026 by the authors. Licensee MDPI, Basel, Switzerland. This article is an open access article distributed under the terms and conditions of the Creative Commons Attribution (CC BY) license.