


Abstract
The rapid development of wind and solar energy necessitates a solution to the problem of the optimal spatial placement of wind farms (WFs) and solar farms (SFs) within electric power systems. The non-stationary generation schedules of WFs and SFs place increased demands on the flexibility of conventional generation, determined by the intensity of net load fluctuations. This paper proposes a methodology for the spatial optimization of WF and SF location, in which the optimization criteria include net load indicators (rate of net load change and net load increment), the base power of the RES system, and the economic criterion of maximum electricity generation. Unlike existing approaches, in which the geographical smoothing effect on power fluctuations is treated as an incidental outcome, the proposed methodology employs it as an explicit optimization criterion for RES placement. The algorithm provides for the preliminary ranking of candidate sites based on the maximum electricity generation criterion, followed by the redistribution of generating capacities among sites with an acceptable capacity factor in accordance with the selected optimization criterion. The methodology was tested on a model comprising six potential wind farm sites and two solar farm sites with a total installed capacity of 600 MW and a maximum power system load of 3000 MW. The obtained results show that the optimal redistribution of installed capacities among sites allows a 31.5% reduction in net load variability intensity to be achieved with an 11.6% reduction in electricity generation relative to the maximum possible. The study is based on idealized daily generation and consumption profiles and is theoretical in nature, proposing a pre-screening tool for RES siting that complements rather than replaces subsequent network-constrained planning studies, including power-flow analysis and grid verification, and establishes a methodological foundation for further development using real multi-year retrospective data.
1. Introduction
Over the past two decades, wind and solar power generation have become the primary sources of new generating capacity in the global electricity sector. The cumulative installed capacity of wind power plants grew from 59 GW in 2005 to 1299 GW by the end of 2025 [1], while solar PV capacity approached 3 TW over the same period [2]. Solar generation now accounts for more than 10% of global electricity consumption. The levelized cost of electricity (LCOE) of onshore wind is 53% and that of solar PV is 41%, below the weighted average cost of new fossil-fuel-fired generation [3]. Wind and solar farms are increasingly integrated into diverse energy complexes alongside conventional generation sources [4,5], energy storage systems [6], and hydrogen production facilities [7], substantially broadening their practical applications.
The rapid growth of the share of RESs in the generation mix has intensified the challenge of their integration into power systems. Unlike dispatchable sources (thermal, hydro, and nuclear power plants), wind and solar farms are characterized by a non-stationary generation schedule. Fluctuations in the combined output of wind and solar farms place increased demands on the flexibility of conventional generation and energy storage systems responsible for maintaining power balance. In planning the siting of RES facilities, this makes it important to consider, alongside the economic criterion of maximum electricity generation, the criteria characterizing the dynamics of the net load (the difference between electricity consumption and total RES output), such as the rate of net load change and the intensity of net load increments. The spatial distribution of wind and solar farms across sites with different climatic and orographic conditions can substantially reduce the intensity of combined power fluctuations through geographical smoothing—the mutual cancellation of generation peaks and troughs at individual facilities—and, where required, increase the base power of the RES system.
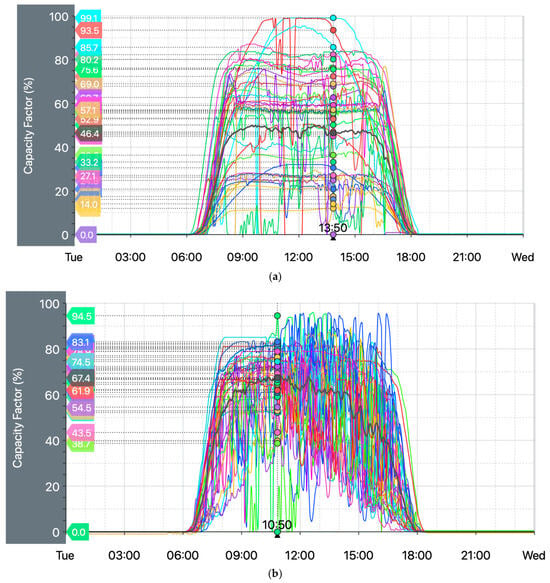
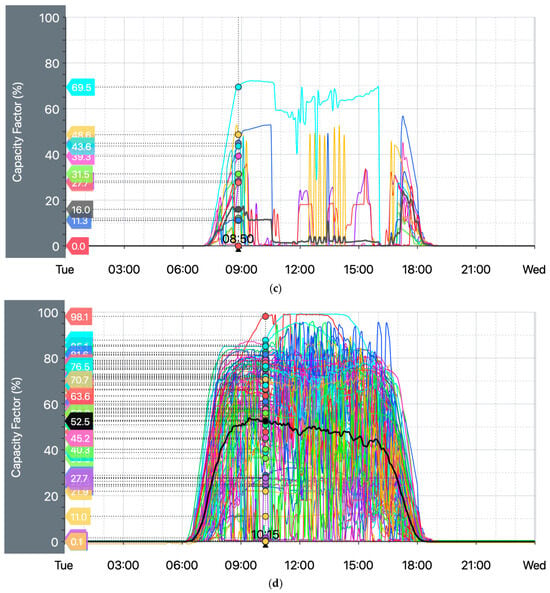
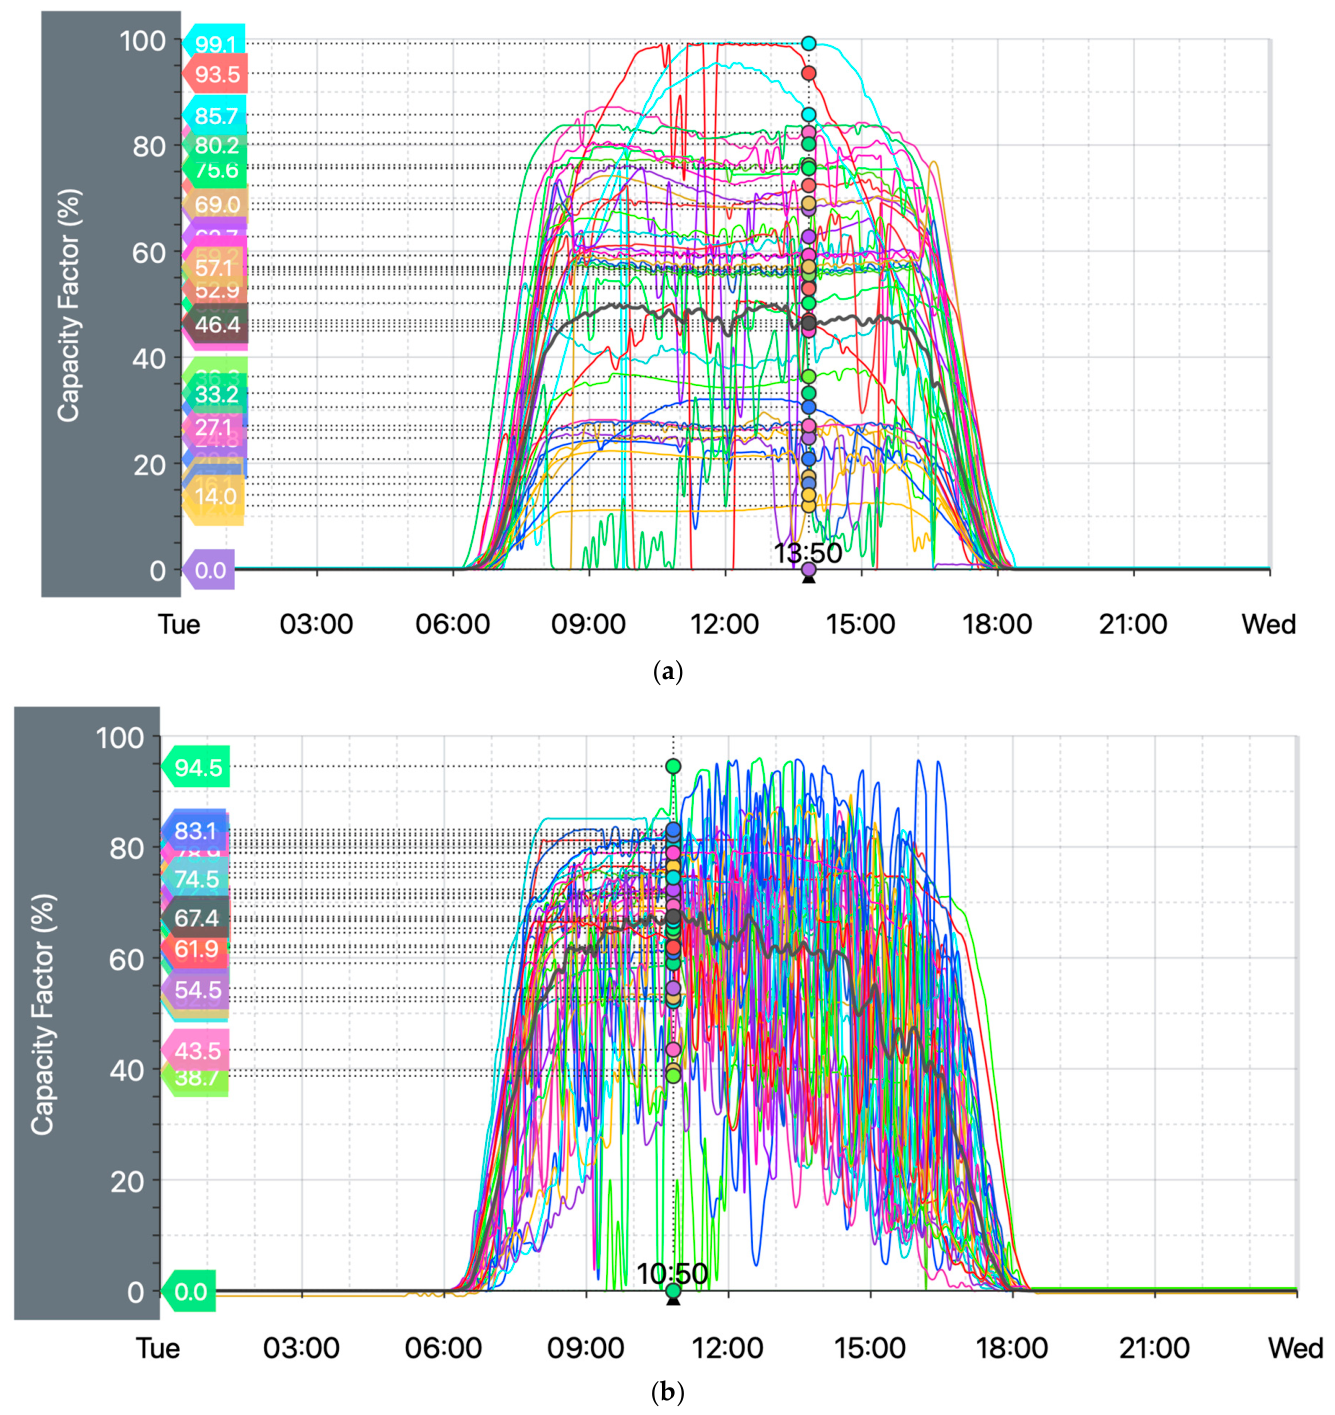
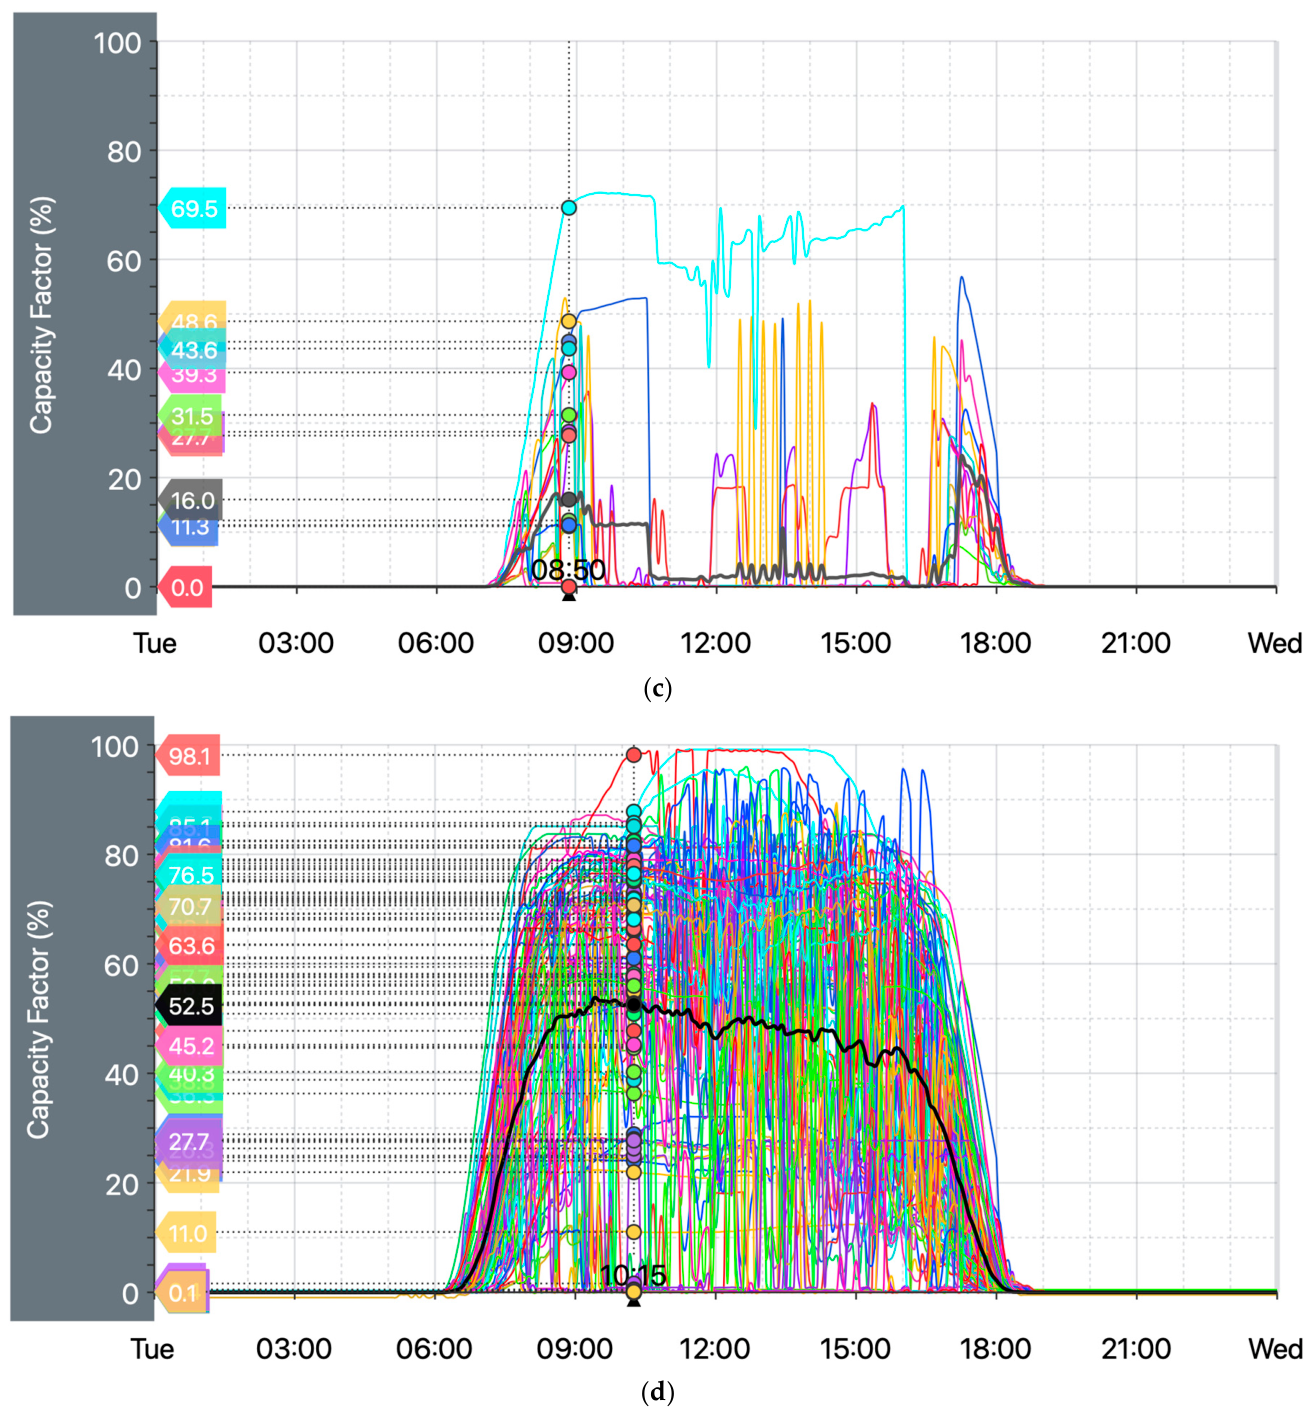
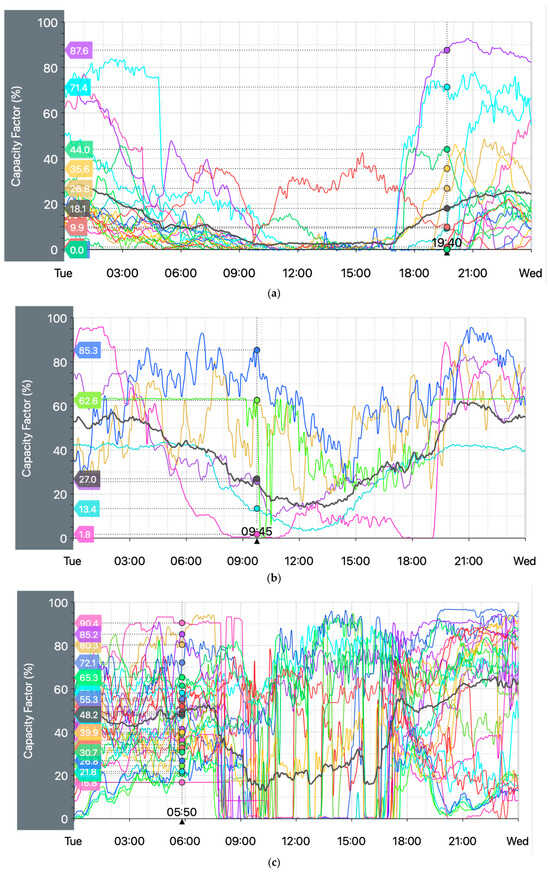
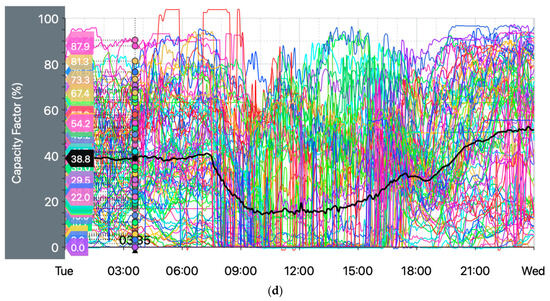
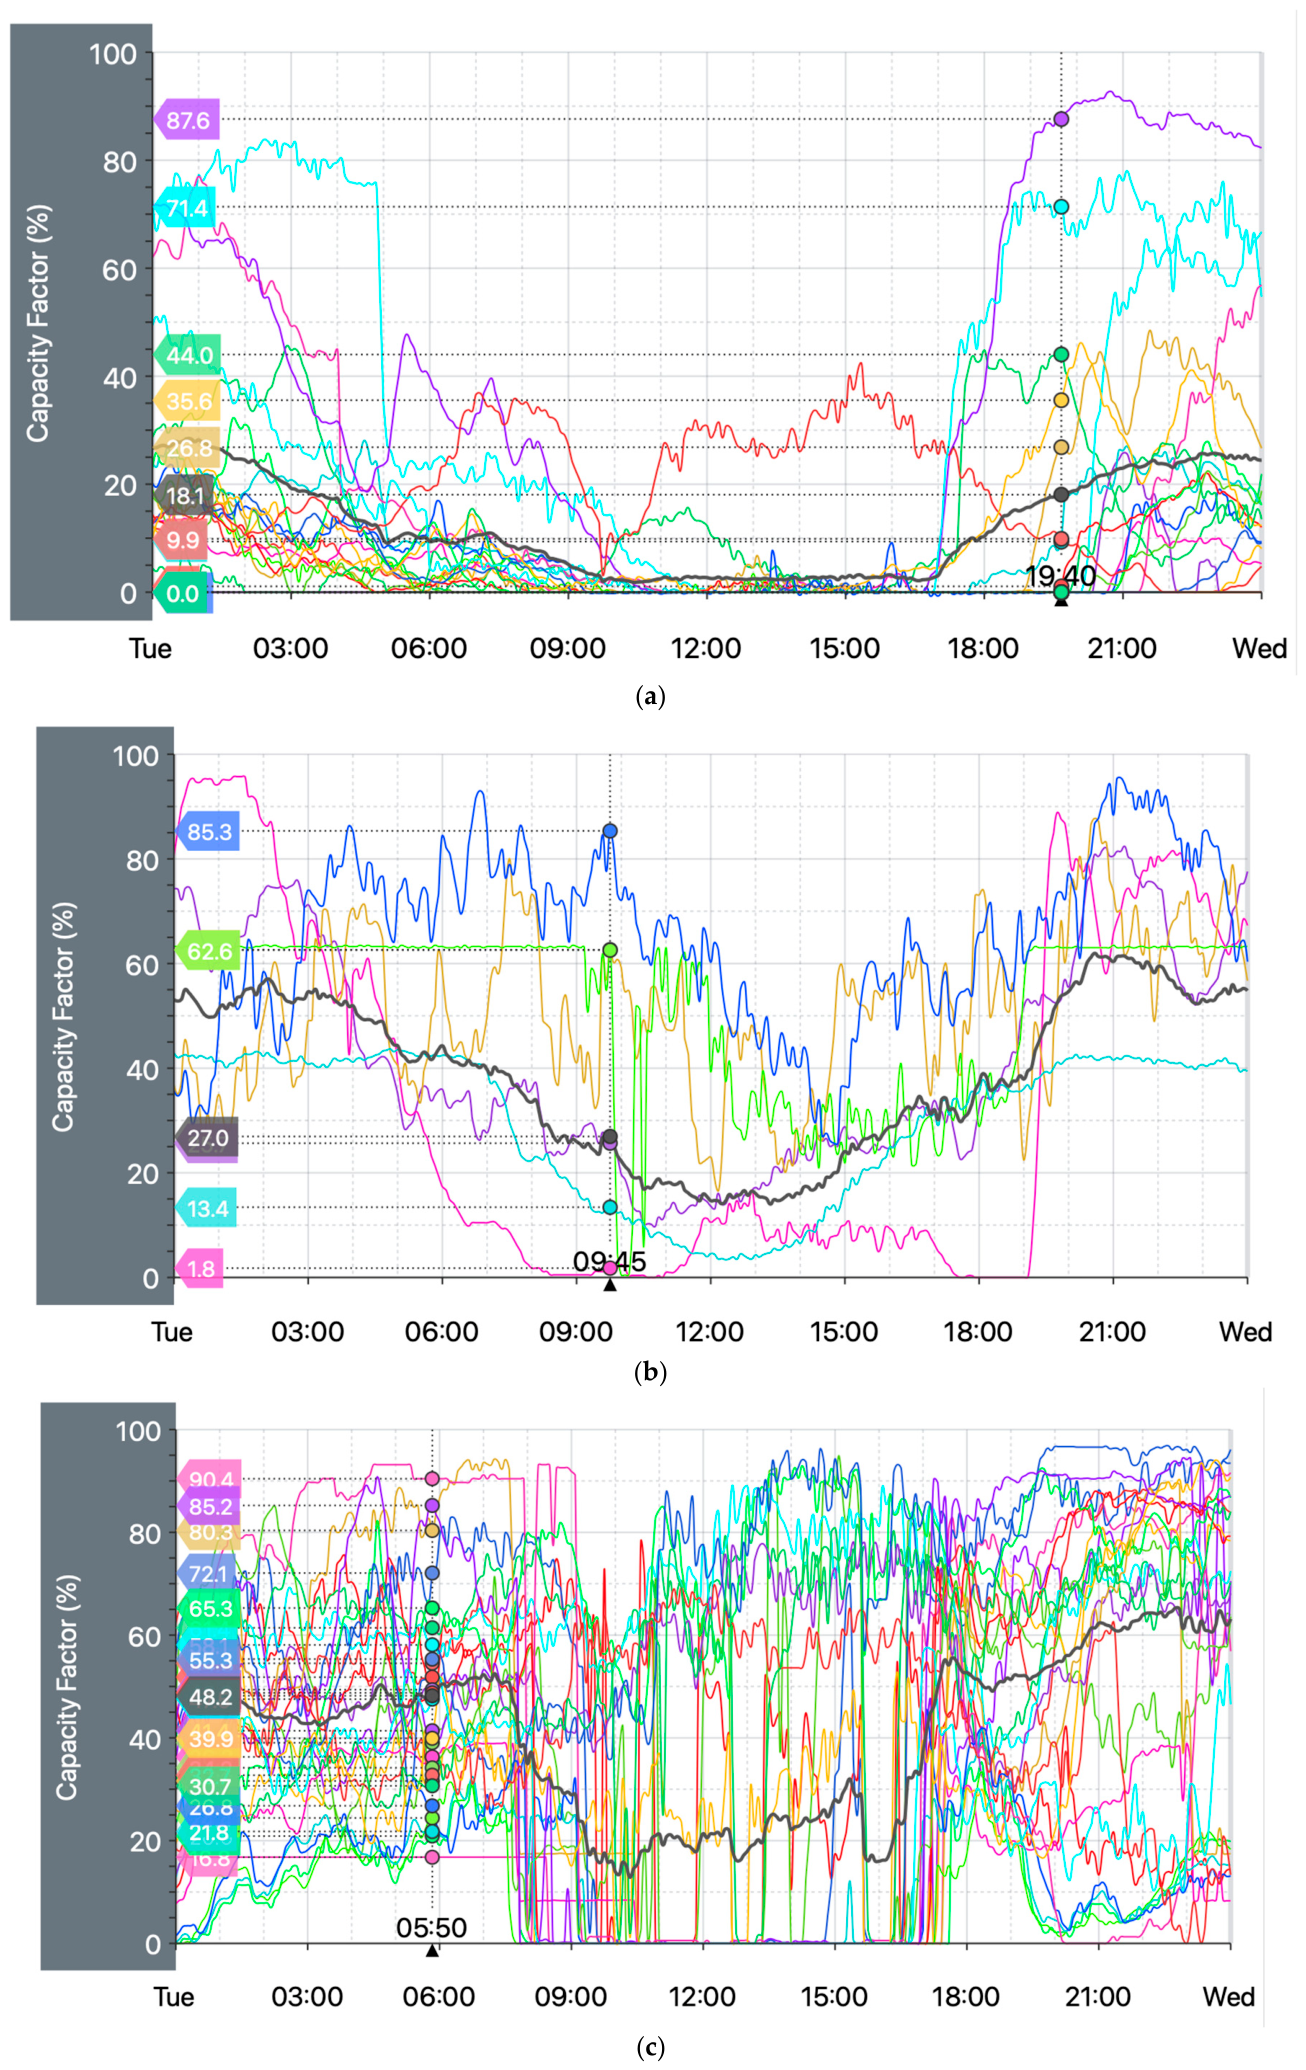
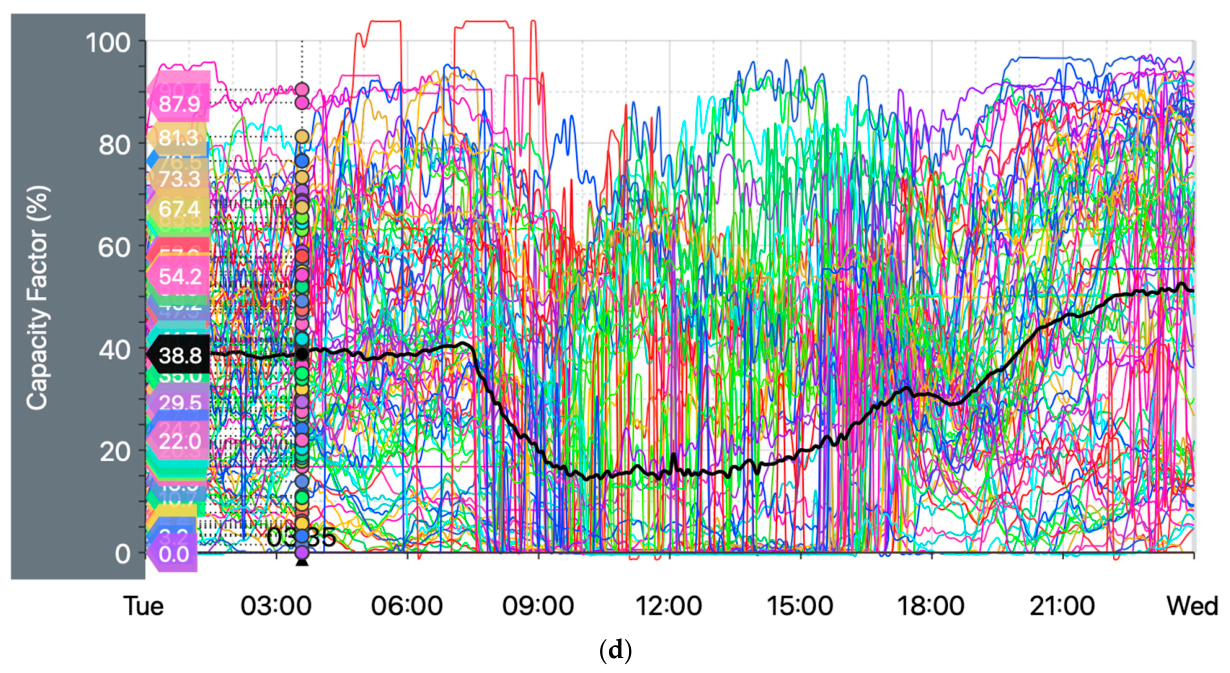
It is clear that WFs and SFs have their own characteristic operating modes. WFs have an unstable generation schedule due to changes in wind speed and direction. Additionally, wind speed and its recurrence are influenced by local characteristics related to local atmospheric circulations (e.g., breeze and mountain–valley circulations). A distinctive feature of SFs is a nighttime load minimum, a daytime load maximum, and dependence on weather conditions and daylight hours. Using the example of daily load curves for WFs and SFs in the Australian power grid [8], one can observe the operating modes of both individual WFs and SFs, as well as the resulting load curves for all sources (Figure 1 and Figure 2). Daily load profiles for WFs and SFs show that the power fluctuations of individual farms overlap, thereby reducing the overall intensity of power fluctuations across all renewable energy facilities. Therefore, the optimal distribution of WFs and SFs allows for an optimal resulting power output schedule and can improve the reliability of power system operation in terms of maintaining power balance.
Figure 1.
Change in the CF of SF during the day on 31 March 2026: (a) 4891 MW of solar power in the New South Wales power system; (b) 3799 MW of solar power in the Queensland power system; (c) 734 MW of solar power in the South Australia power system; (d) total solar power of 10,714 MW in the Australian power system. (The colored lines show the change in the CF for each farm, while the black/gray line shows the resulting CF for all SF.)
Figure 2.
Change in the CF of WFs during the day on 31 March 2026: (a) 2822 MW of wind power in the New South Wales power system (b) 1934 MW of wind power in the Queensland power system (c) 2763 MW of wind power in the South Australia power system (d) All 13,460 MW of wind power in the Australian power system. (The colored lines show the change in the CF of each farm, and the black/gray line shows the resulting capacity factor of all WFs).
In this regard, the objective of this study is to develop mathematical models for determining the optimal construction sites for WFs and SFs within the electric power system. To solve this problem, single-criterion optimization methods are used, which allow formalizing the selection of the objective function when solving the problem of the efficient placement of WFs and SFs. Accordingly, the scientific novelty lies in the development of a model of optimizing constructions sites for WFs and SFs in the electric power system, taking into account indicators characterizing their resulting power output schedule. When solving problems of integrating RESs into the power system, it is necessary to emphasize that not only the economic indicators of RESs (e.g., electricity generation and capacity factor) are of key importance but also the operational characteristics of RESs, which determine their compatibility with conventional generation (e.g., the intensity of power fluctuations and base power, which are particularly critical for assessing the need for RES power reservation by conventional power plants or energy storage systems).
2. Current State of Research
The growing penetration of wind and solar generation into power systems worldwide has intensified research into the optimization of energy complexes that incorporate renewable energy sources. Because wind and PV output power is inherently variable, the design, scheduling, and spatial placement of these sources must account for flexibility—the ability of a power system to accommodate rapid and uncertain changes in net load [9,10]. This section reviews recent studies that address flexibility considerations within optimization problems for renewable-dominated energy systems. A summary of the optimization criteria, flexibility indicators, and energy complex compositions across all reviewed studies is presented in Table 1.
Table 1.
Summary of optimization criteria, flexibility indicators, and energy mix compositions.
Several studies have proposed explicit flexibility indicators and incorporated them into optimization frameworks for energy storage configuration and system scheduling. Meng et al. [9] developed a two-level optimization model for energy storage siting and sizing in which the upper level minimizes storage investment cost and voltage deviations, while the lower level minimizes operating costs, line losses, and the Conditional Value at Risk (CVaR) of flexibility shortage. Two original metrics—the Flexibility Demand Matching Coefficient Index (FDMCI) and upward/downward flexibility of supply and demand—serve as quantitative measures of the supply–demand flexibility balance. Ding et al. [10] investigated the stochastic scheduling of an integrated energy system combining thermal units with power-to-ammonia (P2A) and electrochemical energy storage under wind and PV uncertainty. Their model minimizes total operational cost and introduces three dedicated indicators—the renewable energy integration rate (REIR), the flexibility evaluation indicator (FEI), and the flexibility improvement rate (FIR)—to quantify how coordinated power and ammonia storage enhance system flexibility. Qin et al. [11] addressed the capacity optimization of a hybrid energy storage system (HESS) comprising advanced adiabatic compressed air energy storage (AA-CAES) and lithium-ion batteries for a large-scale desert renewable energy base transmitting power via ultra-high-voltage DC lines. Their multi-objective model minimizes the standard deviation of the residual load, the annualized storage cost, and the amount of curtailed renewable energy, using the curtailed RES share and power delivery reliability indices as flexibility proxies. These studies demonstrate that purpose-built flexibility metrics can guide the optimizer toward configurations that balance cost efficiency and operational resilience, yet they focus on storage sizing and dispatch rather than on the spatial allocation of generation sources.
Another substantial group of studies addresses flexibility implicitly through reliability and adequacy constraints in hybrid renewable energy system (HRES) design. Emrani and Berrada [12] optimized an off-grid PV/wind/biogas plant with dry gravity energy storage (D-GES), minimizing the cost of energy subject to a Loss of Power Supply Probability (LPSP) constraint. In addition, they analyzed the dynamic response time of D-GES, characterizing storage flexibility at short time scales. Kong et al. [13] formulated a mixed-integer quadratic program to maximize grid-connected power from a PV–wind–battery system, explicitly modeling minimum charging and discharging durations and charge/discharge power rates of the battery parameters that directly reflect energy storage ramping capability. Ma et al. [14] applied a hypervolume-improved NSGA-III to minimize total annualized cost, LPSP, and loss of renewable energy (LRE) for an off-grid residential system with PV power, wind power, an electrolyzer, a hydrogen tank, a fuel cell, and batteries. Iqbal et al. [15] optimized a PV–biomass–fuel cell HRES under electric vehicle loading using LPSP as the primary adequacy indicator. Al-Masri et al. [16] explored six on-grid design strategies involving PV, wind, and pumped-hydro storage, minimizing the grid usage factor while evaluating the renewable storage factor, CO2 emissions, and loss of load probability. Collectively, these studies demonstrate that adequacy metrics such as LPSP, LRE, and the renewable storage factor implicitly capture important dimensions of flexibility. However, the optimization variables in these studies are component capacities rather than plant locations within an interconnected power system.
Demand response (DR) and multi-energy coupling represent a third pathway for enhancing flexibility. Basu [17] studied the day-ahead scheduling of a virtual power plant comprising small hydropower, WTs, solar and biomass micro-cogeneration units, battery storage, and plug-in electric vehicles, where flexibility was achieved through ramp-rate limits of cogeneration units and load smoothing via DR applied to electrical, thermal, and cooling demands. Hua et al. [18] proposed a multi-objective model for a smart grid with distributed wind and PV generation, simultaneously minimizing operating costs, pollutant emissions, and user discomfort; their hybrid DR (combining price-based and incentive-based mechanisms) together with battery storage jointly smooths the net load and suppresses rebound peaks. Hu et al. [19] developed an active distribution network scheduling framework integrating combined price- and incentive-based DR with renewable-energy-based ammonia production, in which electrolyzers and ammonia synthesis equipment introduce additional ramp-up constraints and charge/discharge flexibility. While these studies demonstrate that demand-side resources can substantially broaden the operational envelope of renewable-rich systems, they address operational scheduling rather than the planning-stage question of where to locate wind and solar plants.
Finally, several studies address flexibility from a system-level planning perspective. Obara et al. [20] developed a genetic algorithm-based optimization method for wide-area power source allocation, minimizing the combined cost of generation, thermal equipment, and power transmission charges; the energy balance is managed through a controllable backup power supply (CPS) and thermal storage. This study is notable for explicitly optimizing the spatial distribution of renewable sources across a wide-area network, leveraging geographic smoothing of output fluctuations. Ebrie and Kim [21] applied deep reinforcement learning to the unit commitment problem for thermal generating units with limited wind and solar penetration, incorporating operating durations, production capacities, ramp rates, and reserve availability as flexibility-related constraints. Wu et al. [22] proposed a two-stage stochastic expansion optimization for an integrated energy system with CHP, gas and electric boilers, power-to-gas, and electric and thermal storage, where flexible electrical and thermal loads are modeled explicitly and device ramp-rate coefficients and stored-energy-to-capacity ratios serve as flexibility parameters.
The above analysis of existing publications indicates that optimization problems in RES-integrated systems are addressed primarily in three directions: energy storage system configuration (determining the optimal type and capacity of storage devices), operational scheduling (optimal dispatch considering load profiles and energy costs), and capacity sizing of hybrid energy system components. A summary of the reviewed studies, classified by flexibility indicators and energy complex composition, is presented in Table 1.
Thus, existing studies cover a broad range of optimization problems in RES-integrated systems: energy storage configuration, operational scheduling, and capacity sizing of hybrid system components. However, the problem of optimal spatial allocation of wind and solar farms with explicit consideration of the operational characteristics of the combined generation schedule—specifically the intensity of power fluctuations and base power—remains insufficiently addressed in the literature. The effect of geographical smoothing of power fluctuations, arising from the distribution of generating capacities across sites with different climatic and orographic conditions, is typically treated as an incidental outcome rather than an explicit optimization criterion in the siting of RES facilities. Addressing this methodological gap is the objective of the present study.
3. Research Methods
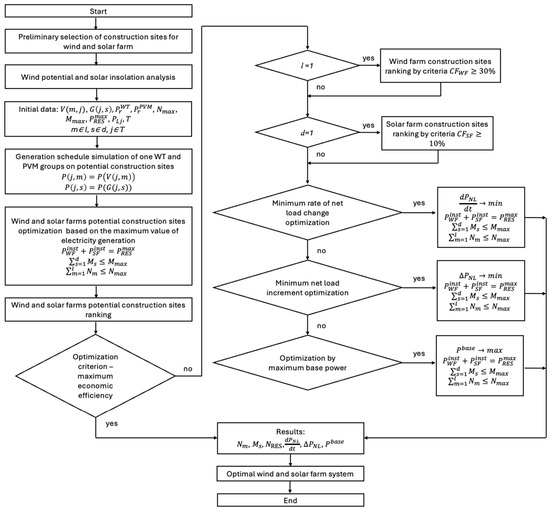
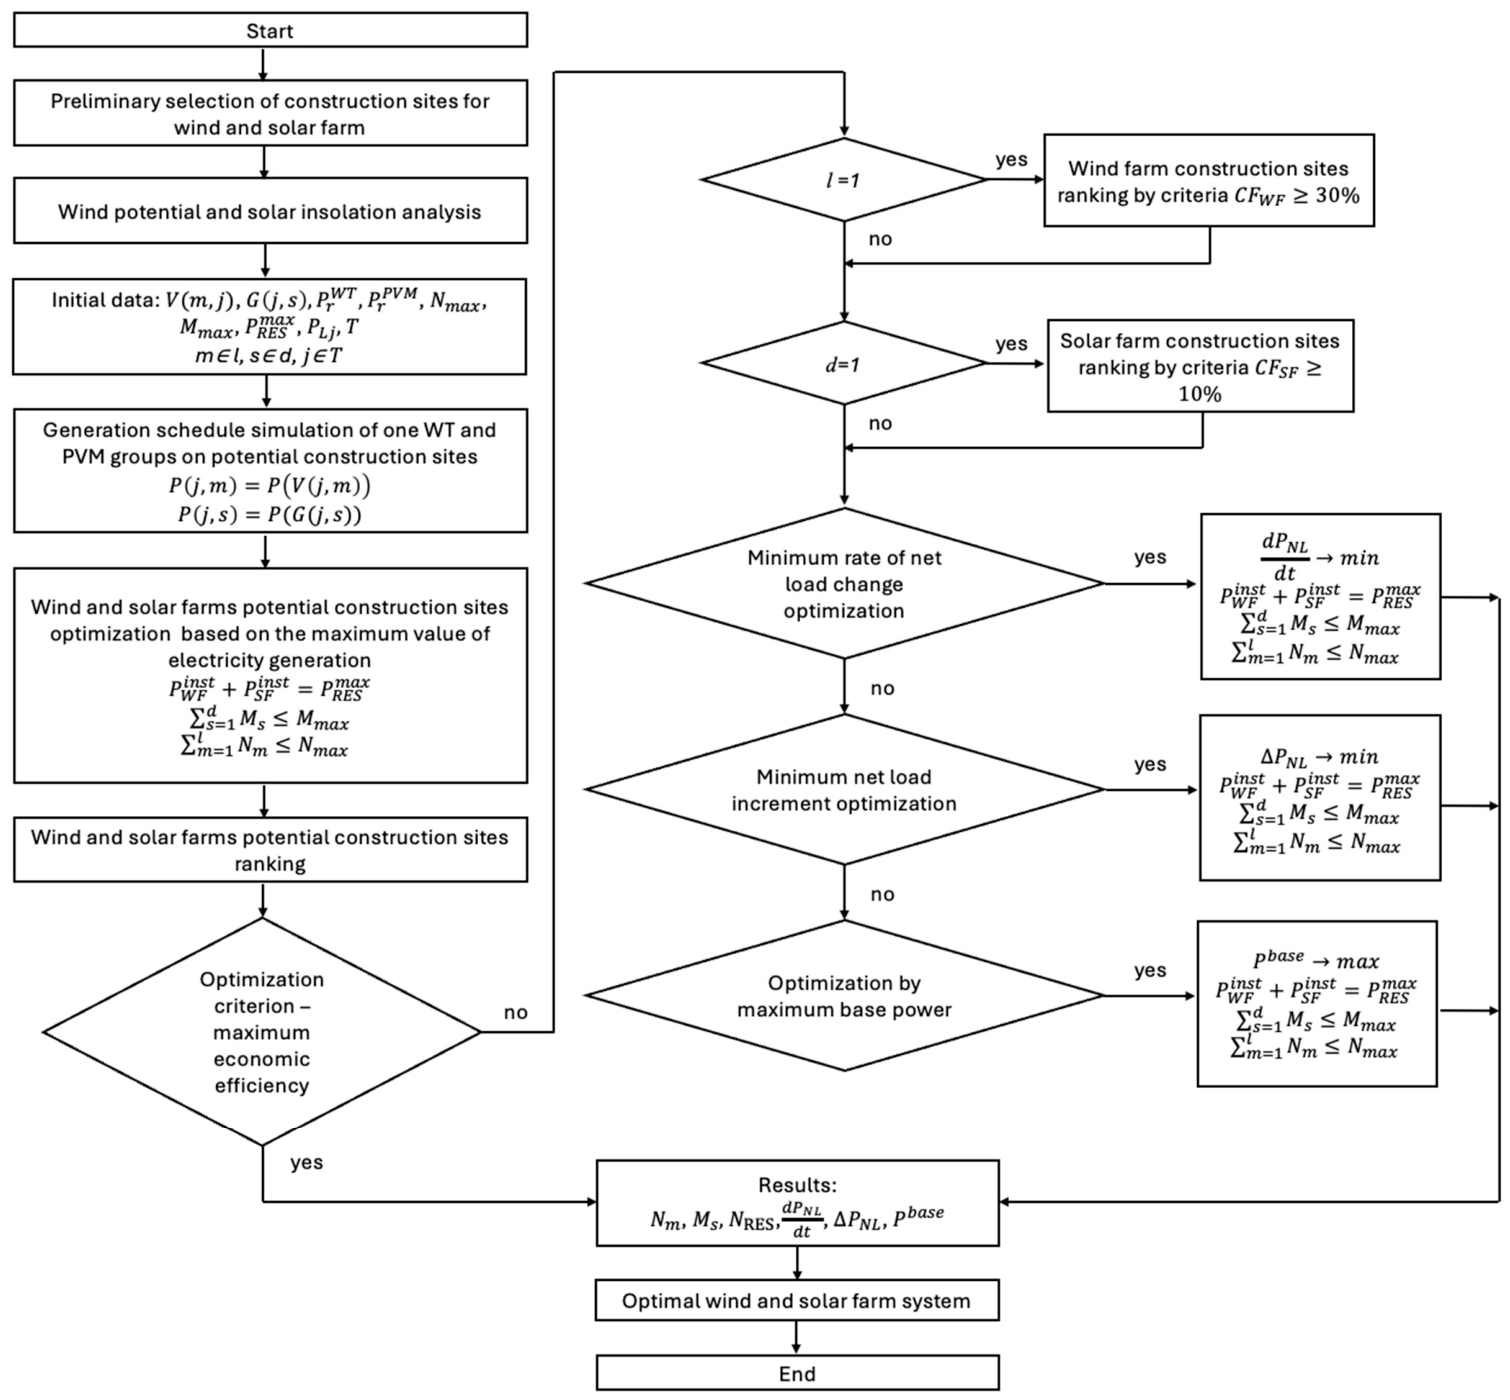
The optimization of the location of RESs within the power system can be viewed as a sub-problem of the broader task of optimizing the structure of generating capacity, the goal of which is to meet the forecasted demand for power and electricity. If the solution to this problem indicates the need to commission wind and solar generation capacity, the task of determining their optimal location arises. The methodological basis for solving this problem within the framework of this study is a single-criterion optimization model for selecting sites for the construction of RES facilities (Figure 3).
Figure 3.
Flowchart of an algorithm for optimizing the construction sites of wind and solar farms.
The choice of a single-criterion problem formulation is motivated by the following considerations. First, solving the optimization problem separately for each criterion allows the marginal contribution of each indicator to be assessed in isolation and its theoretically achievable extremum to be determined under the given constraints. The resulting extreme values—corresponding to the diagonal elements of the matrix in (an example of which is presented later in Table 4)—define the ideal point in the criterion space, which serves as an essential reference for constructing the Pareto front in a subsequent multi-criteria formulation. Second, the single-criterion results provide a quantitative basis for calibrating the weighting coefficients used in criterion aggregation: knowing the variation ranges of each indicator enables their normalization and the correct specification of their relative importance. The single-criterion model thus functions not as a standalone end-point tool but as a necessary first stage of the methodology, whose results are directly employed in the transition to multi-criteria optimization in future work.
The optimization criteria include an indicator characterizing the maximum economic efficiency of wind and solar farms through the maximization of electricity generation as well as indicators reflecting the flexibility of the energy system: minimum rate of net load change, minimum net load increment, and maximum base power of RES system.
Net load increment is the absolute change in net load between two consecutive time steps, expressed in units of power (MW). A positive increment indicates an increase in net load, while a negative one indicates a decrease.
The rate of net load change is the magnitude of the change in net load per unit of time, expressed in MW/h or MW/min. A positive rate corresponds to an increase in net load, while a negative rate corresponds to a decrease. When the rate equals zero, the net load remains unchanged.
Base power is the minimum value of the total power of all farms (wind farms and solar farms) that is maintained continuously for at least a specified number of sampling intervals (for example, every hour over a 24 h period), and in physical terms corresponds to the minimum guaranteed level of generation, expressed in units of power (MW). It should be emphasized that for individual wind and solar farms without storage systems on a daily time horizon, the base power in many cases approaches zero; therefore, this criterion is used primarily when analyzing aggregated renewable energy systems or in the presence of highly maneuverable sources and energy storage systems.
Integrating the listed indicators over time intervals (from minutes to hours) for the period under consideration (from a day to a year) allows for an assessment of the temporal variability of the operating modes of wind and solar farms. These integral indicators are critical for assessing the impact of RESs on the operating modes of conventional power plants and determining the requirements for the flexibility characteristics of generating equipment.
In accordance with the developed optimization algorithm, potential construction sites for RES facilities are selected in the first stage. For each of these sites, wind speed and solar insolation are analyzed, based on which the generation schedule for a single wind turbine (WT) and a single group of photovoltaic modules (PVMs) is modeled. This procedure is performed for each potential location.
Next, optimization is performed to maximize total power generation (), resulting in a ranked list of priority sites for RES facilities. This takes into account constraints on the maximum number of WT and PVM groups that can be installed at potential sites. In this case, the objective function is formulated as follows:
where is the number of WTs in wind farm m; l is the number of wind farms; is the power output of a WT at the corresponding wind speed at time j at the construction site of wind farm m, MW; is the time, h; is the time interval under consideration, h; is the number of PV array groups within solar farm s; d is the number of solar farms; and is the power of a PV array group at the corresponding insolation at time j at the construction site of solar farm s, MW.
The obtained data serve as input parameters for the single-criterion optimization model of RES facility placement. Within this model, WTs and PVMs are redistributed among farms to ensure maximum electricity generation, in accordance with additional optimization criteria such as the minimum rate of net load change, minimum net load increment, or maximum base power.
If only one wind farm/solar farm site is deemed optimal, based on the criterion of maximum output, the reallocation is carried out among locations with an acceptable CF. Acceptability criteria are determined based on statistical analysis. For example, the CF of wind farms in countries with a continental, cold climate can vary from 16% (in the summer) to 40% (in the winter). At the same time, the average CF value for modern continental wind farms worldwide is approximately 30–35% [23] and for offshore wind farms approximately 35–55% [24]. Given this, an acceptable CF value for wind farms can be set at 30% or higher, depending on the specific construction site. For solar farms, the average CF value for a continental climate can range from 4% (in winter) to 21% (in summer). The global average CF value was approximately 17% in 2022 [25]. Thus, the CF value for solar farms, depending on local conditions, can be set at 10% or higher.
The objective functions for the minimum net load variability criteria incorporate the hourly electricity consumption schedule of the power system as an input parameter. The net load at each time step is defined as the difference between power consumption and total RES output, representing the portion of demand that must be covered by conventional generation sources. Minimizing net load variability is therefore directly equivalent to minimizing the flexibility requirements imposed on the conventional generation fleet. The criteria of the minimum rate of net load change and minimum net load increment are formulated as follows:
where is the power consumption of the power system at time step j, MW; is the total combined output of all wind and solar farms at time step j, MW; and is the measurement interval (minutes or hours). A value of corresponds to an increase in net load and to a decrease. When , the net load remains unchanged.
The objective function corresponding to the criterion of maximum base power is as follows:
where is the minimum continuous power that a WT and a group of PVMs can provide during a given period, MW. The presence of zero values for wind speed and solar insolation in the input data set serves as the basis for determining the zero level of base power during a given period.
The constraints for each objective function are the maximum number of WTs, the maximum number of PVM groups, and the maximum installed capacity of the wind and solar farms planned for construction:
According to the presented methodology, the result of the optimization is the optimal configuration of the RES system, determined by the efficient spatial distribution of WTs and PVMs among farms in accordance with the specified optimization criterion.
The global optimality (or a close approximation thereof) of the solutions obtained by the proposed algorithm is supported by an analysis of the geometric properties of the optimization problem.
The objective function of the maximum electricity generation criterion () is linear with respect to the decision variables Nm and Ms, since the unit generation profiles of each site are fixed. The objective functions of the minimum rate of net load change criterion () and the minimum net load increment criterion () represent sums of absolute values of the total net load change of the wind and solar farm system and are downward-convex (the absolute value operation applied to a linear function of the decision variables produces a downward-convex surface with a unique global minimum). The objective function of the maximum base power criterion () equals the minimum total power of the wind and solar farm system over all time steps of the considered period and is upward-convex with a unique global maximum.
Thus, all four problems—maximization of a linear function, minimization of a downward-convex function, and maximization of an upward-convex function over a convex feasible set—are well-posed convex optimization problems with a global optimum (or a close approximation thereof), which is found using the Generalized Reduced Gradient method (GRG Nonlinear) implemented in the Solver add-in of Microsoft Excel. Nevertheless, a substantial increase in the number of candidate sites or a transition to multi-year retrospective data would significantly increase the dimensionality of the problem. Under such conditions, the applicability of the GRG method requires separate investigation, and comparison with metaheuristic methods (e.g., genetic algorithms) or MILP-based approaches becomes a relevant direction for future research.
In the current practice of power system planning, the development of generation capacity follows a sequential procedure: forecasting electricity energy and demand, justifying the rational prospective structure of generation capacities, forming power balances and conducting adequacy calculations, comprehensive justification of generation capacity siting (including the determination of type, installed capacity, and commissioning schedule), justification of grid development (including the selection of network configuration and parameters), and assessment of the economic consequences of the proposed technical solutions.
The proposed methodology for the optimal spatial allocation of wind and solar farms constitutes a sub-task of the generation capacity siting stage. However, current planning practice does not provide specialized methods for optimizing the siting of RES facilities with regard to the operational characteristics of their combined generation schedule—this task is addressed within the general siting procedure without accounting for the specific features of RESs. Filling this methodological gap constitutes the scientific novelty of the present study.
Verification of network constraints—including power-flow feasibility, nodal voltage limits, and line thermal capacities—is performed at the subsequent planning stage, namely the justification of grid development. The proposed algorithm thus serves as a pre-screening tool for RES configurations based on operational criteria, whose results provide the input data for subsequent network verification.
4. Research Results and Discussion
The test model, consisting of six potential wind farm sites (WF 1, WF 2, WF 3, WF 4, WF 5 and WF 6) and two potential solar farm sites (SF 1 and SF 2), provides for the commissioning of WFs and SFs with a total installed capacity of 600 MW, corresponding to 20% of the maximum power system load of 3000 MW. The installed capacity limit for each site is set at 300 MW.
A 2.5 MW WT is a standard class for onshore wind farms offered by various manufacturers (Vestas (Aarhus, Denmark), General Electric (Evendale, OH, USA), Goldwind (Beijing, China)), and it has been selected as the basis for the planned wind farm. The key parameters for turbines of this class are a tower height ranging from 100 to 150 m and a rotor diameter of approximately 100 m. A key technological advantage over high-power WTs (7 MW and above) is the flexibility in selecting the generator configuration, allowing for the use of both geared and gearless (direct drive) technologies.
Heterostructure PVMs with a nominal power of 445 W were selected for the construction of the solar farm. These modules outperform conventional silicon modules in terms of energy efficiency, providing an increase in electricity generation of up to 25% over the entire life cycle of the farm. This result is achieved due to their ability to maintain high performance across a wide range of conditions, including cloudy weather and elevated ambient temperatures. For further modeling, the PVMs are grouped into PVMs with a nominal capacity of 0.1 MW.
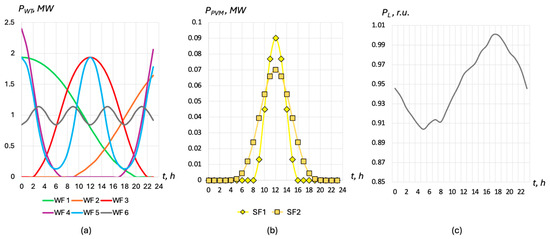
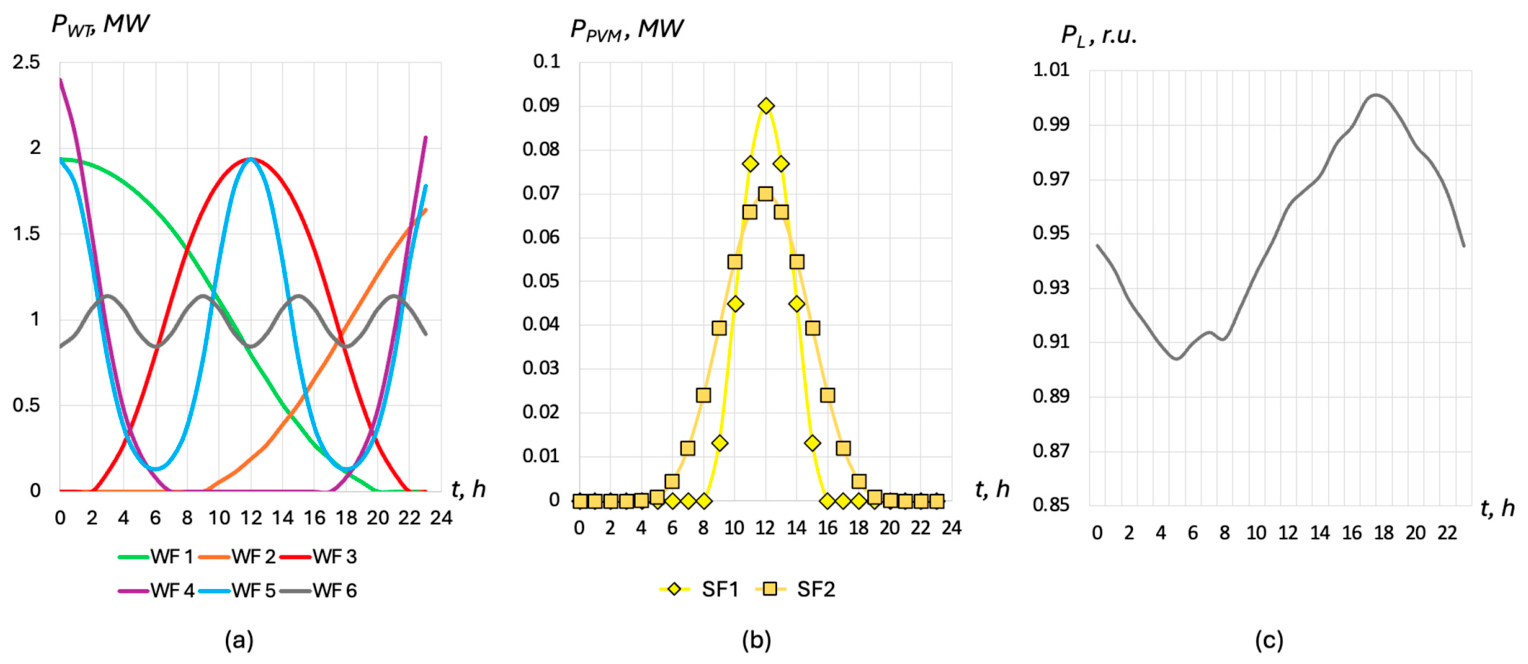
Daily power output schedules for the WT and the PVM group were obtained on the basis of individual models of daily wind speed and solar insolation dynamics specific to each location (Figure 4). Wind farm power output models are grouped by orographic type: flat (WF 1, 2, 3, 4, 6), coastal, and mountain–valley (WF 5). Solar insolation models are based on the minimum (SF 1) and maximum (SF2) daylight hours at 43° latitude. It should be noted that these models are idealized. Actual power output curves for wind farms and solar farms were shown in the Introduction. They are determined by a whole complex of factors. In addition to terrain, seasonal heat redistribution on the surface and in the atmosphere, the movement of cyclones and anticyclones, cloud cover, seasonal precipitation, characteristics of the underlying surface, atmospheric dynamics, and solar activity levels, system and operational factors of wind farms and solar farms play a significant role: hub orientation, optimal placement of the WT within the wind farm, optimal operation of the control system (yaw/pitch control), icing and contamination of the blades, WT shutdowns, orientation and tilt angle of the PVM, temperature coefficient of the PVM, dust accumulation and snow/ice buildup, PVM degradation, and grid constraints on power output and losses in electrical grids.
Figure 4.
Generation schedules of WTs (a) and PVMs (b) at potential sites of WF and SF and load schedule (c) during the day.
Despite these simplifications, these models are applicable for solving the optimization problem of wind farm and solar farm siting, allowing for a qualitative assessment and demonstration of the expected effects.
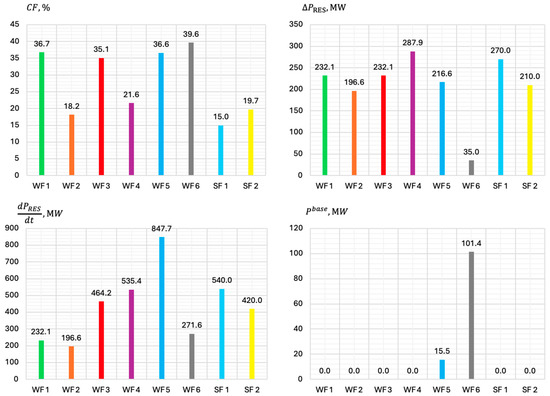
Table 2 presents the results of modeling the daily generation of a single WT and a single PVM group for all potential siting options. Figure 5 presents the integrated daily indicators for each potential wind farm and solar farm construction site when the maximum number of WTs and PVMs is deployed at each location: the daily power output, the rate of net load change, the net load increment, and the base power.
Table 2.
Ranked list of potential construction sites for WFs and SFs based on the criterion of maximum electricity generation.
Figure 5.
Characteristics of potential construction sites for wind and solar farms during the day.
Based on the algorithm for solving a single-criterion problem, optimization was first performed using the criterion of maximizing electricity generation. The result of the solution is a ranked list of potential sites for wind and solar farms, presented in Table 2.
In accordance with the proposed algorithm, the solution obtained on the criterion of maximum economic efficiency is considered final. The optimal locations are WF 6 and WF 1. If other criteria are used (minimum rate of net load change, minimum net load increment, or maximum base power), WF 4 and WF 2 are excluded from consideration, since their installed CF is less than 30% (Figure 5). In this case, the redistribution of generating capacities (WT and PVM groups) is carried out among the remaining sites: WF 6, WF 1, WF 5, WF 3, SF 2 and SF 1.
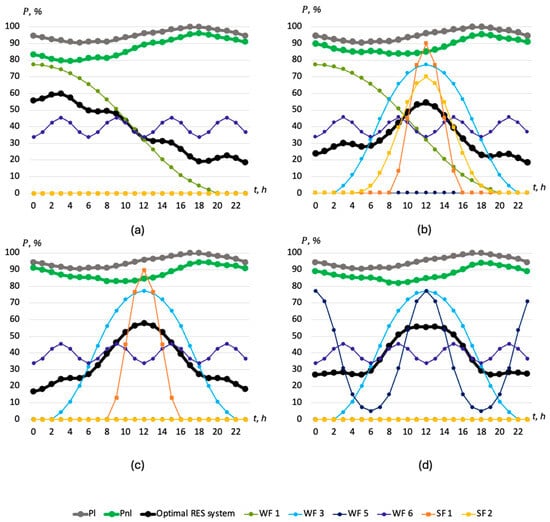
The results of the calculations based on the optimization criteria are presented in Table 3. The number of WTs in each WF and the number of PVM groups in each SF varies depending on the selected objective function. The corresponding daily generation schedules for the obtained optimal system configurations are shown in Figure 6. The selection of the voltage class for grid connection is determined by the installed capacity of the farm and the transmission line capacity, taking into account their double-circuit configuration: up to 10 MW–10 kV, 10–40 MW–35 kV, 40–200 MW–110 kV, and over 200 MW–220 kV. It should be noted that for farms with minimal rated power, it is advisable to consider the possibility of redistributing their capacity in favor of neighboring sites. In particular, within the scope of this study, the capacity initially allocated to SF 2 could be allocated to the SF 1 site.
Table 3.
Distribution of WT and PVM groups at potential construction sites for WFs and SFs under various objective functions.
Figure 6.
Generation schedules of WFs and SFs at various objective functions: maximum electricity generation (a), minimum rate of net load change (b), minimum net load increment (c), maximum base power (d).
The study demonstrates the significant influence of the choice of objective function on the resulting performance indicators of the optimal RES system. As follows from the formulation of the single-criterion problem, achieving an extremum for one indicator (e.g., maximum generation) naturally leads to a deterioration in other system characteristics, which underscores the importance of expert judgment in selecting the priority criterion for each specific power system context. The criterion of maximum electricity generation can be used as a basic and least labor-intensive method that does not require the use of complex optimization procedures. The algorithm involves the sequential placement of WT and PVM at sites in descending order of their energy potential (WF 6, followed by WF 1, WF 5, WF 3, WF 4, SF 2, WF 2, and SF 1) until the location constraint is reached. Unlike electricity generation, parameters such as the rate of net load change, net load increment and base power are derivatives of the resulting net load curve. Forecasting these parameters without specialized optimization models is difficult.
Table 4 shows the dependence of the parameters of the optimal RES system on the selected objective function in the test model. The extreme values of the corresponding optimizable parameters are located along the diagonal of the matrix.
Table 4.
Parameters of the optimal RES system depending on the objective function.
The maximum electricity generation corresponds to the objective function and equals 5500.0 thousand kWh. This is 14.1% higher than for the criterion, 11.6% higher than for the criterion, and 1.7% higher than for the criterion.
The minimum rate of net load change for the corresponding objective function is 692.7 MW, which is 13.3% lower than for the criterion, 1.8% lower than for the criterion, and 8.8% lower than for the criterion.
The minimum net load increment for the corresponding objective function is 344.0 MW, which is 31.5% lower than for the criterion, 0.7% lower than for the criterion, and 4.4% lower than for the criterion.
The maximum base power for the corresponding objective function is 161.2 MW, which is 46.3% higher than for the criterion, 46.3% higher than for the criterion, and 59.0% higher than for the criterion.
To compare the obtained results, Table 5 shows the change in the parameters of the optimal RES system for the objective functions relative to the objective function based on the criterion of maximum electricity generation . It can be concluded that with a reduction in electricity generation of 11.6% relative to the maximum possible, the minimum net load increment criterion () achieves a 31.5% reduction in net load variability intensity. At the same time, the rate of net load change decreases by 11.8%, while the base power decreases slightly by 8.0% compared to the scenario.
Table 5.
Analysis of changes in the parameters of the optimal RES system with respect to the objective function based on the criterion of maximum electricity generation.
In situations where the criterion of maximum economic efficiency is not a priority, the choice of the objective function boils down to a trade-off between ensuring the power system’s flexibility and maximizing renewable energy generation. In this case, the expert assessment consists of a comparative analysis: which is more economically viable, incurring costs to increase flexibility (for example, by commissioning new generating capacity) or accepting the opportunity cost resulting from limiting renewable energy generation?
Key characteristics of a power system’s flexibility that determine its compatibility with RESs include power reserves, including reserves for loading and unloading.
A power plant load capacity reserve refers to the size of the control range of the farm’s generating equipment, defined as the difference between its actual (planned) load and its rated capacity. The load capacity reserve also includes the operating capacity of generating equipment disconnected from the grid but ready to be connected to the grid (hot reserve). The unloading capacity reserve is defined as the regulation range of generating equipment from its actual (planned) load to the technological or technical minimum. In this context, the use of both load and unload capacity reserves must be ensured at a rate of net load change comparable to the fluctuations in RESs and consumer load.
The characteristics of thermal power plants can be considered as an example. For steam-turbine power units, the upper limit of the active power control range is 100–110% of the rated power. The lower limit (technological minimum) varies depending on the fuel type: for gas–oil-fired boilers, it ranges from 30–40%, and for pulverized coal boilers, 60–70%. The rate of power change for such units is usually about 1% of the installed capacity per minute, but in the sliding pressure zone it can reach up to 6%. Combined cycle power units (CCPUs) have the highest flexibility among thermal power plants. For CCPUs with heat recovery boilers, the rate of power change can reach 9% per minute, the operational minimum load is about 50%, and the technical minimum, depending on the unit’s configuration, can drop to 17% [26,27].
Alongside conventional generation, battery energy storage systems (BESSs) and demand-side management (DSM) mechanisms serve as complementary tools for managing net load variability [28,29,30]. BESSs reduce net load variability by buffering mismatches between RES output and electricity consumption [31]. DSM mechanisms enable the shifting of electricity demand to better align with the RES generation schedule, thereby further reducing the flexibility requirements imposed on conventional generation. In this context, the proposed methodology for the spatial optimization of wind and solar farms is complementary to BESS planning and DSM framework development: the combined application of these approaches forms a comprehensive toolkit for ensuring power system flexibility under high RES penetration.
Thus, when the power system’s flexibility characteristics are limited or the costs of improving them are relatively high (when introducing new highly maneuverable energy sources), the objective function should be to minimize the intensity of WF power fluctuations ( and ).
Another key characteristic of flexibility is the ability of generating equipment to start and stop. For CCPUs with heat recovery boilers, the standards provide for a total of approximately 10,000 «start–stop» cycles over the entire service life: 100 from a cold state, 1900 from a warm (not yet cooled) state, and 8000 from a hot state. This corresponds to the requirements for semi-peak power units [26,27]. Load shedding modes have a particularly strong impact on equivalent resource consumption: they cause equipment damage rates more than eight times higher than those during startup modes. According to technical requirements, CCPUs must ensure at least 200 load shedding cycles down to a power plant’s own needs and at least 150 load shedding cycles with generator disconnection from the grid followed by idling during their service life. To reduce the rate of degradation of generating equipment caused by dynamic operating modes (frequent starts and stops) under conditions of unstable renewable energy operation, it is advisable to use the criterion of maximizing base power as the objective function.
Under conditions where a sufficient maneuvering reserve of conventional generation is guaranteed, the objective function should be aimed at achieving economic efficiency, which is realized through the maximization of electricity generation.
5. Conclusions
This paper investigates the problem of the optimal spatial placement of wind and solar farms in an electric power system. A review of scientific research has shown that a significant portion of existing studies focuses on optimizing the configuration of energy storage devices, operational planning of operating modes, and determining the optimal capacities of hybrid energy system components, whereas the problem of the optimal spatial distribution of wind and solar farms with explicit consideration of the aggregated variability of generation schedule is insufficiently studied. Thus, the scientific novelty of the present study consists of the development of a methodology for the optimal spatial allocation of wind and solar farms in which the optimization criteria are based on flexibility indicators of the power system—the rate of net load change, the net load increment, and the base power. Unlike existing approaches, in which the geographical smoothing effect is treated as an incidental outcome, the proposed methodology employs it as an explicit optimization criterion, providing a formalized basis for selecting RES system configurations according to their operational characteristics.
The methodology was tested on a model comprising six potential wind farm sites and two solar farm sites with a total installed capacity of 600 MW. Based on the study, the following key conclusions were formulated:
- The choice of the objective function has a significant impact on the optimal configuration of the RES system. Achieving an extremum for a single indicator invariably leads to a deterioration in other system characteristics, which confirms the need for a conscious choice of the optimization criterion, taking into account the specific conditions of the power system.
- The incorporation of the power system’s hourly power consumption schedule into the optimization model through the net load concept enables the assessment of RES spatial configurations in terms of their direct impact on the flexibility requirements of conventional generation.
- The criterion of the minimum net load increment provides the most balanced compromise between economic efficiency and the operational compatibility of RESs with the power system in the example under consideration. When electricity generation is reduced by 11.6% relative to the maximum possible, this criterion achieves a 31.5% reduction in net load variability intensity, accompanied by a moderate decrease in base power of 8.0%.
- The spatial distribution of wind and solar farms across multiple sites with varying climatic and orographic conditions helps smooth the resulting generation curve by partially offsetting the power fluctuations of individual farms. This effect of geographical smoothing is confirmed both by the results of optimization based on operational criteria and by data from real power systems, as illustrated by the example of Australia.
- The choice of the objective function is determined by the control characteristics of the power system. Under conditions of limited control reserve of conventional generation or high costs of providing it, the criterion of minimum power fluctuation intensity takes priority. When the power system’s flexibility reserve is sufficient, it is advisable to use the criterion of maximum electricity generation, which ensures the greatest economic efficiency of RESs.
- The proposed algorithm should be considered as a sub-task of a more general model for optimizing the development of the power system’s generating capacity. Its purpose is to pre-filter RES configurations based on the criterion of operational compatibility, the results of which are subject to subsequent verification within the framework of the complete power system model, including power-flow analysis and grid verification.
The theoretical significance of the present study lies in establishing the mathematical foundations for incorporating net load indicators into the spatial allocation optimization of wind and solar farms. The extreme values of each indicator obtained under single-criterion optimization define the ideal point in the criterion space—a necessary reference for constructing the Pareto front in a subsequent multi-criteria formulation. The results thus provide a formalized methodological basis for the development of a comprehensive decision-support tool for RES siting in power system planning. Further research is planned in two directions. The first direction involves accounting for existing infrastructure, including previously constructed RES facilities and grid constraints on power output, which will ensure the model’s applicability to real power systems with an already established generation and grid structure. The second direction involves the development of a multi-criteria optimization problem that integrates into a single comprehensive criterion the economic efficiency of RESs and the flexibility characteristics of the resulting net load schedule. The transition to a multi-criteria formulation will allow the main limitation of the single-criterion approach to be overcome—in which the improvement of one indicator is inevitably accompanied by the deterioration of others—and will enable the generation of a set of Pareto-optimal RES configurations to support decision-making in power system development planning.
Author Contributions
Conceptualization, O.S., I.I., H.B., I.B. and K.S.; methodology, O.S., I.I. and K.S.; software, O.S.; validation, O.S., I.I., H.B., I.B. and K.S.; formal analysis, O.S., H.B., I.B. and K.S.; investigation, O.S., I.I., H.B., I.B. and K.S.; resources, H.B., I.B. and K.S.; data curation, O.S., I.I., H.B., I.B. and K.S.; writing—original draft preparation, O.S., I.I., H.B., I.B. and K.S.; writing—review and editing, O.S., I.I., H.B., I.B. and K.S.; visualization, O.S., I.B. and K.S.; supervision, O.S., I.I., H.B. and I.B.; project administration, O.S., I.I. and K.S.; funding acquisition, I.I., H.B., I.B. and K.S. All authors have read and agreed to the published version of the manuscript.
Funding
This study is financed by the European Union-NextGenerationEU, through the National Recovery and Resilience Plan of the Republic of Bulgaria, project № BG-RRP-2.013-0001-C01.
Data Availability Statement
The original contributions presented in the study are included in the article, further inquiries can be directed to the corresponding author.
Conflicts of Interest
The funders had no role in the design of the study; in the collection, analyses, or interpretation of data; in the writing of the manuscript; or in the decision to publish the results.
References
- GWEC. Global Wind Report 2026; Global Wind Energy Council: Brussels, Belgium, 2026; Available online: https://www.gwec.net (accessed on 23 April 2026).
- IEA PVPS. Snapshot of Global PV Markets 2026. Report IEA-PVPS T1-48. 2026. Available online: https://iea-pvps.org (accessed on 23 April 2026).
- IRENA. Renewable Power Generation Costs in 2024; International Renewable Energy Agency: Abu Dhabi, United Arab Emirates, 2025; Available online: https://www.irena.org/Publications/2025/Jun/Renewable-Power-Generation-Costs-in-2024 (accessed on 23 April 2026).
- Irshad, A.S.; Ahmadullah, A.B.; Kamal, K.; Haidari, N.; Qanit, A.; Osmani, J.A.; Elias, S. Optimization of coal sustainability via hybrid renewable integration: A PVsyst-HOMER Synergistic framework for sustainable energy transitions. Energy Convers. Manag. X 2025, 27, 101110. [Google Scholar] [CrossRef] [Scilit]
- Karamov, D.N.; Ilyushin, P.V.; Suslov, K.V. Electrification of Rural Remote Areas Using Renewable Energy Sources: Literature Review. Energies 2022, 15, 5881. [Google Scholar] [CrossRef] [Scilit]
- Lombardi, P.; Sokolnikova, T.; Suslov, K.; Styczynski, Z. Optimal storage capacity within an autonomous micro grid with a high penetration of Renewable Energy Sources. In Proceedings of the IEEE PES Innovative Smart Grid Technologies Conference Europe, Berlin, Germany, 14–17 October 2012. [Google Scholar] [CrossRef] [Scilit]
- Sheikholeslami, M.; Yarmohamad, S. Numerical analysis and performance optimization of a solar photovoltaic–electrolyzer system with hybrid nanofluid-based cooling for sustainable hydrogen production. Renew. Energy 2026, 268, 125526. [Google Scholar] [CrossRef] [Scilit]
- Aneroid Energy. Aneroid Energy Online Data Portal. Available online: https://anero.id/energy (accessed on 10 November 2025).
- Meng, Q.; He, Y.; Hussain, S.; Lu, J.; Guerrero, J.M. Optimized energy storage configuration for enhanced flexibility in renewable-integrated power systems. J. Energy Storage 2025, 132, 117735. [Google Scholar] [CrossRef] [Scilit]
- Ding, J.; Wang, J.; Zhao, N.; Yang, J. Stochastic scheduling optimization of an integrated energy system incorporating power and ammonia energy storage for cost-effective and flexible operation. Int. J. Hydrogen Energy 2026, 197, 152626. [Google Scholar] [CrossRef] [Scilit]
- Qin, J.; Fang, F.; Tian, X. Optimization of hybrid energy storage capacities for large-scale renewable energy bases in the desert: A case study of Tennger, China. Energy 2025, 332, 136791. [Google Scholar] [CrossRef] [Scilit]
- Emrani, A.; Berrada, A. Modeling and optimal capacity configuration of dry gravity energy storage integrated in off-grid hybrid PV/Wind/Biogas plant incorporating renewable power generation forecast. J. Energy Storage 2024, 97, 112698. [Google Scholar] [CrossRef] [Scilit]
- Kong, F.; Huang, Q.; Tong, L.; Wang, L.; Ding, Y. Stable Grid Integration of Renewable Energy and Storage Power Systems Based on Configuration Optimization and Power Management. Available online: https://ssrn.com/abstract=4945153 (accessed on 10 April 2026).
- Ma, T.; Chen, J.; Ma, X.; Yang, Y. Multi-objective optimal configuration of off-grid residential hybrid renewable energy system based on hypervolume-improved Non-dominated Sorting Genetic Algorithm III. Int. J. Hydrogen Energy 2024, 87, 277–289. [Google Scholar] [CrossRef] [Scilit]
- Iqbal, M.N.; Bhatti, A.R.; Farhan, M.; Butt, A.D. Optimizing the design of hybrid renewable energy systems considering electric vehicle loading. Electr. Power Syst. Res. 2026, 252, 112452. [Google Scholar] [CrossRef] [Scilit]
- Al-Masri, H.M.K.; Dawaghreh, O.M.; Magableh, S.K. Optimal configuration of a large-scale on-grid renewable energy system with different design strategies. J. Clean. Prod. 2023, 414, 137572. [Google Scholar] [CrossRef] [Scilit]
- Basu, M. Optimal day-ahead scheduling of renewable energy-based virtual power plant considering electrical, thermal, and cooling energy. J. Energy Storage 2023, 65, 107363. [Google Scholar] [CrossRef] [Scilit]
- Hua, L.-G.; Alghamdi, H.; Hafeez, G.; Ali, S.; Khan, F.A.; Khan, M.I.; Jun, L.J. Optimal energy management via day-ahead scheduling considering renewable energy and demand response in smart grids. ISA Trans. 2024, 154, 268–284. [Google Scholar] [CrossRef] [Scilit] [PubMed]
- Hu, F.; Zhang, Y.; Zhou, M.; Wang, K.; Zhang, L.; Hou, X.; Hu, W.; Hao, S.; Chen, M.; Zhang, X. Optimization and scheduling of active distribution networks considering demand response and renewable energy-based ammonia production. Int. J. Hydrogen Energy 2025, 124, 175–190. [Google Scholar] [CrossRef] [Scilit]
- Obara, S.; Ito, Y.; Okada, M. Optimization algorithm for power-source arrangement that levels the fluctuations in wide-area networks of renewable energy. Energy 2018, 142, 447–461. [Google Scholar] [CrossRef] [Scilit]
- Ebrie, A.S.; Kim, Y.J. Reinforcement learning-based optimization for power scheduling in a renewable energy connected grid. Renew. Energy 2024, 230, 120886. [Google Scholar] [CrossRef] [Scilit]
- Wu, M.; Yan, R.; Zhang, J.; Fan, J.; Wang, J.; Bai, Z.; He, Y.; Cao, G.; Hu, K. An enhanced stochastic optimization for greater flexibility in an integrated energy system with flexible loads and a high penetration level of renewables. Renew. Energy 2024, 227, 120502. [Google Scholar] [CrossRef] [Scilit]
- WindEurope. Wind Energy in Europe—2020 Statistics and the Outlook for 2021–2025; WindEurope: Brussels, Belgium, 2021. [Google Scholar]
- WindEurope. Wind Energy in Europe in 2019—Trends and Statistics; WindEurope: Brussels, Belgium, 2020. [Google Scholar]
- Pourasl, H.H.; Vatankhah Barenji, R.; Khojastehnezhad, V.M. Solar energy status in the world: A comprehensive review. Energy Rep. 2023, 10, 3474–3493. [Google Scholar] [CrossRef] [Scilit]
- Ilyushin, P.V.; Georgievsky, I.D. Review of Methods for Improving the Flexibility of Power Plants with an Increase in the Share of Wind and Solar Power Plants in Regional Power Systems. Power Technol. Eng. 2024, 58, 463–470. [Google Scholar] [CrossRef] [Scilit]
- Radin, Y.A. Improving the Flexibility and Reliability of Steam Power Units at Thermal Power Plants. Therm. Eng. 2021, 68, 481–489. [Google Scholar] [CrossRef] [Scilit]
- Kamana-Williams, B.; Bishop, D. Flexible futures: The potential for electrical energy demand response in New Zealand. Energy Policy 2024, 195, 114387. [Google Scholar] [CrossRef] [Scilit]
- Stotzer, M.; Gronstedt, P.; Styczynski, Z.; Buchholz, B.M.; Glaunsinger, W.; Suslov, K. Demand side integration-A potential analysis for the German power system. In Proceedings of the IEEE Power and Energy Society General Meeting, San Diego, CA, USA, 22–26 July 2012. [Google Scholar] [CrossRef] [Scilit]
- Stanislaw, L.; Seatle, M.; McPherson, M. Quantifying the value of building demand response: Introducing a cross-sectoral model framework to optimize demand response scheduling. Energy Rep. 2024, 11, 2111–2126. [Google Scholar] [CrossRef] [Scilit]
- Palizban, O.; Kauhaniemi, K. Energy storage systems in modern grids-Matrix of technologies and applications. J. Energy Storage 2016, 6, 248–259. [Google Scholar] [CrossRef] [Scilit]

Disclaimer/Publisher’s Note: The statements, opinions and data contained in all publications are solely those of the individual author(s) and contributor(s) and not of MDPI and/or the editor(s). MDPI and/or the editor(s) disclaim responsibility for any injury to people or property resulting from any ideas, methods, instructions or products referred to in the content. |
© 2026 by the authors. Licensee MDPI, Basel, Switzerland. This article is an open access article distributed under the terms and conditions of the Creative Commons Attribution (CC BY) license.