


Abstract
This paper addresses the current development status of a innovative direct high-pressure electrolyser (DHPEL, operating up to 700 bar) and its integration into a microgrid system in which solar energy constitutes the primary energy source and a hybrid energy storage system, comprising a battery and hydrogen, is employed. The DHPEL under development enables the direct production and storage of hydrogen at high pressures, thereby obviating the need for intermediate mechanical compression. In combination with standardized pressure vessels (300–350 bar) or the increasingly widespread use of CFRP-based high-pressure storage tanks (up to 700 bar), the DHPEL concept represents a technically and economically attractive option for microgrids with hybrid energy storage. The hybrid storage concept is based on functional differentiation between the storage media: the battery is intended to act predominantly as a buffer or short-term storage unit, and the hydrogen is designated for long-term energy storage. In principle, this configuration facilitates an autonomous energy supply relying exclusively on renewable energy sources; this is achieved by enabling the surplus solar energy generated in summer to be converted into hydrogen and subsequently utilized in winter. A rule-based energy-management algorithm is presented, prioritizing hydrogen production from surplus energy during the summer period and aiming to minimize interaction with the public electricity grid. This is particularly relevant for high-latitude regions, such as Germany, where solar irradiation is significantly lower in winter than in summer. A quasi-optimal sizing of all components in the microgrid, along with a realistic techno-economic assessment of the overall system, is performed using an energy-management model implemented in Simulink and utilised with realistic boundary conditions. A case study utilizing realistic solar generation and empirically derived electrical load profiles demonstrates the technical and economic viability of seasonal energy shifting from summer to winter (resulting in an autarky degree exceeding 1) within an economically acceptable cost range.
1. Introduction
Anthropogenic climate change and the resulting ecological, economic, and societal implications have fundamentally transformed the framework conditions of global energy policy. The expansion of renewable energy systems is assuming an increasingly central role in achieving significant and long-term reductions in greenhouse gas emissions and in meeting international climate protection targets. In this context, decentralized energy supply is moving into focus as an integral component of contemporary climate and energy policy [1,2,3,4]. It enables the local and efficient use of renewable energy sources, increases supply reliability, and reduces structural dependencies on fossil energy carriers as well as on centrally organized energy infrastructures. Renewable resources such as solar and wind energy are characterized by high temporal volatility, since their availability is directly determined by meteorological conditions, daily cycles, and seasonal fluctuations. The resulting feed-in profiles often do not correspond to the temporally varying load profile of energy demand. Powerful energy-storage technologies are therefore indispensable to ensure a stable, reliable, and demand-oriented energy supply [5,6]. While short-term storage contributes in particular to smoothing peak loads and providing short-term system regulation, long-term storage is crucial for keeping energy surpluses from periods of high generation, such as summer periods with high solar irradiance or pronounced wind events, available for times of low generation. Long-term storage thus makes a substantial contribution to maintaining grid stability, minimizing curtailment losses, and reducing the use of fossil-based reserve and peaking power plants. It therefore constitutes a fundamental technical and infrastructural prerequisite for a successful transformation toward a predominantly renewable, decentralized, and resilient energy supply system [7,8,9,10]. Among all possible long-term storage options, the importance of hydrogen deserves special emphasis. In the long-term storage of renewable energy, hydrogen can play a central role, as it is particularly well suited for storing large amounts of energy over long periods compared to electrical storage systems [11,12,13,14]. Surplus electrical energy from renewable sources can be converted into hydrogen by means of electrolysis. This process makes it possible to store energy in chemical form, thereby enabling a temporal decoupling between generation and use. A key advantage of hydrogen lies in its high storage capacity and low self-discharge, which makes it particularly suitable for seasonal storage applications. In addition, hydrogen can be stored and transported using existing infrastructure such as gas networks, caverns or pressure storage systems [15,16,17,18]. It is highly versatile and can be used both for reconversion into electricity and as an energy carrier in industry, mobility, and heat generation.
Nevertheless, the development of cost-efficient storage concepts for hydrogen still presents a significant technical and economic challenge today. In the context of hydrogen-based applications, two primary storage technologies can be distinguished: compressed gas storage and cryogenic storage. In compressed storage, hydrogen is partially compressed to pressures of up to 700 bar for mobile applications. Due to the required cost and weight reduction, the use of composite pressure vessels [19,20,21] is generally indispensable. In cryogenic hydrogen storage, the extremely low temperature of about −253 °C required for liquefaction (near the boiling point of hydrogen at atmospheric pressure) represents a considerable engineering challenge. A tank containing liquid hydrogen at −253 °C requires excellent thermal insulation to minimize heat ingress from the surroundings [22,23]. Nevertheless, due to the unavoidable residual heat transfer, the continuous evaporation of the liquid hydrogen (boil-off) occurs, which makes a continuous, controlled release of hydrogen necessary in order to keep the internal pressure in the tank within a safe operating range (Figure 1).
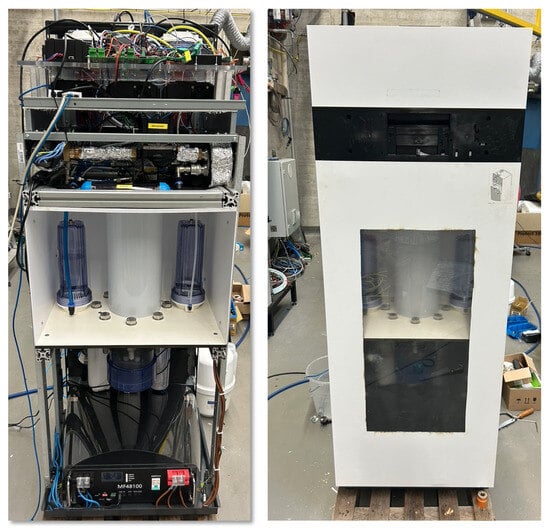
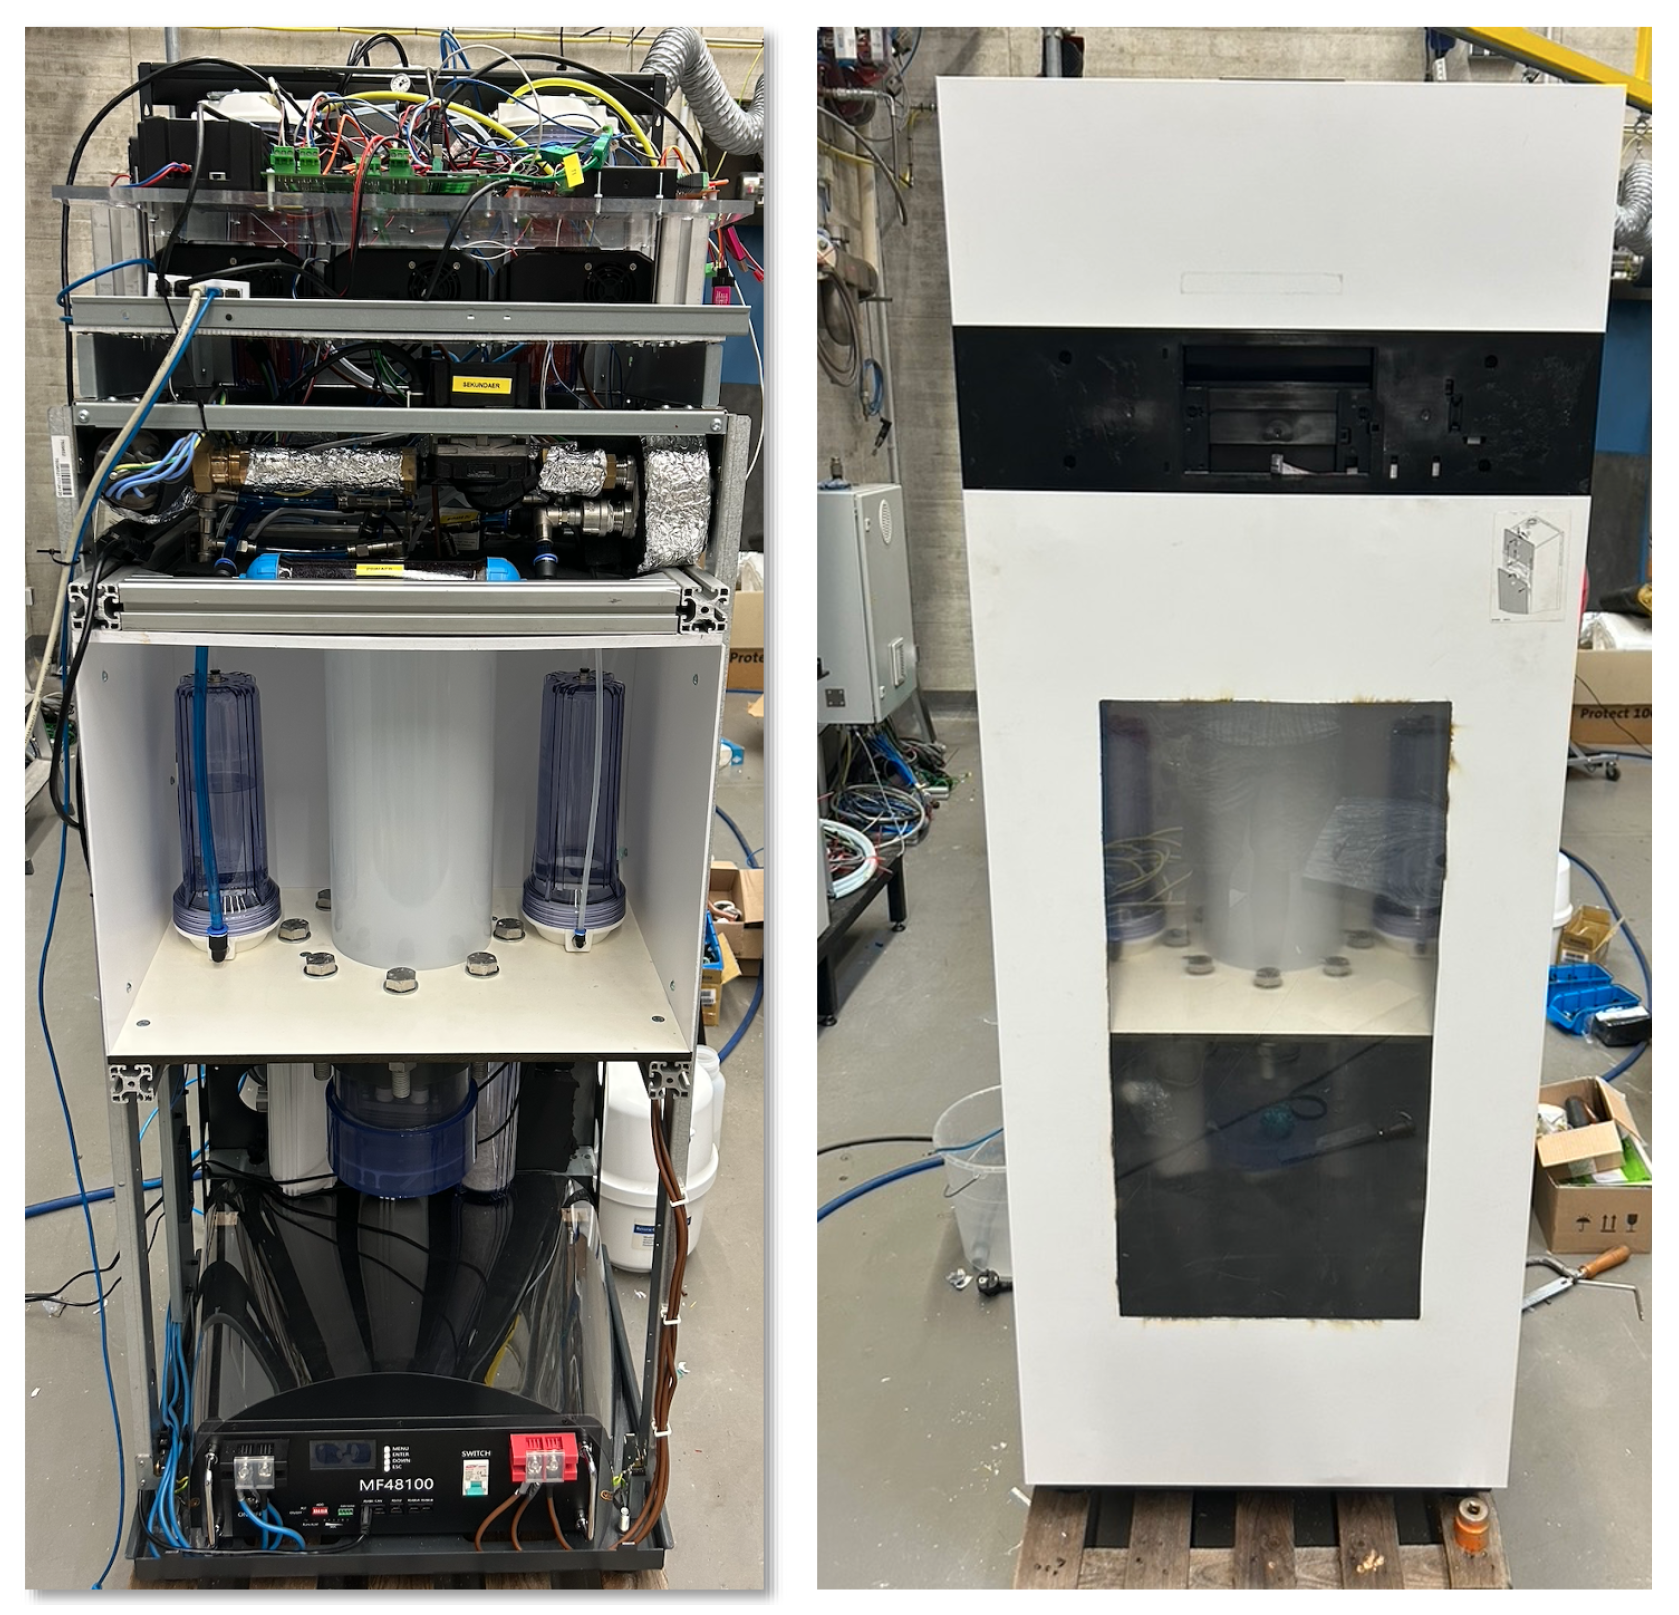
Figure 1.
The design mock-up of the DHPEL at BTU Cottbus-Senftenberg.
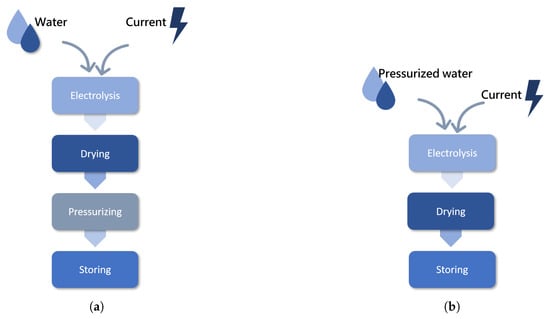
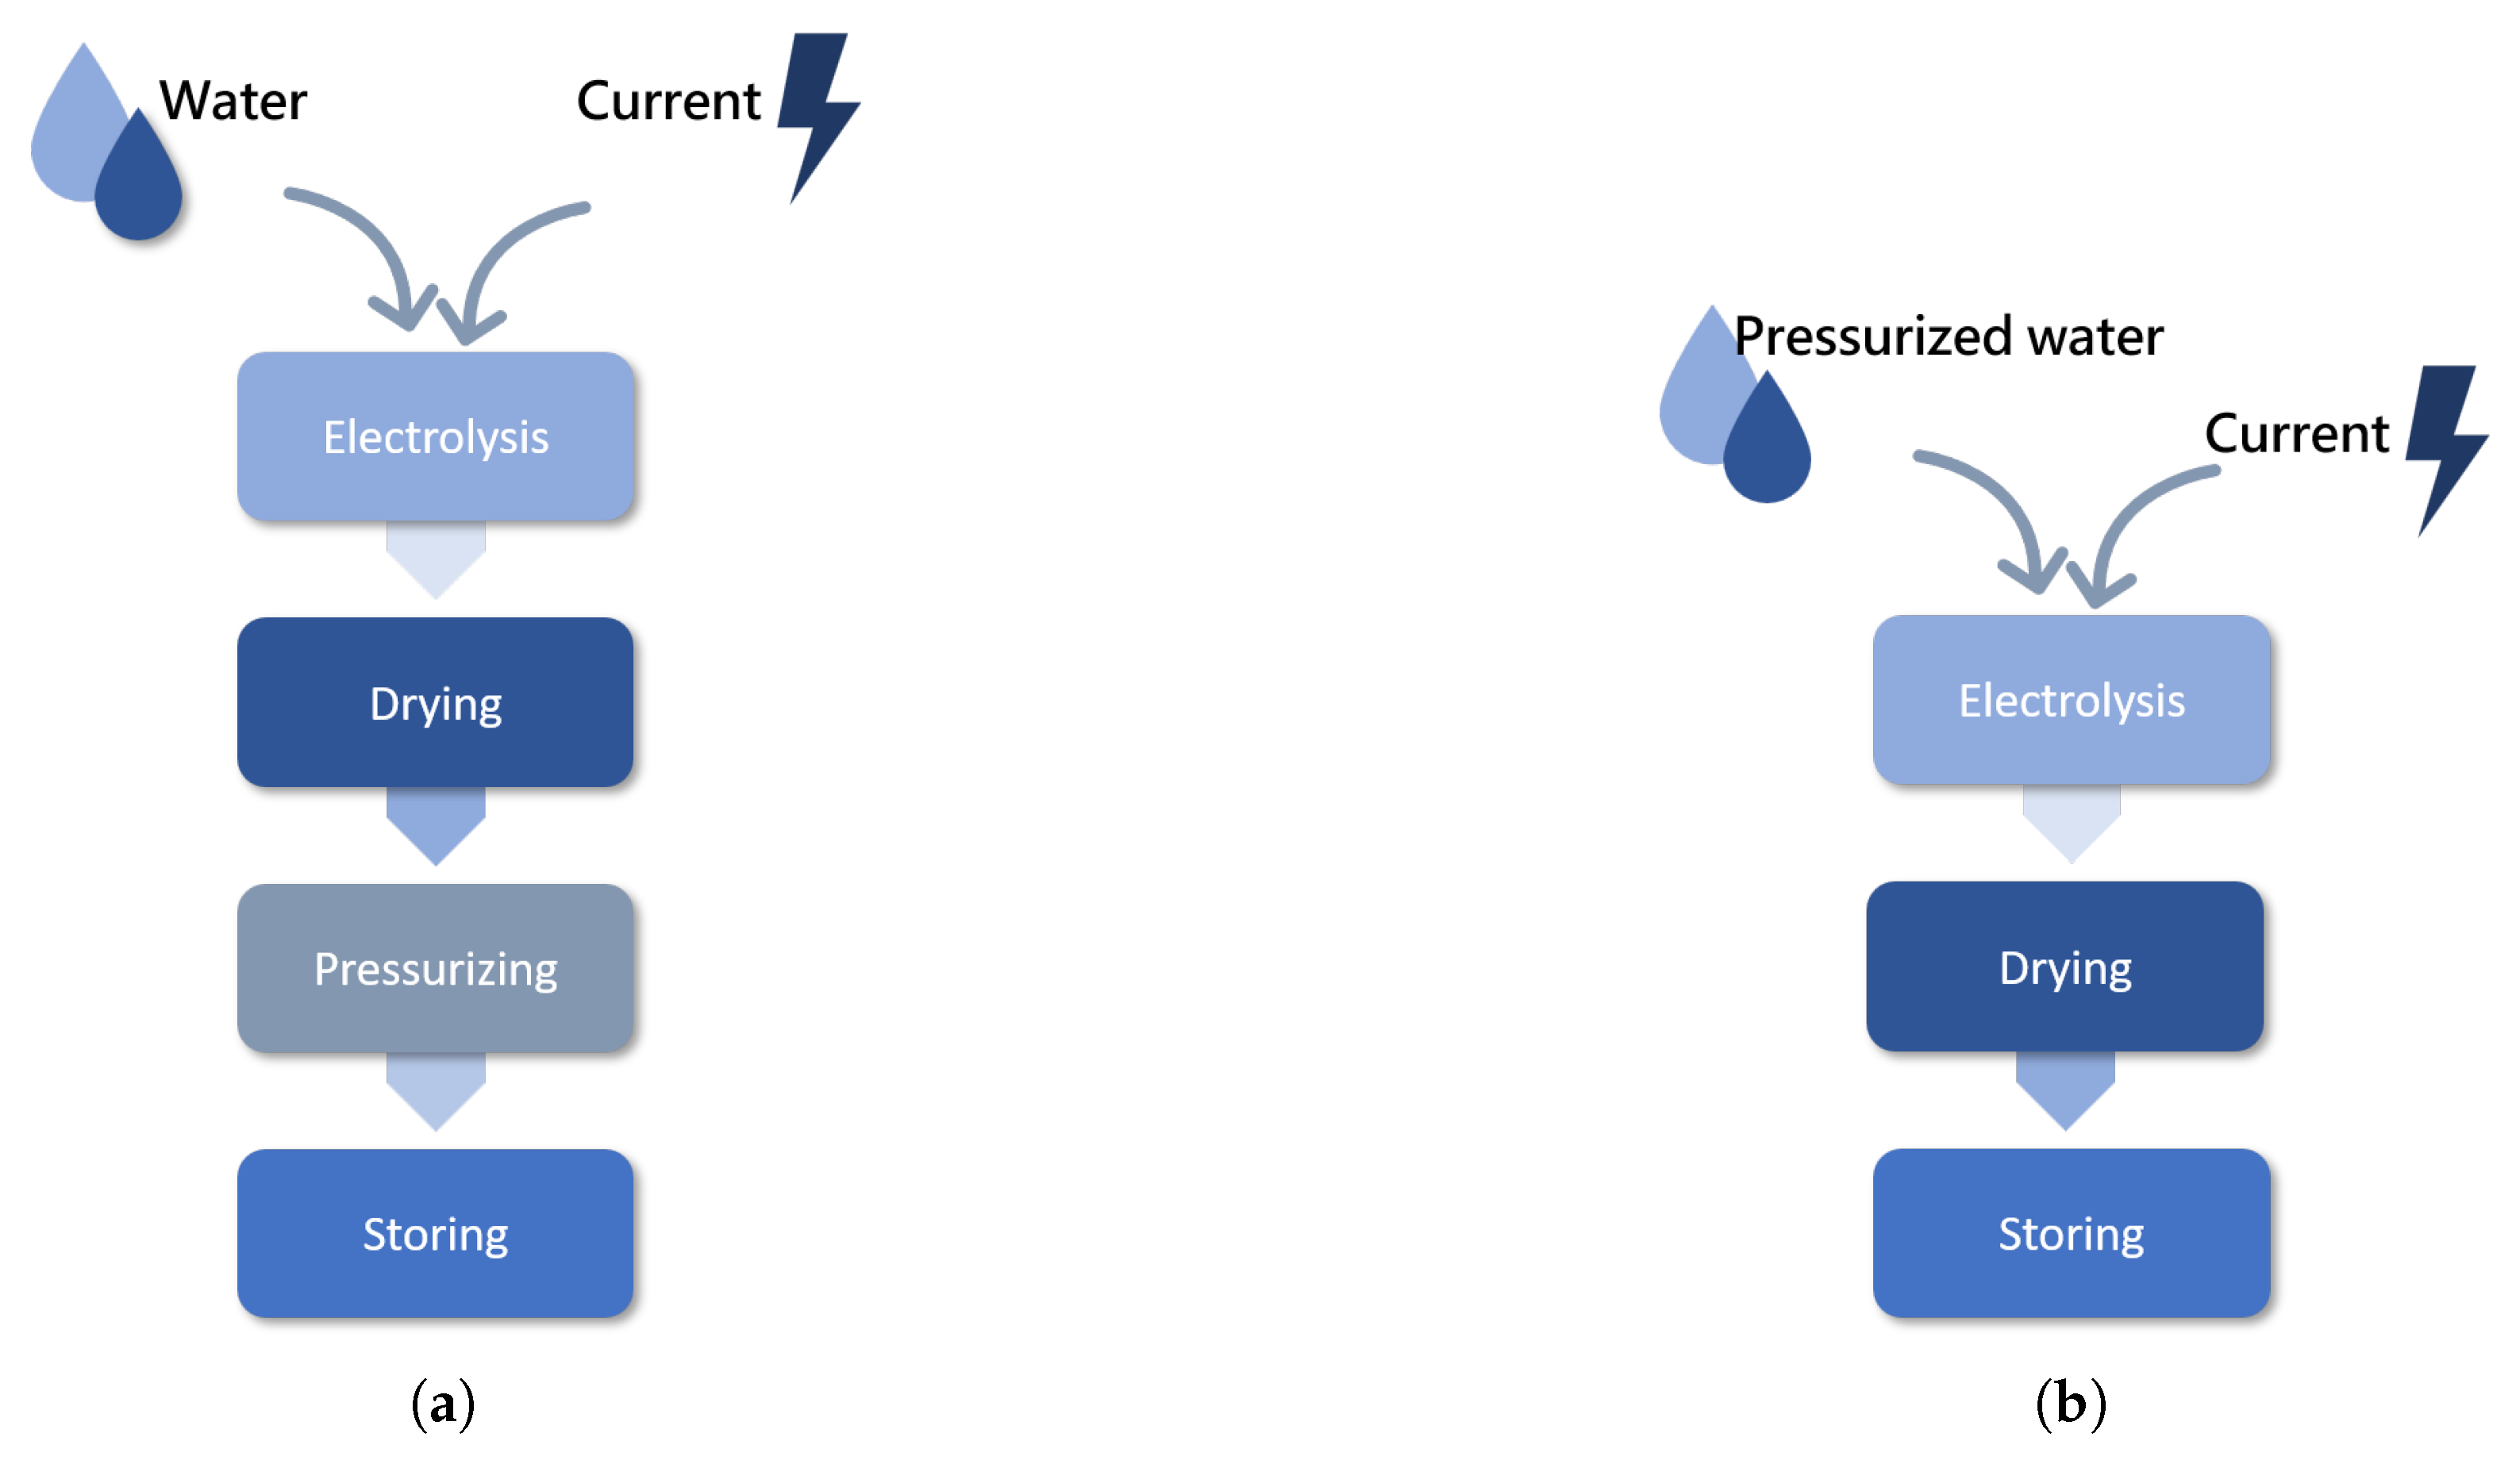
For the seasonal hydrogen-based energy storage within the microgrid application investigated in this study, compressed gas storage is initially selected as the preferred option, primarily due to the associated system complexity. When hydrogen is to be stored at pressures of 350 bar or 700 bar, a conventional electrolysis system requires a multi-stage hydrogen compressor to incrementally increase the gas pressure to these elevated levels. To ensure reliable compressor operation, preconditioning of the hydrogen—through processes such as dehumidification and intercooling—is generally required. To address the intrinsic limitations, increased system complexity, and elevated operational effort associated with conventional compressors, various alternative approaches are being investigated. One strategy for replacing traditional mechanical compressors is metal-hydride-based hydrogen compression, which utilizes the reversible absorption and desorption of hydrogen in metal hydrides to achieve gas compression [24,25]. Regardless of whether hydrogen compression is carried out using conventional mechanical compressors or metal-hydride-based methods, it always takes place in addition to electrolysis. For compression to occur directly via an electrochemical process, an innovative direct high-pressure electrolyser (DHPEL) is being developed at the Chair of Internal Combustion Engines and Aircraft Propulsion at the BTU Cottbus in Germany. In comparison with conventional electrolyser systems, it can produce hydrogen directly at high pressure (350 to 700 bar) without a mechanical compressor. Figure 2 shows a schematic comparison between a conventional electrolyser system and the special in-house electrolyser system being developed. In this innovative concept, a low-pressure electrolyser stack is located inside a pressure vessel designed for an operating pressure of 700 bar. The remaining volume of this pressure vessel is filled with dielectric ultrapure water. Through a flexible hydraulic connection, the anode side of the stack is connected to the water environment, ensuring that the pressure on the anode side corresponds to the pressure of the surrounding water. By simultaneously throttling both the cathode and anode sides of the stack during operation, a continuous mechanical equilibrium is maintained between the inside and outside of the stack. In this way, the stack can be operated at very high pressure without mechanical stress. In this manner, so-called electrochemical compression is realized, and this process is implemented without any moving components, in contrast to conventional mechanical compressors. For continuous operation, only the replenishment of water—compressed to the system pressure—is required. Honda [26] has likewise successfully demonstrated electrochemical compression, but employing a fundamentally different concept, namely direct compression via the stack membrane. In comparison with the BTU concept, this approach necessitates a substantially more complex stack architecture, including a heavily reinforced housing and a specialized clamping device. A number of potential technical challenges, such as hydrogen crossover and water management, are being investigated using the test rig. The test rig is currently in the manufacturing phase and will be commissioned shortly. A design mock-up is shown in Figure 1.
Figure 2.
Comparison of conventional and DHPEL hydrogen energy storage concepts. (a) Conventional storage of renewable energy using hydrogen. (b) Innovative DHPEL for storing renewable energy using hydrogen.
On the basis of this novel DHPEL, a microgrid system that includes both a battery for short-term energy storage and a hydrogen-based long-term storage unit is constructed using a model-based approach and analysed numerically. It should be emphasized that the hydrogen-based microgrid system investigated in this work differs significantly in terms of system costs as well as implementation potential from other hydrogen microgrid systems described in the literature [27,28,29,30,31,32,33,34,35,36,37]. By dispensing with a mechanical hydrogen compressor (e.g., a multi-stage piston compressor), the entire plant becomes substantially more compact and more flexible in its operation. The previously required complex pre- and post-conditioning of the hydrogen before and after the compression process is thus eliminated, removing a central weak point in the process chain for the production of high-pressure hydrogen. The Matlab-Simulink/Simscape (2025a) model presented in this study, which incorporates realistic boundary conditions and realistic component-specific characteristics, demonstrates that the concept of seasonal energy shifting based on hydrogen is technically viable (autarky degree according to Equation (9) greater than 1) within an overall acceptable cost framework, provided that the system architecture is rigorously optimized and the individual components are appropriately dimensioned. In the future, DHPEL could represent a key technology for improving and scaling the use and availability of high-pressure hydrogen for seasonal energy storage across a broad range of user groups.
2. Structure of the Microgrid System and the Energy-Management Model
2.1. Structure of a Microgrid System
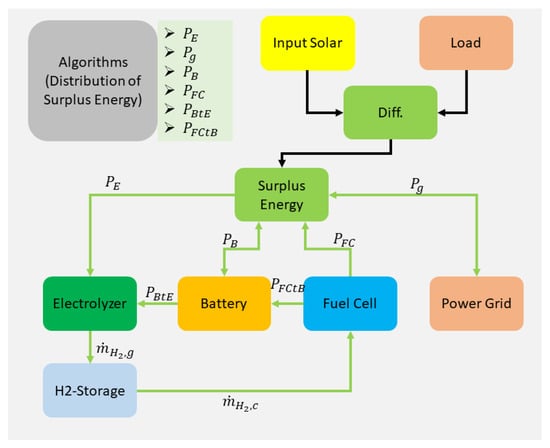
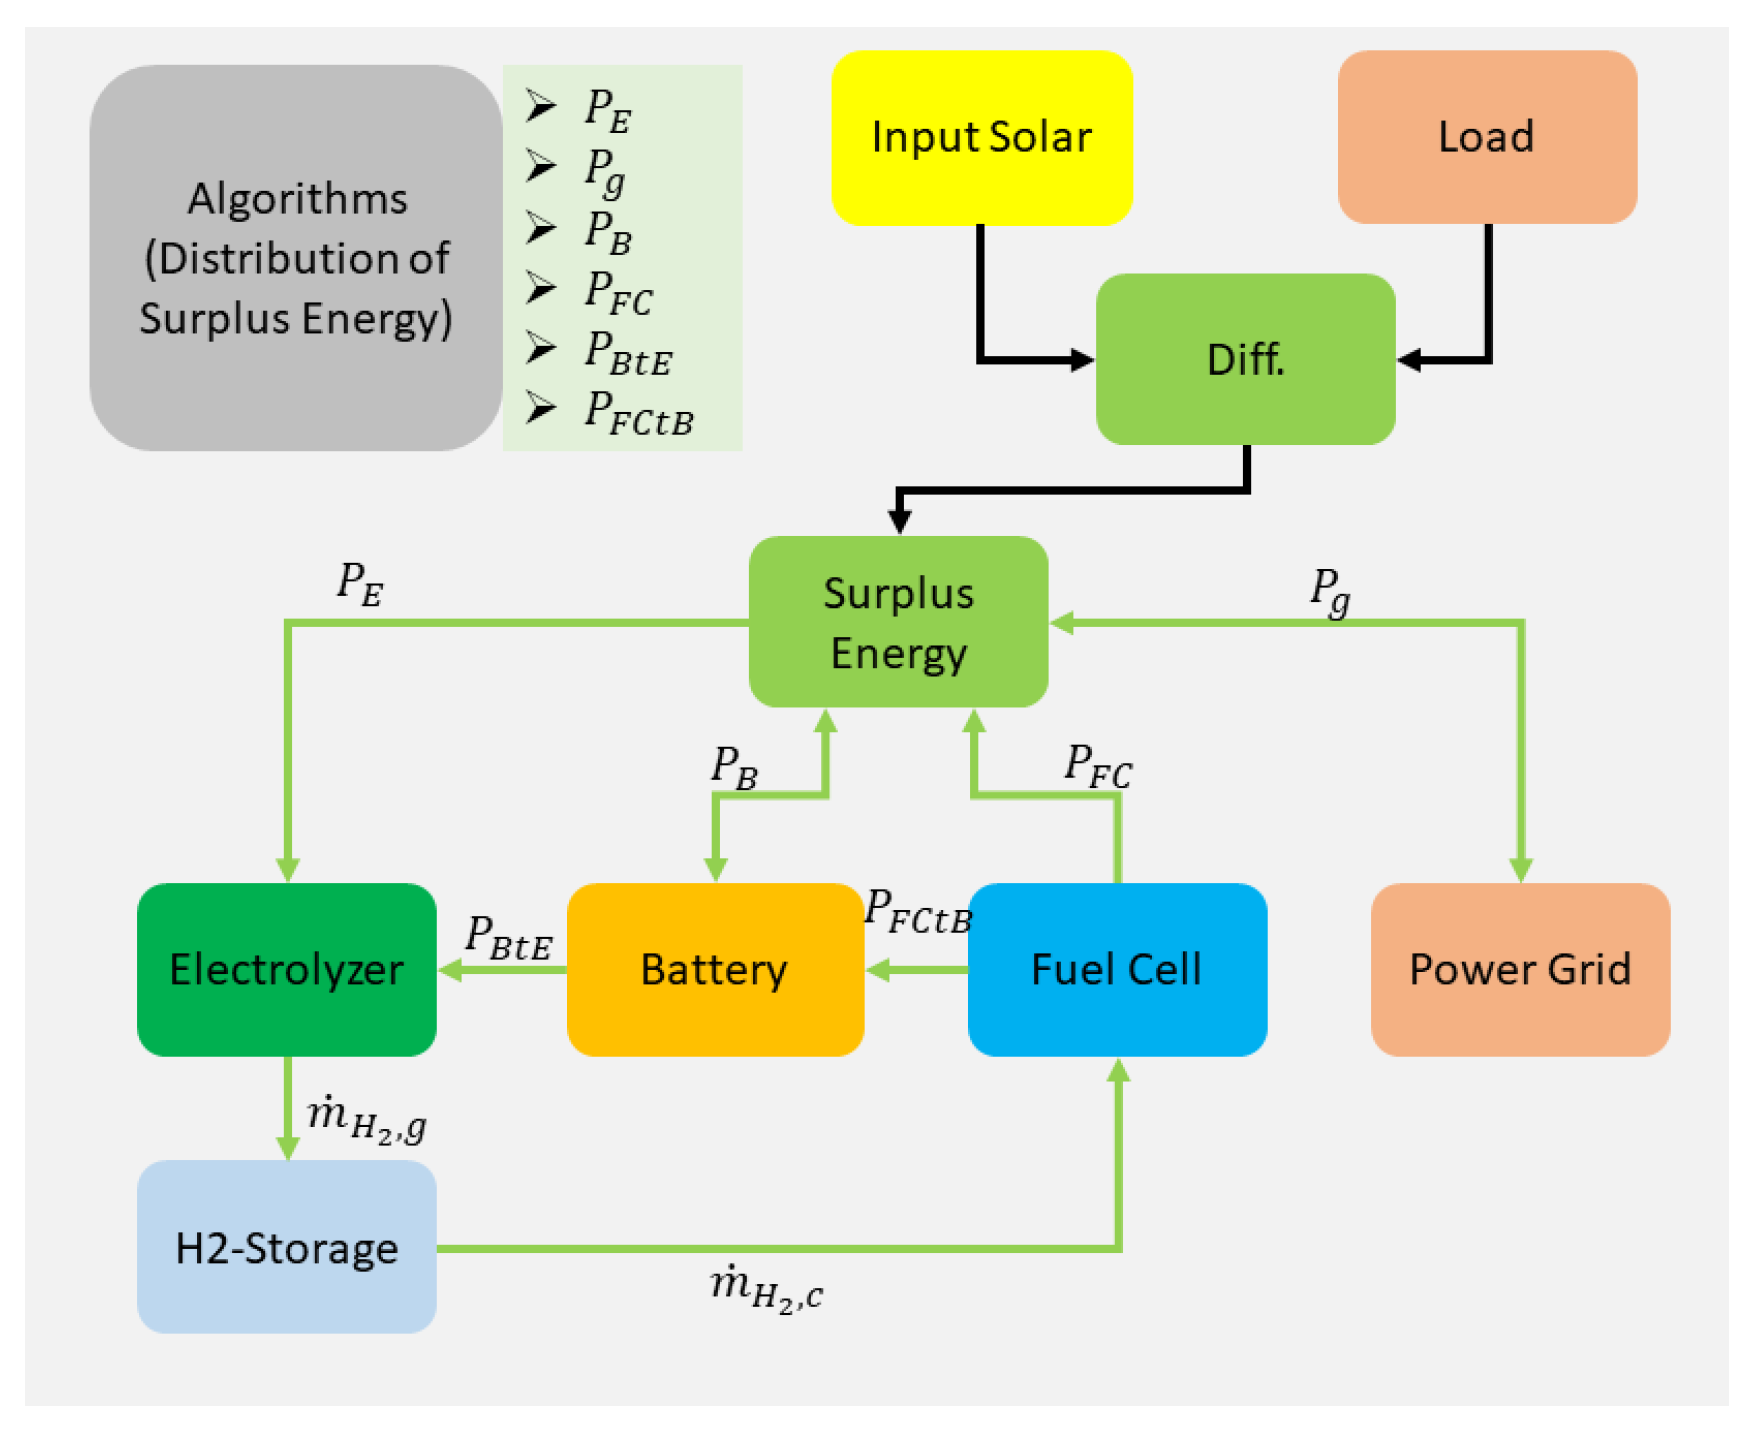
The microgrid system with standalone capability analysed in this study consists of photovoltaic (PV) modules, a direct high-pressure electrolyser (DHPEL), a battery energy storage system, a proton exchange membrane (PEM) fuel cell, and a hydrogen pressure storage unit. Although the system is fundamentally capable of operating in standalone mode, it remains interconnected with the upstream public power grid, as full energy autarky is neither technically necessary nor economically advantageous in many practical applications. The energetic interactions among the individual components are depicted schematically in Figure 3.
Figure 3.
Energetic relationship between different components of the microsystem.
The difference between the electrical energy generated by the PV system and the electrical load of the microgrid is hereinafter denoted as the energy surplus. For a positive energy surplus, and depending on the operational objectives of the microgrid (e.g., cost minimization, reduction in pollutant emissions, or maximization of self-sufficiency), this surplus must either be stored in the available energy storage systems or injected into the external grid, as coordinated by an appropriate energy-management algorithm. In the case of a negative energy surplus (i.e., an energy deficit), the resulting shortfall in electrical energy must be compensated by supplying power from the battery storage system, the fuel cell, or the external grid.
How the surplus energy is to be distributed is determined in the module for the control algorithm.
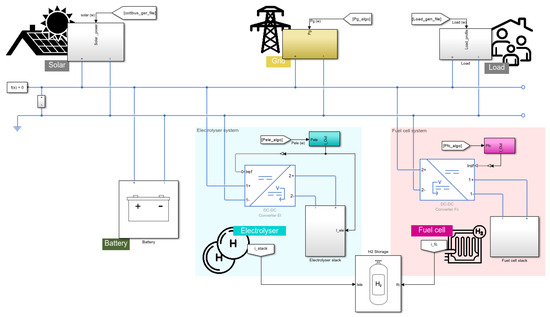
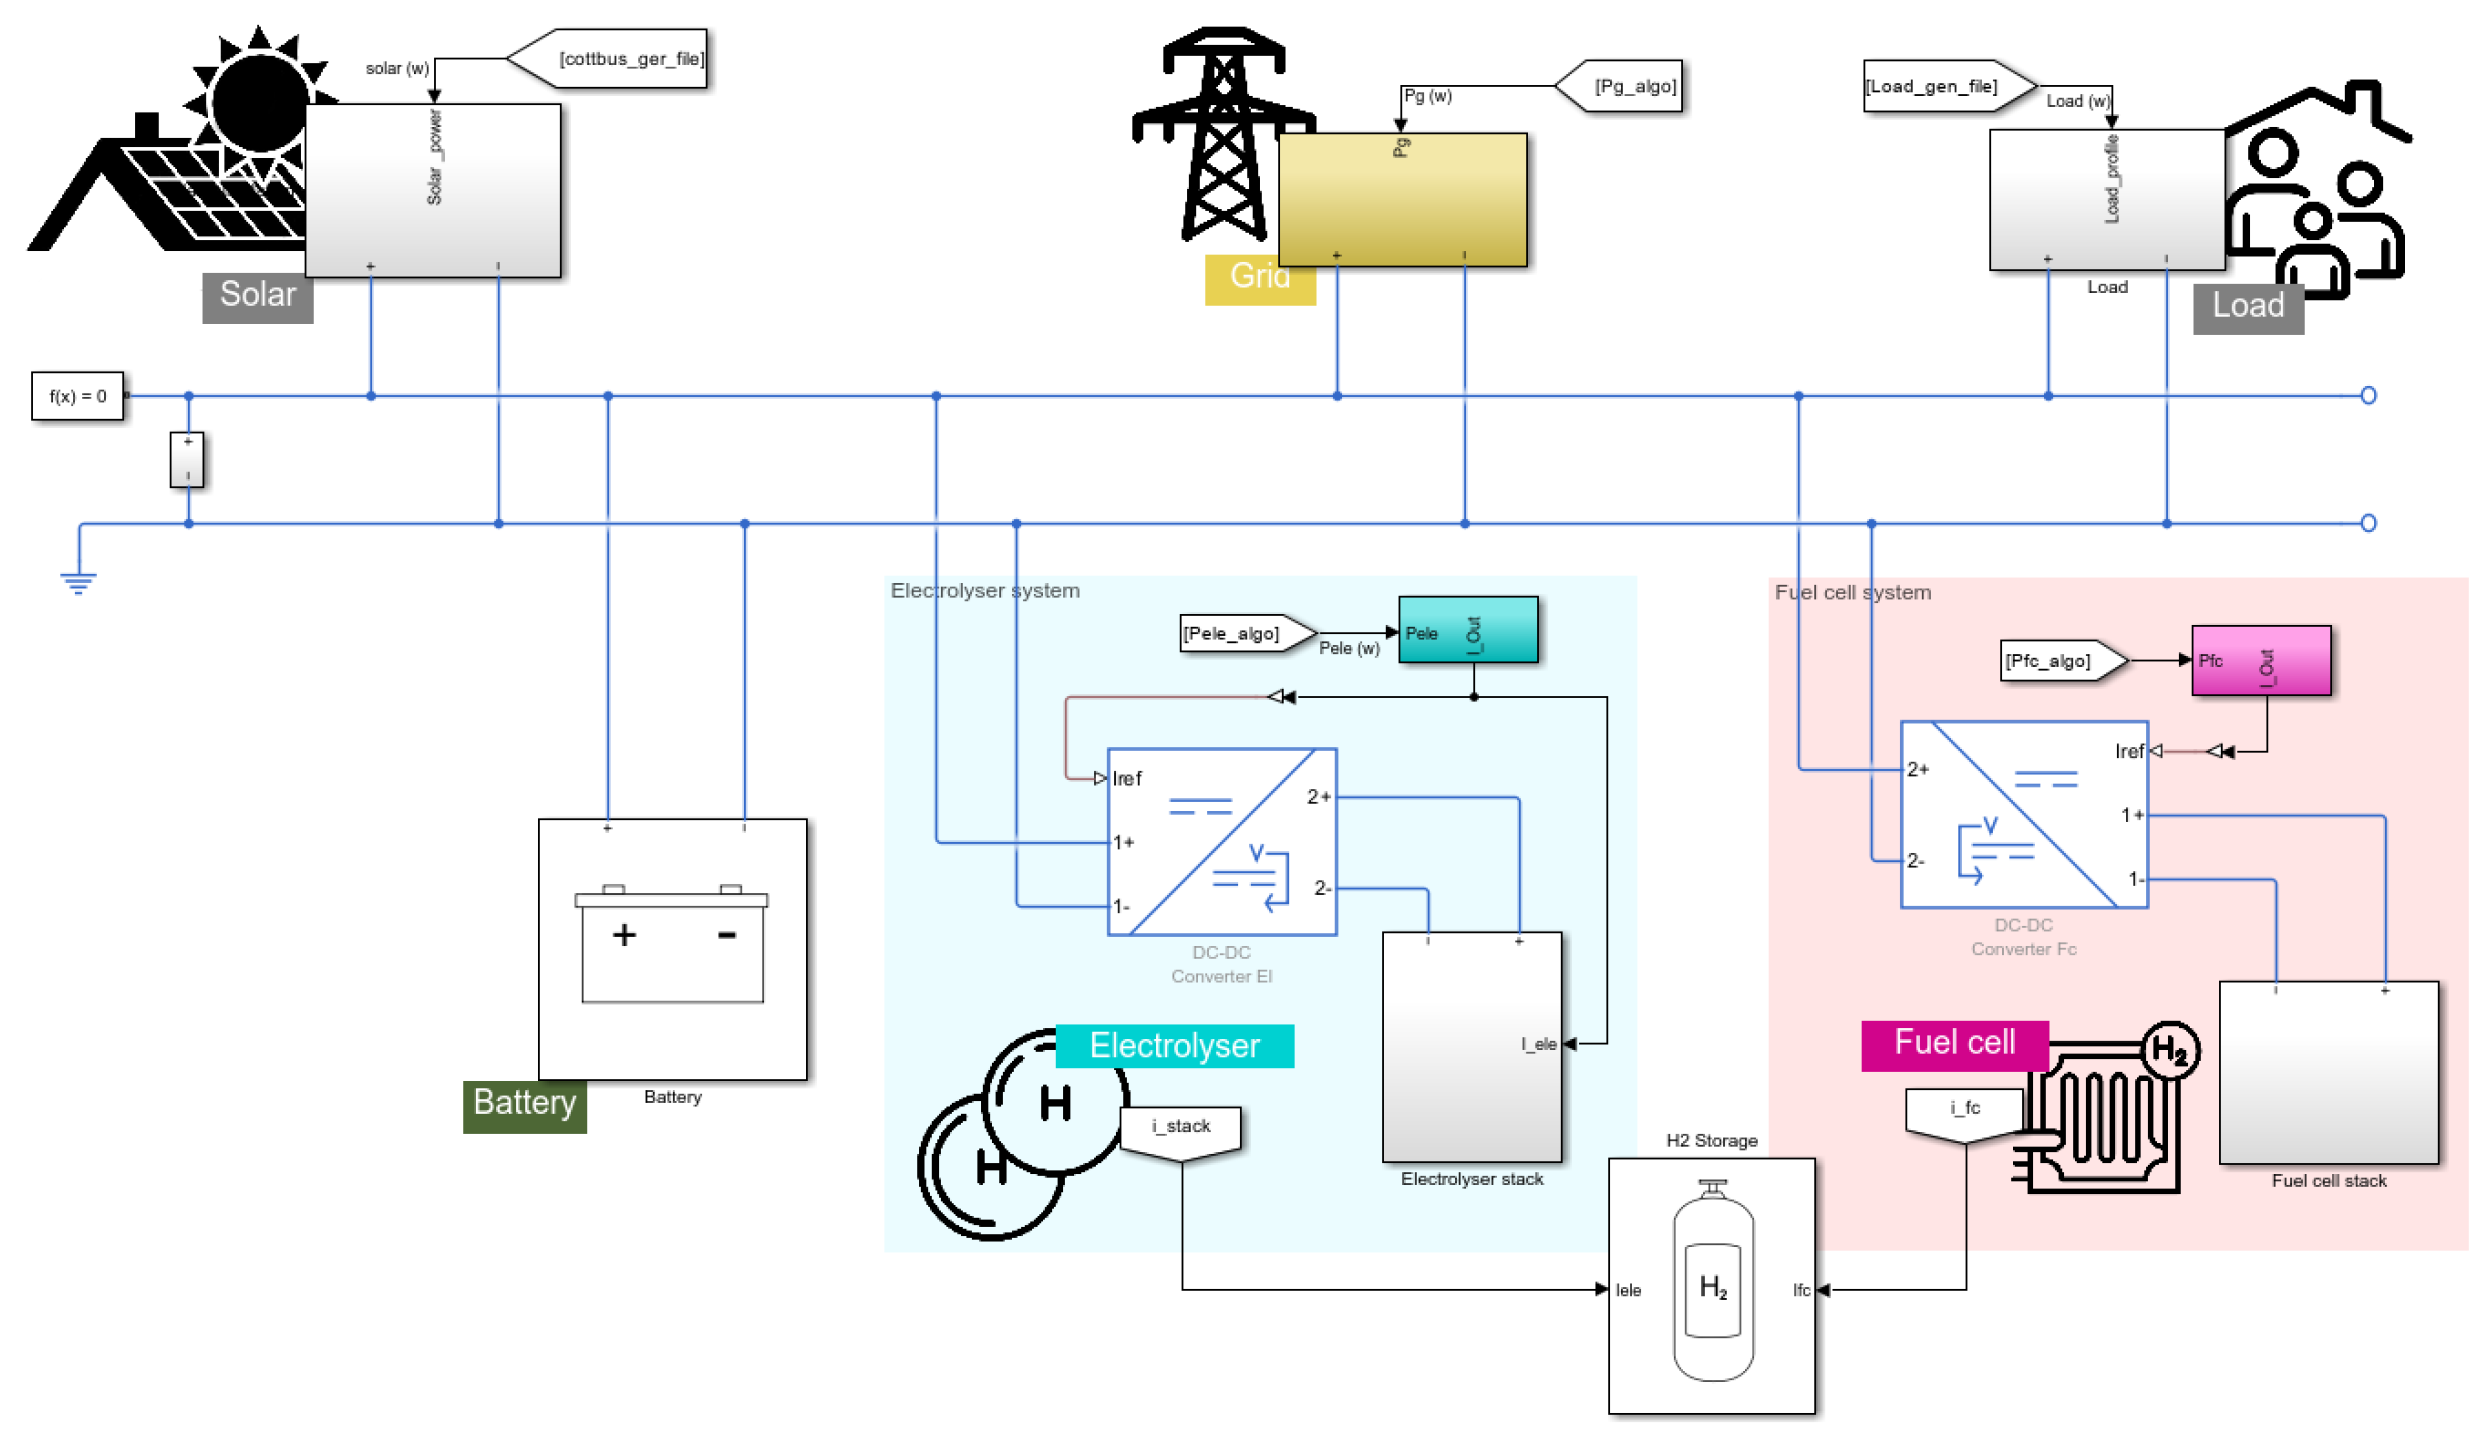
The structure of the microgrid system in Figure 3 is modelled in Matlab-Simulink/Simscape environment (Figure 4). It includes the following subsystems: a battery component, a fuel cell model, an electrolyser model, a solar power profile, a load demand profile, and a grid representation. The algorithm is not shown as a separate component because it controls the operation and interaction of all components. The battery is modelled using the standard Simscape Battery block, based on defined parameters. The fuel cell and electrolyser are modelled using characteristic polarisation (I–V) curves derived from experimental data and component data sheets. The electrical grid is represented by a controllable current source, simulating an exchange of power between the system and the utility network.
Figure 4.
Overview of the components of the Simulink/Simscape microgrid model.
The energy management policy is governed by a self-made algorithm described in Section 2.3. This algorithm coordinates the power distribution by assigning power set-points to the controllable components. The controllable components are the fuel cell, the electrolyser, and the grid. The battery acts as a buffer (absorbing or releasing energy as needed) and is not directly controlled. All the components are connected to a single power bus.
2.2. Mathematical Description of the Components
Given that the overall model is predominantly employed for energy-management purposes, an energy balance is formulated for each individual component only. This level of detail is adequate both for the dimensioning of all components and for conducting the associated cost analysis.
2.2.1. Electrolyser
In the electrolyser, the electrical power is converted into chemical energy (heating value) and heat (loss). From a physical standpoint, the following relation holds:
with as the supplied electrical power, as the efficiency, as the heating value of the hydrogen, and as the mass flow rate of hydrogen produced. The mass flow rate of hydrogen produced is then coupled with the electric current by the Faraday equation:
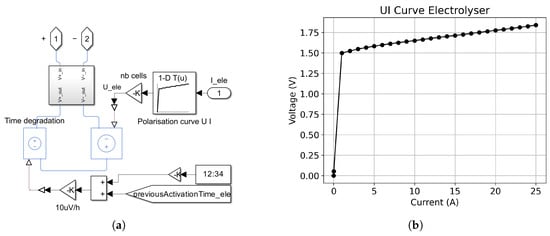
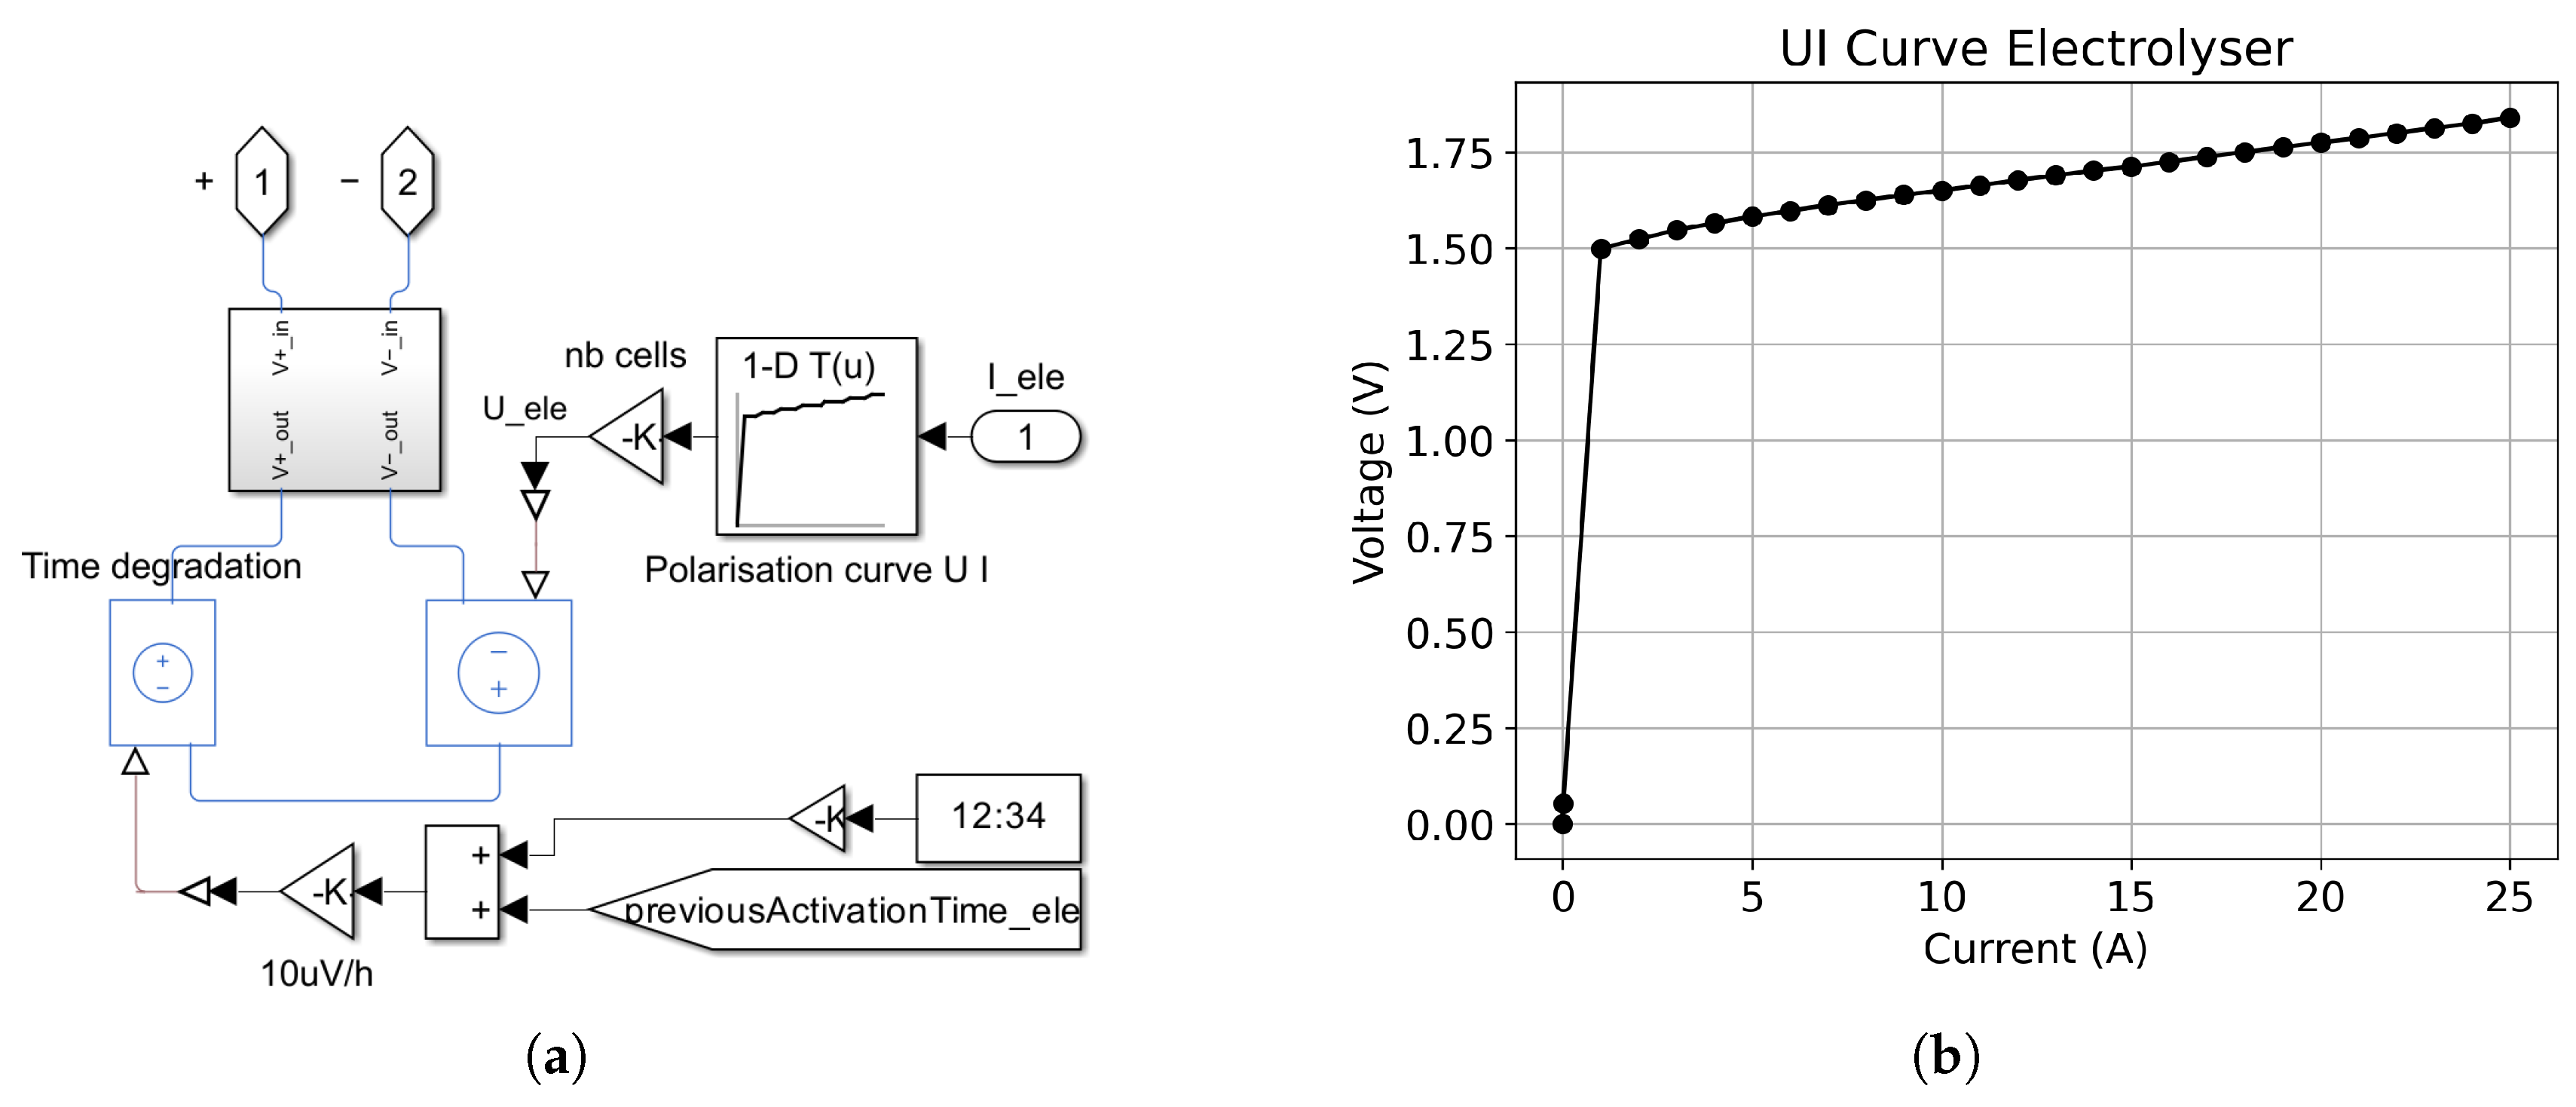
where is the Faraday efficiency, is the number of cells, z is the number of exchanged electrons and F is the Faraday constant. The electrolyser is modelled using the polarisation curve of a single electrolysis cell (Figure 5). The cell voltage is scaled by the total number of cells to achieve the desired power output. Electrolyser degradation is modelled by a gradual increase in the effective cell voltage, corresponding to a degradation rate, where time corresponds to the electrolyser’s cumulative operating time. The degradation is highly correlated with the operation mode and must be considered when controlling the electrolyser stack [38]. Among the key influencing factors, temperature has been shown to accelerate electrolyser degradation [39,40]; however, in the present system, the stack operates under active temperature control, such that this contribution is assumed to be constant and is implicitly captured by the degradation coefficient. Under the optimized stack control, the time-averaged degradation rate remains close to 10 μV h−1 [41,42].
Figure 5.
(a) Simulink model of the electrolyser. (b) Polarisation curve of the electrolyser.
2.2.2. Battery
Since electrical energy is stored in the battery, the corresponding stored energy can be determined by integrating the instantaneous electrical power over time:
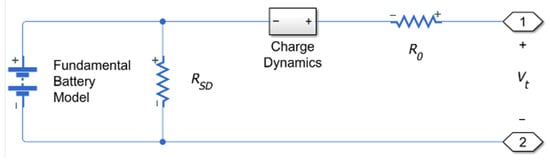
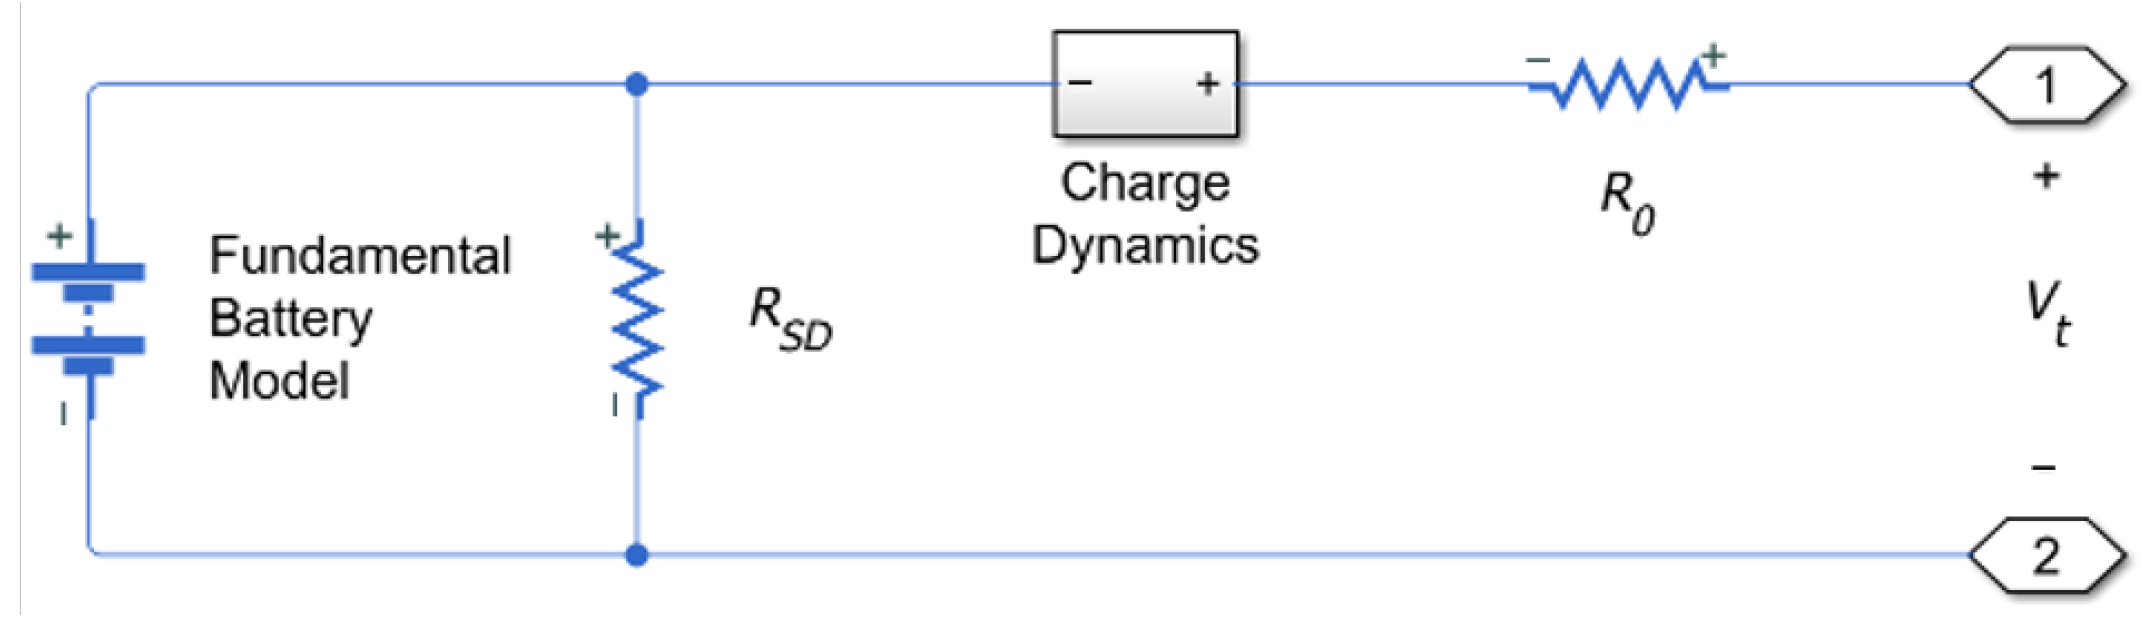
with E as the stored electrical energy (kWh) at time t, as the initially stored electrical energy (kWh), and as the power supplied to or drawn from the battery. The current state of charge (SOC) is defined as the ratio between the available electrical energy and the capacity of the battery (). The battery is modelled as an equivalent circuit, as depicted in Figure (Figure 6), comprising an ideal voltage source in series with an internal resistance. However, The Simscape model provides the capability to represent dynamic behaviour, self-discharge, and ageing phenomena; however, these aspects are neglected, as they evolve on much faster time scales and have limited influence on the energy balance and overall energy conservation considered in this work.
Figure 6.
Battery equivalent circuit.
2.2.3. Fuel Cell
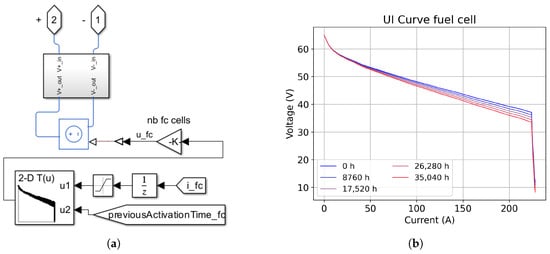
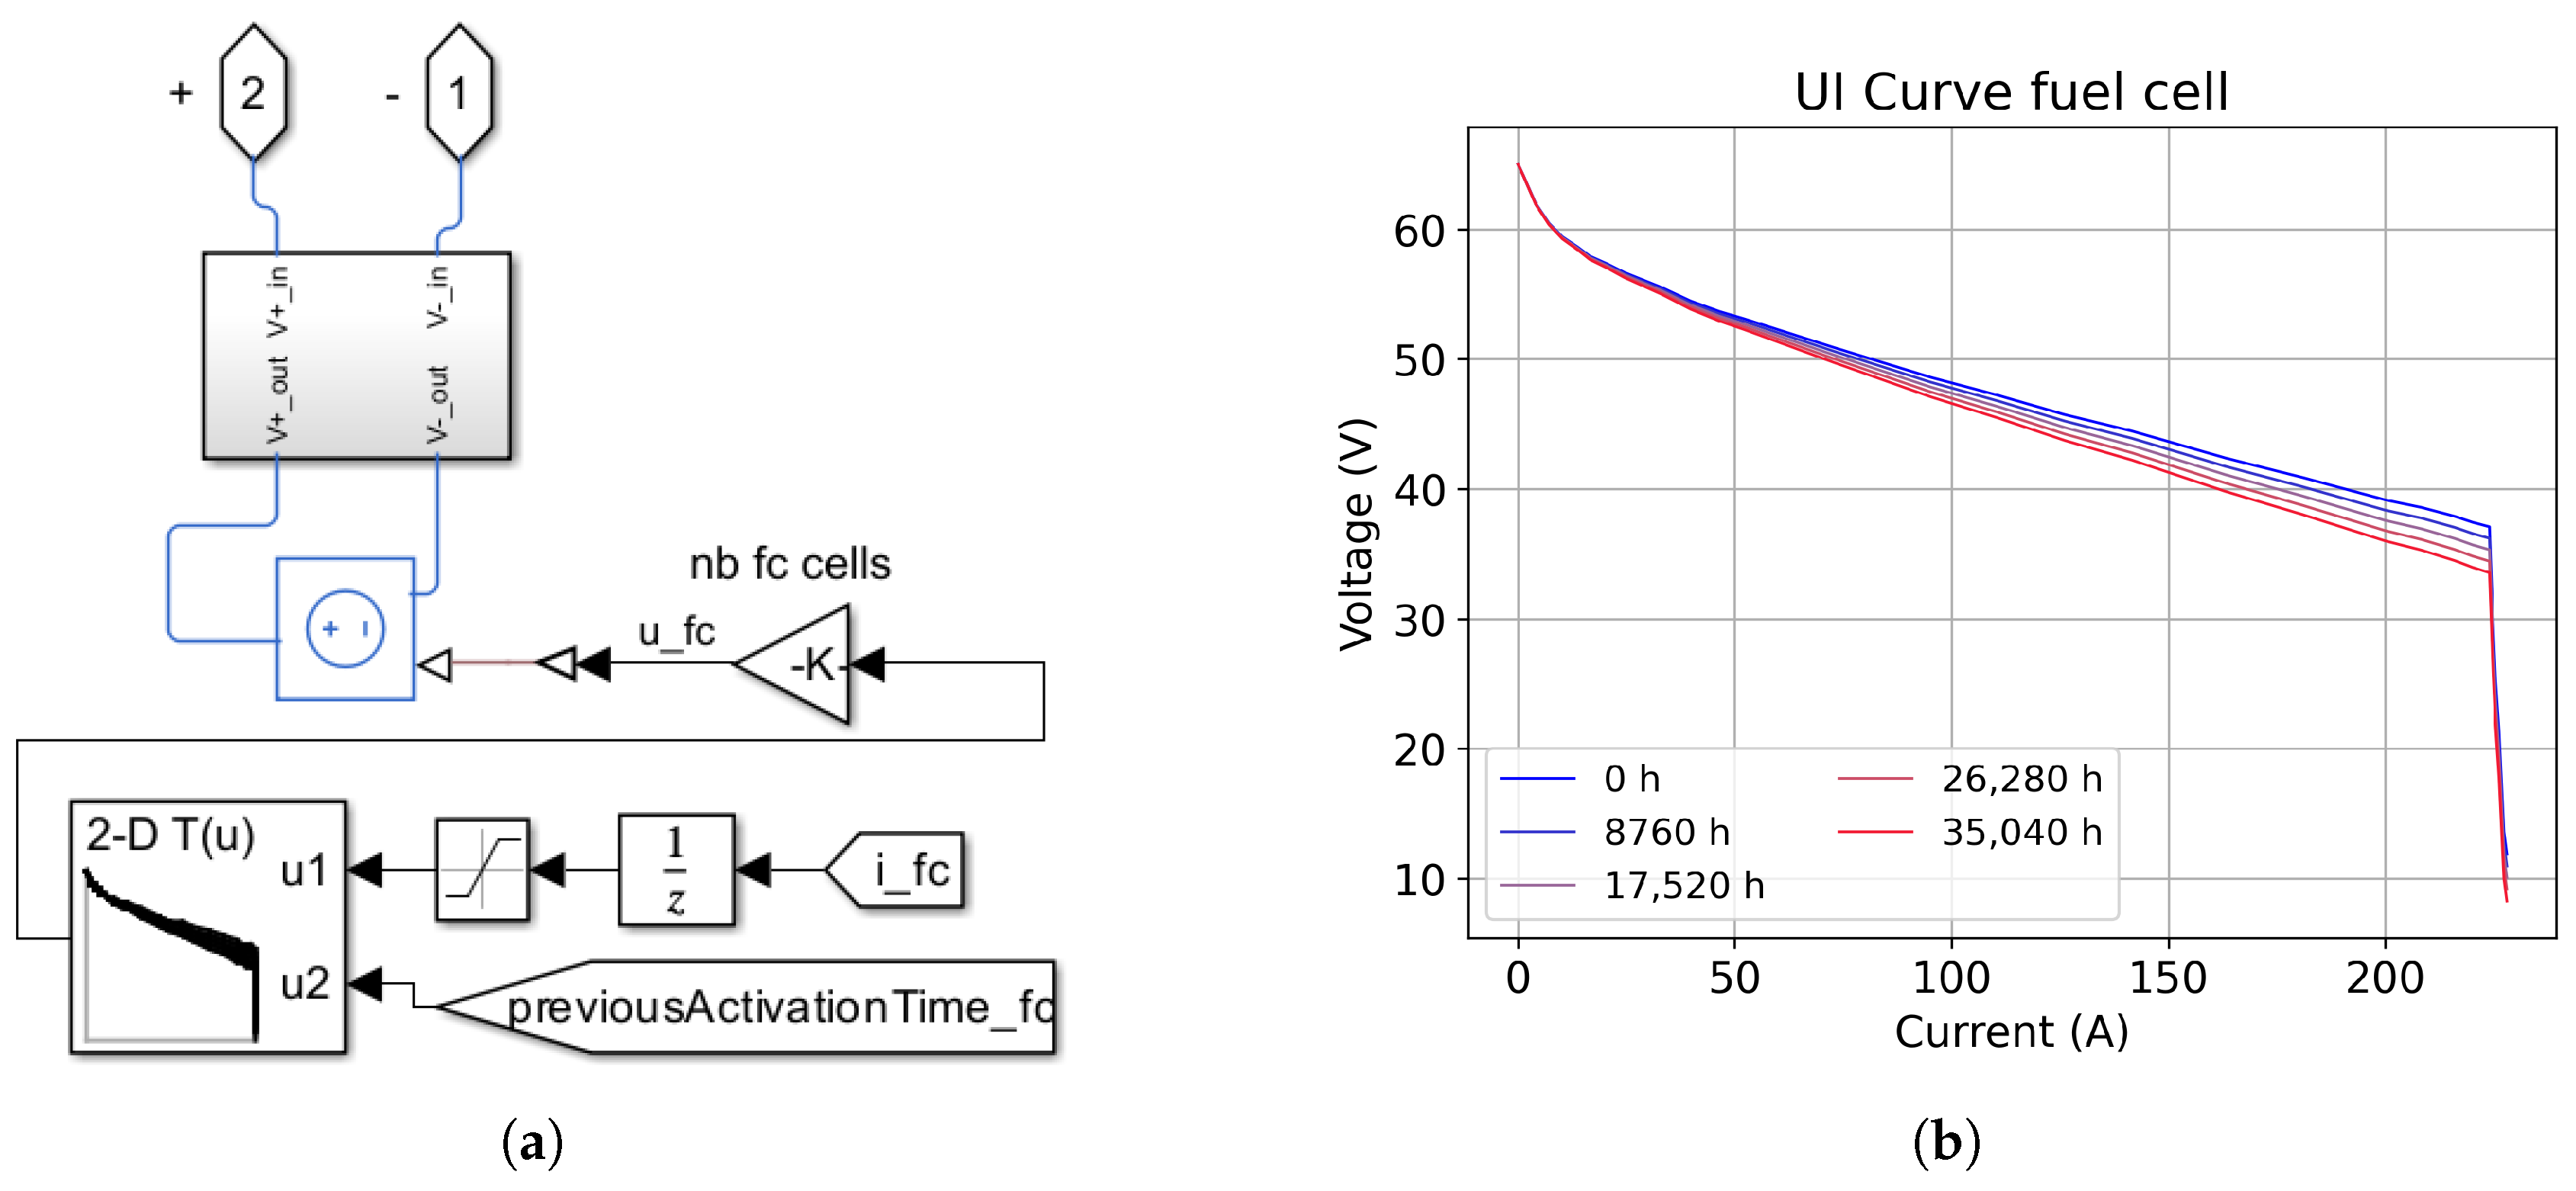
The fuel cell module is modelled based on a realistic polarisation curve, as depicted in Figure 7a. In the fuel cell, in contrast to the electrolyser, the inverse process occurs, namely the conversion of chemical energy into electrical energy:
is the power output from the fuel cell, and is the mass flow rate of hydrogen consumed. The fuel cell module uses the polarisation curve of the NedStack PS6 fuel cell stack described in [43]. The cell voltage is scaled by the total number of cells to achieve the desired power output. The fuel cell degradation is approached by modifying the polarisation curve according to
where denotes the voltage of the original state, I is the operating current, is the maximum current, and k is a degradation coefficient of 10% per 43,800 h (5 years) for this current as shown in (Figure 7b).
Figure 7.
(a) Simulink model of the fuel cell. (b) Polarisation curve of the fuel cell with yearly degradation.
The choice of a 10% value is consistent with the criteria reported by [44] for stationary PEM fuel cells, which define end-of-life as a 10% drop in rated power under standard durability protocols with a common degradation range of 2–10 μV h−1, which is commonly reported for most applications. Temperature-related degradation effects are not explicitly considered in this model, as the fuel cell is assumed to operate under controlled and optimal temperature conditions throughout its lifetime. Start–stop degradation is to be mitigated at the system level by the energy-management system. The polarisation-curve-based formulation adopted here is further supported by recent lifetime prediction studies that track the temporal evolution of electrochemical parameters through the polarisation curve [45,46].
2.2.4. Storage
Analogously to the storage of electrical energy in the battery, the quantity of hydrogen stored can be determined by an integral representation:
where denotes the present hydrogen reservoir and represents the initial hydrogen mass.
2.3. Algorithm of the Energy Management
The primary objective of the algorithm is to maximize hydrogen production during the summer period. This is most effectively accomplished by allocating nearly all seasonal energy surpluses to electrolysis, thereby minimizing electricity feed-in to the public power grid. From a theoretical standpoint, continuous operation of the electrolyser would be preferable; however, in practice, the actual operating profile is constrained by the SOC, the hydrogen storage tank fill level, and the forecasts of future meteorological conditions. is defined as follows:
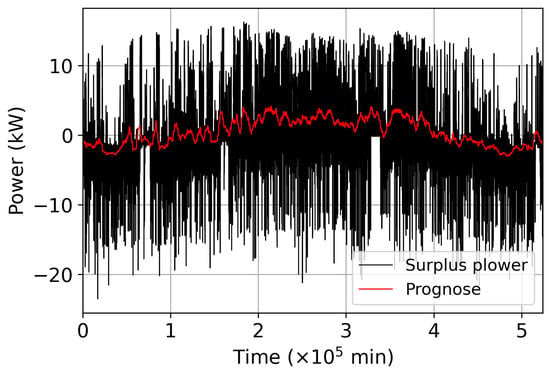
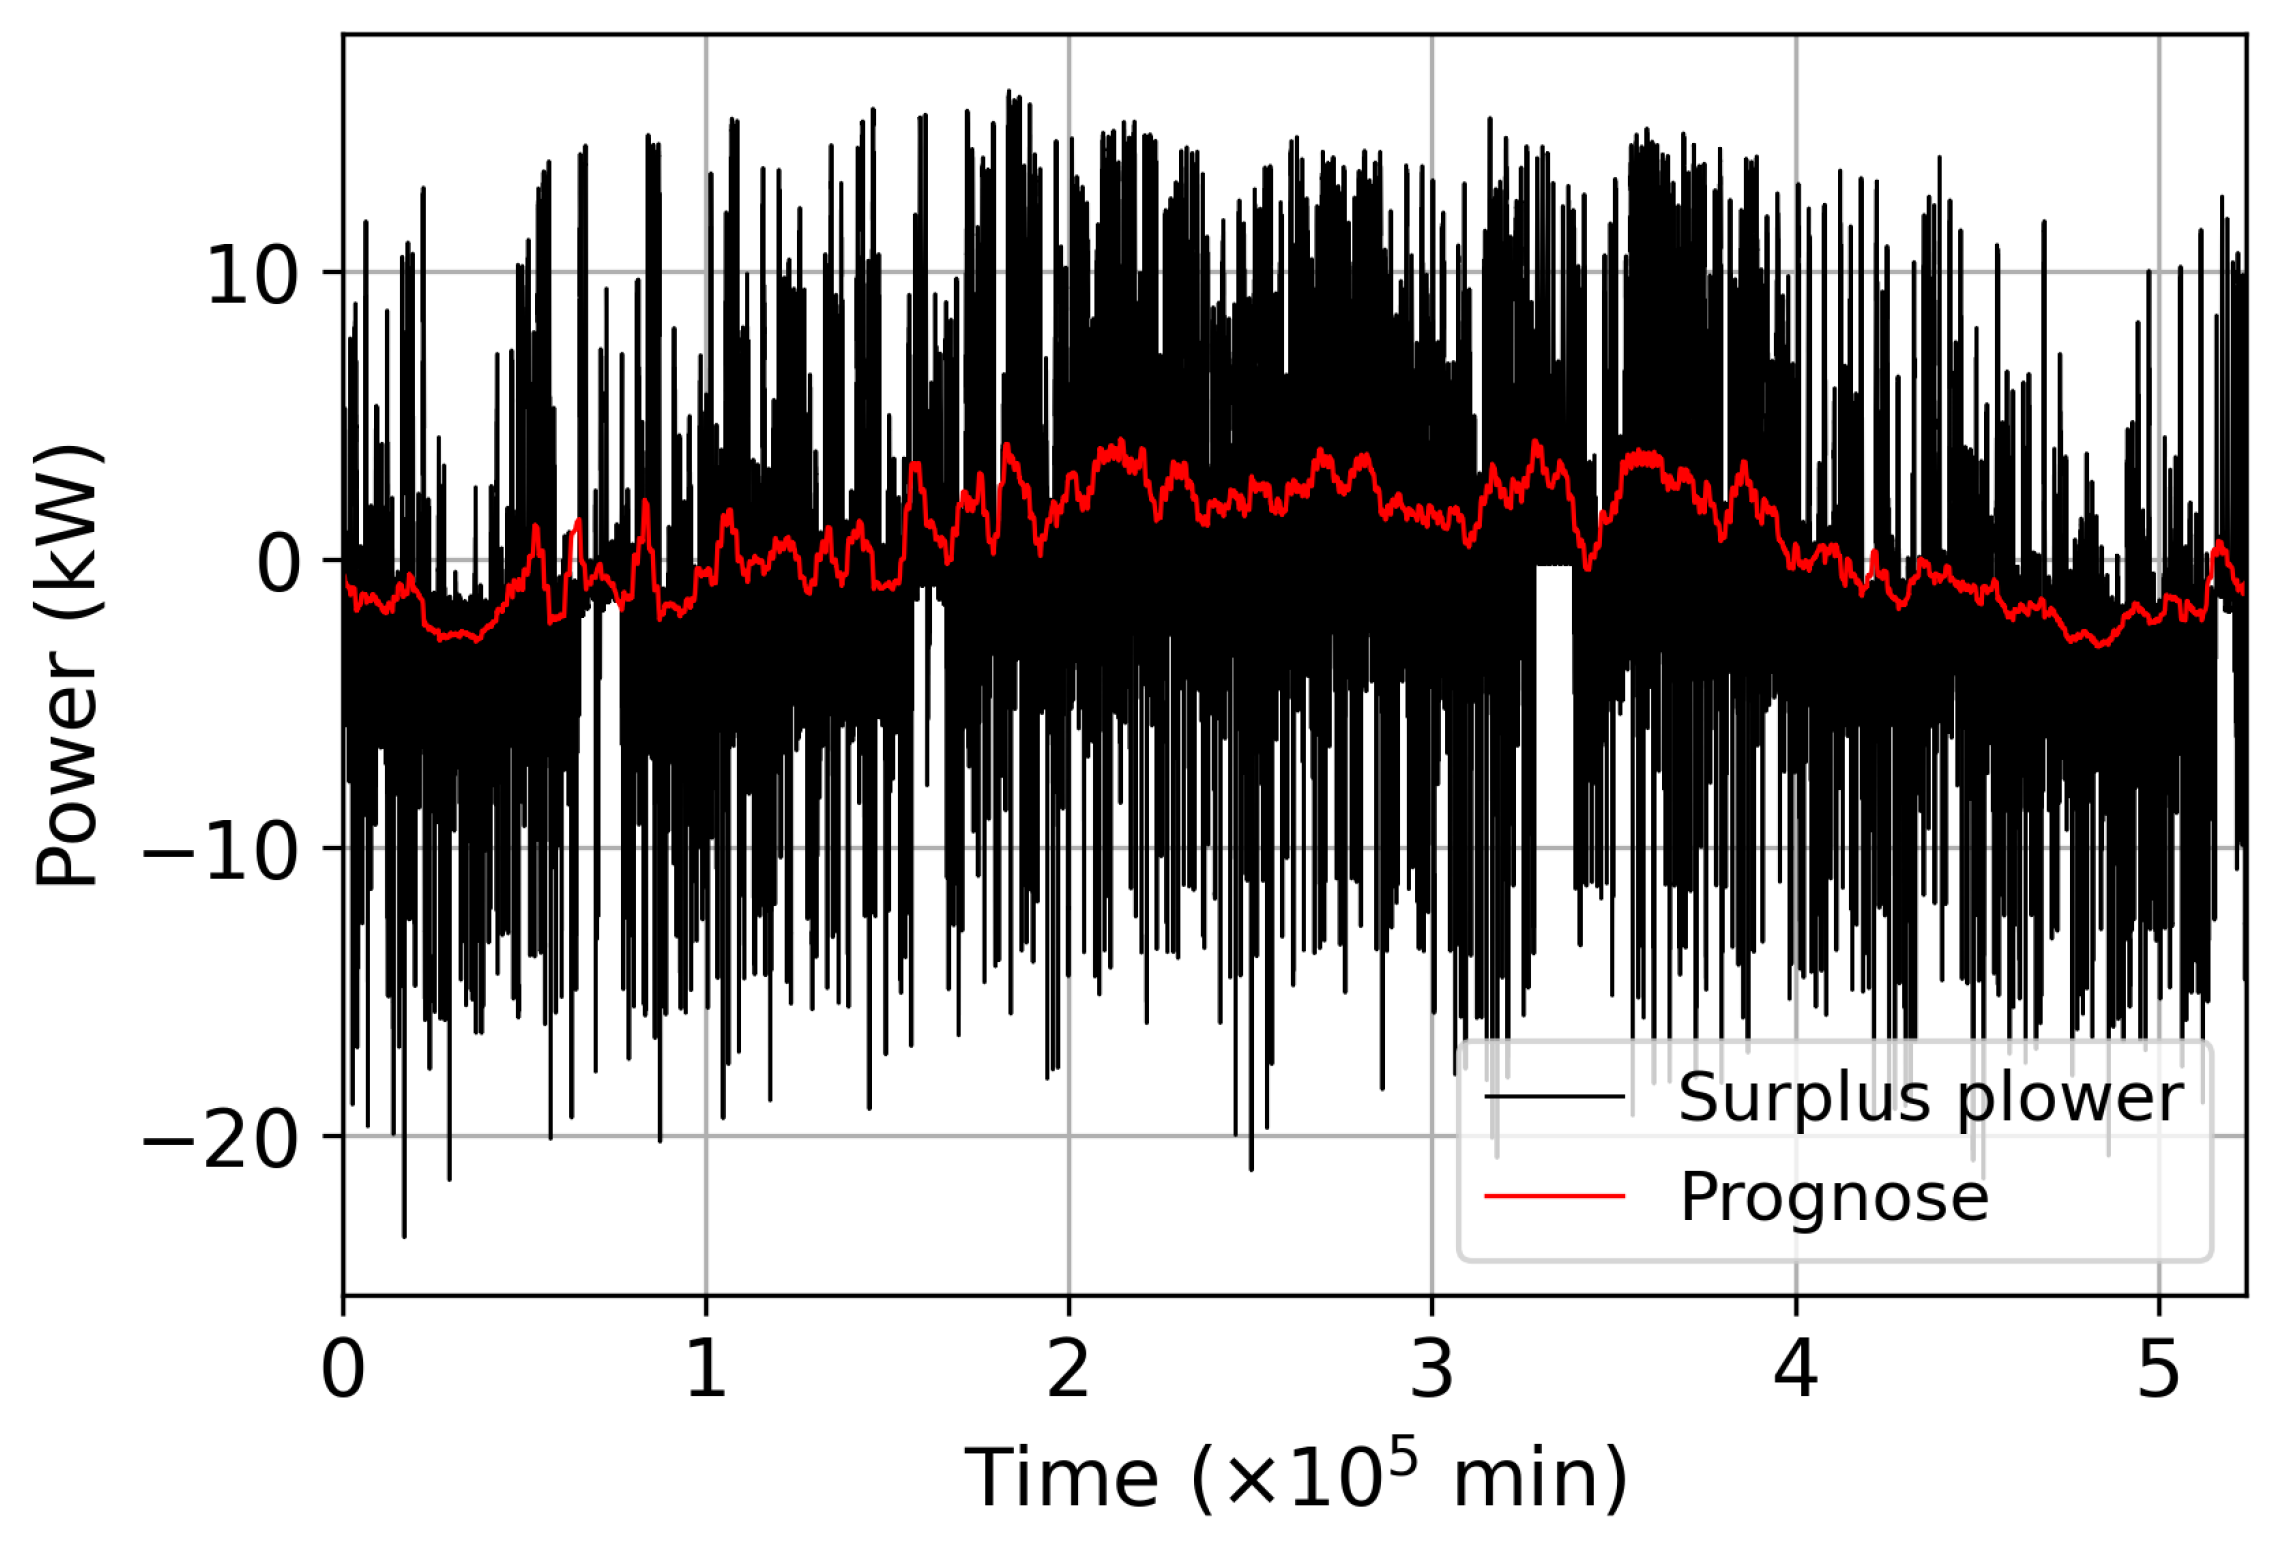
with being the PV profile and being the load profile. The forecast of the prospective power surplus output for each time step is derived from the arithmetic mean of the anticipated energy surplus over a predefined temporal window (), beginning at the current time instant:
The primary advantage of utilizing the forecast lies in its capacity to delineate seasonal variations more distinctly. Consequently, it is more appropriate as a criterion for the operational control of the electrolyser.
In Figure 8, the surplus power profile and the corresponding profile of the forecasted average surplus power are depicted. Based on the weather forecast available at each time step, the control algorithm can be adapted accordingly. For instance, if favourable weather conditions are predicted for the subsequent three days (i.e., the forecasted value exceeds a predefined threshold), the electrolyser can be operated for an extended period without sunshine using energy supplied by the battery, since the battery can be recharged on the following day. Conversely, operation of the electrolyser without sunshine (for example, during night time) is also advantageous because it increases the battery capacity available for storing solar energy on the next day.
Figure 8.
Comparison between and with a time window of 72 h.
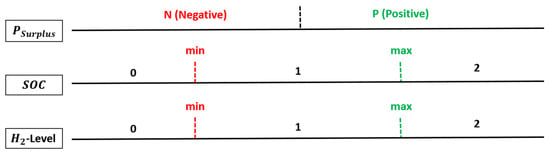
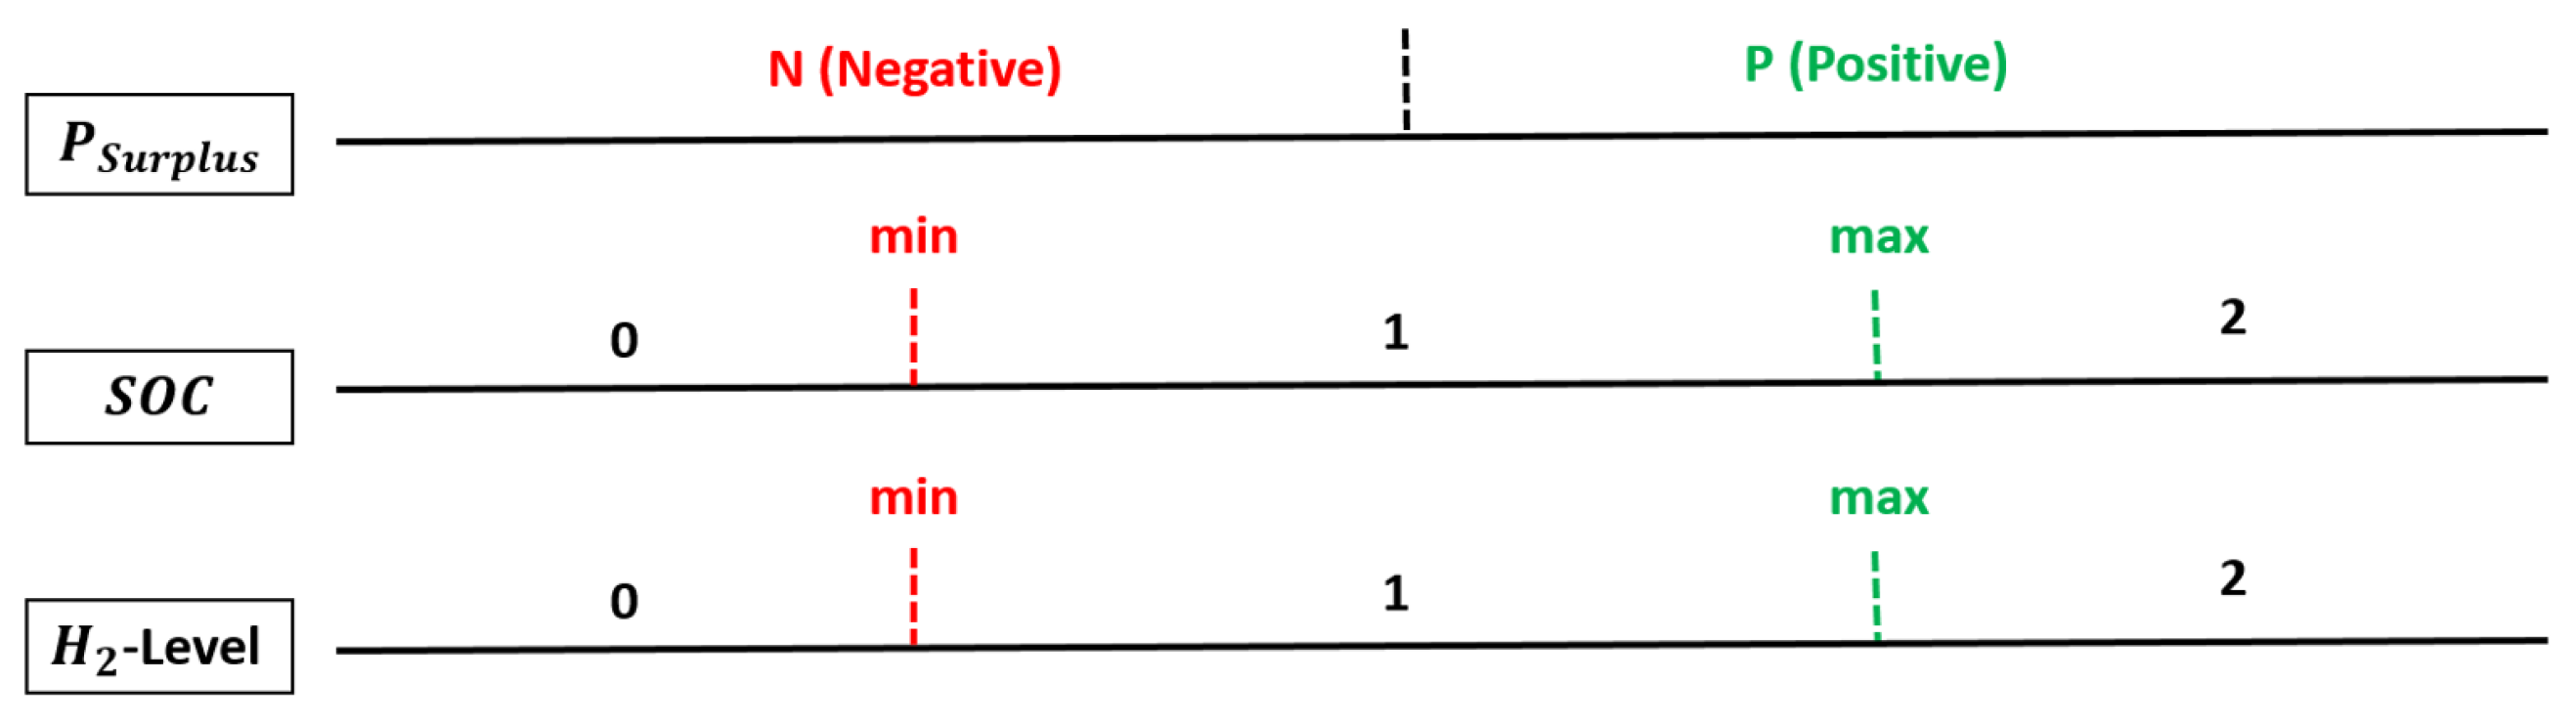
In addition to the aforementioned forecast value, further criteria such as the battery SOC and the hydrogen storage level are incorporated into the control strategy. For each digit combination shown in Figure 9, a corresponding decision is derived regarding how to allocate the energy surplus () or how to cover the energy deficit ().
Figure 9.
Three main criteria for control.
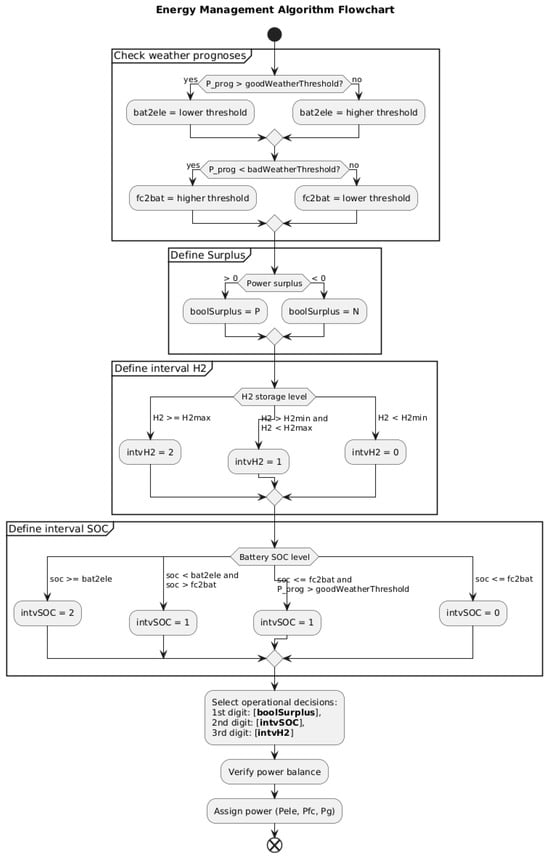
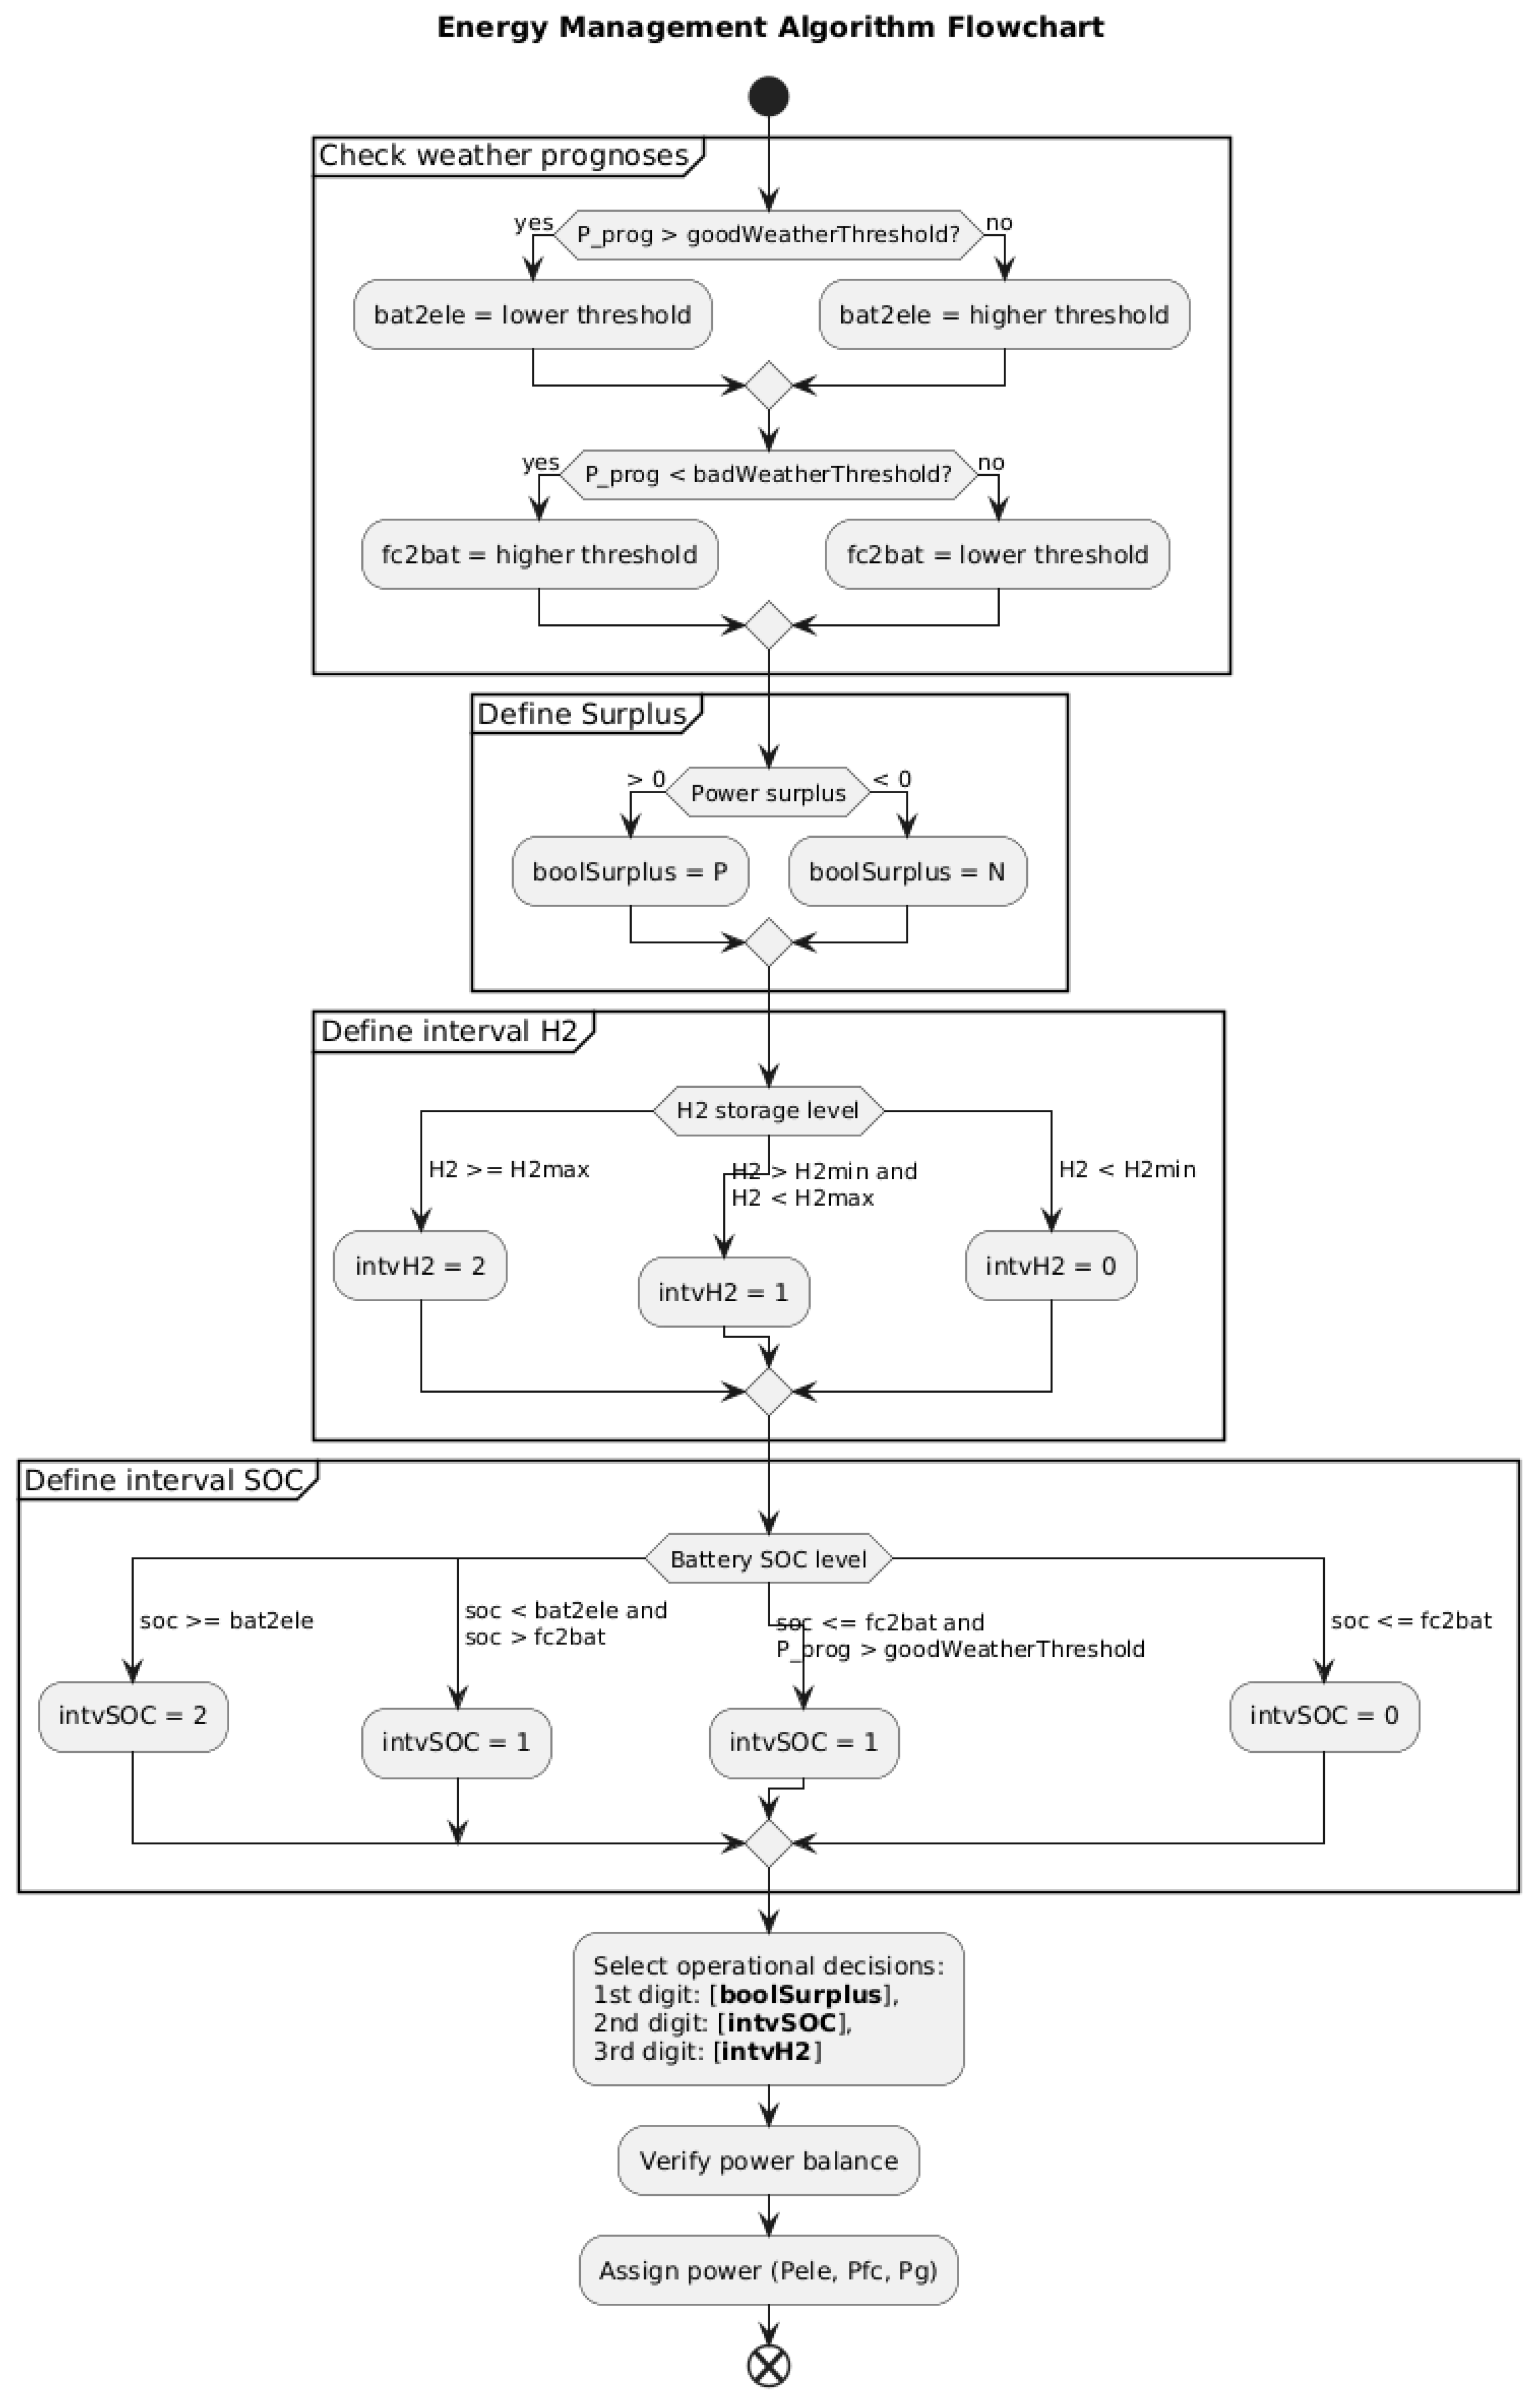
The process of retrieving the values of the digit is described in the algorithm flowchart in Figure 10. While , calculated from Equation (8), is not used as the primary decision variable, it directly influences the operation of both the electrolyser and the fuel cell.
Figure 10.
Flowchart of the algorithm used to determine the operational decision.
If exceeds the threshold, favourable weather conditions are expected in the coming days. Consequently, the threshold above which the battery is allowed to deliver energy to produce , defined as , is set to either or .
If falls below the threshold, unfavourable weather conditions are expected. The threshold under which the fuel cell is allowed to generate energy from the reservoir, defined as , is set to either or .
The electrolyser is deactivated when falls below the threshold . Conversely, the fuel cell cannot be used when exceeds . The associated operational decisions for each configuration are summarized as follows:
- Positive surplus conditions (P):
- -
- P00, P01, P10, P11: Charge battery from surplus. If excess, charge the electrolyser.
- -
- P02, P12: Charge battery from surplus. If excess, sell to the grid.
- -
- P20, P21: Drive electrolyser from surplus and battery. If excess, sell to the grid.
- -
- P22: Sell surplus to the grid.
- Negative surplus conditions (N):
- -
- N00: Buy from the grid.
- -
- N01, N02: Cover deficit from fuel cell. If insufficient, buy from the grid.
- -
- N10, N20: Discharge battery. If insufficient, buy from the grid.
- -
- N11, N12, N21, N22: Discharge battery. If insufficient, cover from fuel cell.
3. Application of the EM Model to Concrete Scenarios
3.1. Component Properties from a Global Systems Perspective
3.1.1. Degree of Self-Sufficiency
The degree of self-sufficiency characterizes the extent to which the energy system operates independently of the public power grid. A self-sufficiency level of 100 Prozent indicates that no electrical energy is imported from the public grid; in this case, the PV yields during the summer fully cover the annual electrical energy demand. Conversely, a self-sufficiency level of 0 Prozent represents complete dependence on the public power grid, corresponding to the absence of a PV system.
Within the framework of the hybrid energy storage concept, it is assumed that the PV system alone can satisfy the electrical energy demand during the summer months. The decisive question is therefore whether the winter energy demand can be met by the hydrogen produced in summer, which is subsequently reconverted into electricity via a fuel cell:
Here, denotes the efficiency of the electrolyser, while represents the efficiency of the fuel cell. A value of indicates that the quantity of hydrogen generated over the summer period is exactly sufficient to meet the electrical energy demand during the subsequent winter. For , the hydrogen produced (and subsequently converted into electricity via the fuel cell) yields a surplus of electrical energy in winter relative to the demand. Conversely, for , the hydrogen-based electricity is insufficient to fully cover the winter demand, and additional electrical energy must be supplied from the public power grid.
3.1.2. Maximum Hydrogen Quantity and Storage Capacity
Depending on the output of the PV system and the load profile, a maximum amount of hydrogen can be expected if the energy surplus in summer is used exclusively for hydrogen production, i.e., no electricity is sold. This maximum expected amount of therefore has nothing to do with the capacity of the electrolyser.
with denoting the lower heating value of hydrogen. In this context, an optimal operating point of the electrolyser is expected, as the total available surplus energy constrains the achievable hydrogen production. Based on the maximum anticipated hydrogen yield, the required maximum storage capacity can likewise be determined.
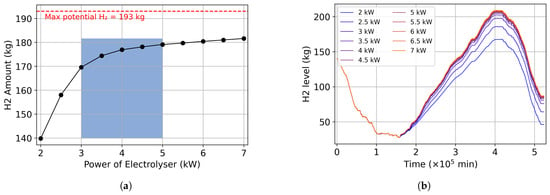
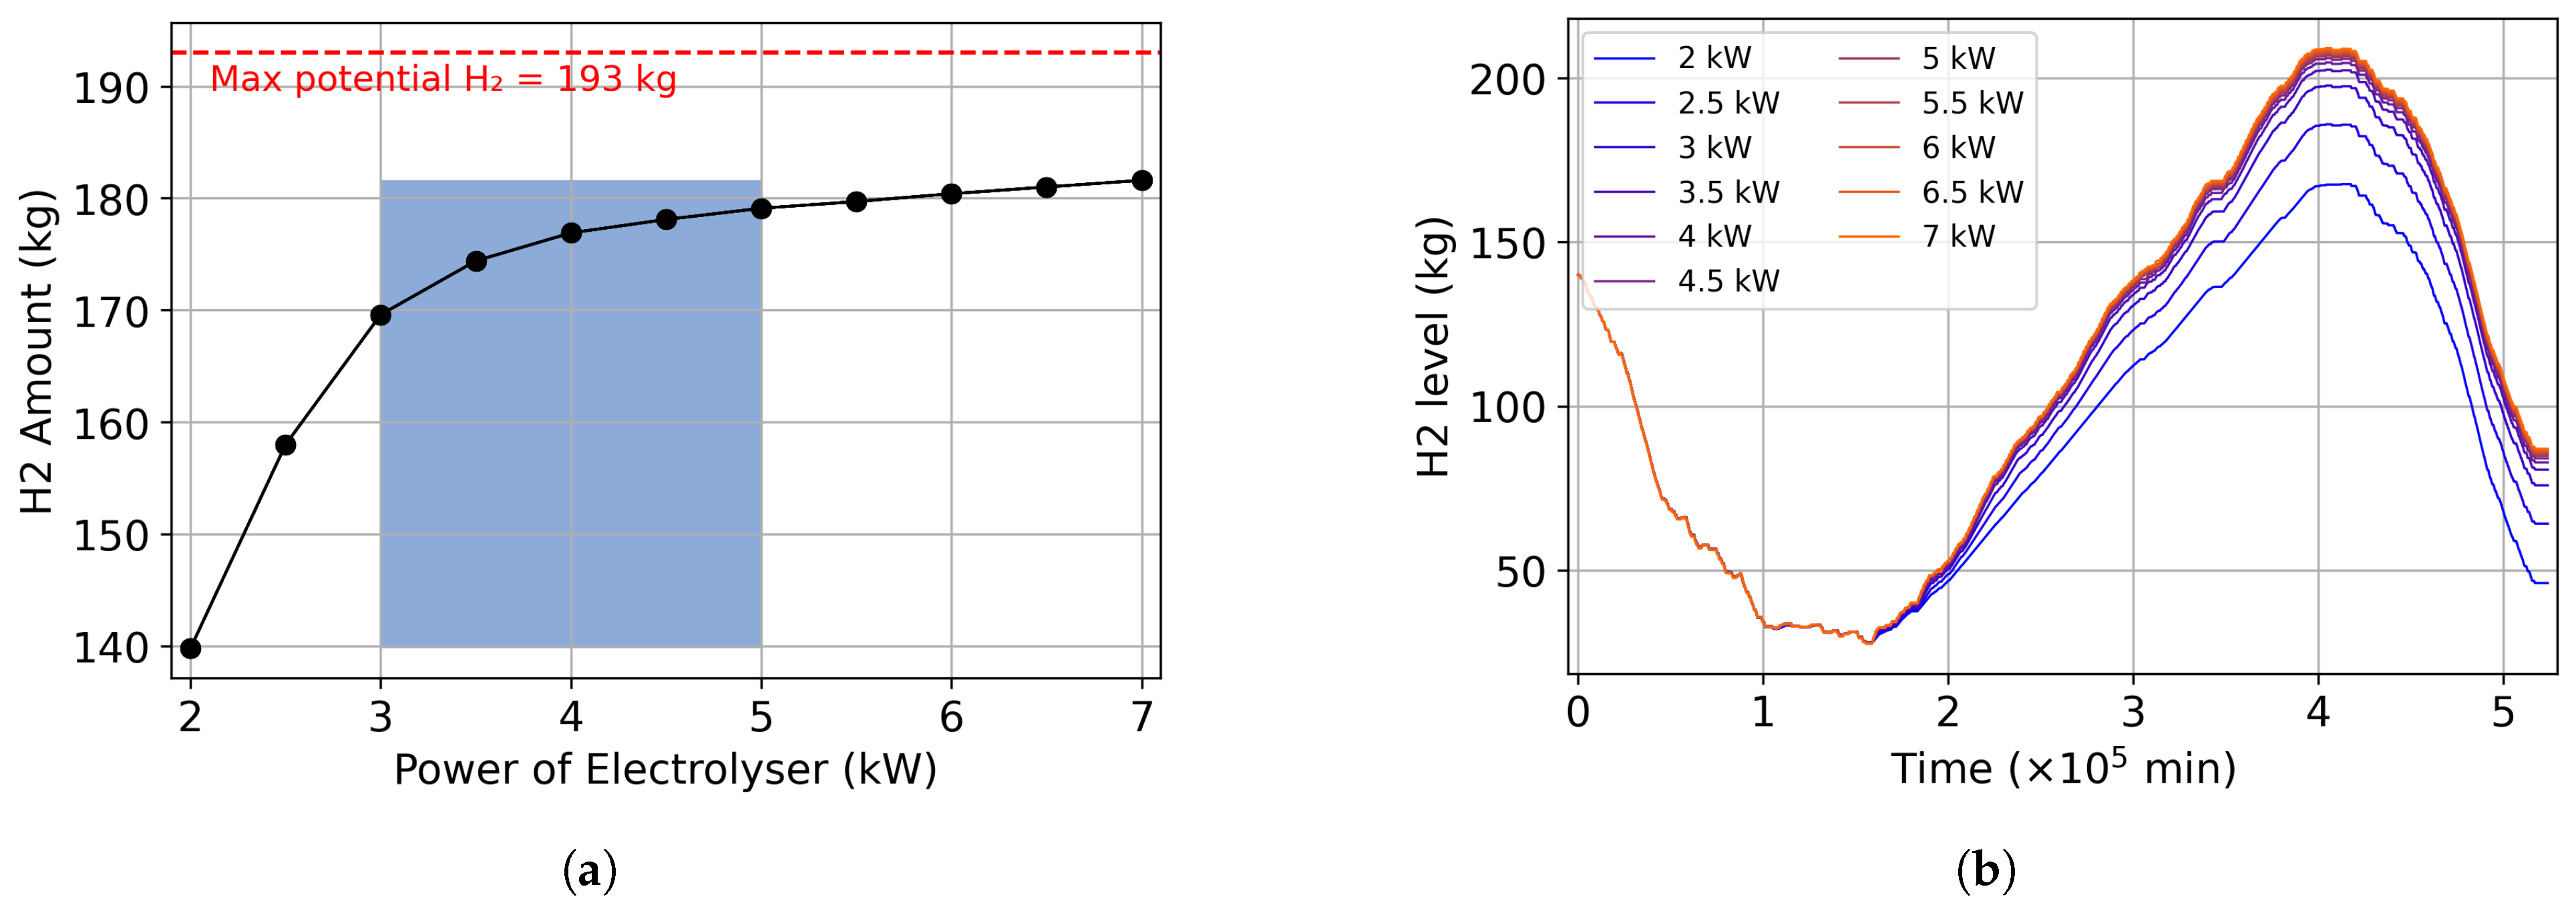
In Figure 11a, the relationship between electrolyser power and the resulting hydrogen yield is illustrated using exemplary solar generation and load profiles. If the electrolyser power is undersized, the surplus energy available over the summer period cannot be fully converted into hydrogen. In contrast to an undersized electrolyser, designing an oversized electrolyser only leads to a marginal increase in the amount of hydrogen produced. Based on a design study conducted by the author as part of the project, it was found that an electrical power per unit in the range of 3 to 5 kW is particularly advantageous in terms of production costs and device size. Figure 11b also shows, using the profiles of the accumulated hydrogen quantity for different electrolyser power ratings, that the influence of the electrolyser becomes negligible once a certain power limit is exceeded. By representing the quantity of hydrogen accumulated in the storage tank, the principal objective of this study—namely, the seasonal shifting of surplus energy from the summer months to the winter period—can be quantitatively demonstrated. During the summer months, the hydrogen produced is continuously stored in the tank until the maximum storage capacity is reached. At the onset of the winter period, the stored hydrogen is then supplied to the PEM fuel cell, where it is converted into electrical energy.
Figure 11.
(a) Quantification of hydrogen production as a function of electrolyser power, derived from the 2023 year profiles of PV generation and electrical load. (b) Comparison of the hydrogen production through the year 2023 between various electrolyser power sources.
3.1.3. Criteria for Selecting Battery Capacity and Fuel Cell Power
When determining the battery capacity, a quasi-optimal value must be selected. An undersized battery undergoes excessively rapid charge–discharge cycles. If the surplus PV power exceeds the maximum electrolyser power while the battery is fully charged (maximum SOC), the excess power must be curtailed or exported to the grid. With a larger battery capacity, this surplus could instead be converted into hydrogen via the electrolyser. Conversely, excessively fast battery discharge leads to a shutdown of the electrolyser; this is because a lower SOC limit is predefined, below which the battery no longer supplies power to the electrolyser. If the battery capacity is oversized, the SOC operates within only a narrow band, resulting in an underutilization of the installed battery capacity. In the ideal case, the battery discharges overnight down to a specified lower SOC threshold and is then recharged during the subsequent day to a level close to its upper SOC limit, thereby maximizing the effective utilization of the available capacity.
The operational strategy of the fuel cell is primarily governed by two parameters: the programmed set-point power and the battery SOC. The nominal power of the fuel cell should be dimensioned to approximately cover the average electrical demand during winter. Short-term peak power demands are then met by the battery, which provides the additional power beyond the fuel cell’s rated output. After such transient high-load events, the battery SOC is restored to a predefined level as soon as the temporary power peak has subsided.
3.2. Generation of Realistic Solar and Load Profiles
3.2.1. Generation of Solar Profiles
For the derivation of the solar resource profile, the Photovoltaic Geographical Information System (PVGIS) tool, established by the European Commission’s Joint Research Center [47], is employed. PVGIS is an online database and computational tool that offers open-access solar climatology data and simulation capabilities. It supports the technical and economic planning of PV installations by supplying information on different factors, such as the following:
- Global radiation: This quantity represents the total incident solar irradiance on a specified surface area (e.g., the plane of a PV module). It comprises three components: direct (beam) radiation, diffuse radiation resulting from atmospheric scattering, and ground-reflected radiation (albedo). Overall, it indicates the total amount of solar energy available at that location, regardless of the presence or configuration of a solar energy conversion system.
- PV output: This quantity represents the net electrical energy output generated by the PV system. It is determined as a function of the geographic coordinates (latitude and longitude), as well as the azimuthal orientation and inclination (tilt angle) of the PV module.
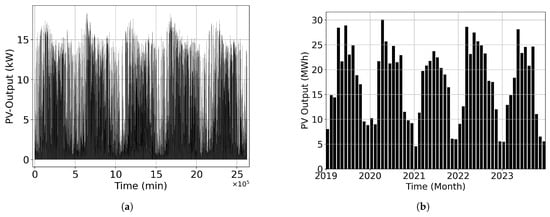
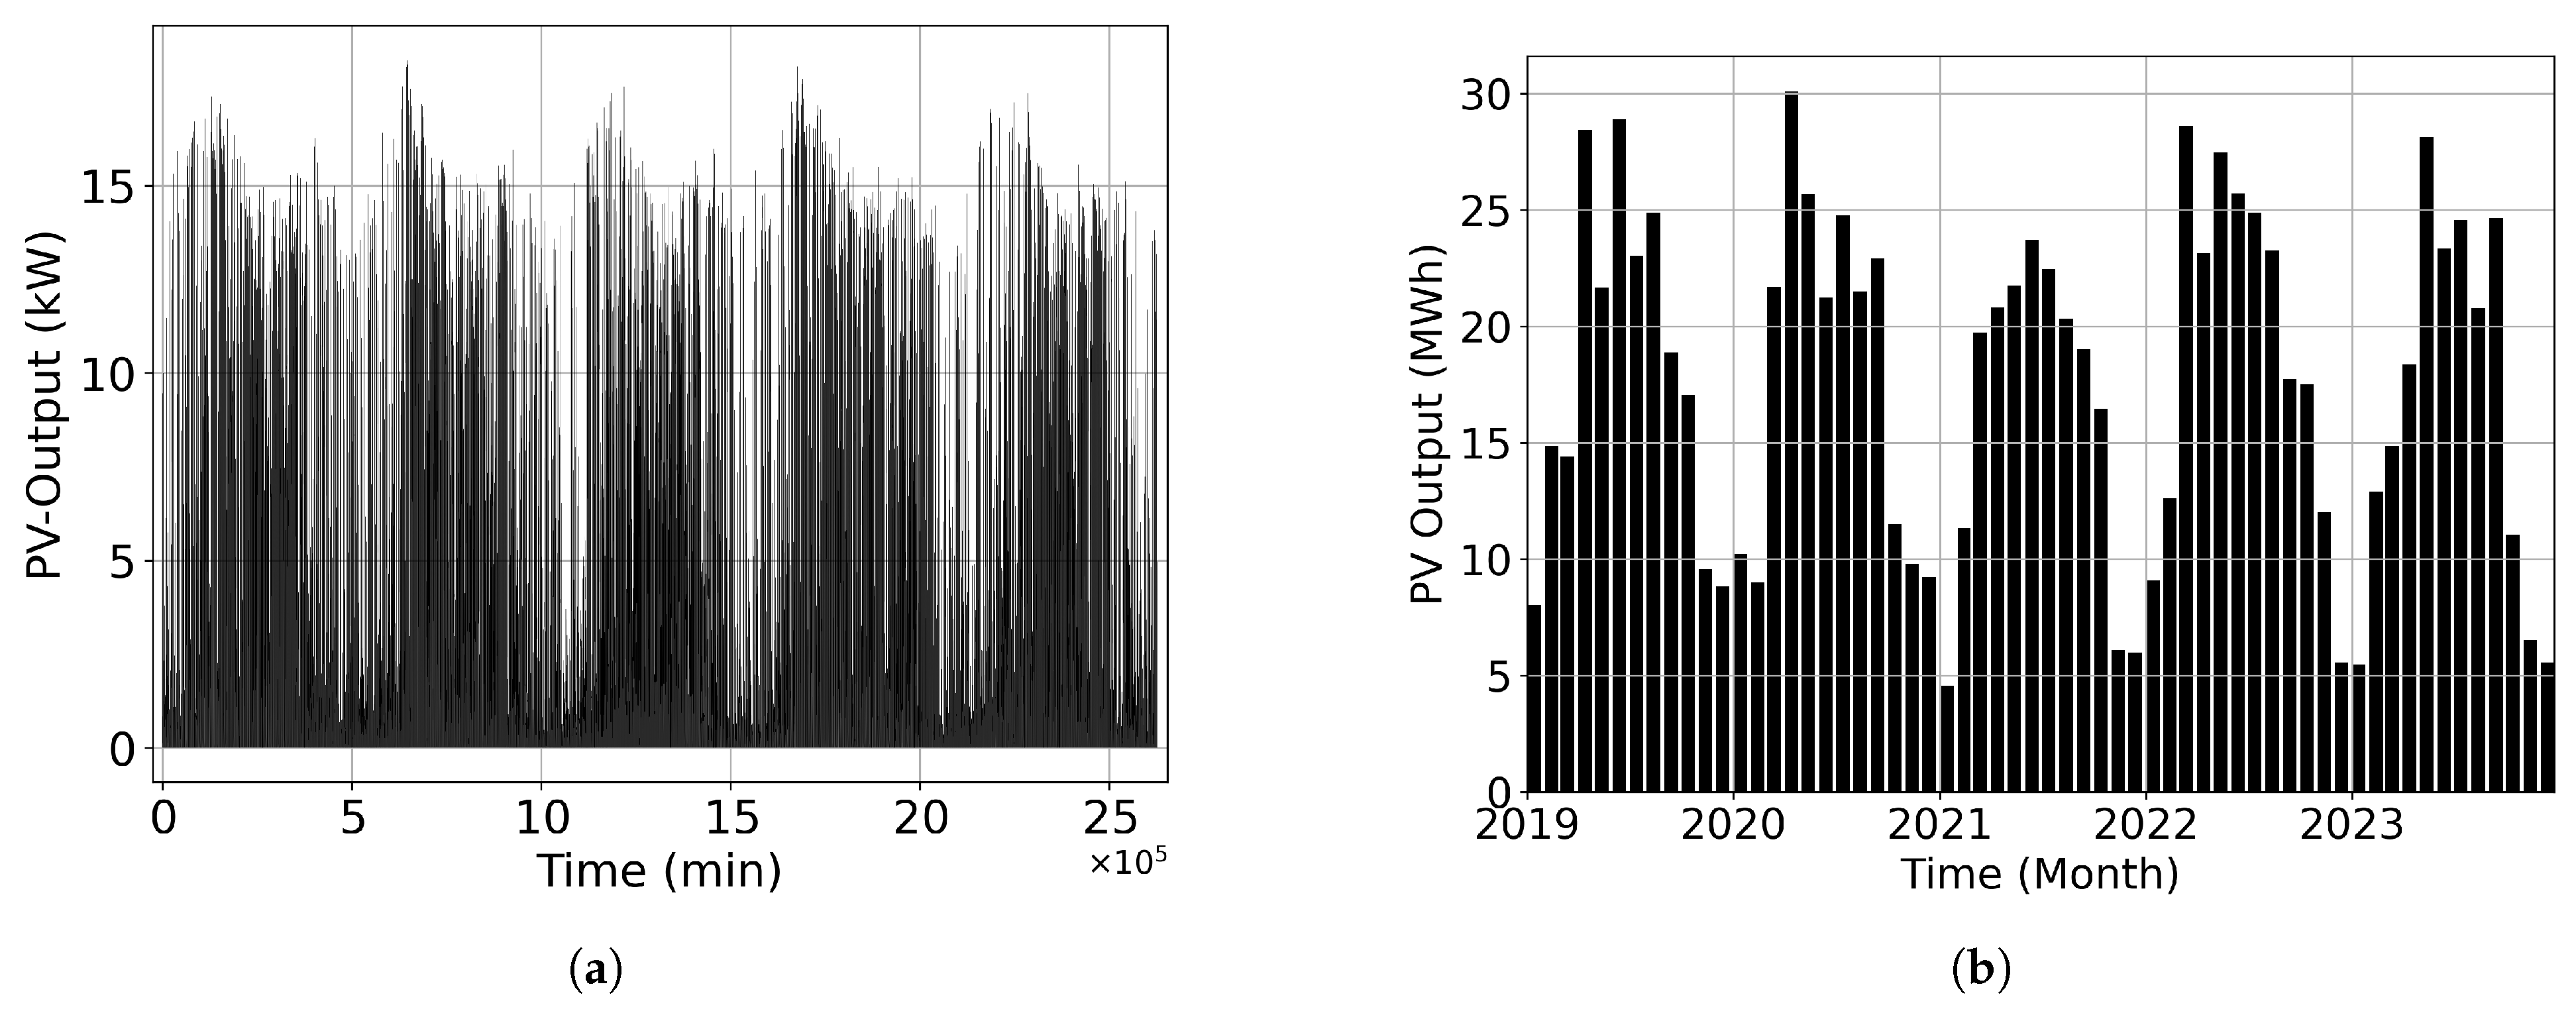
Via an API interface, the geospatial coordinates (longitude and latitude), temporal window, array orientation, tilt angle, nominal module capacity (kWp), and system loss factors are specified in order to retrieve hourly output data from PV output. Global irradiance is not considered at this stage because, as outlined above, it does not directly represent the final solar energy yield. As an illustrative example, Figure 12a depicts the PV output time series for Cottbus (51.7563, 14.3326) over the period 2019–2023 for a PV installation with a rated peak power of 20 kW.
Figure 12.
(a) PV output profile of Cottbus between 2019 and 2023 with power peak of 20 kWh. (b) Monthly distribution of the solar energy of the profile.
Because the solar power peak can only be reached with the best condition (best orientation, optimal temperatures, losses, etc.), a 20 kWp PV module will deliver less than 20 kW of power. With good weather conditions, an power output of over 17 kW was observed. Looking at the envelope curve of the profile, the time of year can be noted. The profile has a minute resolution by interpolating the hourly PVGIS output. The starting point (0 in the X-axis) is 00:01 on 1 January 2019. For comparison and to check the accuracy, the monthly distribution of solar yields is also shown in Figure 12b shows the monthly distribution of solar yields. The solar yields in the winter months are significantly lower than those in the summer months.
3.2.2. Generation of Load Profiles
Load profiles were generated using the LoadProfileGenerator application, a simulation tool developed at the Technical University of Chemnitz [48]. This software employs a desire-driven simulation framework to model resident behaviour in detail. By aggregating the energy consumption of individual appliances at each time step, it produces high-resolution load profiles.
The tool allows for the specification of diverse household types and enables the generation of annual load curves. In this work, load profiles were created by adapting predefined configurations available within the application. The following parameters were modified: type of heating system, household composition, working hours, vacation periods, number of electric vehicles, and charging station power rating. The usage patterns and operational schedules of household appliances were automatically determined by the tool.
To ensure a degree of realism, a real household case study was selected and combined with the LoadProfileGenerator to produce a one-year dataset with a temporal resolution of one minute. The characteristics of the selected household case are as follows:
Example Case: Family Comprising Two Adults and Three Children, with One Car
- Temperature data: Cottbus weather data, covering the period from 1 January 2023 to 31 December 2023.
- Occupants activities: Full time job 8 h/day away from home. Children go to school.
- Electrical vehicle: One car with a 22 kWh battery; 11 kW charging dock at home.
- Heating demand: Annual heat energy consumption of 25,000 kWh.
- Heating system: Heat pump with a coefficient of performance (COP) of 3.
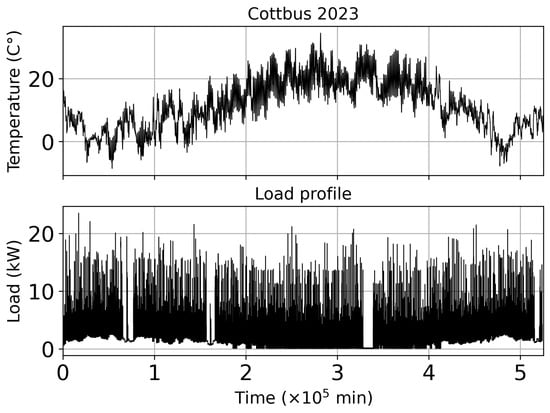
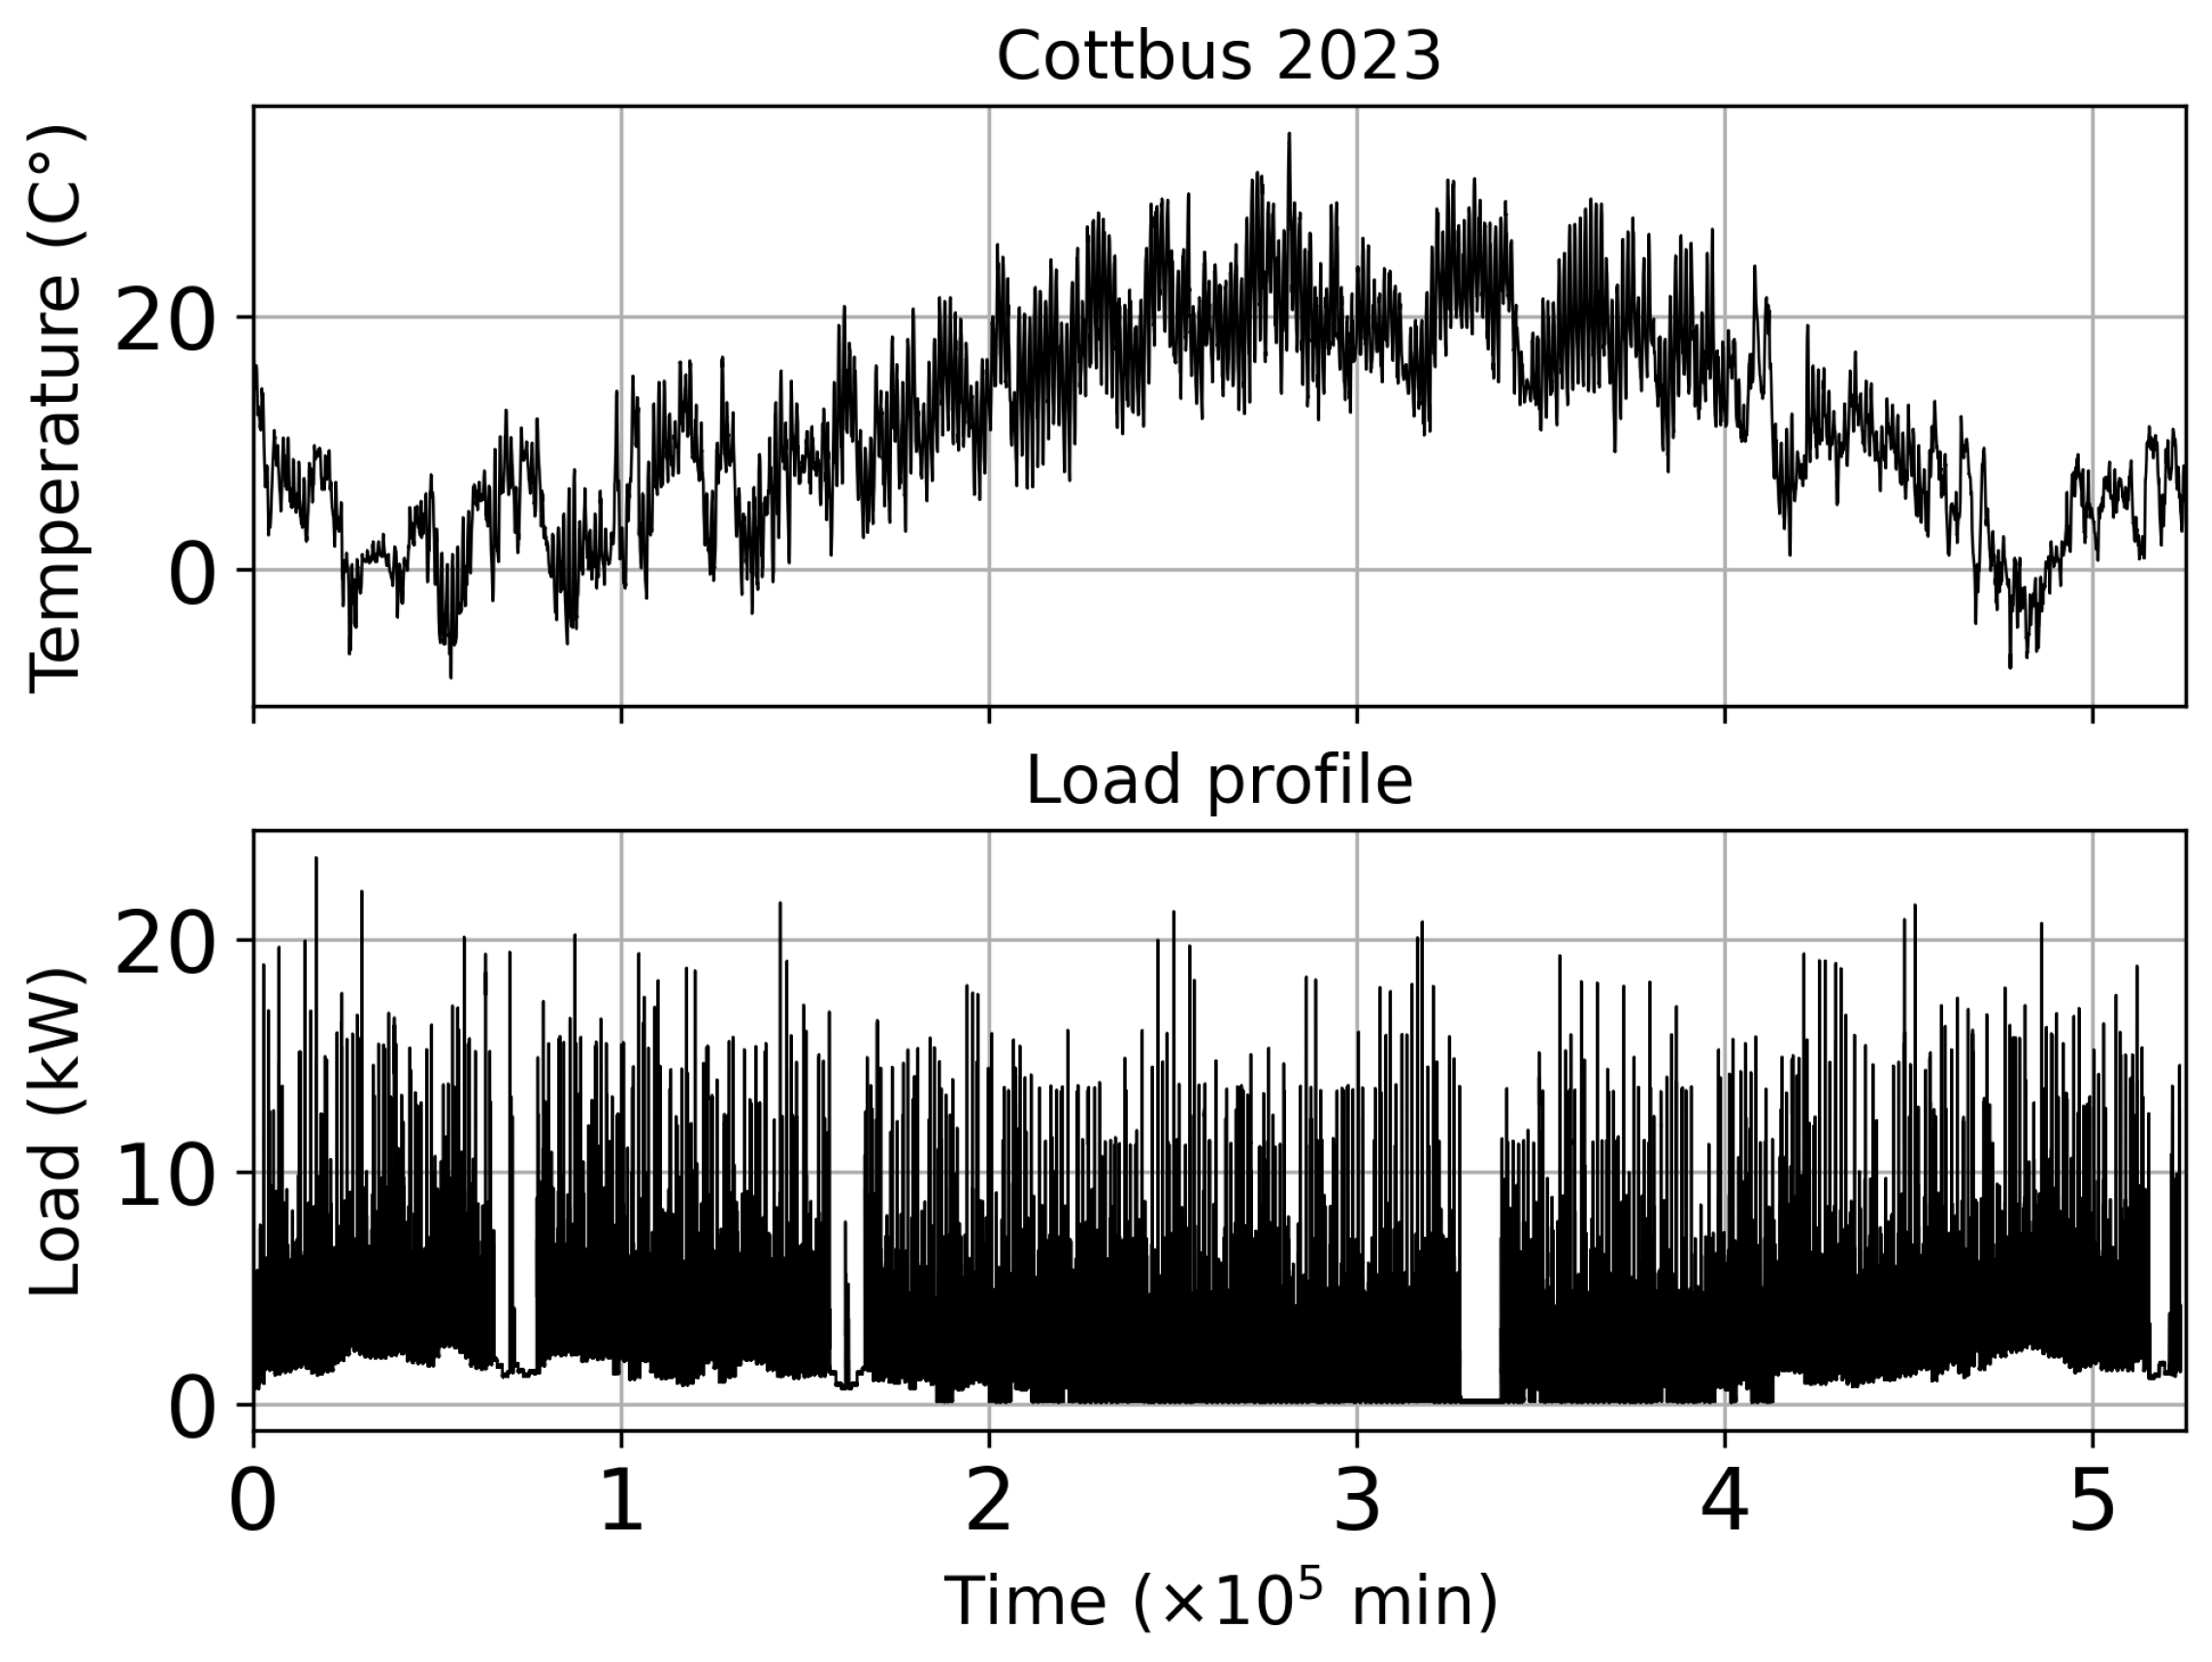
This simulation tool uses a desire-driven algorithm to model the behaviour of the residents in detail. The simulation will determine when and for how long the occupants of the home will use household devices. It determines both the timing and duration of the use of household appliances based on the modelled occupant activities. The heating system is regulated based on the outside temperatures of Cottbus in the year 2023. The model distributes a given total energy consumption over the year according to the outdoor temperatures and the temperature threshold defined for the heating system. It does not calculate the energy consumption of the building itself. The frequency of charging of electric vehicles is related to the travel distance planned by the simulation, which mainly involves trips of 15 km from home to the workplace, with an average speed of 30 km/h. Figure 13 shows the profile of the power consumption and the profile of the local temperature of Cottbus in 2023. Due to the heat pump power, which depends on the outside temperature, more electrical power is required in winter than in summer. Figure 14b shows the specific power consumption of the heat pump during the year.
Figure 13.
Outside temperature of Cottbus 2023 and load profile of the example case.
Figure 14.
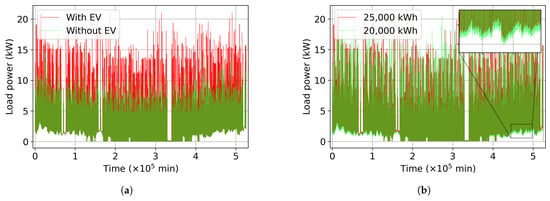
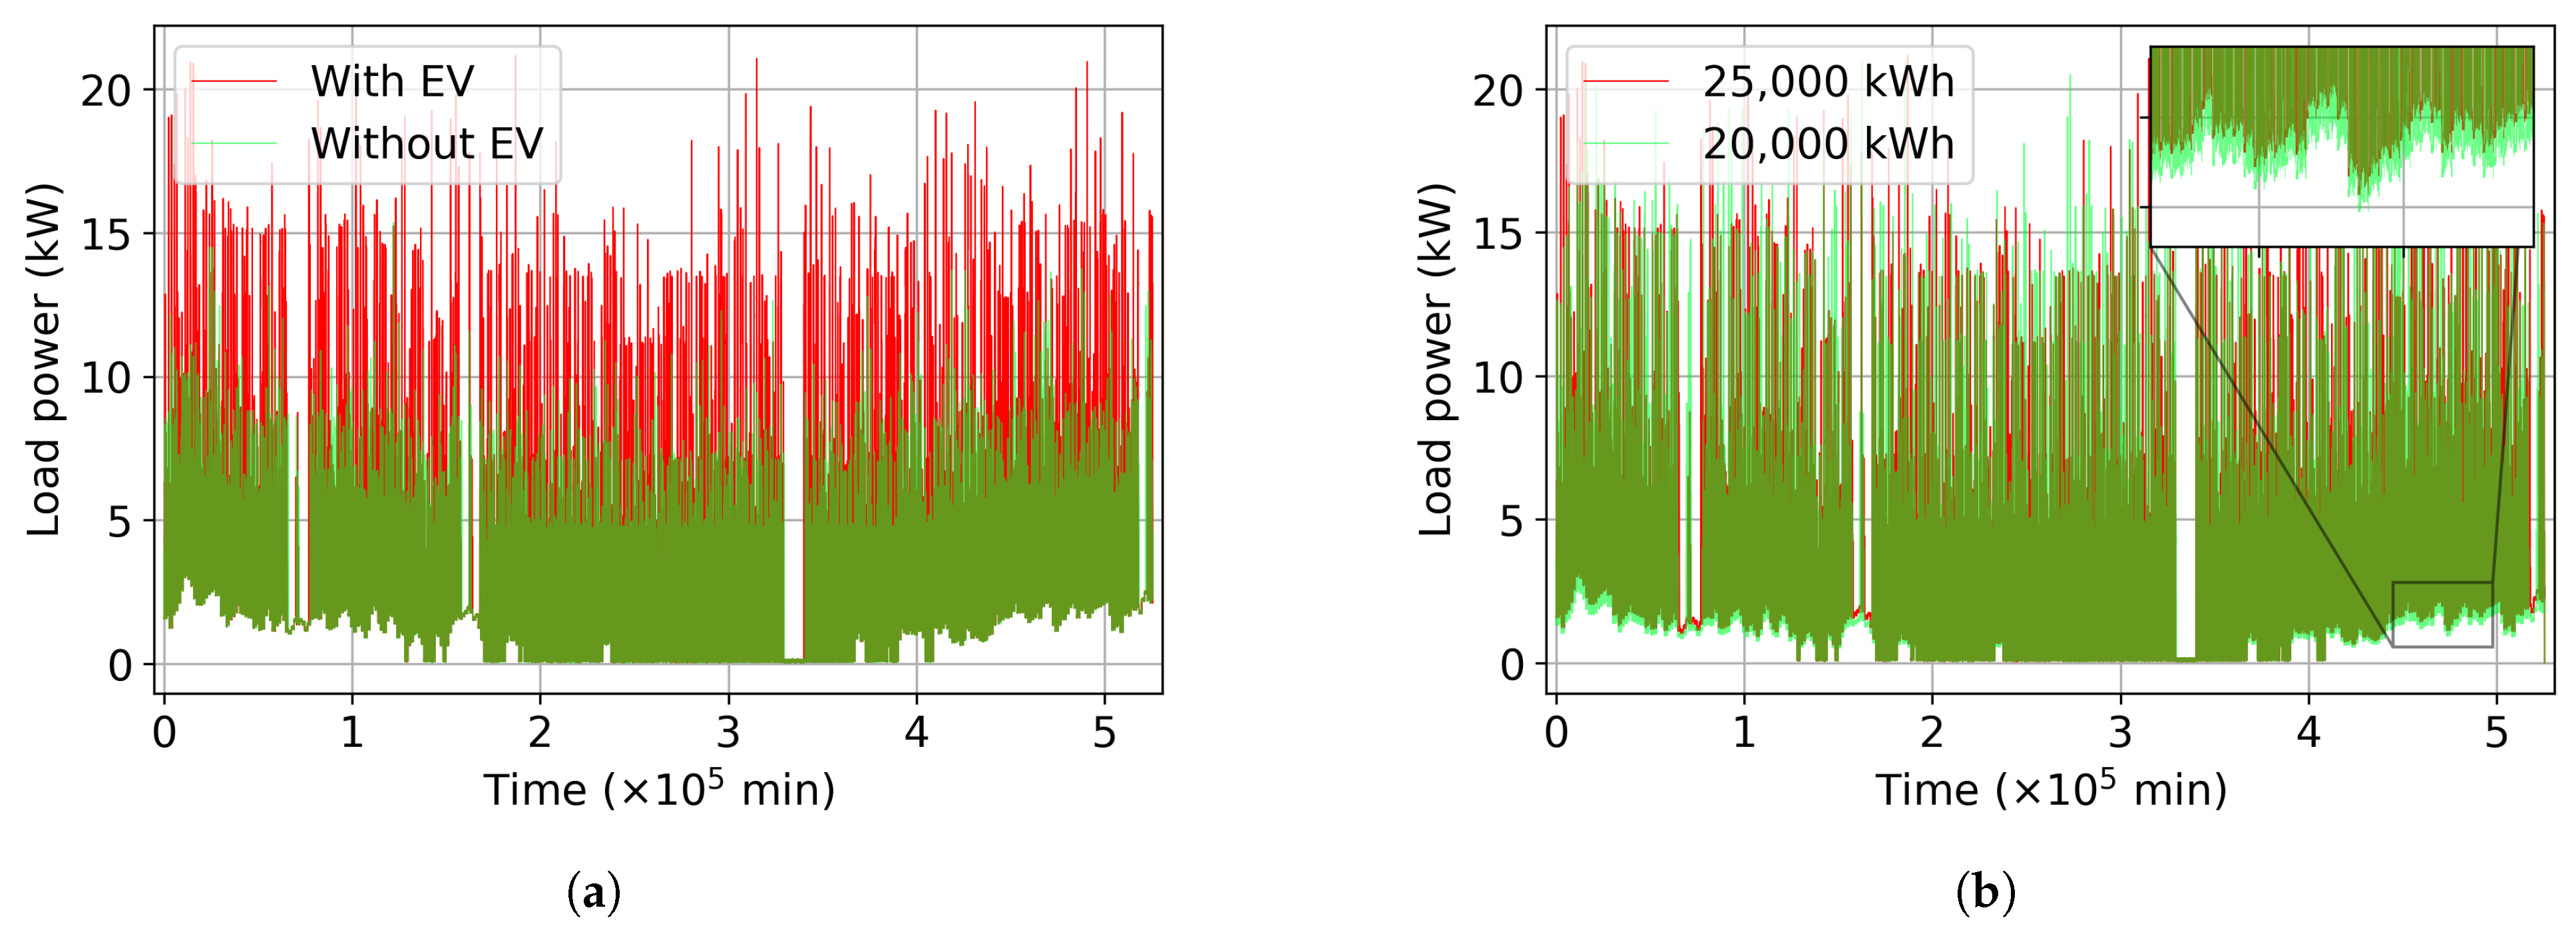
(a) Load profile with EV and without EV. (b) Yearly heat demand: 25,000 kWh vs. 20,000 kWh. The zoomed-in part shows the power difference of the heat pump between the profiles (light green).
3.3. Variation of the Load Profile and Influence on Results
For the case study conducted in this work, two different scenarios are considered. The first scenario relates to the availability of an electric vehicle. The electric vehicle under investigation has an average annual mileage of 11,250 km with an average energy consumption of 20 kWh per 100 km. Two representative electrical load profiles—with and without an electric vehicle—are juxtaposed in Figure 14a. The impact of the electric vehicle on the load profile is particularly evident from the additional power peaks. The second scenario comprises a comparison between buildings with good and poor thermal insulation. In the case of inadequate thermal insulation, the heat pump must provide a higher heating output to maintain a specified indoor temperature than in the case of good insulation. This directly leads to the fact that the energy demand of the heat pump in poorly insulated buildings can in some cases be considerably higher. For the following case study, an annual heat demand of approximately 25,000 kWh is therefore assumed for the poorly insulated building and 20,000 kWh for the well-insulated building. The annual heat demands are coupled with the model parameters presented in Table 1. The total amount of heat provided is covered both by the heat pump and by the fuel cell in the form of waste heat. According to the system modelling, the waste heat from the fuel cell accounts for about 11 percent of the total heat demand. This corresponds to roughly 2750 kWh for the poorly insulated building and 2200 kWh for the well-insulated building. The remaining 89 percent of the heat demand is supplied by the heat pump. Assuming an average coefficient of performance (COP) of 3, this results in an electricity demand of 7417 kWh for the poorly insulated building and 5933 kWh for the well-insulated building. A comparison of the corresponding electrical load profiles is shown in Figure 14b. The light green envelope in the figure, which is subject to seasonal variation, represents the difference in power output of the heat pump.
Table 1.
First assumption of component properties.
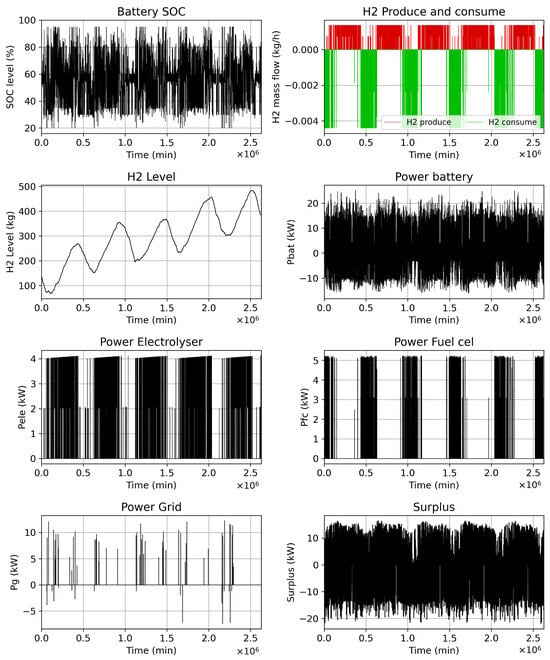
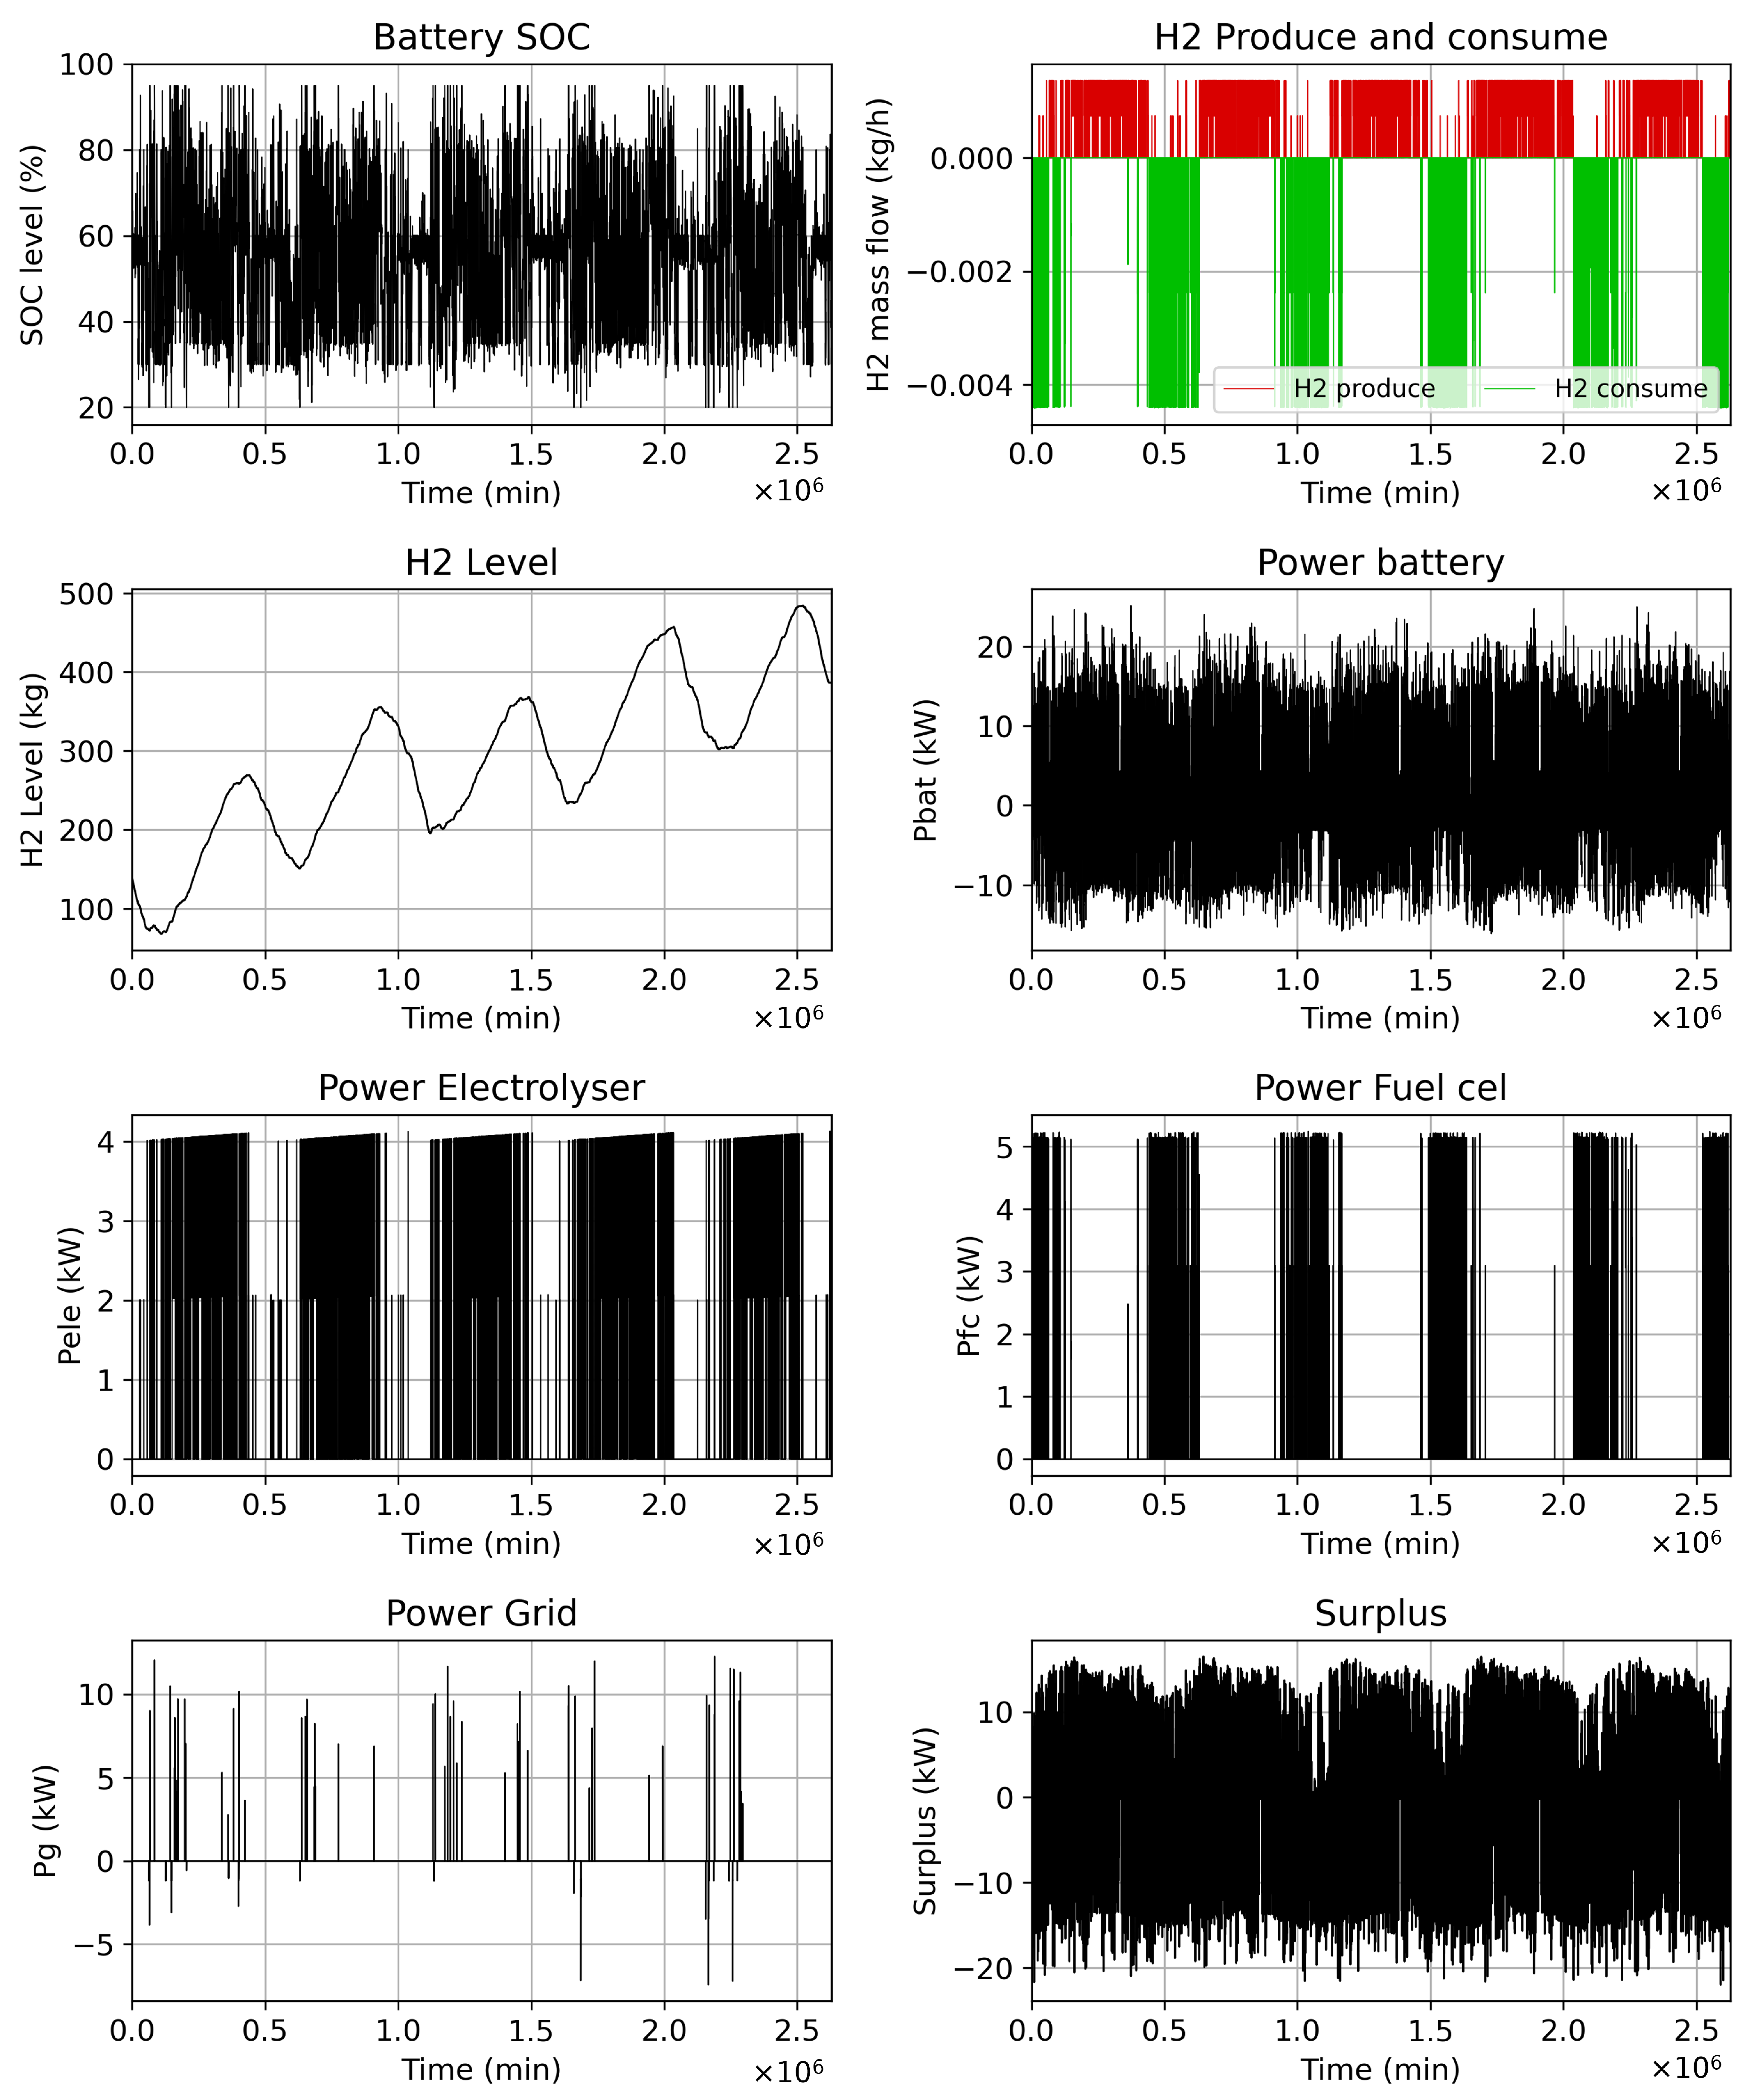
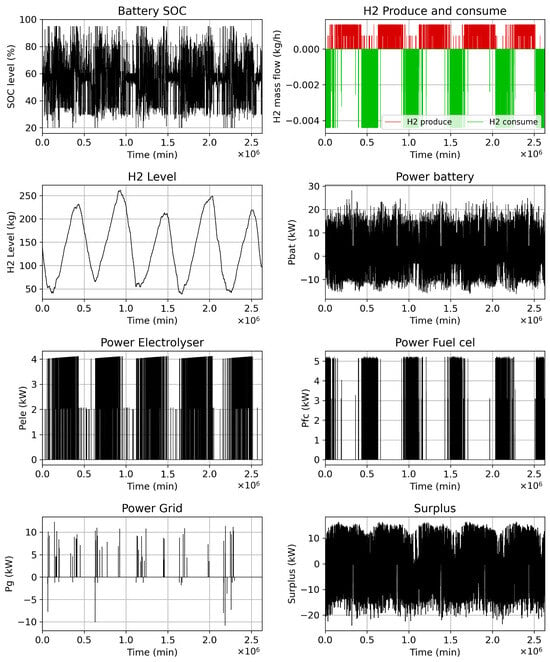
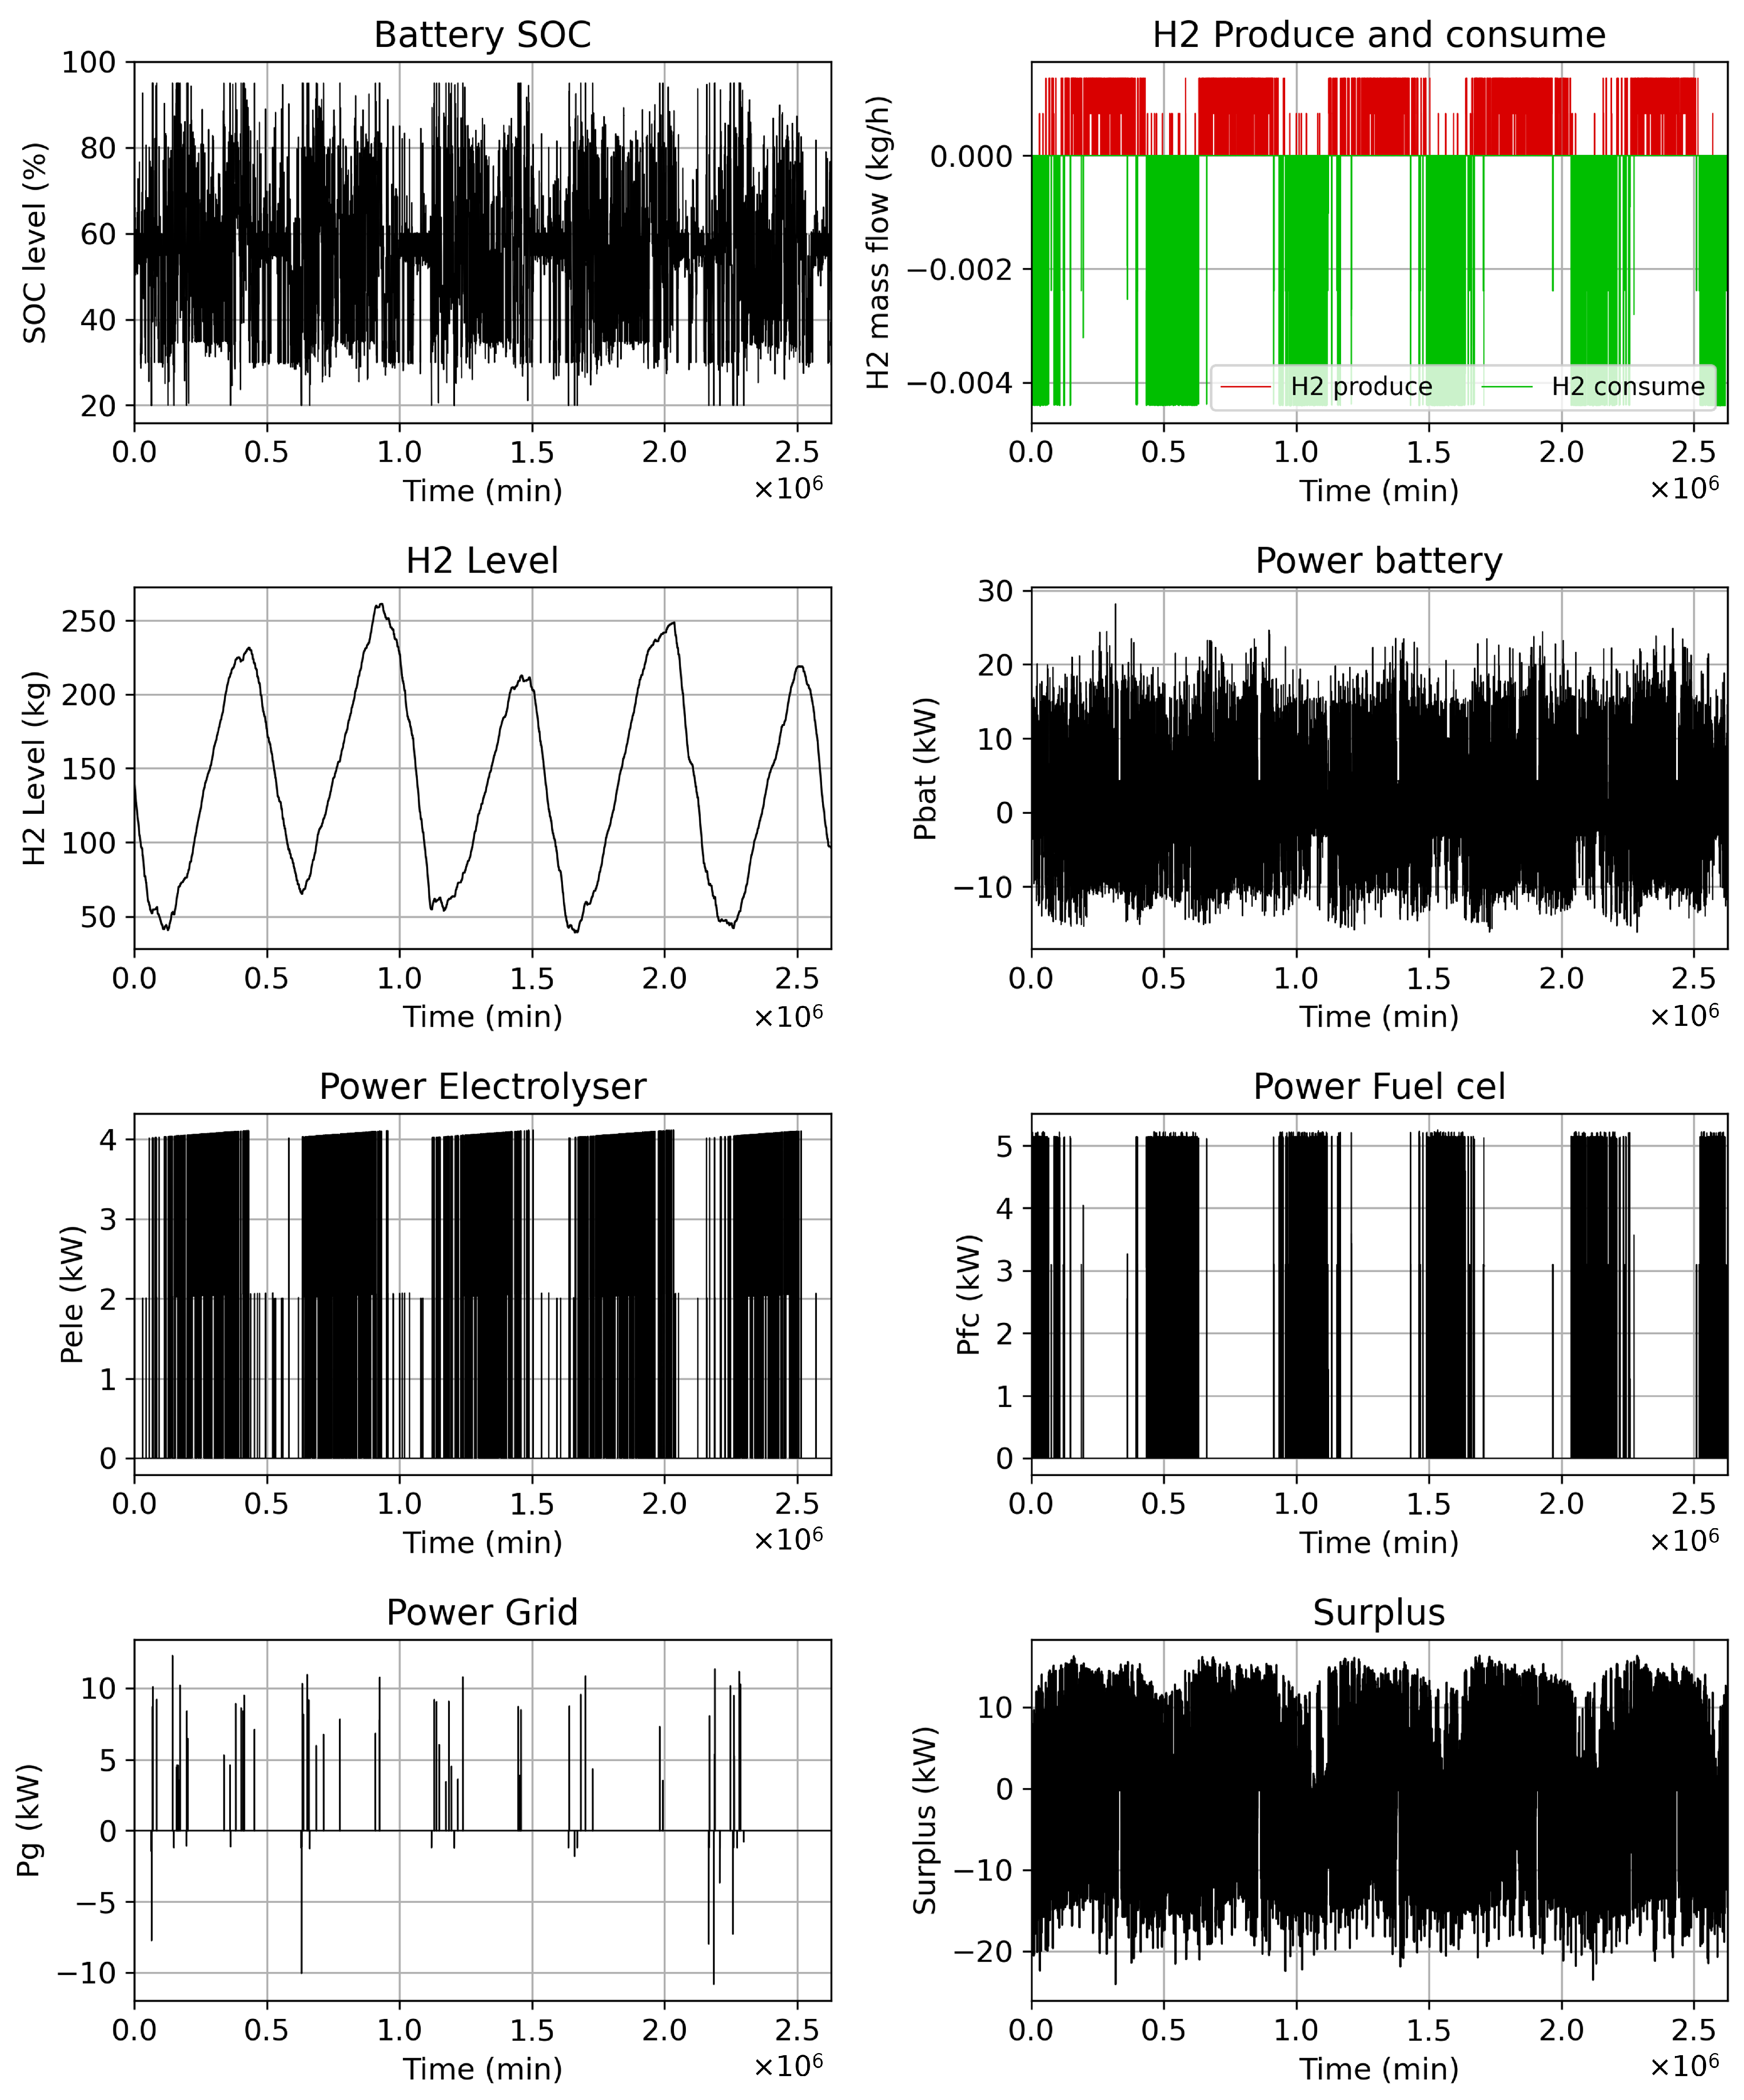
For the assumed component properties, the model calculations yield differing results for two distinct load profiles. However, by adjusting battery usage behaviour, as schematically shown in Figure 10, where the parameters “fc2bat” and “bat2ele” are varied as a function of the weather forecast, similar battery state-of-charge profiles can be achieved. This indicates an almost optimal utilization of the battery capacity. The largest discrepancies between the two scenarios in Figure 15 and Figure 16 arise in particular in the amount of hydrogen produced and consumed. In the case of the single-family house with improved thermal insulation of the building envelope, the reduced heating demand leads to a faster accumulation of hydrogen in the storage tank. This behaviour can be interpreted as an indication of oversized PV and/or solar installation capacity. For the building tat is not as well insulated in terms of energy, however, the system sizing appears appropriate: the quantities of hydrogen generated in summer can cover the heating and electricity demand during the heating season. With a hydrogen storage capacity of about 250 kg, a fully self-sufficient energy supply is achievable for the poorly insulated building. In both configurations, interaction with the public power grid is minimized, since surplus electrical energy is primarily used for hydrogen production and is only fed into the grid in extreme situations (for example, in the case of persistently high solar irradiance with a fully charged battery). Given these considerations, it can be inferred that efficient thermal building management can make a substantial contribution to reducing the required level of system sizing and thus to lowering the total investment and operating costs of the energy system. This is also evident from the definition of the degree of self-sufficiency used in this work (Equation (9)). The single-family house with good thermal insulation exhibits an average degree of self-sufficiency of 2.156 over the five-year observation period, whereas a building with insufficient thermal insulation attains a degree of self-sufficiency of only 1.298. These results are shown in Table 2. For a more detailed, component-wise analysis of the system characteristics, particularly with regard to hydrogen production and the degree of self-sufficiency of the overall system, the following section presents a separate examination of the individual subsystems.
Figure 15.
Results for the good insulation load profile from 2019 to 2023.
Figure 16.
Results for the bad insulation load profile from 2019 to 2023.
Table 2.
Autarky degree of two one-family-house with poor and improved house insulation.
3.4. Variation of Component Properties Based on a Constant Load Profile
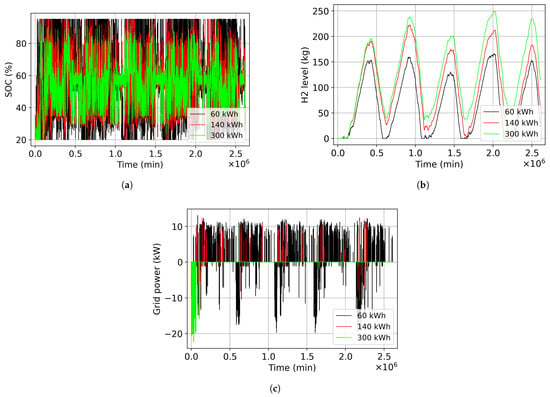
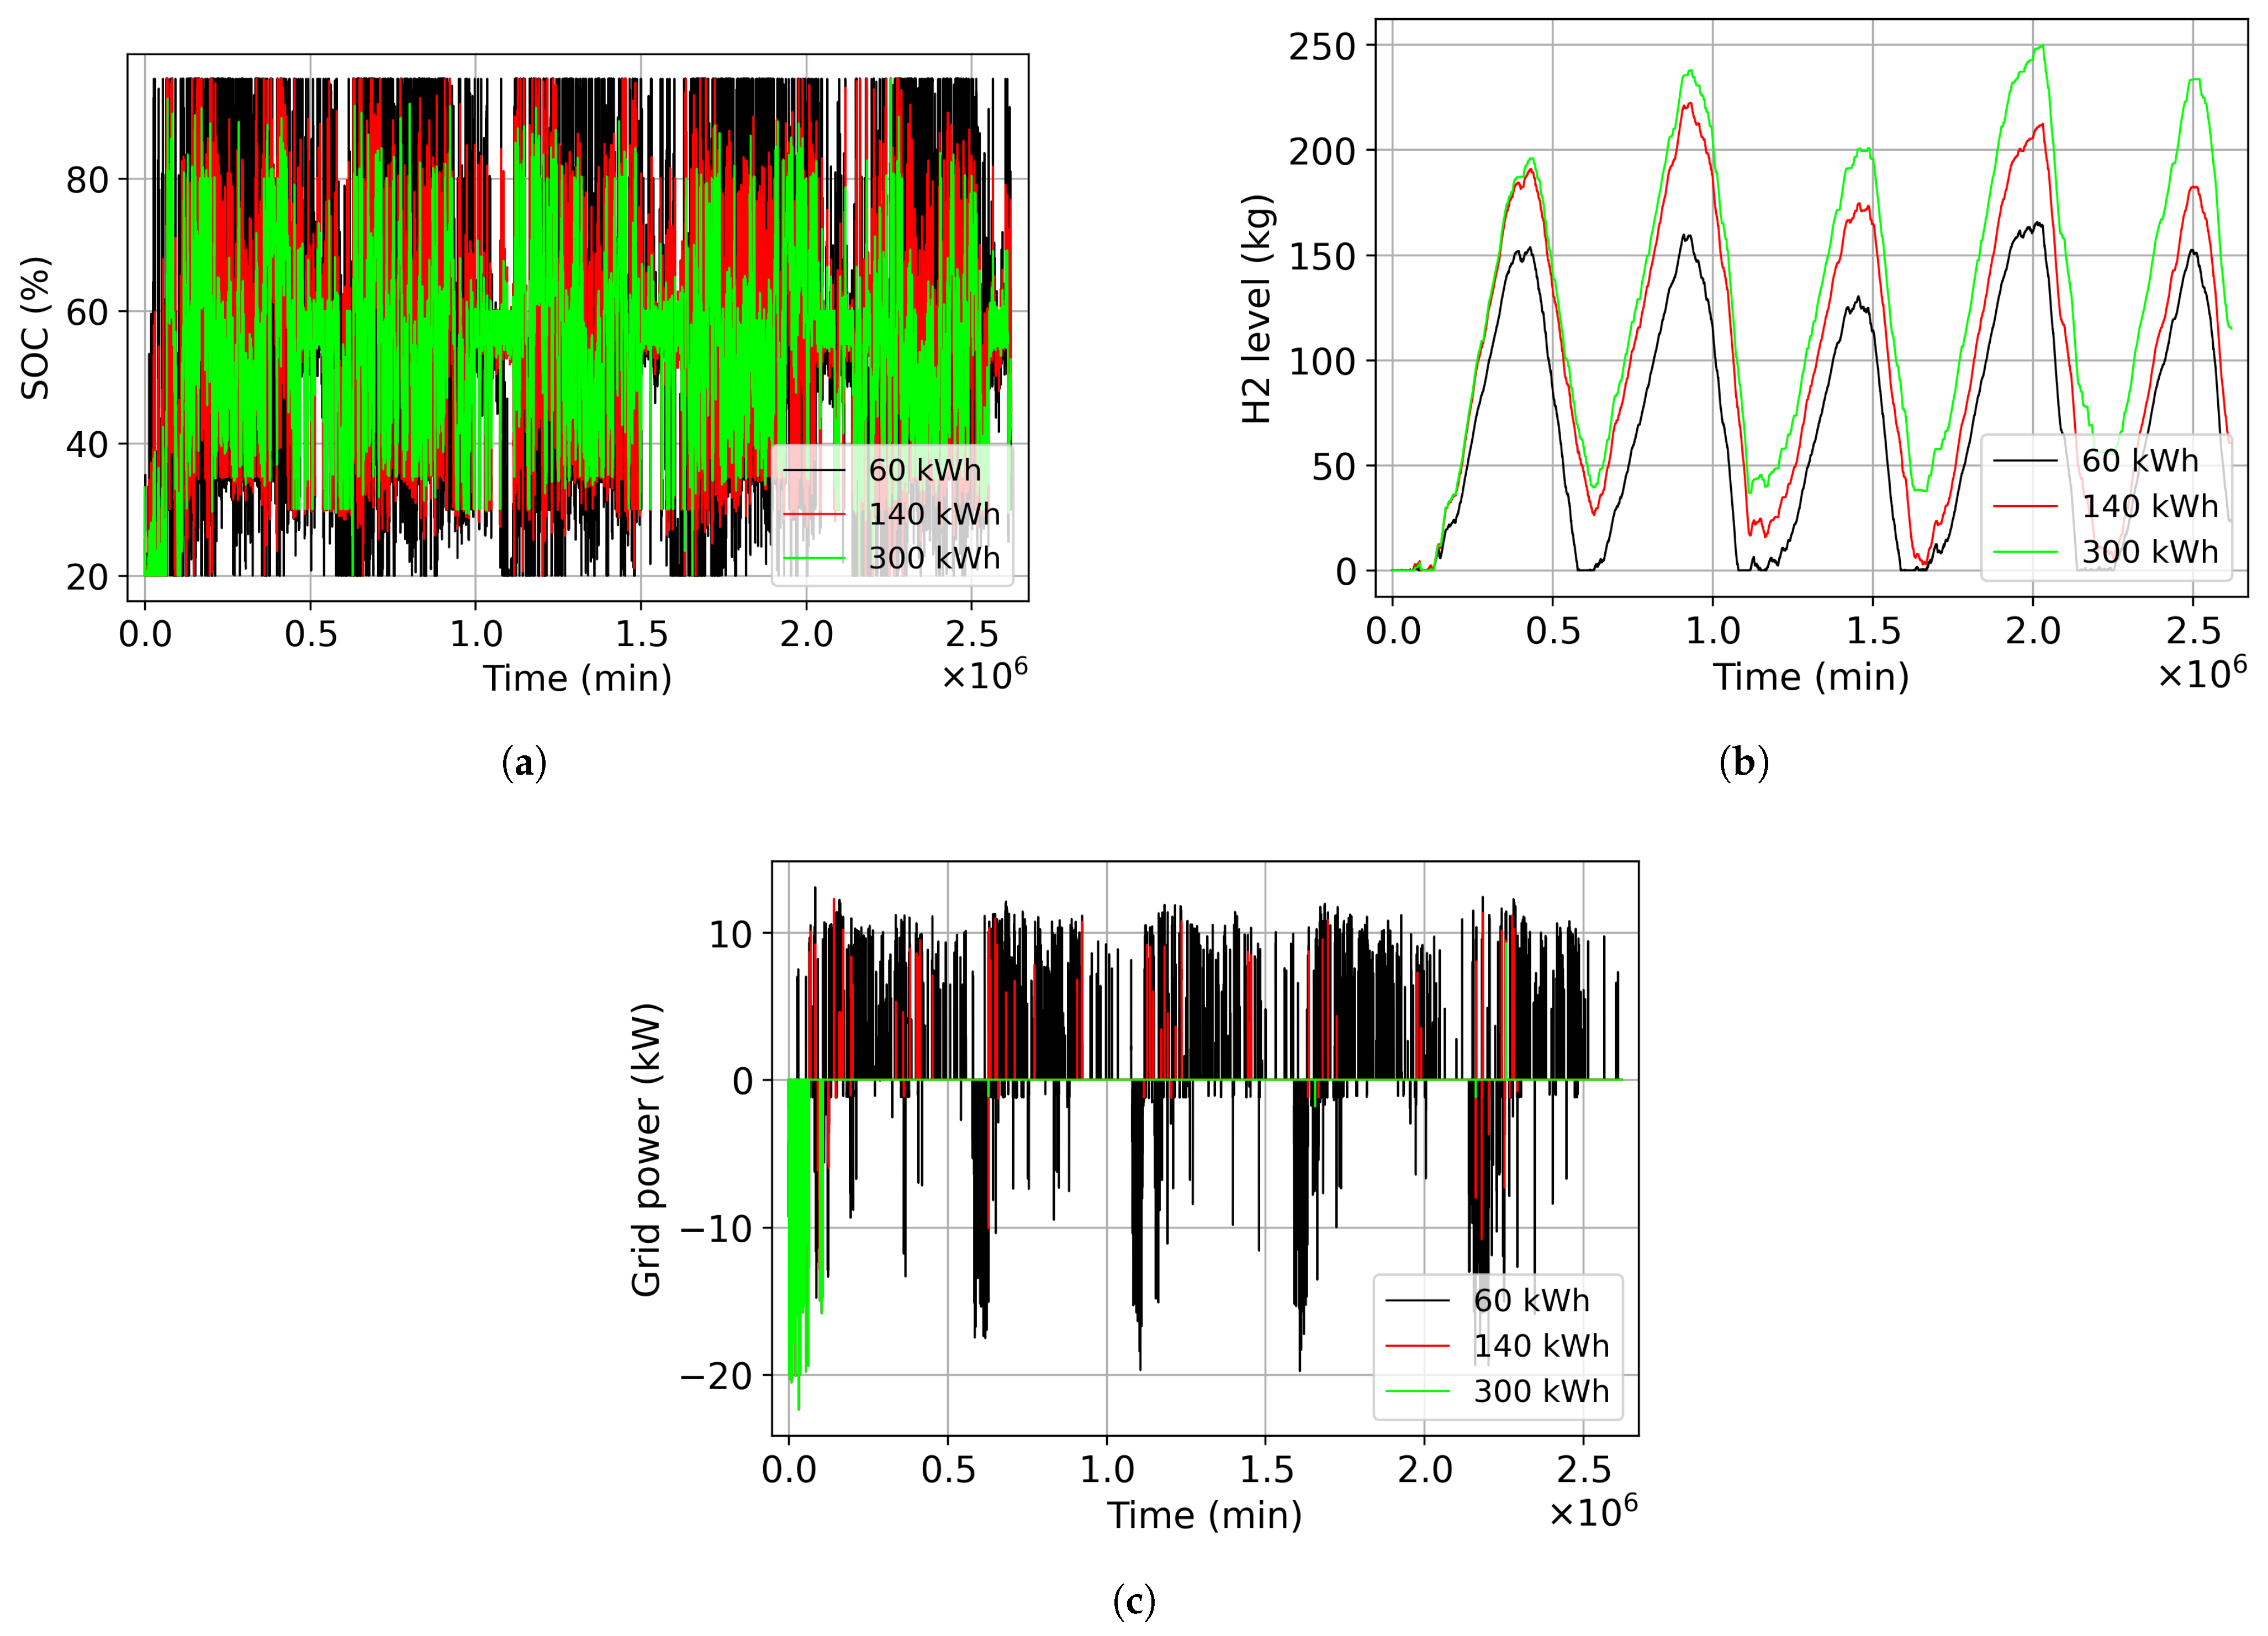
To analyse the effects of component variations, the load profile with poor insulated single-family house and the PV generation profile with an installed capacity of 20 kWp (Figure 12a) are used. A total of three different battery capacities are investigated: 60 kWh, 140 kWh, and 300 kWh. Figure 17 shows the influence of battery capacity on the , the fill level, and grid integration (). With a low battery capacity of 60 kWh, the SOC exhibits pronounced fluctuations between the upper and lower limits. In the case of a heavily oversized battery capacity of 300 kWh, however, the SOC remains approximately at 50%, which corresponds to an inefficient or inadequate utilization of the available storage capacity. In contrast, an intermediate battery capacity of 140 kWh shows a better utilization of the storage capacity. Another disadvantage of a battery that is dimensioned too small is the insufficient coordination with the power rating of the electrolyser.
Figure 17.
System performance in terms of SOC, and grid integration as a function of battery capacity. (a) Influence of the battery capacity on the battery state of charge. (b) Influence of the battery capacity on the hydrogen level. (c) Influence of battery capacity on the grid integration.
Rapid charging of the battery necessitates dissipation of excess energy, whereas with sufficiently high battery capacity this energy could instead be temporarily stored and subsequently utilized for hydrogen production. Conversely, excessively rapid discharging of the battery results in a shutdown of the electrolyser. Consequently, the quantity of hydrogen generated with a 60 kWh battery is substantially lower than that achievable with a larger battery. Beyond a certain battery capacity, the maximum hydrogen yield becomes insensitive to further increases in capacity, since all surplus energy is already being converted to hydrogen. This effect is evident in the profile shown in Figure 17c, where the interval with is almost absent for battery capacities of 140 kWh and 300 kWh.
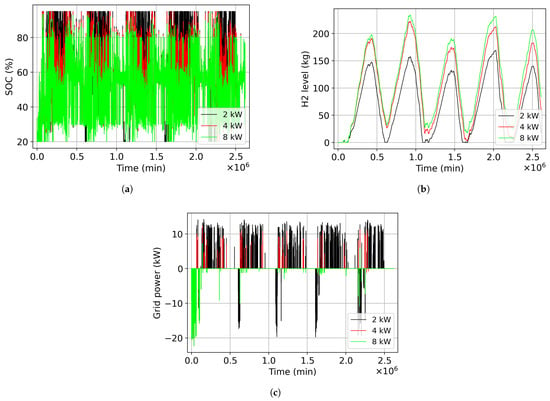
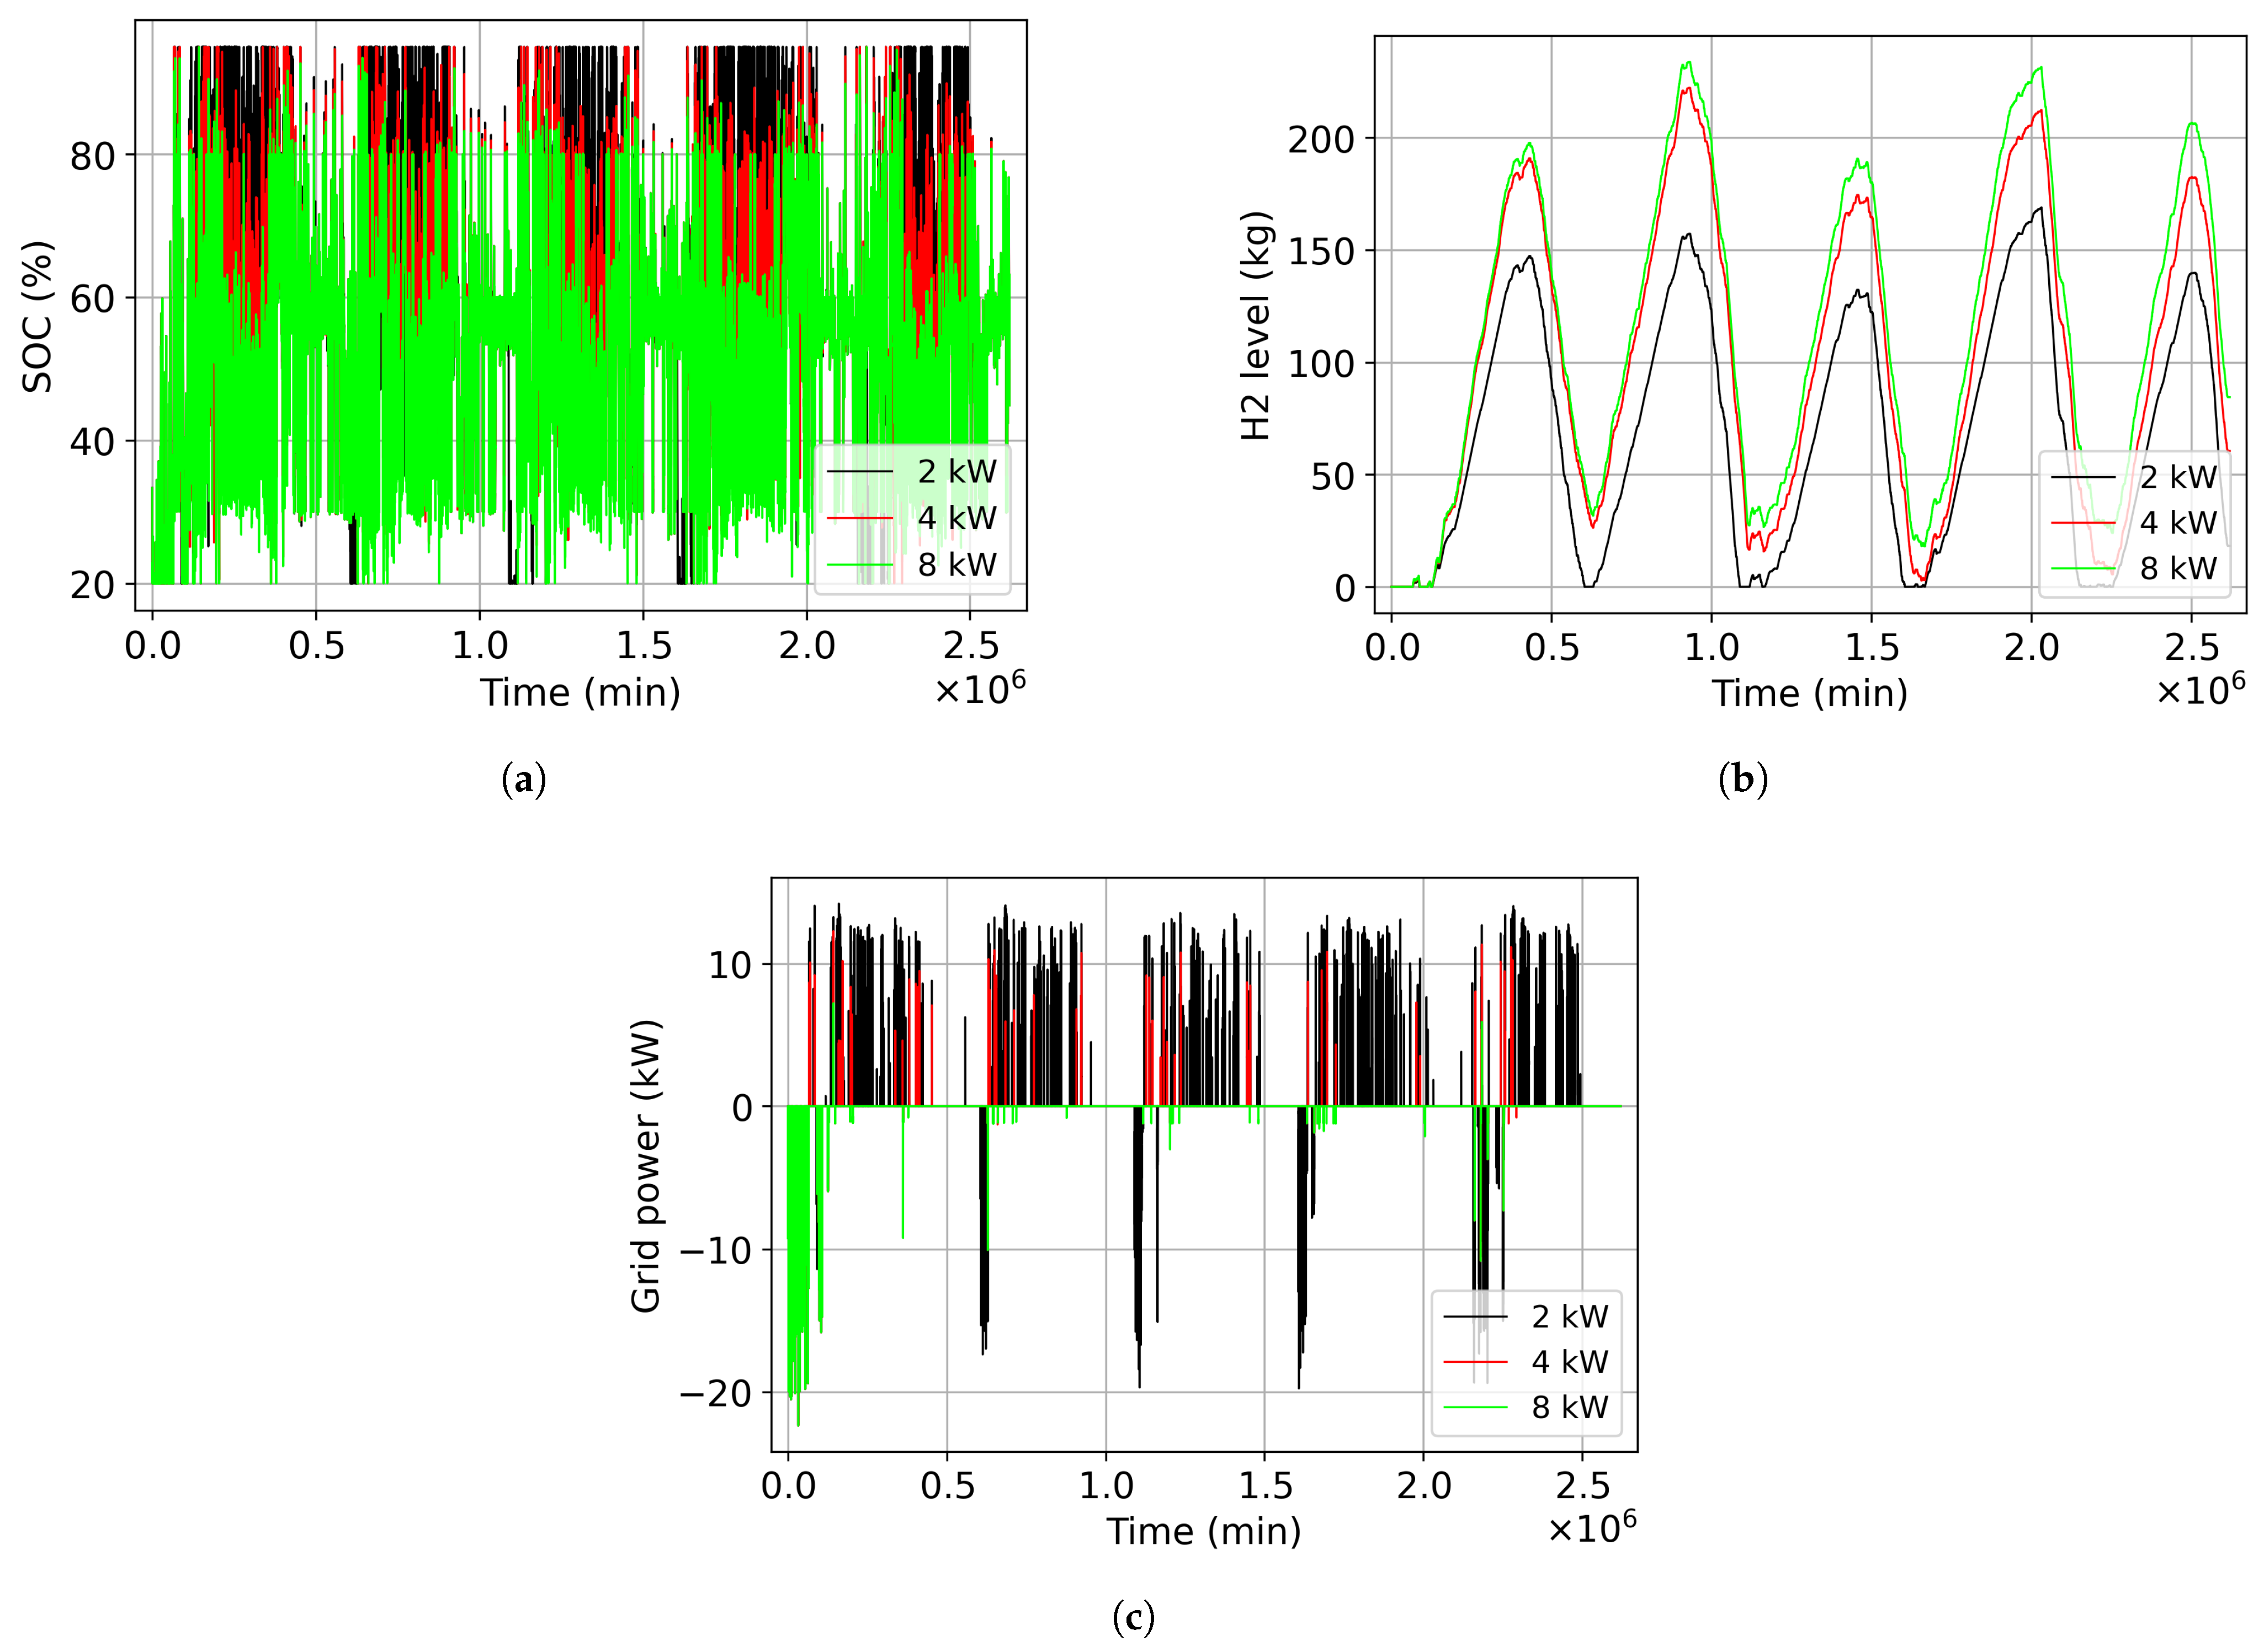
The existence of an optimal electrolyser capacity, as illustrated in Figure 11a, is further corroborated by the results presented in Figure 18. Any mismatch between the available surplus electrical power and the installed electrolyser capacity results either in insufficient hydrogen production or in suboptimal utilization of the available energy. In the case of an undersized electrolyser, a disproportionately large fraction of the surplus electrical energy is directed to the battery storage system. Consequently, the battery, which is primarily intended to function as a short-term power buffer, reaches its maximum state of charge rapidly, necessitating the curtailment of additional surplus energy via feed-in to the grid. Moreover, the battery discharges only slowly during night time, so that inadequate storage capacity remains available as a buffer for the subsequent day.
Figure 18.
System performance in terms of SOC, and grid integration as a function of EL power. (a) Influence of the electrolyser power on the battery state of charge. (b) Influence of the electrolyser power on hydrogen level. (c) Influence of the electrolyser power on the grid integration.
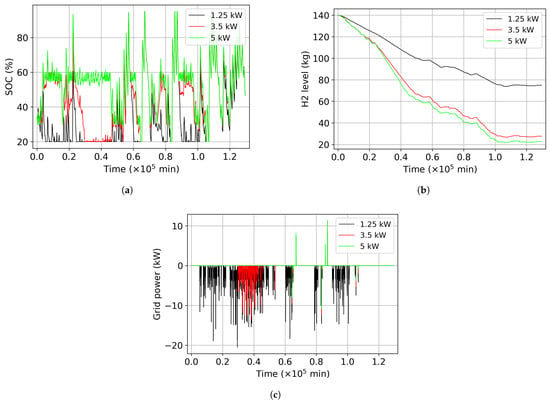
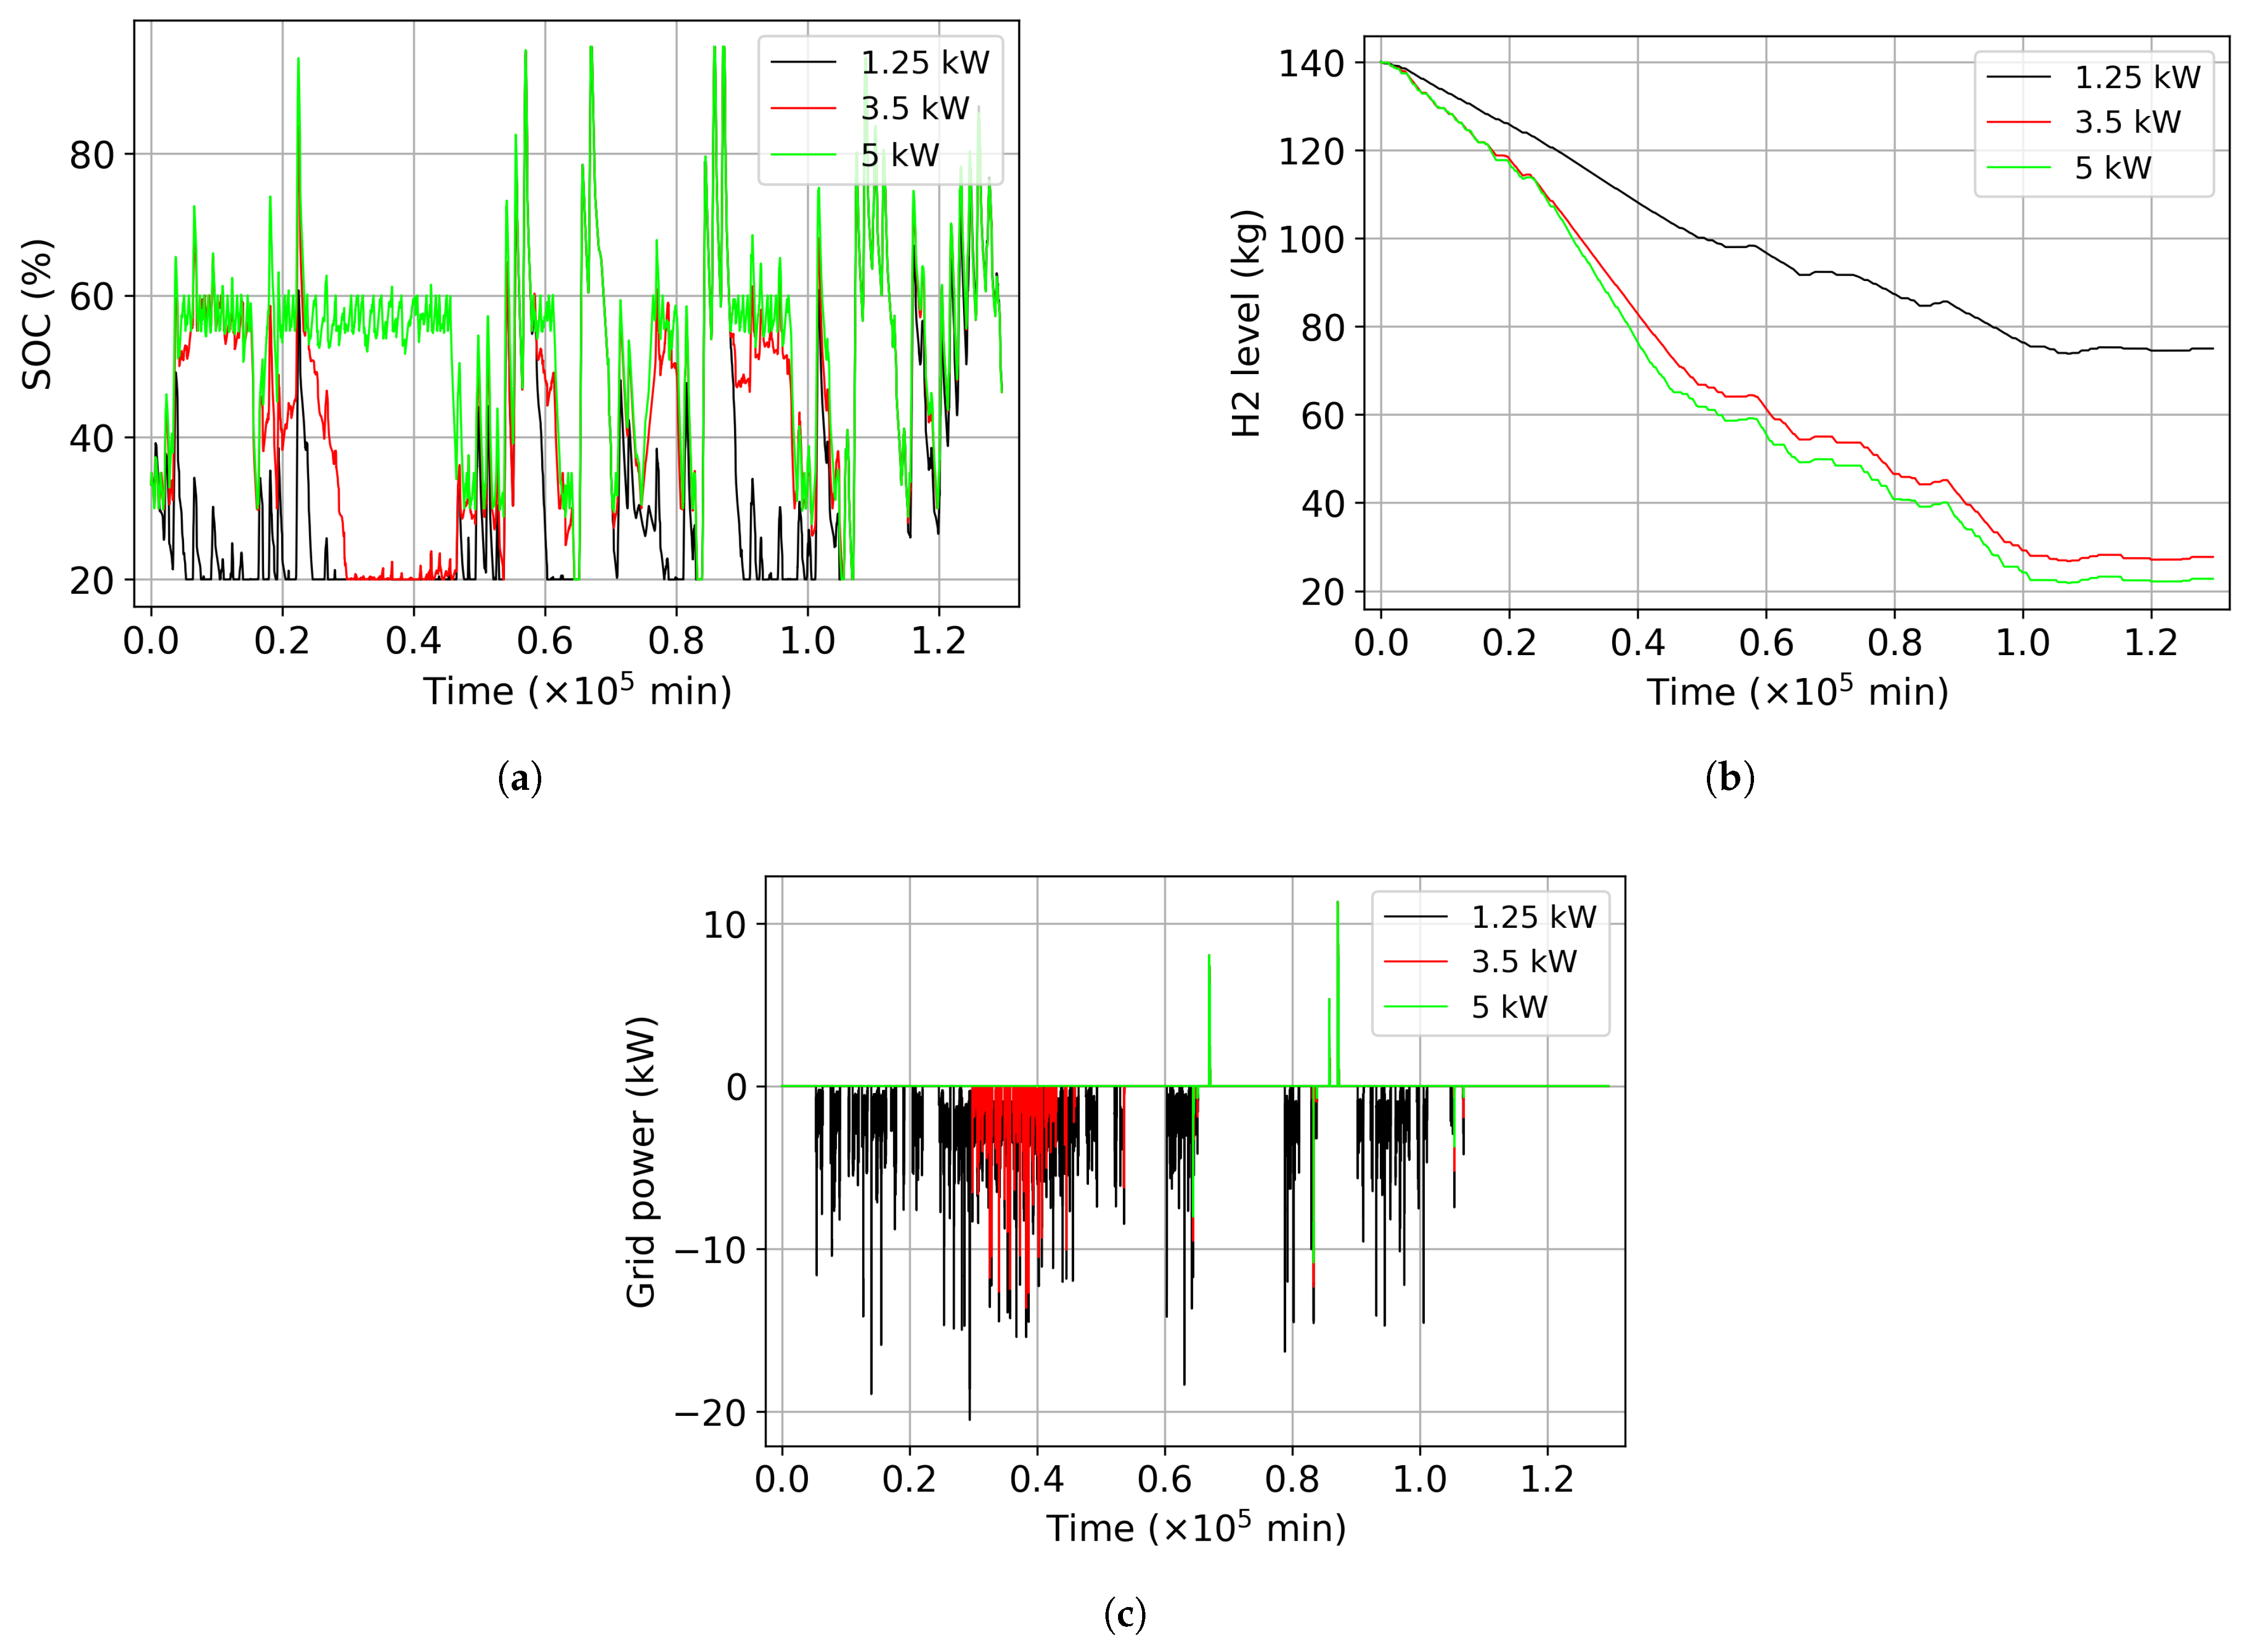
For a more detailed quantification of the influence of the fuel cell on overall system performance, all profiles within a 90-day time horizon during which the fuel cell is operating are evaluated in Figure 19. The fuel cell is activated only when the battery SOC is about to fall below the threshold “fc2bat” and, simultaneously, the forecast energy surplus lies below a predefined limit. Within this control strategy, the fuel cell delivers a constant electrical power. If the instantaneous power demand is lower than the fuel cell output, the surplus power is used to charge the battery. Conversely, if the power demand exceeds the fuel cell output, the battery supplies the additional required power. Appropriate dimensioning of the fuel cell power is intended to maintain the battery SOC approximately constant over the long term, implying that the nominal fuel cell power should be close to the average system power demand. With fuel cell power ratings of 1.25 kW or 3.5 kW (red profile in Figure 19), the power demand cannot be fully met, resulting in a more pronounced battery discharge. Consequently, the “fc2bat” threshold is undershot to a substantially greater extent. In contrast, with a higher fuel cell power of 5 kW, short-term decreases in SOC to the “fc2bat” level can be rapidly compensated.
Figure 19.
System performance of SOC, and grid integration as a function of fuel cell power in a 90 winter days window. (a) influence of the fuel cell power on the battery SOC. (b) influence of the fuel cell power on hydrogen level. (c) influence of the fuel cell power on the grid integration.
3.5. Estimating Plant Capital and Operating Costs
The total system costs comprise an initial capital expenditure and recurring operational expenses, including maintenance and water consumption. The initial investment corresponds to the acquisition of the microgrid system hardware, which encompasses PV modules, battery storage, fuel cell, DHPEL unit, hydrogen storage cylinders, and the associated power electronics, such as hybrid inverters. The aggregate hardware cost can therefore be expressed as:
where is the cost of the PV system per kWp, is the battery cost per kWh, is the cost of the fuel cell per kW, is the cost of the electrolyser per kW, is the storage cost of hydrogen per kg, is the additional cost of the power electronics, and is the annual maintenance costs. The cost components associated with the application of Equation (11) are summarised in Table 3.
Table 3.
Price range and size of the components.
For comparison with grid electricity, the total costs are divided by the total electricity demand:
The levelized cost per kilowatt-hour decreases as the level of electrical energy demand increases.
The price ranges in Table 3 are based on a combination of available market data and cost values derived from experience on prior projects. Hydrogen storage costs were derived assuming 300-bar standard compressed hydrogen cylinders with a typical internal volume of 50 L. A fully charged 50 L hydrogen cylinder contains approximately 1 kg of hydrogen at 300 bar.
Following the calculation in Equation (11) and based on the component price ranges derived from market platforms and previous project estimates (Table 3), the total cost of the system lies between EUR 79,700, and EUR 137,300. With the simulated average annual electrical energy demand of 15,000 kWh, the cost per kilowatt-hour is evaluated using Equation (12). At the end of the first 10 years of operation, the resulting cost per kilowatt-hour ranges from EUR 0.59/kWh to EUR 1.04/kWh. Over a 20-year operational time, the levelized electricity cost reaches a value between EUR 0.33/kWh and EUR 0.58/kWh; this is around the average electricity price in Germany of EUR 0.40 [49] in 2025, suggesting economic feasibility.
3.6. Discussion of Quasi-Optimal Design of the Microgrid System and Economic Analysis
Although the optimal configuration of a hybrid energy storage system is governed by a wide range of system-level boundary conditions and application-specific operating scenarios, it is nevertheless feasible to derive overarching design principles and generalized sizing guidelines to support the conceptualization and engineering of such systems.
- PV module: If a defined load profile is available, the power range of the PV modules should first be determined on the basis of the desired degree of self-sufficiency (see Equation (9)). A degree of self-sufficiency of 1 corresponds to complete coverage of the energy demand by the on-site generation system. Values of the degree of self-sufficiency greater than 1 increase independence from the public electricity grid, but are simultaneously associated with higher capital expenditures. The selection of an appropriate degree of self-sufficiency should therefore be guided by a comprehensive techno-economic evaluation, ensuring that technical performance targets and economic boundary conditions are considered in an integrated manner.
- Electrolyser: If both a PV generation profile and a load profile are available, the profile of the power surplus can be determined as the difference between these two time series. From the resulting surplus power profile (), an average surplus power (analogous to in Figure 8) can be calculated. An optimal design of the electrolyser’s rated power is, as an approximation, based on this average value.
- PEM Fuel Cell: As part of the hybrid energy storage concept, electricity generation from hydrogen takes place almost exclusively during the winter period. Although the fuel cell does not need to be designed to cover the occasional peak loads (this task is handled by the battery) it should have sufficient power to recharge the battery to a defined state of charge within a reasonable period of time. Designing the fuel cell power to around 80 % of the maximum power demand (negative ) represents an appropriate sizing parameter for this purpose.
- Battery: The selection of the battery is carried out subsequent to the design of the electrolyser and the fuel cell. The maximum battery capacity must be sized such that the available storage capacity is utilized as fully as possible. If the capacity is too small or too large, either pronounced fluctuations in the state of charge occur or the battery level remains largely constant (cf. Figure 17 and Figure 18).
- Hydrogen Storage: The maximum expected amount of hydrogen is determined as soon as the profile of the surplus power is available (cf. Equation (10)). This quantity can be used to size the required storage capacity. The hydrogen content of a standard 50 L high-pressure gas cylinder (operating pressure 300–350 bar) is approximately 1.1 kg. For cost reasons, the present concept initially considers standard steel high-pressure gas cylinders, even though the DHPEL should in principle be capable of producing hydrogen directly at a pressure of 700 bar. The use of CFRP pressure vessels both for the DHPEL tank and for hydrogen storage represents the current research and development direction in this project.
- Economic Assessment: An initial economic feasibility analysis, as presented in Section 3.5, has shown that, for an evaluation period starting from 15 years, the overall system can provide a competitive levelized cost of electricity per kWh. Due to the compactness and high flexibility of the high-pressure electrolyser, the hydrogen-based microgrid system solution for self-sufficient energy supply can be classified as particularly future-proof and attractive. In the second project phase, following the validation of functionality in the first phase, a lightweight variant based on carbon-fibre-reinforced composites is to be implemented, which will significantly reduce production costs and system weight. By the end of 2027, the DHPEL is expected to be transferred to series production, thereby achieving market entry.
4. Summary and Outlook
Summary: Using a Simulink/Simscape model, a hybrid energy storage system in which surplus solar energy is stored partly in a battery and partly as hydrogen was investigated. To enable an analysis that is as close to reality as possible, the solar feed-in profiles, depending on the respective configuration of the PV system, were taken from a professional database, the Photovoltaic Geographical Information System (PVGIS) [50]. An API-based interface for the automated import of solar feed-in profiles has been developed in MATLAB. All relevant installation parameters of the photovoltaic system can be configured directly within the MATLAB environment. The electrical load profile is provided by a load profile generator, which takes into account various influencing factors such as household or family composition, population groups, season of the year, as well as other relevant framework conditions. For rapid initialization of simulations, a comprehensive graphical user interface (GUI) has been developed, within which all component properties can be configured and adjusted. The overall concept of hybrid energy storage was systematically verified using the developed model and evaluated with regard to technical feasibility and economic efficiency. In addition, the model is able to size all required system components and optimize them depending on the implemented control algorithms. The effects of sizing individual components (such as battery capacity, electrolyser power, etc.) on the amount of hydrogen produced as well as on the SOC behaviour of the battery can be analysed and evaluated in detail. The developed system model is employed for analysis and component dimensioning for two specific load scenarios. Furthermore, a system configuration capable of achieving an autarky degree of 1 is introduced. The economic assessment, yielding a LCOE in the range of EUR 0.33–0.58/kWh over an operational lifetime of 20 years, based on the assumptions summarized in Table 3, indicates that the system exhibits cost competitiveness relative to alternative energy supply plants.
Outlook: The hybrid energy storage system investigated in this work, as well as the simulation model developed for it, demonstrate the potential use of hydrogen as an option for long-term storage of electrical energy in the microgrid under consideration. As part of a future study, the underlying concept and the associated model will be further developed, taking into account the aspects listed below, in order to subject the use of hydrogen for energy storage as an alternative battery technology in the microgrid to a more substantiated and systematic assessment.
- Use of AI: The current algorithm uses classical if–else rules. Such rule-based approaches are robust and traceable. However, in complex energy systems with many influencing factors, such as PV generation, time-varying loads, battery state, weather, and dynamic electricity prices, these rules reach their limits [51]. They usually react only to the current state and cannot proactively consider future developments. An AI-supported energy management strategy addresses this by combining statistical forecasting with mathematical optimization [52,53,54,55]. In practice, hybrid approaches are particularly effective: AI models forecast key variables, while established optimization methods (e.g., linear or mixed-integer optimization) make the actual decisions. Typical forecasts include PV output, load profiles, and electricity prices using machine learning models. These forecasts then serve as input for the optimization. The result is a predictive, interpretable, and robust energy-management system that can be seamlessly integrated into existing platforms such as OpenEMS. Purely AI-based decision algorithms, especially reinforcement learning, are promising and are being actively researched, but must currently be viewed critically for real-world use [51]. They typically require large training datasets, are difficult to verify deterministically, and hinder traceability and formal certification. For practical applications, a hybrid approach is therefore recommended: AI methods propose recommendations or setpoints (e.g., charging/discharging power, deployment schedules), while a superordinate rule-based logic still monitors safety limits, grid requirements, and physical constraints, and intervenes if necessary. A quantitative comparison between the current rule-based EMS and an AI-based algorithm such as machine learning forecasts for PV generation and load consumption is planned as part of a dedicated follow-up study. Different strategies will be evaluated on the same operational dataset using metrics such as self-consumption rate, grid feed-in, operational costs and component lifetime optimisation.
- Extension of the microgrid concept: The model currently in use is primarily intended to analysed and size the overall concept or system on the basis of historical data. Consequently, the model does not have the capability to adjust algorithm parameters prospectively or predictively. This particularly concerns the PV generation profile, the user load profile, and the exchange-traded electricity price. Real-time weather data (including corresponding forecasts) as well as the current electricity price (including future price forecasts), can be retrieved directly from the Internet in MATLAB via an API interface, while the user-specific load profile can be continuously adjusted, taking individual user behaviour into account. If, for example, a stable high-pressure weather pattern with a high global radiation forecast is expected over the coming days, a greater discharge of the battery at night for hydrogen production could potentially be reasonable or technically justifiable. As another potential source of renewable energy, the future use of wind turbines with a power rating comparable to that of the PV system is also being considered. Building on this, the system behaviour is examined under conditions of significantly more dynamic energy generation.
- Interconnection of the microgrid: With the further development of hydrogen infrastructure, hydrogen pipelines could also be used as storage media in the future. Decentralized storage solutions based on high-pressure technology would therefore no longer be strictly necessary. The significantly simplified storage logistics would enable the use of hydrogen to be implemented much more quickly and across a wider area. By interconnecting all H2 microgrids, the implementation of a significantly more advanced, intelligent energy-management system is absolutely essential in order to adequately address the challenges arising from fluctuating and volatile feeding renewable energy sources and to make their integration into the overall system more efficient.
Author Contributions
Conceptualisation and acquisition: T.X., M.K. and M.B. Analysis, drawing figures, and interpretation of data: T.X. and M.B. Preparation of the manuscript: T.X. and M.B. Critical revision: A.H. and H.P.B. All authors have read and agreed to the published version of the manuscript.
Funding
This research (FKZ: 03SF0693) was funded by the Federal Ministry for Economic Affairs and Energy (BMWE). The APC was funded by BTU Cottbus-Senftenberg.
Data Availability Statement
The original contributions presented in this study are included in the article. Further inquiries can be directed to the corresponding author.
Acknowledgments
We thank the BMWE for funding the research of the DHPEL within the EIZ project at the BTU Cottbus-Senftenberg. During the preparation of this work, the authors used ChatGPT GPT-5.5 and Overleaf 2026 to assist the writing and translating process. After using this tool/service, the authors reviewed and edited the content as needed and take full responsibility for the content of the published article.
Conflicts of Interest
The authors declare that they have no known competing financial interests or personal relationships that could have appeared to influence the work reported in this paper.
References
- IPCC. Climate Change 2023: Synthesis Report; Intergovernmental Panel on Climate Change: Geneva, Switzerland, 2023; Available online: https://www.ipcc.ch/report/ar6/syr/ (accessed on 28 January 2026).
- Sovacool, B.K. The political economy of energy poverty: A review of key challenges. Energy Sustain. Dev. 2012, 16, 272–282. [Google Scholar] [CrossRef] [Scilit]
- Parag, Y.; Sovacool, B.K. Electricity market design for the prosumer era. Nat. Energy 2016, 1, 16032. [Google Scholar] [CrossRef] [Scilit]
- REN21. Renewables 2022 Global Status Report; Renewable Energy Policy Network for the 21st Century: Paris, France, 2022. [Google Scholar]
- Lund, H.; Østergaard, P.A.; Connolly, D.; Mathiesen, B.V. Smart energy and smart energy systems. Energy 2017, 137, 556–565. [Google Scholar] [CrossRef] [Scilit]
- Denholm, P.; Margolis, R.M. Evaluating the limits of solar photovoltaics (PV) in traditional electric power systems. Energy Policy 2007, 35, 2852–2861. [Google Scholar] [CrossRef] [Scilit]
- Heide, D.; von Bremen, L.; Greller, M.; Hoffmann, C.; Speckmann, M.; Bofinger, S. Seasonal optimal mix of wind and solar power in a future, highly renewable Europe. Renew. Energy 2010, 35, 2483–2489. [Google Scholar] [CrossRef] [Scilit]
- Schill, W.P.; Zerrahn, A. Long-run power storage requirements for high shares of renewables: Review and a new model. Renew. Sustain. Energy Rev. 2018, 79, 1518–1534. [Google Scholar] [CrossRef] [Scilit]
- Dowling, J.A.; Rinaldi, K.Z.; Ruggles, T.H.; Davis, S.J.; Yuan, M.; Tong, F.; Lewis, N.S.; Caldeira, K. Role of Long-Duration Energy Storage in Variable Renewable Electricity Systems. Joule 2020, 4, 1907–1928. [Google Scholar] [CrossRef] [Scilit]
- Staadecker, M.; Szinai, J.; Sánchez-Pérez, P.A.; Kurtz, S.; Hidalgo-Gonzalez, P. The value of long-duration energy storage under various grid conditions in a zero-emissions future. Nat. Commun. 2024, 15, 9501. [Google Scholar] [CrossRef] [Scilit]
- Meier, M. Wasserstoff als Energiespeicher für Erneuerbare Energien. Master’s Thesis, FH CAMPUS 02 (CAMPUS 02 Fachhochschule der Wirtschaft), Graz, Austria, 2019. [Google Scholar]
- Glenk, G.; Reichelstein, S. Economics of converting renewable power to hydrogen. Nat. Energy 2019, 4, 216–222. [Google Scholar] [CrossRef] [Scilit]
- Schmidt, O.; Hawkes, A.; Gambhir, A.; Staffell, I. The future cost of electrical energy storage based on experience rates. Energy Policy 2017, 107, 246–256. [Google Scholar] [CrossRef] [Scilit]
- Zeng, K.; Zhang, D. Recent progress in alkaline water electrolysis for hydrogen production and applications. Prog. Energy Combust. Sci. 2010, 36, 307–326. [Google Scholar] [CrossRef] [Scilit]
- Crotogino, F.; Donadei, G.; Bünger, U.; Landinger, L. Large-scale hydrogen underground storage for securing renewable energy supply. In Proceedings of the 18th World Hydrogen Energy Conference 2010 (WHEC 2010), Essen, Germany, 16–21 May 2010. [Google Scholar]
- Ozarslan, A. Large-scale hydrogen energy storage in salt caverns. Int. J. Hydrogen Energy 2012, 37, 14265–14277. [Google Scholar] [CrossRef] [Scilit]
- Kruck, O.; Zimmermann, H.; Schelling, T.; Rühle, J. HyUnder—Assessment of the Potential, the Actors and Relevant Business Cases for Large-Scale and Seasonal Storage of Renewable Electricity by Hydrogen Underground Storage in Europe; Technical Report; European Commission: Brussels, Belgium, 2013. [Google Scholar]
- Melaina, M.; Antonia, O.; Penev, M. Blending Hydrogen into Natural Gas Pipeline Networks: A Review of Key Issues; Technical Report; National Renewable Energy Laboratory: Golden, CO, USA, 2013. [CrossRef] [Scilit]
- Ahluwalia, R.K.; Hua, T.Q.; Peng, J.K. On-board and Off-board performance of hydrogen storage options for light-duty vehicles. Int. J. Hydrogen Energy 2012, 37, 2891–2910. [Google Scholar] [CrossRef] [Scilit]
- Ronevich, J.A.; San Marchi, C.; Brooks, D.; Emery, J.M.; Grimmer, P.; Chant, E.; Sims, J.R.; Belokobylka, A.; Farese, D.; Felbaum, J. Exploring Life Extension Opportunities of High-Pressure Hydrogen Pressure Vessels at Refueling Stations. In Pressure Vessels and Piping Conference; American Society of Mechanical Engineers: New York, NY, USA, 2021; Volume 3, p. V003T05A011. [Google Scholar] [CrossRef] [Scilit]
- Li, J.; Chai, X.; Gu, Y.; Zhang, P.; Yang, X.; Wen, Y.; Xu, Z.; Jiang, B.; Wang, J.; Jin, G.; et al. Small-Scale High-Pressure Hydrogen Storage Vessels: A Review. Materials 2024, 17, 721. [Google Scholar] [CrossRef] [Scilit] [PubMed]
- Aceves, S.M.; Espinosa-Loza, F.; Ledesma-Orozco, E.; Ross, T.O.; Weisberg, A.H.; Brunner, T.C.; Kircher, O. High-density automotive hydrogen storage with cryogenic capable pressure vessels. Int. J. Hydrogen Energy 2010, 35, 1219–1226. [Google Scholar] [CrossRef] [Scilit]
- Chakraborty, A.; Hou, P.; Kumar, D.; Ortmann, J.; Sulic, M. Thermal Management of Onboard Hydrogen Storage Systems. 2013. Available online: https://www.hydrogen.energy.gov/docs/hydrogenprogramlibraries/pdfs/review13/st009_cai_2013_o.pdf (accessed on 28 January 2026).
- Ziozas, N.; Iliadis, P.; Bellos, E.; Kitsopoulou, A.; Rotas, R.; Gonidaki, D.; Nikolopoulos, N. Parametric investigation and multi-objective optimization of building-integrated hybrid energy storage system with metal hydride tank. Int. J. Hydrogen Energy 2025, 139, 203–219. [Google Scholar] [CrossRef] [Scilit]
- Lototskyy, M.; Davids, M.; Swanepoel, D.; Ehlers, R.; Klochko, Y.; Gizer, G.; Pasupathi, S.; Linkov, V.; Yartys, V. Development of a high-pressure 700 bar metal hydride hydrogen compressor. J. Energy Storage 2024, 98, 113072. [Google Scholar] [CrossRef] [Scilit]
- Haryu, E.; Nakazawa, K.; Taruya, K.; Ishikawa, H.; Okabe, M. Mechanical Structure and Performance Evaluation of High Differential Pressure Water Electrolysis Cell. Honda R/D Tech. Rev. 2011, 23, 97–105. [Google Scholar]
- Richards, B.; Conibeer, G. A comparison of hydrogen storage technologies for solar-powered stand-alone power supplies: A photovoltaic system sizing approach. Int. J. Hydrogen Energy 2007, 32, 2712–2718. [Google Scholar] [CrossRef] [Scilit]
- Hwang, J.J.; Lai, L.K.; Wu, W.; Chang, W.R. Dynamic modeling of a photovoltaic hydrogen fuel cell hybrid system. Int. J. Hydrogen Energy 2009, 34, 9531–9542. [Google Scholar] [CrossRef] [Scilit]
- Khan, M.J.; Iqbal, M.T. Dynamic modelling and simulation of a small wind-fuel cell hybrid energy system. Renew. Energy 2005, 30, 421–439. [Google Scholar] [CrossRef] [Scilit]
- Lagorse, J.; Simões, M.G.; Miraoui, A.; Costerg, P. Energy cost analysis of a solar-hydrogen hybrid energy system for stand-alone applications. Int. J. Hydrogen Energy 2008, 33, 2871–2879. [Google Scholar] [CrossRef] [Scilit]
- Maclay, J.D.; Brouwer, J.; Samuelsen, G.S. Experimental results for hybrid energy storage systems coupled to photovoltaic generation in residential applications. Int. J. Hydrogen Energy 2011, 36, 12130–12140. [Google Scholar] [CrossRef] [Scilit]
- Dursun, E.; Acarkan, B.; Kilic, O. Modeling of hydrogen production with a stand-alone renewable hybrid power system. Int. J. Hydrogen Energy 2012, 37, 3098–3107. [Google Scholar] [CrossRef] [Scilit]
- Uzunoglu, M.; Onar, O.C.; Alam, M.S. Modeling, control and simulation of a PV/FC/UC based hybrid power generation system for stand-alone applications. Renew. Energy 2009, 34, 509–520. [Google Scholar] [CrossRef] [Scilit]
- Ipsakis, D.; Voutetakis, S.; Seferlis, P.; Stergiopoulos, F.; Elmasides, C. Power management strategies for a stand-alone power system using renewable energy sources and hydrogen storage. Int. J. Hydrogen Energy 2009, 34, 7081–7095. [Google Scholar] [CrossRef] [Scilit]
- Valdés, R.; Rodríguez, L.R.; Lucio, J.H. Procedure for optimal design of hydrogen production plants with reserve storage and a stand-alone photovoltaic power system. Int. J. Hydrogen Energy 2012, 37, 4018–4025. [Google Scholar] [CrossRef] [Scilit]
- Bernal-Agustín, J.L.; Dufo-Lopez, R. Simulation and optimization of stand-alone hybrid renewable energy systems. Renew. Sustain. Energy Rev. 2009, 13, 2111–2118. [Google Scholar] [CrossRef] [Scilit]
- Chouaib, A.; Belatrache, D.; Touhami, B.; Makhloufi, S. Sizing, optimization, control and energy management of hybrid renewable energy system—A review. Energy Built Environ. 2022, 3, 399–411. [Google Scholar] [CrossRef] [Scilit]
- Finger, S.; Fritsch, B.; Wu, M.; Lahn, L.; Hoffmeister, D.; Will, J.; Kasian, O.; Spiecker, E.; Thiele, S.; Freiberg, A.T.; et al. Degradation phenomena in PEMWE revealed by correlative electrochemical and nanostructure analysis. Energy Environ. Sci. 2025, 18, 9877–9894. [Google Scholar] [CrossRef] [Scilit]
- Qiu, X.; Zhao, F.; Ju, C.; Feng, Y.; Liu, C.; Liu, J.; Tan, A.; Liu, J. Understanding temperature-dependent degradation in proton exchange membrane water electrolyzer: The critical role of porous transport layer. Chin. J. Chem. Eng. 2026, 93, 148–159. [Google Scholar] [CrossRef] [Scilit]
- Maoulida, F.; Guilbert, D.; Camara, M.B.; Dakyo, B. Dynamic electrical degradation of PEM electrolyzers under renewable energy Intermittency: Mechanisms, diagnostics, and mitigation strategies—A comprehensive review. Renew. Sustain. Energy Rev. 2026, 225, 116170. [Google Scholar] [CrossRef] [Scilit]
- Elizetxea-Navarro, A.; Aizpuru, J.; Peña-Sanchez, Y.; Centeno-Telleria, M.; Goikoetxea, A.; Penalba, M. Assessing the impact of PEM electrolyser degradation for green hydrogen production: Power variability and ageing effects. Energy Convers. Manag. 2026, 353, 121142. [Google Scholar] [CrossRef] [Scilit]
- Anders, K.; SerEnergy A/S; Danish Power Systems ApS; Aalborg University; Technical University of Denmark. COmmercial BReakthrough of Advanced Fuel Cells-COBRA, 2010–2014. Online Report. Available online: https://energiforskning.dk/en/projects/commercial-breakthrough-of-advanced-fuel-cells-cobra (accessed on 28 May 2026).
- Njoya, S.; Tremblay, O.; Dessaint, L.A. A generic fuel cell model for the simulation of fuel cell vehicles. In 2009 IEEE Vehicle Power and Propulsion Conference; IEEE: Piscataway, NJ, USA, 2009; pp. 1722–1729. [Google Scholar] [CrossRef] [Scilit]
- Wu, J.; Yuan, X.Z.; Martin, J.J.; Wang, H.; Zhang, J.; Shen, J.; Wu, S.; Merida, W. A review of PEM fuel cell durability: Degradation mechanisms and mitigation strategies. J. Power Sources 2008, 184, 104–119. [Google Scholar] [CrossRef] [Scilit]
- Pene, S.D.; Picot, A.; Gamboa, F.; Savy, N.; Turpin, C.; Jaafar, A. Aging modeling and lifetime prediction of a proton exchange membrane fuel cell using an extended Kalman filter. Math. Comput. Simul. 2025, 234, 151–168. [Google Scholar] [CrossRef] [Scilit]
- Pei, P.; Fan, T.; Ren, P.; Wang, M.; Chen, D.; Meng, Y.; Tan, M.; Shen, H.; Zhou, W. Fuel cell current degradation law and I-V performance prediction. Appl. Energy 2025, 381, 125190. [Google Scholar] [CrossRef] [Scilit]
- Taylor, N.; Martinez, A.; Alexandris, N.; Gounari, O.; Szabo, S.; Chatzipanagi, A.; Mercado, L.; Falangas, A. Photovoltaics Geographical Information System: Status Report 2024; Publications Office of the European Union: Luxembourg, 2025. [Google Scholar] [CrossRef]
- Pflugradt, N.; Stenzel, P.; Kotzur, L.; Stolten, D. LoadProfileGenerator: An Agent-Based Behavior Simulation for Generating Residential Load Profiles. J. Open Source Softw. 2022, 7, 3574. [Google Scholar] [CrossRef] [Scilit]
- Federal Ministry for Economic Affairs and Energy (BMWE). Average Household Electricity Price Returns to Near Pre-Crisis Level in Q1 2025, 2025. Online Report. Available online: https://energiewende.bundeswirtschaftsministerium.de/EWD/Redaktion/EN/Newsletter/2025/04/Meldung/direkt-account.html (accessed on 28 January 2026).
- Huld, T.; Müller, R.; Gambardella, A. A new solar radiation database for estimating PV performance in Europe and Africa. Sol. Energy 2012, 86, 1803–1815. [Google Scholar] [CrossRef] [Scilit]
- Kouihi, M.; Bikndaren, S.; Moutchou, M.; ElMahjoub, A.A.; Majdoul, R. Comprehensive review of classical and ai-driven energy management strategies for hybrid renewable energy systems. e-Prime-Adv. Electr. Eng. Electron. Energy 2025, 13, 101085. [Google Scholar] [CrossRef] [Scilit]
- Shakeri, M.; Pasupuleti, J.; Amin, N.; Rokonuzzaman, M.; Low, F.W.; Yaw, C.T.; Asim, N.; Samsudin, N.A.; Tiong, S.K.; Hen, C.K.; et al. An Overview of the Building Energy Management System Considering the Demand Response Programs, Smart Strategies and Smart Grid. Energies 2020, 13, 3299. [Google Scholar] [CrossRef] [Scilit]
- Safari, A.; Daneshvar, M.; Anvari-Moghaddam, A. Energy Intelligence: A Systematic Review of Artificial Intelligence for Energy Management. Appl. Sci. 2024, 14, 11112. [Google Scholar] [CrossRef] [Scilit]
- Akbulut, O.; Cavus, M.; Cengiz, M.; Allahham, A.; Giaouris, D.; Forshaw, M. Hybrid Intelligent Control System for Adaptive Microgrid Optimization: Integration of Rule-Based Control and Deep Learning Techniques. Energies 2024, 17, 2260. [Google Scholar] [CrossRef] [Scilit]
- Wicaksono, H.; Trat, M.; Bashyal, A.; Boroukhian, T.; Felder, M.; Ahrens, M.; Bender, J.; Groß, S.; Steiner, D.; July, C.; et al. Artificial-intelligence-enabled dynamic demand response system for maximizing the use of renewable electricity in production processes. Int. J. Adv. Manuf. Technol. 2024, 138, 247–271. [Google Scholar] [CrossRef] [Scilit]

Disclaimer/Publisher’s Note: The statements, opinions and data contained in all publications are solely those of the individual author(s) and contributor(s) and not of MDPI and/or the editor(s). MDPI and/or the editor(s) disclaim responsibility for any injury to people or property resulting from any ideas, methods, instructions or products referred to in the content. |
© 2026 by the authors. Licensee MDPI, Basel, Switzerland. This article is an open access article distributed under the terms and conditions of the Creative Commons Attribution (CC BY) license.