


Abstract
Regional electricity interconnections are increasingly recognised as enablers of cost-effective power system expansion, resilience and energy security in emerging economies. In East Africa, Kenya and neighbouring countries, namely Tanzania, Ethiopia, and Uganda, operate relatively low-carbon electricity systems; however, rapidly growing electricity demand and expanding thermal generation are placing upward pressure on grid emissions intensity. This study examines whether planned cross-border interconnections can mitigate this trajectory using OSeMOSYS Global v1.0.0, an open-source least-cost capacity expansion model, comparing stand-alone national power systems against an interconnected regional grid over 2022–2045. Results show that interconnection enables access to low-cost renewable electricity and facilitates surplus generation exports, maintaining system-wide carbon intensity within climate finance eligibility thresholds of 100 gCO2/kWh. Outcomes are heterogeneous: Ethiopia and Kenya incur cost increases (+USD 481 million and +USD 568 million, respectively) attributable to transmission capital expenditure, whereas Tanzania and Uganda achieve net cost savings (−USD 590 million and −USD 891 million) alongside substantial emissions intensity reductions of 141.9 and 280.5 gCO2/kWh, respectively. Regional emissions equity is preserved, with modest intensity increases in Ethiopia and Kenya offset by large reductions elsewhere. These findings strengthen the case for climate-financed regional transmission as a scalable and equitable mitigation strategy in East Africa.
1. Introduction
Electricity transmission infrastructure is a cornerstone of the global clean energy transition, enabling renewable integration, reducing energy poverty, and supporting sustainable development in emerging markets and developing economies (EMDEs) [1,2,3,4]. The IPCC’s AR6 mitigation assessment similarly emphasises deep power-sector decarbonisation within broader energy-system transitions that require system integration and infrastructure [5]. Complementing this, IRENA’s grid-integration work highlights that high shares of variable renewables require flexibility options, explicitly including interconnections and regional markets as flexibility providers [6].
Interconnected markets allow countries to export surplus renewable electricity and import during periods of shortfall, improving market efficiency and lowering consumer electricity costs [7]. The urgency of this transformation is underscored by the scale of unmet electricity demand across sub-Saharan Africa, where hundreds of millions of people lack reliable access to electricity and where demand is projected to grow rapidly over the coming decades [8].
There is a clear need for strong regional co-ordination, as integrating variable renewables, wind, solar, and hydro increasingly relies on robust grid interconnections and storage. Regional power links allow countries to balance complementary resources: hydro-rich neighbours can supply baseload or peaking power when solar or wind output is low. In East Africa, the Eastern Africa Power Pool (EAPP) aims to coordinate these flows among member states, with the general purpose of facilitating regional power trade through access to cheaper power from, and export of excess power to, neighbouring countries [9].
Despite growing consensus on the value of regional electricity trade for decarbonisation and energy access in sub-Saharan Africa, policymakers and climate-finance institutions lack country-differentiated, quantitative evidence on how the costs and benefits of specific planned interconnections are distributed across participating nations. This asymmetry of evidence creates a barrier to the cost-sharing negotiations and climate-finance mobilisation that regional integration requires, a need addressed by this study.
In practice, this means that Kenya can tap low-cost hydropower from Ethiopia while selling surplus geothermal and wind generation to its neighbours. Kenya’s policy context also underscores the importance of regional trade. The draft National Energy Policy 2025–2034 targets universal electricity access (100% by 2030) and steers the sector toward clean, renewable-based expansion [10]. Recent regulations, including the Energy Act 2019 and the Energy (Net-Metering) Regulations 2024, create a conducive environment for decentralised renewables and allow consumers with systems up to 1 MW to feed excess power back to the grid [11]. Against this backdrop, expanding regional interconnections represents a potentially transformative lever for the country’s electricity system.
The economic case for regional electricity cooperation is well established in the academic literature. Cross-border power trade reduces system costs by enabling countries to exploit differences in resource endowments, smooth demand variability, and avoid redundant capacity investment. A widely cited synthesis of international experience highlights that regional electricity market integration can deliver net welfare gains when supported by appropriate regulatory frameworks and governance structures, drawing on lessons from established power pools in West Africa, Southern Africa, and Central America [12]. While individual country-level energy planning studies are common, they are often not well-suited to the specific challenges faced by low-and middle-income countries [13]. Comparative regional assessments that quantify the differential impacts of interconnection across multiple countries remain scarce [14,15,16].
However, realising these benefits in practice requires navigating substantial obstacles, including regulatory fragmentation, financing barriers, grid code incompatibilities, and the technical challenges of integrating variable renewable energy at scale that introduce uncertainty into projected outcomes and have been documented across both European and developing-country power systems [12,16].
While prior studies have assessed aggregate regional trade benefits within the EAPP, notably Remy & Chattopadhyay [17], who quantify system-wide cost and emissions gains from deeper trade, country-differentiated analysis of how interconnection costs and benefits are distributed across individual member states remains limited. No existing study simultaneously quantifies the national-level cost, emissions, and generation-mix implications of planned interconnections across selected EAPP countries, namely, Kenya, Ethiopia, Uganda, and Tanzania, within a single internally consistent modelling framework. Whether interconnection can bring national emissions intensities within internationally recognised eligibility thresholds, a critical climate-finance dimension for this corridor, has not been examined. This study addresses these gaps through a fully open-source, reproducible comparative analysis that explicitly disaggregates regional outcomes by country, providing the distributional evidence base that regional cost-sharing negotiations and climate-finance mobilisation require.
This paper addresses that gap by examining the impacts of planned cross-border electricity interconnections among Kenya, Ethiopia, Uganda, and Tanzania. The study compares two configurations: a ‘No Transmission’ (NoTRN) scenario, in which each country plans and operates its power system independently without building any new interconnectors, and a ‘Transmission’ (TRN) scenario, in which the model is allowed to invest in new transmission infrastructure. Both scenarios are assessed over the period 2022 to 2045 across four dimensions: total installed capacity, annual electricity generation, system cost, and greenhouse gas emissions. The key research question is: (i) How does the ‘Transmission’ scenario affect total system costs in each country relative to the ‘No Transmission’? (ii) What are the emissions implications of interconnection, both nationally and regionally? (iii) How does moving from the ‘No Transmission’ to the ‘Transmission’ scenario reshape the generation mix and capacity portfolio? (iv) What role does cross-border electricity trade in the ‘Transmission’ scenario play in enabling a low-carbon transition?
The contribution of this study is threefold. First, it provides a country-differentiated quantification of how planned interconnection costs and emissions benefits are distributed across Kenya, Ethiopia, Uganda, and Tanzania simultaneously within a single internally consistent framework that aggregate regional assessments cannot supply. Second, it introduces a climate-finance eligibility lens to the East African interconnection debate, directly benchmarking national emission intensity trajectories against recognised thresholds to assess whether transmission investment qualifies as a climate mitigation asset. Third, by archiving all scenario configurations, input data, and model outputs in a public repository, it establishes a fully reproducible open-source baseline for this corridor that future studies can extend, stress-test, or adapt.
2. Materials and Methods
2.1. Study Region
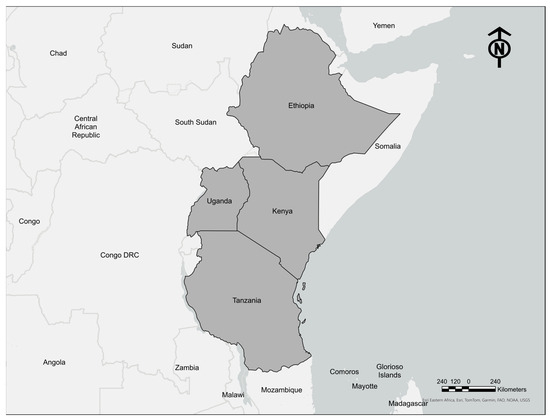
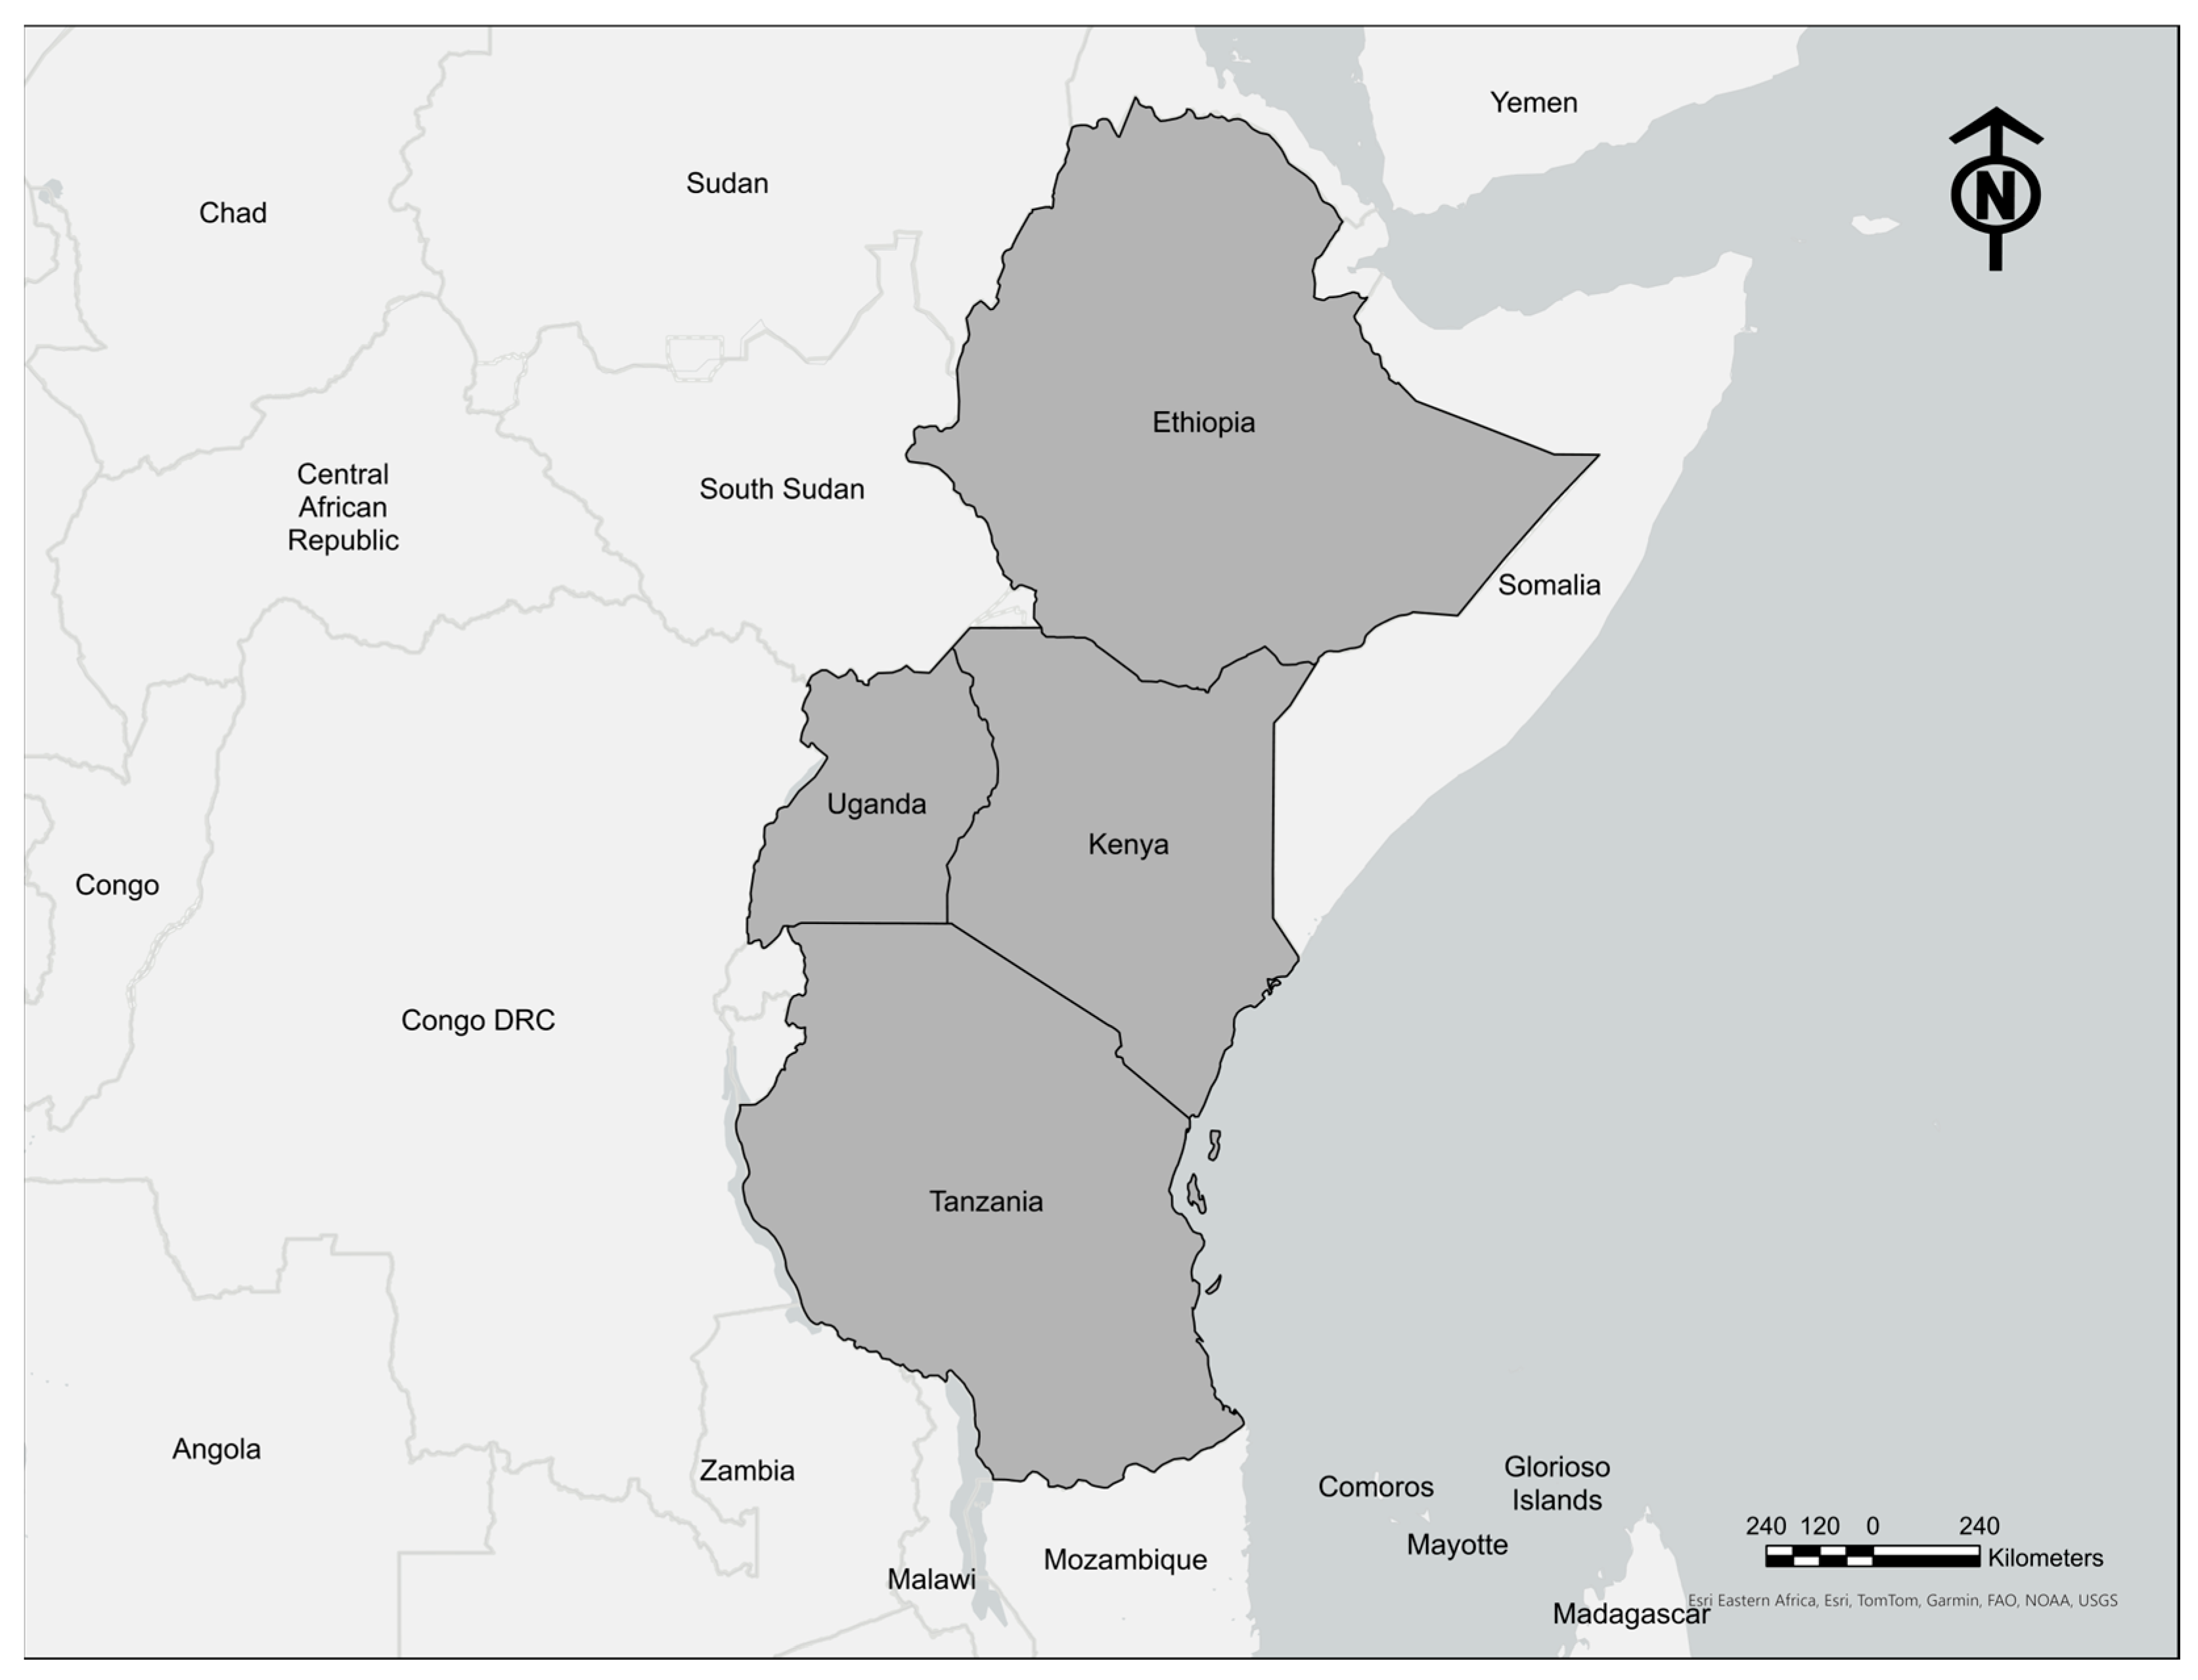
Kenya sits at the centre of a physically contiguous power-trading region in East Africa, with existing and planned electricity interconnectors linking its grid to those of fellow EAPP members Ethiopia, Uganda, and Tanzania. Figure 1 presents the study area.
Figure 1.
Study region showing the four modelled countries (shaded in grey): Ethiopia, Kenya, Tanzania, and Uganda.
The analysis is intentionally scoped to these four countries rather than the full thirteen EAPP member states for three reasons. First, Kenya, Ethiopia, Uganda, and Tanzania are the countries with the most developed existing physical interconnection infrastructure and the most advanced planned corridor investments, making them the near-term operational core of regional trade in East Africa. The countries are linked by existing and planned high-voltage transmission lines. The Ethiopia-Kenya line (the Suswa-Addis corridor) and the Kenya-Tanzania line (Isinya-Singida) represent the primary interconnectors, with the Kenya-Uganda corridor providing an additional link. These lines form the backbone of the EAPP’s planned regional grid, and their expansion is central to the regional energy transition.
These four countries have complementary generation profiles: Ethiopia possesses a large hydropower surplus providing low-cost baseload; Kenya operates a geothermal-dominated system with scope for both import and re-export; Tanzania has a mixed portfolio of natural gas and new hydro capacity; and Uganda exports surplus hydro. This complementarity creates a strong economic rationale for regional integration, as surplus low-carbon generation in one country can displace higher-cost or higher-emission generation elsewhere.
Second, the remaining EAPP members, including Sudan, South Sudan, Somalia, Rwanda, Burundi, the Democratic Republic of the Congo, Eritrea, and Djibouti, have limited grid infrastructure and lack integration into the regional power pool. Third, the four-country scope enables a tractable, reproducible analysis that can serve as a documented baseline for incremental expansion to additional members in future work.
2.2. OSeMOSYS Global
The analysis employs OSeMOSYS Global v1.0.0 [17], an open-source, open-data electricity system model generator built on the Open Source Energy Modelling System (OSeMOSYS) framework. OSeMOSYS Global automates the construction of country and regional electricity system models, performing least-cost capacity expansion planning to identify the optimal combination of new generation, storage, and transmission investments to meet projected electricity demand at minimum total system cost over a multi-decade planning horizon. The model simultaneously optimises capacity investment, generation dispatch, and cross-border electricity trade, enabling self-consistent evaluation of the economic and environmental value of regional interconnections. The OSeMOSYS Global v1.0.0 codebase is publicly available at https://github.com/OSeMOSYS/osemosys_global accessed on 6 May 2026.
For this study, the OSeMOSYS Global repository was cloned and configured for the four-country East African system. The scenario configuration files, input data, and results used in this analysis are archived in a dedicated public repository at https://github.com/jeenogeorge/Applications_OG accessed on 6 May 2026, enabling full reproducibility of the results presented here. The scenario configuration files, input data, and results used in this analysis are archived in the k_t_e_u_baseline_Individuals branch.
The four countries were modelled over the period 2022 to 2050, with the analysis reported here covering 2022 to 2045 to avoid the well-documented end-of-horizon effect, whereby the absence of future periods beyond the model’s terminal year causes the optimiser to systematically underinvest in long-lived assets in the final years of the planning horizon, producing results that are not representative of least-cost system behaviour [18]. The temporal resolution comprises 24 time slices per year, defined by four seasons (S1: January–February; S2: March–May; S3: June–September; S4: October–December) and six daily time segments of four hours each, capturing seasonality and diurnal variation in renewable output and electricity demand. The six daypart structure was designed to explicitly separate solar generation hours (D3–D4), demand peak hours (D5), morning ramp (D2), and overnight periods (D1 and D6), ensuring that the model captures the most decision-relevant temporal contrasts for VRE integration. A 10% reserve margin was applied from 2030 onwards to ensure system adequacy. Technologies excluded from new investment in all scenarios include coal, oil, open-cycle gas, nuclear, and offshore wind, reflecting the resource endowments and policy environments of the study countries.
Transmission data, existing and planned, were integrated from the Global Transmission Database [19,20]. Technology costs, fuel prices, and operational parameters are based on the default values embedded in OSeMOSYS Global, which draw on internationally recognised sources, including IRENA and the IEA. Carbon emissions are calculated endogenously by applying technology- and fuel-specific emission factors to modelled technology activity and associated fuel use across timeslices and years. Total annual emissions are obtained by aggregating these values. Emission intensity can be derived ex post by dividing total annual CO2 emissions by total annual electricity generation. Emission factors are typically based on IPCC default values or similar standard datasets, as implemented in the OSeMOSYS Global default data.
Minimum generation constraints were applied to key technologies in the early model years to calibrate model outputs against observed historical generation, including wind generation in Kenya and hydropower in Ethiopia and Uganda, consistent with reported installed capacity and historical dispatch data. Availability factors were further adjusted at the country and technology level to reflect known operational constraints, seasonal hydrology, and capacity utilisation patterns, particularly for hydropower, geothermal, gas, and solar technologies across the four countries. Validation figures for generation and capacity from the calibrated model, benchmarked against IEA, IRENA, and EMBER for available years from 2022, are at the following link: https://github.com/jeenogeorge/Applications_OG/blob/k_t_e_u_baseline_Individuals/validation.zip accessed on 6 May 2026.
2.3. Scenario Design
The study adopts a single electricity demand pathway, referred to hereafter as the Baseline case, consistent with each country’s current development trajectory. The Baseline case assumes a continuation of prevailing trends, incorporating moderate GDP growth, ongoing population increase, and gradual electrification broadly consistent with each country’s national energy targets. Electricity demand profiles in OSeMOSYS Global are generated by combining regression-based projections of annual demand linked to GDP per capita and urbanisation rates with historical load shapes distributed across representative time slices [17,21], providing a plausible and internally consistent demand trajectory for each country over the modelling horizon.
Within the Baseline case, two transmission configurations are evaluated. The No-Planned-Transmission scenario (hereafter NoTRN) represents a stand-alone configuration in which no new cross-border interconnector projects are constructed beyond existing infrastructure, and each country’s power system is therefore optimised independently with no access to regional electricity trade beyond residual existing interconnector capacity. The Planned-Transmission scenario (hereafter TRN) allows the model to invest in new transmission infrastructure along the corridors as described in the Global Transmission Database [19,20]. Within each scenario, the model endogenously determines the optimal generation mix, storage deployment, and cross-border trade pattern, choosing future investments and regional electricity flows to minimise total system cost subject to meeting demand and all technical constraints. Transmission investment costs are allocated to the country in whose territory the infrastructure is located; for cross-border corridors, costs are split at the national boundary, with each country bearing the capital cost of its domestic segment.
3. Results
This section presents the modelling results for the four-country East African system over the period 2022 to 2045. Results are organised around four dimensions: total installed generation capacity, annual electricity generation and demand, the differential impact of planned transmission on system costs and emissions, and cross-border electricity trade flows. In each case, results are compared across the No-TRN and TRN scenarios to isolate the contribution of planned regional interconnection to system outcomes in Kenya, Ethiopia, Tanzania, and Uganda.
3.1. Total Installed Capacity
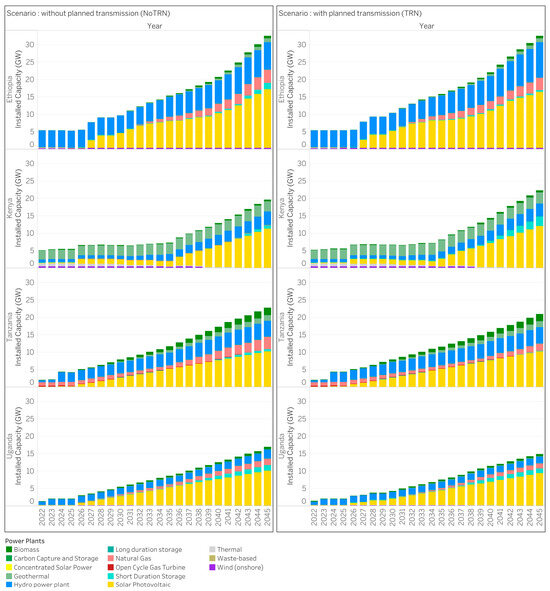
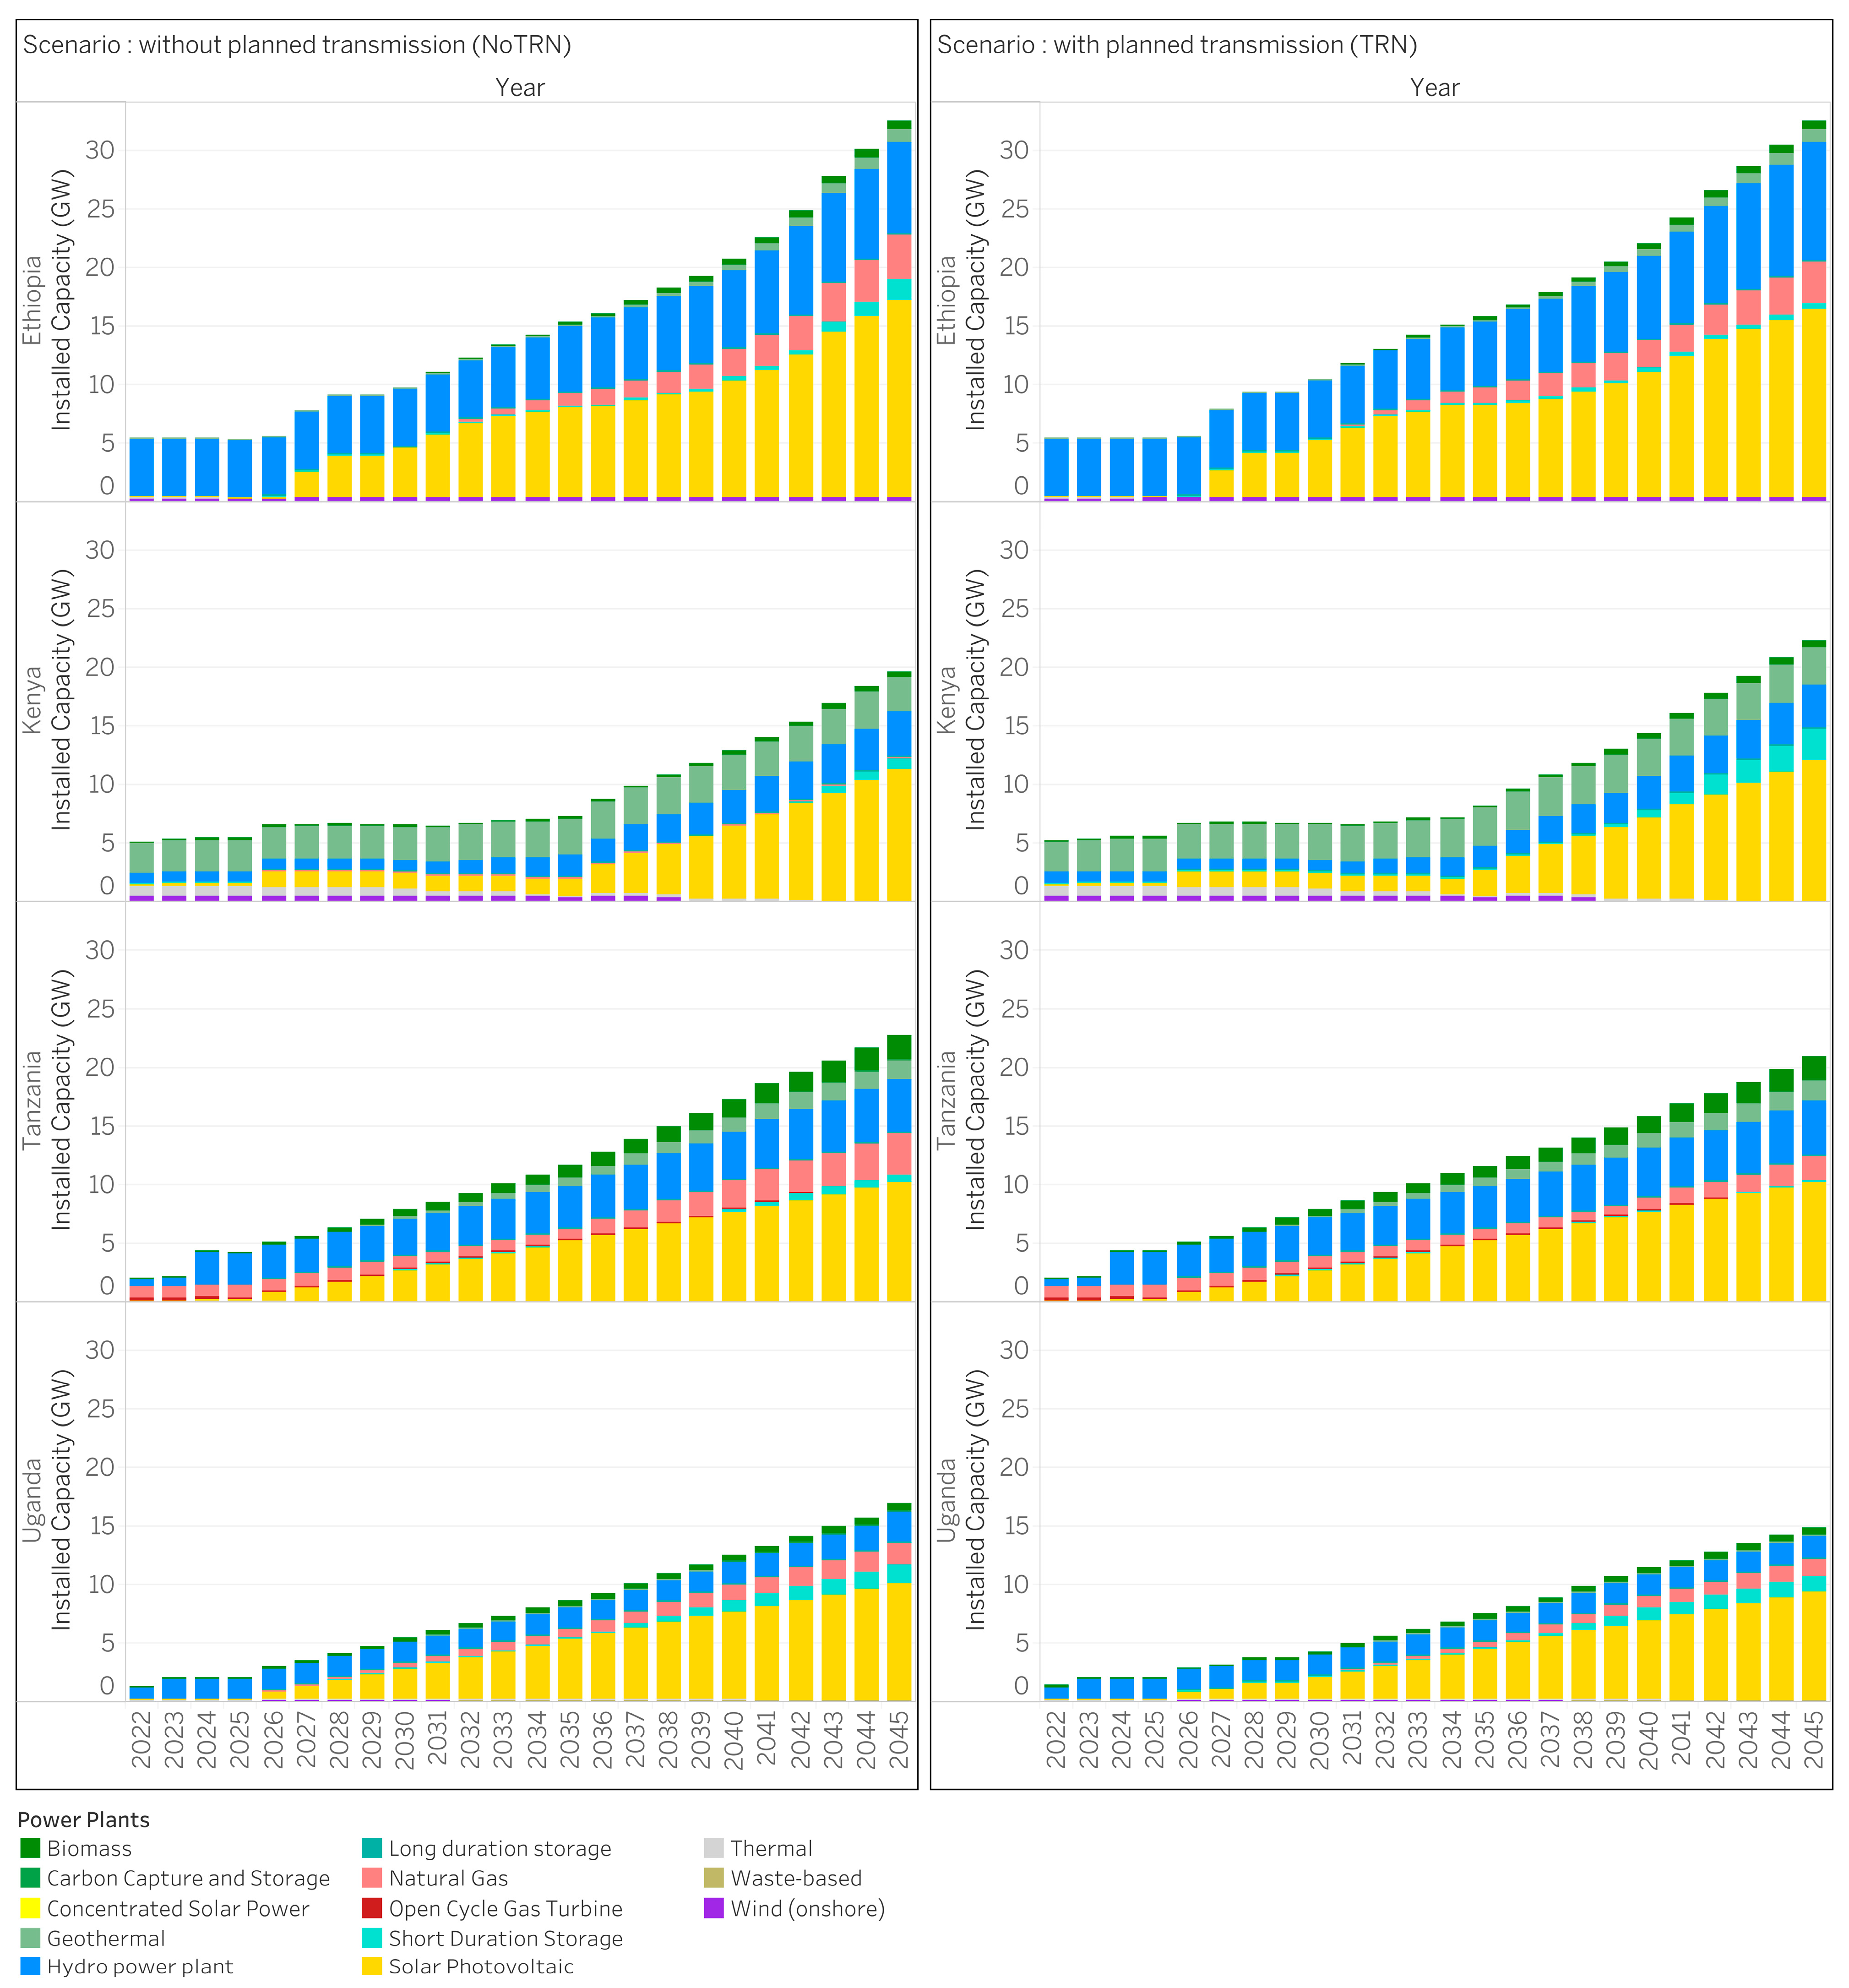
Figure 2 shows the total installed generation capacity by technology and country over the period 2022 to 2045, comparing the NoTRN and TRN scenarios.
Figure 2.
Total installed generation capacity (GW) by technology and country, 2022–2045, without and with planned transmission.
Under the NoTRN scenario, all four countries expand capacity substantially over the modelling horizon driven by domestic resource endowments. In Kenya, solar PV emerges as the dominant new technology from the late 2020s, with the total installed capacity growing from approximately 4 GW in 2022 to around 18 GW by 2045, with solar PV accounting for approximately 10 GW of this total, complemented by continued geothermal and hydro investments. Ethiopia’s installed capacity grows from 5 GW in 2022 to approximately 32 GW by 2045, the largest absolute expansion of the four countries, with hydropower remaining the backbone of the system and solar PV contributing a growing share from the mid-2030s. Tanzania expands from approximately 2 GW to around 19 GW by 2045 through a mixed portfolio of hydro, biomass, and solar PV, with combined cycle gas retaining a significant share in the absence of regional imports. Uganda’s system grows from roughly 1 GW to approximately 13 GW, remaining predominantly hydro-based with increasing solar PV additions in the later years.
Under the TRN scenario, capacity trajectories are broadly similar to NoTRN but with modest differences in technology composition driven by access to regional electricity trade. Kenya’s total installed capacity reaches approximately 22 GW by 2045, with solar PV accounting for approximately 12 GW. Ethiopia’s capacity reaches approximately 32 GW by 2045, with hydropower remaining the backbone of the system. Tanzania’s total capacity reaches around 21 GW by 2045, with a notable reduction in combined cycle gas relative to NoTRN. Uganda’s installed capacity grows to approximately 15 GW, with a broadly similar technology mix to NoTRN but with reduced oil-based generation offset by increased hydro and wind additions enabled by access to regional trade. Across all four countries, the optimisation endogenously selects short-duration storage alongside VRE deployment where economically justified under both scenarios.
3.2. Electricity Generation and Demand
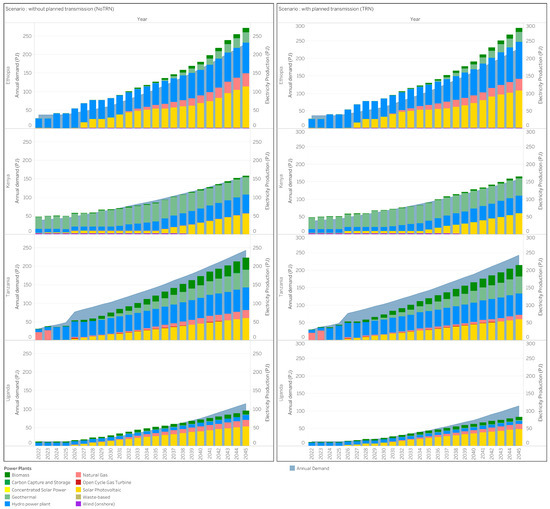
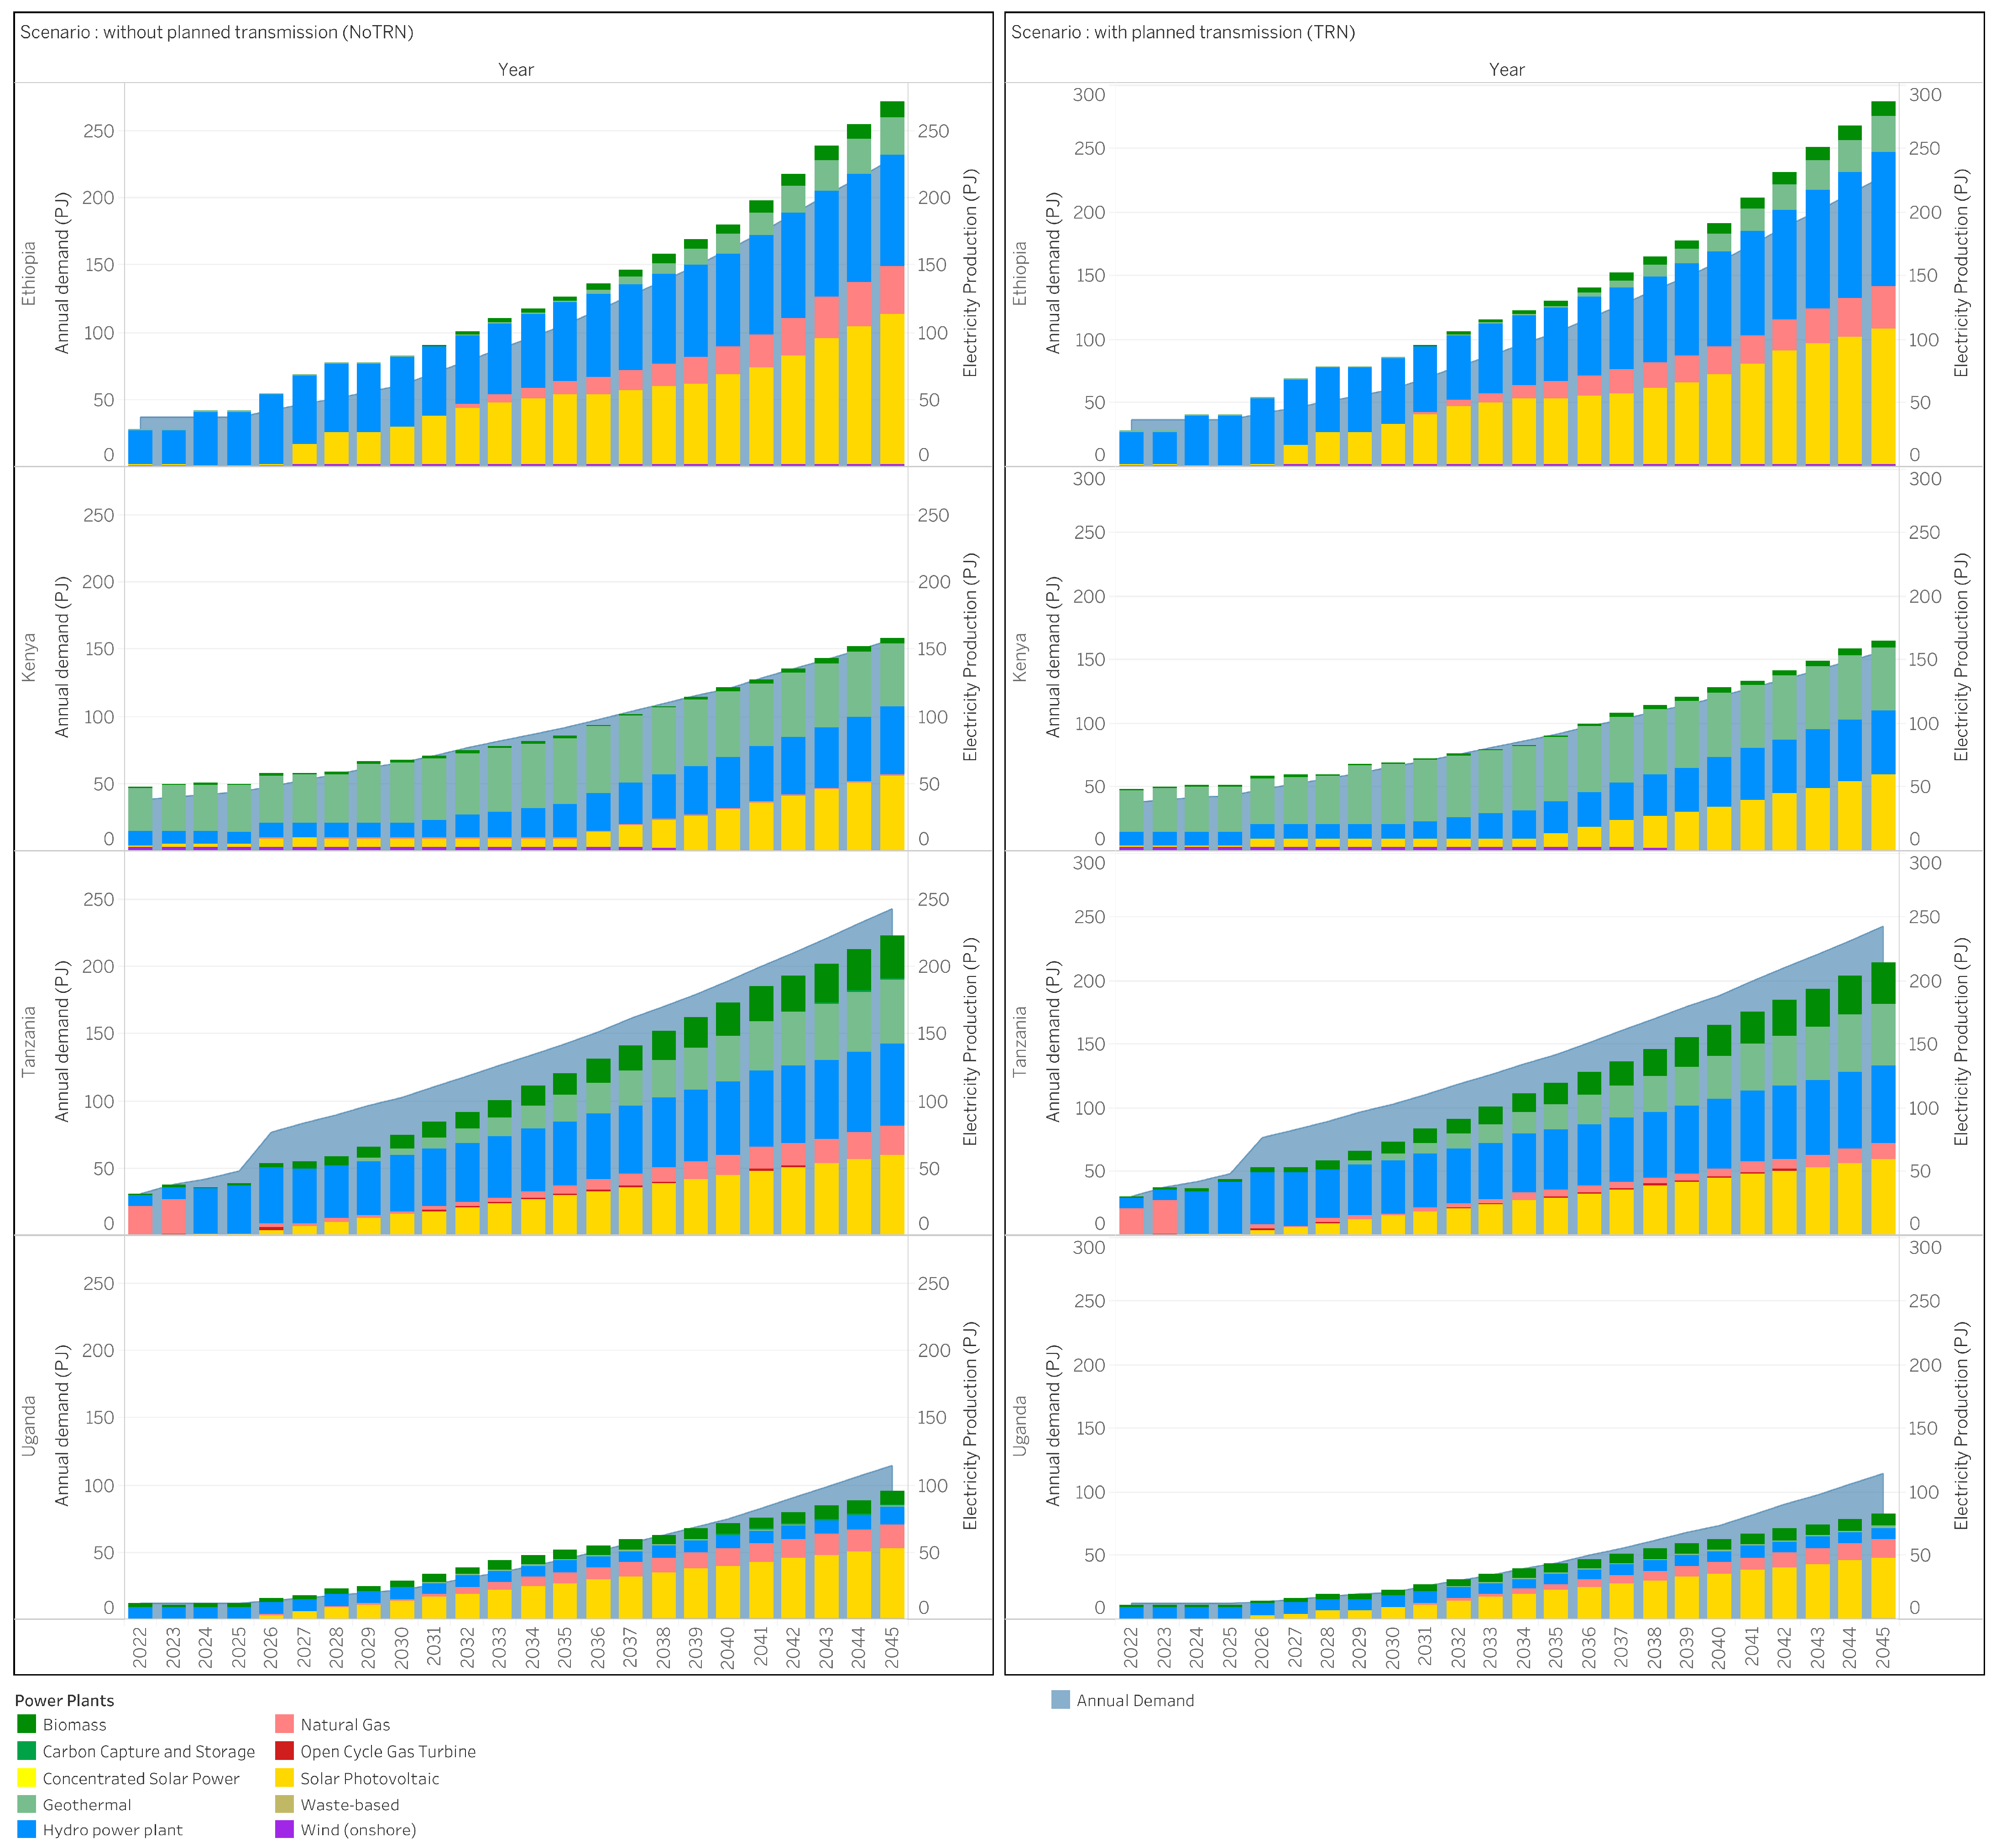
Figure 3 presents total annual electricity generation disaggregated by technology and country for both the NoTRN and TRN scenarios, alongside the projected electricity demand trajectory shown as the grey shaded area. Where the demand area exceeds the generation bars, the country is a net importer of electricity in that period; where generation bars exceed the demand area, the country is a net exporter. In all four countries and under both scenarios, the combination of domestic generation and cross-border trade successfully meets electricity requirements across the planning horizon.
Figure 3.
Annual electricity generation by technology and country compared to projected demand, 2022–2045, with planned transmission.
Under the NoTRN scenario, each country’s generation mix reflects its domestic resource endowment. In Ethiopia, hydropower dominates the horizon, with total annual generation growing from approximately 30 PJ in 2022 to around 220 PJ by 2045 as demand expands; solar PV and wind contribute a growing but secondary share from the mid-2030s, with biomass providing a modest contribution in later years. Kenya’s generation grows from approximately 50 PJ to around 160 PJ by 2045, anchored by geothermal providing stable baseload throughout the period, complemented by hydro, solar PV, and a small but visible natural gas contribution in the middle years. Tanzania’s generation profile is the most structurally distinct under NoTRN; demand grows sharply from approximately 35 PJ in 2022 to around 240 PJ by 2045, met through a combination of hydro, biomass, and a substantial and growing natural gas share that increases visibly from the late 2020s onwards as domestic gas-fired generation is deployed to meet rising demand in the absence of regional imports. Uganda’s generation grows from approximately 10 PJ to around 100 PJ by 2045, with hydropower dominant in early years but solar PV growing rapidly from the mid-2030s to become the largest generation source by the early 2040s, supplemented by a small biomass contribution.
Under the TRN scenario, the generation mix is broadly similar to NoTRN for Ethiopia, Kenya, and Uganda, but with a notable structural difference in Tanzania. Ethiopia’s generation profile under TRN closely resembles NoTRN in technology composition; hydropower remains dominant, but total generation exceeds domestic demand in later years as Ethiopia produces surplus electricity for regional export via the Ethiopia–Kenya corridor. Kenya’s generation mix under TRN is visually near identical to NoTRN, reflecting Kenya’s role as a transit hub that both imports from Ethiopia and exports onwards to Tanzania and Uganda, with domestic generation composition largely unchanged. The most pronounced difference between scenarios occurs in Tanzania, where the natural gas share visible under NoTRN is substantially reduced under TRN; regional imports from Kenya displace the need for domestic gas-fired generation, with total generation remaining sufficient to meet Tanzania’s growing demand but with a cleaner technology mix. Uganda’s generation profile under TRN is broadly similar to NoTRN in technology composition, being hydro-dominated in early years transitioning to solar PV-led by the early 2040s with the gap between domestic generation and the demand area in later years indicating a consistent net import position.
3.3. Impact of Planned Transmission on System Costs, Emissions, and Capacity
The results reveal heterogeneous distribution of costs and benefits across the four countries. While Tanzania and Uganda realise net system cost savings, Ethiopia and Kenya experience cost increases associated with transmission investment. This asymmetry reflects the structure of the regional power system: countries that are well-positioned as net exporters or importers of low-cost electricity capture the largest operational savings, while those that bear the capital costs of new transmission infrastructure may see higher near-term system costs. These distributional effects have important implications for the design of cost-sharing mechanisms and the political economy of regional integration, which are addressed in Section 4.
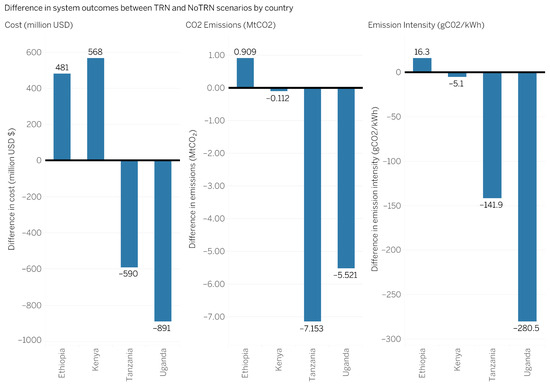
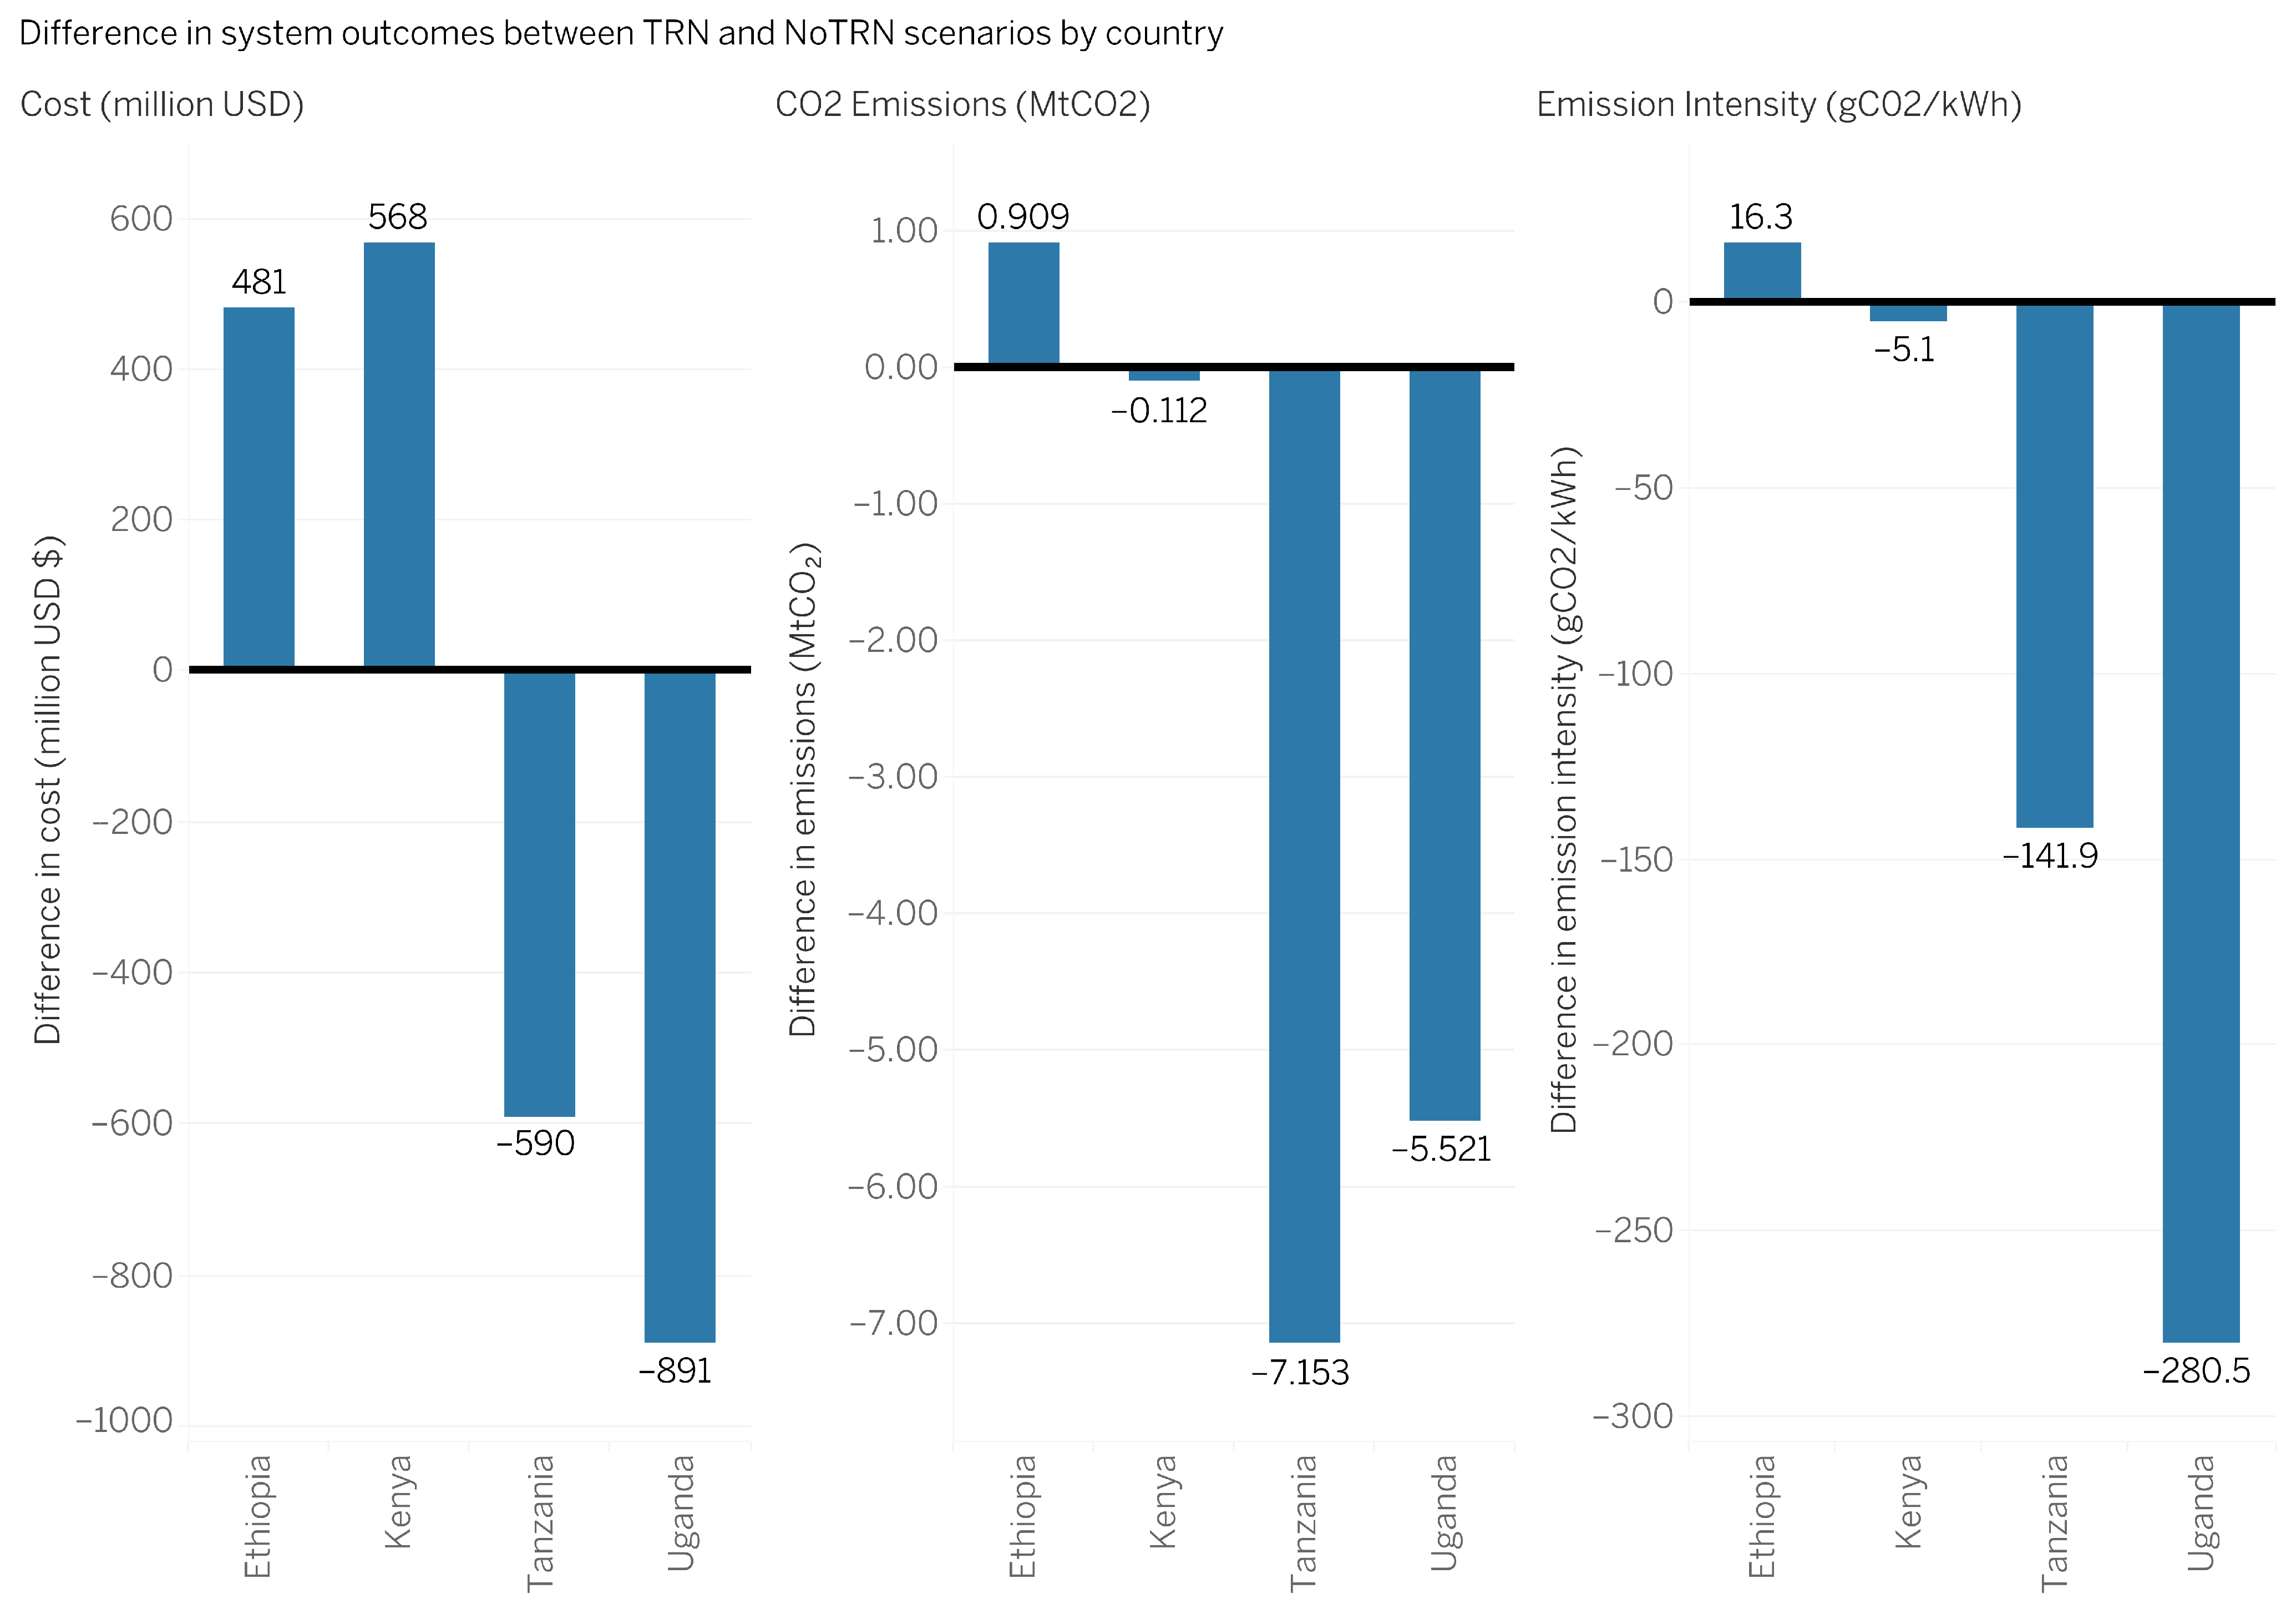
Figure 4 presents the difference in total system cost, CO2 emissions, and emission intensity between the planned transmission and no-planned-transmission scenarios (delta = TRN minus NoTRN) for each country. A positive value indicates that planned transmission leads to a higher outcome; a negative value indicates that interconnection reduces that outcome.
Figure 4.
Difference in cumulative system cost (left), total CO2 emissions (centre), and average emission intensity (right) between the planned transmission and no-planned-transmission scenarios by country.
The results reveal a heterogeneous pattern. Ethiopia and Kenya experience higher total system costs under planned transmission (+USD 481 million and +USD 568 million, respectively), reflecting the capital expenditure associated with new cross-border transmission infrastructure. In contrast, Tanzania and Uganda realise net cost savings of approximately USD 590 million and USD 891 million, respectively, arising from improved access to lower-cost generation from neighbouring countries.
The emissions pattern is similarly differentiated. Ethiopia experiences a modest increase in total CO2 emissions (+0.91 Mt), whereas Kenya records a small reduction (−0.11 Mt). The most substantial emissions reductions occur in Tanzania (−7.15 Mt) and Uganda (−5.52 Mt), reflecting the displacement of higher-emission domestic generation by lower-carbon imports. Emission intensity changes follow a consistent pattern: Ethiopia sees a modest increase (+16.3 gCO2/kWh) while Tanzania and Uganda record large reductions of −141.9 and −280.5 gCO2/kWh, respectively.
As seen in Table 1, in both scenarios, the average emission intensities are well below typical climate-finance eligibility thresholds of 100 gCO2/kWh [22]. Kenya’s emission intensity change is negligible in absolute terms, as its power system is already near zero-carbon under the no-planned-transmission scenario with an average intensity of 0.21 gCO2/kWh, meaning interconnection has little further effect on its emissions profile.
Table 1.
Average and Sum of Emission Intensity in NoTRN and TRN Scenarios for the countries.
3.4. Changes in Generation Mix and Installed Capacity
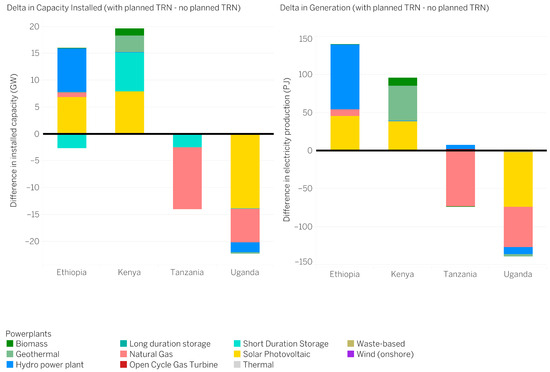
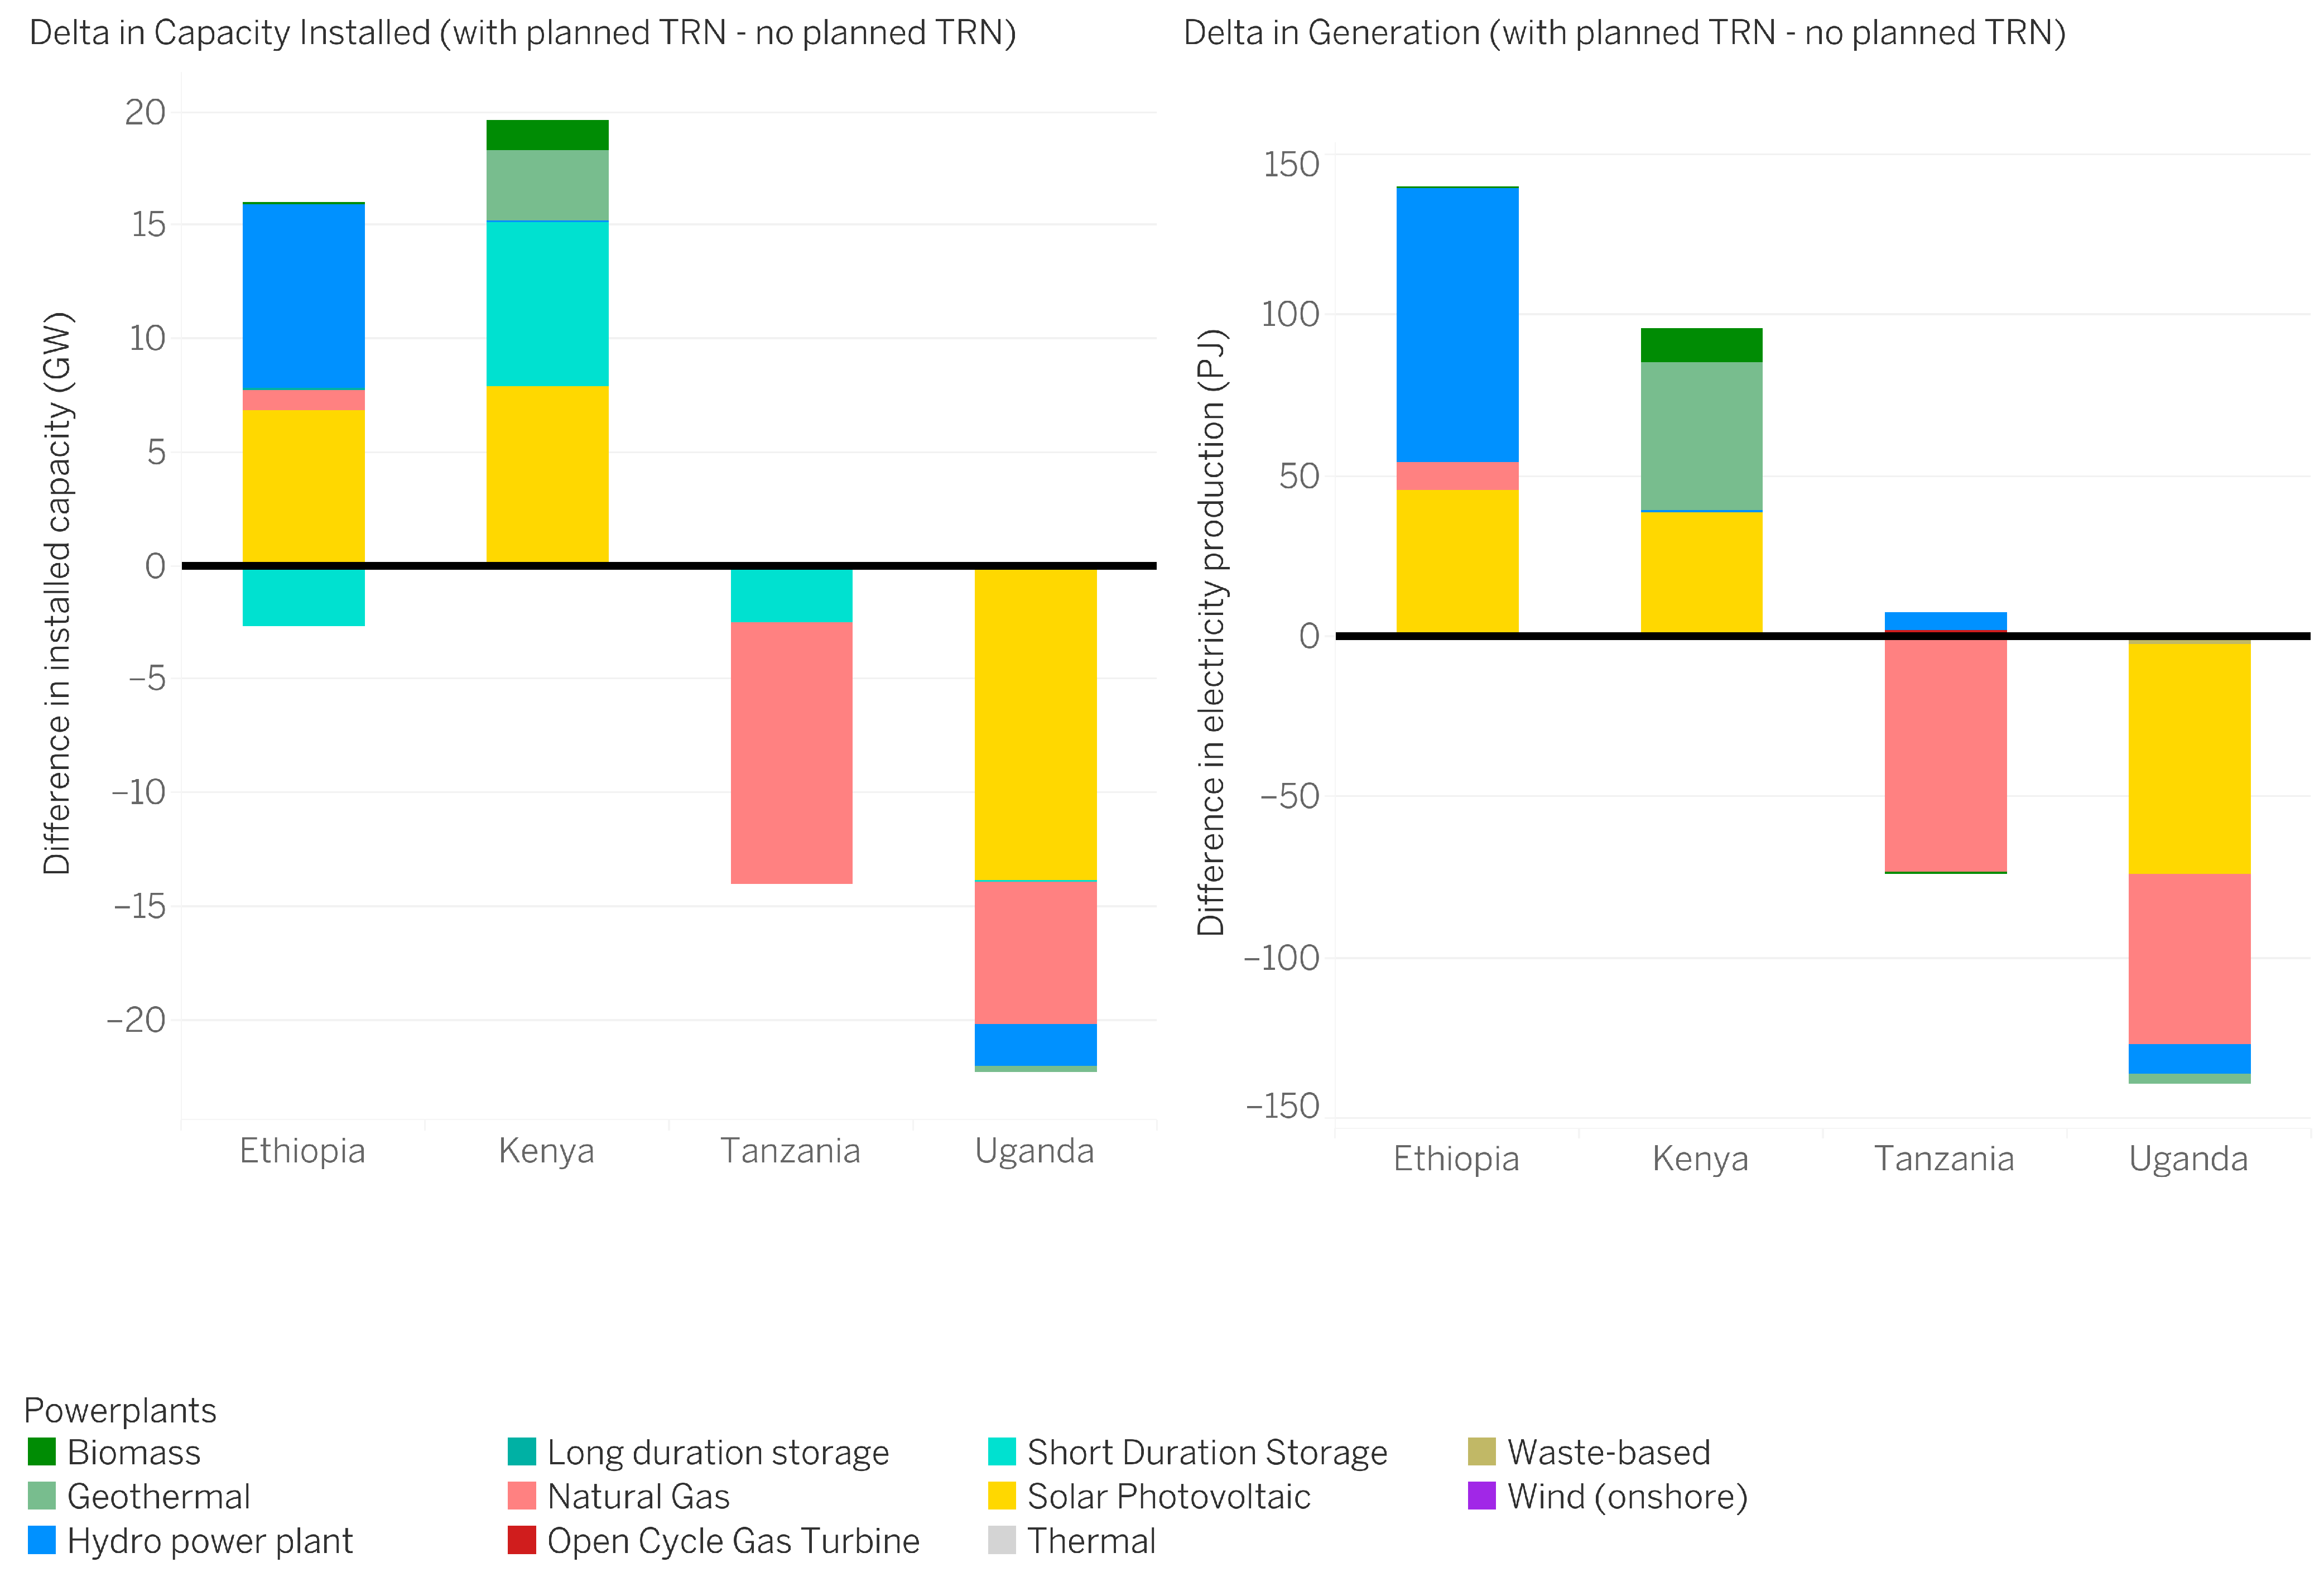
Figure 5 decomposes the delta in installed capacity (left panel) and annual electricity generation (right panel) by technology type for each country, illustrating how interconnection reshapes the domestic generation portfolio relative to the stand-alone case.
Figure 5.
Difference in total installed capacity (GW, left) and annual generation (PJ, right) by technology between the planned transmission and no-planned-transmission scenarios by country.
In Ethiopia and Kenya, interconnection leads to positive changes in both capacity and generation, driven primarily by increases in hydropower and solar PV. Both countries expand their low-carbon generation capacity under interconnection to serve regional demand in addition to domestic needs. Tanzania exhibits a notable reduction in combined cycle gas capacity and generation, as imports from neighbouring countries displace the need for domestic gas-fired generation, the primary driver of Tanzania’s cost savings and emissions reductions. Uganda shows reductions in oil-based generation (PWROIL) offset by increased hydro and wind additions.
3.5. Cross-Border Trade Flows
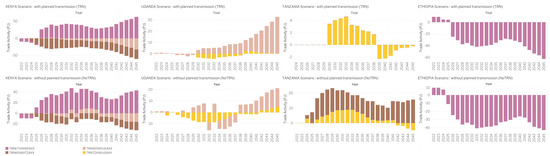
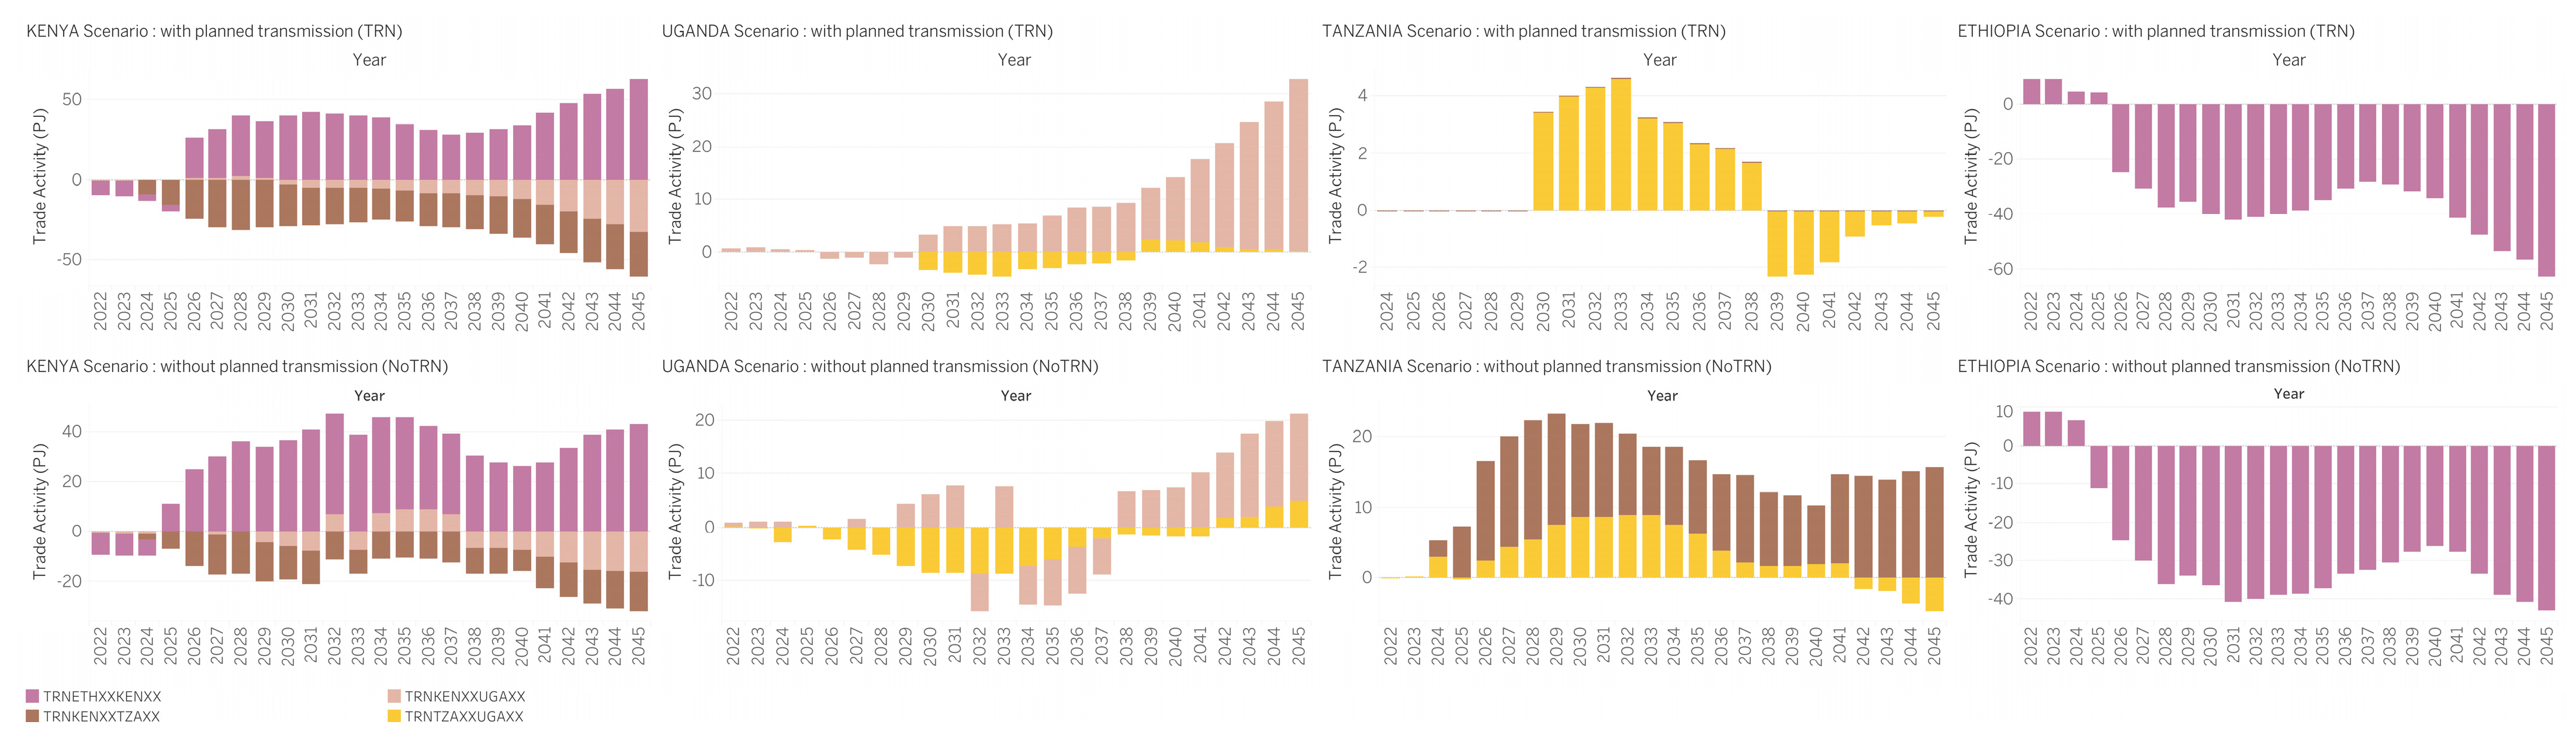
Figure 6 presents the annual trade activity (PJ) for each country under both scenarios over 2022 to 2045. Positive values indicate net electricity imports; negative values indicate net exports.
Figure 6.
Annual trade activity (PJ) for Kenya, Uganda, Tanzania and Ethiopia, 2022–2045, for planned and unplanned transmission scenarios.
Ethiopia is a consistent net exporter throughout the modelling period under both scenarios, as shown by the predominantly negative (below-zero) bars in Ethiopia. Under the NoTRN scenario, Ethiopia exports primarily to Kenya via the TRNETHXXKENXX corridor, with export volumes growing steadily from around 10 PJ in the early 2020s to approximately 40 PJ by 2045 as its hydropower capacity expands. Under the TRN scenario, Ethiopia’s export role intensifies further, with exports to Kenya reaching approximately 60 PJ by 2045, reflecting Ethiopia’s position as the region’s primary low-cost hydropower supplier. Kenya’s trade profile highlights its role as a regional transit hub. Under both scenarios, Kenya simultaneously imports from Ethiopia (negative bars on the Ethiopia-Kenya corridor, appearing as positive imports in the Kenya panel) while exporting to Tanzania and Uganda (negative bars in the Kenya panel on the Kenya-Tanzania and Kenya-Uganda corridors). This import-and-re-export pattern becomes more pronounced under the TRN scenario, with Kenya’s gross exports to Tanzania and Uganda growing substantially through the 2030s and 2040s. Tanzania’s trade pattern differs markedly between scenarios. Under the NoTRN scenario, Tanzania records consistent positive (import) activity via the Kenya-Tanzania corridor throughout the period, reaching around 20–25 PJ by the early 2030s before declining. Under the TRN scenario, Tanzania’s import volumes from Kenya increase substantially, reflecting improved access to low-cost regional generation. The Tanzania-Uganda corridor (TRNTZAXXUGAXX) shows limited activity in both scenarios. Uganda is a net importer under both scenarios, with imports arriving primarily via the Kenya-Uganda corridor (TRNKENXXUGAXX). Under the NoTRN scenario, import volumes are modest, growing from near zero to approximately 20 PJ by 2045. Under the TRN scenario, Uganda’s imports grow more rapidly, reaching approximately 30 PJ by 2045, reflecting the expanding role of regional trade in meeting Uganda’s growing electricity demand.
4. Discussion
4.1. Interpretation of Key Findings
The heterogeneous distribution of costs and benefits, with Tanzania and Uganda realising net savings while Ethiopia and Kenya incur cost increases, reflects the structure of the regional power system, in which countries best positioned as net exporters or importers of low-cost electricity capture the largest operational savings while those bearing transmission capital costs face higher near-term expenditure. These distributional effects have important implications for cost-sharing mechanisms and the political economy of regional integration. The emissions results confirm that interconnection serves as an effective mitigation instrument [23,24]. These reductions are driven primarily by the displacement of gas-fired combined cycle generation in Tanzania and oil-based generation in Uganda, both replaced by lower-carbon regional imports, a structural transformation that would be substantially more costly and, in some cases, technically infeasible under stand-alone national planning.
The finding that interconnection does not compromise regional emissions equity is particularly significant in the context of climate finance. As shown in Table 1, all four countries maintain average emission intensities well below the 100 gCO2/kWh climate-finance eligibility threshold under both scenarios, confirming that the regional emissions balance is favourable and that transmission investment qualifies as a climate mitigation asset under recognised green finance frameworks [22].
The hydropower dependence of the region also introduces a climate risk dimension that strengthens the case for interconnection beyond its cost and emissions benefits. In Ethiopia and Uganda, hydropower accounts for more than 80% of electricity generation [25], while Tanzania’s hydropower share, though reduced from a peak of 96% in 2003, still represented around one third of total generation in 2021, and Kenya followed a similar trajectory, declining from 77% in 1995 to around 30% in 2021 [26], a reduction driven by geothermal and wind expansion rather than any absolute decline in hydro capacity. In East Africa, more frequent heavy precipitation events and prolonged droughts are projected to increase interannual variability and uncertainty in hydropower generation [25]. Between October 2020 and early 2023, the region experienced five consecutive failed rainy seasons, the worst drought in 40 years, directly curtailing hydropower output and forcing costly thermal backup [27]. Even Nile Basin countries that may benefit from increased average annual hydropower output under some climate scenarios are likely to face growing inter-annual variability under higher warming trajectories [25]. Regional interconnection therefore provides not only a cost and emissions benefit but also a meaningful hedge against the climate-driven hydrological risk faced by any single country operating in isolation.
4.2. Policy Implications
The heterogeneous distribution of costs and benefits raises a fundamental political economy challenge: Ethiopia and Kenya whose cooperation is most essential as the primary generation surplus country and regional transit hub are precisely the countries that incur net cost increases, creating a collective action problem where they bear the capital costs of enabling others’ savings. This asymmetry is structurally amenable to cooperative game-theoretic cost allocation under a Shapley value framework, the total regional net benefit would be allocated in proportion to each country’s marginal contribution across all possible coalition subsets, converting Ethiopia’s and Kenya’s nominal cost increases into net benefits through compensation transfers and providing a mathematically grounded basis for negotiation. A full Shapley computation [28] is identified as a priority for future work, with the cost differentials reported here directly providing the required coalition values. Regional bodies such as the EAPP, supported by multilateral development banks, have a critical role in translating such frameworks into operational arrangements whether through revenue-sharing agreements, preferential wheeling tariffs, or climate-finance co-investment without which the technically optimal interconnection scenario may remain politically infeasible.
The cost accounting framework requires an important qualification in this context. The model does not capture the export revenues Ethiopia and Kenya would generate through electricity sales and wheeling services to importing neighbours. Ethiopia’s hydropower exports and Kenya’s transmission of third-party electricity would generate revenue streams that offset capital expenditure over the asset lifetime under commercially structured power purchase agreements or wheeling tariffs. Regional bodies such as the EAPP, supported by multilateral development banks, have a critical role in translating cooperative allocation frameworks into operational arrangements through revenue-sharing agreements, preferential wheeling tariffs, or climate-finance co-investment. Absent such arrangements, the technically optimal interconnection scenario may remain politically infeasible.
Regulatory harmonisation across East Africa will be essential to unlock the full value of interconnection. Streamlining wheeling arrangements, market access rules, and grid codes can reduce transaction costs and facilitate commercial power trade. While Kenya’s Energy Act 2019 and Net-Metering Regulations 2024 represent positive steps, sustained progress requires harmonisation at the EAPP level including competitive auctions, interoperable grid codes, and dispute resolution mechanisms for which the Southern African Power Pool (SAPP) offers a relevant institutional template.
The trade flow results confirm that the cost and emissions benefits accruing to Tanzania and Uganda are directly enabled by Ethiopia’s exportable hydropower surplus and Kenya’s transit role. Such structural interdependence underscores the importance of governance arrangements that preserve the incentives of surplus and transit countries to participate in regional trade.
The modelled outcomes presented here should be interpreted as scenario-conditioned planning estimates rather than forecasts of realised outcomes. In practice, realising interconnection benefits requires navigating substantial obstacles, including regulatory fragmentation, financing barriers, grid code incompatibilities, and the technical challenges of integrating variable renewable energy at scale that are not captured in the modelling framework and introduce additional uncertainty beyond the parameters identified in the uncertainty register [12,16].
4.3. Limitations and Future Work
Several limitations should be acknowledged when interpreting these results. The model assumes idealised market operation across borders, whereas real-world deployment faces challenges related to financing, procurement, regulatory alignment, and institutional capacity. The model relies on default OSeMOSYS Global technology cost and performance parameters, which are based on global datasets and may not fully reflect country-specific cost structures, financing conditions, or resource quality variations within each national system. Country-specific financing conditions and Weighted Average Cost of Capital variations which can differ substantially across East Africa, are not captured, and absolute cost figures should therefore be interpreted as indicative rather than definitive. Data limitations are a persistent challenge in energy system modelling for sub-Saharan Africa, where granular, up-to-date, and publicly available data on generation costs, load profiles, and transmission parameters remain scarce.
The model employs 24 representative timeslices per year (4 seasons × 6 four-hour dayparts) against the theoretical maximum of 288 in OSeMOSYS Global. By representing each timeslice as a single averaged condition, the model suppresses intra-slice variability in solar and wind output, tending to overestimate VRE dispatchability and underestimate flexibility needs. In the modelled system, solar and wind collectively account for approximately 27% of annual generation in 2030, rising to 33% by 2045, with hydro and geothermal providing 52% of dispatchable generation throughout the horizon. At these penetration levels, the primary outputs of this study, namely cost differentials, emissions intensity, installed capacity mix, and trade flows, are driven by long-run resource costs and structural trade complementarity rather than intra-day dispatch dynamics. Temporal resolution has its greatest influence on short-run operational and dispatch studies, where sub-hourly variability, ramping constraints, and curtailment must be explicitly resolved; its impact on long-run capacity expansion metrics is substantially smaller [17,29,30]. A dedicated resolution sensitivity analysis would be required to quantify the exact aggregation error for this system configuration and is identified as a priority for future work.
OSeMOSYS Global, like long-run capacity expansion frameworks such as MESSAGE and TIMES, employs a linear transport model for cross-border electricity flows, representing transmission as a commodity flow between nodes subject to capacity constraints and distance-scaled efficiency parameters. In this study, transmission losses are explicitly parameterised by technology and distance with HVAC lines at 6.75% per 1000 km and HVDC lines at 3.5% per 1000 km plus 1.3% per converter pair, ensuring that compounded losses on longer corridors, including the Ethiopia–Tanzania through Kenya transit route, are proportionally captured. What the linear transport framework does not resolve is reactive power requirements, voltage stability constraints, and loop flows, physical network characteristics that require AC power flow simulation. These simplifications mean that congestion interactions between parallel flow paths are not captured, and cost savings for Tanzania and Uganda may be marginally optimistic relative to a full network simulation. However, given that losses are distance-scaled and the reported cost differentials are of a scale unlikely to be reversed by AC network corrections, the directional findings are considered robust. A full AC optimal power flow analysis would be required to resolve these constraints precisely and represents a natural extension of this planning-level study into operational feasibility assessment.
The model assumes perfect intra-timeslice flexibility within each representative time period; all generation technologies are assumed to respond instantaneously to meet demand without ramp rate constraints, minimum loading requirements, or start-up costs. This means that the transition between timeslices, such as the evening solar-to-hydro ramp as generation shifts from peak solar hours (D4: 13:00–17:00) to the evening demand peak (D5: 17:00–21:00), is modelled as costless and instantaneous rather than subject to physical ramping constraints. As a consequence, system flexibility costs and reliability requirements may be understated. However, the practical significance of this simplification is limited in the East African context by the dominance of hydropower, one of the most rapidly dispatchable generation technologies, and geothermal baseload across all four modelled countries.
Across all modelled countries, the optimisation endogenously selects short-duration storage alongside VRE deployment where economically justified, providing an additional flexibility buffer. Nonetheless, the 24-timeslice temporal resolution means sub-daily variability management costs are not fully captured; VRE deployment figures should, therefore, be interpreted as least-cost investment signals rather than grid-ready deployment forecasts, and detailed short-run operational studies would be required to confirm technical feasibility at the projected scales. The practical significance of the perfect flexibility assumption is greatest in systems where the ramping burden falls primarily on slow thermal plants or where VRE shares are very high [31,32]. In the East African system modelled here, the dominance of dispatchable hydro and geothermal generation reduces the practical significance of this simplification. Incorporating unit commitment constraints and explicit ramp rates would require a short-run operational model and is identified as a priority for future work.
Two structural limitations bound the interpretation of reported cost outcomes. First, the model minimises total regional system cost but does not simulate the commercial pricing structures through which countries recover infrastructure investments. Export revenues from electricity sales and wheeling services are excluded from the cost accounting, and the four-country boundary further understates revenue potential, as exports to non-modelled EAPP members are entirely excluded. Second, the model assumes electricity flows freely between countries subject only to transmission capacity constraints. In practice, synchronising four national grids with different grid codes, voltage standards, protection systems, and market regulatory frameworks represents a substantial technical and institutional challenge. Differences in frequency regulation, balancing market rules, and wheeling arrangements can impede or distort the cross-border flows that the model assumes are commercially available. These implementation barriers are not captured in the modelling framework and represent a category of risk that could reduce realised trade volumes below modelled optima. Addressing them requires harmonisation work within the EAPP framework that is beyond the scope of this planning-focused study.
Decision-making under deep uncertainty techniques [33] could help quantify the sensitivity of key results to these input uncertainties and provide policymakers with a clearer picture of the robustness of the interconnection case across a range of plausible futures. Very few studies incorporate decision-making under deep-uncertainty techniques in energy planning [34,35,36]. Future research should incorporate such techniques, drawing on stakeholder-informed scenarios developed in collaboration with national utilities and planning agencies. Based on the analysis presented in this study, eight key uncertainties are identified as having the greatest potential influence on the central findings: fuel prices, technology costs, demand growth trajectories, hydrological stress, weighted average cost of capital, pace of renewable cost reductions, transmission losses and regulatory and institutional barriers.
A fully systematic characterisation of uncertainties would require stakeholder consultation with national utilities and planning agencies, a limitation acknowledged and identified as a priority for future work. More broadly, the sensitivity of results to key input assumptions, including transmission costs, demand trajectories, and technology learning rates, remains untested in a practical sense. While a full RDM-based robustness analysis is identified as a priority for future work, this represents a limitation of the present study.
For example, a key uncertainty not captured in this framework is inter-annual hydrological variability. The model employs average-year inflow assumptions for hydropower, which does not represent the compound multi-year drought sequences increasingly documented in the Horn of Africa [37]. A parametric dry-year sensitivity would provide a partial treatment of this uncertainty, as it assumes the uncertainty is bounded and characterisable by a single stress parameter. Robust Decision-Making in which strategies are evaluated across a large ensemble of hydrological scenarios rather than a single stress case represents the appropriate analytical framework [33], and the open-source, reproducible nature of this study makes it directly amenable to such ensemble exploration. This is identified as a priority direction for future work.
Finally, the analysis is limited to four countries, whereas the Eastern Africa Power Pool encompasses thirteen member states with significant untapped interconnection potential. Extending the modelling framework to additional EAPP members, including Rwanda, Burundi, Sudan, and the Democratic Republic of Congo, would provide a more complete picture of regional integration benefits and trade-offs. Future research should also assess the role of emerging technologies, including utility-scale battery storage, pumped hydro, and green hydrogen, in complementing cross-border transmission as tools for managing variability and enabling deeper decarbonisation across the region.
5. Conclusions
Using an open-source model generator for interconnected regional electricity systems, this study evaluates the system-level costs, emissions, and structural impacts of planned regional electricity interconnections across Kenya, Ethiopia, Uganda, and Tanzania. The results demonstrate that planned interconnection delivers heterogeneous but broadly positive outcomes at the regional level. Countries that gain access to lower-cost generation from neighbours achieve meaningful reductions in both system costs and carbon emission intensity, while those bearing the capital burden of new transmission infrastructure incur near-term cost increases but positively contribute to a regional emissions balance. Critically, interconnection does not compromise emissions equity: modest intensity increases in some countries are substantially outweighed by large reductions elsewhere, confirming that the benefits of regional integration are shared, if unevenly distributed. Cross-border trade flow analysis further reveals that interconnection activates latent low-cost renewable resources, enables structural transformation of national generation portfolios away from fossil-fuelled generation, and positions Kenya as a potential regional transit hub. Taken together, these findings strengthen the economic and environmental case for treating cross-border transmission infrastructure as a climate mitigation investment rather than merely a reliability asset and point to the need for equitable cost-sharing mechanisms to ensure all participating countries capture a fair share of regional gains.
For policymakers, the results underscore three priorities: the timely delivery of planned interconnector projects, particularly the Kenya-Tanzania and Kenya-Ethiopia corridors alongside fair and transparent regional cost-sharing arrangements; the alignment of national capacity planning with regional trade opportunities; and the acceleration of regulatory harmonisation across the EAPP to unlock the commercial potential of regional power trade. Realising these priorities will be essential for East Africa to achieve a secure, low-carbon, and cost-effective electricity transition.
Author Contributions
Conceptualization, J.S.G., J.Q.-T. and L.V.-G.; methodology, J.S.G., J.Q.-T., L.V.-G. and A.S.-V.; software, J.S.G. and A.S.-V.; formal analysis, J.S.G.; investigation, J.Q.-T. and L.V.-G.; data curation, J.S.G. and A.S.-V.; writing—original draft preparation, J.S.G.; writing—review and editing, J.S.G., J.Q.-T. and L.V.-G.; visualization, J.S.G. and L.V.-G.; supervision, J.Q.-T. All authors have read and agreed to the published version of the manuscript.
Funding
This material has been produced under the Climate Compatible Growth (CCG) programme, which brings together leading research organizations and is led out of the STEER centre, Loughborough University. CCG is funded by UK aid from the UK Government through Foreign, Commonwealth & Development Office: GB-GOV-1-300125. However, the views expressed herein do not necessarily reflect the UK government’s official policies.
Data Availability Statement
The scenario configuration files, input data, and model results supporting the findings of this study are openly available in the k_t_e_u_baseline_Individuals branch of the public repository at https://github.com/jeenogeorge/Applications_OG/tree/k_t_e_u_baseline_Individuals accessed on 6 May 2026. The results are at https://github.com/jeenogeorge/Applications_OG/blob/k_t_e_u_baseline_Individuals/Model_outputs.zip accessed on 6 May 2026. The OSeMOSYS Global model generator used to produce these results is publicly available at https://github.com/OSeMOSYS/osemosys_global accessed on 6 May 2026 [21].
Acknowledgments
The authors acknowledge the Climate Compatible Growth (CCG) programme and Loughborough University for providing the institutional space and resources that supported this research. During the preparation of this manuscript, the authors used Claude (Anthropic, claude-sonnet-4-5) for language correction. The authors have reviewed and edited the output and take full responsibility for the content of this publication.
Conflicts of Interest
Author Andrey Salazar-Vargas was employed by the Climate Lead Group. The remaining authors declare that the research was conducted in the absence of any commercial or financial relationships that could be construed as a potential conflict of interest. The funders had no role in the design of the study; in the collection, analyses, or interpretation of data; in the writing of the manuscript; or in the decision to publish the results.
Abbreviations
The following abbreviations are used in this manuscript:
| EAPP | Eastern Africa Power Pool |
| GW | Gigawatt |
| IEA | International Energy Agency |
| IPCC | Intergovernmental Panel on Climate Change |
| IRENA | International Renewable Energy Agency |
| MW | Megawatt |
| NoTRN | No-Planned-Transmission scenario |
| OSeMOSYS | Open Source Energy Modelling System |
| PJ | Petajoule |
| PV | Photovoltaic |
| SAPP | Southern African Power Pool |
| TRN | Planned-Transmission scenario |
| USD | United States Dollar |
References
- International Energy Agency. Enhancing the Foundations of Resilient, Sustainable and Affordable Power Systems. In Electricity Grids and Secure Energy Transitions; International Energy Agency: Paris, France, 2023. [Google Scholar] [CrossRef] [Scilit]
- World Energy Outlook. 2025. Available online: https://www.iea.org/reports/world-energy-outlook-2025 (accessed on 24 November 2025).
- IRENA. Renewable Power Generation Costs 2024; International Renewable Energy Agency: Abu Dhabi, United Arab Emirates, 2025; Available online: https://www.irena.org/-/media/Files/IRENA/Agency/Publication/2025/Jul/IRENA_TEC_RPGC_in_2024_2025.pdf (accessed on 21 March 2026).
- Alarcón, A.D.; Quiros-Tortos, J. Unlocking the Grid: How to Ensure Reliable and Sustainable Energy in Latin America and the Caribbean; IDB: Washigton, DC, USA, 2025. [Google Scholar] [CrossRef] [Scilit]
- Clarke, L.; Wei, Y.M.; de la Vega Navarro, A.; Garg, A.; Hahmann, A.N.; Khennas, S.; Azevedo, I.M.; Löschel, A.; Singh, A.K.; Steg, L.; et al. Energy Systems. In Climate Change 2022—Mitigation of Climate Change; Cambridge University Press: Cambridge, UK, 2022. [Google Scholar] [CrossRef] [Scilit]
- Boshell, F.; Miranda, R.; Ratka, S. Solutions to Integrate High Shares of Variable Renewable Energy About IRENA. 2019. Available online: https://www.irena.org/-/media/Files/IRENA/Agency/Publication/2019/Jun/IRENA_G20_grid_integration_2019.pdf (accessed on 21 March 2026).
- Powering Africa: The Transformational Impact of Regional Energy Projects in West Africa. Available online: https://www.worldbank.org/en/results/2025/02/06/powering-africa-the-transformational-impact-of-regional-energy-projects-in-west-africa (accessed on 21 March 2026).
- Ajagun, A.S.; Mao, W.; Sun, X.; Guo, J.; Adebisi, B.; Aibinu, A.M. The status and potential of regional integrated energy systems in sub-Saharan Africa: An Investigation of the feasibility and implications for sustainable energy development. Energy Strategy Rev. 2024, 53, 101402. [Google Scholar] [CrossRef] [Scilit]
- The EAPP—Eastern Africa Power Pool. Available online: https://eappool.org/ (accessed on 21 March 2026).
- Republic of Kenya Ministry of Energy & Petroleum State Department for Energy. National Energy Policy 2025–2034 Draft One. Available online: https://www.energy.go.ke/sites/default/files/Final%20Draft_National%20Energy%20Policy%202025_November%202025.pdf (accessed on 21 March 2026).
- The Energy (Net-Metering) Regulations, 2024—Kenya Law. Available online: https://new.kenyalaw.org/akn/ke/act/ln/2024/104/eng@2024-07-26 (accessed on 21 March 2026).
- Oseni, M.O.; Pollitt, M.G. The promotion of regional integration of electricity markets: Lessons for developing countries. Energy Policy 2016, 88, 628–638. [Google Scholar] [CrossRef] [Scilit]
- Daly, M.; Pye, S.; Trotter, P.; Bataille, C.; Akute, M.; Bergman, M.; Bravo, G.; Bui, H.; Buira, D.; Burton, J.; et al. Addressing context-specific energy modelling risks and dynamics in low- and middle-income countries. Nat. Energy 2026, 11, 526–533. [Google Scholar] [CrossRef] [Scilit]
- Howells, M.; Quiros-Tortos, J.; Morrison, R.; Rogner, H.; Niet, T.; Petrarulo, L.; Usher, W.; Blyth, W.; Godínez, G.; Victor, L.F.; et al. Energy system analytics and good governance-U4RIA goals of Energy Modelling for Policy Support. Res. Sq. 2021. [Google Scholar] [CrossRef] [Scilit]
- Allington, L.; Cannone, C.; Pappis, I.; Barron, K.C.; Usher, W.; Pye, S.; Brown, E.; Howells, M.; Walker, M.Z.; Ahsan, A.; et al. Selected ‘Starter kit’ energy system modelling data for selected countries in Africa, East Asia, and South America (#CCG, 2021). Data Brief 2022, 42, 108021. [Google Scholar] [CrossRef] [Scilit] [PubMed]
- Fotis, G.; Maris, T.I.; Mladenov, V. Risks, Obstacles and Challenges of the Electrical Energy Transition in Europe: Greece as a Case Study. Sustainability 2025, 17, 5325. [Google Scholar] [CrossRef] [Scilit]
- Barnes, T.; Shivakumar, A.; Brinkerink, M.; Niet, T. OSeMOSYS Global, an open-source, open data global electricity system model generator. Sci. Data 2022, 9, 623. [Google Scholar] [CrossRef] [Scilit]
- Pfenninger, S.; Hawkes, A.; Keirstead, J. Energy systems modeling for twenty-first century energy challenges. Renew. Sustain. Energy Rev. 2014, 33, 74–86. [Google Scholar] [CrossRef] [Scilit]
- Maarten, B.; Gordon, S.; Simone, O.-O.; Mohanty, R.; Majid, A.; Barnes, T.; Niet, T.; Abhishek, S.; Mayfield, E. Global Transmission Database. In Global Transmission Database (1.1); Zenodo: Geneva, Switzerland, 2024. [Google Scholar] [CrossRef]
- Brinkerink, M.; Sherman, G.; Osei-Owusu, S.; Mohanty, R.; Majid, A.; Barnes, T.; Niet, T.; Shivakumar, A.; Mayfield, E. A global electricity transmission database for energy system modelling. Data Brief 2024, 54, 110420. [Google Scholar] [CrossRef] [Scilit]
- Howells, M.; Rogner, H.; Strachan, N.; Heaps, C.; Huntington, H.; Kypreos, S.; Hughes, A.; Silveira, S.; DeCarolis, J.; Bazillian, M.; et al. OSeMOSYS: The Open Source Energy Modeling System: An introduction to its ethos, structure and development. Energy Policy 2011, 39, 5850–5870. [Google Scholar] [CrossRef] [Scilit]
- Pye, S.; Osei-Owusu, S.; Shivakumar, A. Green Grids Initiative (GGI) Working Paper Mobilising Finance for Grids: Taking Stock of Current Climate Financing Approaches. Available online: https://greengridsinitiative.net/wp-content/uploads/2024/11/Mobilising-finance-for-grid-investments-taking-stock-of-current-approaches.cleaned.pdf (accessed on 6 November 2025).
- Brinkerink, M.; Gallachóir, B.; Deane, P. A comprehensive review on the benefits and challenges of global power grids and intercontinental interconnectors. Renew. Sustain. Energy Rev. 2019, 107, 274–287. [Google Scholar] [CrossRef] [Scilit]
- Beyond Borders Power Grid Interconnections and Regional Electricity Markets for the Sustainable Energy Transition. Available online: https://openknowledge.worldbank.org/server/api/core/bitstreams/ebc5ac60-c902-485e-ad15-4e8bad9a201c/content?utm_source=chatgpt.com (accessed on 15 December 2025).
- IEA. Climate Risks to African Hydropower—Climate Impacts on African Hydropower—Analysis. Available online: https://www.iea.org/reports/climate-impacts-on-african-hydropower/climate-risks-to-african-hydropower (accessed on 21 March 2026).
- Credendo. East Africa: A Climate Crisis That is Only Expected to Worsen. Available online: https://credendo.com/en/knowledge-hub/east-africa-climate-crisis-only-expected-worsen (accessed on 21 March 2026).
- Abay, K.A.; Abay, M.H.; Berhane, G.; Chamberlin, J. Social protection and resilience: The case of the productive safety net program in Ethiopia. Food Policy 2022, 112, 102367. [Google Scholar] [CrossRef] [Scilit]
- Shapley, L.S. A Value for N-Person Games; The RAND Corporation: Santa Monica, CA, USA, 1952. [Google Scholar] [CrossRef] [Scilit]
- Pfenninger, S. Dealing with multiple decades of hourly wind and PV time series in energy models: A comparison of methods to reduce time resolution and the planning implications of inter-annual variability. Appl. Energy 2017, 197, 1–13. [Google Scholar] [CrossRef] [Scilit]
- Kotzur, L.; Markewitz, P.; Robinius, M.; Stolten, D. Impact of different time series aggregation methods on optimal energy system design. Renew. Energy 2018, 117, 474–487. [Google Scholar] [CrossRef] [Scilit]
- Palmintier, B.S.; Webster, M.D. Impact of Operational Flexibility on Electricity Generation Planning with Renewable and Carbon Targets. IEEE Trans. Sustain. Energy 2016, 7, 672–684. [Google Scholar] [CrossRef] [Scilit]
- Frew, B.; Sergi, B.; Denholm, P.; Cole, W.; Gates, N.; Levie, D.; Margolis, R. The curtailment paradox in the transition to high solar power systems. Joule 2021, 5, 1143–1167. [Google Scholar] [CrossRef] [Scilit]
- Marchau, V.A.W.J.; Walker, W.E.; Bloemen, P.J.T.M.; Popper, S.W. Decision Making Under Deep Uncertainty: From Theory to Practice; Springer: Cham, Switzerland, 2019; pp. 1–405. [Google Scholar] [CrossRef] [Scilit]
- Victor-Gallardo, L.; Quirós-Tortós, J. Techno-economic comparison of centralized and distributed power generation to support large-scale transport electrification in Costa Rica. Transp. Policy 2023, 131, 120–138. [Google Scholar] [CrossRef] [Scilit]
- Chacon, M.J.; Valverde, A.M.; Alvarado, B.Z.; Rodríguez-ZúÑiga, M.; QuirÓs-TortÓs, J.; Víctor-Gallardo, L.; Schaal, P.; Cubillos, P.; Duplan, T.; Robin, M.; et al. The regional employment implications of a net-zero economy in Costa Rica under uncertainty. Adv. Clim. Change Res. 2023, 14, 988–999. [Google Scholar] [CrossRef] [Scilit]
- Victor-Gallardo, L.; Solórzano-Jiménez, S.; Rodríguez-Delgado, L.; Roccard, J.; Quirós-Tortós, J.; Gómez, R.; Dionicio, M.; Baldivieso, H.; Lefevre, B. Economic evaluation of decarbonizing the electricity sector in the Dominican Republic. Front. Clim. 2024, 6, 1380382. [Google Scholar] [CrossRef] [Scilit]
- Kimutai, J.; Barnes, C.; Zachariah, M.; Philip, S.Y.; Kew, S.F.; Pinto, I.; Wolski, P.; Koren, G.; Vecchi, G.; Yang, W.; et al. Human-induced climate change increased 2021–2022 drought severity in horn of Africa. Weather Clim. Extrem. 2025, 47, 100745. [Google Scholar] [CrossRef] [Scilit]

Disclaimer/Publisher’s Note: The statements, opinions and data contained in all publications are solely those of the individual author(s) and contributor(s) and not of MDPI and/or the editor(s). MDPI and/or the editor(s) disclaim responsibility for any injury to people or property resulting from any ideas, methods, instructions or products referred to in the content. |
© 2026 by the authors. Licensee MDPI, Basel, Switzerland. This article is an open access article distributed under the terms and conditions of the Creative Commons Attribution (CC BY) license.