


Abstract
High temperatures during charge–discharge cycles pose a significant threat to the safety and capacity of lithium-ion batteries by accelerating solid–electrolyte interphase (SEI) growth. Conversely, elevating the temperature during charging enhances Li-ion transport and suppresses lithium plating, suggesting an asymmetric temperature modulation (ATM) strategy in which cells are charged at elevated temperatures and discharged at room temperature to mitigate degradation under extreme fast-charging conditions. In this study, a one-dimensional electrochemical model incorporating key side reactions—SEI formation, lithium plating, and lithium stripping—is developed to analyse the ageing behaviour of plug-in hybrid electric vehicle (PHEV) cells under ATM operation. Within the present modelling framework and for the investigated temperature and current ranges, lithium plating is found to exert only a modest influence on the SEI growth rate, and the capacity degradation associated with SEI formation at a given temperature follows a unique time dependence that shows only a weak sensitivity to the charging rate. A phenomenological hill-shaped dependence of plating reversibility on the state of charge (SOC) is implemented based on experimental observations. The simulation results show good agreement with experimental data for PHEV cells operated under ATM, reproducing a capacity retention of about 80% after 1000 cycles at a charging temperature of 49 °C.
1. Introduction
Lithium-ion batteries are set to play a critical role in a wide range of commercial applications, spanning from portable devices such as mobile phones to large-scale systems like electric vehicles [1,2,3]. This is largely attributed to their distinct advantages, including high energy density and cost-effectiveness. Surface-engineered cathodes like AlF3-coated Li-rich oxides improve energy density, cycling stability, and rate capability [4]. Nonetheless, lithium-ion batteries continue to confront a series of challenges [5,6], largely attributable to battery degradation and thermal management issues, compounded by the mounting demand for rapid charging as modern electronic devices require higher energy density and customers expect shorter charging times. Concurrently, post-lithium systems, including aqueous magnesium-ion, sodium-ion, and zinc-ion batteries, are being investigated. For instance, anisotropic vanadium oxide nanobelts have been utilised to achieve ultralong cycling in Mg-ion cells [7], while facet-engineered FeNCN anodes enable pseudocapacitive Na-ion storage [8], and dual-modified quinone cathodes and Zn anodes, together with electrolyte engineering, have been shown to significantly enhance the performance of aqueous Zn-ion batteries [9].
The aging mechanisms of lithium-ion batteries are highly complex and challenging to analyse. Literature surveys [10,11,12,13] indicate that the dominant aging mechanisms include the formation and growth of the solid electrolyte interphase (SEI), mechanical breakup of electrode materials, dissolution of transition metals from the cathode, and deposition of metallic lithium on the anode (Li plating) [14,15,16]. In addition to electrochemical and structural characterization, full-life-cycle acoustic-emission monitoring combined with data-driven modelling has recently been proposed as a non-destructive approach for tracking internal degradation and estimating the state of health of lithium-ion batteries [17]. Ouyang et al. [18] investigated the effect of high-temperature environment on the optimal cycle rate of lithium-ion batteries, including two ambient temperatures (26 °C and 70 °C) and four cycle rates (0.5C, 1C, 2C and 3C), and advised that batteries should be cycled at a comparatively high rate if high-temperature operation is unavoidable, in order to mitigate degradation. Yan et al. [19] studied the Li dendrite growth process under different temperatures using a computational model and achieved well-agreed results compared with the published experimental measurements. Jonas Keilz and Andreas Jossen [4,20] presented an electrochemical aging model that accounts for solid electrolyte interphase (SEI) formation, SEI re-formation due to layer cracking during graphite expansion, lithium plating, and subsequent lithium stripping. The simulation results are in good agreement with experimental data tested on commercial 18650-type cells. As demonstrated by J.C. Burns et al. [21], high-precision coulometry has been shown to optimize cell performance through battery management by varying the maximum charge rate in accordance with the temperature, thus avoiding lithium plating. In parallel with studies on degradation mechanisms and thermal effects, there has been significant interest in the improvement of electrode materials, particularly cathodes. Theodore [22] provided a recent overview of cathode chemistries that show promise for lithium-ion batteries, demonstrating that Li-ion transport, electrode surface reactions and structural stability have a significant impact on energy density, safety and cycle life, and that approaches such as cation substitution and surface coating play a crucial role in mitigating cathode degradation. These materials-focused advances further underscore that cell lifetime is governed not only by electrochemical side reactions such as SEI growth and Li plating, but also by the interplay between electrode design and thermal-management strategies.
The prevailing thermal management strategy of lithium-ion batteries during the charge–discharge cycle endeavors to maintain a moderate temperature (usually under 45 °C) throughout the entire cycle to ensure comprehensive performance [18,23]. Nevertheless, when lithium-ion batteries operate under extreme fast charging conditions (i.e., 6C charging), the duration of the charging stage occupies a relatively small fraction of the total cycle time. In this scenario, Li plating supersedes the formation of the SEI layer as the primary cause of deterioration, owing to the exceedingly high charging current [24,25]. Experimental evidence has indicated that elevated temperatures during the charging stage promote lithium-ion intercalation and diffusion, as well as enhance electrolyte conductivity, thereby easing the Li plating effect and extending the lifespan of lithium-ion batteries. A series of experimental studies employing asymmetric-temperature cycling with elevated charging temperatures have demonstrated that an appropriately configured temperature profile can significantly improve battery performance [15,26].
Nevertheless, there remains a paucity of research that quantitatively captures lithium plating behaviour under the extreme fast-charging and high-temperature conditions described above [24,27,28]. Given the complexity and high cost of experiments, it is beneficial to develop a numerical model suitable for lithium-ion batteries operating under varied temperatures and charge currents. Recent advances in lithium-ion battery modelling provide a solid basis for incorporating the above degradation mechanisms into coupled electrochemical-thermal frameworks [29,30,31]. Srinivasan and Wang [32] developed a two-dimensional, coupled, thermal-electrochemical model that enabled the estimation of thermal and electrical energy at various rates, thereby allowing for a comprehensive investigation of temperature changes in cells under diverse conditions. Yang et al. [28] presented a lithium-ion battery model able to predict the aging characteristics of Li-ion cells associated with lithium plating, which was then used to study the aging behavior of a plug-in EV battery. The model constructed by von Lüders et al. [33] takes into account not only SEI formation and Li plating, but also Li stripping. The results correlate with experimental data of a commercial 18650-type NMC/C cell.
The present paper focuses on the development of an extended electrochemical model for lithium-ion batteries operating under asymmetric temperature modulation (ATM) conditions, in which battery degradation is mitigated by charging at elevated temperatures and discharging at room temperature. The influence of plated lithium on SEI generation is investigated using numerical simulations, and the associated changes in capacity retention (CR) are validated against experimental data. Building on previous modelling work, the present model explicitly considers SEI formation, lithium plating and lithium stripping, and incorporates a hill-shaped reversibility curve derived from PHEV-cell experiments.
2. Model Description
The present work proposes a novel electrochemical-thermal (ECT) model, which draws upon the existing methodologies established by Doyle [34] and the ECT models for battery systems developed by Wang et al. [35], with behaviors of SEI generation, lithium plating and lithium stripping analyzed [33]. The model is conducted using COMSOL Multiphysics 6.2, and the cell is represented by a one-dimensional model coupled to a two-dimensional spherical model representing the active material particles.
The intercalation and deintercalation processes of lithium ions within electrodes can be expressed as follows [36]:
Positive electrode: LiMO2 ↔ Li1−xMO2 + xLi+ + xe−
Negative electrode: C + xLi + xe− ↔ LixC
Overall: LiMO2 + C ↔ LixC + Li1−xMO2
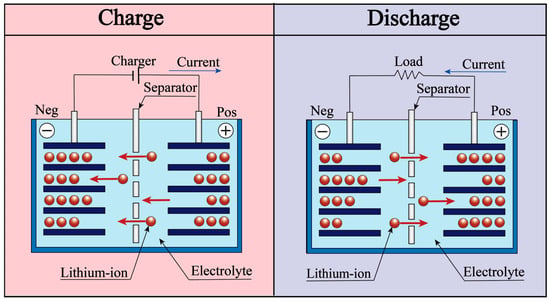
The transportation of lithium ions expressed by Equations (1)–(3) is the main reaction in the anode during charge and discharge of the cell, as illustrated schematically in Figure 1. With regard to the side reactions, SEI formation, lithium plating and lithium stripping are all considered within the negative electrode in the model presented, to which factors the deterioration of battery performance is directly related.
Figure 1.
Schematic illustration of lithium-ion battery principle.
2.1. Lithium Ion Transport Equations
Charge conservation in solid electrodes:
where is the total volumetric current density, is the specific surface area for the faradaic reaction per unit volume, and the solid phase current density is defined as:
Charge conservation in electrolyte:
where is the transfer current density of lithium intercalation, and the liquid phase current density il is defined as:
where is the electrolyte phase concentration, R is the gas constant, T is the temperature.
The faradaic reaction rate is defined using Butler–Volmer kinetic expression as follows:
where F is Faraday’s constant, and the exchange current density is defined as:
where k0 is the faradaic reaction rate, is the maximum lithium concentration in the solid phase of the electrodes, and is the surface concentration of lithium ions.
Conservation of species in electrolyte:
where the molar flux of lithium ions is defined as:
where is the effective electrolyte phase diffusion coefficient, and is the transference number of cation.
Conservation of species in active material particles:
where Ds is the solid phase diffusion coefficient of lithium in the particles
The active material particles are regarded to be uniform spheres in this model, with the conservation of species calculated in a 2-D sub-model coupled into the main 1-D model. The special surface area is calculated by:
where is the volume fraction of the electrolyte phase, is the volume fraction of filler, and is the volume fraction of the polymer matrix.
2.2. SEI Formation Equations
As the electrolyte solvents diffuse through the surface, it is accepted in this work that ethylene carbonate (EC) reacts with Li+ ions to form SEI, which is composed of lithium ethylene dicarbonate (CH2OCO2Li)2, as expressed in Equation (14):
2C2H4CO3 + 2e− + 2Li+ → (CH2OCO2Li)2↓ + C2H4,
The formation of the SEI layer further leads to a drop in local porosity and a decrease in recyclable lithium, reducing local anode potential and thus inducing lithium deposition during the charging stage.
The presented model considers SEI formation as an irreversible side reaction affected by the diffusion rate of EC across the surface film and the surface kinetics. Based on the research conducted by Safari et al. [37], the local current density of SEI formation is calculated using the cathodic Tafel equation below, where the SEI re-formation is ignored in this work.
where is the local current density of SEI formation, is the kinetic rate constant; is the equilibrium potential of SEI formation reaction, and is the concentration of EC on the surface of graphite, and the overpotential is defined as:
Mass conservation of EC:
The material balance of SEI can be expressed as:
where cSEI denotes the molar concentration of SEI per unit volume of the electrode, is the transfer current density of the lithium deposition reaction, and the parameter β is introduced to denote the fraction of plated lithium that becomes SEI, which is considered to be negligible in this work.
The formation of the SEI layer further leads to the drop in local porosity and decrease in recyclable lithium, reducing the local anode potential and thus inducing lithium deposition during charge, as described by Equation (18).
2.3. Li Plating Equations
The lithium plated during the charging stage is considered to consist of two distinct forms: reversible-plated and irreversible-plated lithium. The reversible portion remains unchanged after formation, while the irreversible portion undergoes a lithium stripping reaction once the local overpotential becomes positive during the discharge [30,33,38].
When the local anode potential drops below zero during charging, lithium deposition occurs as described by Equation (19):
Provided that the conditions aforementioned are met, the transfer current density of the lithium deposition reaction may be expressed as follows:
where ilpl is the Li-deposition current density at the graphite particle-electrolyte interface; i0,lpl is the exchange current density of the Li-deposition reaction. Note that when η > 0, the Li-deposition reaction will not be triggered, signifying ilpl = 0 [13,39].
The material balance of lithium metal can be expressed as:
Corresponding to Equation (18), the parameter β is set to zero in this work.
2.4. Lithium Stripping Equations
When the local anode potential becomes positive, the Li plating reaction is stalled, and as long as the reversible lithium exists in the surface film, the lithium stripping reaction occurs. The transfer current density of the lithium stripping reaction is expressed as:
where i0,str denotes the kinetic rate constant for the dissolution reaction of the reversible lithium, ηstr signifies the equilibrium potential of the Li stripping reaction, and fstr represents the reversibility of plated lithium, which is also the fraction of reversible lithium. The indicator is added to ensure that dissolution only occurs when the local anode potential is positive. The damping function is incorporated to prevent instability in the numerical calculation and to ensure that the lithium stripping reaction terminates at the appropriate point when most of the reversible lithium has been consumed.
2.5. Asymmetric Temperature Modulation and Reversibility Model of Plated Lithium
Given that the Li plating behavior of lithium-ion batteries could be eliminated by an elevated charging temperature, and that the total charging time, which is also the exposure time of the battery at the elevated temperature, is reduced to a small fraction of the total cycle time, an asymmetric temperature modulation (ATM) method is considered advantageous for prolonging battery lifespan [40].
To explore the influence of temperature and SOC on the reversibility of plated lithium, it is necessary to simulate the reversibility change as the battery cycles. This paper employs experimental data presented by Yang et al. [40] to analyze the reversibility of plated lithium under ATM cycle conditions via simulation. In the context of simulation, each cycle of the lithium-ion battery comprises a constant-current charging stage, a constant-voltage charging stage, and subsequently, a constant-current discharging stage, in accordance with the conventional approach. The model assumes that lithium plating occurs exclusively during the charge stage, where the overpotential falls below zero, and that lithium stripping transpires solely during the discharge stage, where the overpotential rises above zero. At the conclusion of each charge stage, the capacity retention induced by lithium plating (without accounting for stripping) is compared with the experimental outcomes reported by Yang et al. [40]. The ratio of these two values is interpreted as the reversibility of lithium stripping occurring during the discharge stage. Consequently, the simulation is calibrated to align with the experimental results, thereby yielding a reliable curve of reversibility under the supposition that lithium stripping is the sole factor contributing to the trend of capacity retention under ATM cycling. The reversibility applied in the lithium stripping reaction is set to be:
where EXP refers to the experimental results, and SIM stands for the CR caused by lithium plating in the charging process in the simulation, which is obtained by excluding CR caused by SEI formation from the total CR value.
2.6. Process of Lithium-Ion Battery Degradation During Cycling
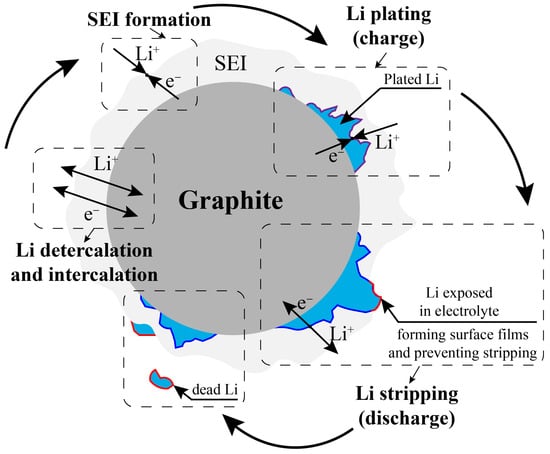
As illustrated in Figure 2, a comprehensive depiction of the relationships between the side reactions for a lithium-ion battery is provided, as outlined above. The formation of SEI is known to reduce the overpotential of lithium plating, thereby enabling lithium plating to occur after a certain number of cycles, as the overpotential falls below zero during the charge stage. The initiation of the discharge stage is accompanied by a reaction between a portion of the plated lithium and the electrolyte, resulting in the formation of a surface film. This surface film functions to impede the occurrence of the lithium stripping reaction. Concurrently, the other portion of the plated lithium, which surrenders within the SEI layer, undergoes a lithium stripping reaction, leading to its dissolution. In this paper, the ratio of the two constituent parts of plated lithium is employed to denote the concept of reversibility.
Figure 2.
Schematic of the relationship between side reactions during the charge–discharge circle, including SEI formation, Li plating, and Li stripping.
We assume that the complex ageing behaviour of lithium-ion batteries operated under asymmetric temperature modulation cannot be fully captured by the simplified set of degradation mechanisms implemented in the present one-dimensional model. In this work, SEI growth, lithium plating, and lithium stripping are taken into account, whereas SEI re-formation due to particle cracking and changes in solvent-diffusion resistance are not resolved explicitly and are instead lumped into effective SEI parameters. Plated lithium is assumed to have only a weak indirect influence on SEI growth, and the reversibility of lithium plating is treated as an effective, SOC-dependent quantity inferred from capacity-retention comparisons rather than from a detailed microscopic description of all possible side reactions. As a result, the present simulations should be interpreted as capturing the dominant trends in capacity fade within the investigated 40–60 °C window, rather than a complete quantitative description of all aging processes. In future work, this framework will be extended by incorporating experimentally constrained descriptions of plated-lithium conversion, SEI re-formation and solvent-diffusion resistance, as well as by including additional cathode-side degradation mechanisms, in order to achieve a more comprehensive and quantitatively accurate prediction of battery ageing under fast-charging ATM conditions.
The design and modeling parameters of the battery are listed in Table 1.
Table 1.
Cell design information and model parameters used in the electrochemical–thermal model.
3. Results
3.1. Model Validation
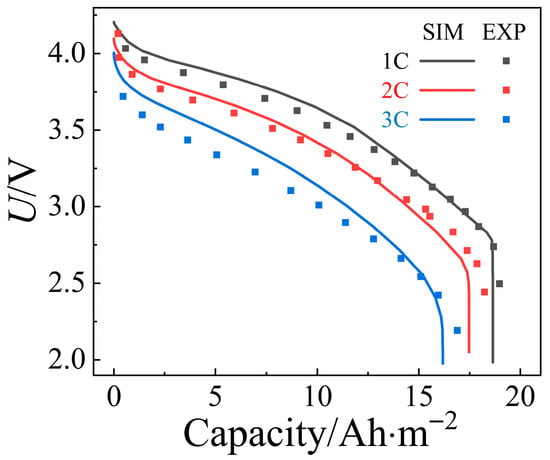
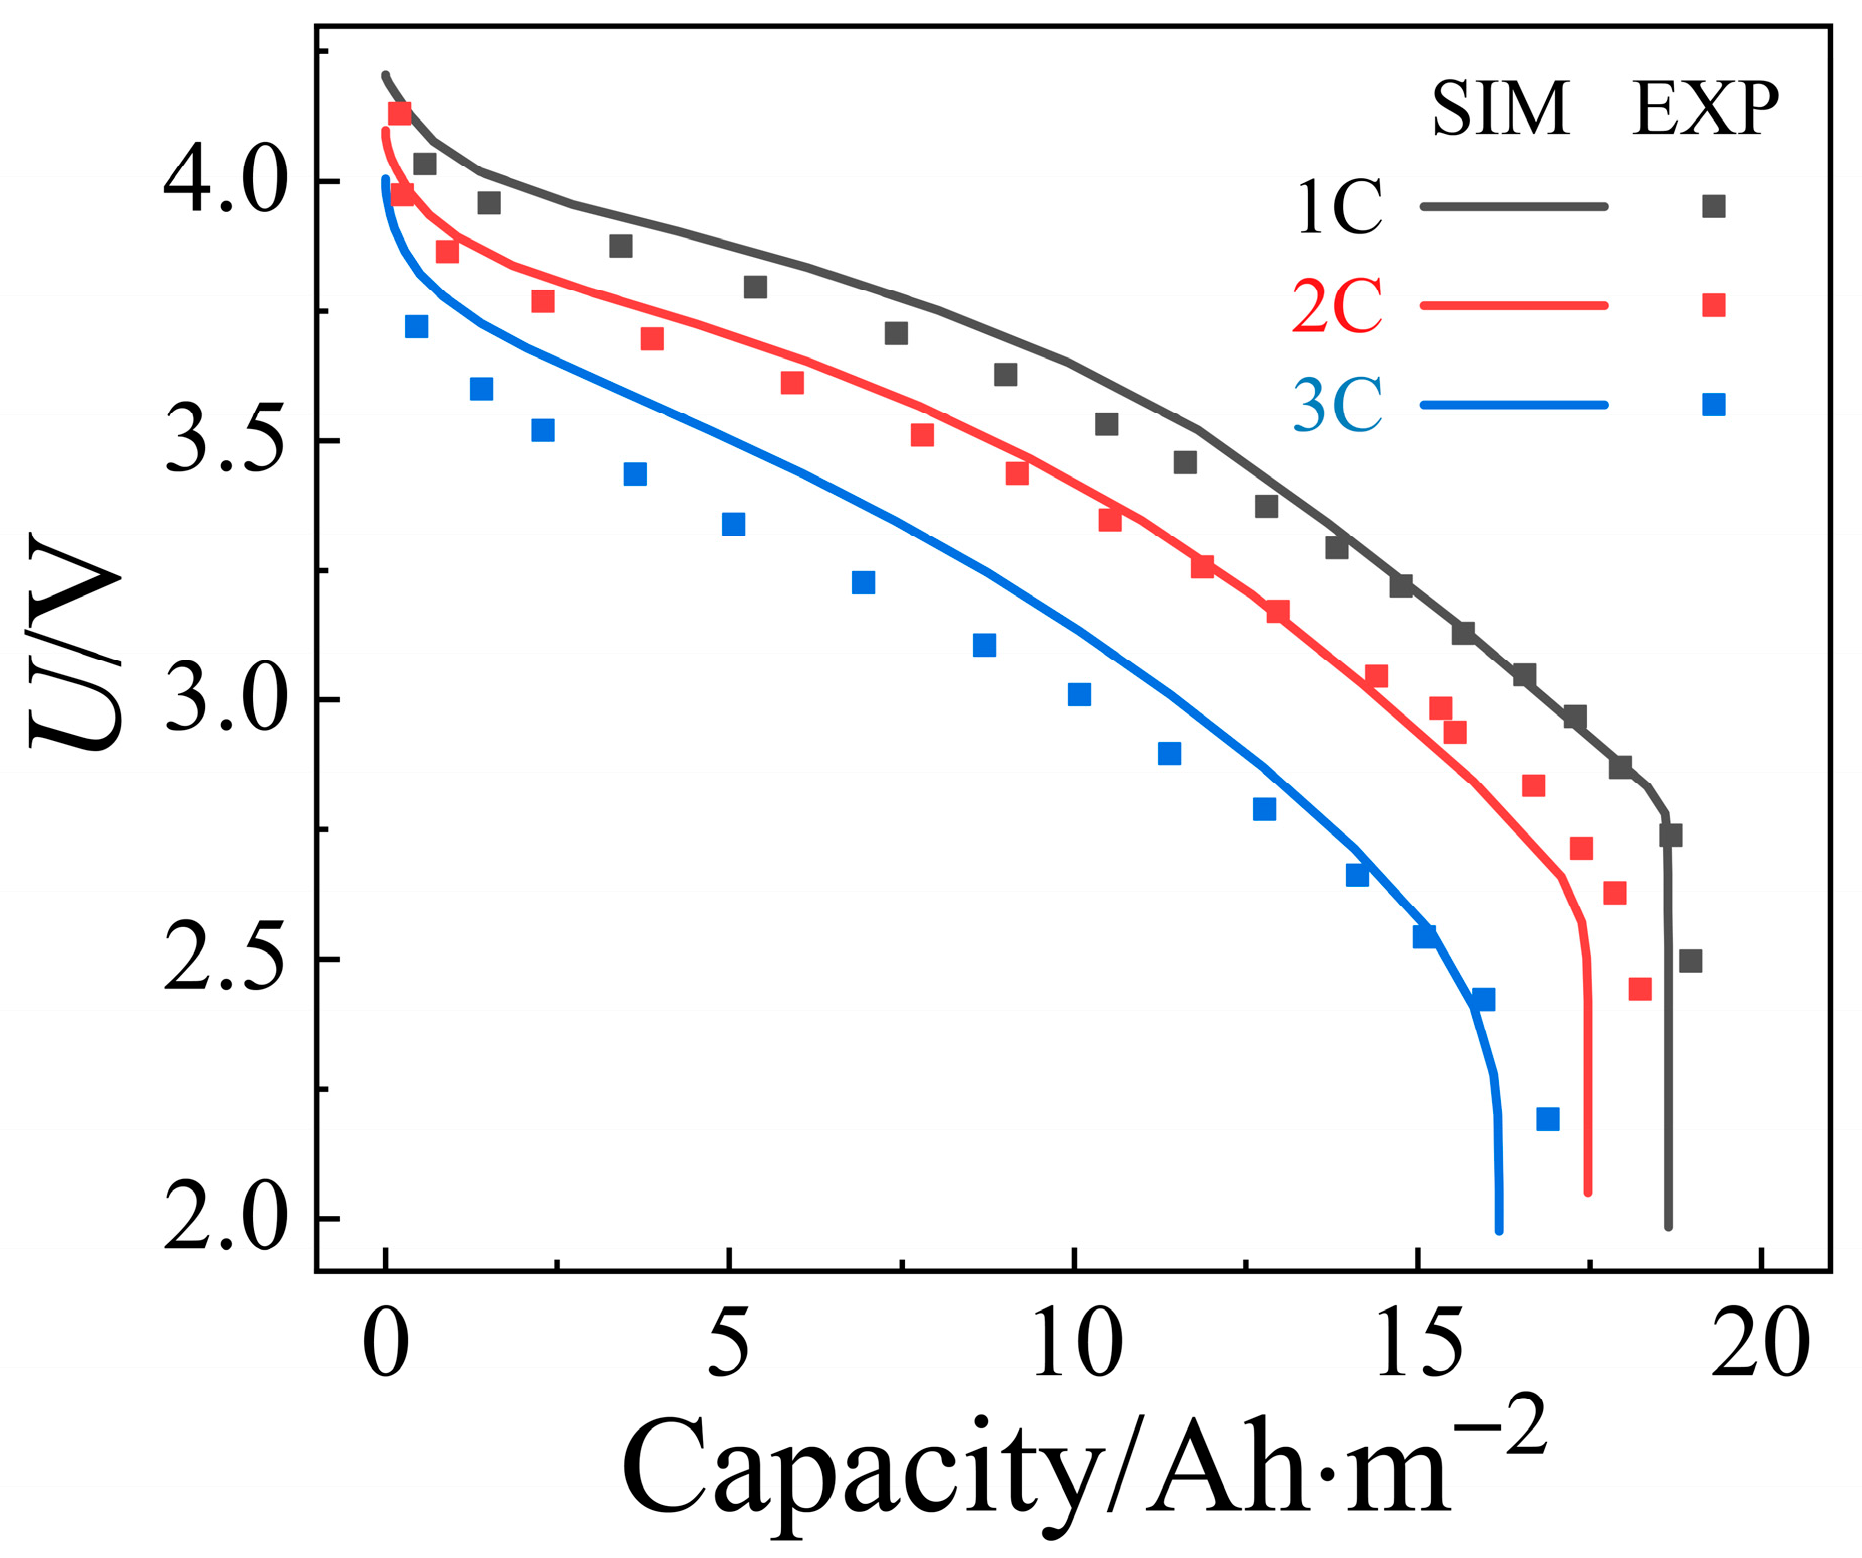
To ensure a valid numerical solution, the electrochemical model with no side reactions considered is validated by comparing the simulation results with the experimental data collected by Doyle et al. [36], which is demonstrated in Figure 3, and the voltage profile agrees well under 1C, 2C, and 3C discharge conditions.
Figure 3.
Comparison of simulation and experimental results under different discharge currents.
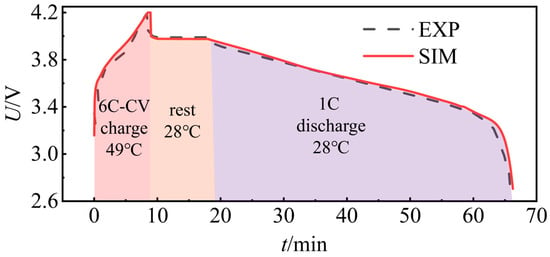
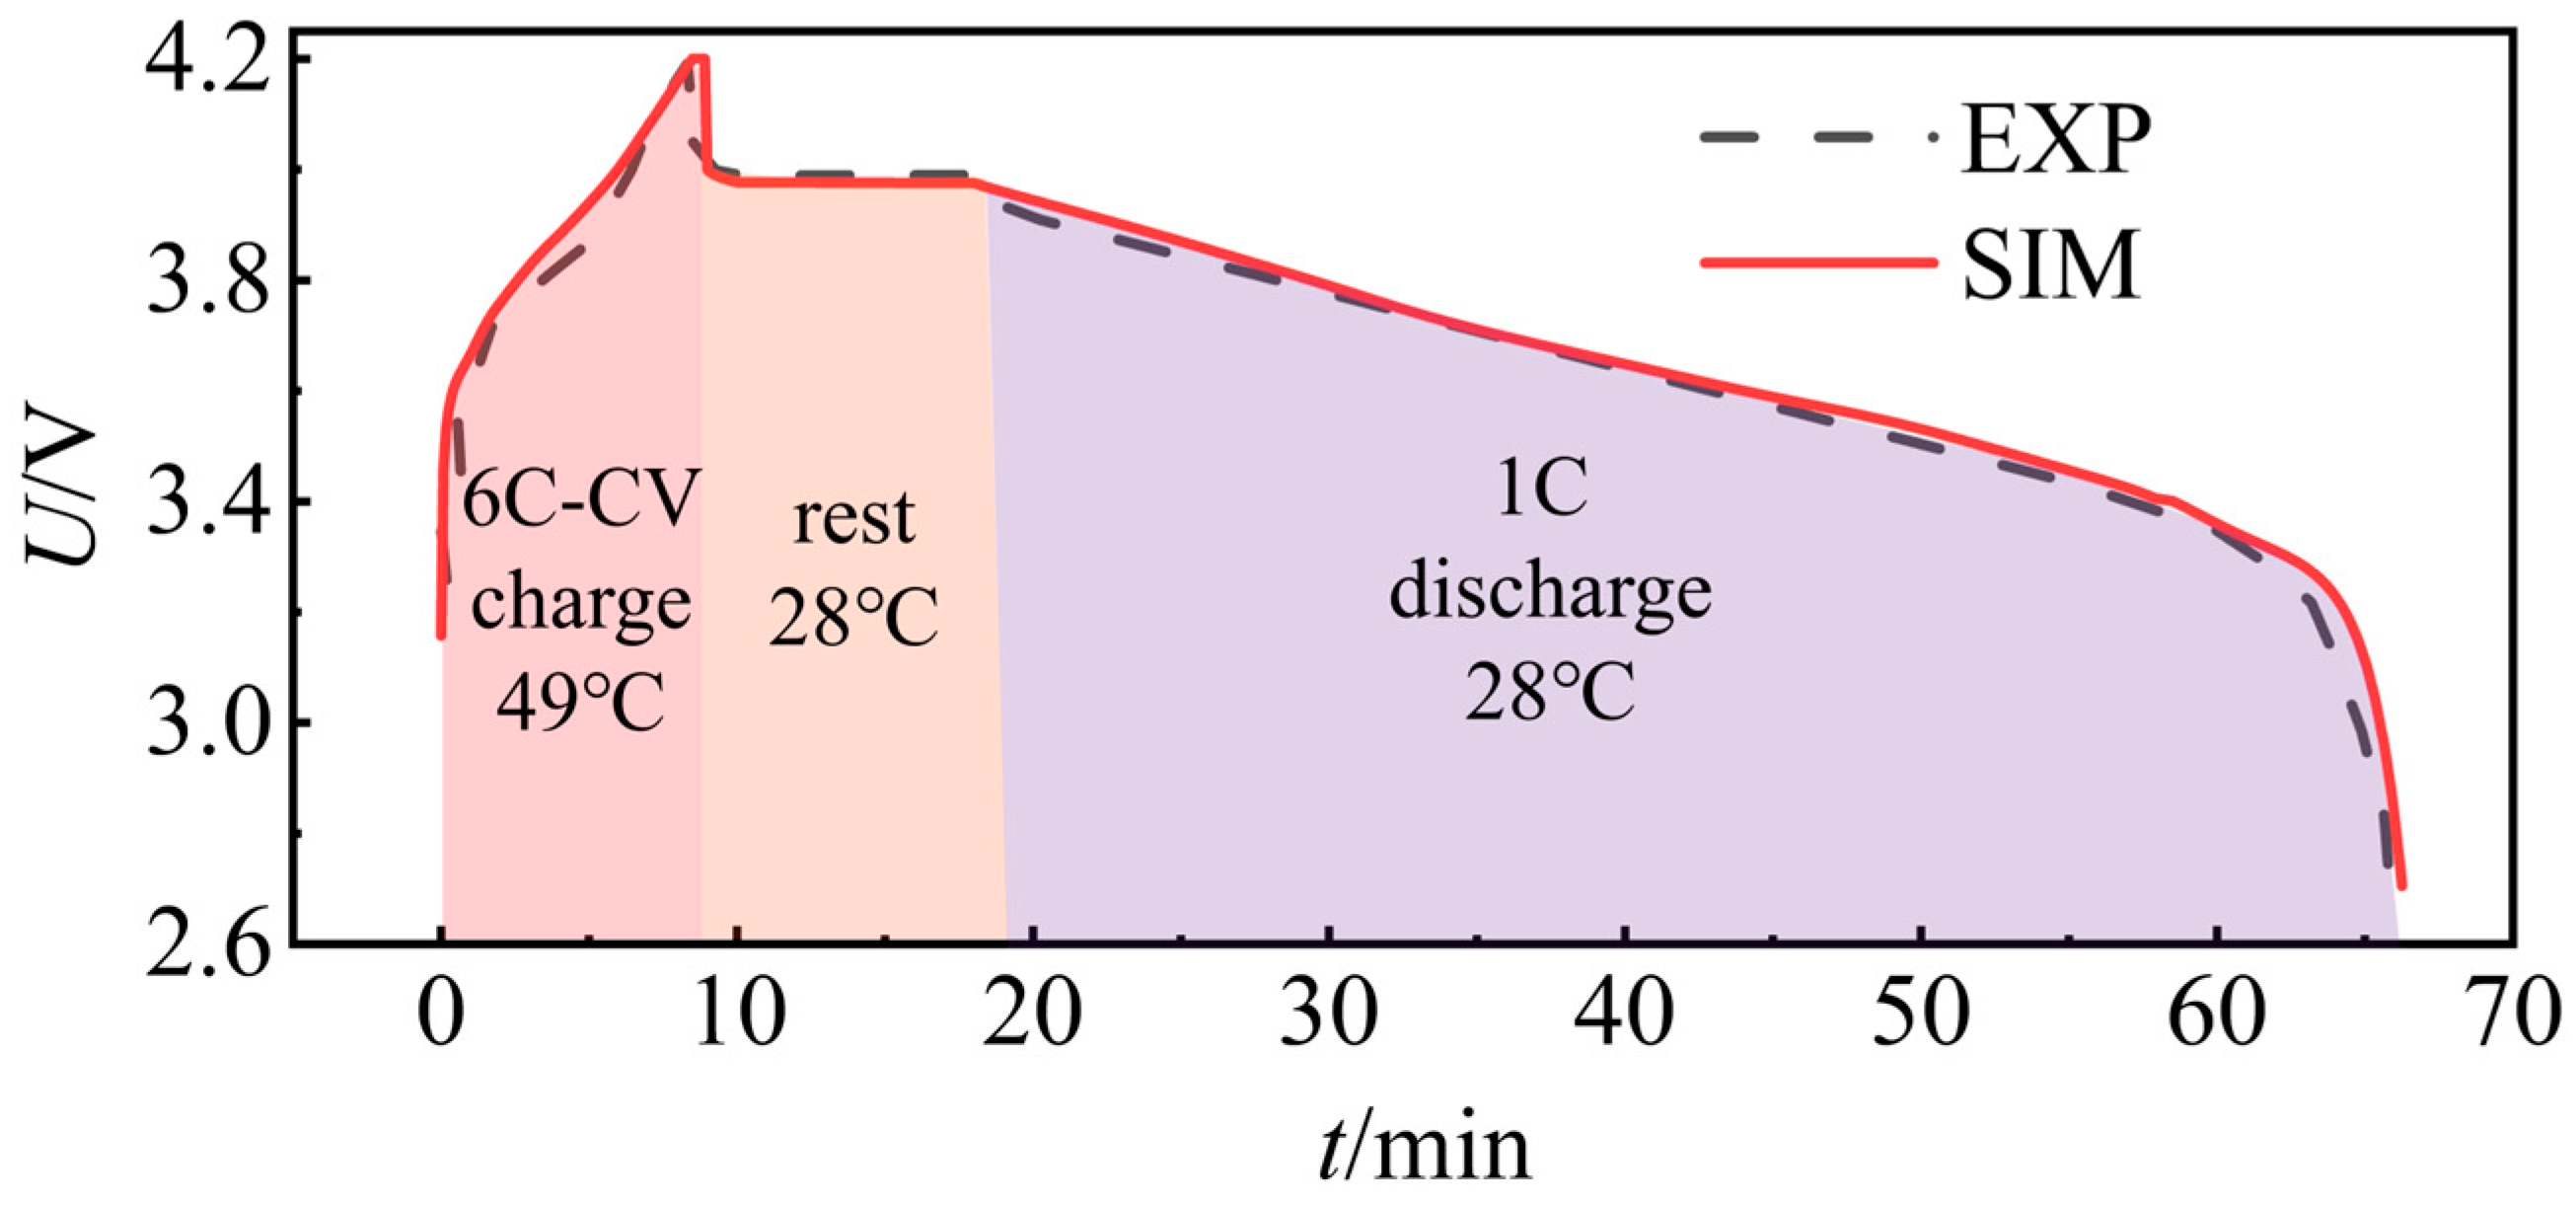
As illustrated in Figure 4, a comparison is made between simulation and experimental results operating under an ATM model. The PHEV cell utilizes a conventional CC-CV charging strategy, a method that is extensively employed to optimize the cell’s capacity. During the charging stage, a high charging current of 6C is applied to the cell, and the temperature is elevated to 49 °C. When the cell voltage rises to a set value of 4.2 V, the charging current is reduced, thereby ensuring the battery voltage remains at 4.2 V until the current falls to one-tenth of its initial value of 0.6C. It has been observed that the duration of the charging stage is marginally less than 10 min. This phenomenon can be attributed to the material properties changing in response to an increase in temperature, thereby reducing the charging time to a modest extent. At the conclusion of the charging stage, the cell is placed into a rest period during which no current is applied, and subsequently discharges at a rate of 1C at room temperature. The simulation results agree well with the experimental results obtained by Yang et al. [40].
Figure 4.
Comparison of simulation and experimental results under ATM conditions with CC-CV charging strategy.
However, we acknowledge that direct experimental comparisons of detailed behaviors such as tail-voltage characteristics, coulombic efficiency, and the onset of lithium plating under ATM conditions are currently limited in the available literature. These parameters require high-resolution voltage diagnostics, which are not accessible in the existing experimental data. As a result, the current validation of the model is focused primarily on global capacity-retention trends, which are in good agreement with experimental data.
3.2. CR Change Under Different Current and Plating Situations
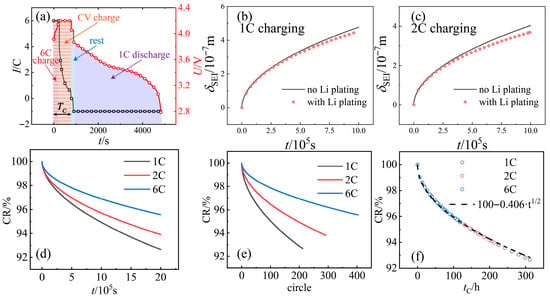
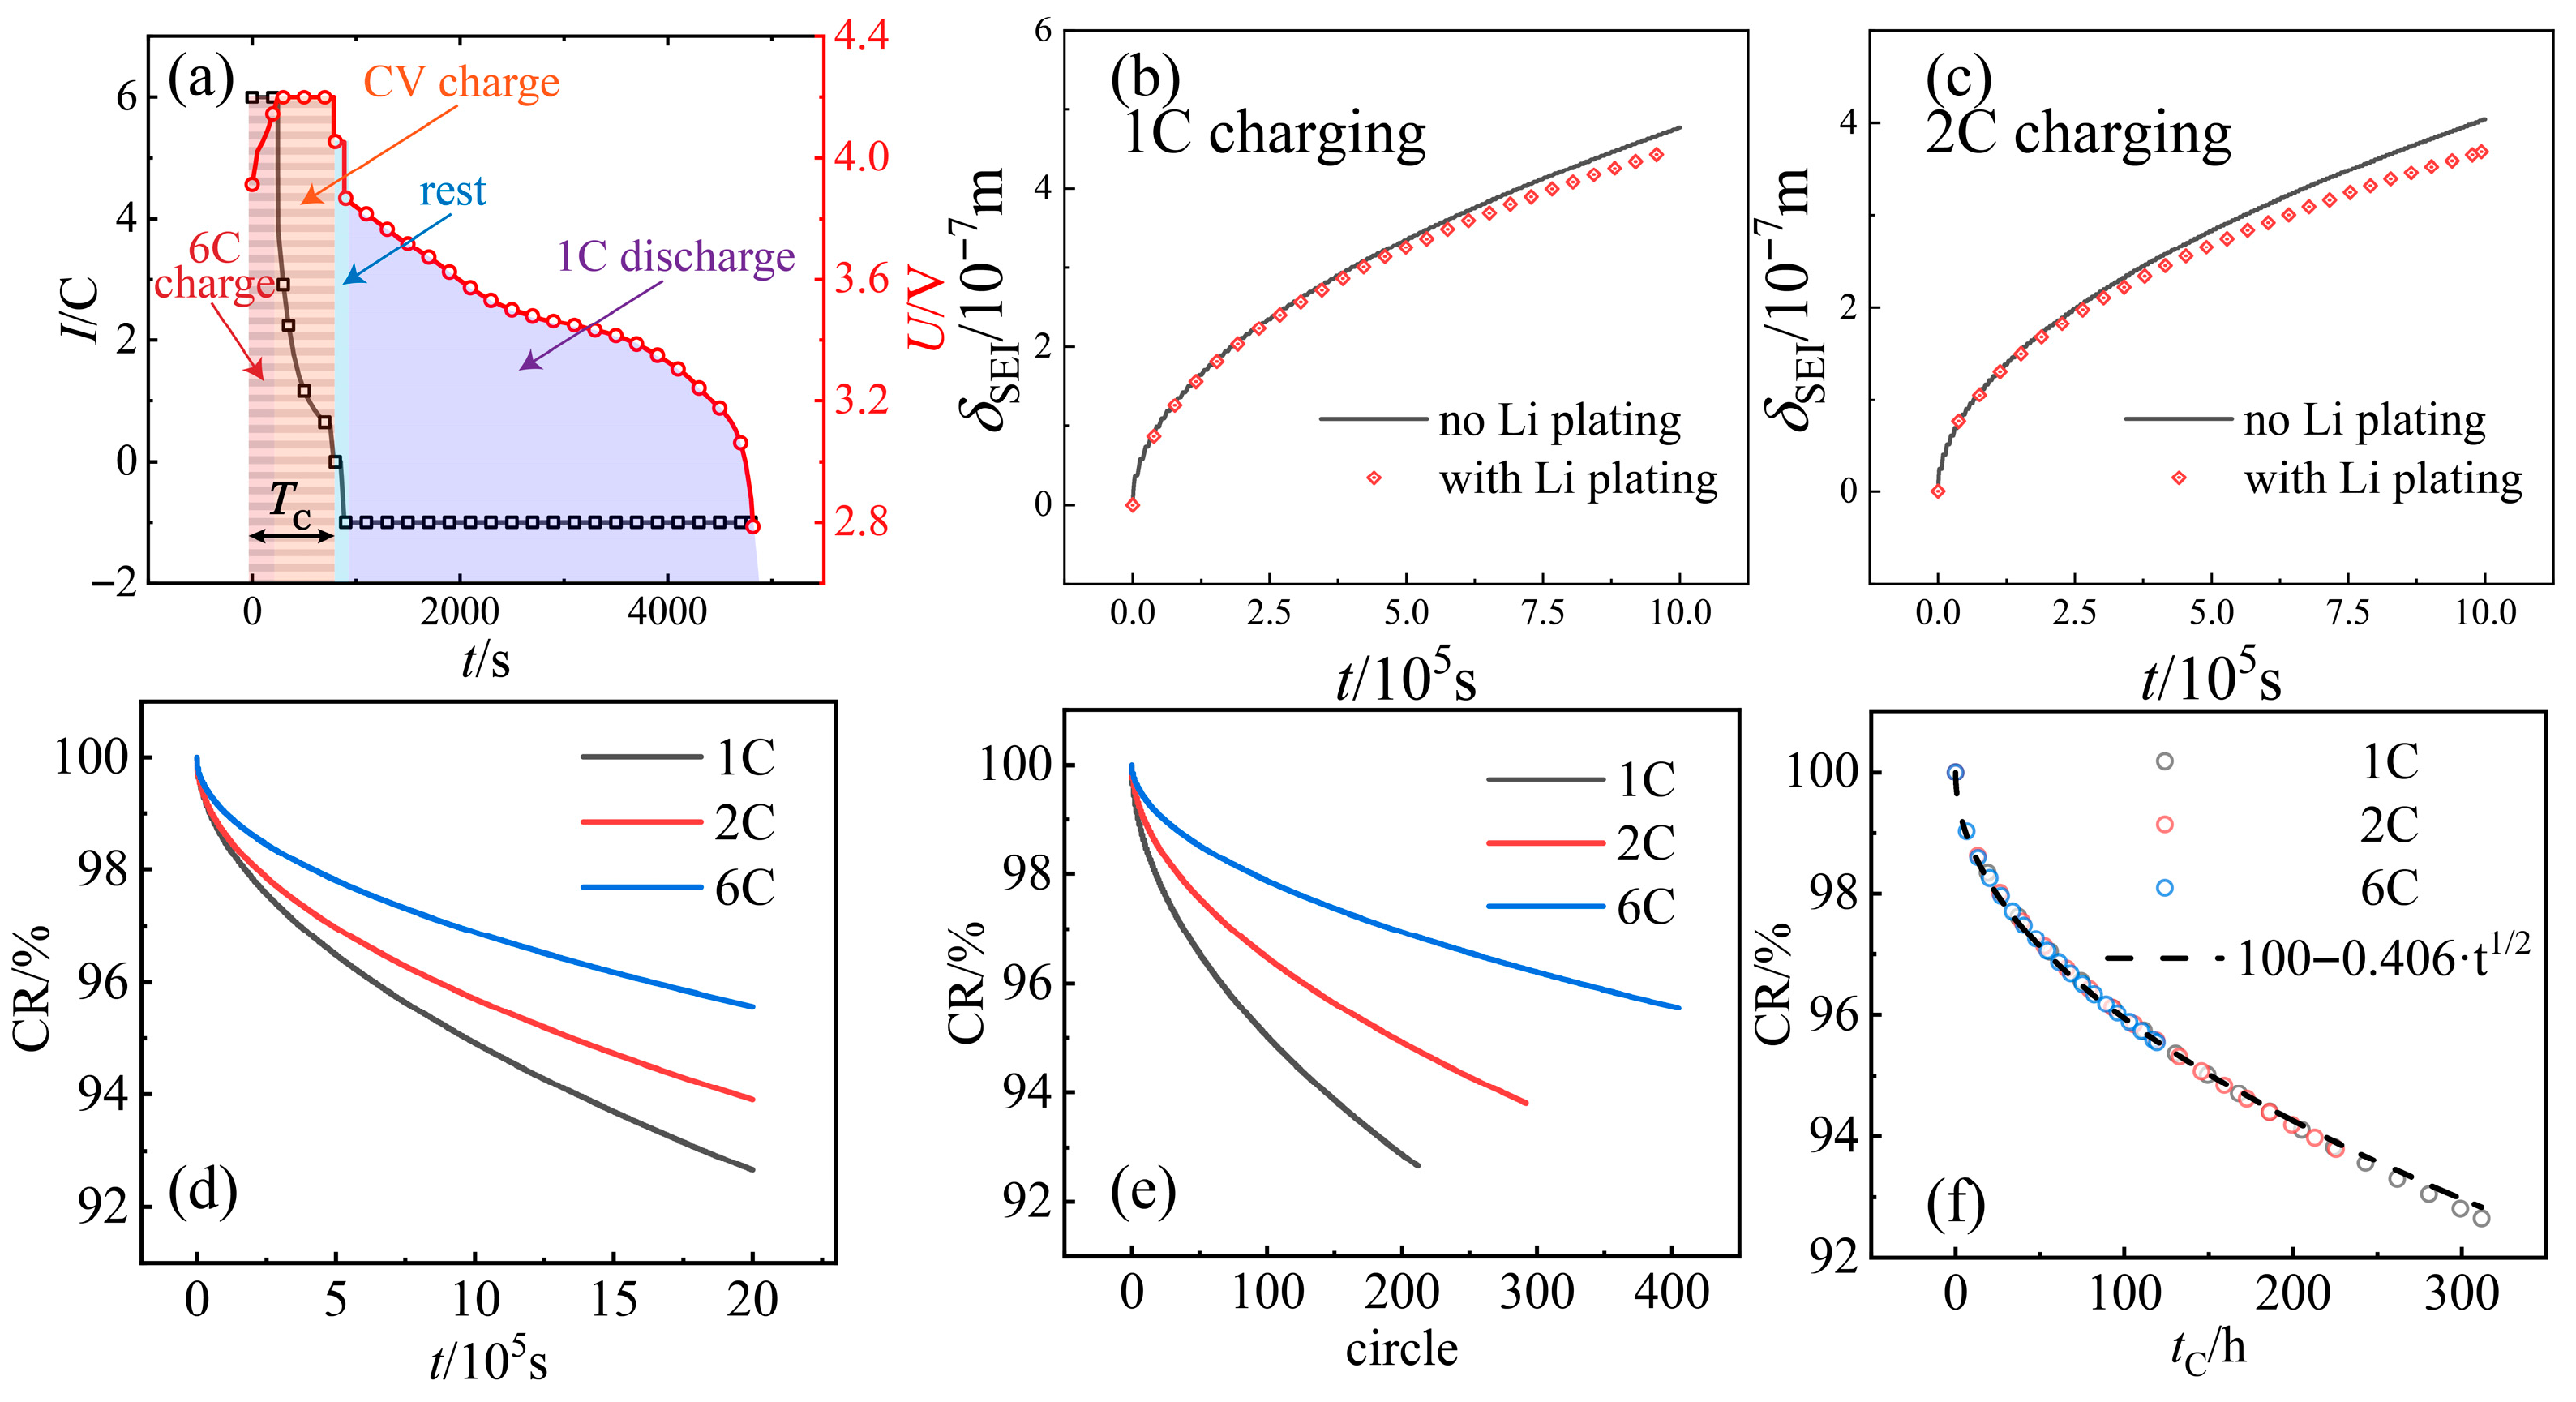
Figure 5a presents the current and voltage curves for a typical CC-CV charging, CC discharging cycle at a charging temperature of 40 °C, where the CC cutoff voltage is set to 4.2 V and the CV cutoff current to 0.6C (i.e., 1/10th of the CC charging current). Given that both SEI generation and Li plating occur during the charging stage when the cell temperature is elevated, the aggregated time of charging the cell experienced is defined as tC, with TC expressing the charging temperature. During this asymmetric-temperature charge/discharge cycle, the battery temperature is set to be constant at TC for CC-CV charging and constant at room temperature during discharging.
Figure 5.
(a) Voltage (red) and current (black) profile of a cell cycling under CC-CV condition with TC = 40 °C; (b) comparison of SEI layer thicknesses with and without considering lithium plating for 1C charging; (c) comparison of SEI layer thicknesses with and without considering lithium plating for 2C charging; (d) CR variation with time for different charge currents; (e) CR variation with cycle number for different charge currents; (f) CR variation with tC for different charge currents.
To further investigate the factors influencing battery capacity retention, it is essential to assess the impact of lithium plating on SEI formation. As illustrated in Figure 5b,c, the thickness of the SEI layer is compared with and without the inclusion of lithium plating. The simulation results show that after a certain period, the SEI layer considering lithium plating is thinner compared to the one without it. Although the reduction of recyclable lithium due to lithium plating may affect SEI formation by altering the reaction overpotential, the primary factor behind this observed difference is that, once a certain amount of SEI has formed and lithium plating begins, the plated lithium contributes to an increase in the total layer thickness. This leads to enhanced diffusion resistance of EC and, consequently, a reduced SEI generation rate. As the intensity of lithium plating increases with higher charge currents, the difference in SEI layer thickness between the cases with and without lithium plating becomes more pronounced at a 2C charge current, with average errors of 5.24% and 4.85% for 2C and 1C currents, respectively. However, it can be concluded that even under elevated charge currents, the change in SEI layer thickness with and without lithium plating remains relatively small and can be neglected in further studies.
As demonstrated in Figure 5d–f, the variation in capacity retention (CR) due to SEI generation is examined over different time periods for various charging rates. The results clearly show that increasing the charging rate significantly reduces the time required for charging the battery, leading to a substantial difference in the number of charge–discharge cycles performed within the same time frame. Figure 5d illustrates that, when the cell undergoes cycling for the same time period and SEI generation is considered as the sole degradation mechanism, the capacity retention decreases with decreasing charge current. This contrasts with experimental findings [41,42], which suggest that CR due to SEI generation is not affected by charge currents. This discrepancy indicates that total cycle time is not a suitable parameter for analyzing CR induced by SEI generation.
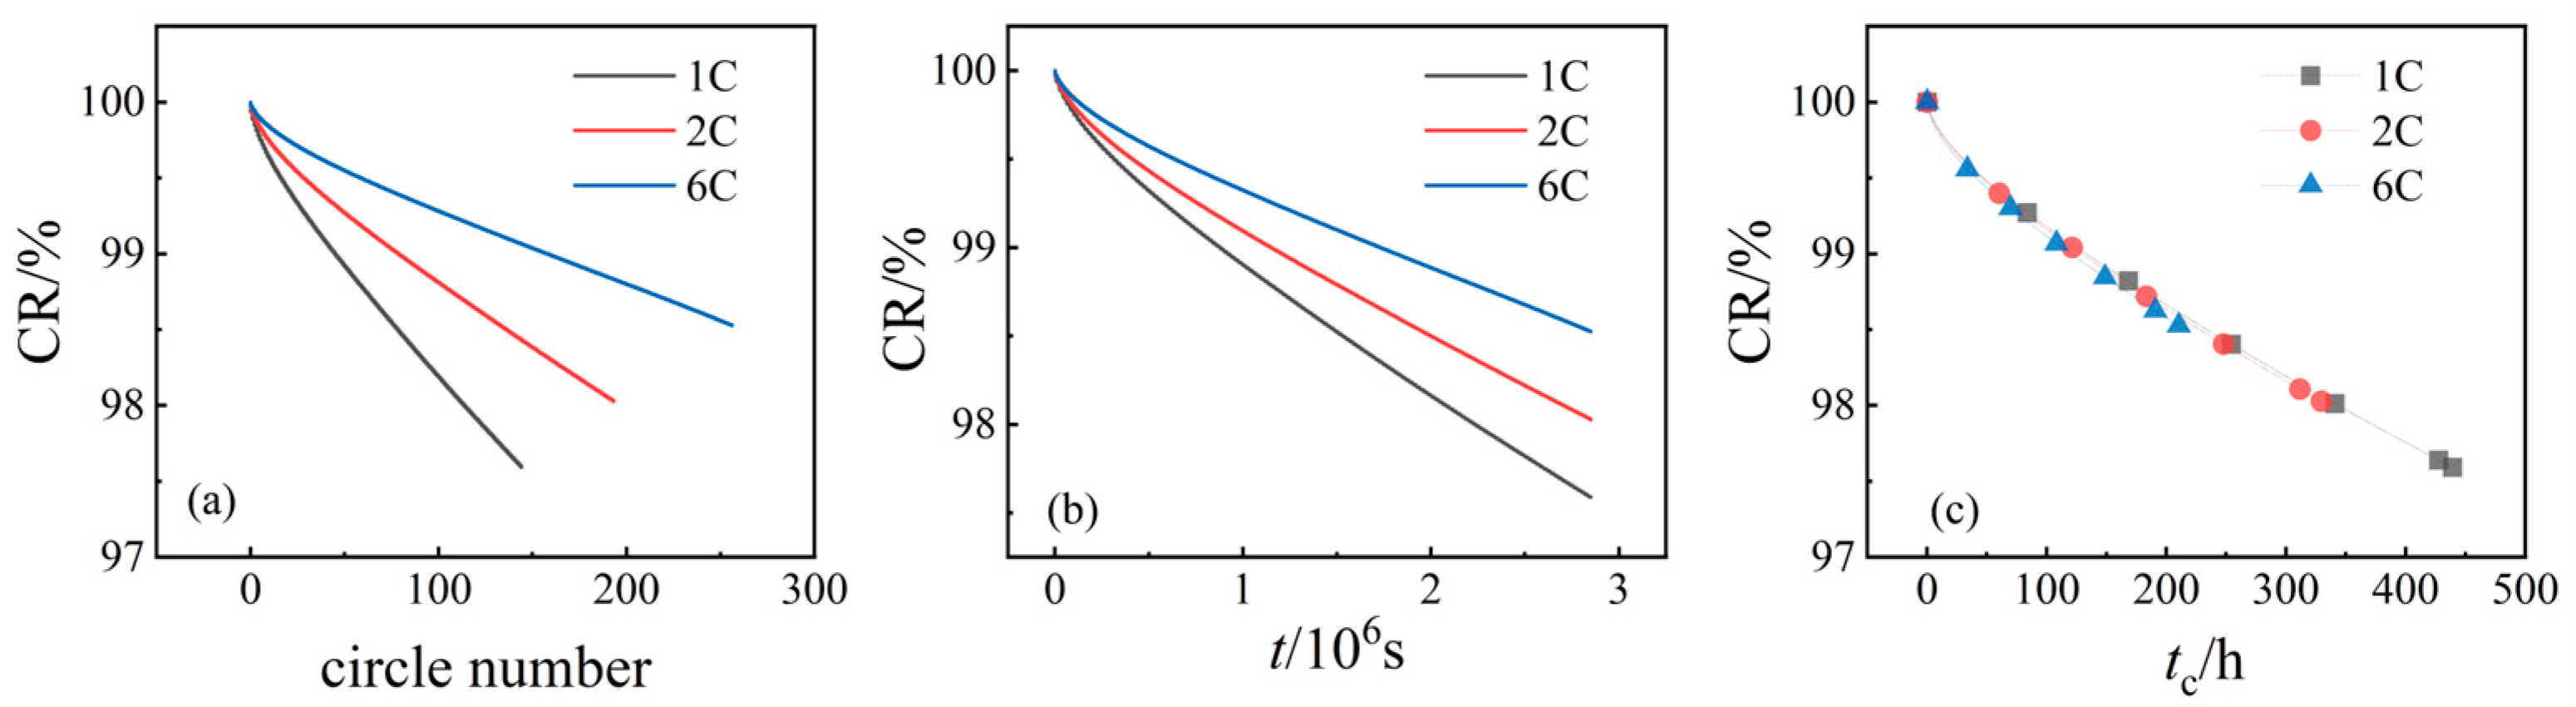
In order to validate the relationship between SEI-induced capacity fade and time at different temperatures, we conducted additional simulations at a temperature of 26 °C, as shown in Figure 6. Figure 6a–c illustrate the capacity retention (CR) variation with respect to time, cycle number, and charging time (tC) under different charging currents (1C, 2C, and 6C). The results demonstrate that the CR curves for each charge current closely overlap at a constant temperature, confirming that SEI-induced capacity fade shows a consistent numerical relationship with time, regardless of the charging rate. This finding is consistent with the model assumptions and provides further validation of the assumption that, under constant temperature, the capacity fade due to SEI formation is independent of the charging rate. These results, obtained across multiple charging conditions, corroborate the initial conclusions drawn from the model and provide stronger evidence for the reliability of the relationship between SEI degradation and time.
Figure 6.
CR profiles at Tc = 26 °C. (a) CR variation with time for different charge currents; (b) CR variation with cycle number for different charge currents; and (c) CR variation with tC for different charge currents.
As shown in Figure 5e, the total number of cycles in 1C charging mode is reduced for a given total time, and the battery remains at elevated temperatures for a longer period. Figure 5e further shows that the number of cycles completed under 6C charging conditions is nearly double that under 1C. The horizontal axis, tC, represents the total time the battery spends in the charging state (i.e., the total time the battery is at an elevated temperature). The black dashed line represents the experimental reference value from literature. The data presented in Figure 5d demonstrate that, under the three charging rates of 1C, 2C, and 6C, the capacity degradation caused by SEI generation aligns well with the empirical correlation equation. This suggests that, under the model’s assumptions and operating conditions, the effect of modifying the charging current and the subsequent lithium plating on SEI formation is negligible. Therefore, the present study uses the empirical correlation equation as a foundation to assess the impact of lithium plating and SEI generation on battery capacity.
3.3. Analysis of SEI Formation
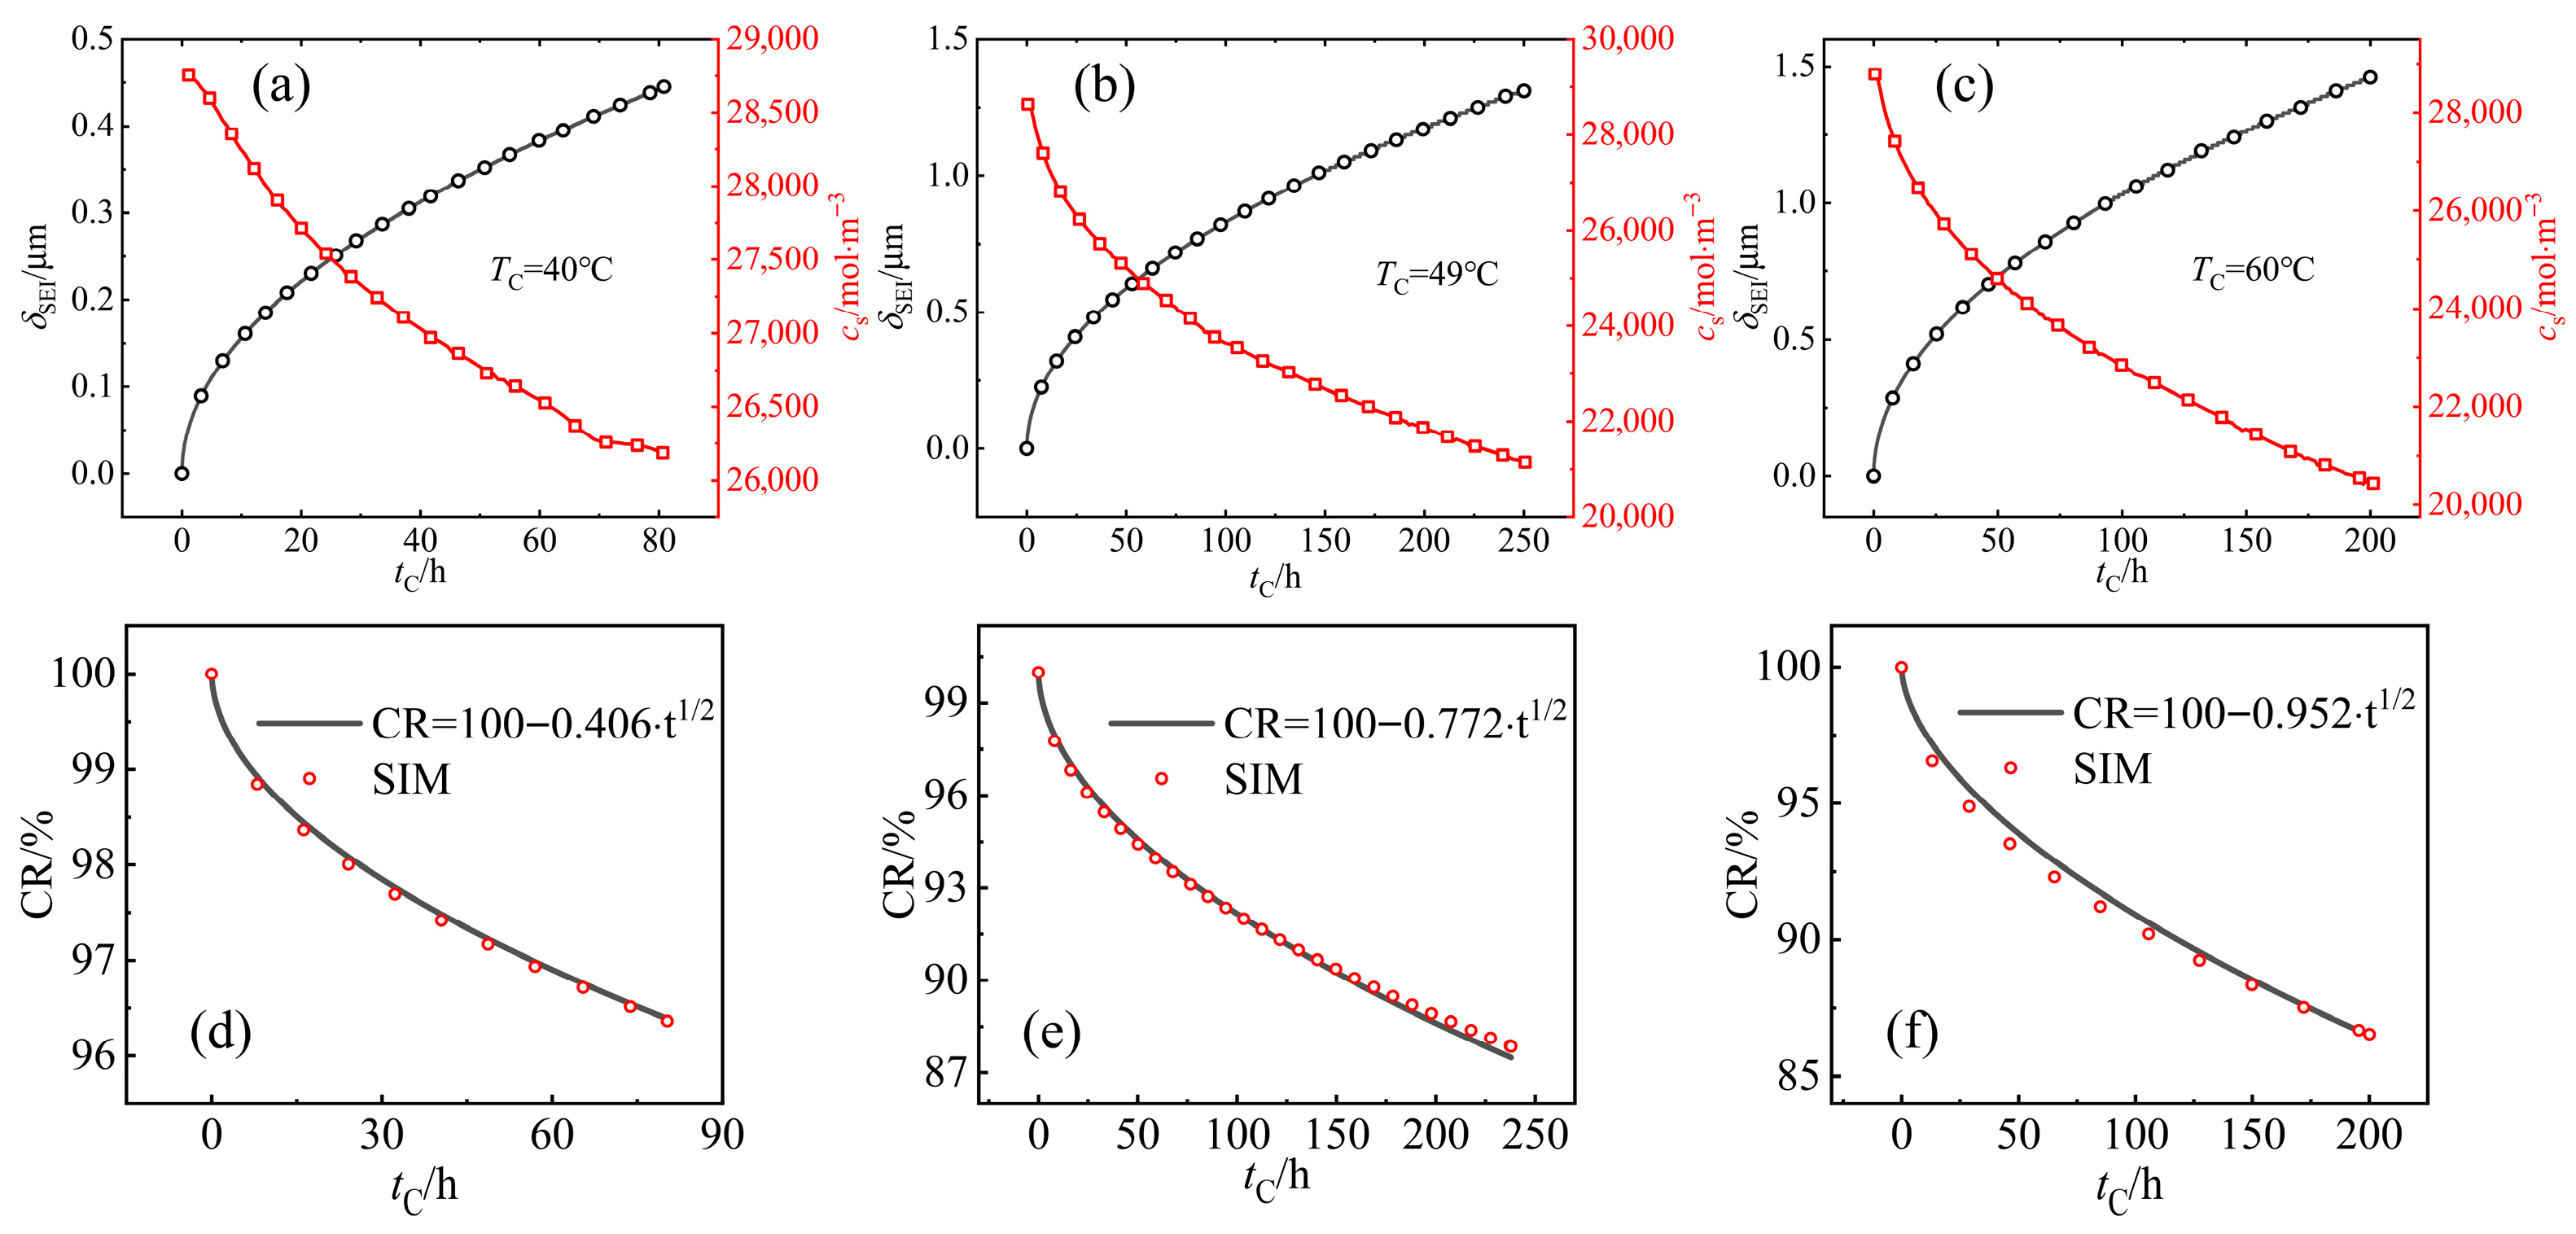
In this section, the Li plating current is set to zero, and SEI formation is considered the only side reaction affecting CR, so its regulation can be examined. The process of SEI formation exerts a significant influence on the capacity of batteries, operating through two principal mechanisms. Firstly, it leads to an increased layer thickness, resulting in an associated increase in layer resistance. Secondly, it contributes to a reduction in recyclable lithium, thereby impacting the overall capacity of the battery. As demonstrated in Figure 7a–c, the SEI layer thickness remains at a low level, which would not increase the layer resistance by a significant amount. It has been demonstrated that a marked decline in solid phase concentration is observed. As the charge temperature is set at 40 °C, the concentration is approximately 3000 mol/m3 at tC = 80 h. However, when the charge temperature is increased to 49 °C, the concentration decrease is around 6000 mol/m3, and finally, at 60 °C, the concentration decrease reaches approximately 7000 mol/m3. The observed phenomenon can be attributed to the fact that the concentration loss is the primary cause of capacity degradation resulting from SEI generation. Furthermore, the diffusion resistance of EC increases with the formation of the SEI layer, thereby leading to a slowed decline in concentration with an increase in tC.
Figure 7.
Change in SEI thickness and solid phase concentration with (a) TC = 40 °C, (b) TC = 49 °C, and (c) TC = 60 °C. Comparison of empirical correlation equation and simulation results, with (d) TC = 40 °C, (e) TC = 49 °C, and (f) TC = 60 °C.
Numerous studies have demonstrated that the CR caused by SEI formation and the time of battery staying in charging follow a pattern of t1/2 dependence [41,43], which can be expressed as:
As demonstrated in the preceding section, the CR curve of SEI generation at a charging current of 6C can be represented by the same cell cycling at 1C for an equivalent charging temperature. It can be posited that, in circumstances where a minimal charging current is present, the Li plating reaction may not occur. Consequently, the CR curve of SEI degradation in ATM cycles can be represented by the experimental results when the cell is cycled at a 1C charging current. In this paper, the parameter a in Equation (24) is obtained from experimental results [40] under such conditions.
By adjusting the kinetic rate constant k0,SEI and diffusivity of EC DEC [28], CR caused by SEI formation is adjusted to the experimental results under different charging temperatures of 40 °C, 49 °C and 60 °C. As demonstrated in the preceding section, Li plating exerts minimal influence on the CR resulting from SEI formation. Consequently, the adjusted values of k0,SEI and DEC are deemed to be the appropriate values when Li plating is taken into consideration.
3.4. Lithium Plating and Stripping Under Different ATM Cycles
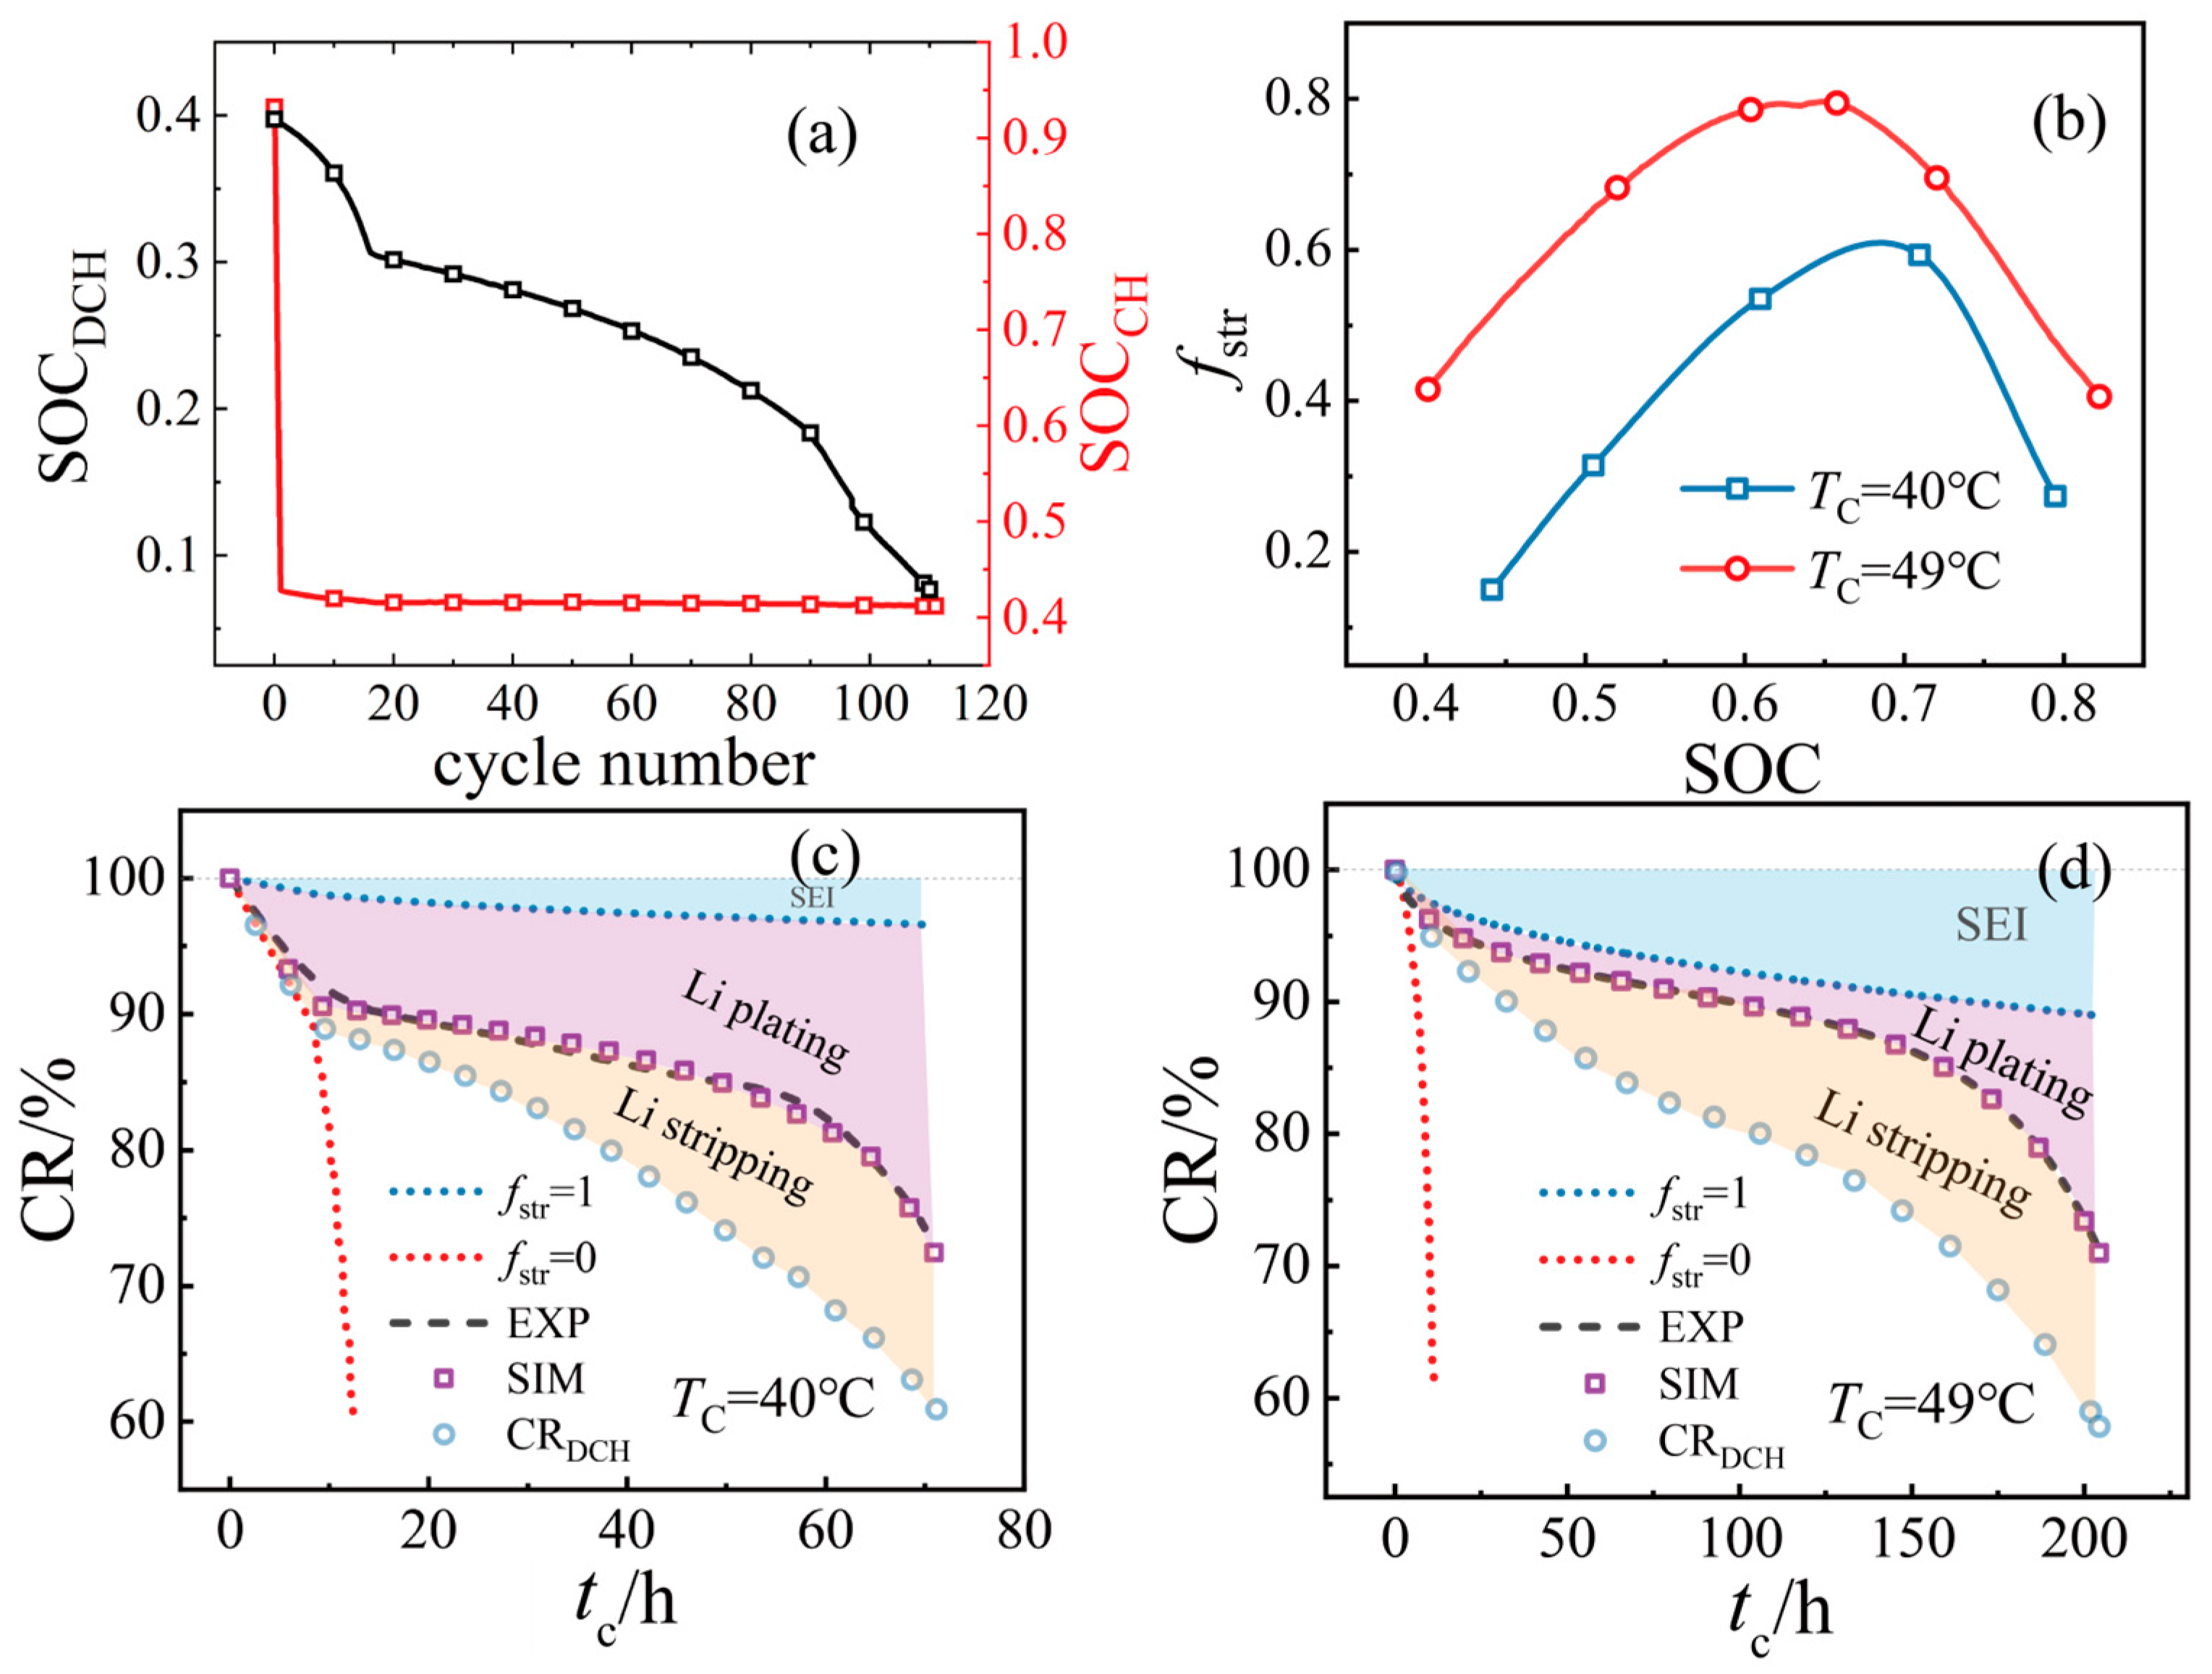
As illustrated in Figure 8a, with an increase in cycle number, there is a substantial decline in the SOC at the commencement of the discharging stage. This is attributable to the loss of recyclable lithium ions, a consequence of both SEI generation and Li plating. Such loss has been shown to have a detrimental effect on the potential of cell SOC in each cycle, with the maximum SOC in each cycle dropping in line with the capacity degradation of the cell.
Figure 8.
(a) SOC change with cycle number at the beginning of each charge/discharge stage; (b) variation in reversibility with SOC at different TC; (c) comparison of CR for different conditions at TC = 40 °C; (d) comparison of CR for different conditions at TC = 49 °C.
Research undertaken hitherto has demonstrated that the reversibility of plated lithium is associated with changes in SOC levels. Petzl et al. [44] conducted experiments that demonstrated the reversibility of plated lithium within the temperature range of −26 °C to −20 °C. The findings of the study indicate that when the battery was charged to varying levels of SOC, reversibility initially increased with SOC rise, subsequently decreasing at higher levels. This paper contends that the change in reversibility of plated lithium should be regarded as a critical factor affecting capacity degradation caused by Li plating. The experimental results of ATM cells [40] cycling at temperatures of 40 °C and 49 °C were coupled to obtain a hill-shaped curve of reversibility versus SOC. This curve followed the regulation of reversibility change within the range of −26 °C to −20 °C, suggesting that Li stripping and the reversibility change could be the cause of the unusual CR curve in the ATM experiments. This phenomenon is analogous to the trend of reversibility change in ATM conditions, suggesting plated lithium may also undergo similar regulation. Consequently, the reduction in the acceleration of lithium plating may be attributable to the same phenomenon.
Specifically, The reversibility-SOC relationship at TC = 49 °C can be well fitted using the following expression:
where A = −2.72665, B = 11.41656, C = −9.26513. While for TC = 40 °C, the fitting yields:
where A = −4.10001, B = 14.55573, C = −11.33519.
Figure 8c,d illustrate the variation in CR under differing conditions at TC = 40 °C and TC = 49 °C, respectively. In the event of the reversibility being set to zero, lithium stripping does not occur during the discharge process, and the cell capacity undergoes a significant decrease as a consequence of the rapid lithium plating reaction. When the reversibility parameter is set to 1, it signifies that all lithium plated during charging is stripped during discharge, resulting in a CR curve that is identical to the one caused by SEI generation exclusively. In principle, the Li plating should exhibit an accelerating trend with an increase in cycle number. However, experimental findings reveal a decelerate-accelerate process that remains unexplained when SEI formation and Li plating are considered as the sole side reactions. The assumption that Li stripping is the primary cause of this phenomenon, in conjunction with the application of a hill-shaped curve to describe the relationship between reversibility and SOC, has been demonstrated to produce simulation results that exhibit a high degree of agreement with experimental results. This finding serves to substantiate the rationality of the hill-shaped curve of reversibility.
A comparison of Figure 8c,d reveals that an increase in the charging temperature results in a twofold enhancement in capacity degradation caused by SEI generation at tC = 80 h. However, it has been demonstrated that Li plating is the primary cause of capacity loss, and that reversibility increases with a rise in charging temperature. Consequently, CR of the ATM cell improves with an increase in temperature, thus offering a solution to solve capacity degradation of lithium-ion batteries under extreme fast charging conditions.
3.5. Heat and Energy Analysis
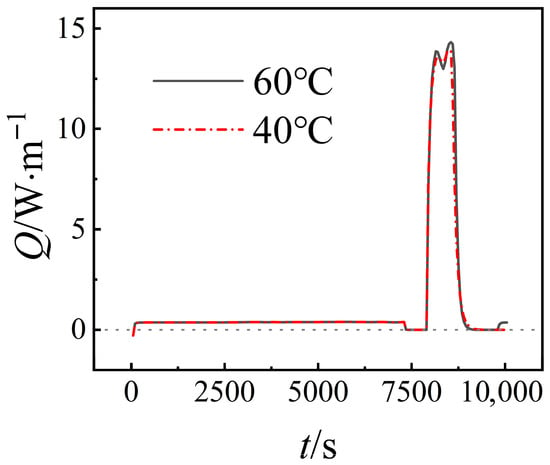
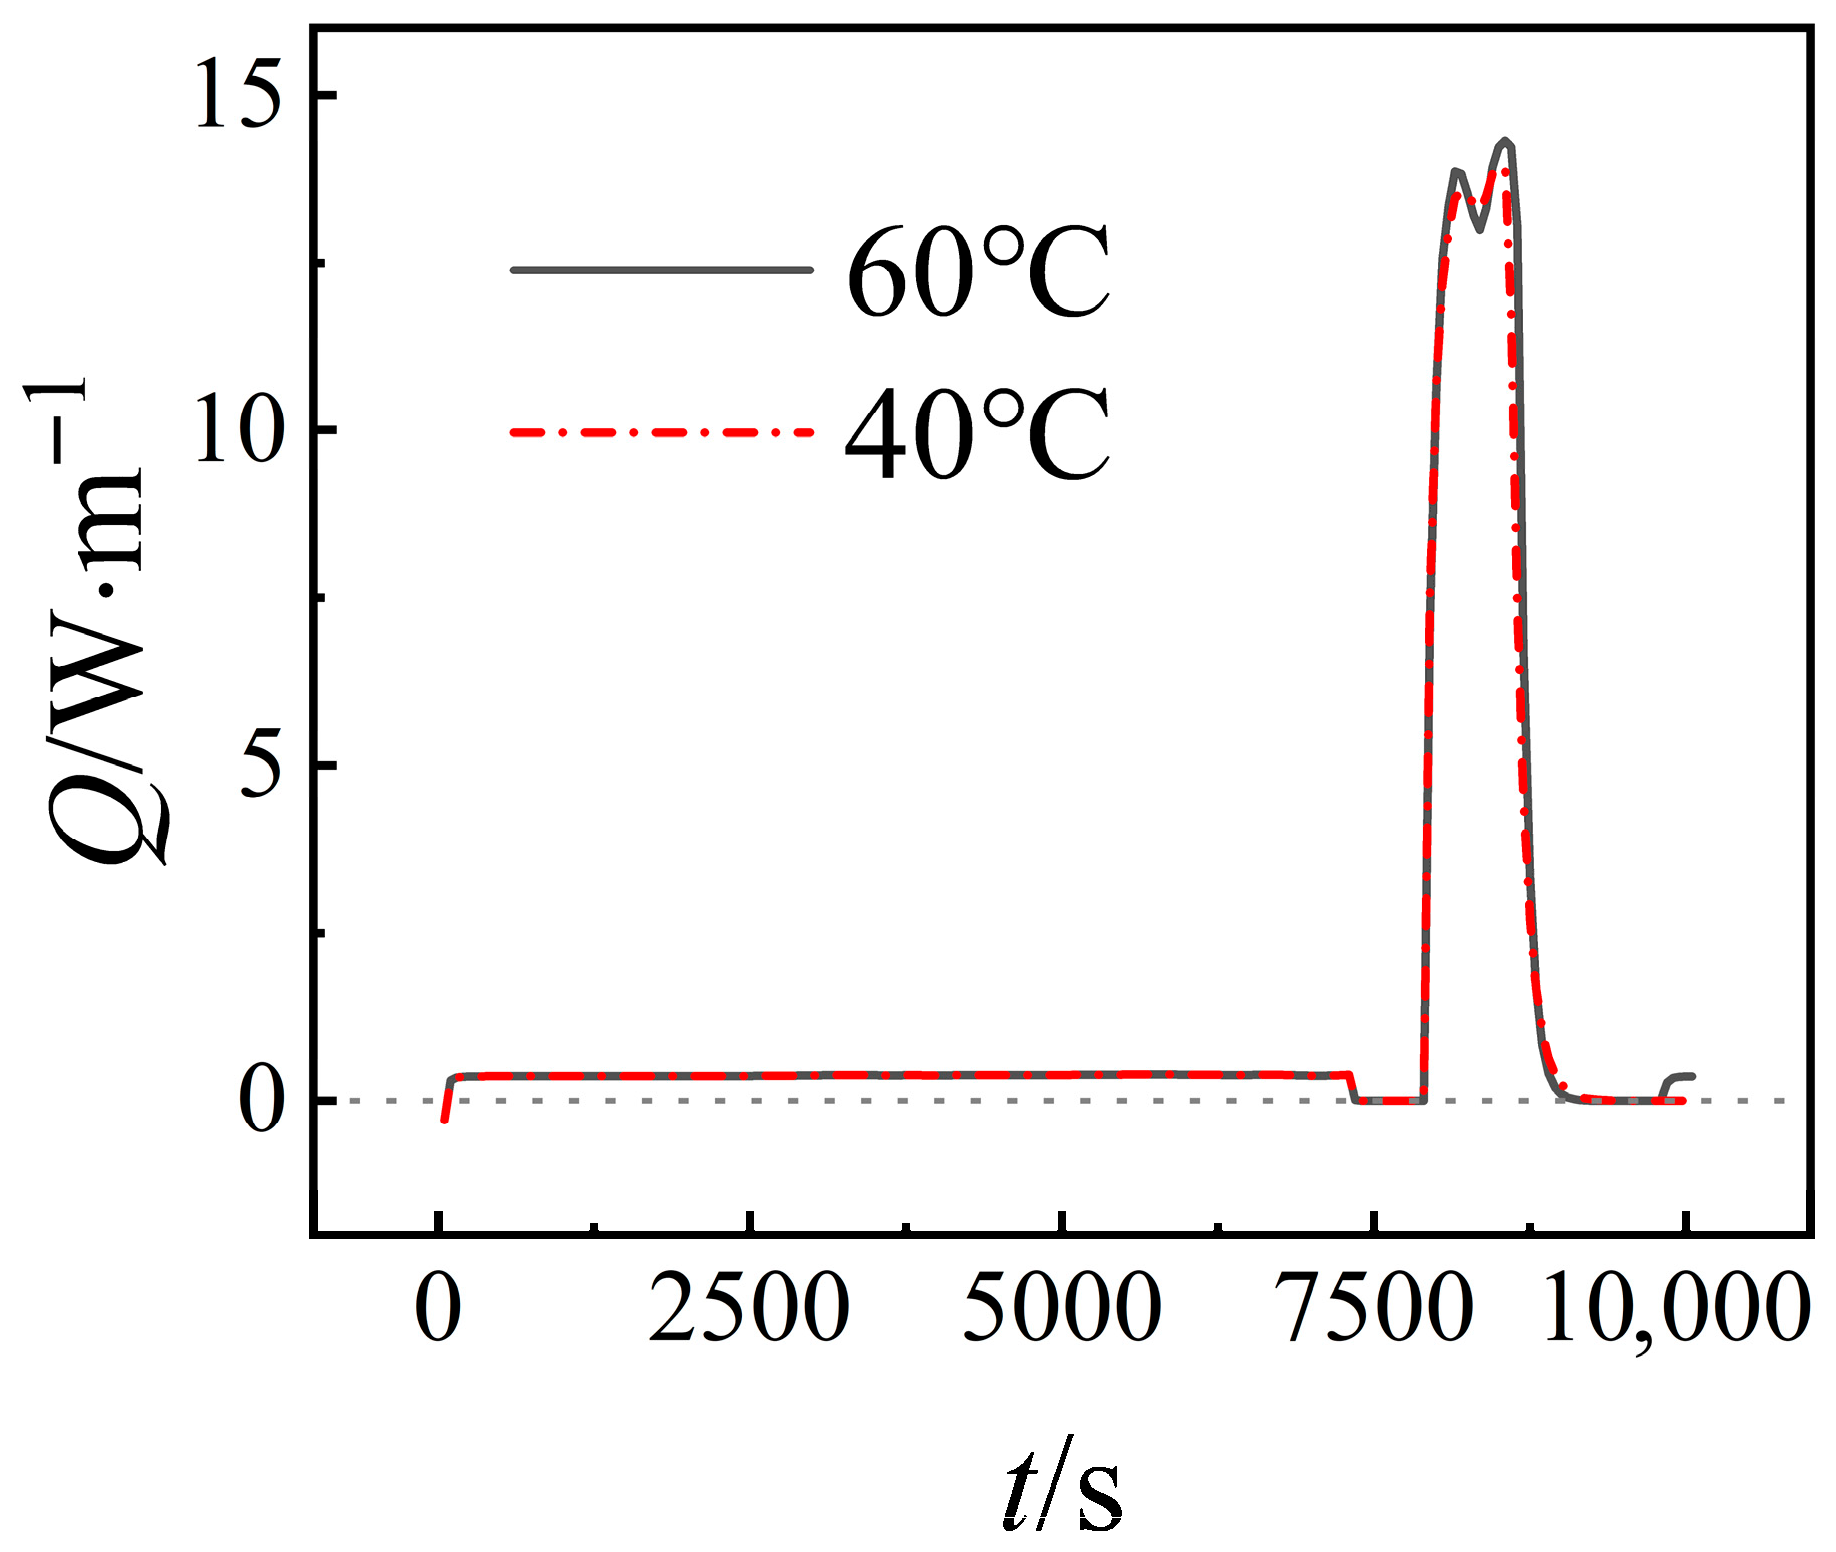
Figure 9 presents the heat generation of the cell during ATM cycles. As demonstrated in Figure 9, the generation of heat in cells encompasses reversible, irreversible, and ohmic heat generation. The predominant heat generation in cells occurs during the charge stage, where the current levels are considerably higher, particularly under extreme fast charging conditions. Consequently, ohmic heat is the predominant factor in heat generation during ATM cycles. A comparison of the heat generated at temperatures of 60 °C and 40 °C reveals that the former is only slightly higher than the latter. This finding indicates that the inner resistance of the cell is not significantly influenced by temperature.
Figure 9.
Comparison of heat generation for different temperatures.
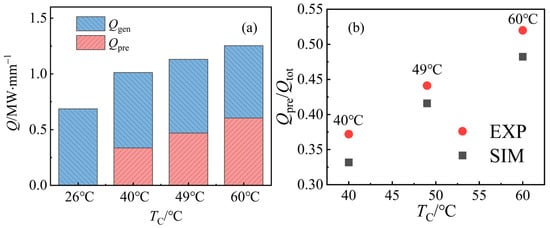
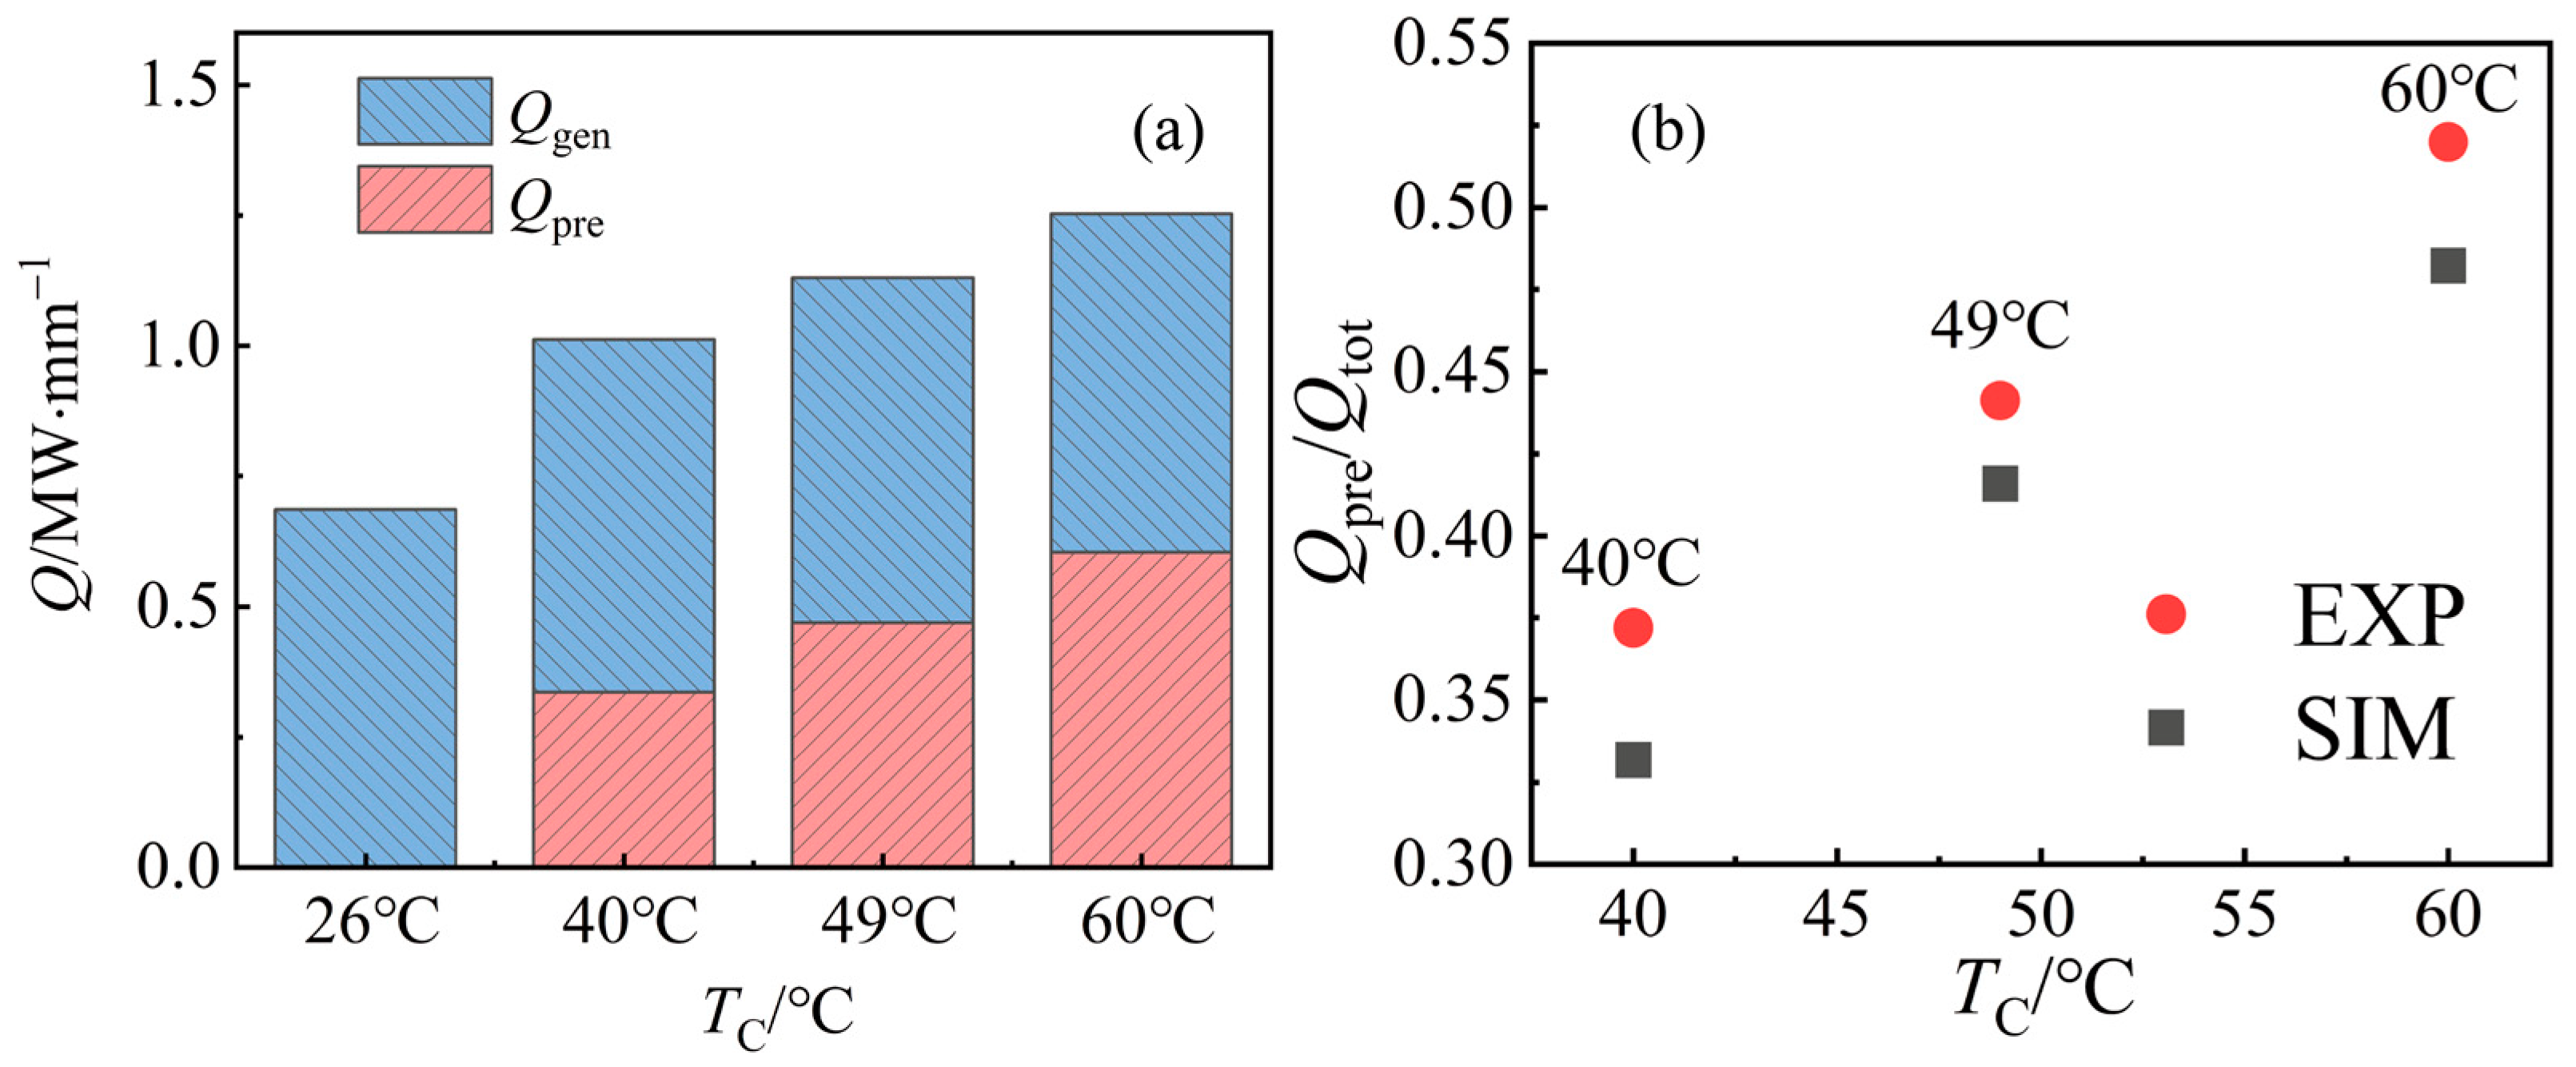
In order to apply the ATM method, the cell must be preheated before each charging stage and cooled after each stage. Preheating requires additional energy to achieve the necessary elevated temperature, leading to energy dissipation when compared with conventional charging strategies. As demonstrated in Figure 10a, while there is a slight increase in heat loss as the charging temperature rises, the energy required for preheating also escalates. A higher charging temperature demands more energy during the preheating process. However, the total heat loss caused by the elevated charging temperature remains relatively small. In fact, increasing the charging temperature by 34 °C only doubles the total heat loss, which is a minor increase when considering the significant improvement in battery lifespan.
Figure 10.
(a) Heat loss during cycle and heat for preheating; (b) comparison of experimental and simulated Qpre/Qtot ratios at different temperatures.
The heat-generation results are further validated by comparing the ratio of energy consumed for preheating to total heat loss (Qpre/Qtot), as shown in Figure 10b. The modelled ratio is in reasonable agreement with experimental data from Yang et al. [40], with an average error of 15.04%, across the investigated temperature range. This comparison supports the consistency of the predicted cell-level heat balance. However, it is important to emphasize that pack-level thermal management, coolant flow, and auxiliary power consumption are beyond the scope of the current model and should be addressed in future system-level studies.
4. Conclusions
This study presents a one-dimensional numerical model for lithium-ion batteries that incorporates key degradation mechanisms such as SEI formation, lithium plating, and lithium stripping. The influence of lithium plating on SEI growth was analyzed, and the simulation results showed an average error of 4.85% and 5.24% for 1C and 2C charge rates, respectively, over a total cycling duration of 106 s. In the current model, lithium plating is assumed to have a minimal direct impact on SEI formation. Consequently, the capacity loss due to lithium plating is calculated by subtracting the SEI-induced degradation from the total degradation. It is important to note that this conclusion is specific to the assumptions of the one-dimensional model and the operating conditions considered. Future research will further examine the impact of lithium plating on SEI generation over a broader range of operating conditions.
The simulations indicate that, within the specific temperature and current ranges investigated, the degradation caused by SEI growth is only weakly dependent on the charge current. This suggests that capacity retention (CR) under fast-charging conditions can be reasonably estimated using experimental data obtained at lower charge currents, where SEI generation is the dominant degradation mechanism. However, this observation is limited to the conditions explored in this study, and extrapolating it beyond these parameters should be treated with caution.
The reversibility of plated lithium under ATM cycling was investigated by comparing simulation results with experimental data at the end of each charge cycle. The simulations produced a hill-shaped curve of reversibility as a function of state of charge (SOC), which aligns well with experimental measurements obtained across a range of temperatures. Additionally, while the total heat loss increases with higher charging temperatures, this effect is minimal compared to the substantial improvement in battery lifespan achieved through ATM cycling. However, it is important to note that the observed impact on heat loss pertains only to cell-level behavior and does not account for pack-level thermal management or system-level efficiency losses. The model predicts a capacity retention of approximately 80% after 1000 cycles at a charging temperature of 49 °C for PHEV cells under ATM conditions.
While ATM can significantly mitigate lithium plating and improve capacity retention under the studied conditions, any practical implementation of ATM strategies must carefully balance these benefits against potential risks associated with high-temperature degradation. These risks include gas generation, transition metal dissolution, SEI dissolution, and electrolyte aging. Future work should consider these trade-offs in the context of real-world applications of ATM cycling.
Author Contributions
Conceptualization, T.H. and W.-Q.T.; Methodology, H.L., T.H. and W.-Q.T.; Validation, H.L. and W.-Z.F.; Formal Analysis, W.-Z.F.; Writing—Original Draft, H.L.; Writing—Review and Editing, H.L.; Supervision, W.-Z.F. and W.-Q.T.; Project Administration, W.-Z.F. All authors have read and agreed to the published version of the manuscript.
Funding
This study was supported by the National Natural Science Foundation of China (No. 52206110). Support was also provided by the S&T Program of Energy Shaanxi Laboratory (Grant No. ESLB202431).
Data Availability Statement
The original contributions presented in this study are included in the article. Further inquiries can be directed to the corresponding author.
Conflicts of Interest
The authors declare no conflict of interest.
Abbreviations
The following abbreviations are used in this manuscript:
| is | Solid phase current density |
| As | Specific surface area for the faradaic reaction per unit volume |
| ifara | Transfer current density of lithium intercalation |
| itot | Total volumetric current density |
| k0 | Faradaic reaction rate |
| Maximum lithium concentration in the solid phase of the electrodes | |
| Effective solid phase electrical conductivity | |
| Electronic conductivity of solid matrix | |
| Uref,i | Open circuit potential of the electrodes at the reference temperature |
| Entropic change | |
| Kinetic rate constant | |
| Equilibrium potential of SEI formation reaction | |
| Concentration of EC on the surface of graphite | |
| Resistance of surface film (in this model, determined by SEI only) | |
| Volume fraction of SEI in the film | |
| Ionic conductivity | |
| Exchange current density of Li deposition | |
| Equivalent thickness of the surface film | |
| M | Molar weight |
| Density | |
| Volume fraction of electrolyte phase | |
| Volume fraction of filler | |
| Volume fraction of the polymer matrix | |
| Rs | Radius of the active particles |
| il | Solid phase current density |
| Effective electrolyte phase electrical conductivity | |
| R | Universal gas constant |
| F | Faraday’s constant |
| Transference number of cation | |
| Diffusivity of EC | |
| Concentration of EC in the bulk electrolyte | |
| Thickness of the surface film | |
| Molar concentrations of SEI per unit volume of the electrode | |
| Porosity of electrolyte | |
| Effective electrolyte phase diffusion coefficient | |
| Temperature-dependent properties | |
| Tref | Reference temperature |
| Activation energy | |
| Initial state of charge (SOC) at the positive electrodes | |
| Initial state of charge (SOC) at the negative electrodes | |
| Surface concentration of lithium ions | |
| Average concentration of lithium ions in the active material | |
| ls | Diffusion length for the particles of the electrodes |
| cs | Solid phase concentration in the active material particles of the electrodes |
| Ds | Solid phase diffusion coefficient of lithium in the particles |
| Diffusion coefficient of electrolyte | |
| Bruggemann constant | |
| Vc | Cell volume |
| Ac | Surface area though which heat is removed from the cell |
| Ta | Temperature of surroundings |
| TC | Temperature during charging |
| Molar concentrations of lithium metal per unit volume of the electrode | |
| n | Unit vector in the normal direction |
| iapp | Applied current density |
| h | Heat transfer coefficient |
| keff | Effective thermal conductivity |
References
- Li, M.; Lu, J.; Chen, Z.; Amine, K. 30 years of lithium-ion batteries. Adv. Mater. 2018, 30, 1800561. [Google Scholar] [CrossRef] [Scilit]
- Kim, T.; Song, W.; Son, D.-Y.; Ono, L.K.; Qi, Y. Lithium-ion batteries: Outlook on present, future, and hybridized technologies. J. Mater. Chem. A 2019, 7, 2942–2964. [Google Scholar] [CrossRef] [Scilit]
- Blomgren, G.E. The development and future of lithium ion batteries. J. Electrochem. Soc. 2016, 164, A5019. [Google Scholar] [CrossRef] [Scilit]
- Zhu, Z.; Cai, F.; Yu, J. Improvement of electrochemical performance for AlF3-coated Li1.3Mn4/6Ni1/6Co1/6O2.40 cathode materials for Li-ion batteries. Ionics 2016, 22, 1353–1359. [Google Scholar] [CrossRef] [Scilit]
- Manthiram, A. Materials challenges and opportunities of lithium ion batteries. J. Phys. Chem. Lett. 2011, 2, 176–184. [Google Scholar] [CrossRef] [Scilit]
- Wakihara, M. Recent developments in lithium ion batteries. Mater. Sci. Eng. R Rep. 2001, 33, 109–134. [Google Scholar] [CrossRef] [Scilit]
- Ma, X.-F.; Li, H.-Y.; Tan, J.; Wang, J.; Diao, J.; Yue, J.; Tan, S.; Huang, G.; Wang, J.; Pan, F. Anisotropy of V3O7 nanobelts enables ultralong cycling life of magnesium ion battery. J. Magnes. Alloys 2025, 13, 1592–1601. [Google Scholar] [CrossRef] [Scilit]
- Qi, H.; He, C.; Song, C.; Gao, J.; Gao, Q.; Luo, W.; Zhang, Z.; Liu, H.; Yuan, X.; Wu, W. Tailoring the exposure of active facets of FeNCN towards enhanced pseudocapacitive behavior for sodium storage. Chin. Chem. Lett. 2025, 36, 111591. [Google Scholar] [CrossRef] [Scilit]
- Zhang, M.; Fu, J.; Xu, N.; Meng, L. A dual-modification strategy for both the Quinone-based cathode and Zn anode electrodes of the aqueous zinc-ion battery. Chem. Eng. J. 2025, 511, 161944. [Google Scholar] [CrossRef] [Scilit]
- Vetter, J.; Novák, P.; Wagner, M.R.; Veit, C.; Möller, K.-C.; Besenhard, J.; Winter, M.; Wohlfahrt-Mehrens, M.; Vogler, C.; Hammouche, A. Ageing mechanisms in lithium-ion batteries. J. Power Sources 2005, 147, 269–281. [Google Scholar] [CrossRef] [Scilit]
- Arora, P.; White, R.E.; Doyle, M. Capacity fade mechanisms and side reactions in lithium-ion batteries. J. Electrochem. Soc. 1998, 145, 3647. [Google Scholar] [CrossRef] [Scilit]
- Birkl, C.R.; Roberts, M.R.; McTurk, E.; Bruce, P.G.; Howey, D.A. Degradation diagnostics for lithium ion cells. J. Power Sources 2017, 341, 373–386. [Google Scholar] [CrossRef] [Scilit]
- Kwon, O.J.; Fang, W.; Wang, C.-Y. Lithium Deposition in the Anode of an Automotive Li-Ion Battery: Experiments and Modeling; ECS Meeting Abstracts, 2010; IOP Publishing: Bristol, UK, 2010; p. 279. [Google Scholar]
- Edge, J.S.; O’Kane, S.; Prosser, R.; Kirkaldy, N.D.; Patel, A.N.; Hales, A.; Ghosh, A.; Ai, W.; Chen, J.; Yang, J. Lithium ion battery degradation: What you need to know. Phys. Chem. Chem. Phys. 2021, 23, 8200–8221. [Google Scholar] [CrossRef] [Scilit] [PubMed]
- Wang, C.-Y.; Liu, T.; Yang, X.-G.; Ge, S.; Stanley, N.V.; Rountree, E.S.; Leng, Y.; McCarthy, B.D. Fast charging of energy-dense lithium-ion batteries. Nature 2022, 611, 485–490. [Google Scholar] [CrossRef] [Scilit]
- Hou, J.; Yang, M.; Wang, D.; Zhang, J. Fundamentals and challenges of lithium ion batteries at temperatures between −40 and 60 °C. Adv. Energy Mater. 2020, 10, 1904152. [Google Scholar] [CrossRef] [Scilit]
- He, Y.; Zeng, Q.; Tang, L.; Liu, F.; Li, Q.; Yin, Y.; Xu, S.; Deng, B. State of health estimation of lithium-ion battery based on full life cycle acoustic emission signals. J. Energy Storage 2025, 139, 118725. [Google Scholar] [CrossRef] [Scilit]
- Ouyang, D.; Weng, J.; Chen, M.; Wang, J. Impact of high-temperature environment on the optimal cycle rate of lithium-ion battery. J. Energy Storage 2020, 28, 101242. [Google Scholar]
- Yan, H.; Bie, Y.; Cui, X.; Xiong, G.; Chen, L. A computational investigation of thermal effect on lithium dendrite growth. Energy Convers. Manag. 2018, 161, 193–204. [Google Scholar] [CrossRef] [Scilit]
- Keil, J.; Jossen, A. Electrochemical modeling of linear and nonlinear aging of lithium-ion cells. J. Electrochem. Soc. 2020, 167, 110535. [Google Scholar] [CrossRef] [Scilit]
- Burns, J.; Stevens, D.; Dahn, J. In-situ detection of lithium plating using high precision coulometry. J. Electrochem. Soc. 2015, 162, A959. [Google Scholar] [CrossRef] [Scilit]
- Theodore, A. Promising cathode materials for rechargeable lithium-ion batteries: A review. J. Sustain. Energy 2023, 14, 51–58. [Google Scholar]
- Thakur, A.K.; Sathyamurthy, R.; Velraj, R.; Saidur, R.; Pandey, A.; Ma, Z.; Singh, P.; Hazra, S.K.; Sharshir, S.W.; Prabakaran, R. A state-of-the art review on advancing battery thermal management systems for fast-charging. Appl. Therm. Eng. 2023, 226, 120303. [Google Scholar] [CrossRef] [Scilit]
- Wang, C.-Y.; Xu, T.; Ge, S.; Zhang, G.; Yang, X.-G.; Ji, Y. A fast rechargeable lithium-ion battery at subfreezing temperatures. J. Electrochem. Soc. 2016, 163, A1944. [Google Scholar] [CrossRef] [Scilit]
- Liu, Y.; Zhu, Y.; Cui, Y. Challenges and opportunities towards fast-charging battery materials. Nat. Energy 2019, 4, 540–550. [Google Scholar] [CrossRef] [Scilit]
- Liu, T.; Ge, S.; Yang, X.-G.; Wang, C.-Y. Effect of thermal environments on fast charging Li-ion batteries. J. Power Sources 2021, 511, 230466. [Google Scholar] [CrossRef] [Scilit]
- Yang, X.-G.; Zhang, G.; Ge, S.; Wang, C.-Y. Fast charging of lithium-ion batteries at all temperatures. Proc. Natl. Acad. Sci. USA 2018, 115, 7266–7271. [Google Scholar] [CrossRef] [Scilit]
- Yang, X.-G.; Leng, Y.; Zhang, G.; Ge, S.; Wang, C.-Y. Modeling of lithium plating induced aging of lithium-ion batteries: Transition from linear to nonlinear aging. J. Power Sources 2017, 360, 28–40. [Google Scholar] [CrossRef] [Scilit]
- Tang, M.; Albertus, P.; Newman, J. Two-dimensional modeling of lithium deposition during cell charging. J. Electrochem. Soc. 2009, 156, A390. [Google Scholar] [CrossRef] [Scilit]
- Shi, F.; Pei, A.; Boyle, D.T.; Xie, J.; Yu, X.; Zhang, X.; Cui, Y. Lithium metal stripping beneath the solid electrolyte interphase. Proc. Natl. Acad. Sci. USA 2018, 115, 8529–8534. [Google Scholar] [CrossRef] [Scilit]
- Wei, T. Mathematical Modeling of Transport Phenomena in Lithium-Ion Batteries. Ph.D. Thesis, National University of Singapore, Singapore, 2014. [Google Scholar]
- Srinivasan, V.; Wang, C.-Y. Analysis of electrochemical and thermal behavior of Li-ion cells. J. Electrochem. Soc. 2002, 150, A98. [Google Scholar] [CrossRef] [Scilit]
- von Lüders, C.; Keil, J.; Webersberger, M.; Jossen, A. Modeling of lithium plating and lithium stripping in lithium-ion batteries. J. Power Sources 2019, 414, 41–47. [Google Scholar] [CrossRef] [Scilit]
- Doyle, M.; Fuller, T.F.; Newman, J. Modeling of galvanostatic charge and discharge of the lithium/polymer/insertion cell. J. Electrochem. Soc. 1993, 140, 1526. [Google Scholar] [CrossRef] [Scilit]
- Wang, C.; Gu, W.; Liaw, B. Micro-Macroscopic Coupled Modeling of Batteries and Fuel Cells: I. Model Development. J. Electrochem. Soc. 1998, 145, 3407. [Google Scholar] [CrossRef] [Scilit]
- Doyle, M.; Newman, J.; Gozdz, A.S.; Schmutz, C.N.; Tarascon, J.M. Comparison of modeling predictions with experimental data from plastic lithium ion cells. J. Electrochem. Soc. 1996, 143, 1890. [Google Scholar] [CrossRef] [Scilit]
- Safari, M.; Morcrette, M.; Teyssot, A.; Delacourt, C. Multimodal physics-based aging model for life prediction of Li-ion batteries. J. Electrochem. Soc. 2008, 156, A145. [Google Scholar] [CrossRef] [Scilit]
- Hein, S.; Danner, T.; Latz, A. An electrochemical model of lithium plating and stripping in lithium ion batteries. ACS Appl. Energy Mater. 2020, 3, 8519–8531. [Google Scholar] [CrossRef] [Scilit]
- Li, Z.; Huang, J.; Liaw, B.Y.; Metzler, V.; Zhang, J. A review of lithium deposition in lithium-ion and lithium metal secondary batteries. J. Power Sources 2014, 254, 168–182. [Google Scholar] [CrossRef] [Scilit]
- Yang, X.-G.; Liu, T.; Gao, Y.; Ge, S.; Leng, Y.; Wang, D.; Wang, C.-Y. Asymmetric temperature modulation for extreme fast charging of lithium-ion batteries. Joule 2019, 3, 3002–3019. [Google Scholar] [CrossRef] [Scilit]
- Ploehn, H.J.; Ramadass, P.; White, R.E. Solvent diffusion model for aging of lithium-ion battery cells. J. Electrochem. Soc. 2004, 151, A456. [Google Scholar] [CrossRef] [Scilit]
- Pinson, M.B.; Bazant, M.Z. Theory of SEI formation in rechargeable batteries: Capacity fade, accelerated aging and lifetime prediction. J. Electrochem. Soc. 2012, 160, A243. [Google Scholar] [CrossRef] [Scilit]
- Smith, A.; Burns, J.C.; Zhao, X.; Xiong, D.; Dahn, J. A high precision coulometry study of the SEI growth in Li/graphite cells. J. Electrochem. Soc. 2011, 158, A447. [Google Scholar] [CrossRef] [Scilit]
- Petzl, M.; Danzer, M.A. Nondestructive detection, characterization, and quantification of lithium plating in commercial lithium-ion batteries. J. Power Sources 2014, 254, 80–87. [Google Scholar] [CrossRef] [Scilit]

Disclaimer/Publisher’s Note: The statements, opinions and data contained in all publications are solely those of the individual author(s) and contributor(s) and not of MDPI and/or the editor(s). MDPI and/or the editor(s) disclaim responsibility for any injury to people or property resulting from any ideas, methods, instructions or products referred to in the content. |
© 2025 by the authors. Licensee MDPI, Basel, Switzerland. This article is an open access article distributed under the terms and conditions of the Creative Commons Attribution (CC BY) license (https://creativecommons.org/licenses/by/4.0/).