Abstract
In this study, a response surface methodology (RSM) using a central composite design (CCD) was implemented to investigate the influence of process variables on ethyl levulinate (EL) production from the ethanolysis of waste corn cob samples, using sulphuric acid as a catalyst. The effects of four independent variables, namely, the temperature (A), the corn cob content (B), corn cob/H2SO4 mass ratio (C) and the reaction time (D) on the yields of EL (Y1), diethyl ether (DEE) (Y2) and solid residue (Y3) were explored. Using multiple regression analysis, the experimental results were fitted to quadratic polynomial models. The predicted yields based on the fitted models were well within the experimental uncertainties. Optimum conditions for maximising the EL yield were found to be 176 °C, 14.6 wt. %, 21:1 and 6.75 h for A to D, respectively. A moderate-to-high EL yield (29.2%) from corn cob was achieved in optimised conditions, a result comparable to those obtained from model C6 carbohydrate compounds. Side products were also produced, including diethyl ether, furfural, levulinic acid, 5-hydroxymethyl furfural, ethyl acetate, ethyl formate and water. Total unknown losses of only 5.69% were reported after material balancing. The results suggest that lignocellulosic waste such as corn cob can be used as a potential feedstock for the production of ethyl levulinate by direct acid-catalysed ethanolysis, but that the treatment of side products will need to be considered.
1. Introduction
Rapid increases in energy consumption and human dependency on fossil fuels have led to the accumulation of atmospheric greenhouse gases (GHGs) and, consequently, climate change. Global primary energy demands are expected to increase by nearly 50% by 2050, driven by a continual rise in the global population, better standards of living and strong economic and technical growth in non-OECD countries [1]. This raises concerns for both climate impact and global energy security, leading to the implementation of renewable technologies alongside fossil fuels. In 2021, fossil fuels accounted for more than 80% of the global primary energy demand from oil (30.95%), natural gas (24.42%) and coal (26.90%). Comparably, renewable, hydroelectric and nuclear energy contributed only 6.71%, 6.76% and 4.25% to the global energy share, respectively [2].
To reduce the impacts of fossil fuel utilisation, energy efficiency improvements and renewable energy expansion are crucial [3]. Indeed, the Renewable Energy Directive (RED) targets at least 32% of the EU’s energy consumption to be derived from renewables by 2030 [4,5]. Decarbonisation of the transportation sector remains a key challenge in meeting EU climate goals. Originally, the RED adopted a target of at least 10% renewables in total transport energy by 2020. Since this was achieved in 2020, the revised RED (RED II) has proposed a new target of 14% renewable energy use in transport by 2030 [6]. Despite improvements, the transportation sector remains a significant contributor towards GHG emissions. Transport (24%) was the leading contributor towards UK net GHG emissions in 2020. The Department for Business Energy and Industrial Strategy (BEIS) reported that the emissions are generated mainly from road transport, in particular from passenger cars [7]. Thus, the decarbonisation of the transportation sector relies heavily on reducing GHG emissions from passenger cars. One way of achieving this is by the integration of biofuels in road transport. The full deployment of biofuels is currently hindered by operational challenges. Instead, biofuels are often blended with fossil fuels to offset GHG emissions from commercial vehicles [8]. The application of biofuels is considered a promising route for decarbonising transport, leading to government-backed policies.
Moving forward, advanced biofuels are likely to be favoured over first-generation fuels. These liquid fuels are produced from non-food-based feedstocks and achieve a lifecycle greenhouse gas emission reduction of at least 50% compared to fossil fuels. Lignocellulosic biomass is the most abundant renewable resource that is available for advanced biofuel production and is currently viewed as the desired feedstock for the green chemistry of the future [9]. RED II mandates the use of advanced biofuels, requiring them to account for 3.5% of the EU’s total transport sector energy consumption by 2030, with an expected increase to 5.5% under RED III [10]. Technologies capable of producing cost-competitive advanced biofuels that can extend the blend walls with petroleum fuels are highly desired. The direct acid-catalysed alcoholysis of carbohydrate-rich lignocellulosic biomass is seen as a promising approach for producing novel oxygenated blendstock for diesel and gasoline fuels. The resulting blends contain mixtures of alkyl levulinate, alcohol and ether. Each is a viable biofuel with complementary synergistic properties; hence, using these biofuels as mixtures (i) extends the potential for their use with conventional fuels, as the mixture offers multi-variant control over the fuel property blend wall limits, and (ii) both gasoline- and diesel-compatible fuels can be produced using the same process and feedstock. Importantly, by considering these as co-products, the technical requirements and associated costs of separation are avoided.
Lignocellulosic biomass can be converted into various high-value chemicals (e.g., sugar, furfural, 5-hydroxymethyl furfural and levulinic acid) by controlled dehydration under various conditions. Levulinic acid contains two reactive functional groups, keto and carbonyl, making it highly suitable for the synthesis of various high-value products, including γ-valerolactone, acrylic acid and the α-angelica lactone and levulinate esters [11,12]. Alkyl levulinates have been identified as potential biofuel blend components because of their specific physicochemical properties [13]. Adding alkyl levulinates to diesel can improve the physical properties of the fuel, e.g., its lubricity, thermal stability and viscosity, and reduce the net aromatic and sulphur content, due to the dilution of the base diesel [14]. Moreover, using blends of alkyl levulinates, combined with the equivalent alcohol and ether as multi-component mixtures when blended with diesel, may have the potential to meet selected fuel standard property limits, such as flash point, density and kinematic viscosity, along with their miscibility with diesel; thus, they could have potential as drop-in fuel replacements for fossil diesel [15]. Several studies have tested the potential of such blends for displacing fossil diesel in internal combustion engines, such as the blends made by Antonetti et al. [16], Frigo et al. [17] and Wiseman et al. [18]. There have also been other studies utilising ethyl levulinate (EL) as a diesel biofuel blend component [19,20]. Christensen et al. [19] demonstrated that the addition of 10% EL to diesel reduced the engine-out smoke by 41% without changing the nitrogen oxide emissions, which would benefit urban air quality. Howard et al. [21] and Michelbach et al. [22] studied different ethyl three-component blends in rapid-compression machines to probe their reactivity. Both studies investigated blends that had a calculated research octane number (RON) of 95, the RON of a standard EN 228 gasoline with 10% ethanol [23]. The RON 95 blends had different compositions, with the blend studied by Michelbach et al. [22] having a higher EL fraction of 54 mol % compared to that with 35 mol % used by Howard et al. [21]; using higher EL fractions could increase the economic viability of EL production [24]. It is, therefore, important to establish optimal process conditions for the production of alkyl levulinates, as well as for quantifying any side products produced under optimal process conditions.
Ethyl levulinates can be produced from lignocellulosic biomass through two distinct pathways. The first involves the esterification of levulinic acid with ethanol, facilitated by a catalyst such as mineral liquid acid, solid acid or immobilised lipases [25,26]. The conversion of lignocellulosic biomass to ethyl levulinate requires two reaction steps. First, levulinic acid is generated from cellulosic biomass through acid hydrolysis [25], followed by its esterification with ethanol. Alternatively, ethyl levulinate can be directly produced from lignocellulosic biomass via acid-catalysed alcoholysis [16,27]. This approach offers a simplified one-step process for ethyl levulinate production, eliminating the need for levulinic acid purification that is required in two-step methods. Additionally, this approach provides several benefits, such as reduced wastewater generation and improved product quality. The reaction steps are summarised in Figure 1, involving the conversion of cellulose and hemicellulose into C6/C5 sugars, followed by alcoholysis to the alkyl glucoside, and subsequent dehydration and alcoholysis to the alkyl levulinate (AL) diethyl ether (DEE) by the acid-catalysed dehydration of ethanol, whereas further dehydration of ethanol can produce ethylene at higher temperatures.
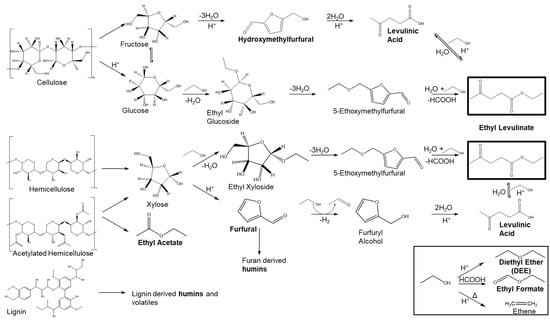
Figure 1.
Reaction scheme of the proposed chemical pathways involved in the ethanolysis of corn cob samples. Products with their names in bold are in the final mixture and are quantified and used in the mass balance in this study [8,16,24,28,29,30,31,32,33].
Numerous researchers have reviewed the different pathways for producing alkyl levulinates for use as biofuel blending components [8,16,24,28,29,30,31,32,33]. The direct acid-catalysed alcoholysis of carbohydrate precursors to alkyl levulinates was reviewed by Galletti et al. [28], who highlighted the benefits of simplifying the production approach and reducing the processing steps. Leal Silva et al. [29] investigated the techno-economics of different production routes and highlighted the importance of using low-cost biomass feedstocks such as sugarcane bagasse, rice waste and agricultural residues. The use of low-cost biomass streams that are rich in carbohydrates (cellulose and hemicellulose) is favoured for direct alcoholysis. Corn cob is a low-cost, high-cellulose/hemicellulose agricultural residue from corn production, and is ideally suited for alcoholysis. It is in plentiful supply, particularly in regions such as Brazil, and production is expected to increase. The production of alkyl levulinates by alcoholysis from corn cob in regions such as Brazil also benefits from the significant co-production of bioethanol.
McNamara et al. [34] investigated the steady-state production of EL from corn cob via sulphuric acid-catalysed ethanolysis at a fixed temperature of 150 °C and studied the influence of the catalyst loading fraction and reaction time on the yield. The main reaction products of EL, diethyl ether and ethanol were quantified. However, no side products were quantified, and these may contribute towards the missing fraction found in the elemental balance. McNamara et al. [34] also reported that increasing the biomass loading from 5 to 20 wt. % reduced the EL yield from 27 to 6 wt. %; this was due to the acid wt. % being held constant so that the biomass:acid ratio decreased, reducing the catalytic activity. When a biomass:acid ratio of 10:1 was used for 20 wt % corn cob, a steady state yield of 20 wt % EL was achieved. Therefore, the biomass:acid ratio is one of the key process parameters requiring further investigation, along with process temperature, biomass loading and reaction time, and this is where the use of a design of experiments (DOE) methodology could be useful. O’Shea et al. [35] built on the dataset of McNamara et al. [34] by conducting sulphuric acid-catalysed ethanolysis of corn cob at a range of temperatures (150–200 °C) and 1 and 2 wt. % of sulphuric acid, to yield biomass:acid ratios of 20:1 and 10:1. The reactions were conducted for a shorter time as the purpose of this study was to produce a chemical kinetic model of the formation of EL from the alcoholysis of lignocellulosic biomass. The results show that with 2 wt % of sulphuric acid, a steady-state yield of 18.6% could be achieved (which is consistent with the results reported by McNamara et al. [34]), with shorter reaction times at higher temperatures. The steady-state yield could be reached within 5 h at 190 °C and 200 °C, which was 10 times faster than at 150 °C. Being able to reach steady-state yield in a shorter time may be favourable for commercial production. However, this speed would need to be balanced with the energy cost required to operate at higher temperatures. Investigating the relationships between time, temperature, biomass loading and catalyst loading can be conducted efficiently using a DoE methodology that informs the necessary set of experiments required to build a response surface over a range of process conditions [15].
McNamara et al. [34] also summarised the molar EL yields from the ethanolysis of different lignocellulosic biomasses, as reported in the literature. These included a range of different feedstocks, including corn stover, paper pulp, wheat straw, cassava and mandarin peels, which were reacted at a range of temperatures from 150 °C to 200 °C, with different catalyst loadings, different catalysts, and different reaction times [27,36,37,38,39,40,41,42]. The most common catalyst used was sulphuric acid. The yields of EL ranged from around 5 wt. % up to around 35 wt. %. As stated by McNamara et al. [34], there is no systematic study on the influence of the reaction conditions on the yield of EL. Hence, in this work, we investigate the influence of the process parameters that were shown to be most influential using a DoE approach, namely, temperature, reaction time, biomass loading and the biomass:acid ratio.
The optimisation of product yields can be performed using empirical models based on central composite design (CCD), coupled with a response surface methodology (RSM) [43]. The use of CCD with RSM offers the advantage of minimising the number of experimental runs needed to obtain statistically valid results and produce statistically significant models [44]. Output responses are visually represented through three-dimensional response surface plots or contour plots, aiding in the interpretation of the response surface structure. The Box–Behnken experimental design allows for the evaluation of different experimental parameters with a limited number of trials, as each factor requires only three levels. This design provides a more practical and efficient approach to optimisation.
Antonetti et al. [16] studied the alcoholysis of Eucalyptus nitens in n-butanol (butanolysis) and applied the DoE and RSM methodology using Design Expert software to optimise the yield of n-butyl levulinate (nBL). First, they used a one-factor-at-a-time approach to study a range of reaction conditions, including temperature, biomass loading, reaction times, and heating approaches (both microwave and traditional methods). The initial results demonstrated that there were dependencies of the yield of nBL on the reaction conditions. The DoE carried out for the optimisation of nBL yield using RSM was conducted using a fixed biomass loading of 20 wt %, with temperature, reaction time, and catalyst loading being the three factors used in the face-centre cubic design (FCCD). Analysis of the experimental nBL yield using the Design Expert software resulted in a quadratic polynomial being fitted to the response surface of the nBL yield. The fitted equation had an R2 of 0.910 and a p-value of 0.0025, indicating that the model could accurately reproduce the experimental data and was statistically significant. Antonetti et al. [16] found that catalyst loading was the most influential parameter, followed by temperature and then reaction time. The optimisation of nBL yield could facilitate sustainable process designs being utilised; when lower temperatures are used, more catalyst is necessary and longer reaction times are needed to achieve the same high yields, with potential environmental impacts that would need to be assessed using a lifecycle analysis. Antonetti et al. [16] also quantified some of the major side products, including di-n-butyl ether, butyl acetate and n-butanol. Butyl acetate was reported to be at 3 mol % in all experiments conducted for the FCCD. They also tried to quantify butyl formate, but no values were reported, indicating that it may not have been detectable using their chosen methods. It is uncommon for the side products from alcoholysis studies to be reported. They are scarcely reported in ethanolysis studies, regardless of the biomass feedstock used. These side products may hold commercial value or could be valuable fuel components; thus, it is essential to account for them in the design of any commercial process.
This research work aims to explore the production of novel oxygenated biofuel blend components derived from lignocellulosic feedstocks via acid-catalysed ethanolysis. More specifically, RSM analysis was employed using Design Expert 23 software (StatEase, 2023) to model the ethanolysis of waste corn cob using H2SO4 as a catalyst. This work investigates the effects of temperature, corn cob loading wt. %, corn cob:H2SO4 mass ratio and reaction time on the different responses. By developing a series of regression models, it becomes possible to predict the material balance for the reaction procedure. Finally, identifying the optimum conditions will help tailor the reaction conditions towards the production of useful blend components. Understanding the material balance in optimum conditions will then feed into additional studies regarding the characteristics and performance of blend mixtures in real-life engine simulations. Quantification of the main products and key side products will also inform the future design of commercial processes for advanced biofuel production.
2. Methodology
2.1. Materials
The lignocellulosic biomass material used in this study was corn cob, purchased from Essex Reptile Ltd., Braintree, UK. Regular-grade ethanol (96%) and concentrated sulphuric acid (95–97%) were purchased from BHD Laboratory Supplies and Scientific Laboratory Supplies, respectively. The pure components used for GC calibration included diethyl ether (DEE, anhydrous ≥ 99.7%), levulinic acid (LA, 98%), ethyl levulinate (EL, 99%), 5-hydroxy methyl furfural (HMF, 99%) and furfural (99%) which were all purchased from Sigma-Aldrich, Gillingham, Dorset, UK (Merck Life Science UK Ltd., Gillingham, Dorset, UK).
2.2. Acid-Catalysed Ethanolysis
Ethanolysis of the corn cob was performed in an 80 mL high-pressure Parr reactor using H2SO4 as a catalyst in the presence of excess ethanol, following the central composite design (CCD) of experiments, as specified in Table 1. The levels of the process parameters were chosen in response to the results of screening experimental work based on the one-factor-at-a-time (OFAT) methodology, whereby we conducted the ethanolysis reaction at a wider range of temperatures, acid ratios and corncob loading, among other parameters, to screen the parameters and determine the levels with the most significant impact on the targeted responses. The reactor was heated at a constant heating rate of 10 °C/min to different temperatures within the range of 130–210 °C, as specified in the experimental design. After the desired temperature was reached, the reaction time was considered to have begun. The reactions were carried out with a substrate-to-H2SO4 ratio varying from 10 to 30, a reaction time from 2 to 10 h and a corn cob content from 5 to 25 wt. % (Table 1). On completion of the reaction, the materials were allowed to cool to room temperature before opening the reactor. The solid residue was then separated from the supernatant by filtration, then dried at 105 °C for 2 h and weighed. Equation (1) was used to calculate the yield of solid residue (based on weight) under the different reaction conditions. The corn cob ‘CC’ (wt %) is defined in Equation (2).

Table 1.
Factors (and levels) used in the statistical model for the direct conversion of corn cob to ethyl levulinate.
2.3. Analytical Methods
2.3.1. Analysis of Raw Corn Cob and Residues
Raw corn cob was analysed using proximate, ultimate and biochemical analysis. The residues isolated after filtration were analysed for proximate and ultimate analysis only. Proximate analysis was determined by thermo-gravimetric analysis (TGA) (Mettler Toledo GmbH, Greifensee, Switzerland). All measurements were performed in duplicate, with the mean values being reported. A sample of approximately 10 mg was heated in a nitrogen atmosphere from 25 °C to 105 °C at a rate of 25 °C/min, with a hold time of 10 min. It was then heated further under nitrogen from 105 °C to 900 °C at the same rate. At 900 °C, the sample was held for 10 min under nitrogen, followed by exposure to air for 15 min. The ultimate analysis (CHNS) was determined using a Flash 2000 CHNS analyser (Thermo Scientific, Waltham, MA, USA), which was calibrated with certified reference materials from Elemental Microanalysis (Okehampton, UK). The hydrogen content was adjusted for moisture, and oxygen content was determined by difference.
Biochemical analysis (cellulose, hemicellulose and lignin) was determined using a Gerhardt Fibrecap system to determine the neutral detergent fibre (NDF, STM016), acid detergent fibre (ADF, STM 017) and acid detergent lignin (ADL, STM143), following the method described by Chernick et al. [45].
The biochemical content was calculated using Equations (3)–(5).
% Cellulose = % ADF − % ADL
% Hemicellulose = % NDF − % ADF
% Lignin = % ADL
2.3.2. Analysis of Liquid Products
Liquefied products were initially analysed by GC-MS to identify unknown products. Each species was then quantified using a Shimadzu GC-FID, fitted with a DB-FFAP column (30 m 0.32 mm 0.33 mm) using a He carrier gas. Calibration standards were obtained for EL, DEE, furfural, HMF and LA, and quantification was performed using the internal standard (IS) method, with 1-octanol (≥99%) as the IS. Quantification of ethyl acetate and ethyl formate was performed using normalisation methods; therefore, the concentrations are semi-quantitative. The yields reported are calculated as below.
The yield of ‘X’, where X is either ethyl levulinate (EL), levulinic acid (LA), furfural or 5-hydroxymethylfurfural (HMF), was calculated (based on weight) using Equation (6) and the yield of diethyl ether (DEE) using Equation (7).
Diethyl ether (DEE) yield was calculated (based on weight) using:
2.4. Response Surface Methodology
The design of experiments was carried out based on a CCD coupled with an RSM, using Design Expert (Stat-Ease, Inc., Minneapolis, MN, USA). Four independent variables or ‘factors’ were investigated, including: A: temperature ‘T’ (°C), B: corn cob ‘CC’ (wt. %), C: corn cob:H2SO4 (mass ratio) ‘CC:HS’, and D: time (hours). A total of 30 (A–D) experimental sets needed to be carried out, using the factors in Table 1. Optimal reaction conditions for maximal ethyl levulinate yield were obtained using the desirability function of the software.
The yield of ethyl levulinate was considered to be the dependent variable, and the proposed response model is presented below:
where Yi is the predicted response, b0 is the coefficient for the offset term, b1, b2, b3 and b4 are coefficients for the linear effect terms, b11, b22, b33 and b44 are coefficients for the squared effects, and b12, b13, b14, b23, b24 and b34 are coefficients for the interaction effects.
The model’s validity was confirmed through an analysis of variance (ANOVA). R2 was used to assess the fitness of the model. The significance of the factors was evaluated at a 95% confidence interval, with p-values at p < 0.05. Any insignificant non-linear terms (p > 0.05) were removed from the models.
3. Results and Discussion
3.1. Characterisation of Corn Cob
Characterisation of the corn cob samples is shown in Table 2, including biochemical, ultimate and proximate analyses. Corn cob contains high levels of cellulose (44.9 wt %) and hemicellulose (32.3 wt %) and lower levels of lignin (9 wt %). The ash and nitrogen contents are low, compared to other biomass feedstocks. The higher cellulose and hemicellulose contents make corn cob an ideal feedstock for alcoholysis. Alkyl levulinates can be produced from both cellulose and hemicellulose but not from the lignin, which largely remains in the residue.
Table 2.
Biochemical, elemental and proximate analyses, with the means of corn cob samples and standard deviations on the average of four analyses.
3.2. Characterisation of Reaction Products
The liquid products contained ethyl levulinate (EL), diethyl ether (DEE) and unreacted ethanol. GC-MS analysis also indicated the presence of side products, including levulinic acid, 5-HMF, furfural, ethyl formate and ethyl acetate. The proposed reaction pathways are described in Figure 1. The solid residue after alcoholysis contained carbon derived from lignin, as well as humins derived from the polymerisation of furanic molecules such as HMF and furfural. The ratio of furan-derived humins to lignin-derived humins is not known; however, these side reactions are related to hydrolysis pathways promoted by the presence of water, which is generated by dehydration reactions, and the water present in the initial feedstock. For the development of the model, the main products were investigated, including EL, DEE and the yield of solid residue. Conversion of the corn cob across the DoE ranges between 28% and over 67%. The residue after ethanolysis has a carbon content ranging between 47 and 59 wt % and a heating value ranging between 15 and 25 MJ/Kg (Tables S2 and S3).
3.3. Experimental Design
The levels of the experimental design were chosen based on the results of an initial screening. For the temperature, we identified a negligible ethyl levulinate yield of <1% at <130 °C. In contrast, we noticed a significant decrease in the yield of EL at >210 °C, which is most probably due to the degradation of EL.
Regarding the wt % of corn cob, it is challenging to detect the EL value with a loading lower than 5%, and it is regarded as impractical for further upscaling to operate at levels lower than 5%. The solid loading upper limit of 25% is the maximum biomass loading that we could apply to ensure complete contact with the ethanol. Higher concentrations of corn cob caused agglomeration of the feedstock (even with stirring), resulting in an inefficient ethanolysis reaction and, consequently, a lower yield of EL.
Lastly, the CC:H2SO4 ratio was also screened, where lower CC:H2SO4 ratios than 10:1 (more H2SO4 concentration) led to significant dehydration of the ethanol, resulting in higher yields of DEE and humins, both of which are unfavourable, with the latter product making the recovery of EL challenging. A higher CC:H2SO4 ratio than 25:1 results in a significantly lower yield of EL, as it minimises the catalytic effect of H2SO4.
Regarding reaction time, the initial tests indicated that a minimum reaction time of 2 h is required for the production of EL at the minimum catalyst loading, lowest temperature and highest feedstock loading. The upper limit for the reaction time was selected, based on maximum yields being reported at 8–10 h.
3.4. Model Analysis
Table 3 shows the yields of the main products, namely, ethyl levulinate (Y1), diethyl ether (Y2), and solid residue (Y3). The response surfaces were fitted with Equations (9)–(11) as functions of the test variables: temperature (A), corn cob content (B), corn cob:H2SO4 ratio (C) and time (D).
Table 3.
Results of central composite design for the production of ethyl levulinate, diethyl ether and solid residue from corn cob, using H2SO4 as a catalyst and ethanol as a solvent.
The positive and negative coefficients in Equations (9)–(11) indicate the favourable and unfavourable impacts of the parameters on the responses, respectively [46]. An ANOVA was employed to evaluate the statistical significance and adequacy of the regression models, including each variable and the various interactions. The validation and suitability of regression models were determined using the coefficient of determination (R2), adjusted R2 and predicted R2, as shown in Table 4. The R2 for each model was greater than 0.9, which suggests that the predicted values calculated by the regression models provided a good representation of the experimental data and further confirmed the adequacy of the regression models. The closeness between R2 and the adjusted R2 values suggests that all the terms included in the models were significant [47]. Furthermore, the numerical difference between adjusted R2 and predicted R2 of less than 0.2 also indicates a close agreement between the predicted and experimental results [48]. The Design Expert software also provided the p-values corresponding to the F-values calculated. The model for each variable had a high F-value and a low p-value (<0.05), indicating that it was significant to the chosen confidence level. p-values were utilised to evaluate the significance of each model coefficient, which is essential for interpreting the interaction patterns among the design variables. Smaller p-values indicate the greater significance of the corresponding coefficients. Specifically, p-values below 0.05 suggest that the model terms are statistically significant and should be included in the polynomial equation [49]. p-values lower than 0.01 denote that the impact of the design variable on the response variable is extremely significant. A summary of the ANOVA results for all models, including the yield of side products, is shown in the Supplementary Data Tables S1–S15. The models for all three main responses, as shown in Table 4, are statistically extremely significant, with F-values at p-values of <0.0001. Adequate precisions were also calculated as 26.61, 18.47 and 28.79 for yields of EL, DEE and solid residue, respectively. Adequate precision measures the signal-to-noise ratio by comparing the range of predicted values at the design points to the average prediction error; a value greater than 4 is considered desirable. The adequate precisions of all responses were greater than 4, suggesting that the signals were suitable and that the models could be utilised to traverse the design [50,51].
Table 4.
Analysis of variance (ANOVA) of the RSM regression analysis for ethyl levulinate, diethyl ether and solid residue yields for the conversion of corn cob using H2SO4 as a catalyst in ethanol.
Figure 2 shows parity plots between the experimental and predicted yields, using regression models for each response. It can be observed that the predicted values are very close to the observed values.
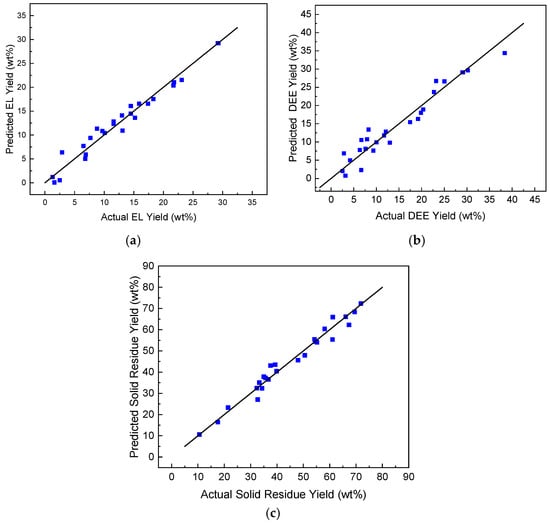
Figure 2.
Comparison between the predicted and experimental values for (a) ethyl levulinate yield, (b) diethyl ether yield and (c) solid residue yield.
For simplicity, the discussion surrounding the effect of process variables will be divided between liquid products and solid residue responses. For liquid products, the discussion will mainly focus on the yields of EL and DEE, due to their applications as biofuel-blending molecules. Likewise, the critical discussion of solid residue responses will primarily focus on corn cob conversion, as this promotes the production of useful liquid products.
3.5. The Effect of Reaction Parameters
The three-dimensional (3D) response surface and contour plots of the RSM as a function of two variables are shown in Figure 3, Figure 4 and Figure 5. The other two factors were fixed according to the results of the experimental design. Figures S1–S3 in the Supplementary Data also show the 3D response surface and contour plots of the side products, including HMF, furfural and LA. The 3D response surface and contour plots are helpful for understanding the main effects, as well as the interactions between different factors.
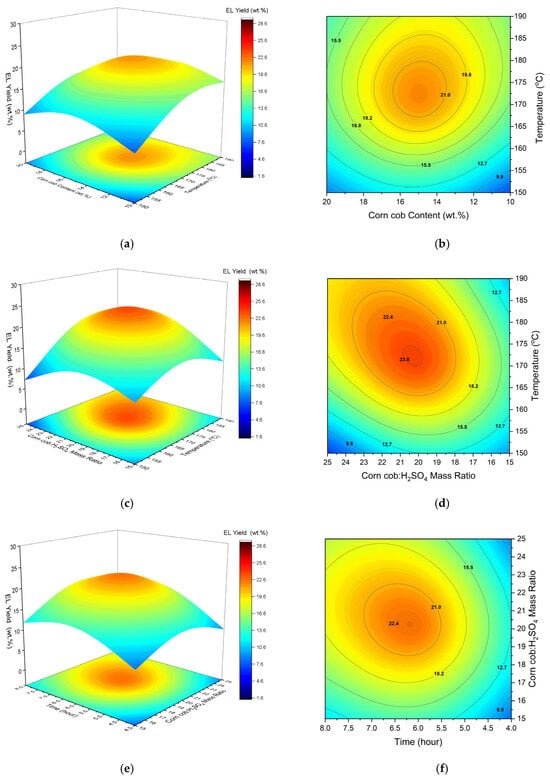
Figure 3.
The 3D response surface plots and isoresponse of ethyl levulinate yield versus temperature and corn cob content (a,b), temperature and corn cob:H2SO4 (c,d) and corn cob:H2SO4 and reaction time (e,f).
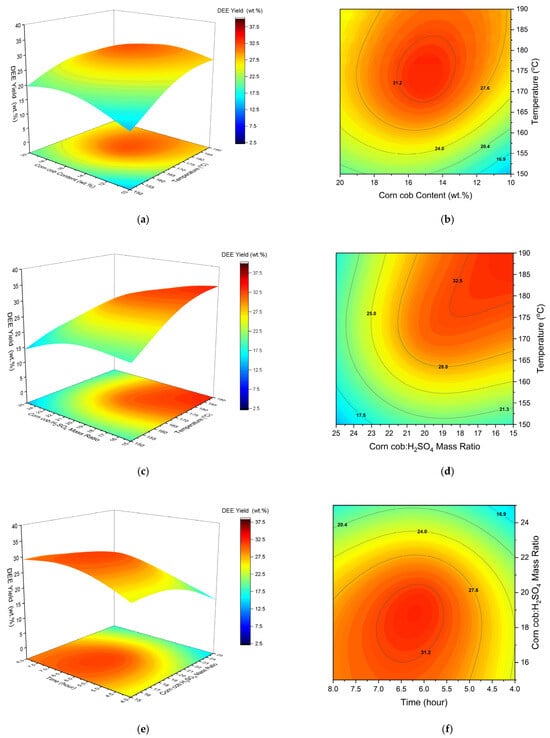
Figure 4.
The 3D response surface plots and isoresponse of diethyl ether yield versus temperature and corn cob content (a,b), temperature and corn cob:H2SO4 (c,d) and corn cob:H2SO4 and reaction time (e,f).
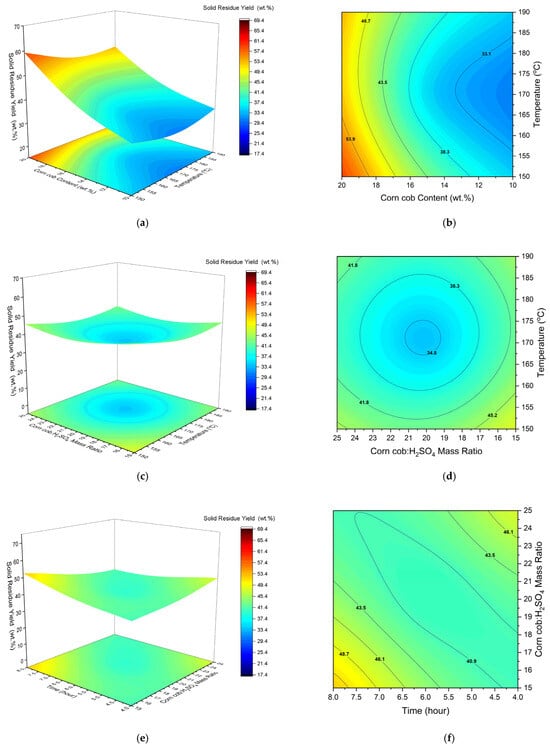
Figure 5.
The 3D response surface plots and isoresponse of solid residue yield versus temperature and corn cob content (a,b), temperature and corn cob:H2SO4 (c,d) and corn cob:H2SO4 and reaction time (e,f).
3.5.1. The Effect of Process Variables on EL Yield
The Effect of Temperature on the EL Yield
The regression model suggests that quadratic terms for temperature, corn cob:H2SO4 and reaction time all have a synergistic effect on EL yield. Furthermore, the values for each term suggest the relative impact on the response follows the following order: temperature > reaction time > corn cob:H2SO4. The effects of temperature and time were found to be highly significant, followed by corn cob:H2SO4 to a lesser extent. The reported ethanolysis of model compounds (glucose and fructose) follows similar patterns, with increasing temperature favouring the conversion of ethyl glucoside (EG) to 5-ethoxymethylfurfural (EMF), followed by rapid dehydration to EL [52]. However, excess temperatures have been shown to have an antagonistic effect on EL yield, as shown by the negative quadratic coefficient for the A2 term in Equation (9). Yu et al. [53] reported similar findings for the ethanolysis of microcrystalline cellulose, with temperatures above 170 °C leading to rapid solid residue formation. As such, an intermediate temperature of 160 °C was preferred to avoid unwanted side reactions. Likewise, Zhao et al. [54] reported an optimum temperature of 150 °C for the ethanolysis of fructose. They also cited unwanted side reactions at excessive temperatures above this point. It is worth noting that fructose has demonstrated faster reaction kinetics than glucose, meaning that lower temperatures are probably required. The effect of reaction temperature in this study is shown in Figure 3a.
The conversion of EL continued to increase up to ~170 °C and then slightly declined with increasing temperature. It follows that this is higher than the optimum temperatures mentioned for glucose and fructose, given the inherent challenges with the lignin valorisation of lignocellulose. Finally, given that EL has a boiling point of 206 °C [8], a reaction temperature above 200 °C should be avoided to prevent evaporative losses.
The Effect of Corn Cob Content on the Yield of EL
Both linear and quadratic coefficients for corn cob wt % have a negative influence on EL yield, as shown by the regression model. However, the linear term was found to be insignificant compared with the quadratic term given in Supplementary Data Tables S4 and S5. The maximum yield was achieved at 14–15%, then started to decrease, as shown in Figure 3a. This non-linear behaviour is likely due to the agglomeration of biomass particles at higher biomass loading, reducing contact with the ethanol. This is evident in Table S4, where the B2 term for the influence of corn cob content on the EL yield is statistically significant. Since the biomass-to-acid ratio was constant, the dependence on catalyst availability was important. Antonetti et al. [16] reported that in the butanolysis of eucalyptus, nBL yields reduced with increasing biomass loading, owing to the non-constant biomass-to-acid ratio that was used reducing the catalyst’s availability, and showed that increasing biomass loading makes the mixing process more difficult.
The Effect of Corn Cob:H2SO4 Ratio on the Yield of EL
The effect of the corn cob:H2SO4 ratio was found to have a significant impact on EL yield. The quadratic term has an antagonistic effect on EL yield, along with having the largest relative impact amongst the quadratic coefficients. This is an interesting result, as it suggests that optimum EL yields are not achieved at either high or low corn cob:H2SO4 ratios. Rather, the response benefits from an intermediate corn cob:H2SO4 ratio. In Figure 3c, it is seen that a ratio of approximately 20:1 is beneficial for EL yield. Towards both limits, the response begins to decline, as indicated by the significant downward curvature in the graph. One possible explanation is that at lower concentrations of H2SO4, the majority of H2SO4 is consumed by the dehydration of ethanol to produce DEE. It is worth mentioning that the rate of DEE formation is higher than the ethanolysis of the extracted cellulose from the corn cob. In contrast, a higher concentration of acid (low corn cob:H2SO4 ratio) facilitates the reverse reaction of ethyl levulinate into levulinic acid.
A high corn cob:H2SO4 ratio results in a lower amount of catalyst relative to feedstock. Therefore, it follows that the yield of EL is lower, given that there is more feedstock to convert with a fixed amount of catalyst. Conversely, lowering the corn cob:H2SO4 ratio is beneficial for increasing the amount of catalyst relative to the feedstock. Initially, it would be suggested this is helpful in accelerating the catalysed reactions to form EL as there are more Brønsted acid catalytic sites. However, an excess of catalyst may be detrimental to EL yield, as suggested by the authors of [54], who cited unwanted side reactions at high catalyst loading. The findings of Wen et al. [55] follow a similar trend, with the highest EL yield found at an intermediate catalyst amount (0.3 g). Here, the catalytic selectivity follows the same pattern as EL yield, thereby reiterating earlier suggestions of unwanted side reactions with more catalyst.
The Effect of Reaction Time on the Yield of EL
The reaction time was found to have a significant effect on the yield of EL. The positive sign before the linear coefficient in the regression model indicates that reaction time has a promoting effect on EL yield. Pasquale et al. [56] also found that longer reaction times are favourable for EL yield as they allowed for intermediate components (EMF etc.) to form. This suggests that EL is one of the last components to form during ethanolysis, with longer reaction times therefore being beneficial. However, prolonged reaction times appear adverse for EL yield, as shown by the negative quadratic coefficient (D2) in Equation (9). Previous studies regarding the reaction kinetics showed a levelling-off of EL yield with time, which coincided with a reduction in EMF yield [34,52]. For glucose, this effect was observed after approximately 2 h, with no further increase in EL yield beyond this point. This reiterates earlier suggestions that the formation of EL is directly correlated to EMF yields [38]. Wang et al. [57] also studied the reaction pathways and mechanism of glucose conversion to EMF and EL, as catalysed by Brønsted acid sites. They reported three main pathways: (i) via glucose and ethyl glucoside, (ii) via fructose, HMF, LA and EL, and (iii) via fructose, HMF, EMF and EL. The latter pathway was considered to be the primary thermodynamic and kinetic pathway, with an energy barrier of 20.8 kcal/mol. The intermediate HMF was formed by a ring-opening reaction and the dehydration of fructose. Figure 3e indicates that reaction times of up to 7 h were advantageous, with no substantial enhancement in EL yield beyond this duration. Compared to model compounds, reaction times are longer, which is probably due to the complexity of lignocellulosic feedstocks. This includes the initial period required to form EMF. Thus, moderate to high reaction times are favourable for EL yields.
The co-interaction between temperature and corn cob:H2SO4 ratio was found to be highly significant for EL yield. Moreover, the positive operation sign suggests that these variables have a synergistic effect on the response. Interestingly, in Figure 3c,d, EL yield appears to drop at extreme combinations of temperature and corn cob:H2SO4 ratio, as indicated by the graphs’ curvature. The highest response occurs towards the middle of the surface plot, suggesting a non-linear relationship. At low temperatures, a low corn cob:H2SO4 ratio is beneficial because there is more available catalyst relative to the amount of feedstock. Likely, this helps overcome the reaction activation energy, which molecules may otherwise not have sufficient kinetic energy to overcome at low temperatures. Above 170 °C, a higher corn cob:H2SO4 ratio (and lower relative catalyst amount) is shown to be better for EL yield. This is probably because there is sufficient kinetic energy to overcome the reaction activation energy, thereby reducing the reliance on the catalyst. Furthermore, this reiterates earlier suggestions that unwanted side reactions may proceed with the use of more catalyst at higher temperatures. Overall, this highlights an interesting interactive effect between the temperature and catalyst. At low temperatures, more catalyst (a low corn cob:H2SO4 ratio) is favourable for overcoming activation energies, while at high temperatures, less catalyst (a high corn cob:H2SO4 ratio) is required to overcome activation energies and, in fact, is beneficial in avoiding the unwanted side reactions that reduce EL yields. Comparably, the co-interaction between temperature and time has an antagonistic effect on EL yield. Nandiwale et al. [58] found that the reaction time for maximum LA esterification was reduced with increasing temperature. Thus, a similar effect is likely taking place here, with shorter reaction times being needed to convert lignocellulose at higher temperatures. Likewise, longer reaction times, coupled with higher temperatures, would also favour the unwanted side reactions that reduce EL yield. This is supported by Yu et al. [53], who found an increase in solid residue yields at high temperatures, along with lower conversion times. The model suggests that the combined term for temperature and corn cob wt % was found to be non-significant. This suggests that the effect of increasing temperature on EL yield was unaffected by the amount of feedstock that was initially used.
3.5.2. The Effect of Process Variables on DEE Yield
The Effect of Temperature on the DEE Yield
The linear coefficient for temperature was found to be highly significant for DEE yield, owing to the temperature dependence of the ethanol dehydration reaction. Looking at the regression model, the linear coefficient for temperature has a positive sign, suggesting that DEE yield is promoted by increasing temperature. In Figure 4a,b, the DEE yield continues to increase up to 190 °C. However, the negative quadratic coefficient suggests that excessive temperatures are not favourable for DEE formation (Equation (10)). Probably, this is because of the exothermic nature of ethanol dehydration (∆H298K = −25.1 kJ/mol). Additionally, DEE yields may fall in excessive temperatures, due to the further dehydration of DEE to ethylene. Unlike ethanol dehydration, this is an endothermic reaction (∆H298K = +44.9 kJ/mol), which benefits from increasing reaction temperature [59]. Similar findings were reported by [60], who used a range of Cu-Fe/ZSM5 catalysts. Temperatures between 180 and 200 °C were most favourable for DEE yields. Above 200 °C, the DEE catalytic selectivity fell sharply and subsequently coincided with a rise in ethylene catalytic selectivity. Ref. [61] reported a similar decline in DEE selectivity between 180 °C (90%) and 250 °C (30%). Overall, the reported findings suggest that temperatures up to 190 °C are beneficial for DEE yield, while temperatures above 200 °C should be avoided to prevent the formation of ethylene.
The Effect of Corn Cob Content on the Yield of DEE
The linear term for corn cob wt % was found not to significantly affect DEE yield (Table S6). Likewise, the relatively low linear coefficient highlights its low impact compared with other process variables. This is to be expected, as the reaction that forms DEE takes place exclusively between ethanol and H2SO4. However, the quadratic term was found to have a significant influence on the response. The negative operation sign suggests a negative impact on DEE yield with large amounts of biomass. As per the experimental design (total reaction mixture = 35 g), the amount of excess ethanol is reduced with larger amounts of feedstock. Thus, it makes sense that the amount of DEE formed is reduced with lower amounts of ethanol.
The Effect of the Corn Cob: H2SO4 Ratio on the Yield of DEE
The influence of corn cob:H2SO4 was found to be highly significant on DEE yield. Furthermore, the negative linear term in the regression model suggests that higher ratios negatively impact DEE yields. This is to be expected, given that lower corn cob:H2SO4 ratios result in more acid catalyst relative to the feedstock. In turn, this benefits DEE formation, which takes place with the dehydration of ethanol. Figure 4c,d reiterates this claim, with increasing DEE yield being seen towards a corn cob:H2SO4 ratio of 15:1. Comparably, the response proceeds to fall with an increasing corn cob:H2SO4 ratio, as there is less available catalyst for DEE formation. The strong curvature highlights the significant influence of catalyst amount on DEE yield. Ref. [61] also found that the conversion of ethanol sharply rises with increasing catalyst amounts (of tungstophosphoric acid, in their case). This was consistent over a temperature range of 180–250 °C, thereby highlighting the benefit of low corn cob:H2SO4 ratios.
The Effect of Reaction Time on the Yield of DEE
Reaction time was found to have a significant effect on DEE yield. According to the regression model, the linear term has a positive effect on DEE yield, suggesting that it benefits from increasing reaction time. The quadratic term highlights an antagonistic effect on DEE yield. Furthermore, the relative value amongst the quadratic terms suggests that reaction time has the biggest impact on DEE yield. This is similar to the effect of the corn cob:H2SO4 ratio on EL yield, where intermediate values were desirable. Figure 4e,f highlights an increase in DEE yield proceeds after 6.5 h, followed by a slight decline. Ref. [59] reported similar findings when modelling the kinetics for ethanol dehydration.
DEE initially forms quickly but then levels off, due to a reduction in ethanol. This levelling-off period also coincides with the gradual formation of ethylene. After a prolonged reaction time, DEE and ethylene yields begin to converge towards each other. This illustrates the dehydration of DEE to ethylene after a long reaction time. Thus, the reported work shows similar effects and suggests that reaction times longer than 6.5 h are non-beneficial, due to ethylene formation.
Both combined terms for temperature and corn cob amount and for temperature and corn cob:H2SO4 ratio were found to have significant effects on DEE yield. Likewise, both had antagonistic effects on the response, given the negative operation signs. The interactive effect between corn cob amount and increasing temperature is shown in Figure 4. Above ~175 °C, a low feedstock amount (10 wt %) is more beneficial, compared with a high feedstock amount (20 wt %). This is explained by the fact that there is a higher excess of ethanol in the system when using less feedstock to maintain the experimental design (total reaction mixture = 35 g). Thus, more available ethanol is converted to DEE, resulting in higher yields. Interestingly, the inverse was true at low temperatures, with the use of more initial feedstock benefiting DEE yields. This is because, for a given corn cob:H2SO4 ratio, the amount of catalyst initially added to the system decreases with less feedstock. Overall, this suggests that the yields of DEE were more sensitive to the amount of H2SO4 catalyst at low temperatures. Probably, this is because reaction activation energies are more difficult to overcome, thereby increasing the catalytic reliance on conversion at low temperatures.
3.5.3. The Effect of Process Variables on Solid Residue Responses
The Effect of Temperature on Solid Residue Responses
The ANOVA results, as shown in the Supplementary Data for solid residue yield (Tables S8 and S9) and the quadratic regression (Equation (11)), show that the linear coefficient for temperature was found to have a relatively less significant effect on the response. However, the quadratic term had a highly significant effect on the response. This is an interesting result, as one would expect the solid residue yield to decrease linearly with temperature. Looking at Figure 5, it appears that the response decreases towards ~170 °C and then slightly increases with increasing temperature. This may suggest that parts of the feedstock are difficult to convert, despite increasing temperatures. This could be due to the lignin content. Lignin likely constitutes most of the uncovered material as it requires significantly higher temperatures to break down. Thus, intermediate temperatures may be sufficient to break down cellulose and hemicellulose, while lignin valorisation presents greater challenges. In addition, the increase in the solid residue yield could be attributed to the unwanted side reactions that take place at excessive temperatures, leading to an increase in the amount of solid residue.
The Effect of Corn Cob Content on Solid Residue Yield
As expected, the amount of initial corn cob used had a significant influence on the response. Amongst the linear term values, it can be deduced that the corn cob content had the largest impact on the solid residue yield. Moreover, the positive value of corn cob content (Equation (11)) suggests that the solid residue yield increased with increasing feedstock amount. This is because it is more difficult to achieve higher conversions with more feedstock at a given corn cob:H2SO4 ratio. This finding is reiterated in Figure 5a,b, which shows the solid residue yield increasing with more corn cob. For example, at 150 °C, the yield increases from ~30% to ~60% when increasing the amount of feedstock from 10 wt % to 20 wt %. Furthermore, the strong positive gradient with increasing feedstock amount indicates a significant effect on the response.
The Effect of the Corn Cob:H2SO4 Ratio on Solid Residue Yield
The linear term and the quadratic term for the corn cob:H2SO4 ratio did not have a significant effect on the response. Looking at Figure 5c,d, there appears to be a slight decrease in the solid residue yield with reducing corn cob:H2SO4 ratio. For example, after 4 h, the solid residue yield decreases from ~47% to ~35% when reducing the corn cob:H2SO4 ratio from 25:1 to 15:1. However, the lack of significant curvature in the graph suggests that this has less influence compared with other process variables. Overall, it is suggested that the reduction in the solid residue yield results from the presence of more catalyst relative to feedstock.
The Effect of Reaction Time on Solid Residue Yield
Both the linear and quadratic terms for reaction time significantly impacted solid residue yield. Figure 5e,f shows that the lowest yield of almost 35% was achieved after a short reaction time of 4 h. This is an interesting result, as one would expect the solid residue yield to decrease with increasing reaction time. However, Yu et al. [53] found very similar results regarding the required time to completely convert microcrystalline cellulose during ethanolysis. According to their study, the microcrystalline cellulose had been converted fully after 4 h at 170 °C. The same temperature was used in Figure 5e, suggesting that corn cob conversion was limited by some other factors, such as lignin recalcitrance. As mentioned earlier, the valorisation of lignin is inherently difficult and requires temperatures in the range of 450–500 °C. Thus, corn cob conversion was likely limited due to the presence of lignin, which would need higher temperatures to break down. Overall, this would suggest that the effect of increasing the reaction time is almost trivial beyond a certain point. This reiterates earlier claims that lignin recalcitrance remains one of the principal challenges associated with lignocellulosic feedstocks.
The most significant combined effect on solid residue yield was found to be corn cob wt % and time. At low reaction times (4 h) and with a low corn cob amount (10 wt %), a very low yield was produced of around 30%. With increasing feedstock amount, it appears that higher reaction times are more favourable for decreasing the yield and increasing the conversion rate. More specifically, longer reaction times (8 h) are beneficial to achieve an interactive effect on the response above approximately 16 wt % of corn cob. However, despite the reaction time, solid residue yields are higher with 20 wt % of corn cob, compared with 10 wt %. This reiterates the significant effect of corn cob amount in terms of both its linear and quadratic coefficients, along with combined terms.
3.6. Process Optimisation
3.6.1. Maximising EL Yield
The objective of process optimisation is to identify the combination of process conditions favourable for EL yield. Through the analysis of central composite design and response surface methodology, optimal conditions for EL yields can be predicted using the desirability function, based on variables within the experimental design range. Since the primary focus was on EL yield, constraints for all other parameters were disregarded. The goal for optimisation was set to ‘maximise’ EL yield, with a high level of importance (+++) (StatEase, 2023). Limits for the response were established at between 1.3% and 29.3%, the lowest and the highest EL yields that were produced among all DoE runs.
The optimum reaction conditions were a temperature of 169.8 °C, a corn cob loading of 13.2 wt %, a corn cob:H2SO4 mass ratio of 20.7 and a reaction time of 6.36 h. The maximum EL of 29.39% was predicted under these conditions, while the DEE and solid residue yields were 27.68 wt % and 29.22 wt %, respectively.
3.6.2. Material Balance Under Optimum Conditions
A material balance was performed using the optimised conditions given in Table 5. Initially, the inlet amount of corn cob, H2SO4 and ethanol was determined, based on the experimental design previously used (total reaction mixture = 35 g). Based on this, corn cob and ethanol masses were found to be as follows:
Corn cob = 13.2% × 35 = 4.62 g
Corn cob:H2SO4 = 20.7:1 → H2SO4 = 0.22 g
Ethanol = 35.00 − (4.62 + 0.22) = 30.16 g
Table 5.
Optimised responses for the ethanolysis of corn cob.
The optimised conditions were inputted into the regression models to generate the responses given in Table 5. The remaining ethanol was simply determined, based on the consumed percentages.
Figure 6 shows the material balance for ethanolysis under optimised conditions. EL is the highest yield component from corn cob, suggesting that the process optimisation was successful in maximising this response. DEE was generated most notably in terms of quantity because of the large excess of ethanol used. This was ~6 times higher than the EL produced. Total losses were found to be 1.99 g, which is approximately 5.69% of the inlet material. The recorded 5.7% closure is regarded as being acceptable for laboratory studies of this type and agrees with other literature reports. The losses of all species are expected during sample preparation; however, the main loss is expected from volatile and gaseous products such as ethylene and diethyl ether. Ethylene was not routinely analysed as part of the DoE; however, selected tests positively identified its presence in the gas phase when opening the reactor. The reactor was cooled to room temperature before opening; however, it is expected that there will be some evaporation of DEE and volatile products during sample preparation. Overall, the low material losses suggest that the regression models were accurate in predicting the ethanolysis response.
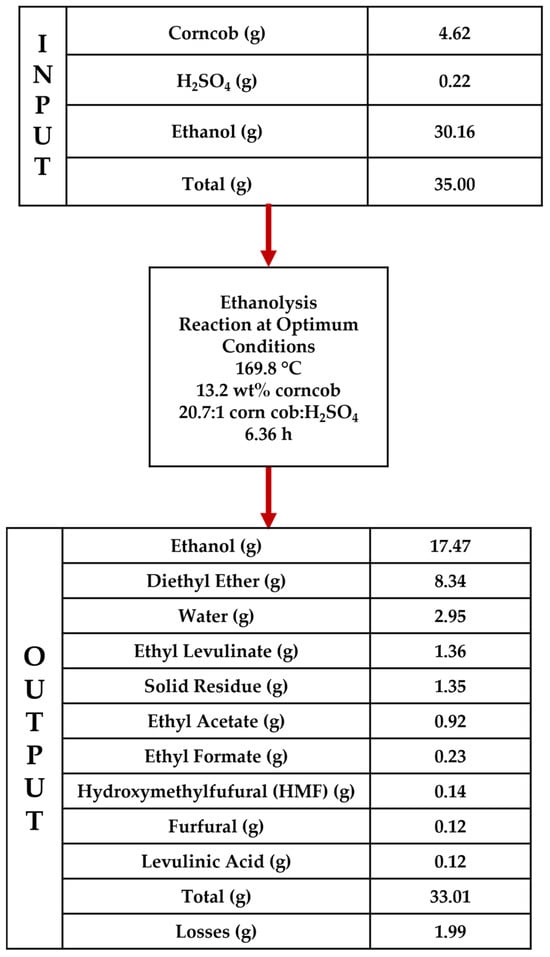
Figure 6.
Material balance for the ethanolysis of corn cob under optimised conditions.
Significant quantities of side products are generated during the alcoholysis of the corn cob. These include ethyl acetate, ethyl formate, furfural, levulinic acid and HMF. Ethyl acetate can be formed from the cleavage of the acetyl ester group from acetylated hemicellulose. Cleavage of the glycosidic bond and the acetyl group produces sugar and ethyl acetate. Ethyl formate is probably formed by the reaction of formic acid and ethanol, whereby the formic acid can be formed from multiple reactions, as shown in Figure 1. HMF and levulinic acid are formed via hydrolysis routes and are likely to increase as the levels of water in the system increase. The reduction of water in the system will potentially reduce side products and increase process efficiency. Operation in continuous mode is likely to improve yields, particularly if process intensification approaches such as reactive distillation are utilised.
Ethyl acetate was the highest among the alkyl side products observed. It has mostly been studied as a co-solvent for ethanol for use with both gasoline and diesel [62,63], enabling >10% ethanol to be blended into the base fuels and remain miscible. Parray and Bhattacharya [63] found that higher fractions of EA were required as the ethanol proof reduced. Using a stable blend of 58.8% diesel, 14.7% 190° ethanol and 26.5% EA caused the brake-specific fuel consumption to increase by 30%, whilst also reducing the NO and NO2 emissions relative to diesel [63]. Therefore, keeping EA in the final product blend from alcoholysis may enhance the miscibility and stability of ethanolysis product mixtures with diesel and gasoline, enabling higher fractions of biofuel to be used [15].
It is important to quantify such side products, since they may need to be separated within any commercial processes designed to produce fuel blends or commercial chemicals at scale. They may also have commercial value, which would impact the cost-effectiveness of the overall process. The removal of water and the recycling of ethanol within the process will need to be part of any commercially orientated process design. These requirements highlight the utility of the RSM since the concentrations of side products can be predicted for any combination of the process variables included in the regression analysis.
Several assumptions were made as part of the material balance, including the following:
- H2O formation took place via reactions involving the formation of DEE, furfural and HMF, according to Equation (12), Equation (13) and Equation (14), respectively [64,65].
- 2.
- Additionally, 2 moles of H2O are formed per mole of EL via complex reactions:
- Three moles of H2O are formed via the cellulose → EG → HMF → EMF → EL pathway.
- One mole of H2O is consumed during the hydrolysis of cellulose to glucose.
- 3.
- The moisture in the corn cob (2.3 wt %) was present as H2O at the end of ethanolysis. This was added to the amount formed during ethanolysis.
- 4.
- Total losses were assumed to be volatile losses of ethanol, due to its low boiling point of 78.2 °C.
4. Conclusions
RSM analysis using the Design Expert software was successfully deployed to investigate the effects of temperature, corn cob wt %, corn cob:H2SO4 ratio and reaction time on the ethanolysis of corn cob. Optimised conditions for maximising EL yield were found to be 169.8 °C, 13.2 wt %, 20.7:1 and 6.36 h, respectively. Temperature and the corn cob:H2SO4 ratio were found to have a highly significant influence on EL yield. Intermediate values for both process variables were preferable, to avoid unwanted side reactions. Furthermore, interactions between these variables exhibited interesting effects. At low temperatures, a low corn cob:H2SO4 ratio (with a higher relative catalyst amount) was favourable, due to difficulties in overcoming activation energies with less available kinetic energy, whereas at high temperatures, a high corn cob:H2SO4 ratio was beneficial, highlighting potential issues with catalytic selectivity. Process optimisation was considered successful for maximising EL. In fact, EL (29.38 wt %) was the highest-yielding component derived from corn cob, followed by HMF (3.05 wt %), furfural (2.53 wt %) and LA (2.5%). The optimised EL yield was comparable to model C6 carbohydrate compounds, suggesting the suitability of corn cob for deriving levulinate esters. The quantification of the full range of main and side products across different process conditions will provide useful input for commercial process design approaches.
Supplementary Materials
The following supporting information can be downloaded at: https://www.mdpi.com/article/10.3390/en18112985/s1, Table S1: Results of the central composite design for production of furfural, LA and HMF from corn cob, using H2SO4 as the catalyst and ethanol as the solvent; Table S2: The proximate analyses results of central composite design of the solid residue produced; Table S3: The elemental analyses and HHV results of the central composite design of the solid residue produced; Table S4: ANOVA for a quadratic model of EL yield; Table S5: Quadratic model coefficients for EL yield predictions; Table S6: ANOVA for the quadratic model of DEE yield; Table S7: Quadratic model coefficients for DEE yield predictions; Table S8: ANOVA for the quadratic model of solid residue yield; Table S9: Quadratic model coefficients for solid residue yield predictions; Table S10: ANOVA for the quadratic model of furfural yield; Table S11: Quadratic model coefficients for furfural yield predictions; Table S12: ANOVA for the quadratic model of LA yield; Table S13: Quadratic model coefficients for LA yield predictions; Table S14: ANOVA for the quadratic model of HMF yield; Table S15: Quadratic model coefficients for HMF yield predictions; Figure S1: The 3D response surface plots and iso-response of furfural yield versus temperature and corn cob content (a,b), temperature and corn cob:H2SO4 (c,d) and corn cob:H2SO4 and reaction time (e,f); Figure S2: The 3D response surface plots and iso-response of LA yield versus temperature and corn cob content (a,b), temperature and corn cob:H2SO4 (c,d) and corn cob:H2SO4 and reaction time (e,f); Figure S3: The 3D response surface plots and iso-response of HMF yield versus temperature and corn cob content (a,b), temperature and corn cob:H2SO4 (c,d) and corn cob:H2SO4 and reaction time (e,f).
Author Contributions
Conceptualisation, A.S.T., M.A.N., V.D. and A.B.R.; methodology, A.B.R. and M.A.N.; software, M.A.N.; validation, M.A.N., N.H., O.A., A.A., S.W., A.B.R. and V.D.; formal analysis, O.A., N.H., M.A.N. and A.B.R.; investigation, N.H., M.A.N., O.A. and A.A.; resources, A.B.R., A.S.T. and V.D.; data curation, M.A.N. and O.A.; writing—original draft preparation, M.A.N., N.H. and S.W.; writing—review and editing, A.A., S.W., A.B.R., A.S.T. and V.D.; visualisation, O.A., N.H., M.A.N. and S.W.; supervision, A.B.R., A.S.T. and V.D.; project administration, A.B.R. and A.S.T.; funding acquisition, A.S.T., V.D. and A.B.R. All authors have read and agreed to the published version of the manuscript.
Funding
This research was funded by the Engineering and Physical Sciences Research Council, via grant number EP/T033088/1. The APC was funded by the University of Leeds through the UKRI Block grant.
Data Availability Statement
The original contributions presented in this study are included in the article/Supplementary Materials. Further inquiries can be directed to the corresponding author(s).
Acknowledgments
The authors would like to thank Stephen Dooley, Conall McNamara and Ailís O’Shea from Trinity College Dublin (TCD) for discussions related to the project. Additionally, the authors would also like to thank Adrian Cunliffe and Karine Alves Thorne for their technical assistance.
Conflicts of Interest
The authors declare no conflicts of interest.
References
- U.S. Energy Information Administration. EIA Projects Nearly 50% Increase in World Energy Usage by 2050, Led by Growth in Asia; U.S. Energy Information Administration: Washington, DC, USA, 2020.
- Karakurt, I.; Aydin, G. Development of regression models to forecast the CO2 emissions from fossil fuels in the BRICS and MINT countries. Energy 2023, 263, 125650. [Google Scholar] [CrossRef]
- Amin, A.Z. Global Energy Transformation: A Roadmap to 2050; International Renewable Energy Agency: Abu Dhabi, United Arab Emirates, 2018. [Google Scholar]
- Holzleitner, M.; Moser, S.; Puschnigg, S. Evaluation of the impact of the new Renewable Energy Directive 2018/2001 on third-party access to district heating networks to enforce the feed-in of industrial waste heat. Util. Policy 2020, 66, 101088. [Google Scholar] [CrossRef]
- Renewable Energy Directive. Directive (EU) 2015/1513 of the European Parliament and of the Council of 9 September 2015 amending Directive 98/70/EC relating to the quality of petrol and diesel fuels and amending Directive 2009/28/EC on the promotion of the use of energy from renewable sources. Off. J. Eur. Union 2015, 239, 1–29. [Google Scholar]
- European Environment Agency. Use of Renewable Energy for Transport in Europe; European Environment Agency: Copenhagen, Denmark, 2023.
- Department for Business, Energy and Industrial Strategy. 2020 UK Greenhouse Gas Emissions, Final Figures; Department for Business, Energy and Industrial Strategy: London, UK, 2022.
- Alamgir Ahmad, K.; Haider Siddiqui, M.; Pant, K.K.; Nigam, K.D.P.; Shetti, N.P.; Aminabhavi, T.M.; Ahmad, E. A critical review on suitability and catalytic production of butyl levulinate as a blending molecule for green diesel. Chem. Eng. J. 2022, 447, 137550. [Google Scholar] [CrossRef]
- Bozell, J.J. Connecting Biomass and Petroleum Processing with a Chemical Bridge. Science 2010, 329, 522–523. [Google Scholar] [CrossRef]
- European Council. Council and Parliament Reach Provisional Deal on Renewable Energy Directive; European Council: Brussels, Belgium, 2023.
- Piskun, A.S. Catalytic Conversion of Levulinic Acid to γ-Valerolactone Using Supported Ru Catalysts: From Molecular to Reactor Level. Ph.D. Thesis, University of Groningen, Groningen, The Netherlands, 2016. [Google Scholar]
- Leonard, R.H. Levulinic acid as a basic chemical raw material. Ind. Eng. Chem. 1956, 48, 1330–1341. [Google Scholar] [CrossRef]
- Démolis, A.; Essayem, N.; Rataboul, F. Synthesis and Applications of Alkyl Levulinates. ACS Sustain. Chem. Eng. 2014, 2, 1338–1352. [Google Scholar] [CrossRef]
- Nelson Appaturi, J.; Andas, J.; Ma, Y.-K.; Phoon, B.L.; Muazu Batagarawa, S.; Khoerunnisa, F.; Hazwan Hussin, M.; Ng, E.-P. Recent advances in heterogeneous catalysts for the synthesis of alkyl levulinate biofuel additives from renewable levulinic acid: A comprehensive review. Fuel 2022, 323, 124362. [Google Scholar] [CrossRef]
- Wiseman, S.; Michelbach, C.A.; Li, H.; Tomlin, A.S. Predicting the physical properties of three-component lignocellulose derived advanced biofuel blends using a design of experiments approach. Sustain. Energy Fuels 2023, 7, 5283–5300. [Google Scholar] [CrossRef]
- Antonetti, C.; Gori, S.; Licursi, D.; Pasini, G.; Frigo, S.; López, M.; Parajó, J.C.; Raspolli Galletti, A.M. One-Pot Alcoholysis of the Lignocellulosic Eucalyptus nitens Biomass to n-Butyl Levulinate, a Valuable Additive for Diesel Motor Fuel. Catalysts 2020, 10, 509. [Google Scholar] [CrossRef]
- Frigo, S.; Pasini, G.; Caposciutti, G.; Antonelli, M.; Galletti, A.M.R.; Gori, S.; Costi, R.; Arnone, L. Utilisation of advanced biofuel in CI internal combustion engine. Fuel 2021, 297, 120742. [Google Scholar] [CrossRef]
- Wiseman, S.; Li, H.; Tomlin, A.S. Combustion and Emission Performance of Acid-Catalysed Butanol Alcoholysis Derived Advanced Biofuel Blends from a Compression Ignition Engine; SAE Technical Paper 2025-01-8445; SAE International: Warrendale, PA, USA, 2025. [Google Scholar] [CrossRef]
- Christensen, E.; Williams, A.; Paul, S.; Burton, S.; McCormick, R.L. Properties and Performance of Levulinate Esters as Diesel Blend Components. Energy Fuels 2011, 25, 5422–5428. [Google Scholar] [CrossRef]
- Koivisto, E.; Ladommatos, N.; Gold, M. Compression Ignition and Exhaust Gas Emissions of Fuel Molecules Which Can Be Produced from Lignocellulosic Biomass: Levulinates, Valeric Esters, and Ketones. Energy Fuels 2015, 29, 5875–5884. [Google Scholar] [CrossRef]
- Howard, M.S.; Issayev, G.; Naser, N.; Sarathy, S.M.; Farooq, A.; Dooley, S. Ethanolic gasoline, a lignocellulosic advanced biofuel. Sustain. Energy Fuels 2019, 3, 409–421. [Google Scholar] [CrossRef]
- Michelbach, C.; Hakimov, K.; Farooq, A.; Tomlin, A.S. Predicting the autoignition behaviour of tailorable advanced biofuel blends using automatically generated mechanisms. Proc. Combust. Inst. 2024, 40, 105667. [Google Scholar] [CrossRef]
- BS EN 228:2012+A1:2017; Automotive Fuels. Unleaded Petrol. Requirements and Test Methods. Milton Keynes:BSI. 2023. iTeh Inc.: San Francisco, CA, USA, 2017. Available online: https://bsol.bsigroup.com (accessed on 19 May 2025).
- Zhu, S.; Guo, J.; Wang, X.; Wang, J.; Fan, W. Alcoholysis: A Promising Technology for Conversion of Lignocellulose and Platform Chemicals. ChemSusChem 2017, 10, 2547–2559. [Google Scholar] [CrossRef]
- Fernandes, D.R.; Rocha, A.S.; Mai, E.F.; Mota, C.J.A.; da Silva, V.T. Levulinic acid esterification with ethanol to ethyl levulinate production over solid acid catalysts. Appl. Catal. A Gen. 2012, 425–426, 199–204. [Google Scholar] [CrossRef]
- Lee, A.; Chaibakhsh, N.; Rahman, M.B.A.; Basri, M.; Tejo, B.A. Optimized enzymatic synthesis of levulinate ester in solvent-free system. Ind. Crops Prod. 2010, 32, 246–251. [Google Scholar] [CrossRef]
- Le Van Mao, R.; Zhao, Q.; Dima, G.; Petraccone, D. New Process for the Acid-Catalyzed Conversion of Cellulosic Biomass (AC3B) into Alkyl Levulinates and Other Esters Using a Unique One-Pot System of Reaction and Product Extraction. Catal. Lett. 2011, 141, 271–276. [Google Scholar] [CrossRef]
- Raspolli Galletti, A.M.; Antonetti, C.; Fulignati, S.; Licursi, D. Direct Alcoholysis of Carbohydrate Precursors and Real Cellulosic Biomasses to Alkyl Levulinates: A Critical Review. Catalysts 2020, 10, 1221. [Google Scholar] [CrossRef]
- Leal Silva, J.F.; Grekin, R.; Mariano, A.P.; Maciel Filho, R. Making Levulinic Acid and Ethyl Levulinate Economically Viable: A Worldwide Technoeconomic and Environmental Assessment of Possible Routes. Energy Technol. 2018, 6, 613–639. [Google Scholar] [CrossRef]
- Saravanamurugan, S.; Nguyen Van Buu, O.; Riisager, A. Conversion of Mono- and Disaccharides to Ethyl Levulinate and Ethyl Pyranoside with Sulfonic Acid-Functionalized Ionic Liquids. ChemSusChem 2011, 4, 723–726. [Google Scholar] [CrossRef] [PubMed]
- Saravanamurugan, S.; Riisager, A. Solid acid catalysed formation of ethyl levulinate and ethyl glucopyranoside from mono- and disaccharides. Catal. Commun. 2012, 17, 71–75. [Google Scholar] [CrossRef]
- Bozell, J.J.; Petersen, G.R. Technology development for the production of biobased products from biorefinery carbohydrates—The US Department of Energy’s “Top 10” revisited. Green Chem. 2010, 12, 539. [Google Scholar] [CrossRef]
- Peng, L.; Lin, L.; Li, H.; Yang, Q. Conversion of carbohydrates biomass into levulinate esters using heterogeneous catalysts. Appl. Energy 2011, 88, 4590–4596. [Google Scholar] [CrossRef]
- McNamara, C.; O’Shea, A.; Rao, P.; Ure, A.; Ayarde-Henríquez, L.; Ghaani, M.R.; Ross, A.; Dooley, S. Steady states and kinetic modelling of the acid-catalysed ethanolysis of glucose, cellulose, and corn cob to ethyl levulinate. Energy Adv. 2024, 3, 1439–1458, Erratum in Energy Adv. 2024, 3, 3007–3008. [Google Scholar] [CrossRef]
- O’Shea, A.; McNamara, C.; Rao, P.; Howard, M.; Ghanni, M.R.; Dooley, S. A hierarchical surrogate approach to biomass ethanolysis reaction kinetic modelling. React. Chem. Eng. 2025, 10, 344–359. [Google Scholar] [CrossRef]
- Olson, E.S.; Kjelden, M.R.; Schlag, A.J.; Sharma, R. Levulinate Esters from Biomass Wastes. Chem. Mater. Renew. Resour. 2001, 784, 51–63. [Google Scholar]
- Tan, J.; Liu, Q.; Chen, L.; Wang, T.; Ma, L.; Chen, G. Efficient production of ethyl levulinate from cassava over Al2(SO4)3 catalyst in ethanol–water system. J. Energy Chem. 2017, 26, 115–120. [Google Scholar] [CrossRef]
- Zhang, Y.; Wang, X.K.; Hou, T.; Liu, H.; Han, L.; Xiao, W. Efficient microwave-assisted production of biofuel ethyl levulinate from corn stover in ethanol medium. J. Energy Chem. 2017, 27, 890–897. [Google Scholar] [CrossRef]
- Chang, C.; Xu, G.; Jiang, X.-Q. Production of ethyl levulinate by direct conversion of wheat straw in ethanol media. Bioresour. Technol. 2012, 121, 93–99. [Google Scholar] [CrossRef] [PubMed]
- Zhao, T.; Zhang, Y.; Zhao, G.; Chen, X.; Han, L.; Xiao, W. Impact of biomass feedstock variability on acid-catalyzed alcoholysis performance. Fuel Process. Technol. 2018, 180, 14–22. [Google Scholar] [CrossRef]
- Rizqullah, H.; Yang, J.; Lee, J.W. Temperature-swing transesterification for the coproduction of biodiesel and ethyl levulinate from spent coffee grounds. Korean J. Chem. Eng. 2022, 39, 2754–2763. [Google Scholar] [CrossRef]
- Yang, J.; Park, J.; Son, J.; Kim, B.; Lee, J.W. Enhanced ethyl levulinate production from citrus peels through an in-situ hydrothermal reaction. Bioresour. Technol. Rep. 2018, 2, 84–87. [Google Scholar] [CrossRef]
- Pereira, L.M.S.; Milan, T.M.; Tapia-Blácido, D.R. Using Response Surface Methodology (RSM) to optimize 2G bioethanol production: A review. Biomass Bioenergy 2021, 151, 106166. [Google Scholar] [CrossRef]
- Özgür, C.; Mert, M.E. Prediction and optimization of the process of generating green hydrogen by electrocatalysis: A study using response surface methodology. Fuel 2022, 330, 125610. [Google Scholar] [CrossRef]
- Chernick, D.; Dupont, V.; Ross, A.B. The Potential to Produce Bio-Based Ammonia Adsorbents from Lignin-Rich Residues. Clean Technol. 2025, 7, 30. [Google Scholar] [CrossRef]
- Jiang, N.; Zhao, Y.; Qiu, C.; Shang, K.; Lu, N.; Li, J.; Wu, Y.; Zhang, Y. Enhanced catalytic performance of CoO-CeO2 for synergetic degradation of toluene in multistage sliding plasma system through response surface methodology (RSM). Appl. Catal. B Environ. 2019, 259, 118061. [Google Scholar] [CrossRef]
- Lucas, J.M. Response Surface Methodology: Process and Product Optimization Using Designed Experiments, 3rd edition. J. Qual. Technol. 2010, 42, 228–230. [Google Scholar] [CrossRef]
- Roudi, A.M.; Salem, S.; Abedini, M.; Maslahati, A.; Imran, M. Response Surface Methodology (RSM)-Based Prediction and Optimization of the Fenton Process in Landfill Leachate Decolorization. Processes 2021, 9, 2284. [Google Scholar] [CrossRef]
- StateEase. Design Expert (13); StateEase: Minneapolis, MN, USA, 2023. [Google Scholar]
- Ragab, S.; Elkatory, M.R.; Hassaan, M.A.; El Nemr, A. Experimental, predictive and RSM studies of H2 production using Ag-La-CaTiO3 for water-splitting under visible light. Sci. Rep. 2024, 14, 1019. [Google Scholar] [CrossRef] [PubMed]
- Yabalak, E.; Görmez, Ö.; Gizir, A.M. Subcritical water oxidation of propham by H2O2 using response surface methodology (RSM). J. Environ. Sci. Health Part B 2018, 53, 334–339. [Google Scholar] [CrossRef] [PubMed]
- Xu, G.; Chen, B.; Zheng, Z.; Li, K.; Tao, H. One-pot ethanolysis of carbohydrates to promising biofuels: 5-ethoxymethylfurfural and ethyl levulinate. Asia-Pac. J. Chem. Eng. 2017, 12, 527–535. [Google Scholar] [CrossRef]
- Yu, F.; Zhong, R.; Chong, H.; Smet, M.; Dehaen, W.; Sels, B.F. Fast catalytic conversion of recalcitrant cellulose into alkyl levulinates and levulinic acid in the presence of soluble and recoverable sulfonated hyperbranched poly(arylene oxindole)s. Green Chem. 2017, 19, 153–163. [Google Scholar] [CrossRef]
- Zhao, S.; Xu, G.; Chang, C.; Fang, S.; Liu, Z.; Du, F. Direct Conversion of Carbohydrates into Ethyl Levulinate with Potassium Phosphotungstate as an Efficient Catalyst. Catalysts 2015, 5, 1897–1910. [Google Scholar] [CrossRef]
- Wen, Z.; Ma, Z.; Mai, F.; Yan, F.; Yu, L.; Jin, M.; Sang, Y.; Bai, Y.; Cui, K.; Wu, K.; et al. Catalytic Ethanolysis of Microcrystalline Cellulose over a Sulfonated Hydrothermal Carbon Catalyst. Catal. Today 2020, 355, 272–279. [Google Scholar] [CrossRef]
- Pasquale, G.; Vázquez, P.; Romanelli, G.; Baronetti, G. Catalytic upgrading of levulinic acid to ethyl levulinate using reusable silica-included Wells-Dawson heteropolyacid as catalyst. Catal. Commun. 2012, 18, 115–120. [Google Scholar] [CrossRef]
- Wang, S.; Chen, Y.; Jia, Y.; Xu, G.; Chang, C.; Guo, Q.; Tao, H.; Zou, C.; Li, K. Experimental and theoretical studies on glucose conversion in ethanol solution to 5-ethoxymethylfurfural and ethyl levulinate catalyzed by a Brønsted acid. Phys. Chem. Chem. Phys. 2021, 23, 19729–19739. [Google Scholar] [CrossRef]
- Nandiwale, K.Y.; Niphadkar, P.S.; Deshpande, S.S.; Bokade, V.V. Esterification of renewable levulinic acid to ethyl levulinate biodiesel catalyzed by highly active and reusable desilicated H-ZSM-5. J. Chem. Technol. Biotechnol. 2014, 89, 1507–1515. [Google Scholar] [CrossRef]
- Sarve, D.T.; Singh, S.K.; Ekhe, J.D. Kinetic and mechanistic study of ethanol dehydration to diethyl ether over Ni-ZSM-5 in a closed batch reactor. React. Kinet. Mech. Catal. 2020, 131, 261–281. [Google Scholar] [CrossRef]
- de Oliveira, T.K.R.; Rosset, M.; Perez-Lopez, O.W. Ethanol dehydration to diethyl ether over Cu-Fe/ZSM-5 catalysts. Catal. Commun. 2018, 104, 32–36. [Google Scholar] [CrossRef]
- Varisli, D.; Dogu, T.; Dogu, G. Ethylene and diethyl-ether production by dehydration reaction of ethanol over different heteropolyacid catalysts. Chem. Eng. Sci. 2007, 62, 5349–5352. [Google Scholar] [CrossRef]
- Amine, M.; Awad, E.N.; Ibrahim, V.; Barakat, Y. Effect of ethyl acetate addition on phase stability, octane number and volatility criteria of ethanol-gasoline blends. Egypt. J. Pet. 2018, 27, 567–572. [Google Scholar] [CrossRef]
- Parray, R.A.; Bhattacharya, T.K. Effectiveness of Ethyl Acetate, 1-Octanol, and Soy Biodiesel in Stabilizing Ethanol–Diesel Fuel Blends and Performance of Compression Ignition Engine on Stabilized Fuel Blends. ACS Omega 2022, 7, 1648–1657. [Google Scholar] [CrossRef]
- Asakawa, M.; Shrotri, A.; Kobayashi, H.; Fukuoka, A. Solvent basicity controlled deformylation for the formation of furfural from glucose and fructose. Green Chem. 2019, 21, 6146–6153. [Google Scholar] [CrossRef]
- Phung, T.K.; Busca, G. Diethyl ether cracking and ethanol dehydration: Acid catalysis and reaction paths. Chem. Eng. J. 2015, 272, 92–101. [Google Scholar] [CrossRef]
Disclaimer/Publisher’s Note: The statements, opinions and data contained in all publications are solely those of the individual author(s) and contributor(s) and not of MDPI and/or the editor(s). MDPI and/or the editor(s) disclaim responsibility for any injury to people or property resulting from any ideas, methods, instructions or products referred to in the content. |
© 2025 by the authors. Licensee MDPI, Basel, Switzerland. This article is an open access article distributed under the terms and conditions of the Creative Commons Attribution (CC BY) license (https://creativecommons.org/licenses/by/4.0/).