1. Introduction
Energy is one of the most fundamental resources for human beings to meet their basic needs and to sustain their economic and social lives more easily. Primary energy demand has become more important over the years in parallel with urban and population growth, and industrialization [
1]. Energy resources are divided into two groups: renewable and non-renewable. Significant scientific research indicates that non-renewable sources generate approximately 80% of the electricity used for global commercial purposes, with renewable energy sources accounting for the remaining 20% [
2].
Worldwide energy consumption has significantly increased since 1971. According to World Bank data, the energy demand has increased by approximately three times [
3]. A significant portion of energy resources comprises non-renewable sources, which include fossil fuels such as oil, coal, and natural gas. The production, transportation, and use of fossil energy resources, which have a large share in meeting the world’s primary energy needs, cause some problems that are becoming more visible with every passing day, on a local and global basis, in addition to the advantages they provide [
4]. In particular, fossil fuels are exhaustible, and they are becoming less attractive due to reasons such as greenhouse gasses, predominantly carbon dioxide (CO₂), released due to their use, which causes global warming, climate change, exhaustion, and rising prices. The Organization for Economic Cooperation and Development (OECD) anticipates that fossil fuels will remain the predominant energy source in the near future, owing to their higher energy densities and slower rates of innovation. Nevertheless, OECD countries are actively promoting alternative energy sources to reduce dependence on fossil fuels [
5]. All countries should act quickly to reduce the risk of climate change. As concerns regarding energy security and efforts to reduce carbon emissions intensify, numerous countries are endeavoring to promote the adoption of renewable energy and are making significant strides in this regard [
6].
Renewable energy sources consist of wave, ocean currents, tide, wind, solar, geothermal, and hydrogen energies and are self-renewing resources. Renewable energy is also a safe, clean, and, most importantly, sustainable source with minimal environmental consequences [
7]. Renewable energy systems play a vital role in meeting the ever-increasing energy demand. While renewable energy systems offer unlimited and eco-friendly opportunities, it is obvious that putting these systems into operation is a challenging task due to the intermittence of these energy supplies [
8].
Environmental degradation and global warming, attributed to the use of fossil fuels, have significantly impacted life worldwide in recent years. Additionally, as stated by [
9], the supply resources of fossil fuels are considered limited and insufficient to meet the growing energy demand in the future. Consequently, the pursuit of clean energy sources for sustainable environmental development has become a crucial goal. In this context, the significance of renewable energy sources, including wave, wind, and solar energies, has been heightened due to their contribution to sustainable energy production and addressing environmental concerns. Among these sources, wind and solar energies are the most commonly used clean energy alternatives [
4]. It is thought that wave energy will follow wind and solar energies as important power sources. Owing to their important characteristics for energy demand, the integration of ocean (wave energy), wind, and solar energies in Türkiye is of serious importance in terms of both global warming and the energy economy.
Solar and wind energies, considered crucial sources of renewable energy, are extensively utilized for electricity generation today, owing to their maturity and competitive prices. However, the intermittent and variable nature of these energy sources poses limitations on the dependability of the power supply. Additionally, their effectiveness is contingent upon daily or seasonal climatic conditions [
10]. Weather forecasting aids in determining the optimal methods of harnessing energy from solar, wind, or oceanic sources, depending on the prevailing climatic conditions. While numerous renewable energy facilities are being established, the primary challenge persists in the capricious and sporadic output from these sources, making it difficult to predict the amount of generated energy [
11]. The most considerable obstacle in converting solar and wind energy into electrical energy is their intermittency. Although solar energy varies depending on the seasons, it can only be converted into electrical energy during one-third of the day. The situation is the same with wind energy [
10]. Recent research has revealed that system reliability can be increased using two or more alternative energy sources that complement each other. The most common hybrid energy production systems involve a combination of solar and wind sources. Fluctuations in wind flow and variations in solar energy may lead to inefficiencies in meeting the load demand. Consequently, potential changes in climate and weather conditions, including temperature fluctuations, cloud movement, wind speed, wave speed, and other factors influencing energy production from renewable sources, must be considered. Researchers are actively working to enhance the precision of weather forecasts, a crucial step toward improving the overall efficiency of the renewable energy production process [
11]. In addition to forecasting the climatic conditions affecting renewable energy sources, it is imperative to predict future electrical energy consumption to meet the rising demand [
12]. Therefore, researchers aim to develop a method for predicting electrical load consumption to address issues arising from the unpredictability of future loads [
13]. Due to the intermittent utilization of wind and solar energy, the development of energy storage technologies is crucial to enhance the efficiency and flexibility of energy systems. In this scenario, the cost of materials and production technologies significantly increases the installation expenses of renewable energy-based systems compared to traditional production facilities [
14]. Conversely, tidal and wave energies have attained a mature technical level among all marine renewable energies. The heightened predictability of these sources makes them more dependable than other options. Therefore, by integrating various alternative energy sources, the intermittency and variability of overall production can be diminished, enhancing the dependability of cycles and enabling more sustainable energy production. This integration also has the potential to reduce the necessity for storage capacity and generators [
10]. At present, many scientists and politicians are considering certain concepts that will play a vital role in the future of sustainable energy. The motivation underlying these concepts is to achieve an efficient energy system, use renewable energy, reduce pollution, and protect the environment. In this regard, the concept of multigeneration is a unique, important, and valuable solution [
14].
A significant part of Türkiye’s energy needs is still met using fossil fuels. Considering the country’s resources, renewable energy sources appear to be an alternative source to meet Türkiye’s energy needs. According to the data of the International Energy Agency (IEA), while the world’s primary energy demand was 13.7 billion tons of oil equivalent (TOE) in 2016, it is expected to reach 19.6 billion TOE in 2040, with an increase of 43% [
1].
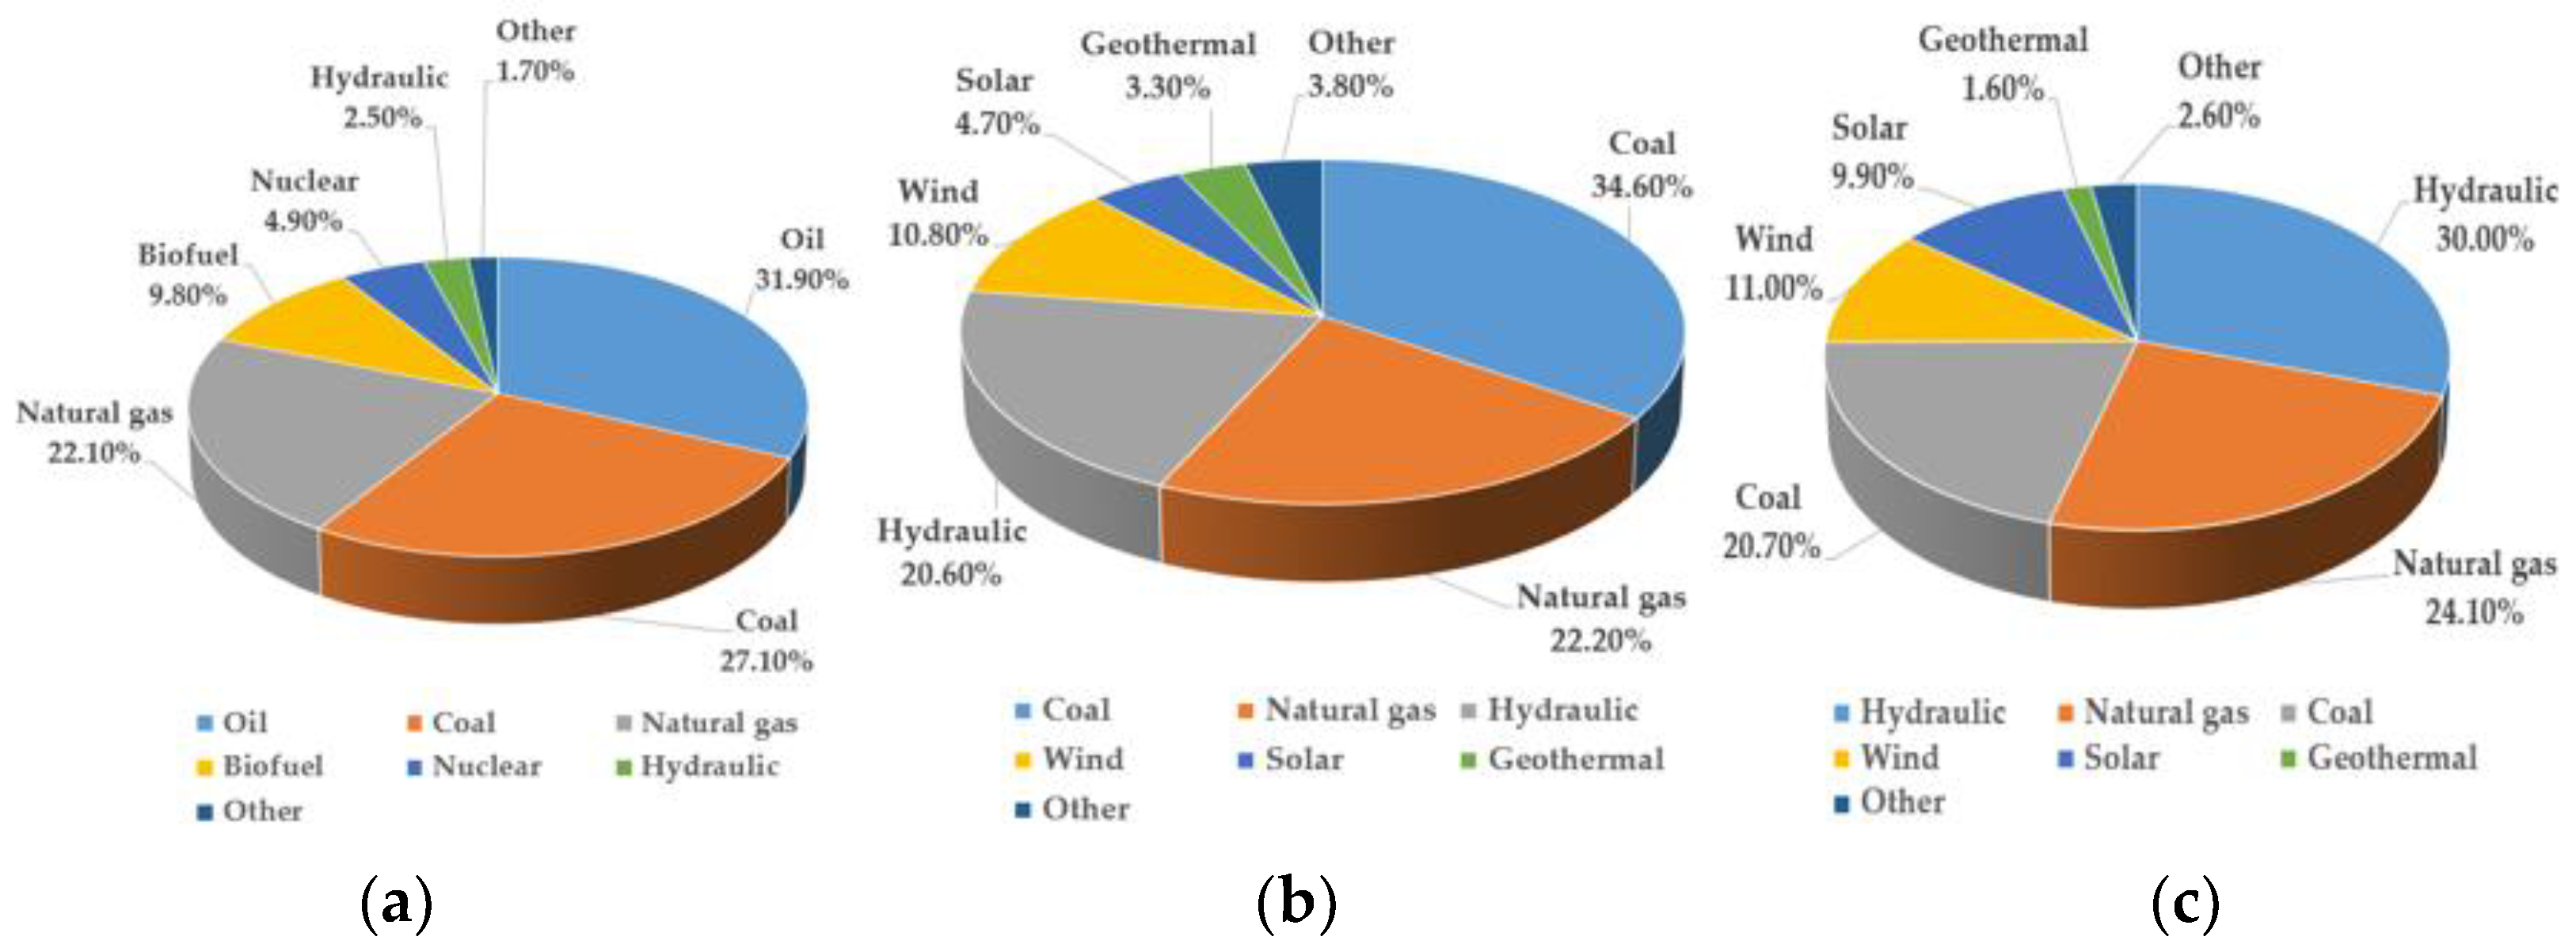
The current distribution of the global primary energy supply, electricity production sources in Türkiye in 2022, and the distribution of installed power sources in Türkiye as of the end of July 2023 are presented in
Figure 1a,
Figure 1b, and
Figure 1c, respectively.
Due to the rapid depletion of fossil fuel energy sources and the environmental impacts, the trend towards the adoption of renewable energy sources is increasing day by day in the world and in Türkiye. When the general energy situation in the world and Türkiye is evaluated, it is shown that the highest electrical energy production from non-renewable energy sources is obtained from coal, and the highest electrical energy production from renewable energy sources is obtained from hydraulic energy. In recent years, wind and solar energies together have started to have a large share in the world electricity production with the increase in the installed capacity and related electricity production. Türkiye has a large solar energy potential due to its geographical location and significant wind and hydraulic energy potential due to its landform characteristics. In 2022, 34.6% of our electricity generation came from coal, 22.2% from natural gas, 20.6% from hydraulic energy, 10.8% from wind, 4.7% from solar, 3.3% from geothermal, and 3.8% from other sources. When the distribution of the installed capacity by resources (
Figure 1c) is analyzed, the increase in hydraulic, wind, and solar energies is noteworthy. Also, as of July’s end, 2023, the installed power of Türkiye has reached 105,135 MW [
15].
Oceans, which cover more than 70% of the world, have long been considered as renewable energy sources. The most important feature of wave energy is that it has the highest energy density among renewable energy sources, especially compared to wind and solar. The global scale of energy generated by the waves is 8,000,000 TWh/year [
16]. When compared to each other, wave energy is approximately 10 times more intense than solar energy and approximately 5 times more intense than wind energy per m
2. Considering these rates, the slightest efficiency increase in the form of wave energy will result in an energy increase that is 5–10 times that of other forms of renewable energy [
17]. Wave energy is one of the most clean, natural, powerful, and constantly renewable energy types. In Türkiye, bordered by three seas, wave energy holds promise as an alternative to depleting fossil fuels. Countries worldwide with ocean shores are benefiting from this energy source, primarily through structures located on the coast.
When looking at the studies in the literature, different situations are encountered. To briefly state the work conducted, different integrated renewable energy sources are available in the literature for energy and exergy analyses of electricity production. Özlü et al. [
18] worked on the analysis of solar and wind hybrid multi-energy systems. In this study energy, exergy, economy, and environmental impacts were analyzed. The energy and exergy efficiencies of the system were calculated as 43% and 65%, respectively. The maximum turbine output was 48 kW, the cooling effect was 28 kW, and the heating effect was 298.5 kW. Thanks to the system, 1614 tons of CO₂ were saved annually. This multi-generation system met all the energy requirements of at least 49 households. Sezer et al. [
19] studied a renewable energy-driven multigeneration system efficiently utilizing wind and solar energy sources to produce valuable commodities, like hydrogen, oxygen, and electricity. The innovative design contributed to sustainability efforts, with calculated energy and exergy efficiencies of 61.3% and 47.8%, respectively. Al-Sharafi et al. [
20] investigated the techno-economic evaluation of solar and wind energy-supported electricity and hydrogen production in different locations in Saudi Arabia. They examined electricity and hydrogen production under the Saudi Arabian climate with different solar radiation and wind speeds. The lowest energy and hydrogen production costs were found to be 1208 USD/kWh and 43.1 USD/kg for the Abha region. Yilmaz et al. [
4] worked to produce electricity and hydrogen from wind and solar energy sources. This study presented four subsystems: a solar collector cycle, an ORC, wind turbine power, and hydrogen production and compression systems. The system’s energy and exergy efficiencies were determined as 21% and 16%, respectively. Furthermore, the organic Rankine cycle and wind turbine, combined, yielded a net electricity rate of 195.9 kW and 326.5 kW, respectively. These findings illustrated the potential for the proposed facility to be an environmentally conscious choice. Huang et al. [
21] conducted a study on hybrid solar–wind systems, introducing a novel category that employed multiple small wind turbines instead of a larger one. They analyzed the electric power difference between the multi-turbine hybrid system and the traditional wind turbine. Two hybrid wind–solar systems were developed in Tianjin, offering comparable capacities, and utilizing the TRNSYS software for electric power calculations. The study concluded that the multi-turbine hybrid system delivered greater power at lower wind speeds compared to the reference system. Kaabeche et al. [
22] analyzed the thermodynamics, economics, and optimization of a hybrid PV–wind energy system. The study proposed an iterative optimization method for the hybrid PV–wind system, considering power supply deficits, net costs, excess power generation, annual costs, and break-even distances. The researchers optimized the PV–solar hybrid system using a battery bank to meet technical and economic reliability requirements.
Furthermore, Karapekmez et al. [
14] examined an integrated system of wind, solar, and geothermal energy sources to develop a renewable-based energy system with the main goal of higher environmental and system performance. A comprehensive thermodynamic analysis was conducted using an energy and exergy approach. The system’s energy and exergy efficiencies were calculated as 52.97% and 55.69%, respectively.
In addition to wind and solar energy used in integrated form, studies have been conducted on the use of wave energy. Roy et al. [
10] studied the electrical power supply of remote marine areas. This article presented the basic characteristics of wave, tidal, wind, and solar energies, which are different sources that can provide electrical energy in remote sea areas. This study focused on multi-source systems utilizing marine energies, encompassing not only industrial projects but also relevant concepts and research studies. Lavidas et al. [
23] studied multigenerational renewable energy sources in the Saronic Gulf, part of Greece’s most populated urban coastline. Wave, wind, and solar energy sources were analyzed, and their long-term characteristics affecting energy production were compared. It is thought that multiple generations from different sources, especially with the temporal overlap of wind and waves, will reduce intermittent generation and therefore accelerate energy transmission. Kumar et al. [
24] examined integrated renewable energy sources such as wave, wind, solar, and battery energy storage systems. They introduced a hybrid power management algorithm (PMA) integrated with day-ahead demand-side management (DSM), aiming at combining economic and emission load distribution (CEED) to reduce losses. Halamay et al. [
25] analyzed the interaction between ocean wave energy, wind energy, and solar energy production and grid load variations. The results emphasized that a diversified variable renewable energy mix can reduce utility reserve requirements and help to mitigate variability. Ibrahim et al. [
16] aimed to develop a hybrid renewable energy system using wave, wind, and solar energy sources to generate electricity. The hybrid system was installed and tested in the coastal area close to the University Malaysia Terengganu (UMT) campus. The measurement results showed that the existing wave, wind, and solar resources can be used in an integrated manner to meet electricity needs to a significant extent. M. Talaat et al. [
26] examined the feasibility of integrating wave, solar, and wind energies. In this study, three renewable energy sources were used to power a residential building near the coast. An integrated system was designed to be more reliable because of the variability of factors affecting the energy production process. H. Lund [
27] studied the large-scale integration of wave energy, wind energy, and PV into the Danish reference energy system. He analyzed the problems in integrating electricity generation from fluctuating renewable energy sources into the electricity supply. Electricity production was examined when the system was integrated by determining the technically most suitable optimum mixtures. Qu et al. [
28] designed a hybrid floating system utilizing a floating wind turbine, PV, and wave energy converters. The design incorporated a grid system to enhance the buoyancy of the floating foundation. Widen et al. [
29] conducted a study on the assessment, variation, and prediction of solar, wind, wave, and tidal energy resources, building on previous research. This study aimed to summarize the state of knowledge in each area and to compare the approaches used for the respective resources. Reikard et al. [
30] investigated the integration of wave energy into the power grid, alongside wind and solar power sources. The Pacific Northwest region of the United States features a favorable combination of these three energy sources. Load and wind power series were obtained from government databases, while solar power was determined using data from 12 sites across five states. Wave energy was calculated using buoy data, simulations of the ECMWF model, and power matrices for three types of wave energy converters. The analysis led to two notable conclusions. First, the geographic dispersion of renewable energy generators tended to average out localized noise, making power forecasting more manageable. Additionally, wave power proved significantly easier to forecast than wind or solar power. Subekti et al. [
31] explored the design of hybrid power plants combining wave and wind energies, aiming to generate clean, renewable energy for large areas. Vertical ocean wave energy was converted to pressurized water energy, by rotating turbines connected to direct current generators. Simultaneously, wind turbines were linked to direct current generators. Through research and development techniques, the direct current generators enhanced the stability of electrical energy fluctuations from the ocean wave energy generator. The design calculation of the hybrid power plant indicated that ocean waves with a discharge of 0.0054 m
3/s and a height of 65 m can produce 2 kW of electrical energy.
Pennock et al. [
32] studied wave, tidal, wind, and solar energies, which are reliable and high-power generation renewable energy sources in Great Britain. The study used ten metrics to quantify the temporal complementarity and supply–demand balancing requirements of these energy mixes, as well as to investigate the potential magnitude of these system benefits. The study found that incorporating tidal and wave generation into the renewable energy mix enhanced its usability in various conditions. The research conducted three regional case studies over the course of a year, during peak demand, consecutive hourly periods, and when wind and solar generation were unavailable. All three regional case studies demonstrated that the incorporation of marine energy enhanced regional supply–demand matching, reduced energy shortages and surpluses, and potentially alleviated transmission congestion in particularly constrained locations within Great Britain. Jacobson et al. [
33] analyzed the use of renewable energy sources, such as wind, water, and sunlight, to meet the demand for electricity, transportation, and heating/cooling. They examined the system’s features, the current and future energy demand, resource availability, device quantity, space, and material requirements. The study suggested that the world’s power demand could be reduced by 30%, while requiring only a small increase in land usage (0.41% for footprint and 0.59% for area). The authors proposed producing energy from wind, water (wave), and solar sources by 2030. They argued that the obstacles to this transition were primarily social and political, rather than technological or economic.
Astariz et al. [
34] conducted an economic analysis of wave, tidal, and offshore wind energy. The study found that the levelized costs for wave, tidal, and offshore wind marine energies were 225 EUR/MW, 190 EUR/MW, and 165 EUR/MW, respectively. These results indicated that renewable energy sources had a higher energy cost than traditional energy sources. The study suggested that the integrated system accelerated the joint development of renewable energy resources, promoted sustainable use, and reduced supply uncertainties due to resource-specific variability. Astariz et al. [
35] conducted a holistic analysis of wave energy economics, focusing on the integration between wave and offshore wind energy, the shadow effect, and the increased accessibility of wind turbines. According to Azzellino et al. [
36], there is potential for smoothing power output from wave and offshore wind renewable energy sources, as well as for improving their economic viability through operation and maintenance cost reduction. The authors also analyzed the possibility of co-locating offshore wind turbines and wave energy converters in the Italian seas using a spatial planning approach. The study stated that, while waves and winds were generally strongly dependent, there were cases where the dependence is lower, resulting in a more interesting combined energy production. The most suitable areas for the integrated system were the Tyrrhenian coast south of the island of Elba, the northwestern Sardinian coast, and the southern Adriatic and Ionian coastal waters. Additionally, Shi et al. [
37] investigated the dynamic power and load impact performance of an integrated wind wave energy system utilizing an optimized hollow cylinder wave energy converter (WEC) to identify the potential areas of interest for the development of the marine renewable energy sector with a focus on minimizing costs and environmental impact. A numerical model was constructed using the open-source code F2A to simulate a 5 MW semi-submersible wind turbine with an optimized wave energy converter. Hydrodynamic loads on the integrated platform were calculated according to potential flow theory using the AQWA hydrodynamic code. The shape optimization of the wave energy converter was performed using a dimensionless optimization method, and the optimum was obtained using a differential evolution algorithm. The article compared the time domain and statistical responses of the integrated system with and without wave energy converter optimization. This article guided the achievement of the optimum design of offshore wind–wave energy integrated systems and provided convenience by quantifying the benefits of using optimum designs in the generated wave energy power. Yang et al. [
38] investigated the design and development of a hybrid energy production system that can simultaneously collect wave and wind energies. The system is unique in that it can collect both vertical and horizontal wave energy, as well as wind energy. The system can convert both wave and wind energies into kinetic energy with a 5 kW permanent magnet generator, which is then used to produce electricity.
Sağlam et al. [
39] stated that Türkiye’s wave energy potential was approximately 10 TWh/year as a usable resource in the wave power range of 4–17 kW/m. The north of the Bosphorus, the Western Black Sea region, and the southwestern coasts of the Aegean Sea (between Marmaris and Finike) were recommended as the best locations for wave energy. Ozdamar et al. [
40] investigated the potential wave energy and associated costs of Turkish waters, focusing on Cesme-İzmir. Cesme is renowned for its abundant wind, significantly contributing to sea wave formation. The Solar Energy Institute of Ege University conducted wind velocity measurements at an altitude of 10 m in Cesme from 05.11.1998 to 05.11.1999. The measured values were taken at an altitude of 19.5 m above sea level. Applying the Pierson–Moskowitz wave energy spectrum, the team worked to determine the wave energy potential in the area throughout the year. Monthly variations in wave energy were evaluated, and the data were utilized to calculate the unit cost of electricity produced by a turbine with a width of 1 m, assumed to be installed in the measurement area. Ozkop et al. [
41] offered a novel perspective on wave energy conversion (WEC) technologies by summarizing and categorizing previous studies based on system components. This approach effectively showcases the performance, efficiency, and advancement of WEC technologies over the past two decades. The research demonstrated the interrelated nature of various elements within a WEC system, encompassing wave energy converter types, generator motion, control techniques, and power electronic converters. Consequently, effective optimization requires the careful consideration of all components, emphasizing that no single element should be optimized in isolation. This study showed that several studies on WEC systems were conducted. The authors of this paper hope that the survey and analysis provided will help the research community and investors to accelerate the development process of electricity generation using wave energy. Ishaq et al. [
42] examined three different renewable energy methods, Ocean Thermal Energy Conversion (OTEC), wind, and solar energy, for clean hydrogen production. This study showed the value of developing a clean OTEC-based hydrogen production system and applying it for practical applications. The overall energy and exergy efficiencies of the wind energy-based methodology for producing hydrogen were 33.51% and 32.7%, respectively. For the ocean thermal energy conversion-based system, they were 5.61% and 13.6%, respectively. The efficiencies for the solar energy-based thermochemical cycle were found to be 32.7% and 33.2%, respectively.
Renewable energy usage in Türkiye is increasing, especially in areas of solar and wind energies. Türkiye plans to implement strict regulations to further promote the use of renewable energy in the future. Wave energy has also gained significant attention as a potential renewable energy source, particularly due to Türkiye’s extensive coastline. We conducted energy and exergy analyses to determine the electrical power potential in six cities in Türkiye by designing an integrated system that combines wave, wind, and solar energy. The study aims to find an effective, efficient, economical, environmentally friendly, and sustainable way to produce electricity while demonstrating the potential of wave, wind, and solar energy systems in Türkiye. The aim of this work is to reach net-zero targets and transition towards low-carbon and carbon-free energy systems.
In this regard, to the best of the authors’ knowledge, there is no study that investigated an integrated electricity generation system from wind, wave, and solar energy sources in Türkiye. This work has two main contributions. Firstly, it examines the potential of integrated renewable energy resources on Türkiye’s coastline and finds the most suitable cities. Secondly, it determines the capacities of wave, wind, and solar energies through energy and exergy analyses in an integrated form on Türkiye’s coastline. Local policymakers and governments can effectively utilize the provided wave, solar, and wind energy potential for different zones to align their energy trends with the available renewable energy potentials of the country. This will enable the country to have an effective energy hub in the region.
2. Materials and Methods
This study presented three renewable energy-based methodologies for electricity generation. The primary objective of the system design was to generate a range of valuable resources, including electricity, without causing harm to the environment. The energy system design relied exclusively on renewable sources, utilizing wave, wind, and solar power to operate the system.
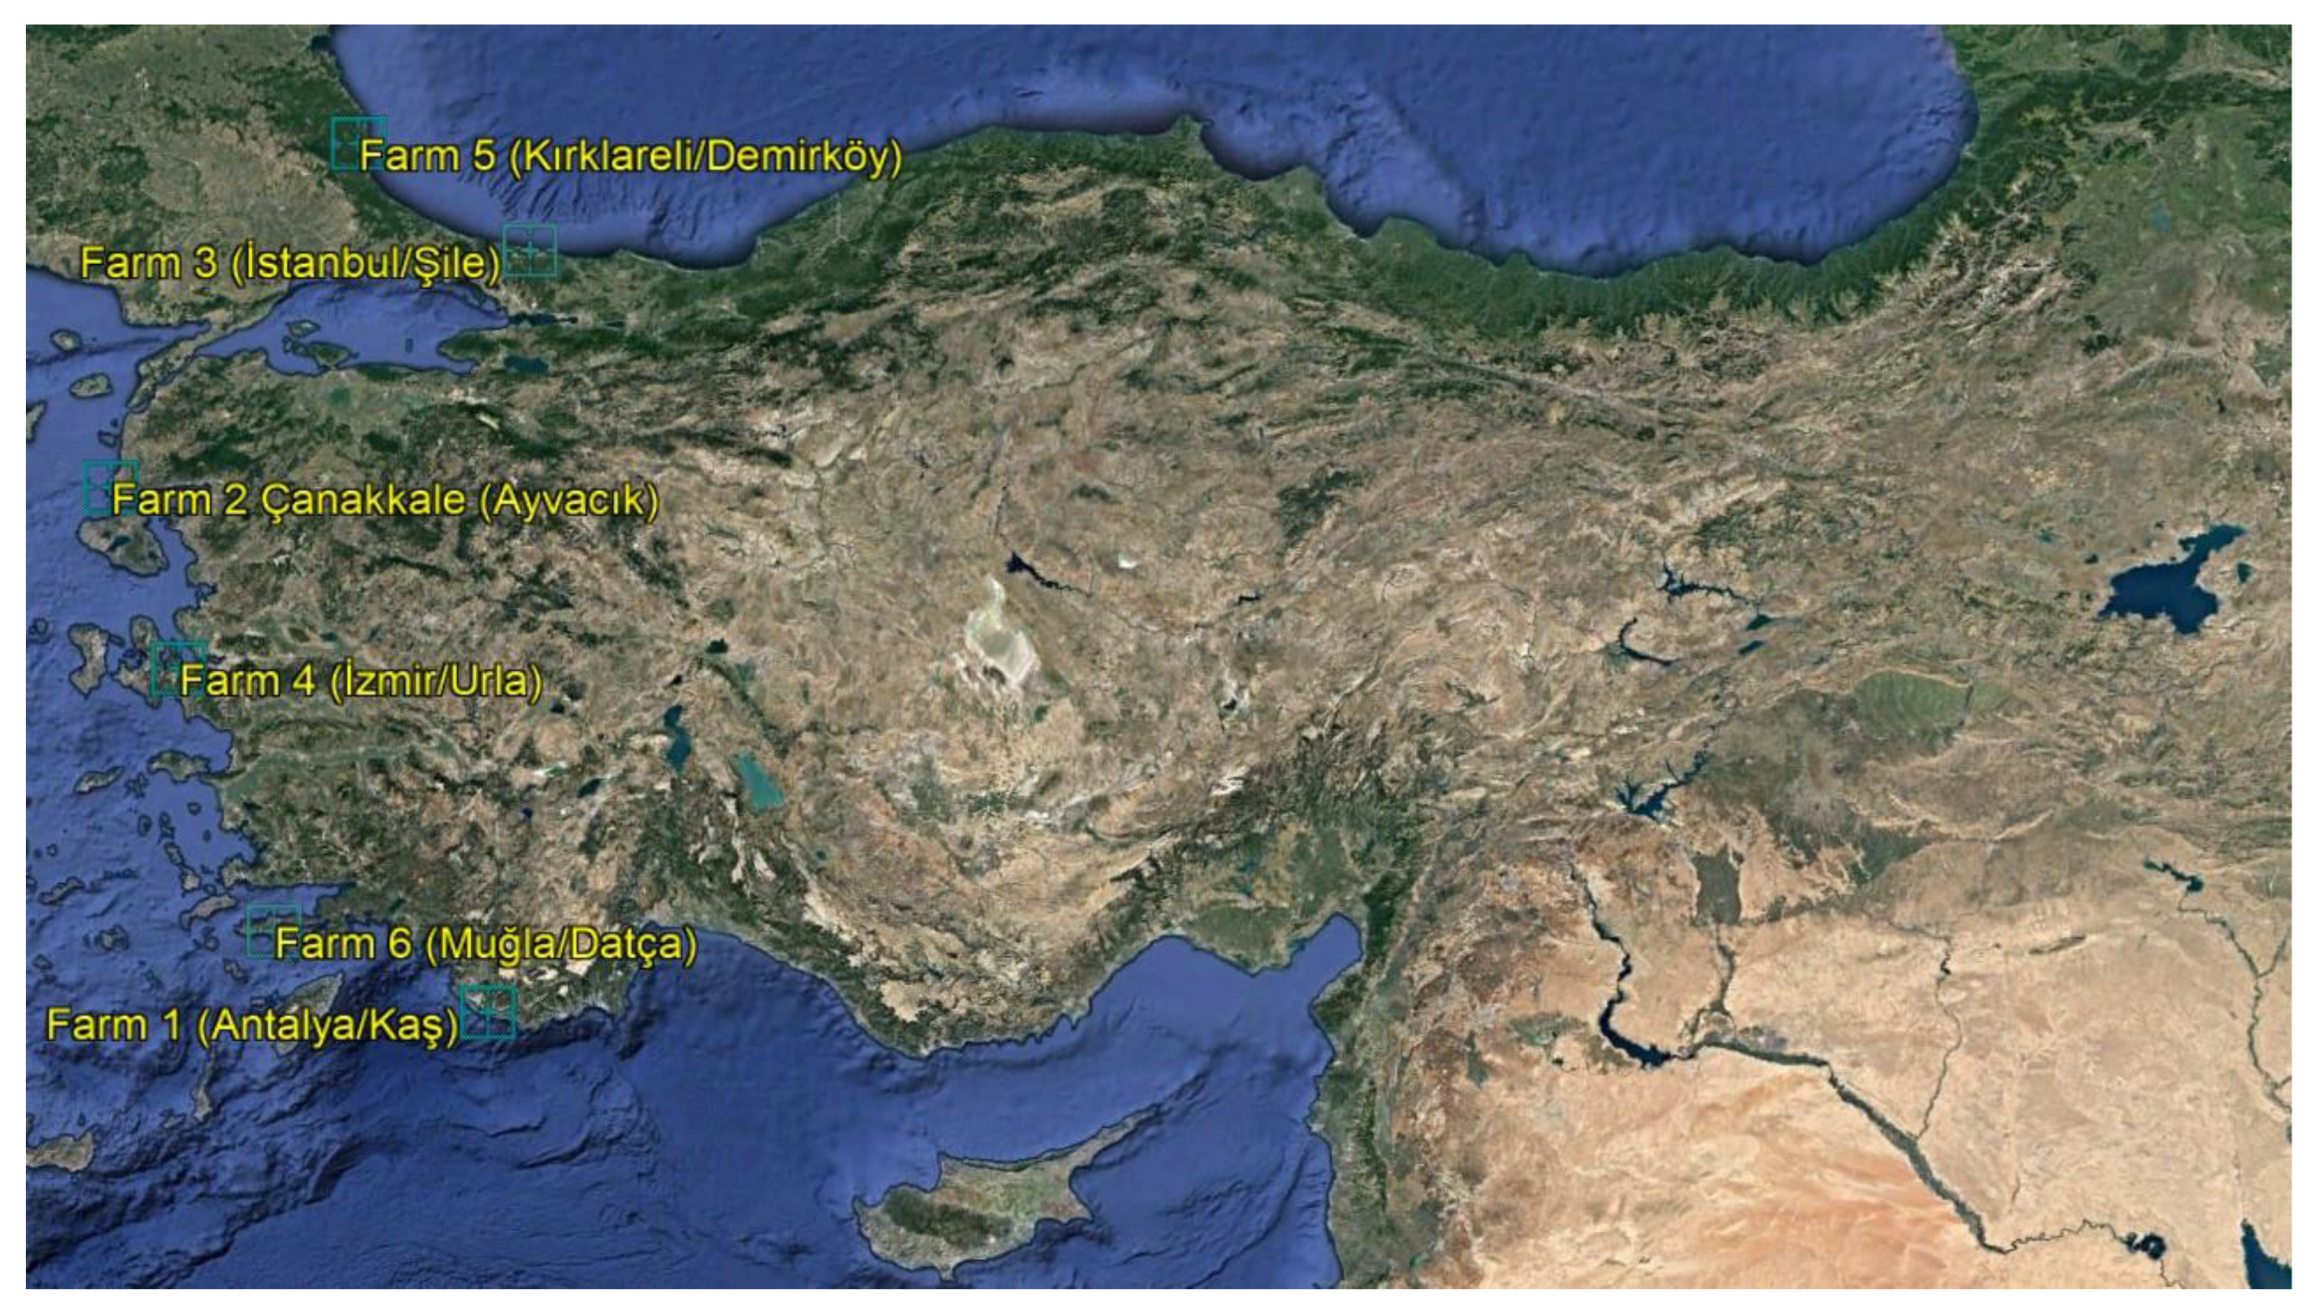
In the current paper, to investigate the relevant issue in depth, six provinces from different regions of Türkiye (Antalya, Çanakkale, İstanbul, İzmir, Kırklareli, and Muğla) were assessed in terms of wave, wind, and solar potential, including wave data, wind speeds, sunshine duration, and global radiation values. The chosen districts of the six provinces identified in
Figure 2 were as follows: Antalya (Kaş), Çanakkale (Ayvacık), İstanbul (Şile), İzmir (Urla), Kırklareli (Demirköy), and Muğla (Datça).
Wind, wave, and solar energy data of the selected regions were taken from the ERA5 database, which is the weather forecast model of the European Center for Medium-Term Weather Forecasts (ECMWF) [
44], and Solar Energy Potential Atlas (GEPA) of the Ministry of Energy and Natural Resources of the Republic of Türkiye [
45] and the General Directorate of Meteorology [
46], PV*SOL (Meteonorm database) [
47,
48], and National Renewable Energy Laboratory (NREL) System Advisor Model (SAM) (Photovoltaic Geographical Information System (PVGIS-SARAH2 database)) [
49,
50]. Calculations were made by taking monthly data of the last 5 years. ERA5 provides hourly estimates of numerous atmospheric, land, and oceanic climate variables on a 30 km grid, resolving the atmosphere using 137 levels from the surface up to 80 km. Uncertainty information is included for all variables at reduced spatial and temporal resolutions. Also, PV*SOL utilizes the Meteonorm data source, developed by Meteotest, a widely accepted source of solar radiation data in the solar energy industry. It has become the standard meteorological database for solar energy simulations. Furthermore, the SAM method was utilized for generating electricity from a parabolic solar collector system. The data for the selected cities were obtained from the PVGIS, which is a widely accepted and utilized source of solar radiation data in the solar industry. PVGIS provides information on solar radiation and photovoltaic system performance for any location in the world, except the North and South Poles. PVGIS employs various databases, including the widely used PVGIS-SARAH2 solar radiation data that covers Europe. Additionally, all the solar data obtained from Meteonorm and PVGIS have been verified by the GEPA of the Ministry of Energy and Natural Resources of the Republic of Türkiye.
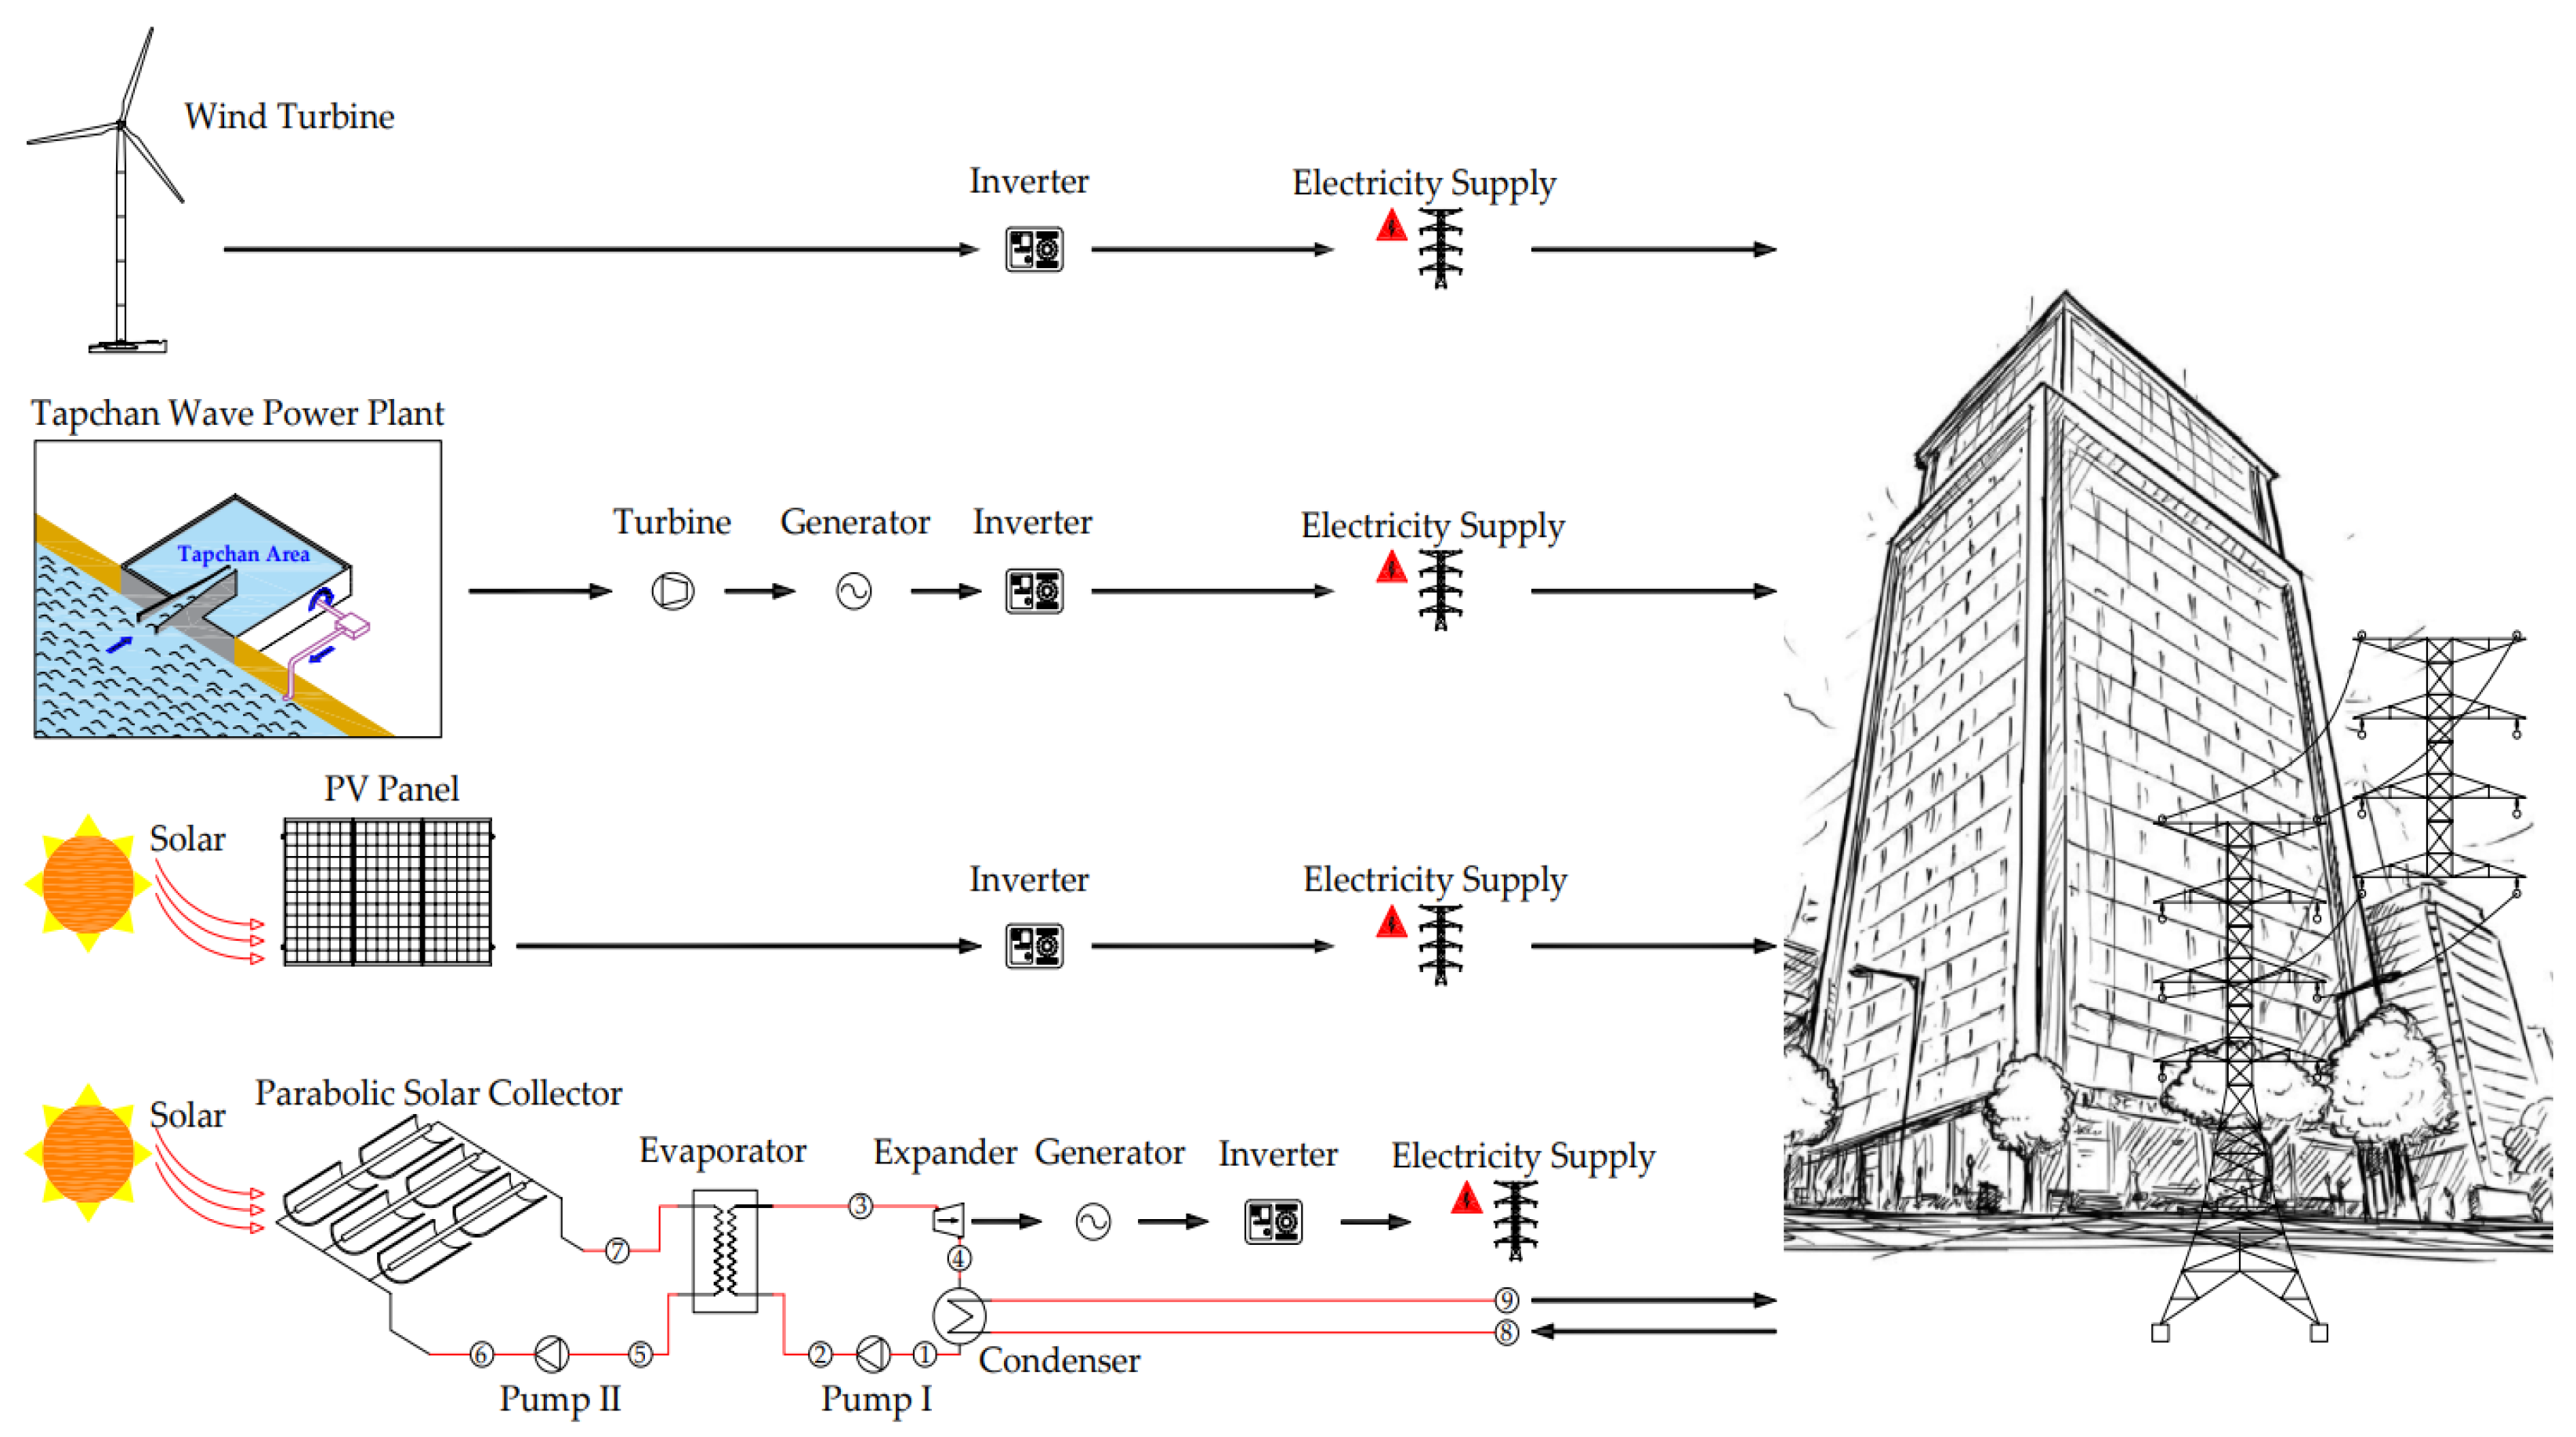
In this study, a novel renewable-based multigeneration energy system was designed and analyzed using energy and exergy approaches. A schematic view of the designed system is illustrated in
Figure 3. The system structure was created using Microsoft Visio [
51].
As shown in
Figure 3, the current system consisted of a wind turbine, the TAPCHAN wave generation method, a photovoltaic panel (PV), and a parabolic solar collector system. In the system design, the thermodynamic modeling and equations of the integrated system and a thermodynamic analysis were performed in terms of energy and exergy approaches using the Engineering Equation Solver (EES) [
52] software program. In addition, PV*SOL [
47] for the PV system and the National Renewable Energy Laboratory System Advisor Program (SAM) [
49] for the parabolic solar collector system were used. Considering the coastal lengths that were considered in the determined regions, the annual total electrical power that can be produced from wind, wave, and solar energies was calculated.
In this design, based on the determination of the potential of wave and wave-integrated wind and solar energy in Türkiye, the model design was carried out by determining the same shore lengths in each determined location for the establishment of electricity generation facilities on the sea coastline. The potential electrical power generated from renewable energy sources was analyzed using the developed model. The system design and planning were determined by considering the geographical structure, altitude, and environmental factors of the location where the power plant will be installed.
2.1. Thermodynamic Modeling
In this section, we present the thermodynamic modeling and equations for the integrated system designed based on energy and exergy performance analyses. A thermodynamic analysis was performed in terms of energy and exergy approaches using the EES software.
2.1.1. Thermodynamic Energy and Exergy Analyses of the Wind Turbine
The power obtained from the wind turbine can be calculated using the following expression:
Wind turbine power (
) is expressed in terms of air density (
, kg/
), efficiency (
), speed (V, m/s), and turbine power coefficient (
) [
53].
The exergy obtained from the wind turbine can be calculated using the following expression:
Exergy efficiency can be calculated using the following expression:
The exergy destruction of the wind turbine can be calculated using the following expression:
2.1.2. Thermodynamic Analysis of the Ocean (Wave) Energy System
Energy fluctuations can be observed in sea waves. In wave energy systems, the energy in ocean waves is converted into electricity. The electrical power obtained from the waves depends on the amplitude and period of the waves. Since the power produced from waves is proportional to the square of the amplitude, the wave amplitude has more impact on power output than the period of motion [
54]. The relationship between wavelength (
λ/
m) and period (
s) is expressed as follows:
The traveling wave is described by the following expression:
It is expressed in terms of amplitude (
a), wavelength (
λ), height above sea level (
y), time (
t), horizontal coordinate (
x), angular velocity (
w), and period (
τ).
Wave velocity can be calculated using the following expression:
The total wave energy can be calculated as the sum of the potential and kinetic energies using the following expression:
The kinetic and potential energies per unit area can be expressed as follows:
Finally, wave energy per unit time can be obtained by multiplying by the frequency and Equation (10).
The energy potential of the wave can be calculated using the following expression:
The power potential of the wave can be calculated using the following expression:
In this system, the TAPCHAN Channel System (TAPCHAN) was preferred as the wave energy production method, and the wave power plant efficiency can be calculated using the following expression:
It is expressed in terms of efficiency (
), wavelength (
), and wave height (
[
55].
2.1.3. Thermodynamic Energy and Exergy Analyses of the Photovoltaic System (PV)
The energy and exergy analyses of PV systems are expressed according to the first and second law of thermodynamics. The energy balance of the PV system is determined using Equation (15) [
56].
represents the electricity production of the PV system and
represents the heat losses of the system.
represents the open circuit voltage and
is the short-circuit current.
The heat losses of the PV system to the environment are expressed by Equation (17). It is expressed as convective and radiative heat loss from the photovoltaic cell to the environment ( maximum current power ( cell temperature (, and ambient temperature (.
The total energy balance of the PV system is expressed as follows.
The energy efficiency (
of the PV system can be defined as the ratio of the output energy, that is, the sum of the electrical and thermal energies, to the solar energy reaching the PV surface and can be expressed as follows.
The daily electricity efficiency (
of the PV system is shown below.
The electrical exergy produced by the PV system aims to use as much of the available energy as possible. The exergy balance of the PV system (E
is as in Equation (21).
where
represents the electrical exergy of the PV system, and
and
represent the internal and external exergy losses, respectively.
The exergy efficiency (
of PV systems is the ratio of the exergy value of the PV system to the amount of sunlight reaching the PV system surface. It is calculated by the ratio of radiation to exergy value.
in Equation (25) is the exergy of solar radiation that arrives at the collector. In its simplest form, this value is calculated using Equation (26).
2.1.4. Thermodynamic Energy and Exergy Analyses of the Parabolic Solar Collector System
The mass, energy, entropy, and exergy expressions, which are the general thermodynamic equilibrium equations of the parabolic solar collector system, are presented below. In the system model shown in
Figure 3, equations were derived by numbering the parabolic solar collector cycle.
Heat Exchanger (Evaporator)
Turbine
Condenser
Pump-II
Solar Collector
2.2. Optimization and Economic Analyses
To find the optimum factors for the maximum total electricity generation and the number of houses at minimum cost were analyzed with the Response Surface Methodology (RSM) using the Design Expert, Version v13 [
57] software.
Response Surface Methodology (RSM)
The Response Surface Method (RSM) is a combination of statistical and mathematical techniques used for developing and optimizing processes. RSM comprises experimental strategies for exploring the process variables to determine the relationship between the system response and the independent variables. [
58] Also, it helps to find out the levels at which process variables have the desired effect on the system responses with optimization techniques. The RSM optimization approach offers a significant advantage over other optimization methods. RSM generally requires fewer simulation instances, resulting in a smoother and more regular analysis of component simulations, interactions, and specific responses. Therefore, RSM with the commonly used Central Composite Design (CCD) was used in this study [
59].
The block diagram in
Figure 4 summarizes the integrated form modeling and optimization of the wave, solar, and wind power generation parameters conducted in this study. The study employed the Response Surface Methodology to develop the experimental design layout. This involved inputting factors with specified low and high real bounds to estimate the corresponding responses. The responses were then assessed and optimized using the Response Surface Methodology, with a focus on achieving maximum electricity generation, determining the number of houses, and minimizing associated costs. To achieve this, RSM and CCD delivered 30 simulation runs by employing the commercial software Design Expert for these analyses [
60,
61].
3. Results and Discussion
In this section, the thermodynamic modeling and equations of the designed integrated system, and a thermodynamic analysis in terms of energy and exergy approaches are presented, as they were performed using the EES engineering software. Taking the coastal lengths considered in the determined regions, the annual total electrical power that can be produced from wind, wave, and solar energies was calculated. In this study, a model design was developed for the establishment of electricity production facilities from renewable energy sources on the sea coastline, based on the determination of the wave energy potential in Türkiye.
According to all selected locations in the model, the coastal lengths and areas were fixed as 5.4 km and 135,000 m2, respectively. The distance from the shore to the land was accepted as 100 m. In this model, 25% wave energy, 25% wind, 25% PV, and 25% parabolic solar collectors were considered. The model was analyzed in six different farms in each city, separately. To calculate the maximum wind energy, it was determined that two turbines were needed for the selected area. Similarly, to calculate the maximum photovoltaic solar energy, it was determined that 49,769 units of panels were needed for the selected area. The estimated number of loops was 25, with a total reflective aperture area of 131,200 m2, in order to determine the maximum solar energy that can be produced by the parabolic solar collector. Additionally, the area required to calculate the maximum wave energy was 135,000 m2.
In these calculations, the electrical power potential that can be produced from energy sources was analyzed for wind, wave, and solar energies using the same shore length parameter. Considering these analyses, the annual total electrical power and the number of houses were calculated assuming that the daily electrical energy need of a house was 10 kWh. As a result, the potential electrical power and the number of houses that can be met in the selected regions were compared. It is important to mention that the wave height, wave period, wind speed, and global radiation parameters used in the calculations of electricity generation from renewable sources were obtained from different databases (the ERA5 database, which is the weather forecast model of the European Center for Medium-Term Weather Forecasts (ECMWF), and the Ministry of Energy and Natural Resources of the Republic of Türkiye, the General Directorate of Meteorology, PV*SOL (Meteonorm database) and SAM (PVGIS-SARAH2 database)). Therefore, the amount of electricity generated by an integrated system that can be installed in reality may vary slightly due to unforeseen changes in these parameters.
3.1. Thermodynamic Results of the Wind Turbine System
A parametric analysis of the integrated wind turbine system was conducted using the EES software program. V100-2.0 MW IEC IIB (Vestas) was preferred as the wind turbine model used in the system [
62]. As shown in
Table 1, a sweeping area of 7854 m
2 and a rotor radius of 50 m were assumed for the selected wind turbine. A wind turbine can convert a certain portion of wind power into energy. The amount of power that a wind turbine can convert into energy cannot exceed the Betz limit. Since the Betz limit is 0.59, a wind turbine can convert, at most, 59% of wind power into energy. Since this value cannot be reached in reality, the amount of power that can be obtained from the wind turbine in our study was considered as 0.35. In this regard, the results were estimated by calculations using the EES program [
53,
63].
As shown in
Table 2, based on the model, separate calculations were made for the selected locations, and the annual total electrical power and the number of houses whose electricity needs can be met were calculated.
In
Figure 5, the annual production and number of houses according to the locations selected based on the model are shown graphically.
The above table and graphic results were obtained when the calculations were performed for the selected locations. The main findings of this study are as follows:
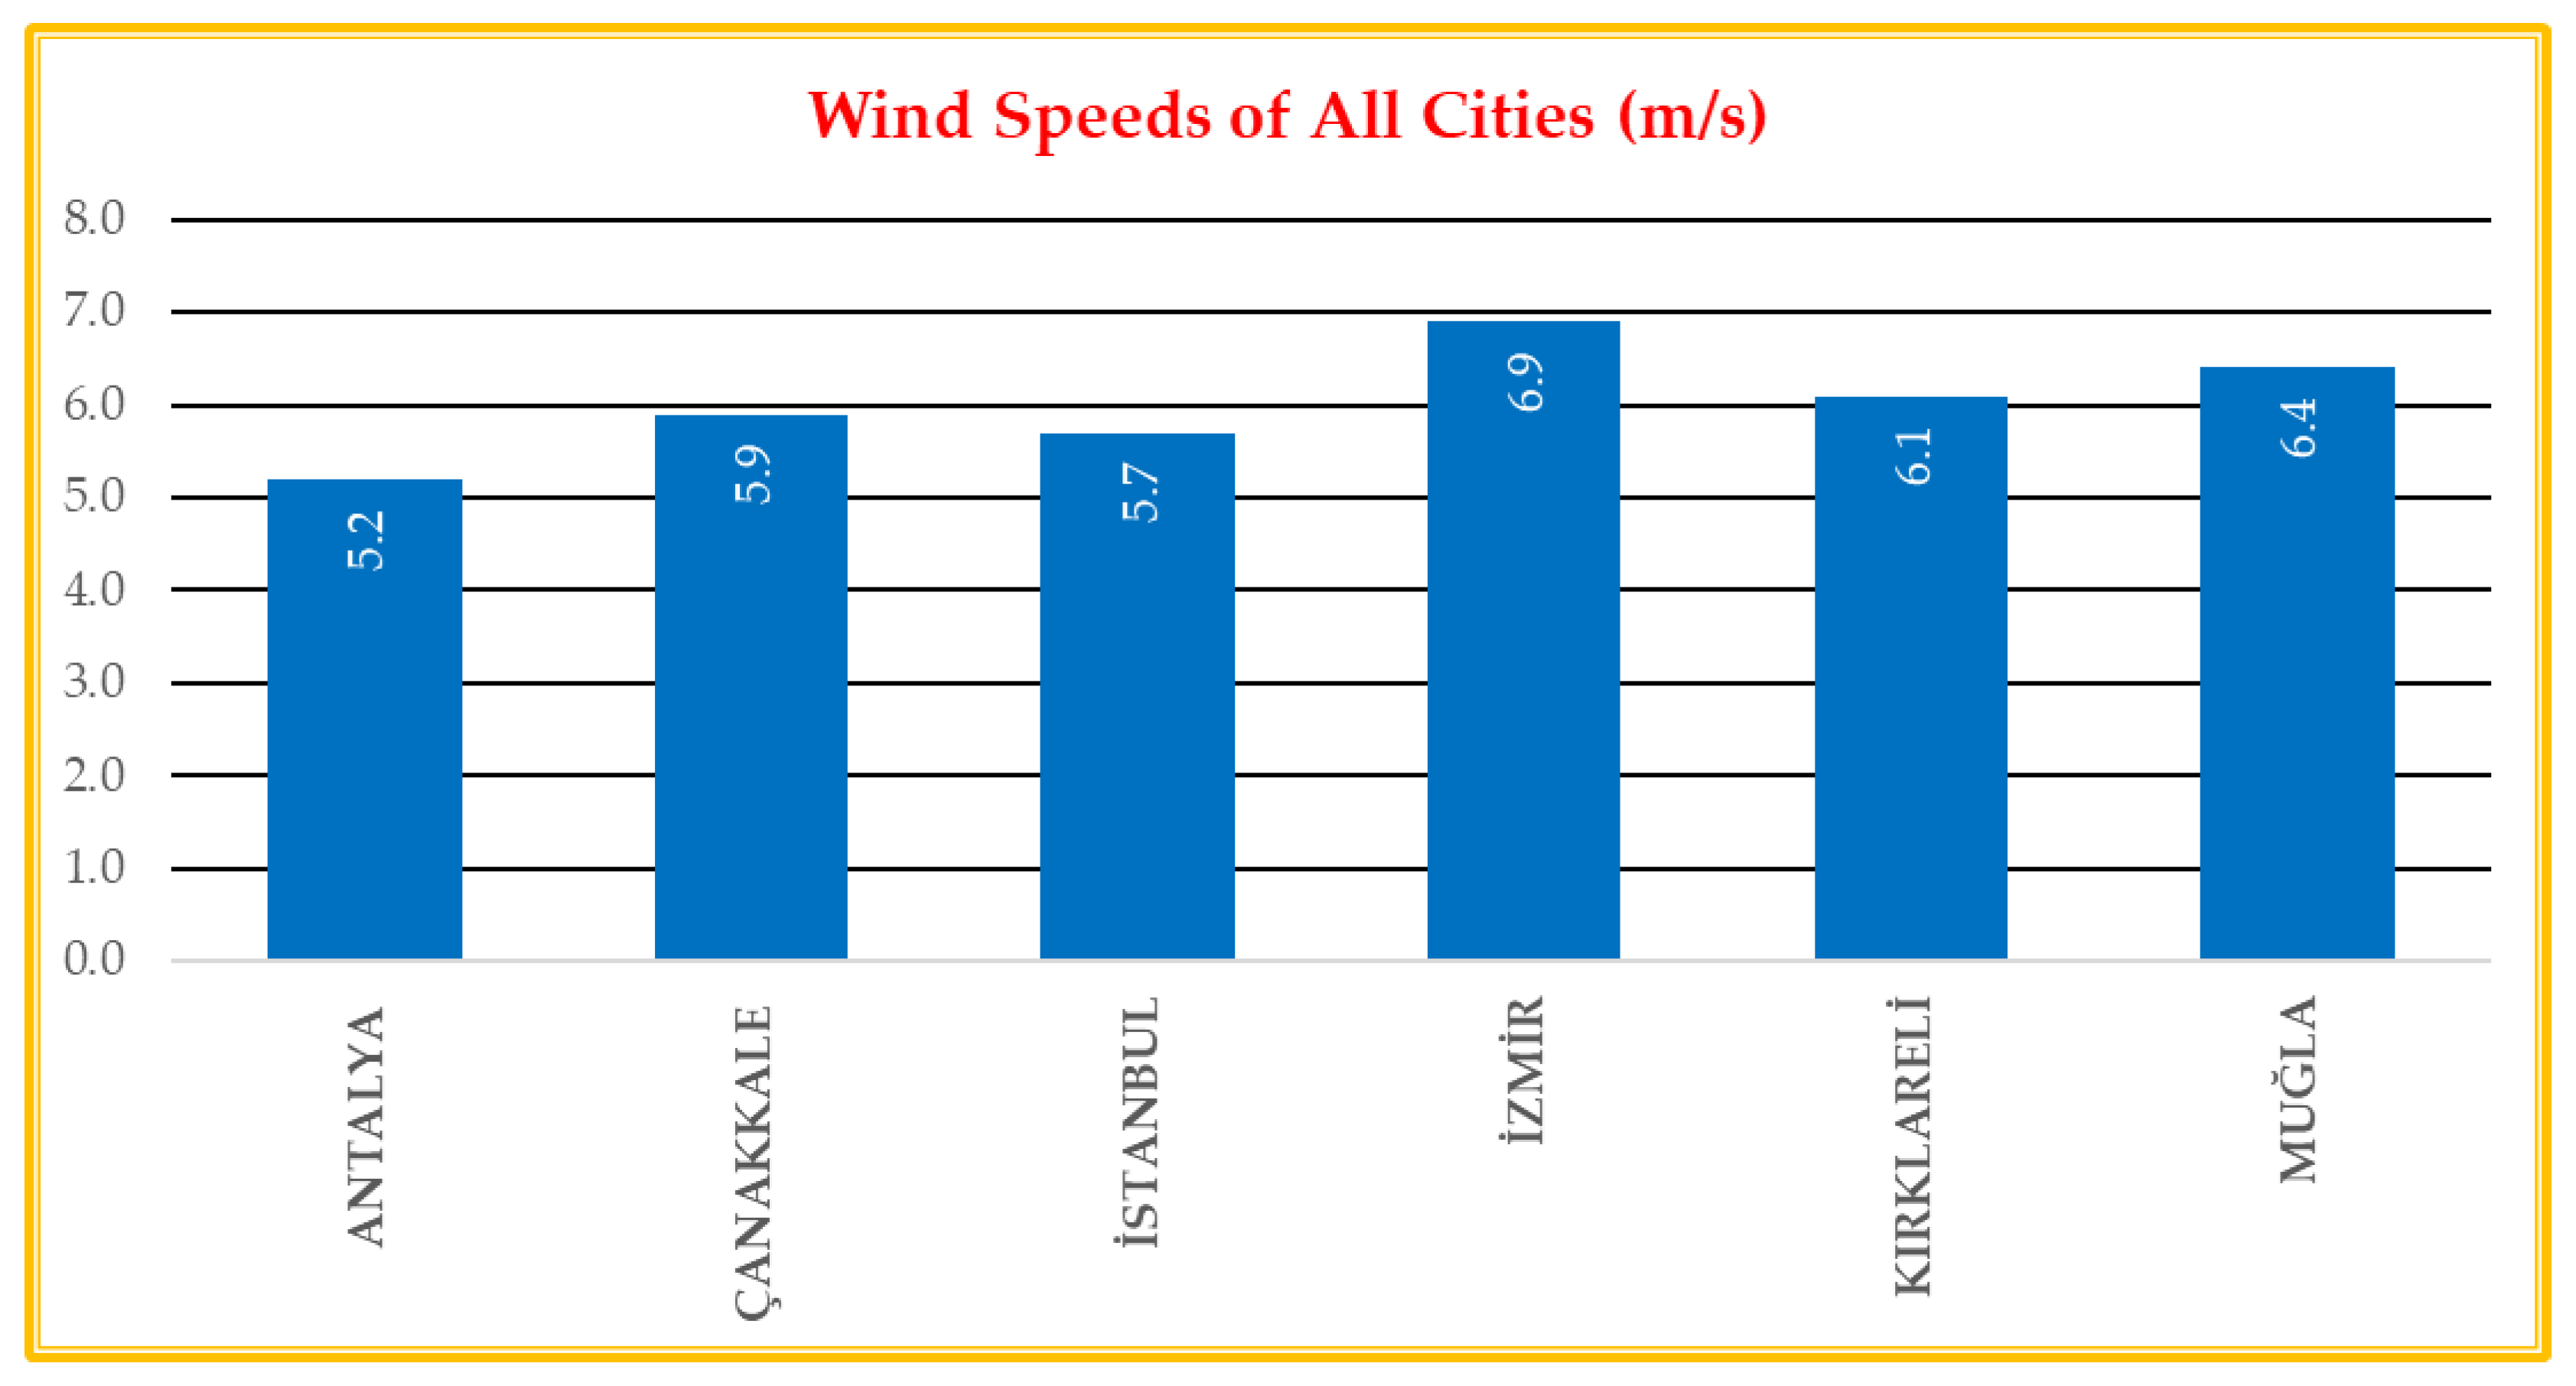
According to the model, the power obtained from the wind turbine was the highest in İzmir/Urla compared to the other locations. İzmir was followed by Muğla, Kırklareli, Çanakkale, İstanbul, and Antalya. When the wind speeds of all selected locations as presented in
Figure A1 were considered, this result was expected due to the highest values of İzmir/Urla.
It was determined that the highest consumption can be met in İzmir/Urla and the lowest in Antalya/Kaş in terms of the number of houses’ electricity consumption according to the calculated power.
The wind turbine efficiency was assumed to be 90%. The exergy efficiency of the wind turbine was calculated as 31.5%.
3.2. Thermodynamic Results of the Ocean (Wave) Energy System
A parametric analysis of the integrated wave energy system (TAPCHAN) was conducted using the EES program [
54,
55]. The TAPCHAN system presented in
Figure 6 is a modified version of the conventional hydroelectric power generation system. These systems comprise a channel that gradually narrows down and feeds a reservoir constructed on the shore with a wall height above the water level. The narrowing of the channel results in an increase in wave height and the rising waves flow through the channel walls into the reservoir. As water accumulates in the reservoir, the kinetic energy of the traveling wave is converted into potential energy. The water that is stored is supplied to the turbine, which has low maintenance costs and high reliability due to its minimal moving parts [
64].
As shown in
Table 3, the EES solutions were obtained by determining the wave heights, wave speeds, wind speeds, and areas of the selected regions according to the determined models. As shown in
Table 4, separate calculations were made for the selected locations, and the annual total electrical power and the number of houses whose electricity needs can be met were calculated.
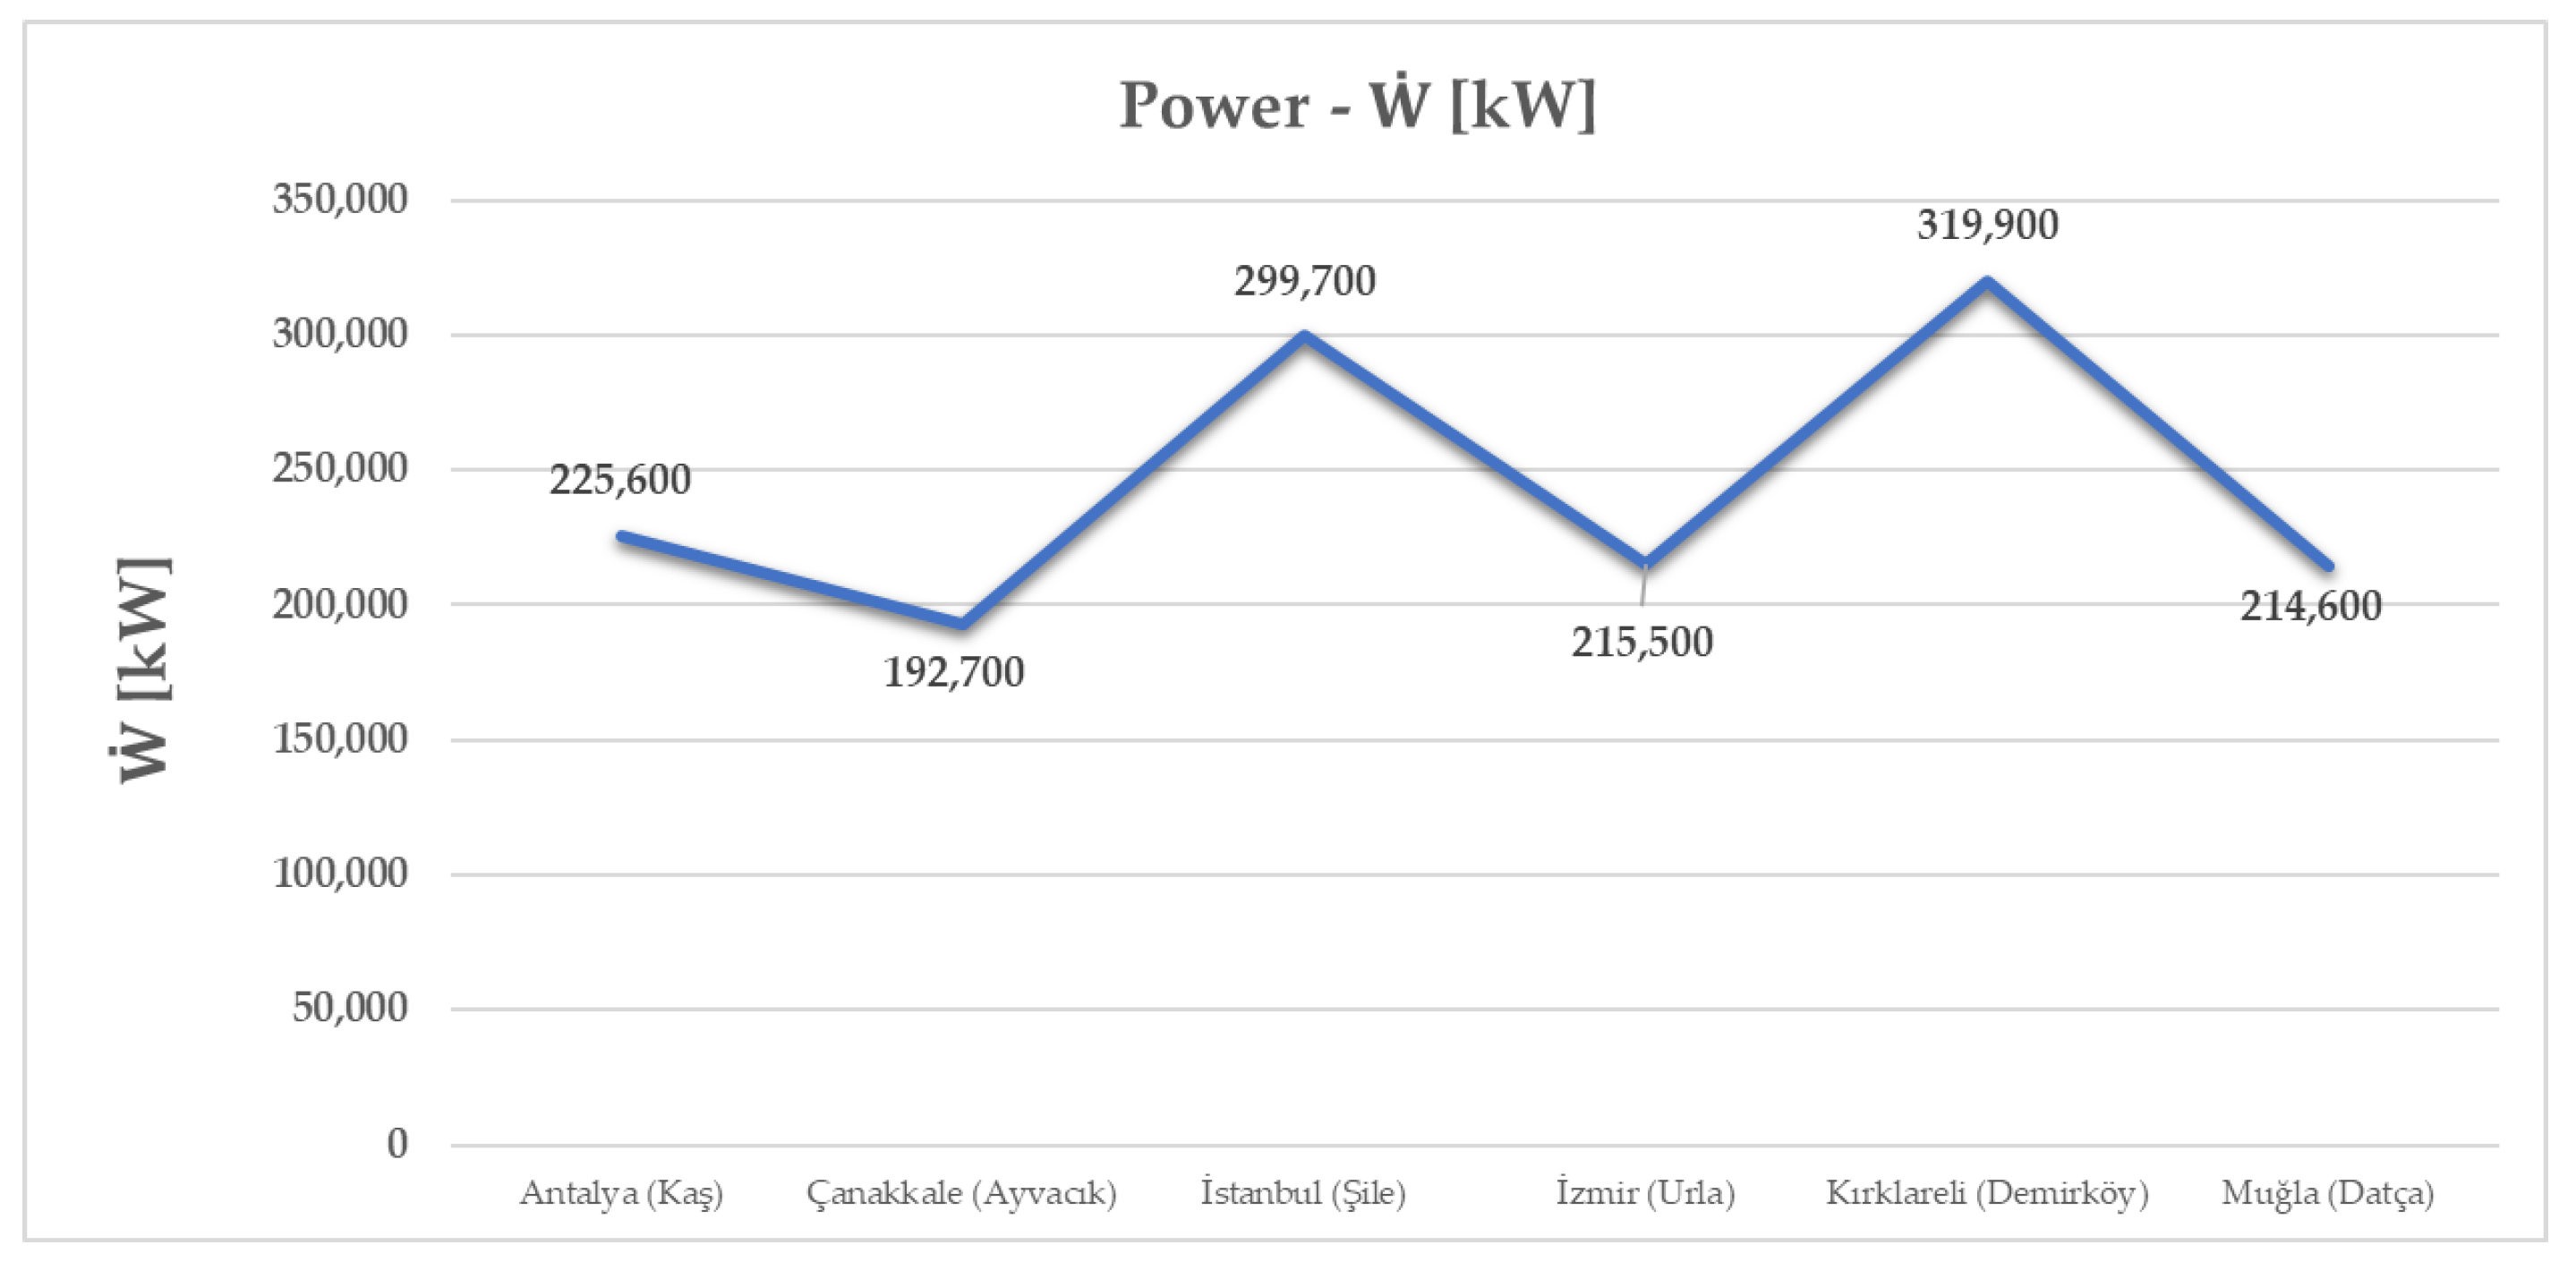
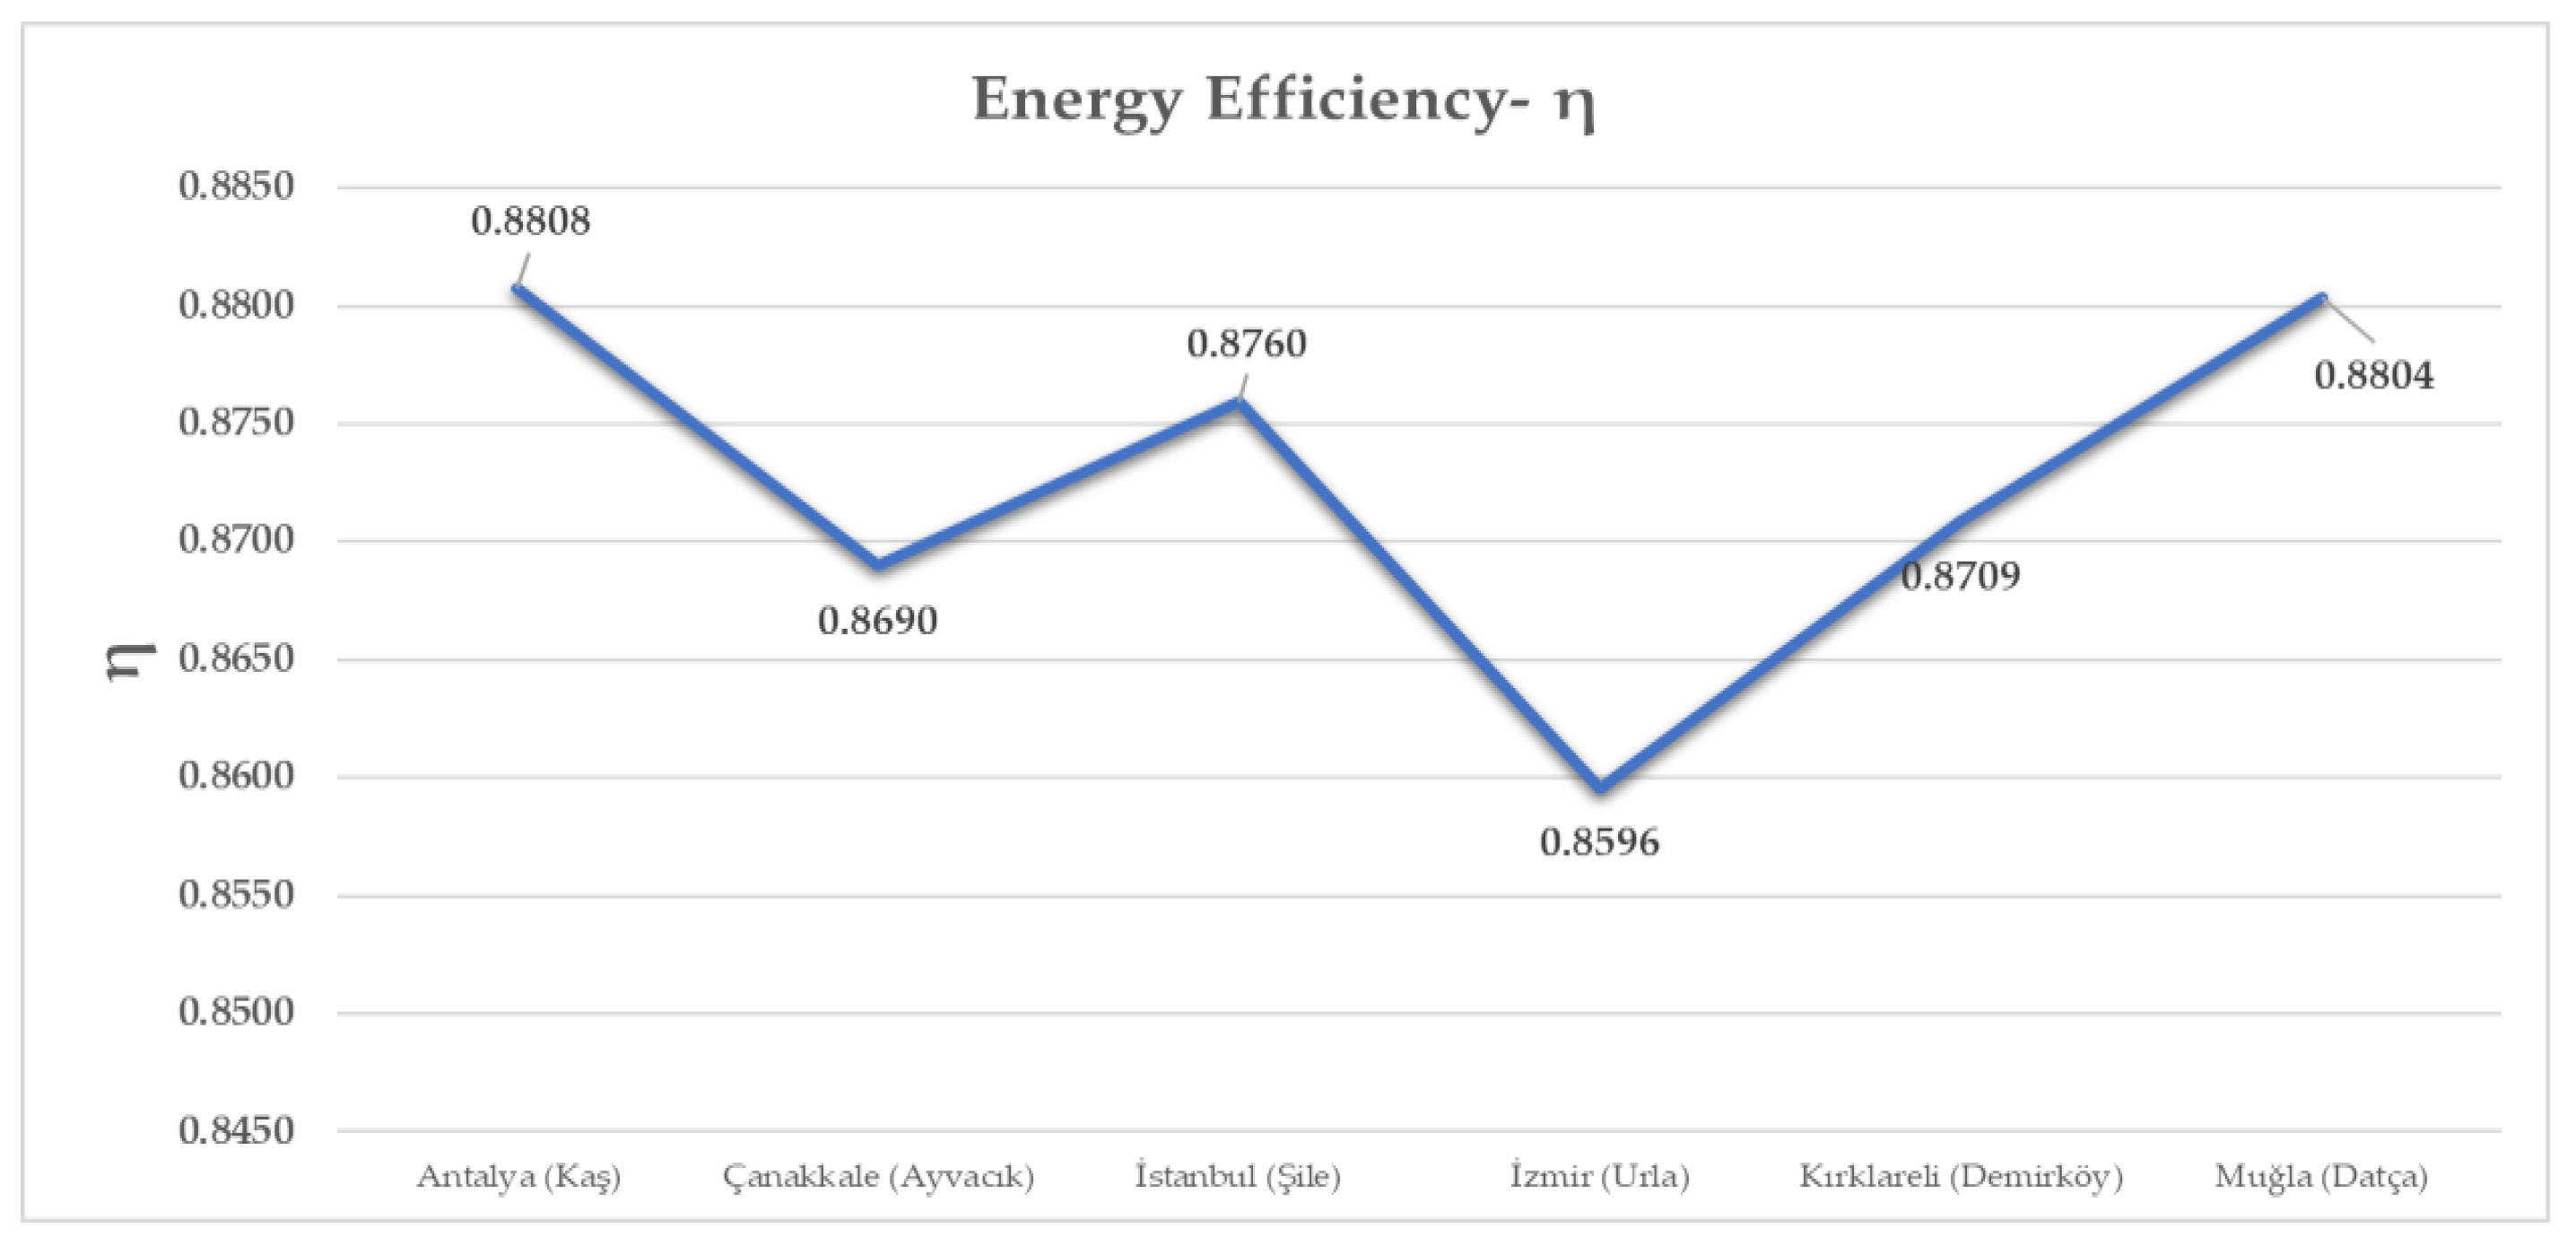
Figure 7 displays the wave power in kilowatts (kW) for the chosen locations. The power generated in the selected locations was mainly influenced by wave height, wave period, and wind speed. The calculations were performed by taking these parameters into account. The graphical representation of the energy efficiency results is shown in
Figure 8. The efficiency was primarily influenced by the wavelength and wave height. Therefore, the calculations were performed taking into account these parameters.
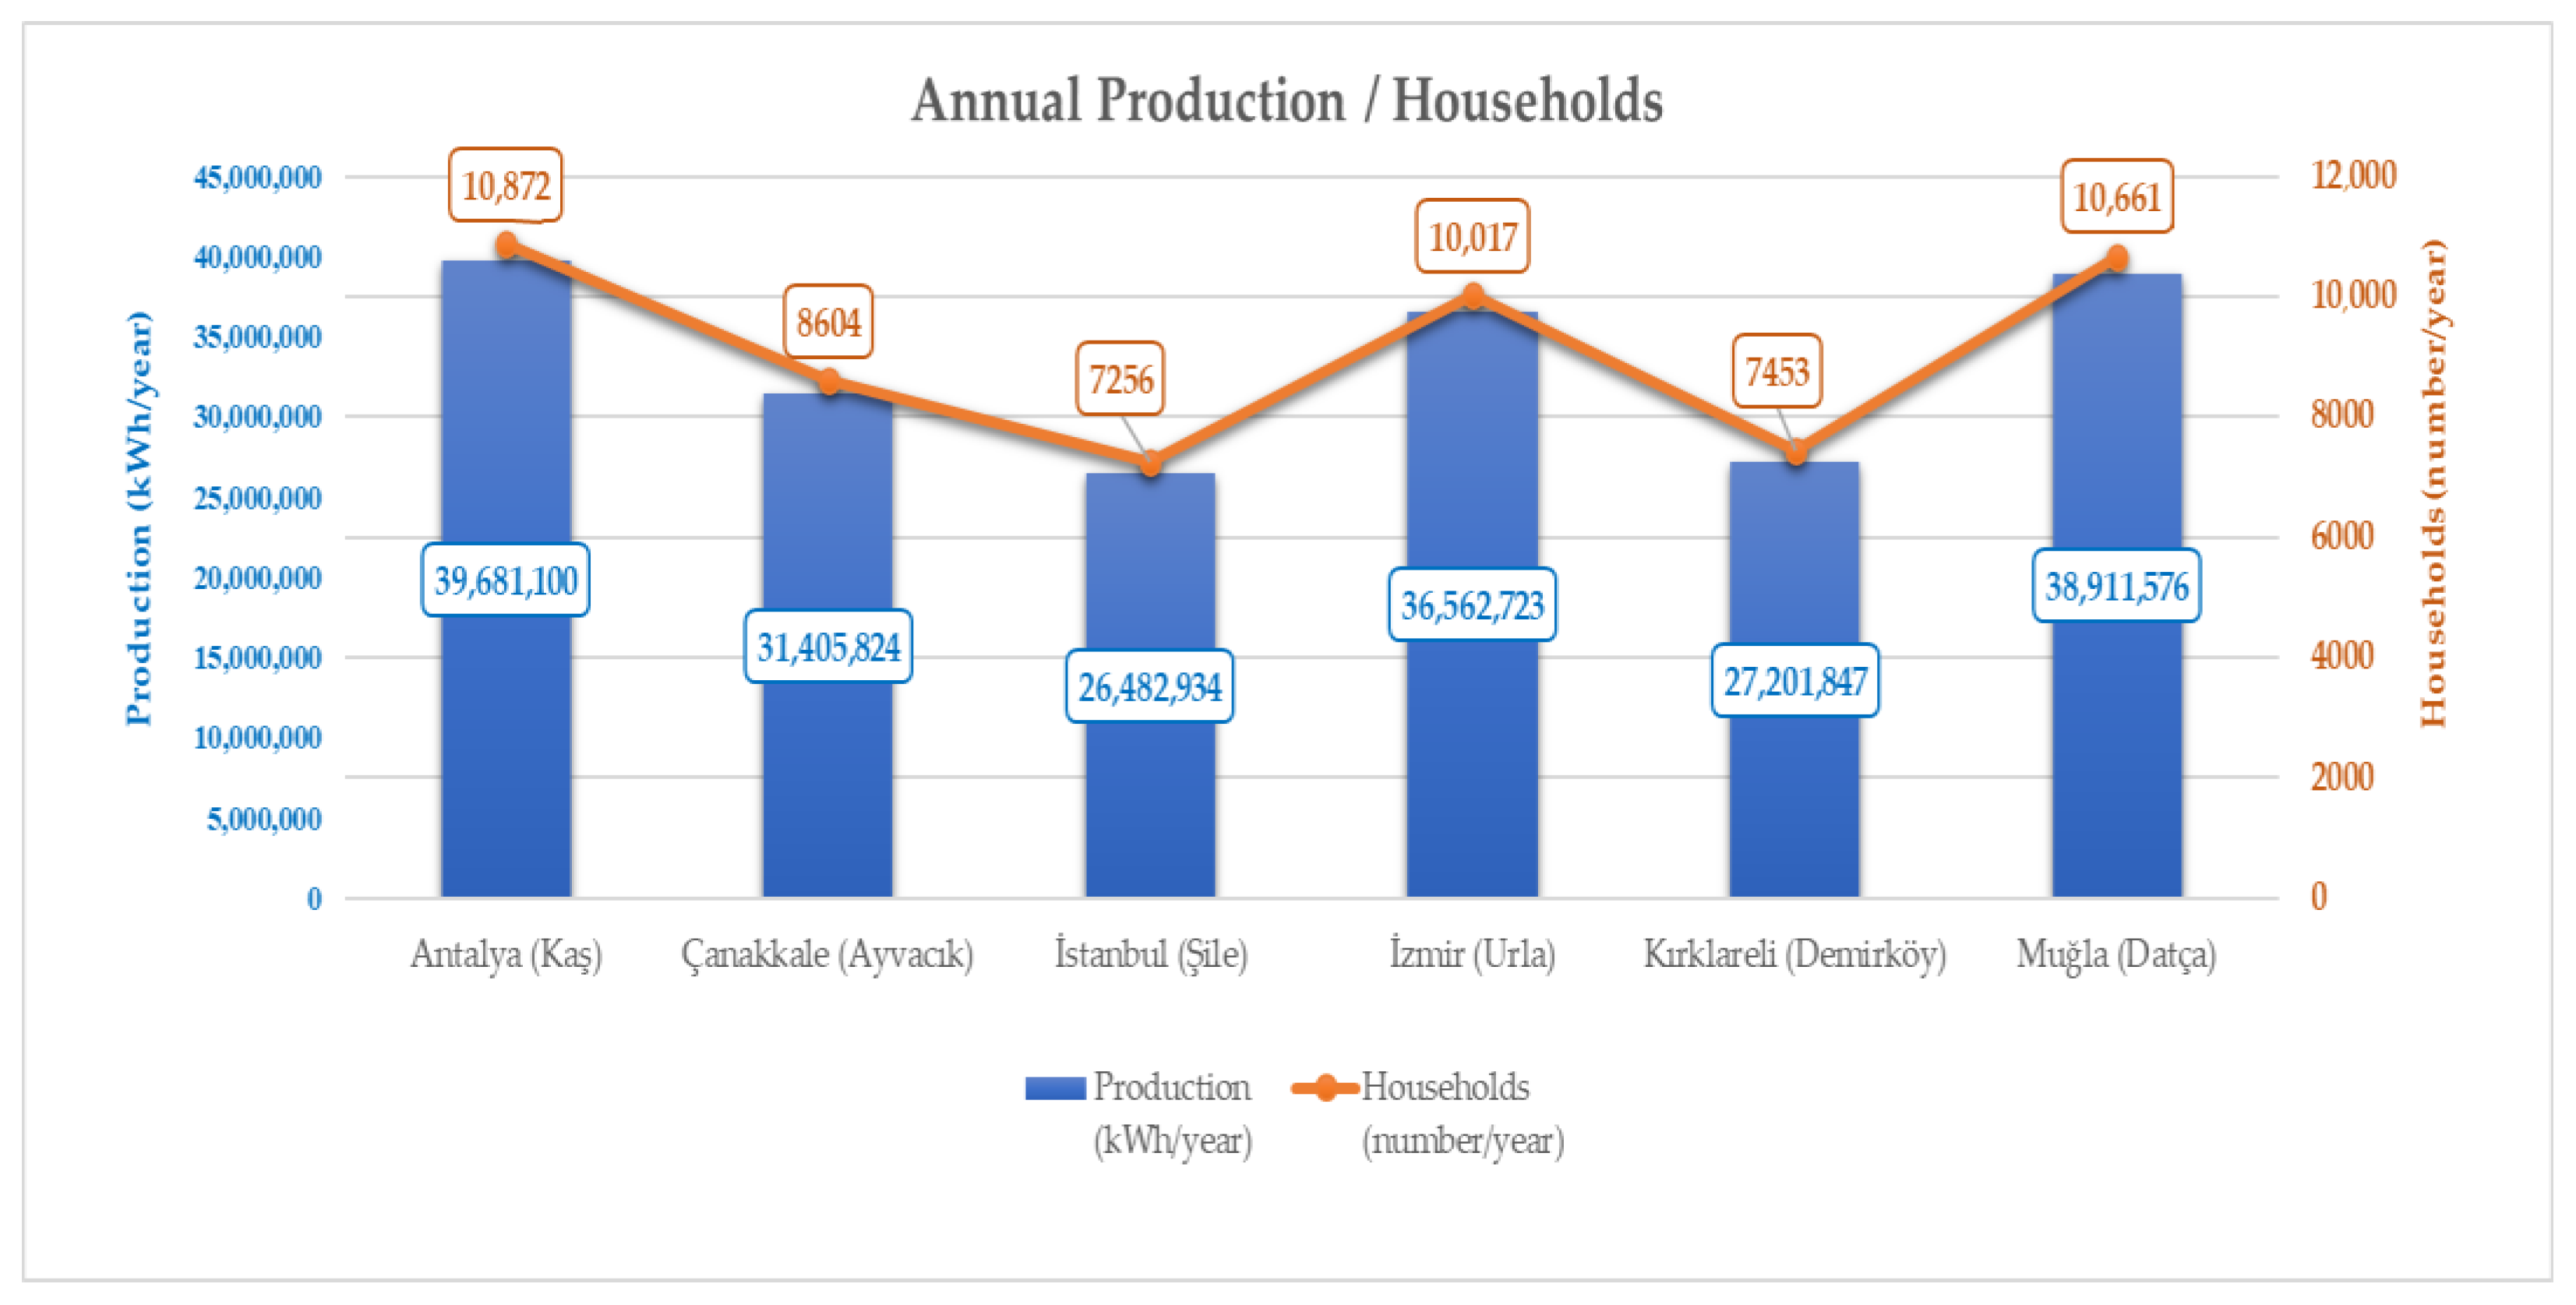
In
Figure 9, the annual production results and the number of houses according to the locations selected based on the model are shown graphically.
The above table and graphic results were obtained when the calculations were performed for the selected locations. The main findings of this study are as follows:
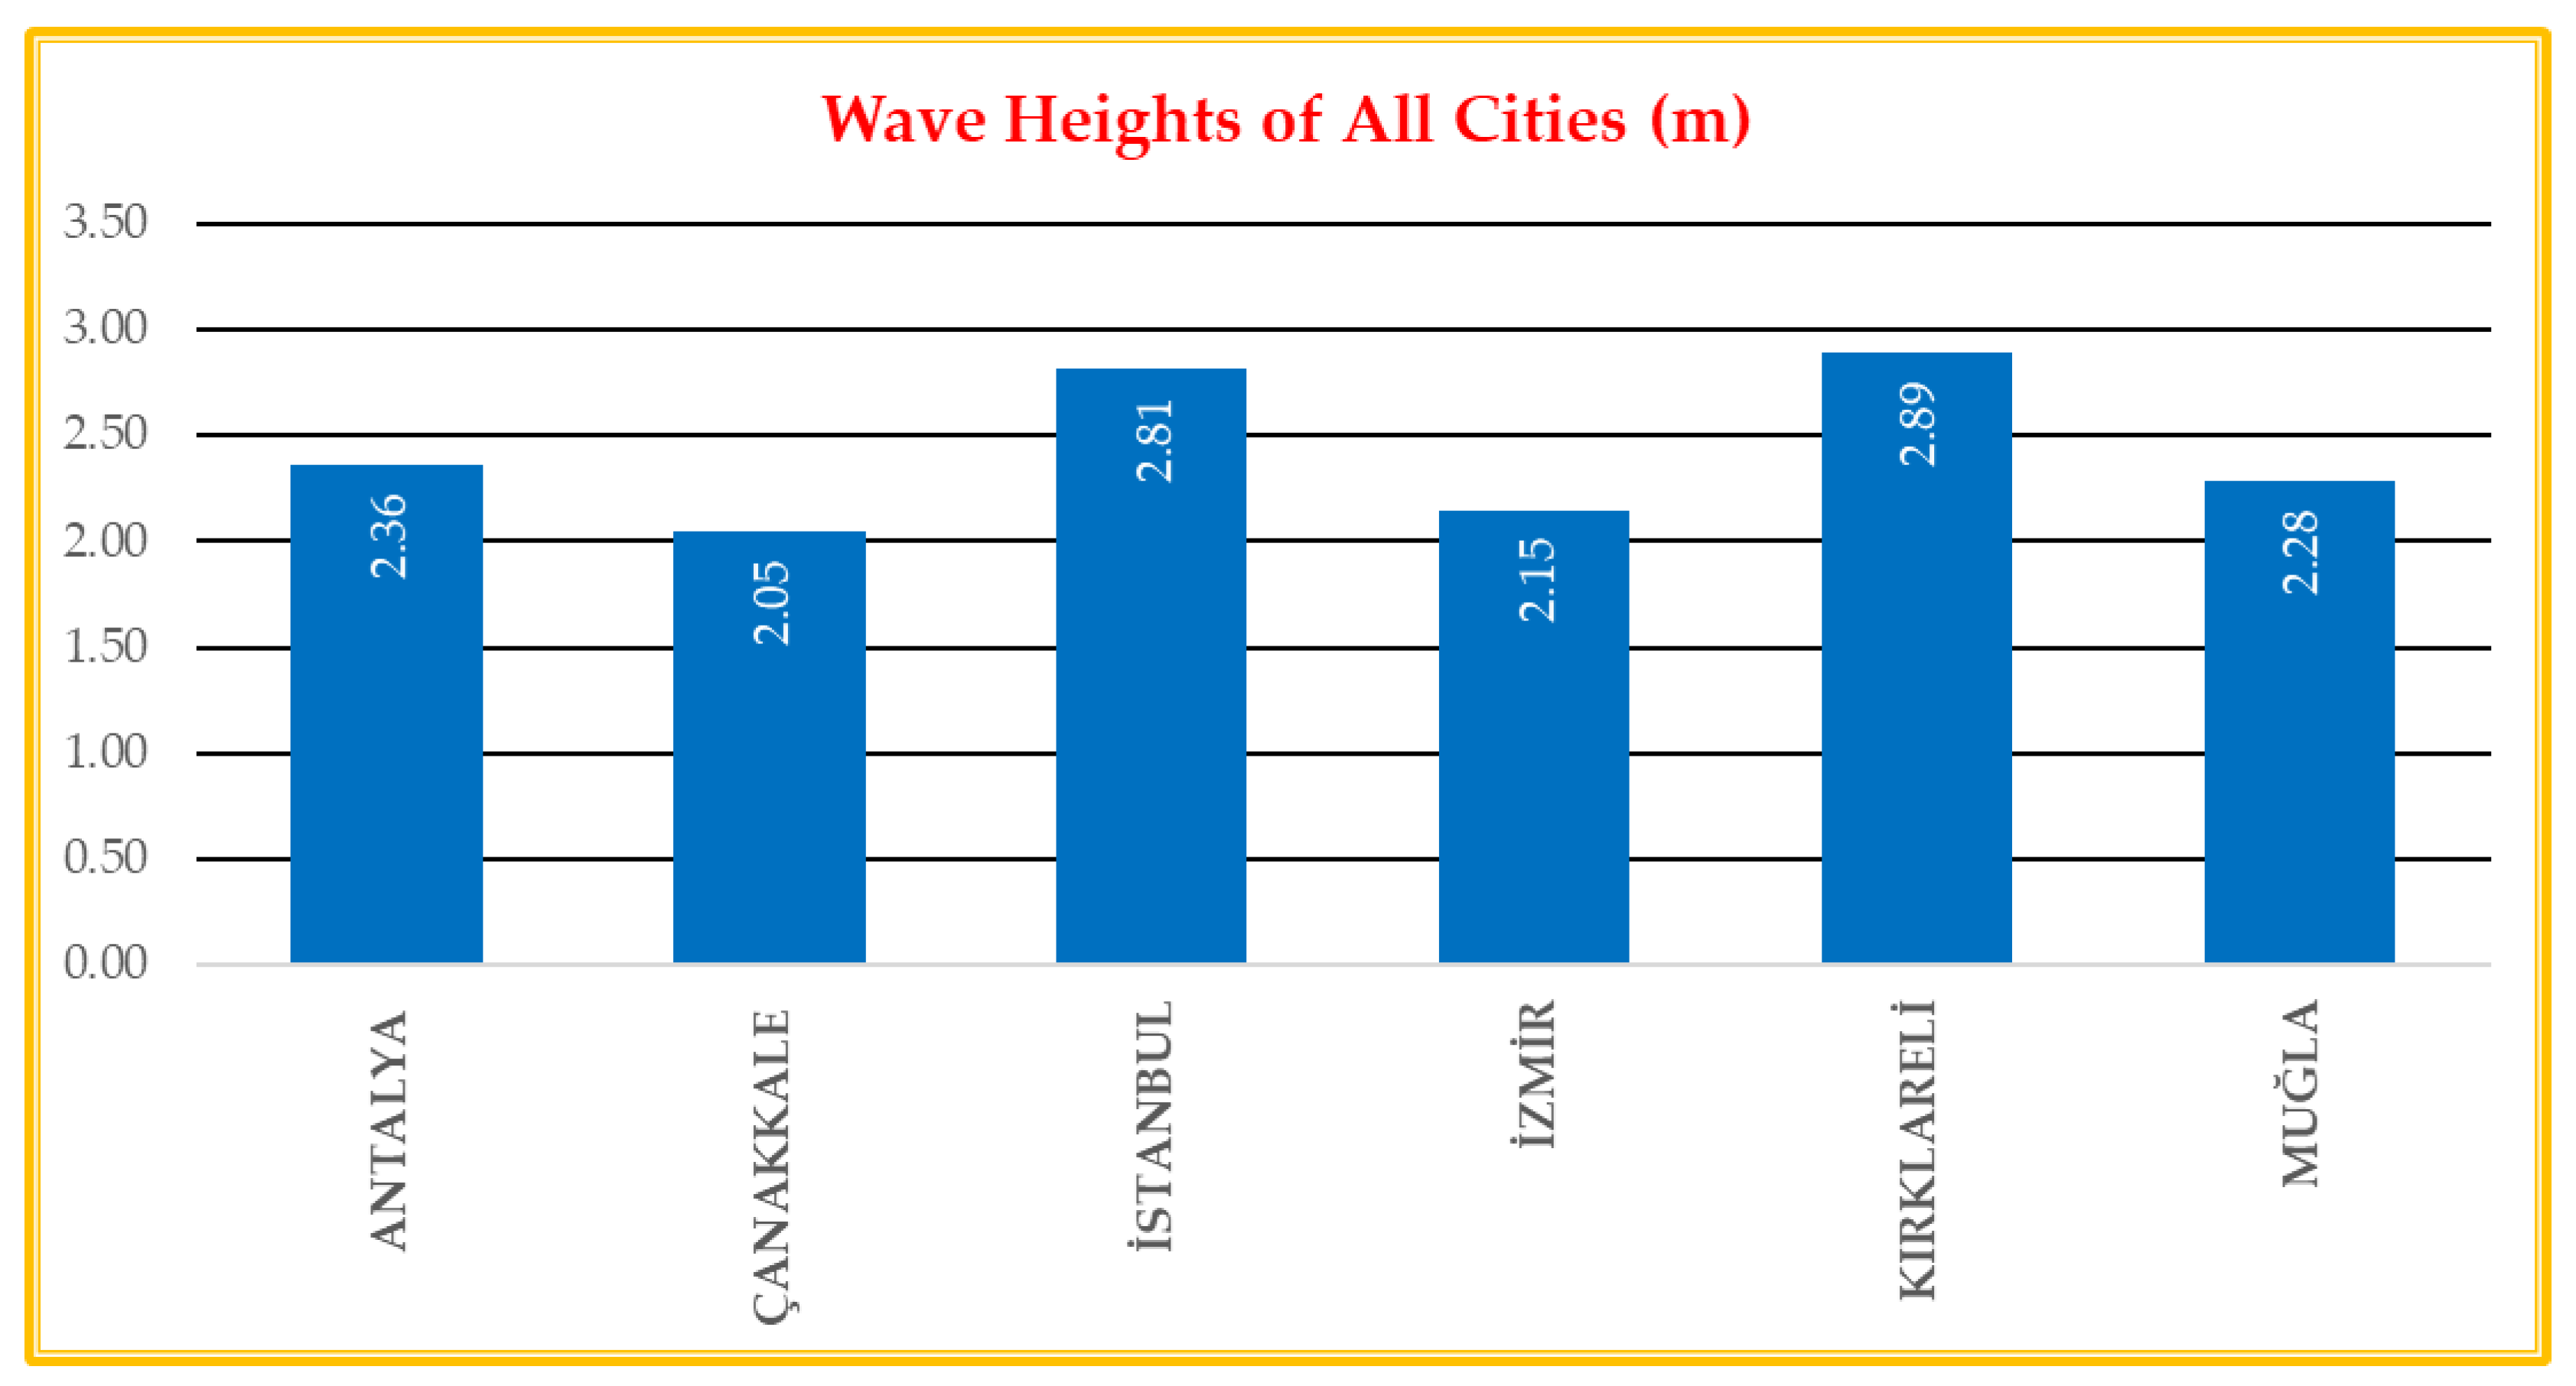
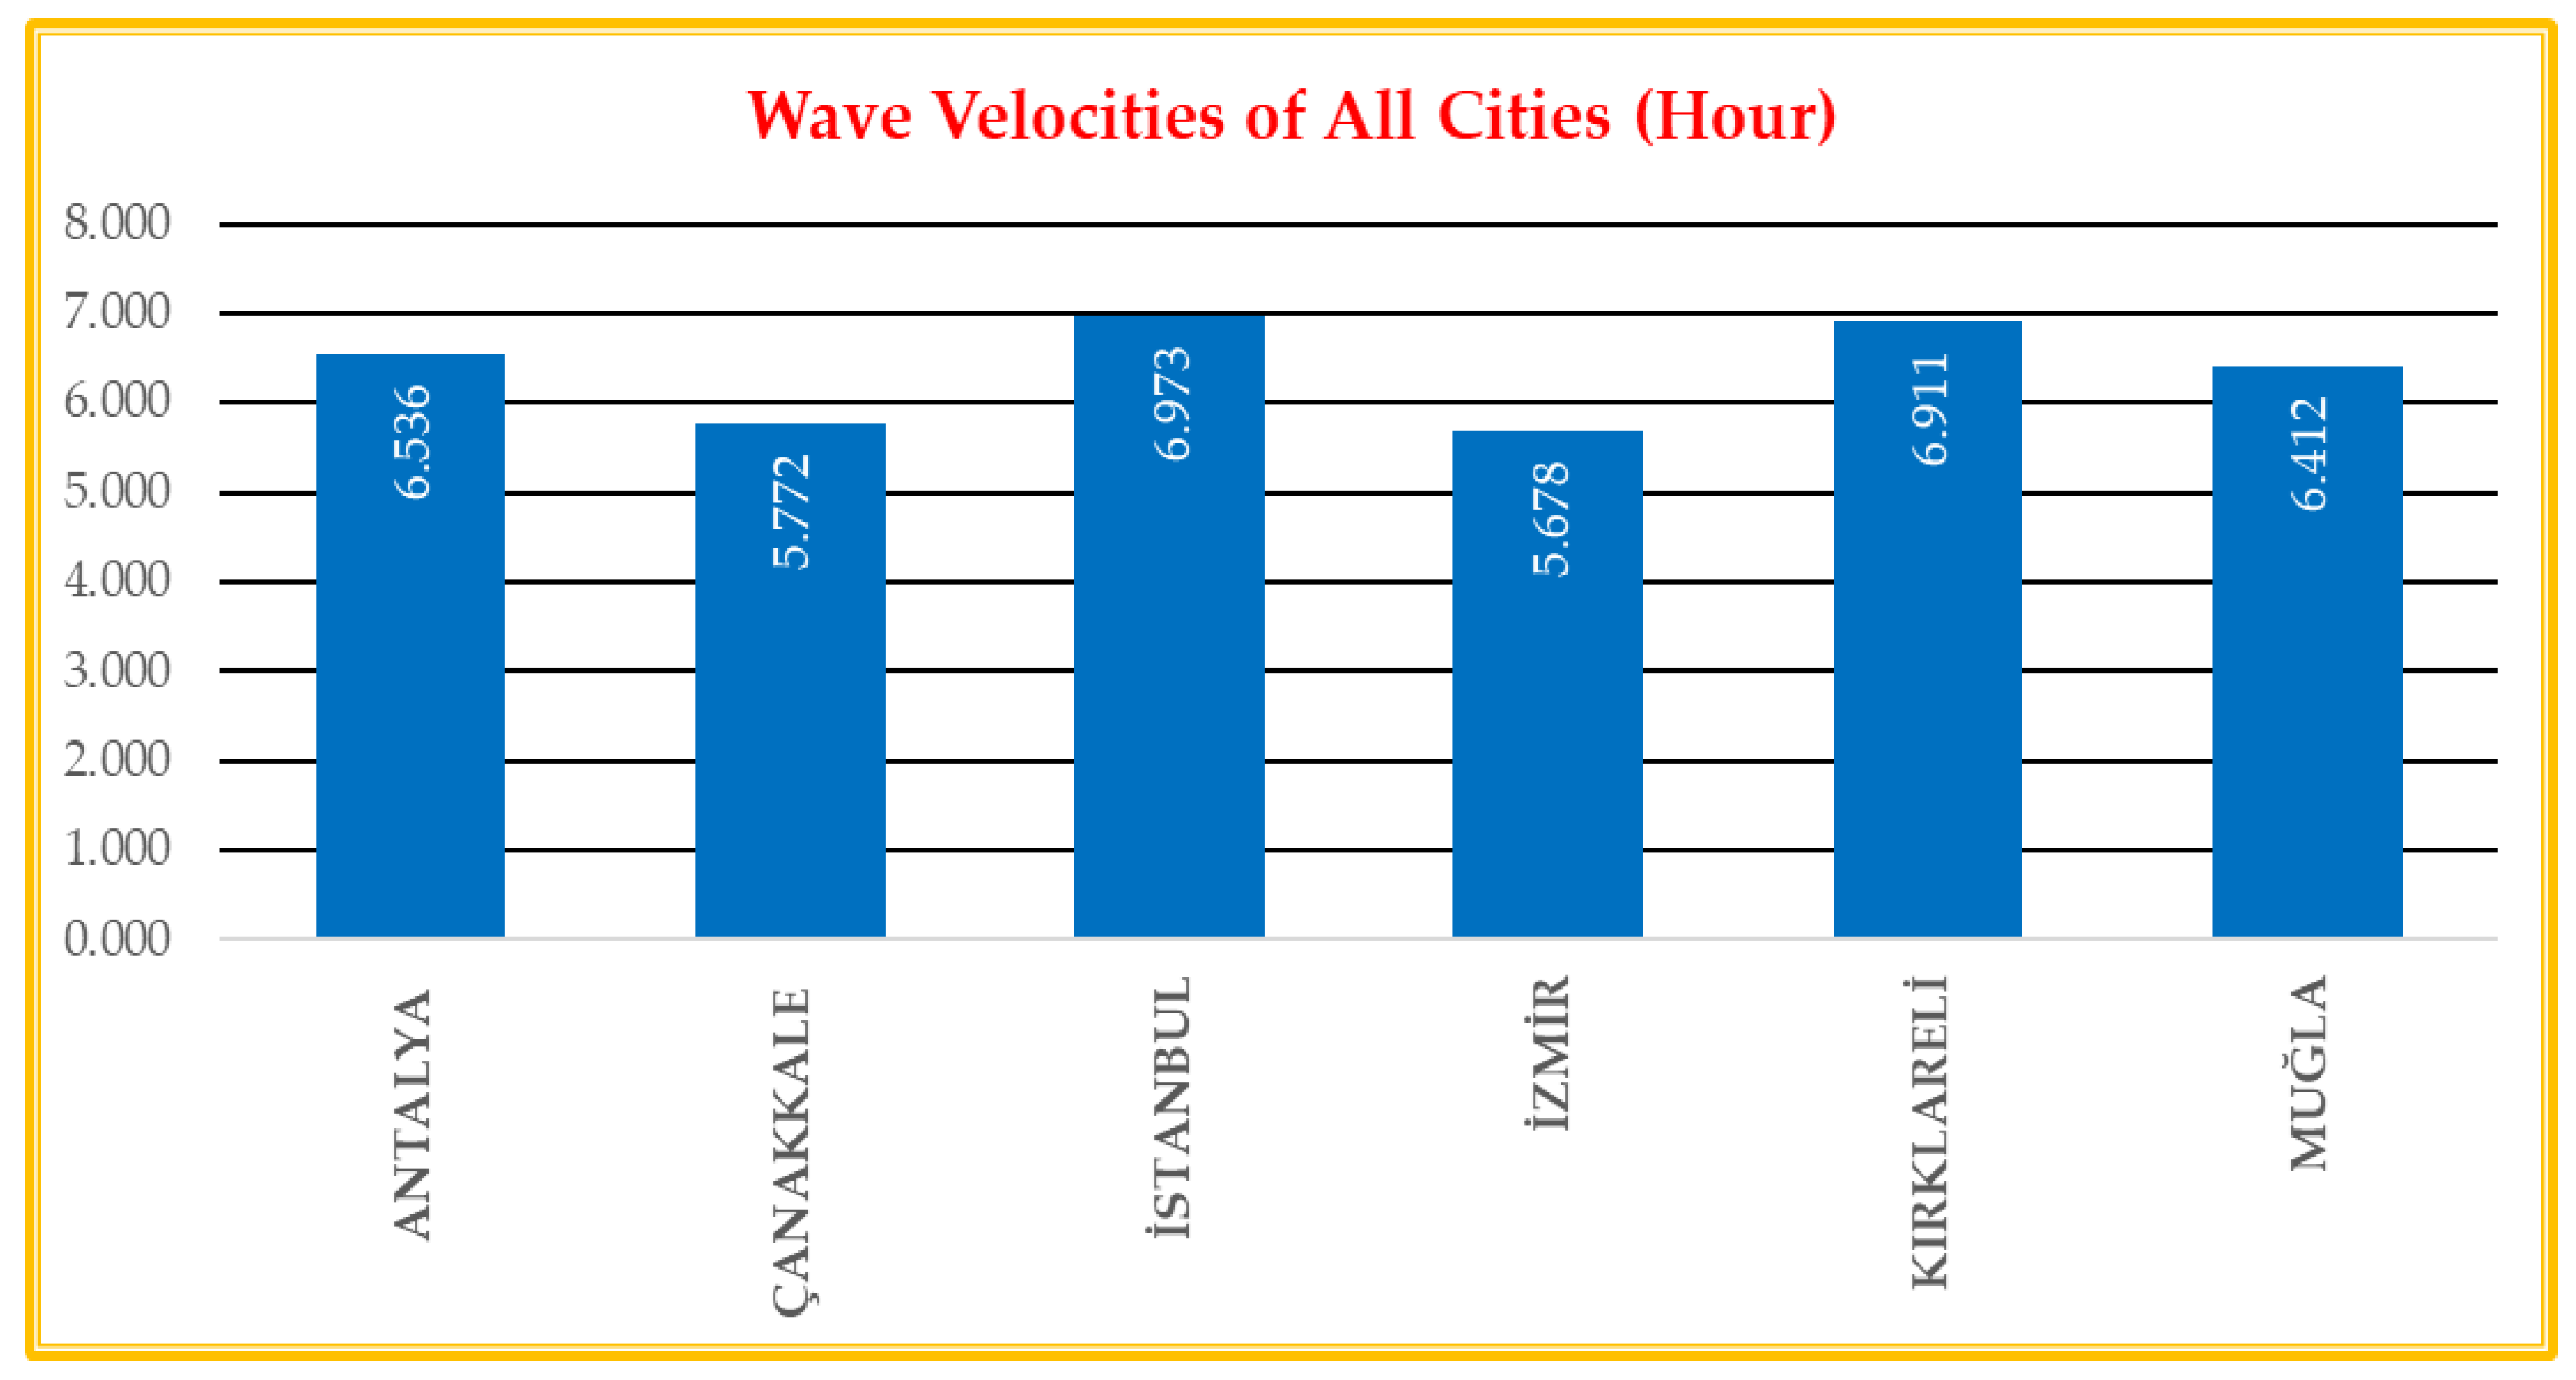
According to the model, the power obtained from the wave energy system (TAPCHAN) was at the highest level in the Kırklareli/Demirköy province compared to the other locations. Kırklareli was followed by İstanbul, Antalya, İzmir, Muğla, and Çanakkale. When the wave height, wave period, and wave speeds of all selected locations, as presented in
Figure A2 and
Figure A3, were considered, this result was due to the highest values of Kırklareli/Demirköy.
It was determined that the highest consumption can be met in Kırklareli/Demirköy and the lowest in Çanakkale/Ayvacık in terms of the number of houses’ electricity consumption according to the calculated power.
The efficiency of the wave energy system (TAPCHAN) was estimated as the highest in the Antalya/Kaş region and the lowest in the İzmir/Urla region.
3.3. Thermodynamic Results of the Photovoltaic System (PV)
We utilized the EES engineering software to conduct a parametric analysis of the integrated PV system. The power generation from the design and simulation was determined using the PV*SOL program. In all selected cities, CWT 455 (455 Wp) was chosen as the PV model with a panel area of 135,000 m
2. Considering this, the calculated number of panels and installed power were found to be 49,769 and 22,644.9 kWp, respectively [
47,
56,
65]. As shown in
Table 5, based on the model, separate calculations were made for the selected locations, and the annual total electrical power and the number of houses whose electricity needs can be met were calculated.
The calculation of the annual production and the number of houses according to the locations selected based on the model is shown graphically in
Figure 10.
The above table and graphic results were obtained when the calculations were performed for the selected locations. The main findings of this study are as follows:
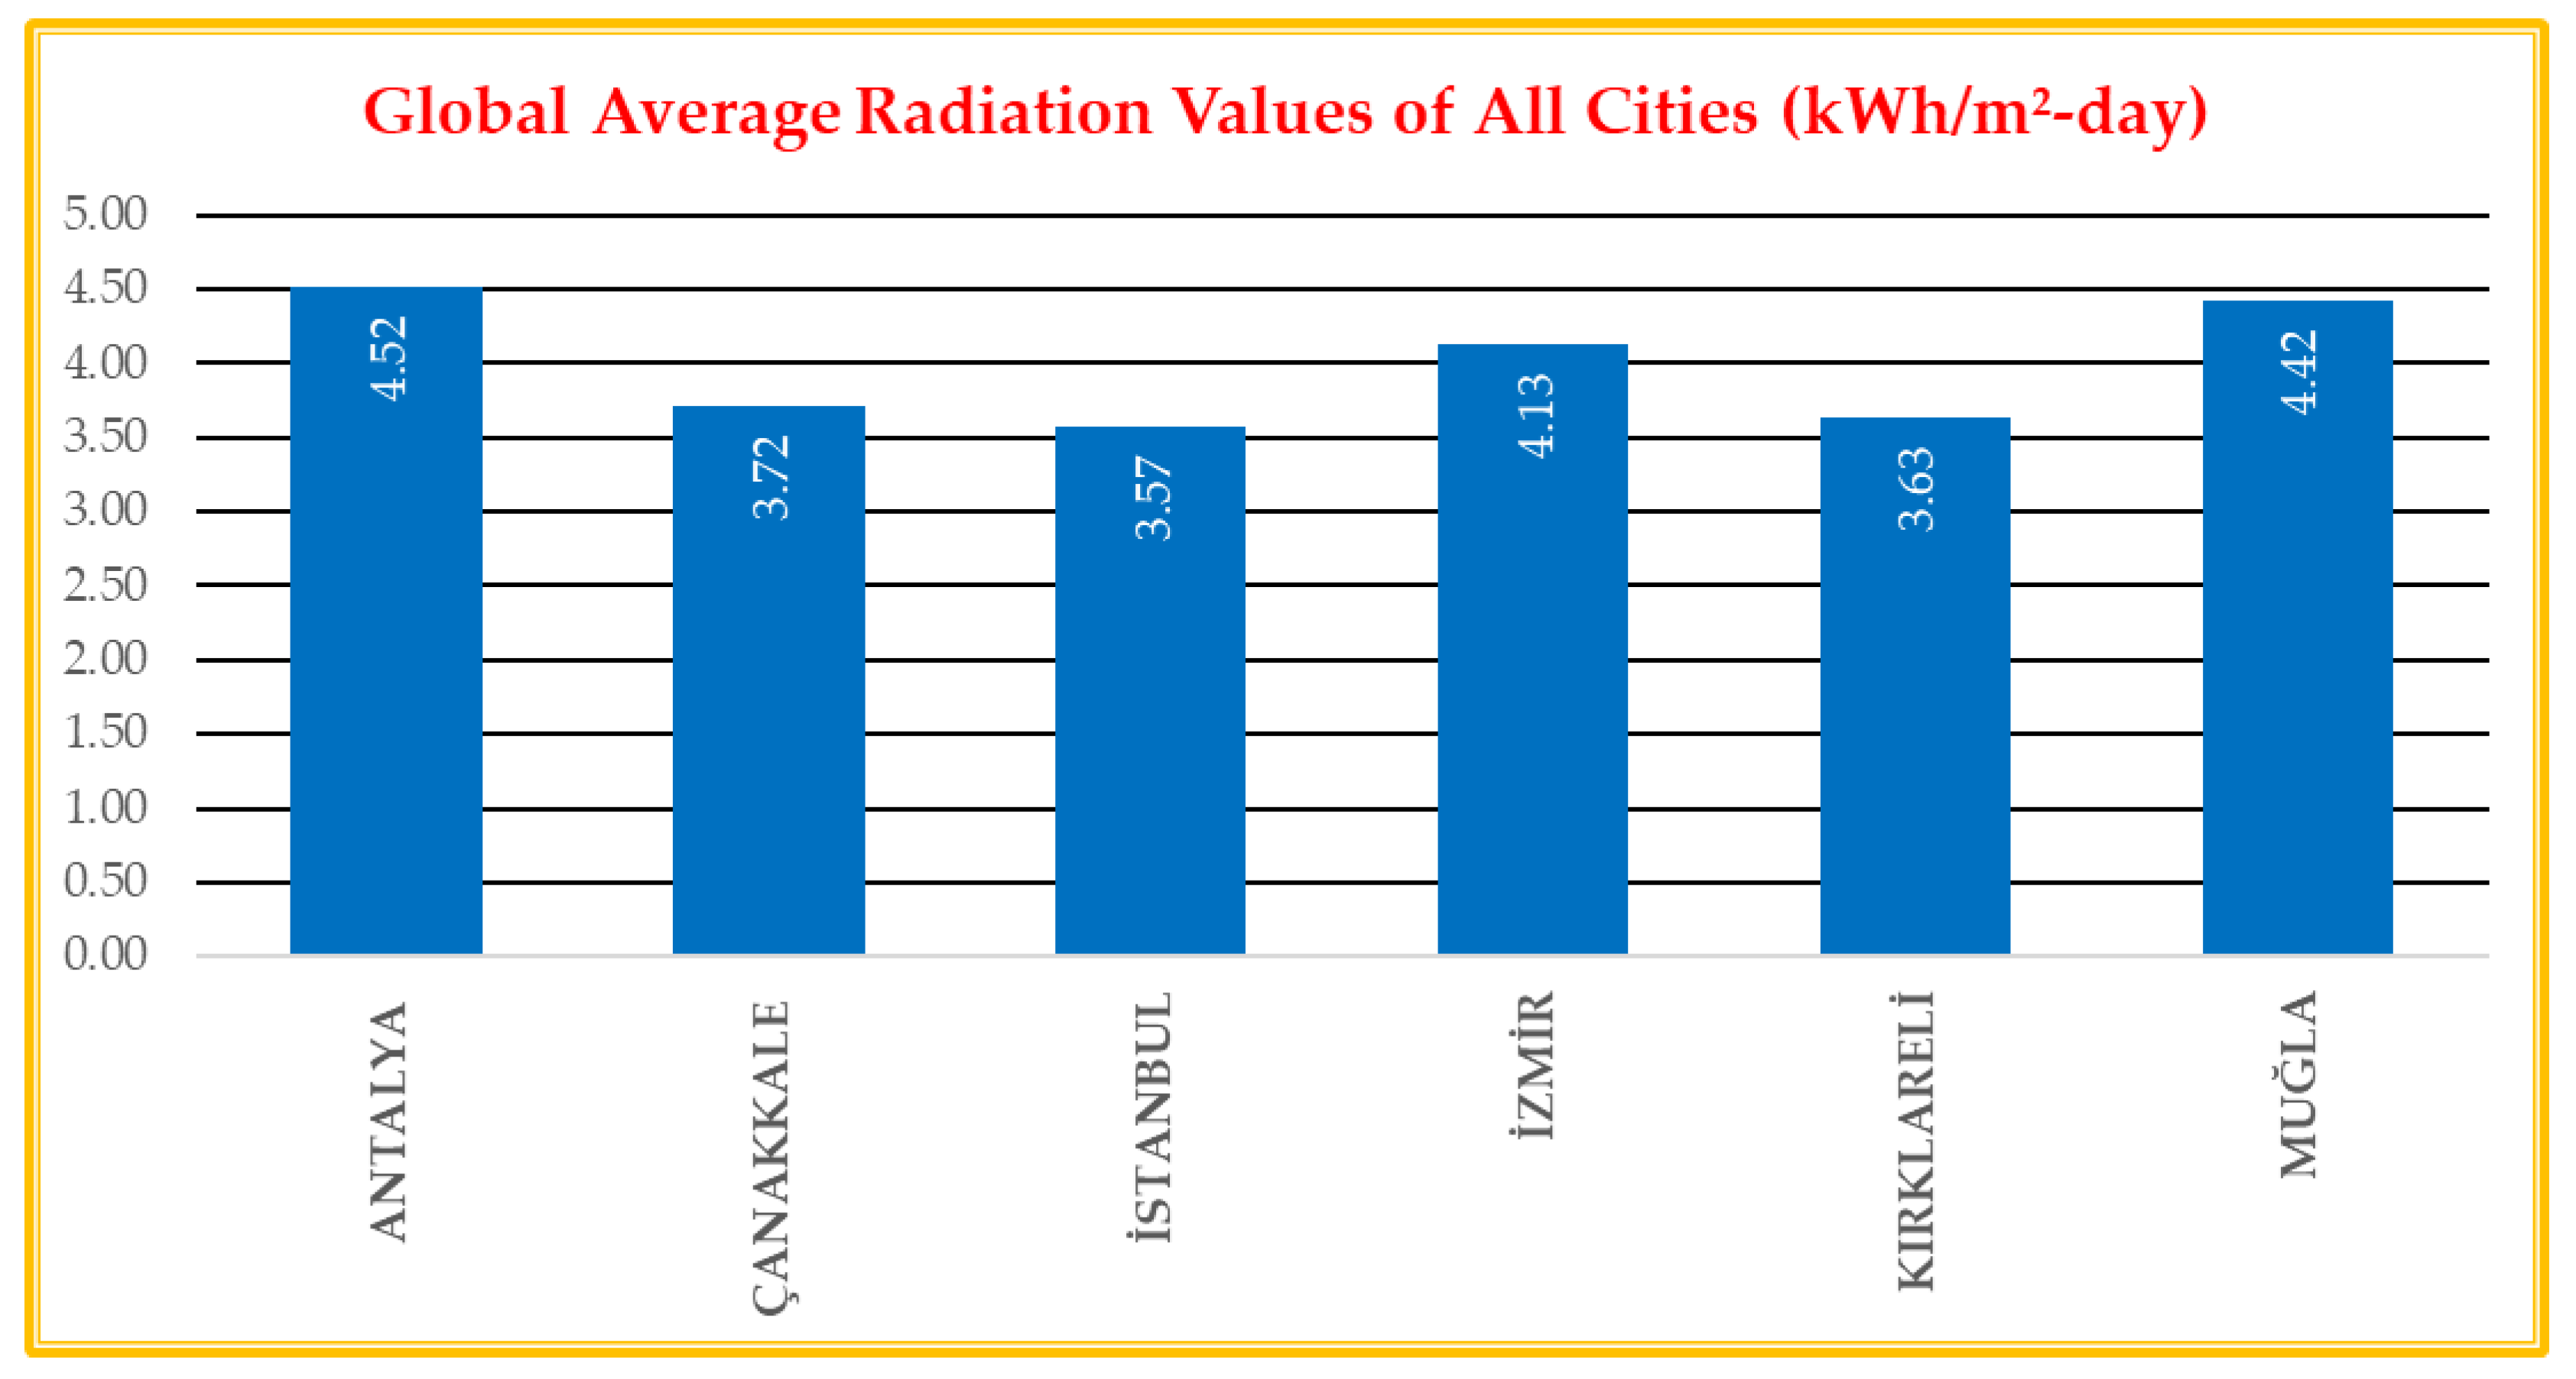
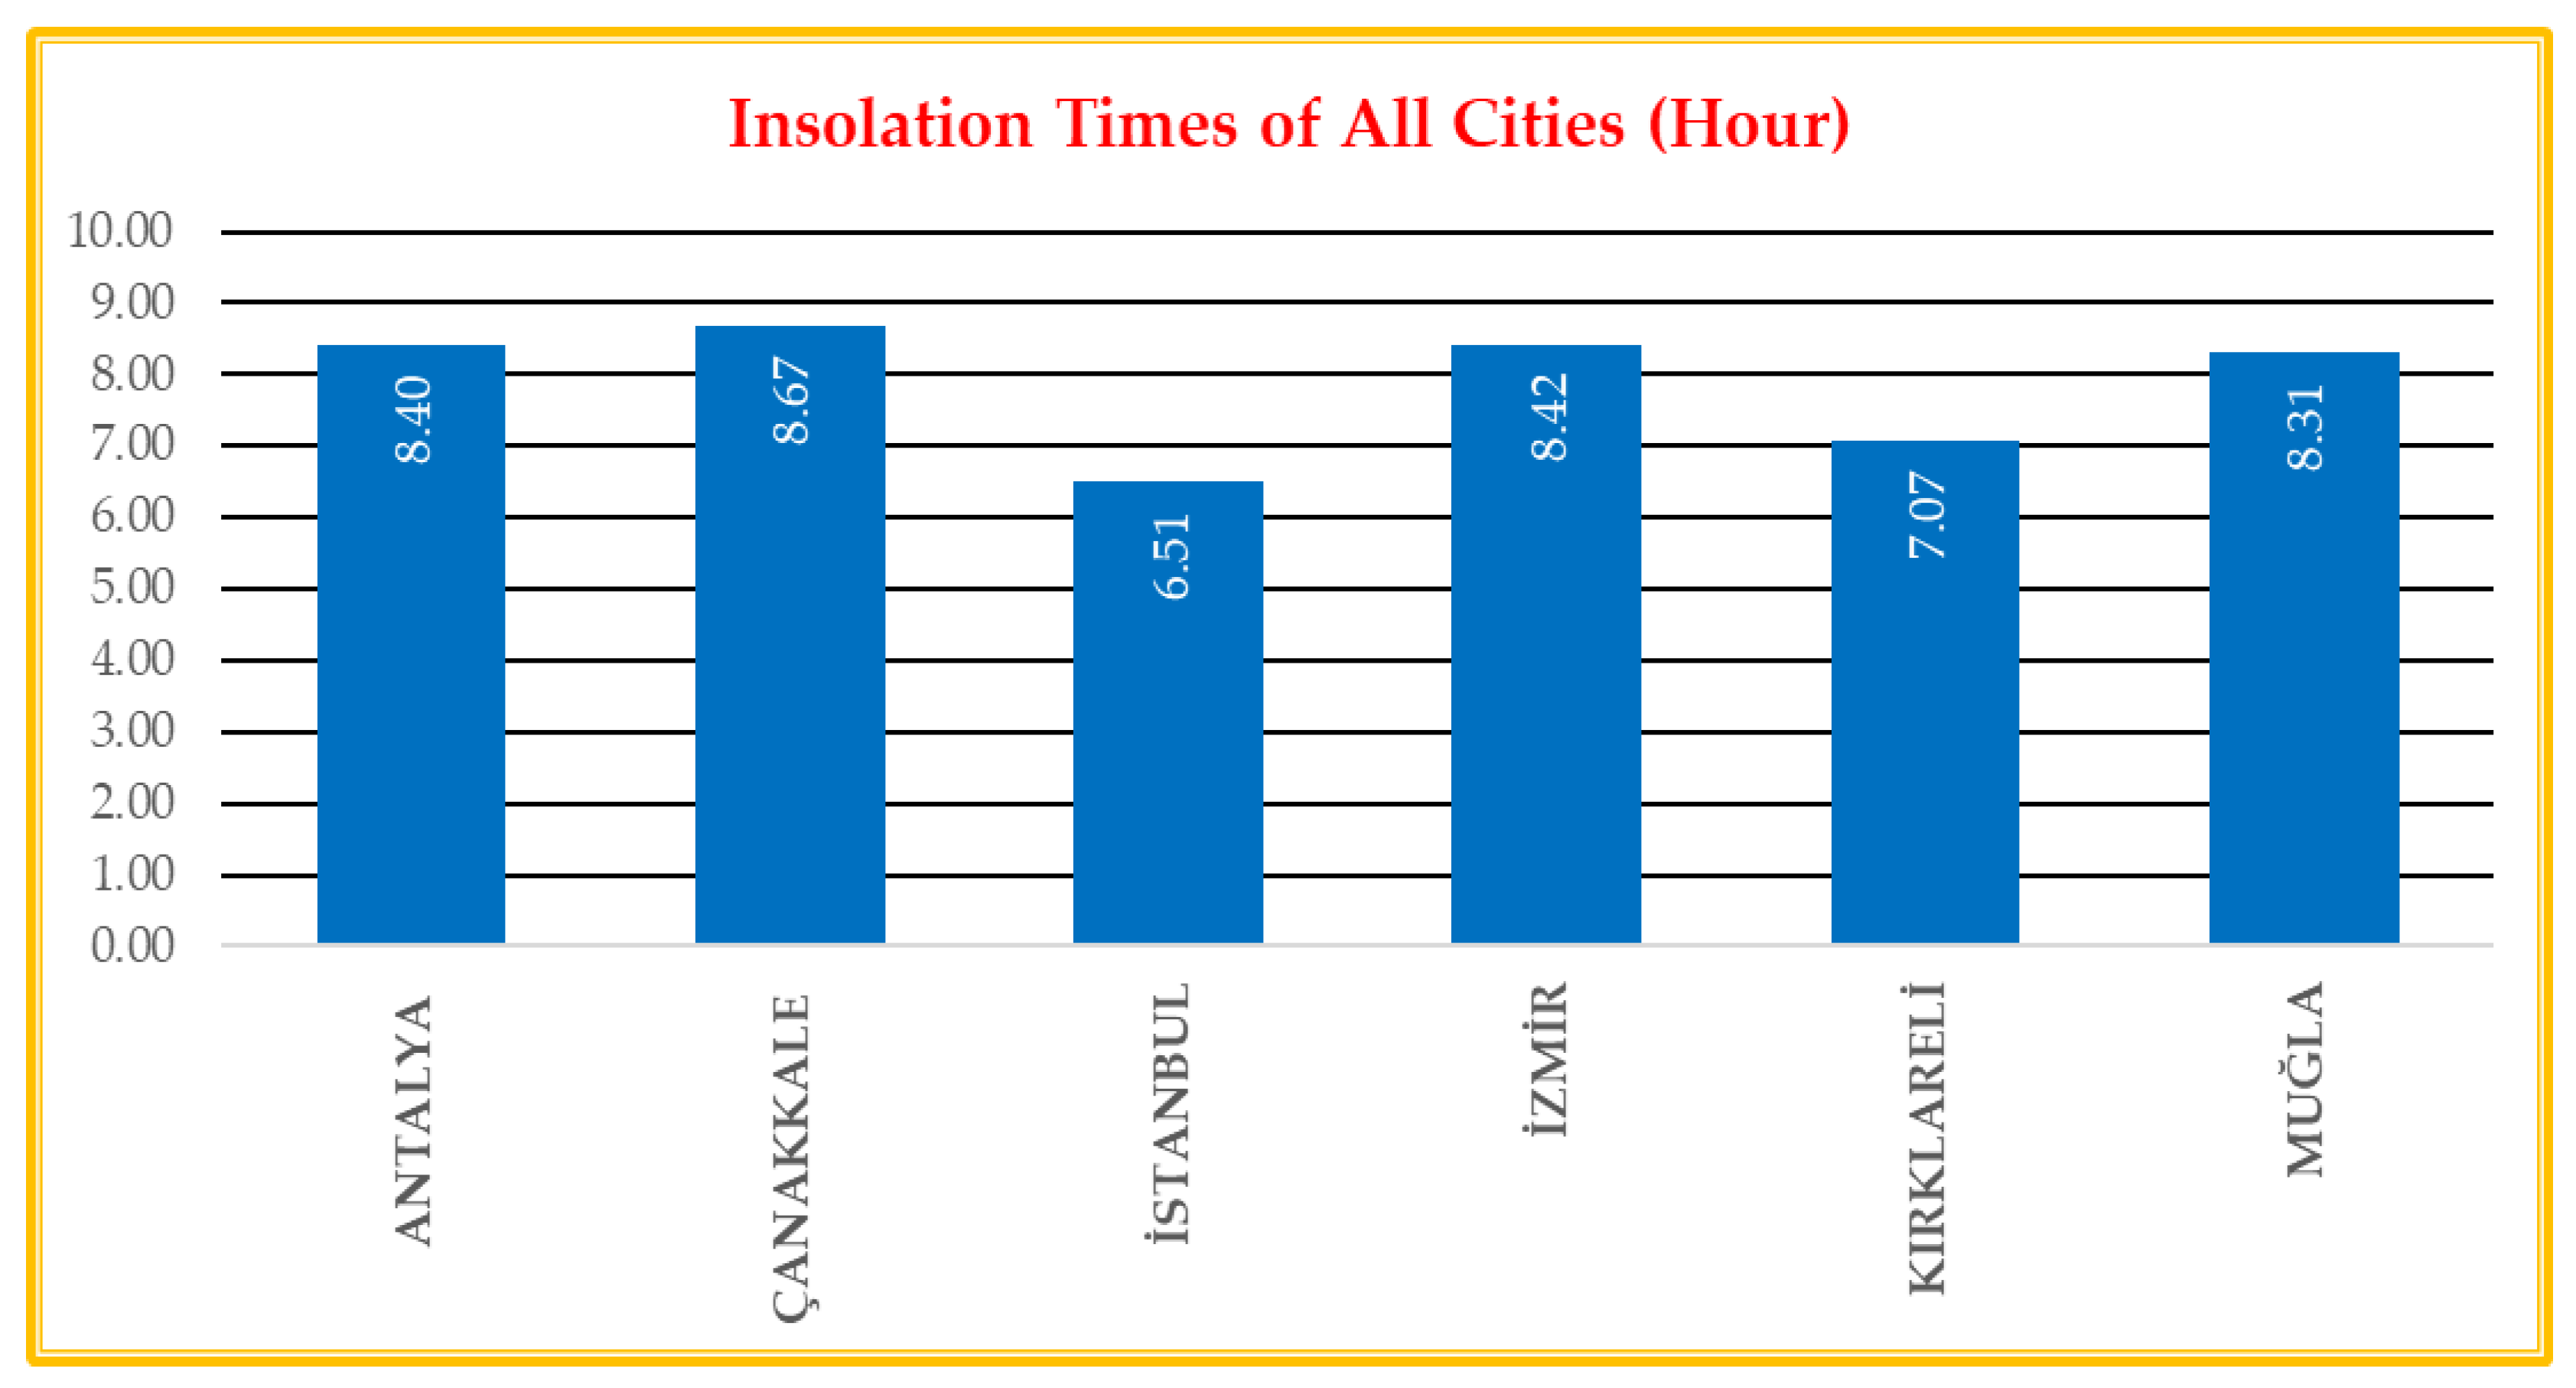
The power obtained from the photovoltaic energy system was at the highest level in Antalya/Kaş compared to the other locations. Antalya was followed by Muğla, İzmir, Çanakkale, Kırklareli, and İstanbul. When the global radiation values and sunshine hours of all selected locations, as presented in
Figure A4 and
Figure A5, were considered, this result was expected due to the highest values of Antalya/Kaş.
Household calculations were made according to the calculated power, and in terms of electricity consumption, the highest consumption can be met in the Antalya/Kaş region and the lowest in the İstanbul/Şile region.
The system’s energy and exergy efficiencies were calculated as 26.48% and 22.01%, respectively.
3.4. Thermodynamic Results of the Parabolic Solar Collector System
We performed a parametric analysis of the integrated system for the parabolic solar collector and power generation using the SAM program. The Therminol VP1 fluid was selected for the system [
49]. The solar data of the selected cities were taken and processed using the Photovoltaic Geographical Information System (PVGIS) [
50]. PVGIS was used to compute the solar irradiation and energy output of a photovoltaic (PV) system. Most of the solar radiation data in PVGIS were calculated from satellite images, and there are several methods to perform this, depending on the satellites used. PVGIS-SARAH2 was selected for this analysis. PVGIS offers users the option to download a dataset containing Typical Meteorological Year (TMY) data. This dataset includes hourly data for parameters such as date and time, global horizontal irradiation, direct normal irradiation, diffuse horizontal irradiation, air pressure, dry bulb temperature (2 m temperature), wind speed, wind direction, relative humidity, and long-wave downwelling infrared radiation. The dataset was created by selecting the most representative month for each month of the year from a 16-year full-time period, specifically between 2005 and 2020, for PVGIS-SARAH2. On the basis of the model in
Table 6, separate calculations were made for the selected locations, and the annual total electrical power and the number of houses whose electricity needs can be met were calculated.
The calculation of annual production and the number of houses according to the locations selected based on the model is shown graphically in
Figure 11.
The above table and graphic results were obtained when the calculations were performed for the selected locations. The main findings of this study are as follows:
The power obtained from the parabolic solar collector in the Antalya/Kaş location was the highest compared to the other locations. Antalya was followed by İzmir, Muğla, Çanakkale, İstanbul, and Kırklareli. When the global radiation values and sunshine hours of all selected locations, as presented in
Figure A4 and
Figure A5, were considered, this result was expected due to the highest values of Antalya/Kaş.
Household calculations were made according to the calculated power, and in terms of electricity consumption, the highest consumption can be met in the Antalya/Kaş region and the lowest in the Kırklareli/Demirköy region.
The capacity factor of the parabolic solar collector system was calculated as the highest in Antalya, with a capacity factor of 35.7%, and the lowest in Kırklareli, with a capacity factor of 16.8%.
3.5. Thermodynamic Results of Wave, Solar, and Wind Energies in Integrated Form
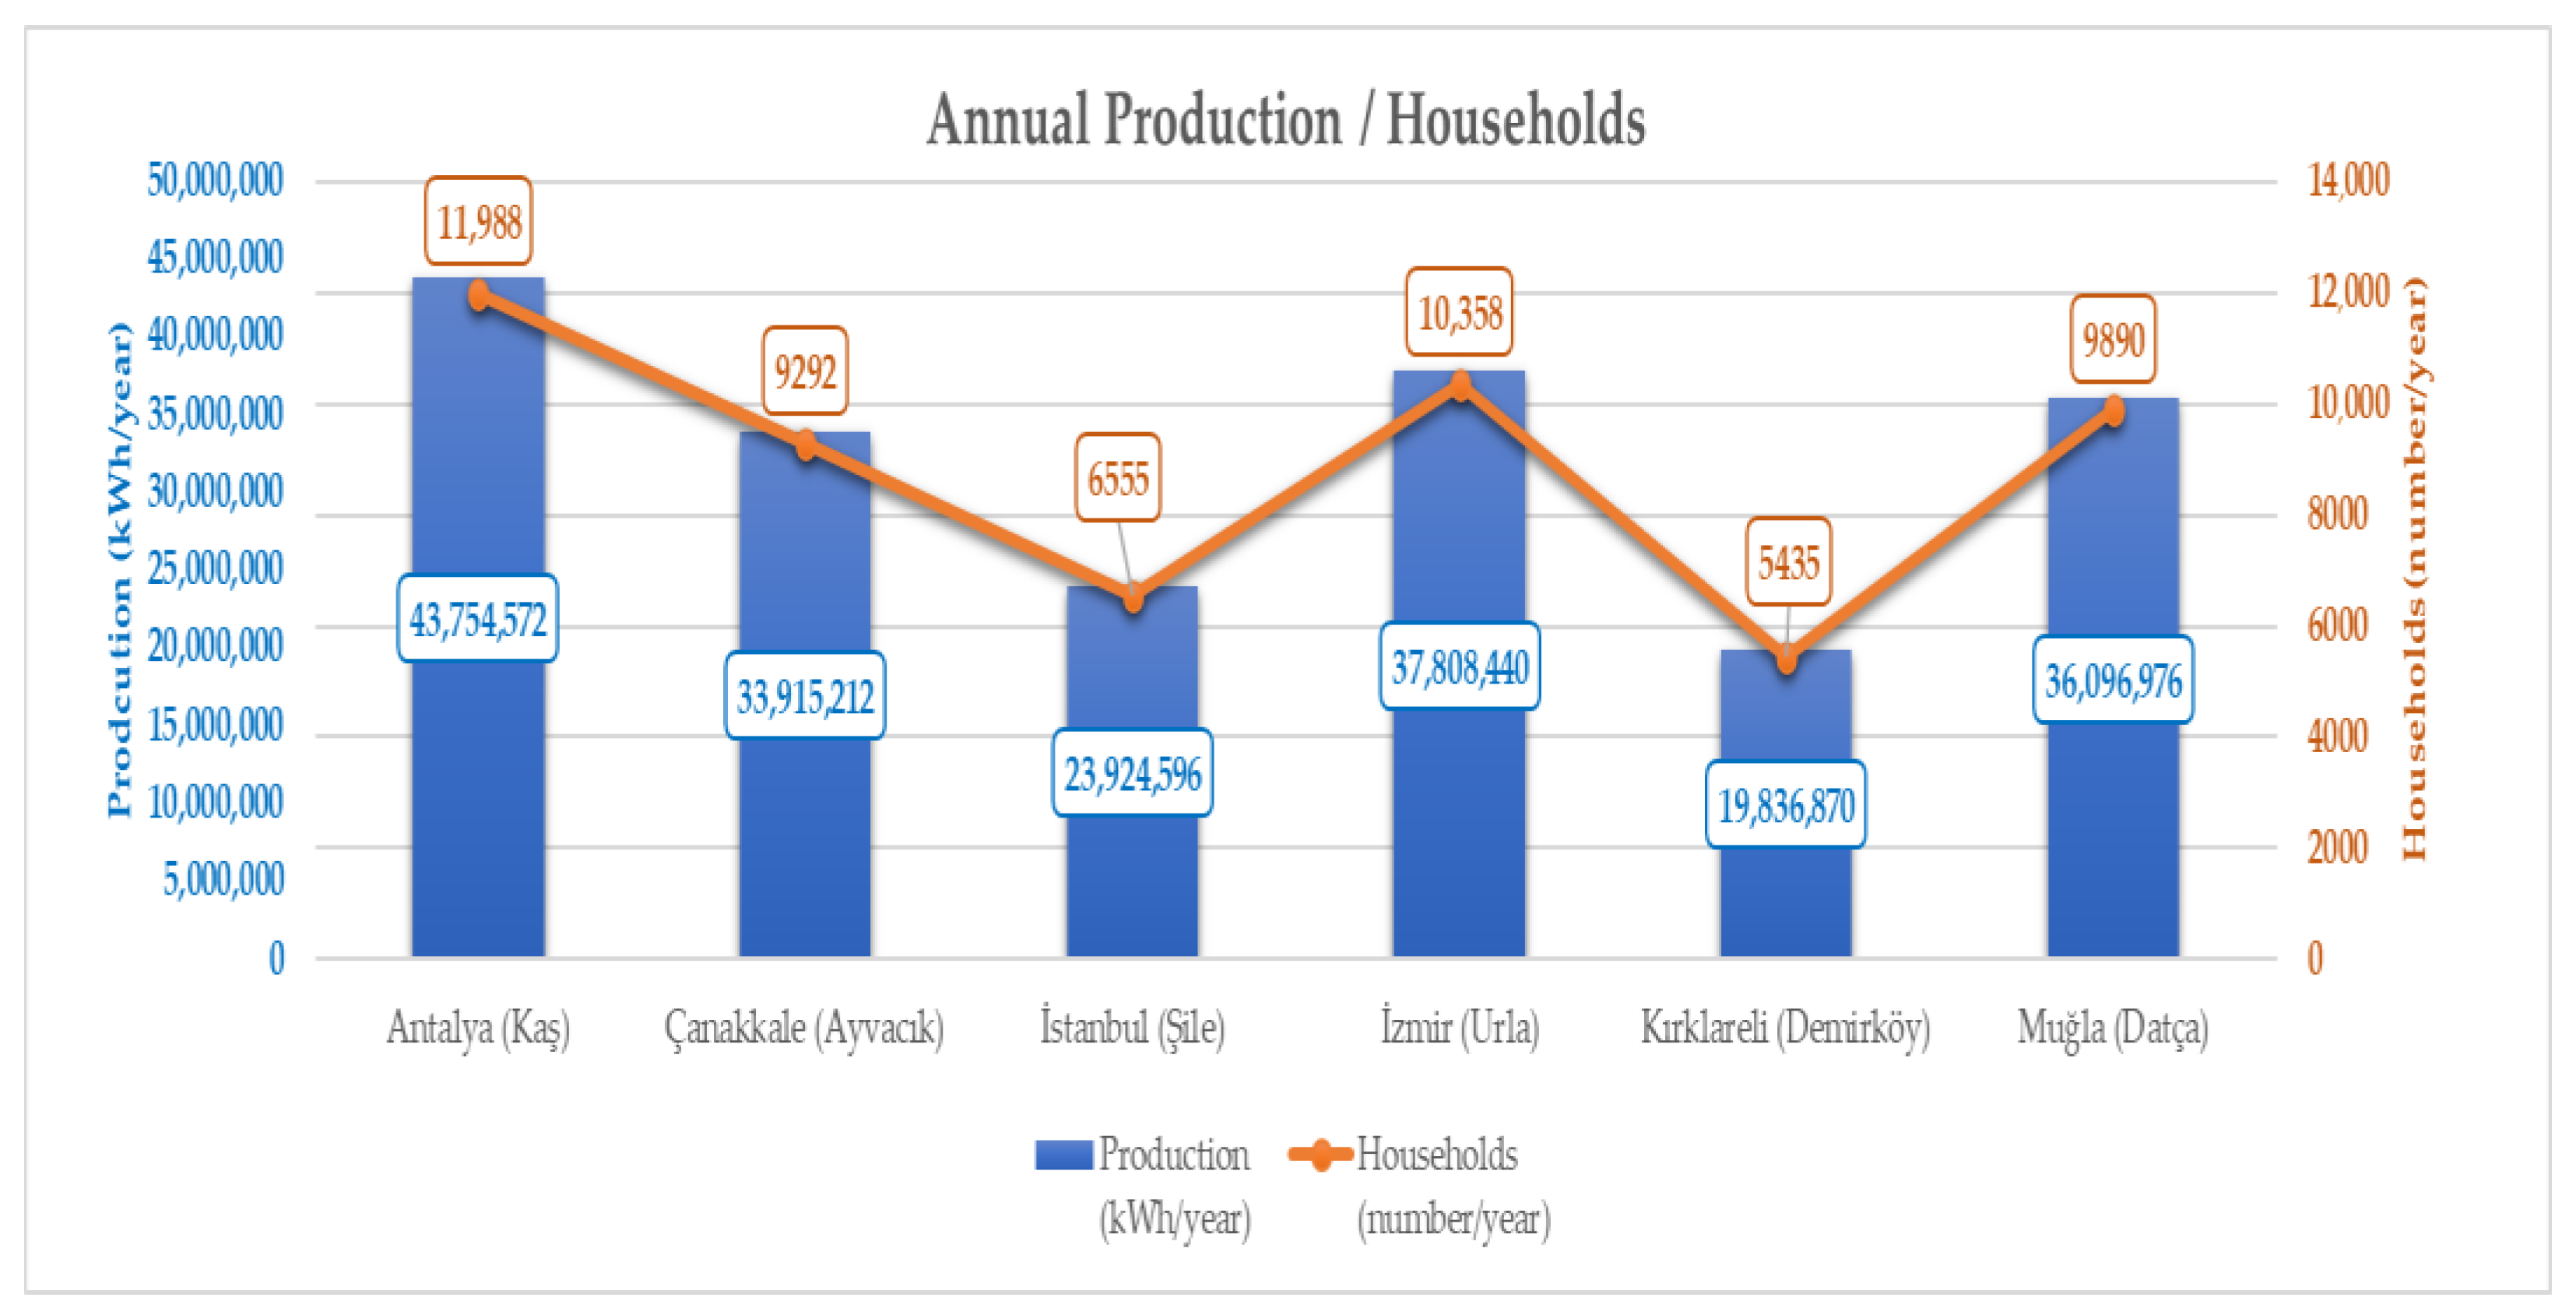
In this section, the annual total electrical energy potential that can be produced from an integrated system of wave, solar, and wind energies is analyzed. Considering all the results, individual calculations were performed for the selected locations to estimate the annual total electrical power and the number of houses that could meet their electricity needs, as presented in
Table 7. In all selected locations, the coastal lengths and areas were fixed as 5.4 km and 135,000 m
2, respectively. The distance from the shore to the land was accepted as 100 m. In this model, 25% wave energy, 25% wind, 25% PV, and 25% parabolic solar collectors were considered. Considering all the assumptions and the calculated data, Antalya was selected for solar energy, İzmir for wind energy, and Kırklareli for wave energy potential. In this regard, the most suitable city to be built in an integrated form in Türkiye appears to be Kırklareli, which has a high wave energy potential. If different assumptions are made, the selected provinces will also change as the power data obtained will differ.
In conclusion, to remove the energy bottleneck that Türkiye may face in the coming years in parallel with its limited energy resources, developing technology, and increasing population, domestic and renewable energy investments should be initiated immediately, and new production technologies, such as wind, solar, and especially wave energy, which will offer new energy resources, should be developed. This study calculated that a significant proportion of the electricity needs of the selected cities were met using renewable energy sources, producing electricity in an effective, efficient, cheap, environmentally friendly, and sustainable way. This important development will make serious contributions to Türkiye in terms of energy efficiency, energy economy, and the fight against climate change.
3.6. Socioeconomic and Policy Aspects of the System
The socioeconomic impacts of the proposed system transformation in Türkiye were analyzed in terms of employment, economic benefits, and widespread adoption of renewable energy sources in the assessed regions. According to IRENA (2019), approximately 11 million people worldwide were employed in the renewable energy sector in 2018, compared to 7.3 million in 2012. Solar PV had the largest share in this increase, reaching 3.6 million in 2018. By 2050, it is expected that the total employment in renewable energy will reach 42 million worldwide. Therefore, it is clear that production from renewable energy sources will have a positive impact on job creation in Türkiye. New investments in renewable energy could create job opportunities between 2018 and 2030. The majority of new jobs in renewable energy will be created during the investment phase. The increased deployment of renewable energy has employment implications that can be divided into three categories: manufacturing, construction and installation, and operation and maintenance. At first, the majority of employment opportunities will come from manufacturing, construction, and installation. However, as time passes, the number of employees in ongoing operations and maintenance services will increase. By 2030, the rapid expansion of solar PV and wind power in Türkiye is projected to create 718,000 job-years of employment in manufacturing and 1.7 million job-years of employment in construction and installation. The manufacturing phase will primarily involve the metal (iron–steel, copper, etc.), machinery, and electrical equipment sectors. Furthermore, the use of renewable sources for electricity production can help these countries to reduce their energy import costs. Additionally, the clean energy sector can provide a larger portion of the overall energy supply, and progress can be made in the domestic production of renewable energy equipment. This can contribute to the economy by creating more jobs through import substitution and domestic production [
66].
Considering Türkiye’s 2023 and 2053 energy plans, the utilization of renewable energy sources for electricity generation can help to alleviate the negative impacts of carbon emissions, greenhouse gases, global warming, and climate change. The rise in greenhouse gas emissions worldwide is primarily attributed to the increase in energy consumption, making decarbonization and energy system transformation critical in the fight against climate change. However, the ongoing energy crisis has disrupted the supply chain and access to primary energy resources. This has led to an unprecedented increase in energy prices in 2022 and raised energy supply security issues. These developments have brought all elements of the energy transition back into focus, particularly renewable energy sources and energy efficiency. Türkiye aims to reduce its carbon footprint by ratifying agreements, such as the Kyoto Protocol and the Paris Climate Agreement, which have been adopted by many countries. This will have a positive impact on climate change and global warming by controlling greenhouse gas emissions. Additionally, recent policy developments in this area include new legal regulations aimed at increasing energy efficiency. Türkiye is committed to achieving its 2053 net-zero emission target to address the growing energy demand. To achieve this goal, Türkiye is focusing on renewable energy fields, emphasizing energy efficiency, and aiming to decarbonize within 30 years. Furthermore, the eleventh development plan published by the Presidency of the Republic of Türkiye emphasizes the significance of renewable energy. The development plan includes a section on achieving a sustainable and clean environment through the use of renewable energy. Therefore, there are no potential obstacles to implementing and improving the integrated energy system [
67].
3.7. Optimization and Economic Analysis Results
The research optimization was conducted using the RSM method, which determined the optimal values for the objective functions and optimized variables. Four design parameters were selected as optimization variables, as indicated in
Table 8.
Table 8 was constructed according to the previously provided data for all selected locations in
Table 2,
Table 4,
Table 5 and
Table 6. The optimization of the selected factors was performed using a statistical approach for all responses.
Table 9 presents the analysis runs using a face-centered central composite design with calculated responses. The detailed statistical results of the responses used in the RSM design are summarized below.
Table 10 shows the statistical results obtained from the analysis of variance (ANOVA) for the total annual electricity generation. It is important to note the significance of the total annual electricity generation, as indicated by the substantial model F-value of 3.44 × 10⁷, which suggests that it is not a random occurrence. The model terms A, B, C, D, AD, BD, CD, and D
2 are coded factors that emerge as noteworthy parameters, as evidenced by their Prob > F values falling below the accepted risk threshold of 0.05. It is crucial for accurate response value prediction to have congruence between the predicted R-squared (Pred R-squared) and the adjusted R-squared (Adj R-squared) values. Notably, the estimated R
2 value aligned precisely with the adjusted R
2 value at 1. Additionally, the adequate precision (Adeq Precision) was registered at 15,172.6977, and the signal-to-noise ratio exceeded 4, indicating the model’s suitability for optimizing the total annual electricity generation.
Table 11 presents the statistical findings for the variable concerning the number of houses, derived from the analysis of variance (ANOVA). The total annual electricity generation was statistically significant, as indicated by a substantial model F-value of 3.44 × 10⁷, which suggests its non-random nature. Noteworthy model terms, including coded factors such as A, B, C, D, AD, BD, CD, and D
2, were identified as influential parameters due to their Prob > F values falling below the accepted risk threshold of 0.05. It is essential for the predicted R-squared (Pred R-squared) value to exhibit reasonable concordance with the adjusted R-squared (Adj R-squared) value for accurate response value prediction. Remarkably, both the estimated R
2 value and the adjusted R
2 value were precisely 1. Furthermore, the model’s suitability for optimizing the total annual electricity generation was indicated by the adequate precision (Adeq Precision) measuring 15,172.6977 and the signal-to-noise ratio exceeding 4.
Table 12 presents the statistical outcomes of the analysis of variance (ANOVA) regarding the total cost. The significance of the total annual electricity generation was highlighted by a substantial model F-value of 1.19 × 10⁷, indicating its non-random nature. Key model terms, including coded factors such as A, B, C, D, AD, BD, CD, and D
2, were prominent due to Prob > F values falling below the accepted risk threshold of 0.05. Also, both the estimated R
2 value and the adjusted R
2 value were exactly 1. In addition, the model’s suitability for optimizing the total annual electricity generation was indicated by an adequate precision (Adeq Precision) of 9002.245 and a signal-to-noise ratio that exceeded 4.
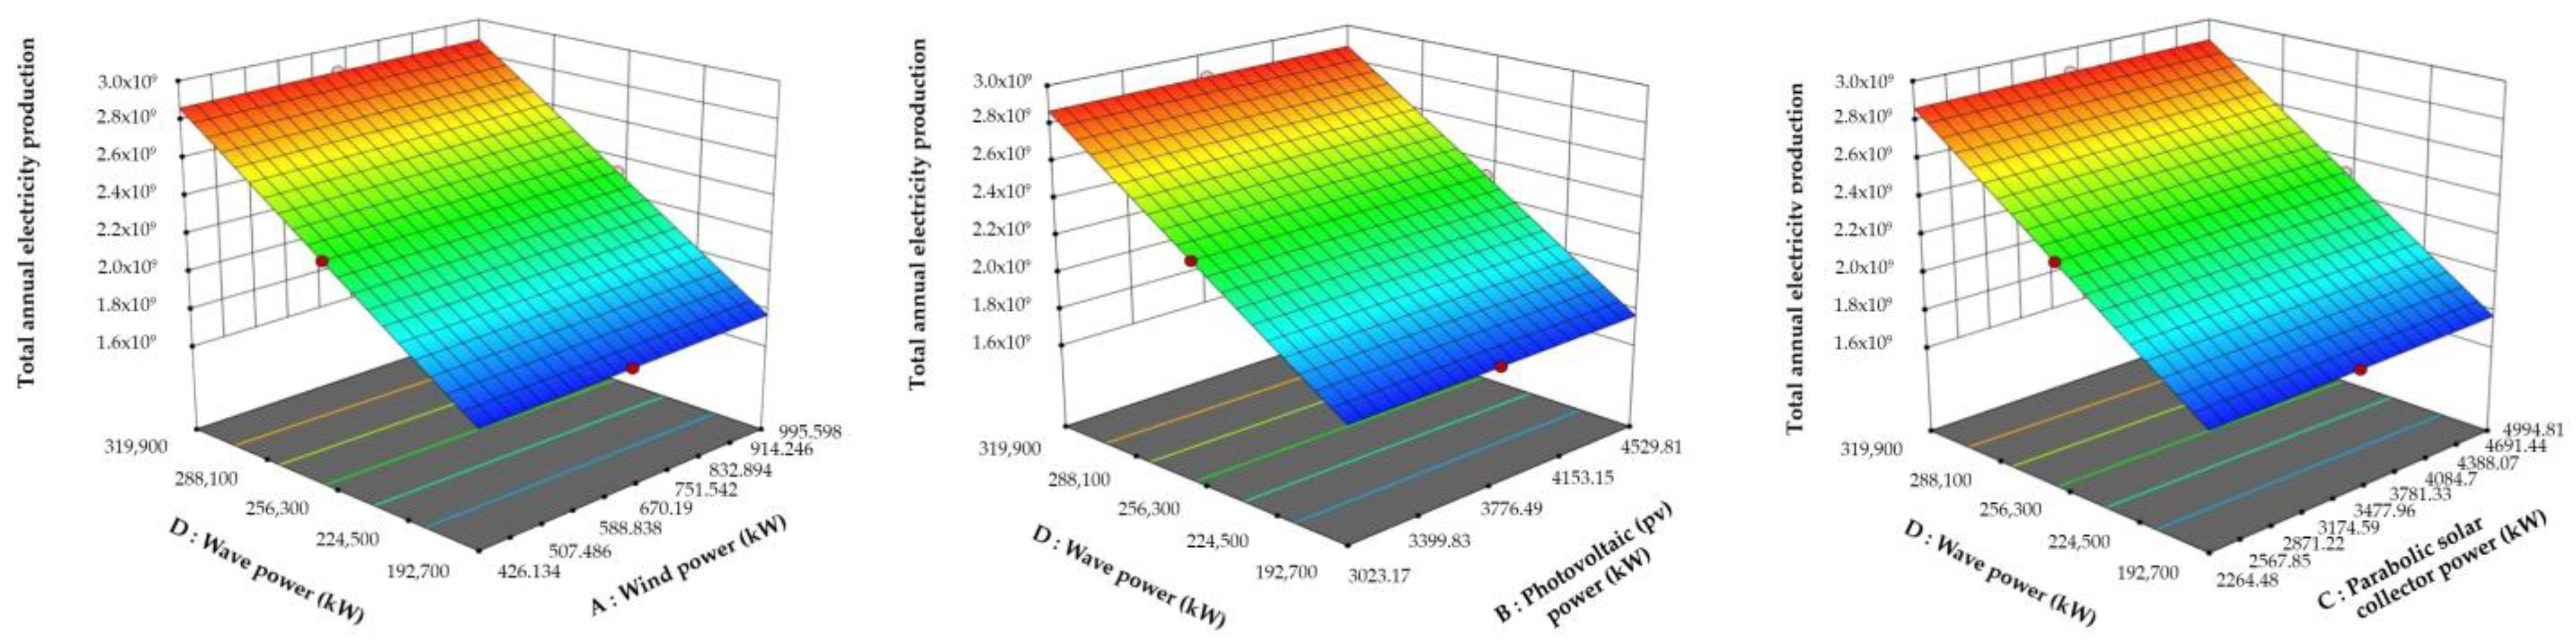
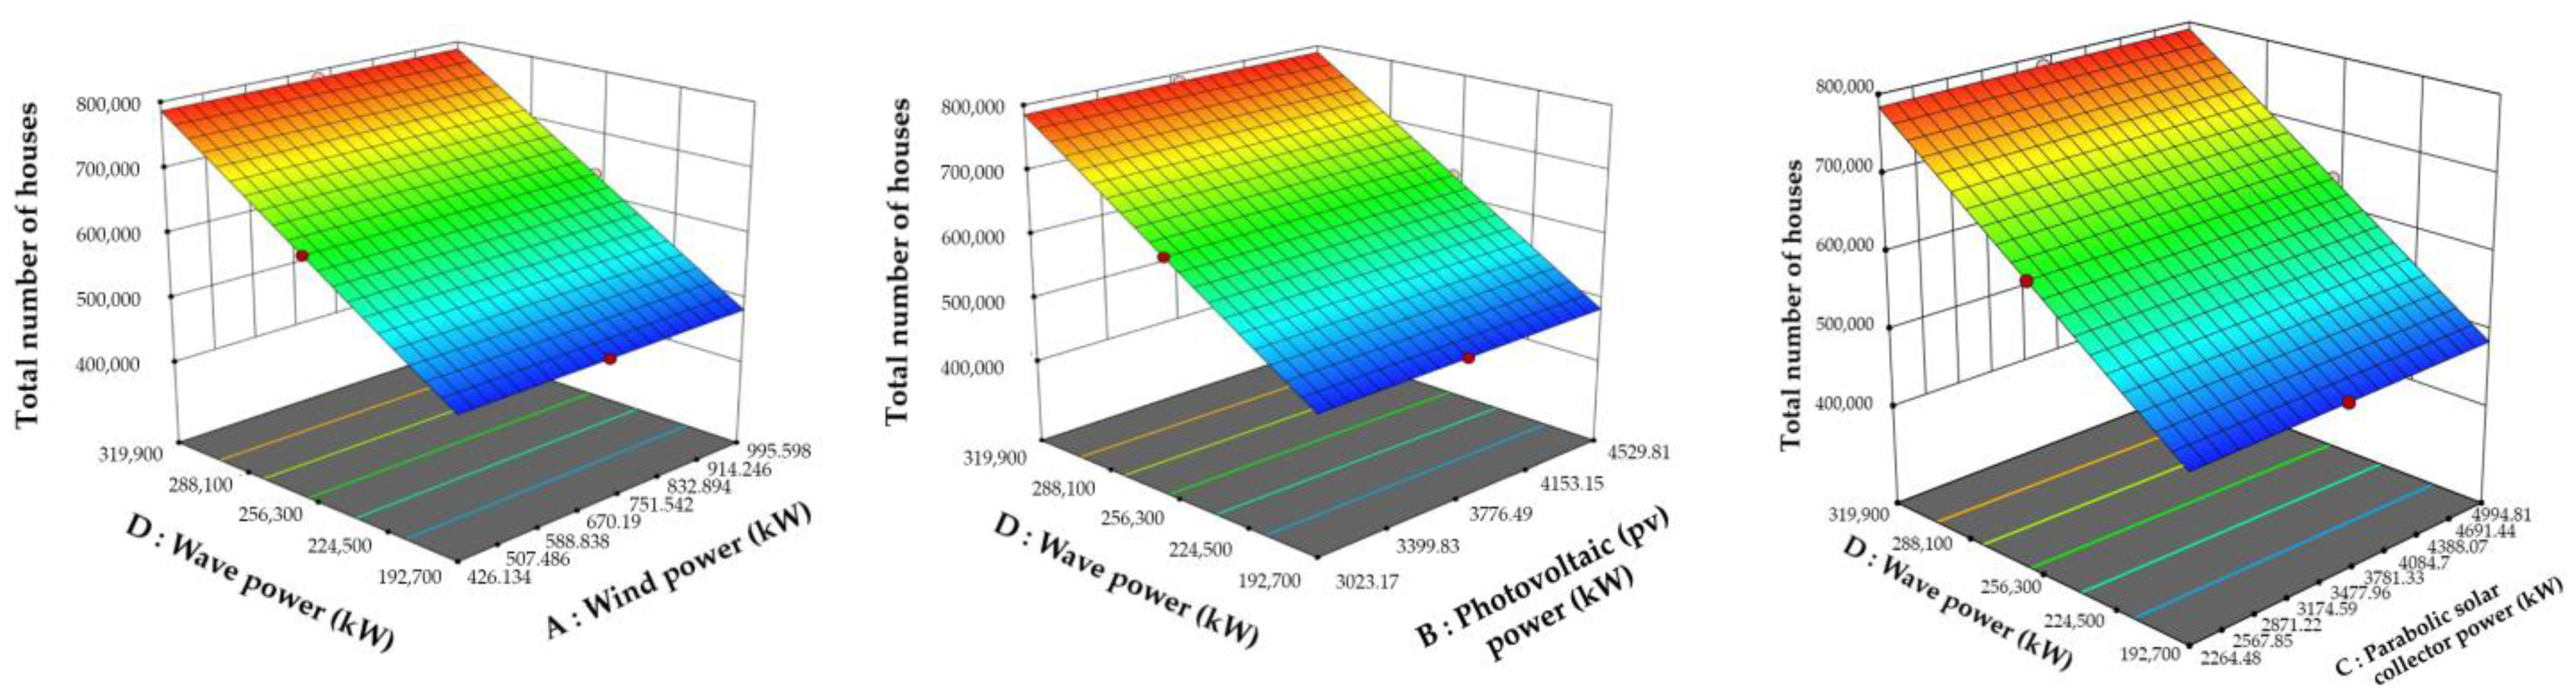
The combined effect of wave, wind, photovoltaic, and parabolic solar collector power factors on the responses is shown in
Figure 12 for the total annual electricity generation,
Figure 13 for the total number of houses per year, and
Figure 14 for the total cost. When
Figure 12,
Figure 13 and
Figure 14 are analyzed, the effect of wave power on all responses is considerably higher than the other factors. This could be due to the fact that the wave height, wavelength, and wind speed affect the electricity generation more when the equations used in the wave power calculations are analyzed in Equations (5)–(14). The power generated from the wave energy system (TAPCHAN) is the highest compared to the other renewable energy sources, such as wind, photovoltaic, and parabolic solar collector energy. In terms of the total maximum electricity generation and number of houses with the minimum cost, wave energy has the highest impact when compared to the other renewable energy sources.
In
Figure 12, the variations in the design parameters affecting the electricity generation of wave, wind, and solar energies in integrated form are shown in three-dimensional graphs, and the aim of optimizing these parameters was to maximize electricity generation and increase efficiency. The main goal of this system is to produce clean energy by reducing carbon emissions (climate change, greenhouse gases, etc.) and environmental pollution for a sustainable future. Therefore, optimizing this system helps to increase the amount of clean electricity production with minimized costs. Upon examining the results, it is evident that wave energy input is among the most effective design parameters for electricity generation, and changes in this parameter can have a significant impact on the overall electricity production rate of the system. In contrast, wind and photovoltaic solar energies may have a limited impact on increasing the total electricity production.
Figure 13 displays the three-dimensional variations in the design parameters for wave, wind, and solar energies in an integrated form that impact the total number of houses. The objective of optimizing these parameters was to maximize the number of houses and increase efficiency. The study indicated that the wave energy input was a crucial design parameter that significantly affected the total number of houses. Changes in this parameter can have a high impact on increasing the number of houses in the system. The data indicated that wind and solar photovoltaic energies had a minimal impact on the total number of houses.
Figure 14 displays the variations in the design parameters that affect the cost of integrated wave, wind, and solar energies. The purpose of optimizing this function was to reduce costs. The results indicate that the input of wave and parabolic solar collector energy are among the most influential design parameters on the cost of the system. Changes in these parameters can significantly increase the cost of the entire system. The average total installation costs for generating electricity from wind, wave, photovoltaic, and parabolic solar collectors in the integrated form are as follows: 1498.6 USD/kW [
49] for wind, 2881 USD/kW [
68,
69,
70] for wave, 600 USD/kW [
65] for photovoltaic, and 5690.22 USD/kW [
49] for parabolic solar collectors.
Table 13 shows the optimal solution obtained from the Response Surface Methodology (RSM) calculations for the decision variables and objective functions. The multi-objective optimization method was used to obtain these responses. The statistically optimized factors for wind power, PV power, parabolic power, and wave power were 995.278, 4529.743, 2264.546, and 276,495.09, respectively. The present study showed that the solution with the highest value of 0.538 was the most desirable, indicating the sensitivity of RSM.
Table 14 presents the top 10 optimal results out of 100 for the system to be installed, based on the maximum electricity production and the number of houses, and the minimum cost. The optimum wind and photovoltaic energy results were found to be close to their maximum upper limits, while the parabolic solar collector and wave energy inputs were optimized to a value in the range. This indicated that wind and photovoltaic energy production may have a lower effect on increasing the total cost. The optimal factors aimed to achieve a total electricity generation rate of 2.491 × 10
9 (kWh/year), a total number of houses of 682,590.55 (number/year), and a total cost of USD 813,940,876. The factors that were optimized significantly contributed to the overall cost and feasibility of the proposed integrated energy system. The optimization of the selected factors was performed using the RSM method, which determined the optimal values for the objective functions. A statistical approach was used to optimize all responses. The response outputs were obtained in terms of the maximum electricity generation and the number of houses, as well as the minimum cost. Based on this analysis, wind and photovoltaic energies were optimized close to their maximum upper limits, while the parabolic solar collector and wave energy inputs were optimized within a specific range. This suggests that wind and photovoltaic energy generation can have a lower impact on the overall cost.
Based on the optimization results of the wave and wave-integrated wind and solar energy system, it is expected that installing the system in the Kırklareli/Demirköy region, the most optimal city, will meet a significant portion of the region’s electricity demand. Based on data from the Republic of Türkiye Energy Market Regulatory Authority (EMRA) [
71], the consumption amount for the Kırklareli province in 2022 was reported as 2,328,744.56 MWh. Therefore, the proposed system being installed has the potential to meet the entire reported electricity demand of the Kırklareli province, as calculated in this study.


