


Abstract
Renewable energy forecasting is a key for efficient resource use in terms of power generation and safe grid control. In this study, we investigated a short-term statistical forecasting model with 1 to 3 h horizons using photovoltaic operation data from 215 power plants throughout South Korea. A vector autoregression (VAR) model-based regional photovoltaic power forecasting system is proposed for seven clusters of power plants in South Korea. This method showed better predictability than the autoregressive integrated moving average (ARIMA) model. The normalized root-mean-square errors of hourly photovoltaic generation predictions obtained from VAR (ARIMA) were 8.5–10.9% (9.8–13.0%) and 18.5–22.8% (21.3–26.3%) for 1 h and 3 h horizon, respectively, at 215 power plants. The coefficient of determination, R2 was higher for VAR, at 4–5%, than ARIMA. The VAR model had greater accuracy than ARIMA. This will be useful for economical and efficient grid management.
1. Introduction
The use of renewable energy is increasing due to the environmental impacts of fossil fuels and energy security. The European Union recently announced the REPowerEU plan for developing more affordable, secure, and sustainable energy sources such as solar power to displace consumption of natural gas [1]. The most commonly used renewable energy type in South Korea is solar energy, with national targets of 20% renewable energy by 2030 and 42% by 2034 [2]. Increased shares of solar power energy must be considered in advance for distributed grid operations and planning [3,4]. In Jeju, South Korea, curtailment in solar power energy has been started under a 20% share of the energy mix. Reliable forecasting of renewable energy is key to optimization and technical development of management methods based on load balancing, which can reduce annual energy operating costs and ensure safe grid operation [5]. In addition, the volatility of power generation can be high due to weather conditions in the surrounding oceans of South Korea. Thus, accurate forecasting is essential.
Numerous studies have predicted solar power generation using various methods. Studies that have employed artificial neural network (ANN) or autoregressive integrated moving average (ARIMA) models with variables such as solar radiation, generator module temperature, and module ambient temperature have also been reported [6]. A support vector machine (SVM) model that predicts 10 min solar power generation has been designed [7]. In addition, statistical models such as time-series analysis, neural network, SVMs, and numerical weather prediction models based on satellite data have been developed for short-term solar power forecasting [8,9,10,11,12,13]. The time-series method has been used with a neural network model to predict ultra-short-term solar power generation [14]. Other studies have established models to predict power consumption based on ARIMA and various ANNs [15]. Additional studies have employed several extended models based on the ANN and ARIMA models. The adaptive neuro-fuzzy inference system (ANFIS) [16], Infinite impulse response multilayer perceptron (IIR-MLP) [17], locally feedback dynamic fuzzy neural network (LF-DFNN) [18], and deep learning models with several layers such as the convolution neural-network (CNN), recurrent neural network (RNN), long-short term memory neural network (LSTM), and CNN-LSTM and RNN-LSTM hybrid [19,20,21,22,23,24] are examples of extended models based on ANN. These models have demonstrated good predictability. The ARIMA model’s predictive performance can be improved by applying multiple fractal noise to the noise of the time series [25]. Accuracy of the results can also be improved through application of an ensemble model and ANN to leverage the principal components between independent variables [26]. Predictive models using machine learning methods, such as ANNs, have the advantage of high accuracy and the disadvantage of low interpretability. In comparison, predictive models that use statistical techniques have the advantage easy interpretation [27,28].
In this study, we propose a solar power forecasting system using a spatiotemporal time-series analysis model. The proposed model is novel in terms of efficiently managing photovoltaic power plant groups rather than individual plants. We designed the forecasting models using solar power generation data from 215 power plants throughout South Korea. We established models for forecasting solar power generation 1 to 3 h in advance, which are the vector autoregression (VAR) and ARIMA models. We then compared the accuracy of the two models. Section 2 provides detailed descriptions of the model and data. The constructed forecasting system is presented in Section 3. Summary and conclusions are given in Section 4.
2. Methodology
2.1. Regional Solar Power Forecasting System
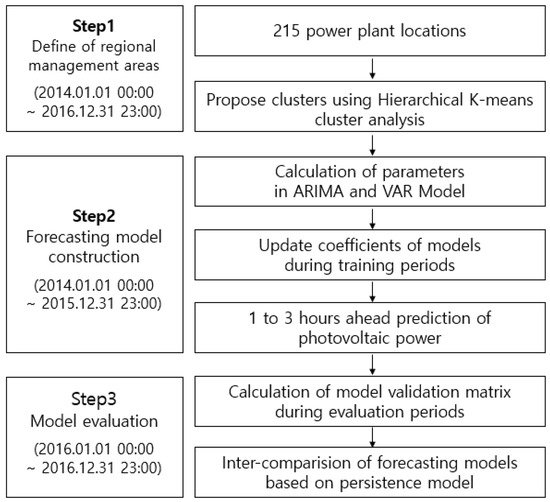
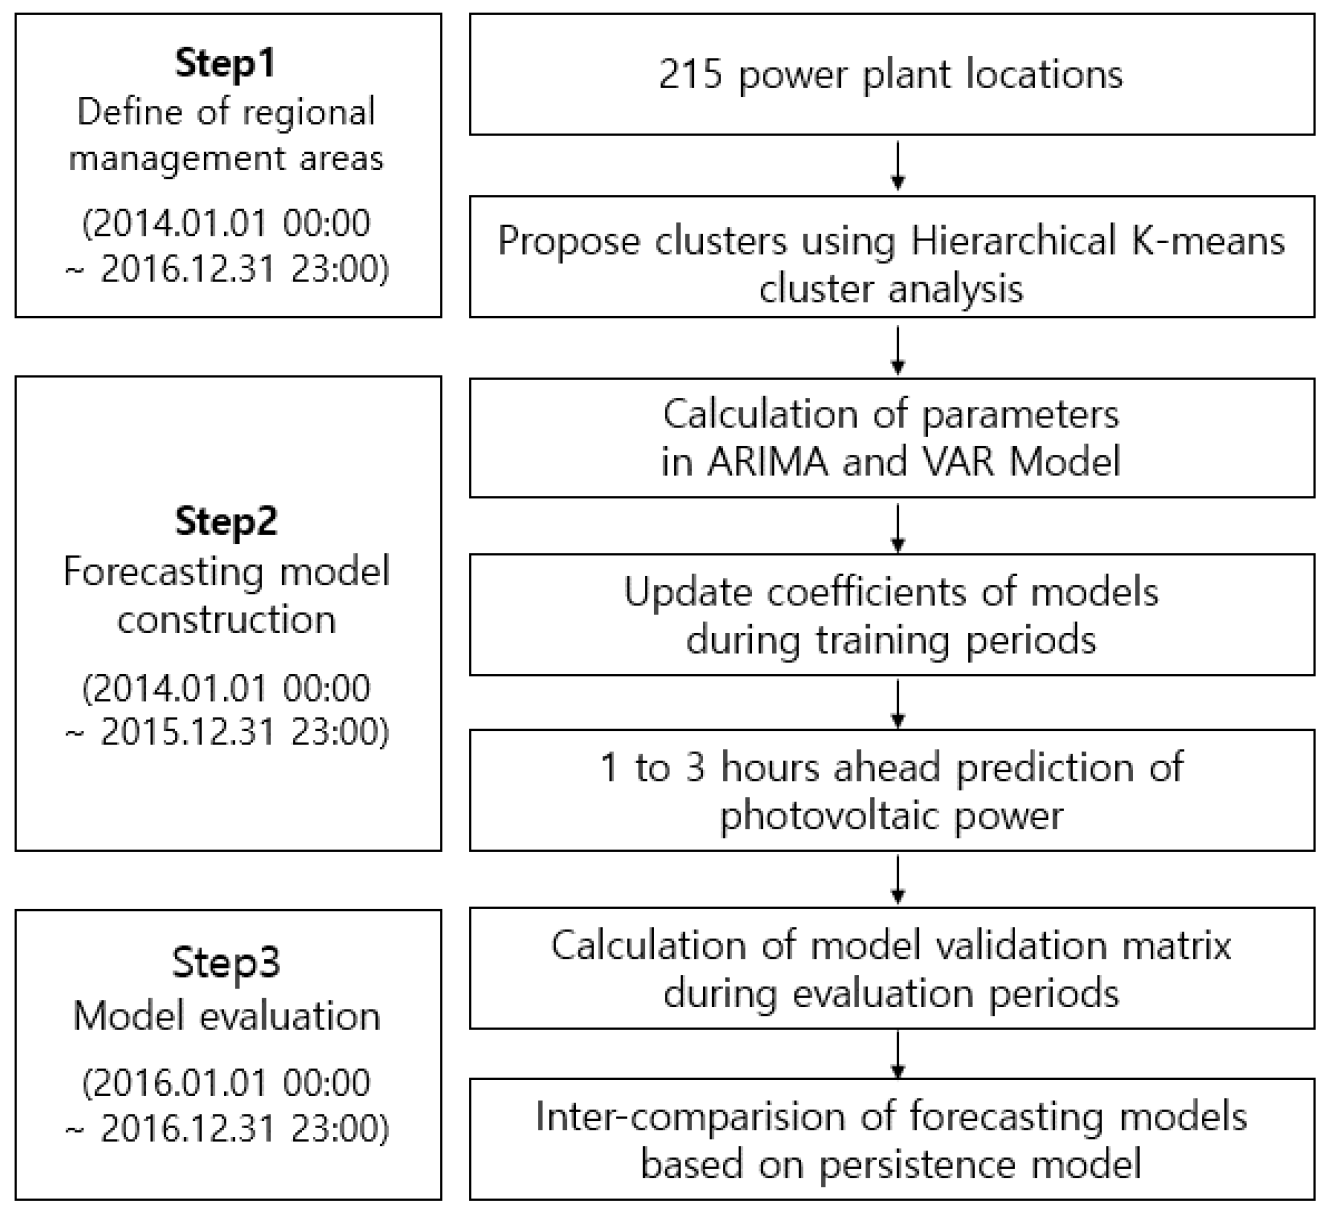
Figure 1 is a schematic diagram showing the development of the photovoltaic power forecasting model. The forecasting model employs long-term memory for time-series analysis. The process of model construction was largely divided into three phases: definition of regional management areas using cluster analysis, forecasting model construction, and model evaluation. The datasets used for the three phases differed slightly. Cluster analysis was conducted for the period from 1 January 2014, at 00:00 LST to 31 December 2016, at 23:00 LST. Afterward, the forecasting model construction was developed using the training data from 1 January 2014, at 00:00 LST to 31 December 2015, at 23:00 LST. Finally, the model evaluation used the data from 1 January 2016 at 00:00 LST to 31 December 2016, at 23:00 LST.
Figure 1.
Schematic diagram of the photovoltaic power forecasting system based on cluster and time-series analyses.
2.1.1. Regional Management Area
Cluster analysis is used to classify observations based on their similarity. Euclidean distance is commonly used as a measure of similarity and the Ward method, a hierarchical clustering analysis method, was used here. The hierarchical K-means clustering method is clustering analysis method that complements K-means clustering with hierarchical cluster analysis. First, through hierarchical cluster analysis, the number of clusters and their center points are determined, and then K-means clustering is performed using the calculated values as the initial center points. Through this process, an observation is assigned to a specific cluster during hierarchical clustering, and thus the disadvantage of that observation being excluded from further consideration is complemented. Furthermore, this method avoids the difficulty of selecting initial center points for K-mean clustering.
2.1.2. Forecasting Models
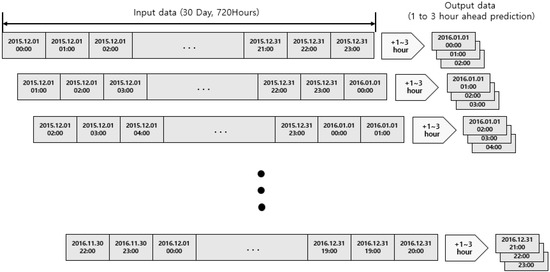
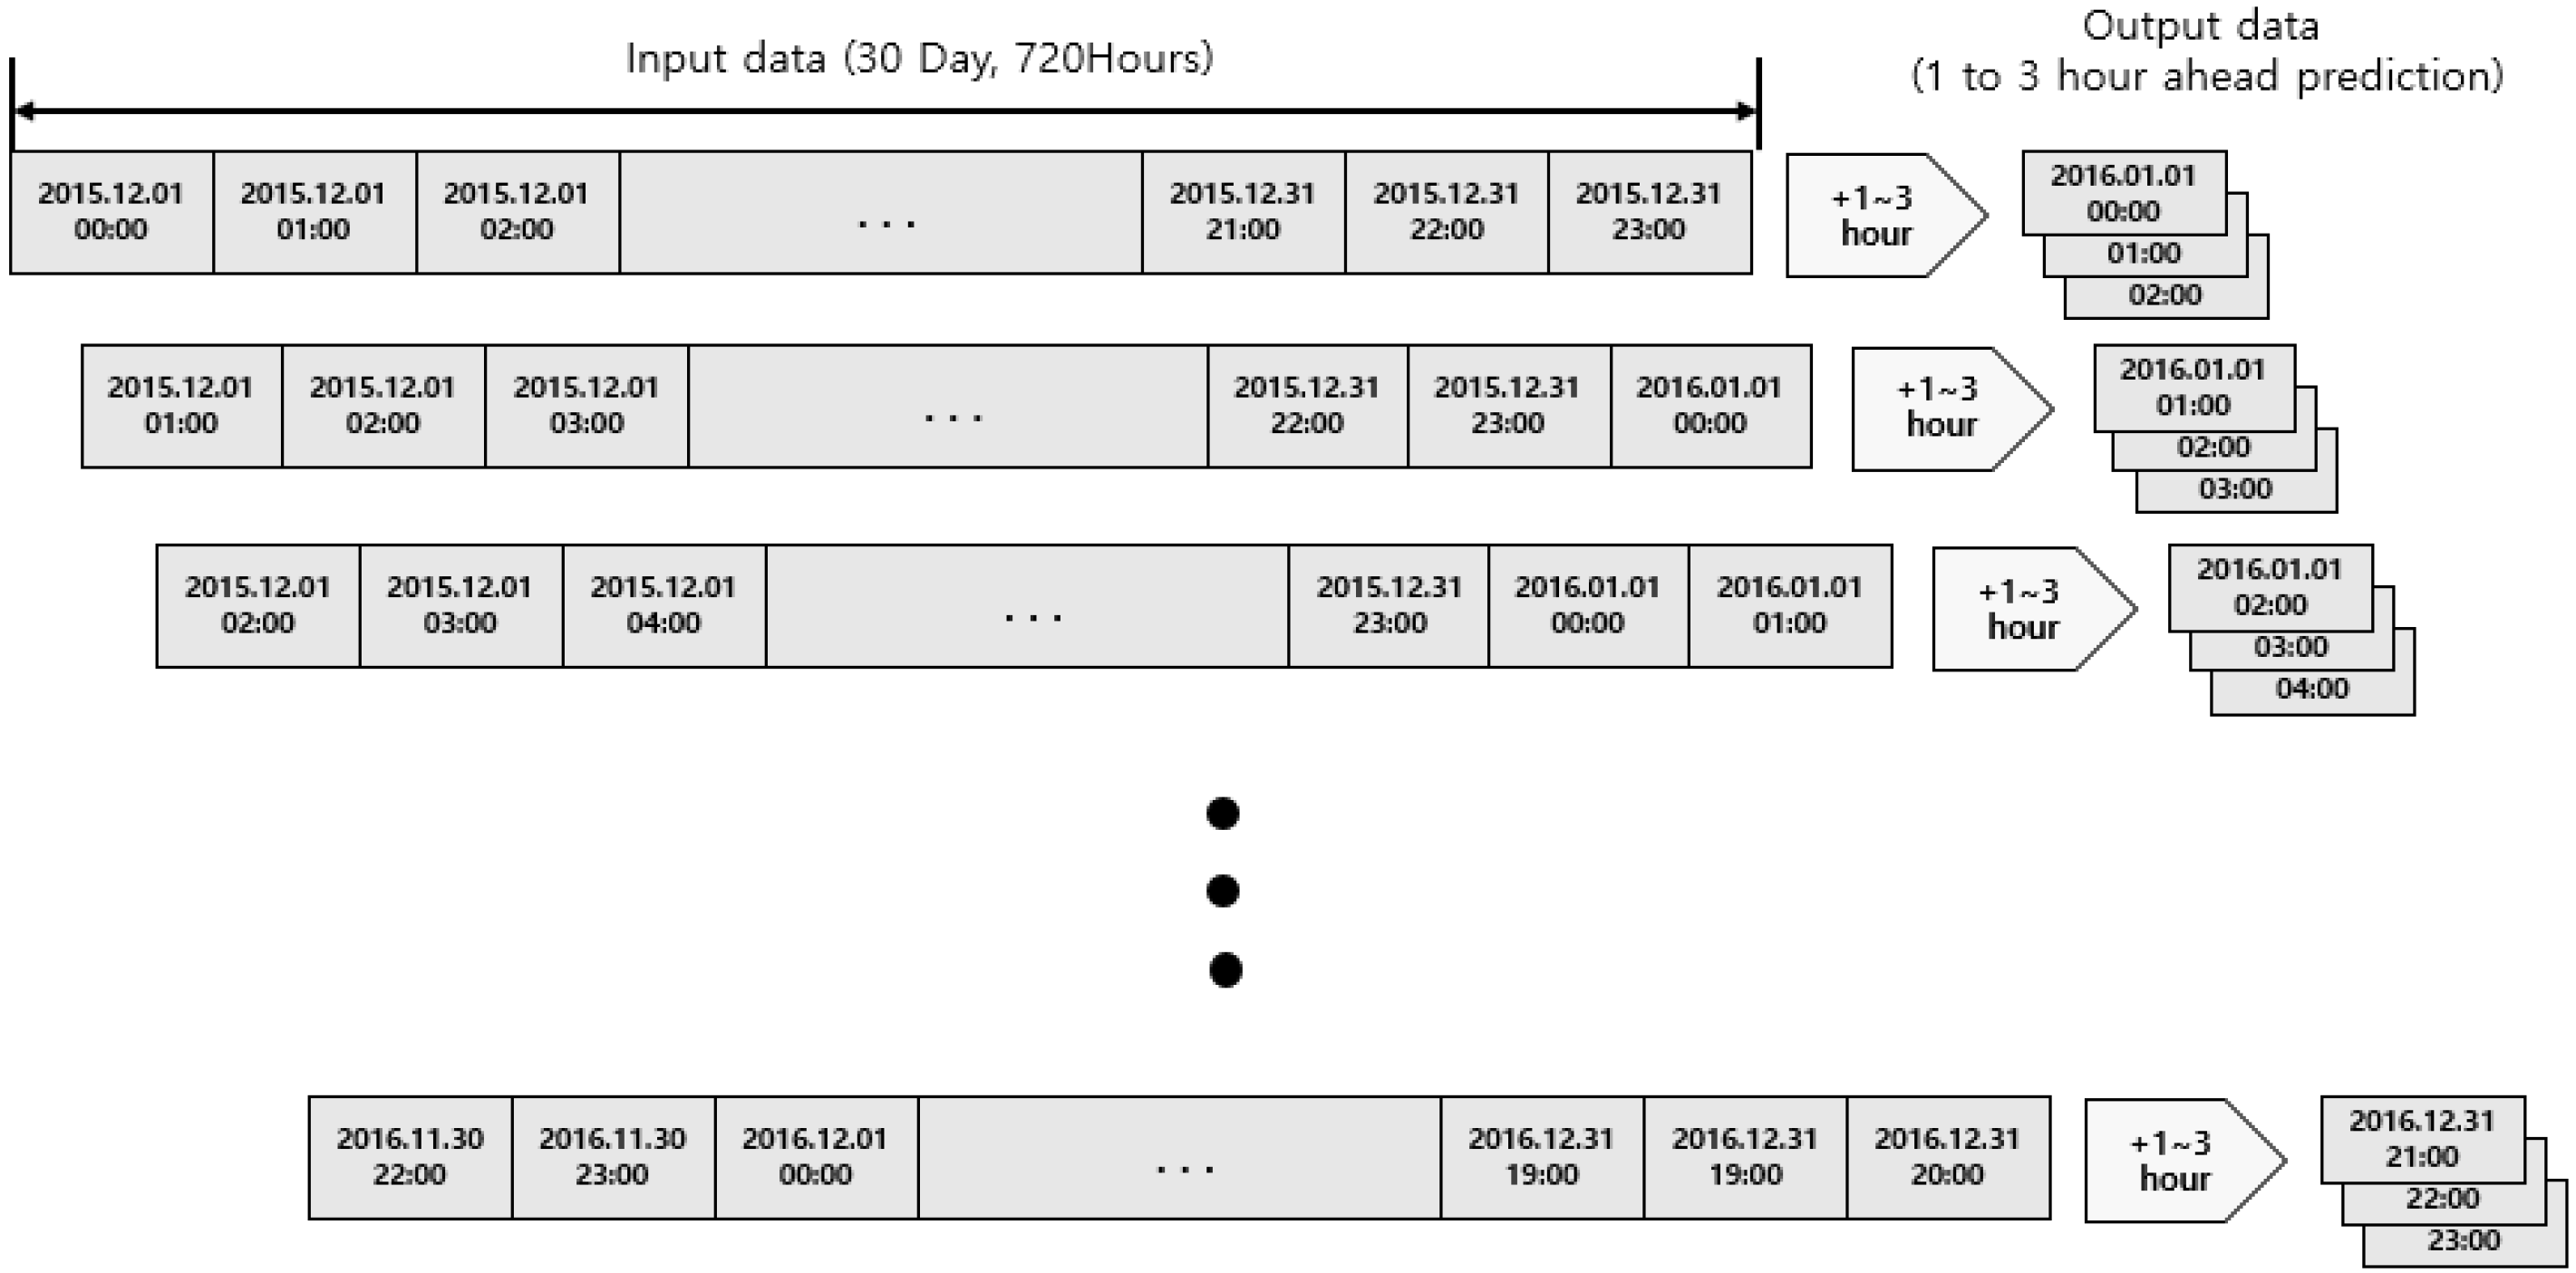
Figure 2 describes the data movement for 1 to 3 h ahead prediction.
Figure 2.
Data management for prediction 1 to 3 h in advance.
Algorithm 1 shows the brief process how to predict the solar power generation using VAR and ARIMA models.
| Algorithm 1: The prediction algorithm for solar power generation using the VAR and ARIMA models is as follows: |
|
|
|
|
VAR is a model that extends the AR model, which is a univariate time-series analysis model, to a multivariate model, and reflects the correlation variables [29]. VAR models are generally denoted as VAR (p) where parameters p is the non-negative integers representing the order of the maximum lag. To determine the order of a VAR model, we often use Akaike’s Information Criterion (AIC, [14]), the corrected AIC (AICc), and Schwartz’s Bayesian Criterion (SBC, [15]).
where
ARIMA is a statistical model that considers both auto-regression and moving averages. The AR part of ARIMA represents the current observation in the form of a function of the past observations if the current state depends on the past state in the time series process. The MA part of ARIMA represents the error between the past observation value and the current observation value in the form of a function. The ARIMA model is a model used when data have non-stationarity in which deterministic and stochastic trends are shown, and variable transformation or differencing is performed to eliminate non-stationarity. A non-seasonal ARIMA model is expressed by ARIMA (p,d,q); p represents the order of the AR model, q represents the order of the MA model, and d represents the differencing.
To determine the order of an ARIMA model, we can also use AIC, AICc, and SBC.
where .
2.2. Data and Evaluation Method
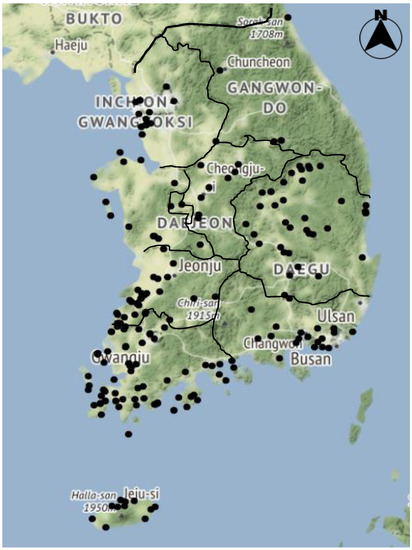
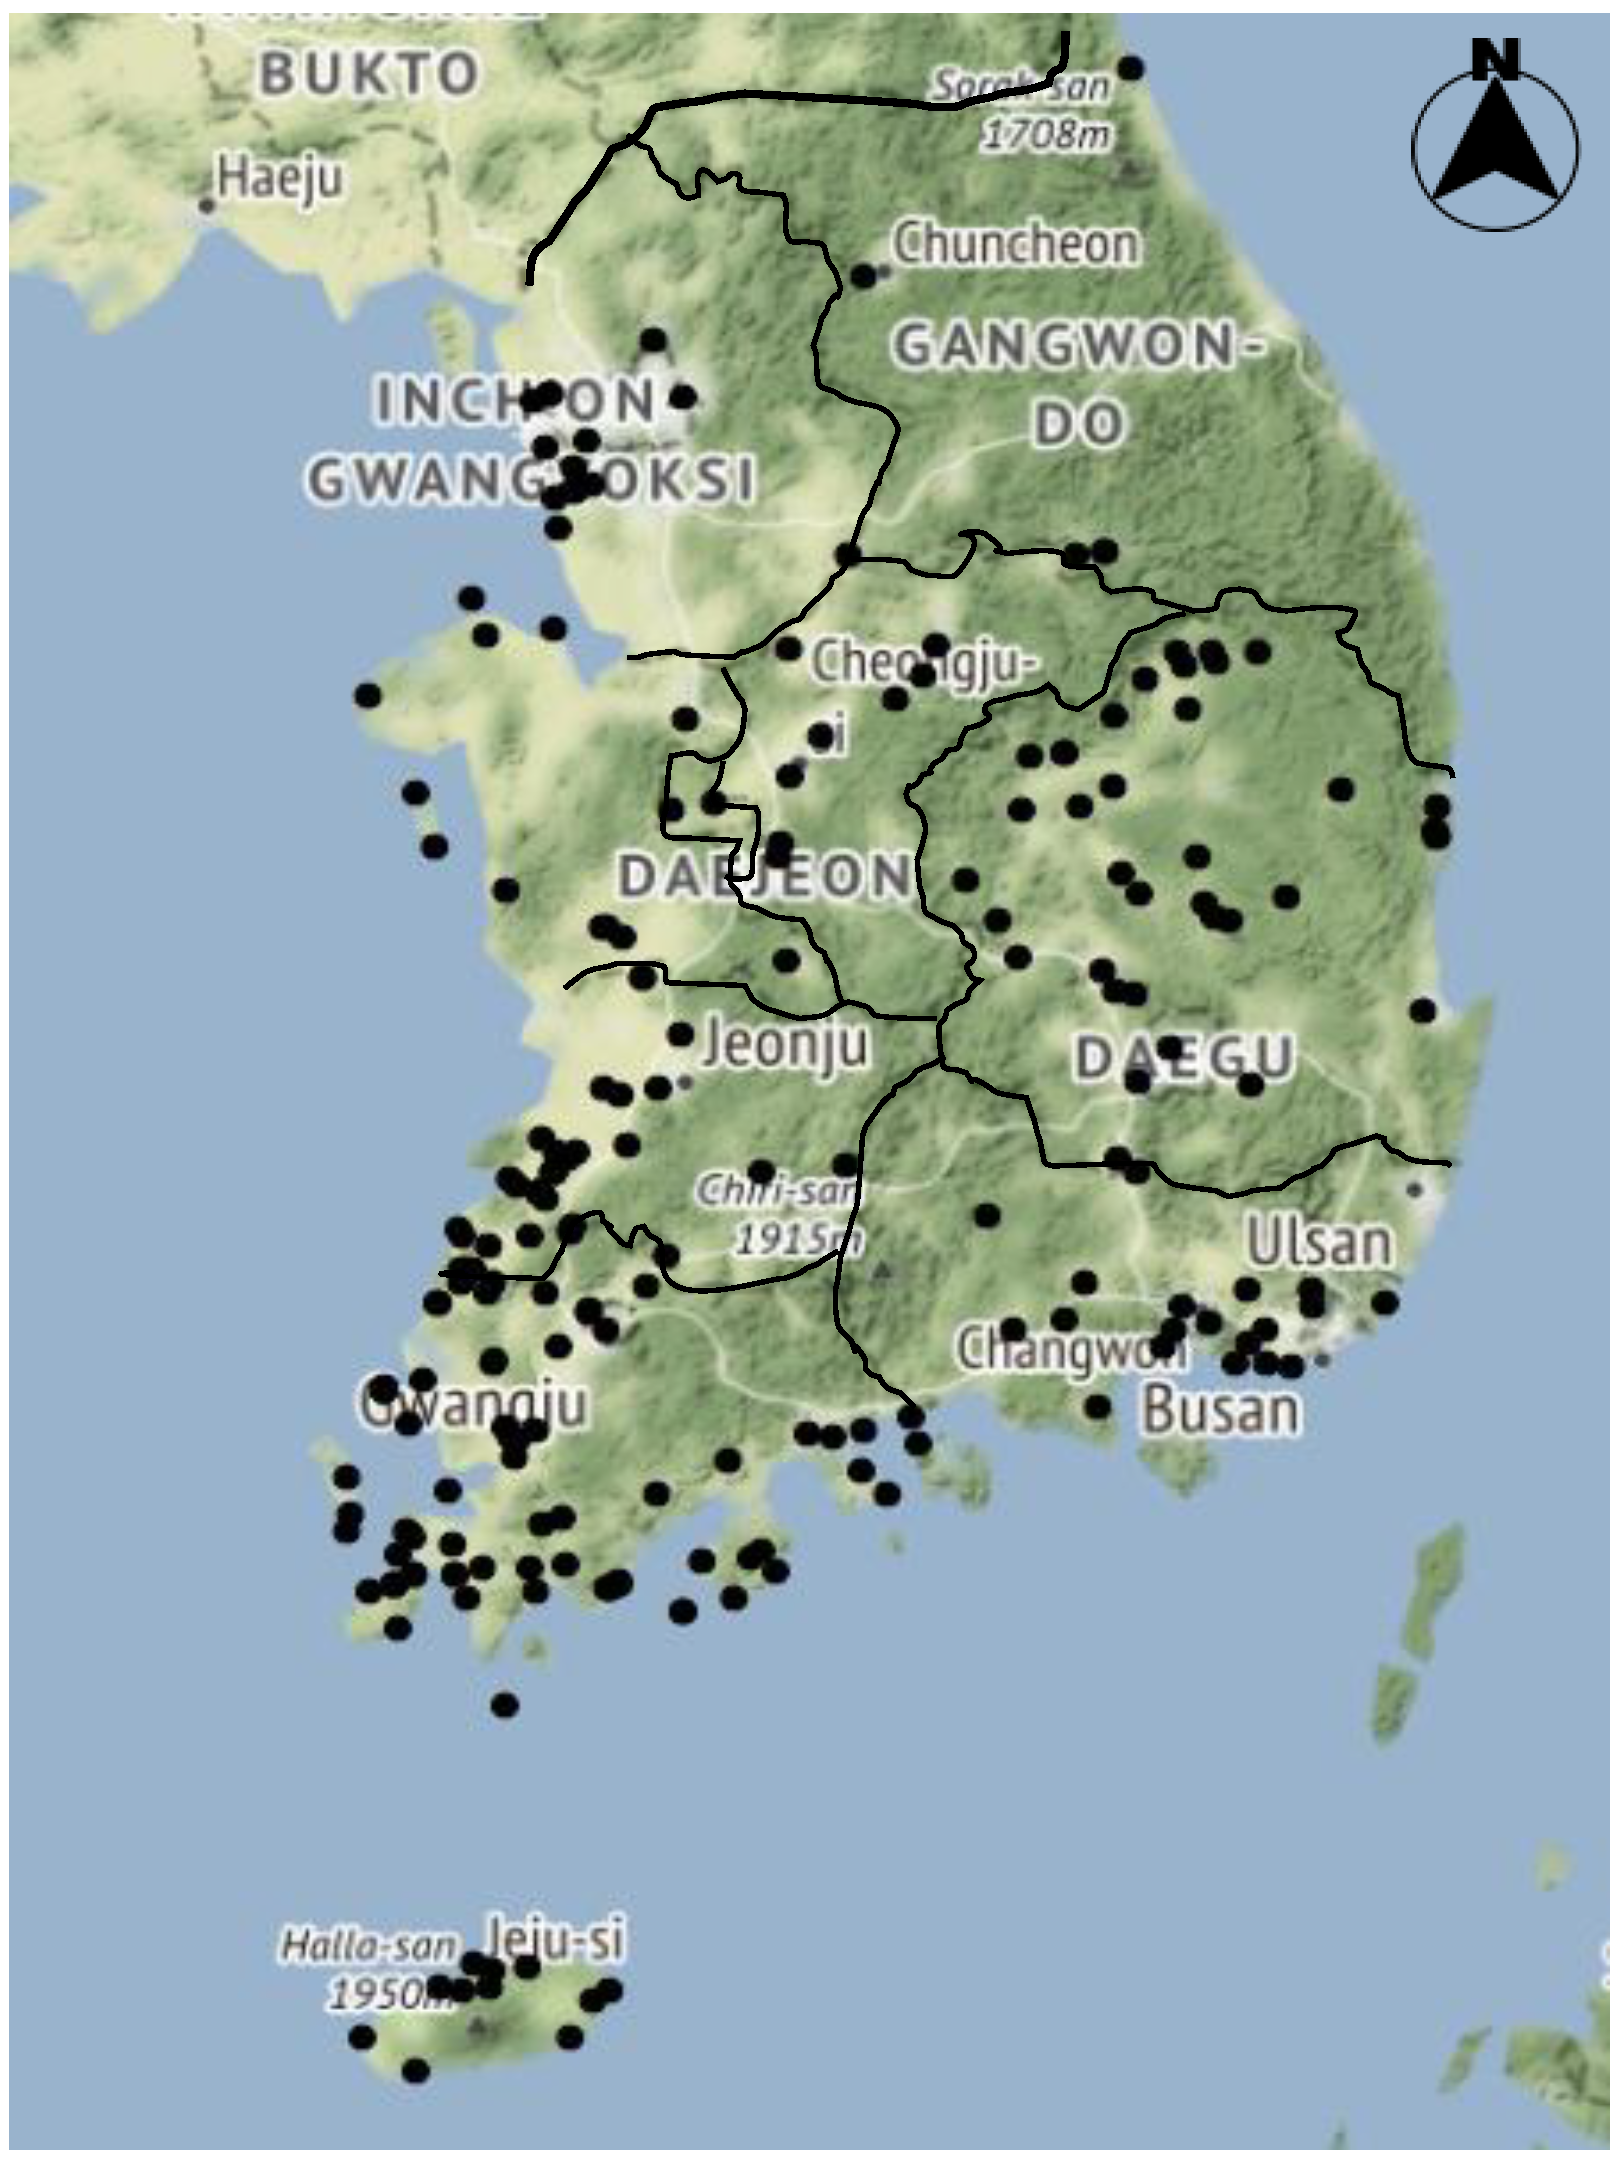
Solar power generation data was input from 2014 to 2016 for development and evaluation of the forecasting system. The solar power generation data were collected at 1 h intervals from 00:00 1 January 2014, to 23:00 31 December 2016. Only 215 power plants were used for the analysis, excluding 12 power plants with zero solar power generation for periods longer than two weeks. In addition, data for analysis were created by filling gaps in the observation with 0 for the dusk and night h of 7 p.m. to 7 a.m. when no observations were available. The analysis was performed using standardized data obtained by dividing the raw solar power generation data by the capacity of power plants from 00:00 1 January 2014, to 23:00 31 December 2016. Figure 3 shows the 215 power plants on a national map.
Figure 3.
Spatial distribution of 215 power plants (black dots) on a national map.
To compare the accuracy of the row models, we used normalized root mean square error (nRMSE). This indicator is calculated by dividing the root mean squared error by the capacity of solar power plants. A lower nRMSE, value indicates a more accurate model. The formula for nRMSE is presented as Equation (3). In addition, P-values were calculated using Student’s t-test to determine the significance of prediction errors of the VAR and ARIMA models. The actual and predicted values used for calculating the prediction error were not standardizing.
3. Results
3.1. Regonal Photovaltaic Power Management Areas
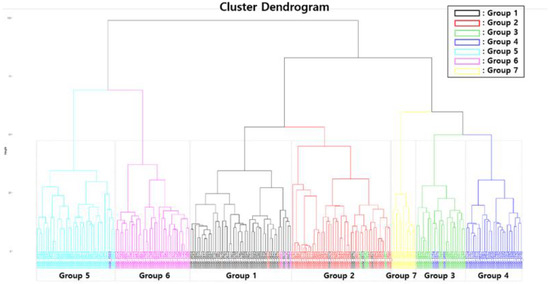
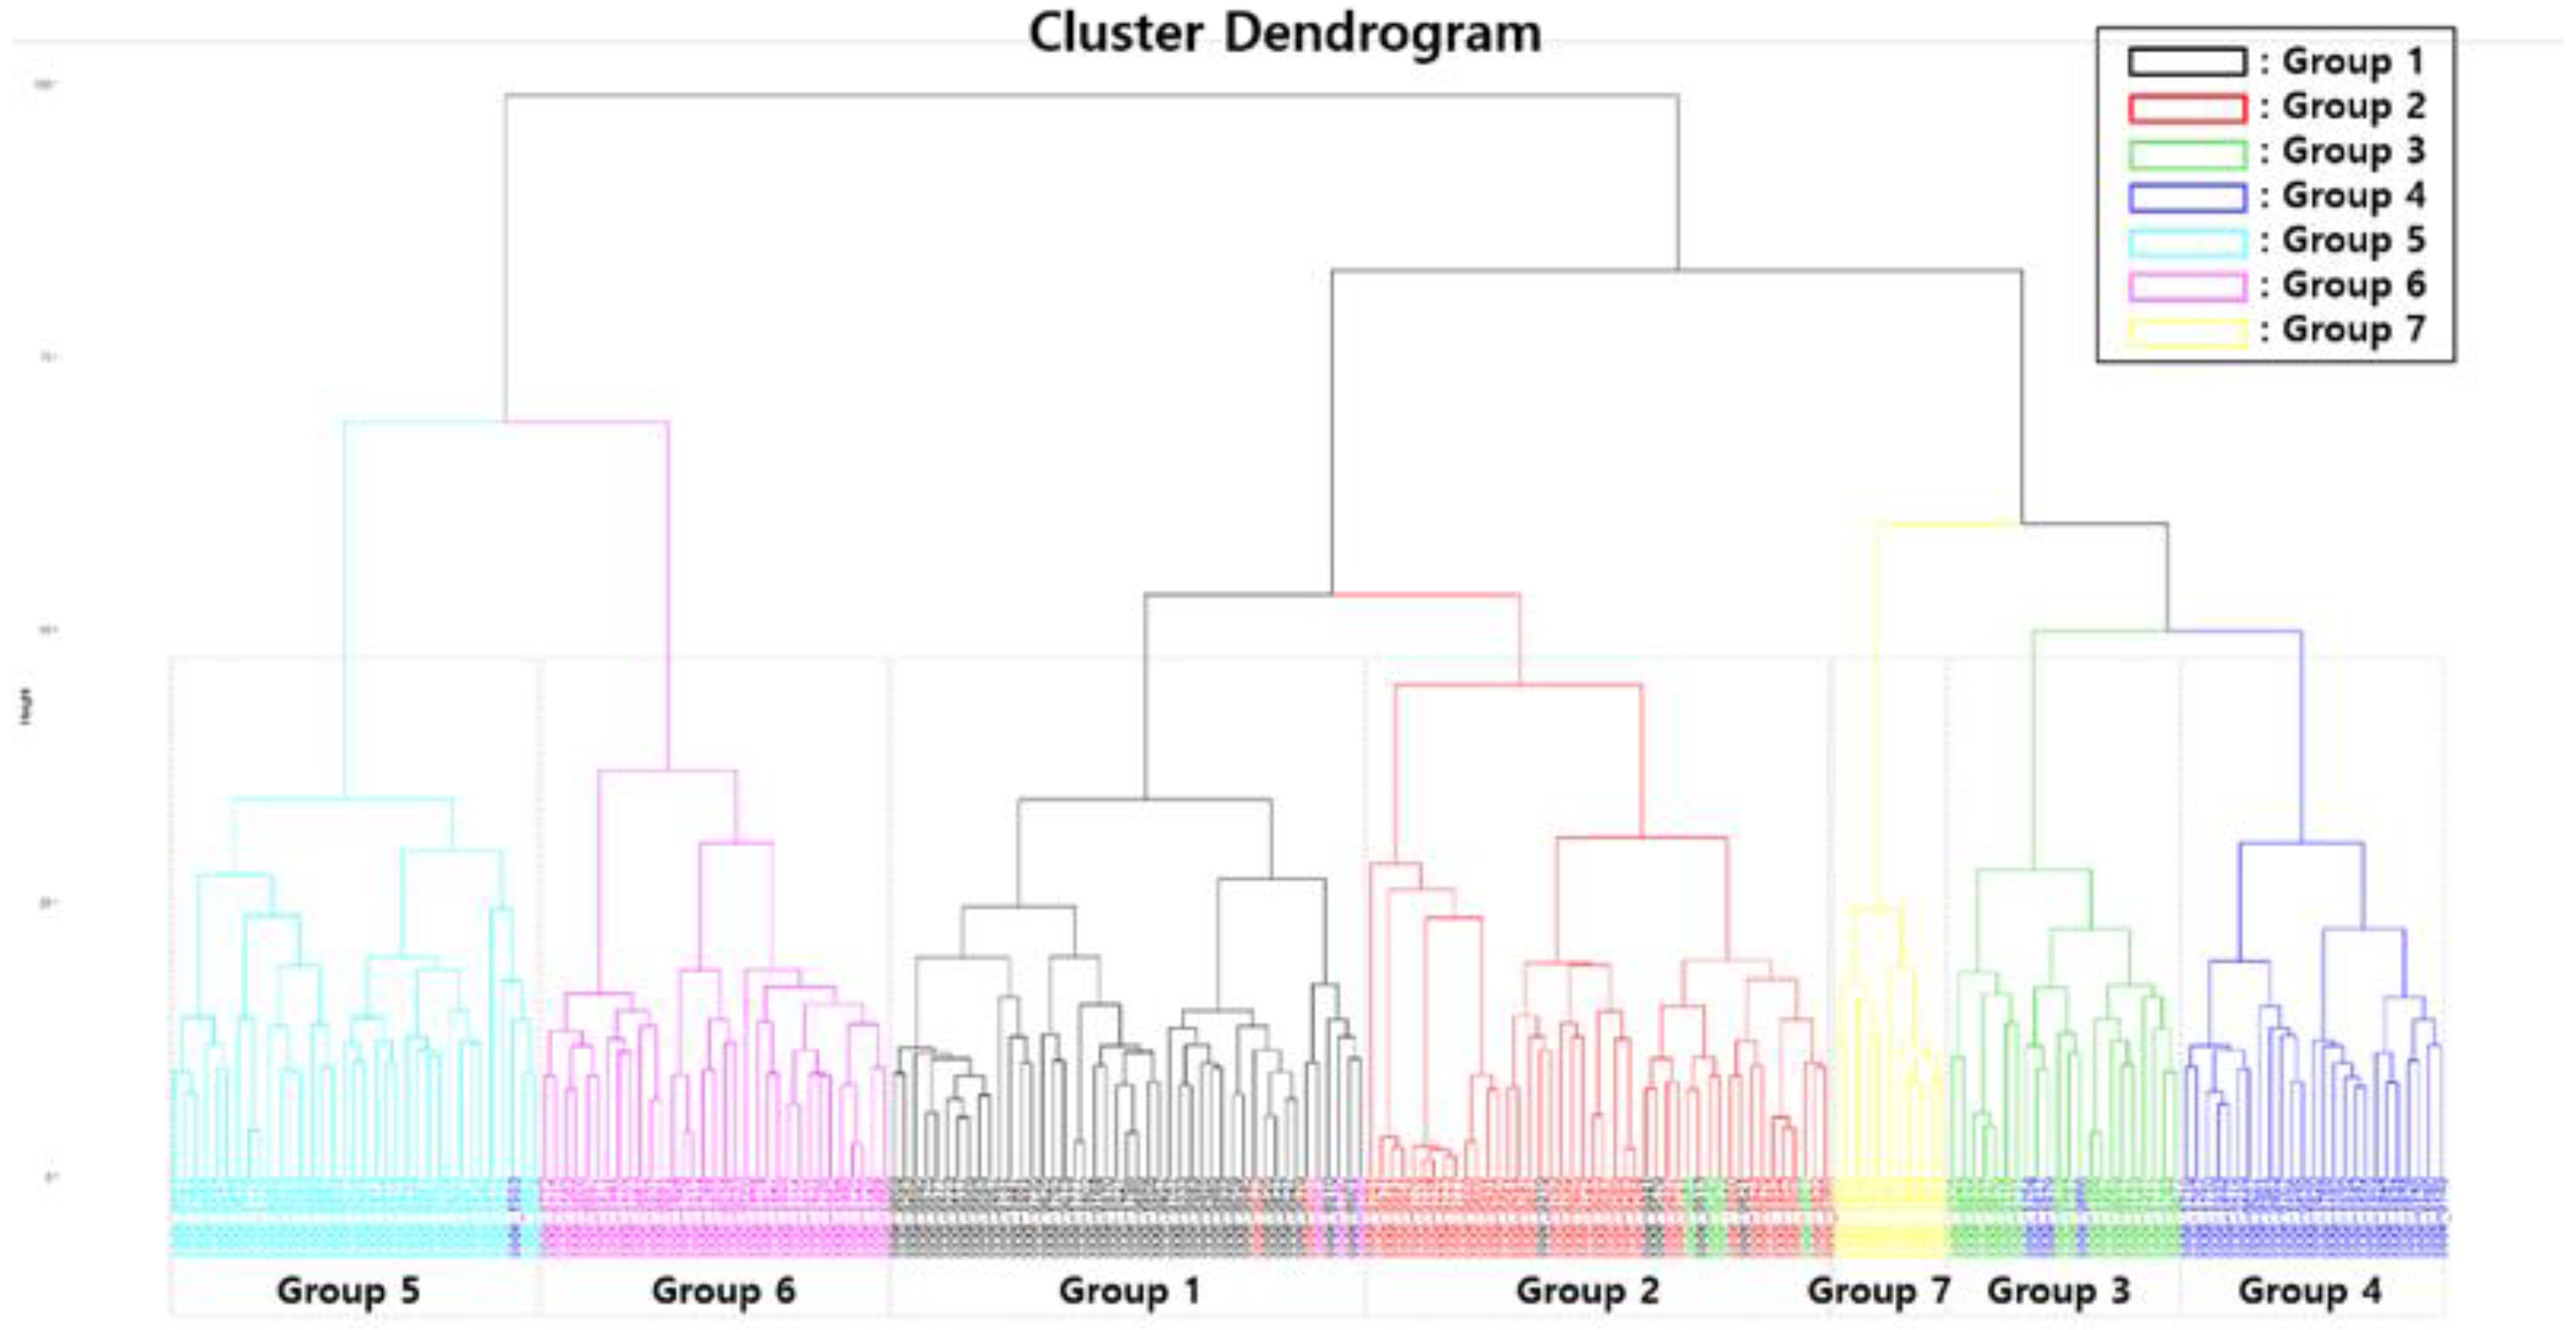
The results of Hierarchical K-means clustering are shown in Figure 4. Based on Figure 4, the most appropriate number of clusters is seven.
Figure 4.
Dendrogram of clusters based on standardized solar power generation.
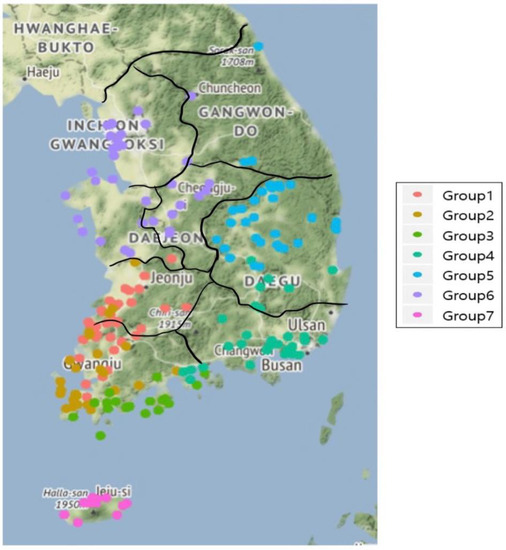
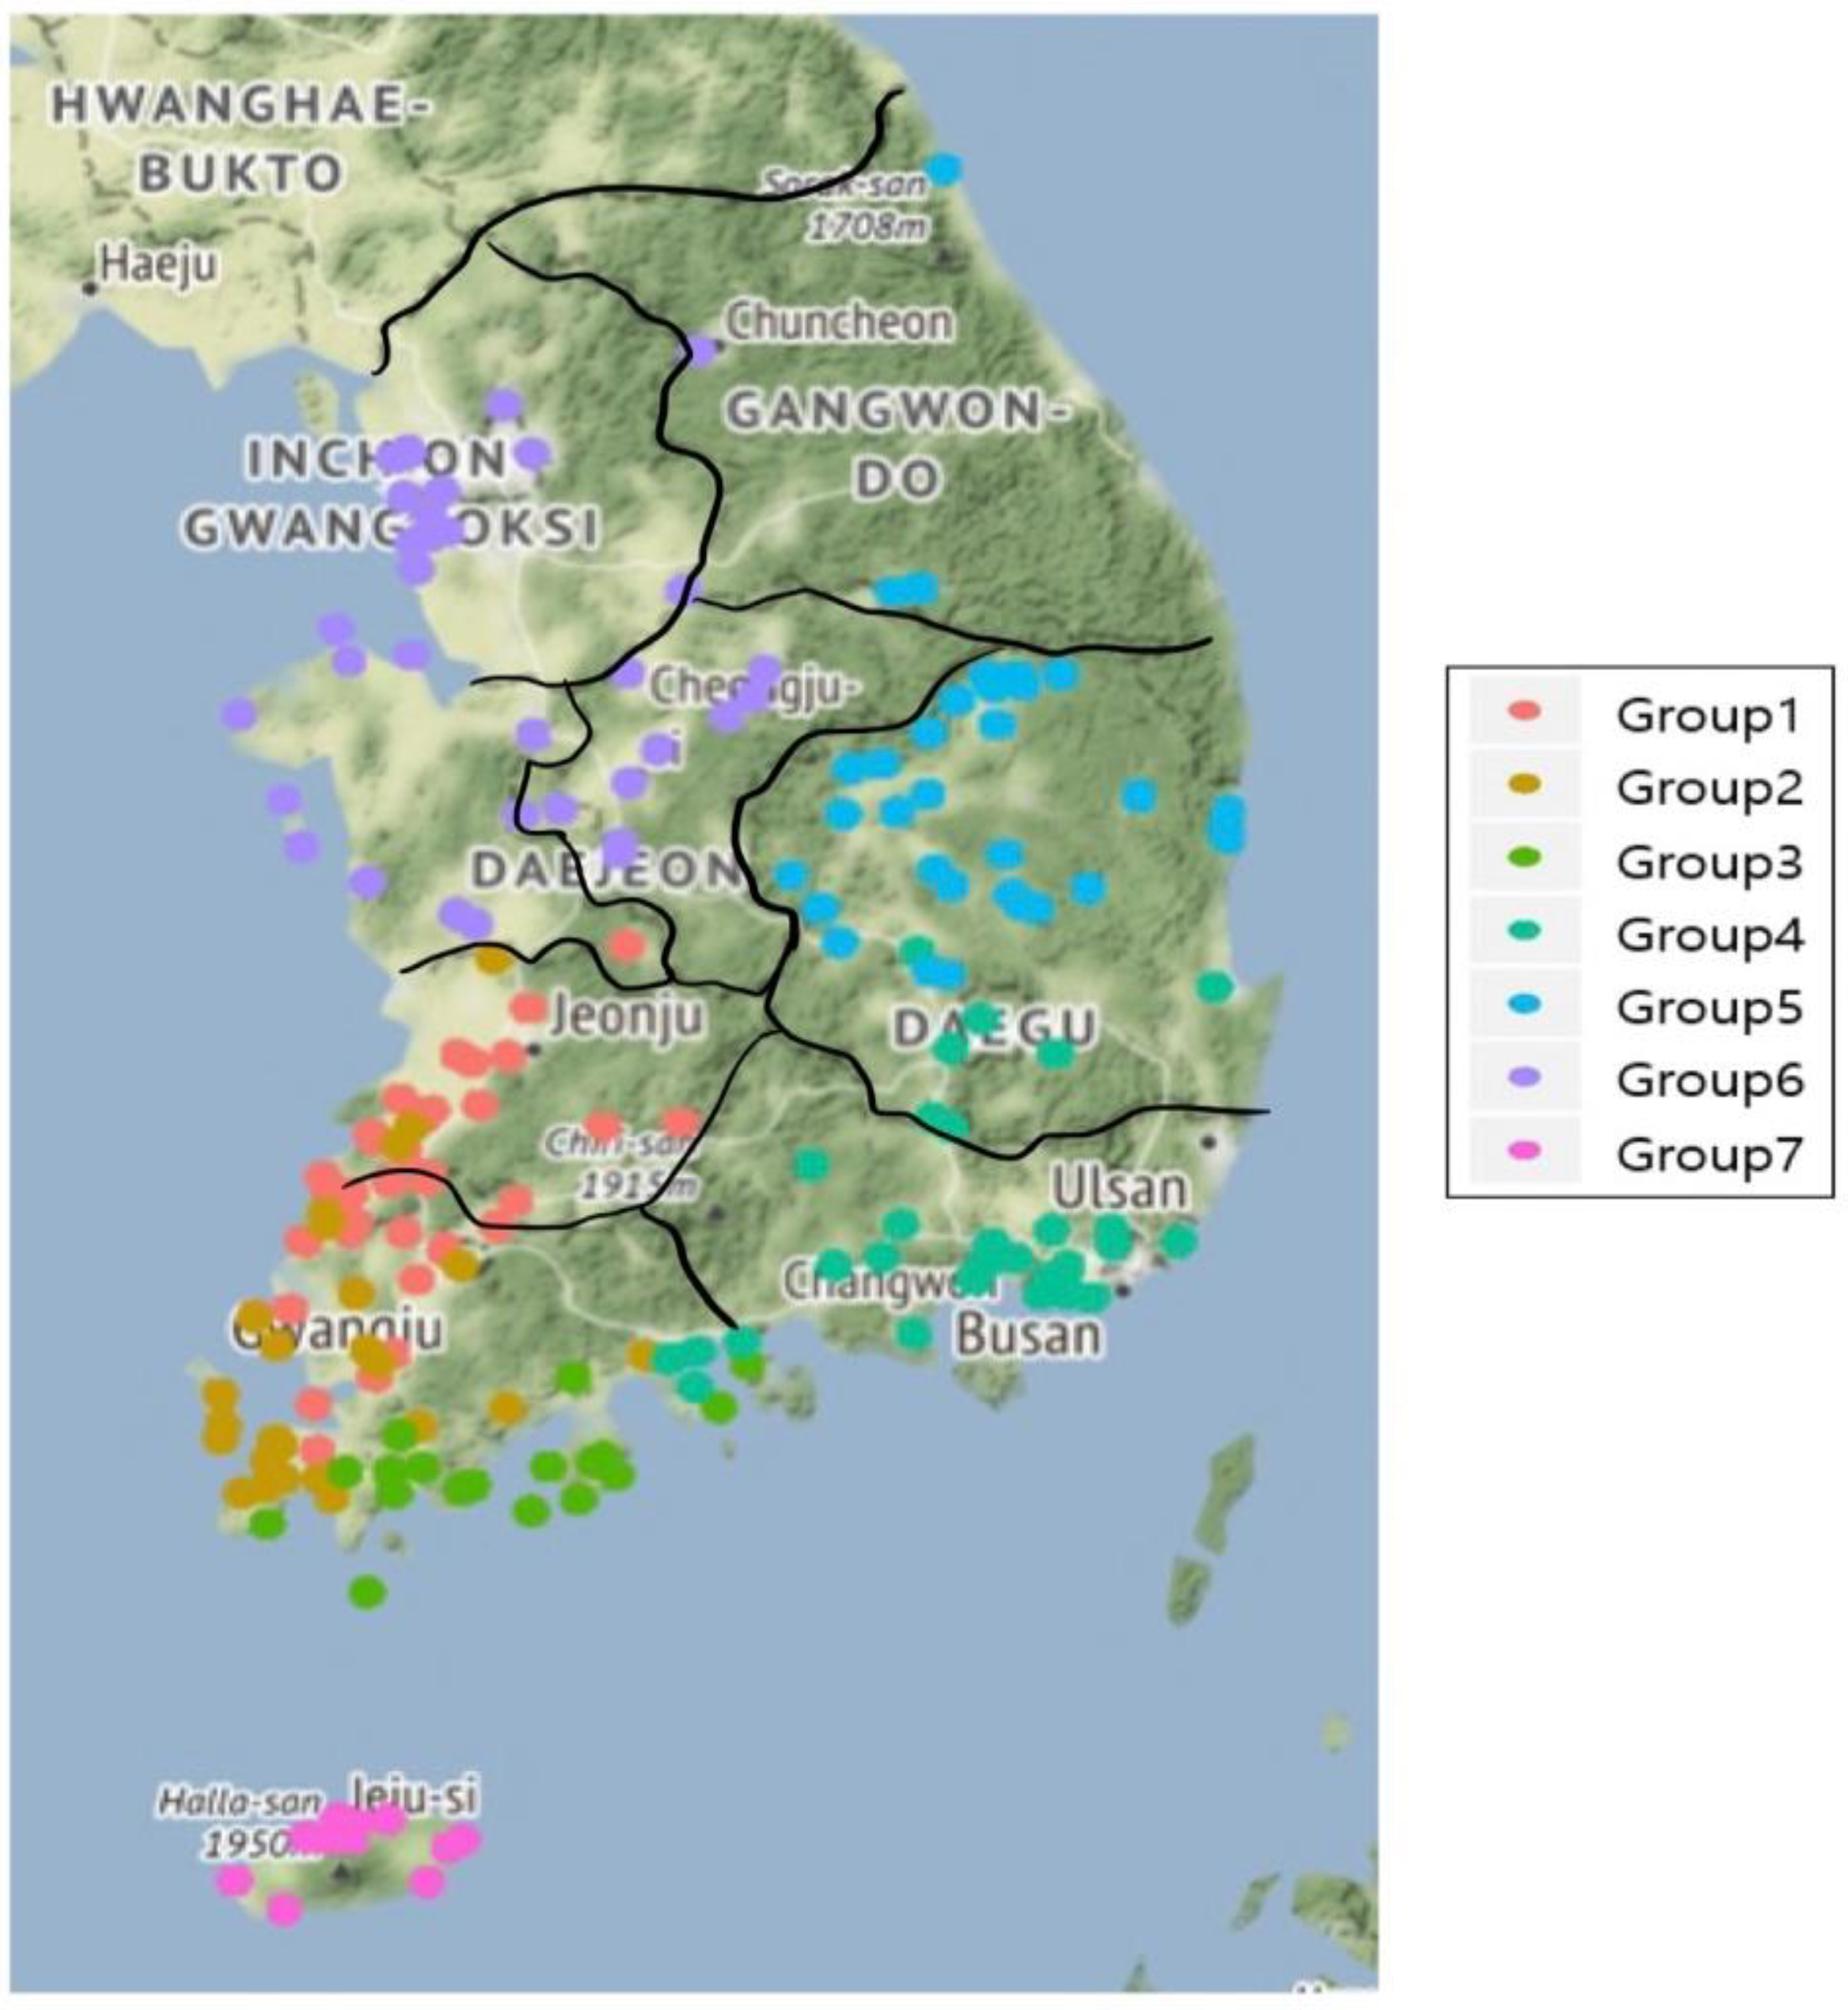
Figure 5 shows the clusters, presented in different colors, on a map showing the latitude and longitude of the power plants, and Table 1 lists the number of plants and regions associated with each of the seven clusters.
Figure 5.
Results of cluster mapping.
Table 1.
The numbers of solar power plants and regions of the seven groups.
As a result of mapping the plants by cluster, we determined that clustering results are divided by region. The first group contains 45 power plants mainly in Jeollabuk-do. The second group includes 37 power plants in Jeollanam-do near the West Sea, and the third group has 22 power plants in Jeollanam-do, near to the South Sea. The fourth group consists of 30 power plants in Gyeongsangnam-do and the fifth group contains 34 power plants in Gyeongsangbuk-do and Gangwon-do. The sixth group includes 36 power plants in Seoul, Gyeonggi-do, and Chungcheong-do. The seventh group is comprised of 11 power plants on Jeju Island.
3.2. Construction of a Regional Photovoltaic Power Prediction System
The VAR and ARIMA models were used for time-series analysis, and the prediction period for the model ranged from 1 to 3 h. The forecasting model based on VAR contained seven forecast models, representing each cluster, while 215 forecast models representing individual power plants were constructed for the ARIMA model.
3.2.1. VAR
Table 2 shows the results of varying the p-value to explore the appropriate VAR(p) model for Group 2 along with AIC and SBC values. As shown in Table 2, the VAR model most suitable for Group 2 is the VAR (2) model, which has the lowest SBC value. Although the VAR (5) model has the smallest AIC value, based on the principle of parsimony, the simpler model of VAR (2) is preferred over the VAR (5) model.
Table 2.
Fitting results for p of the VAR model for Group 2.
Table 3 presents the result of VAR model construction for each group obtained using a training dataset from 1 January 2014, to 31 December 2015. The optimal VAR model was selected using AIC and SBC. Table 3 lists the results of VAR model selection for each group based on AIC and SBC.
Table 3.
Results of VAR model selection for each cluster.
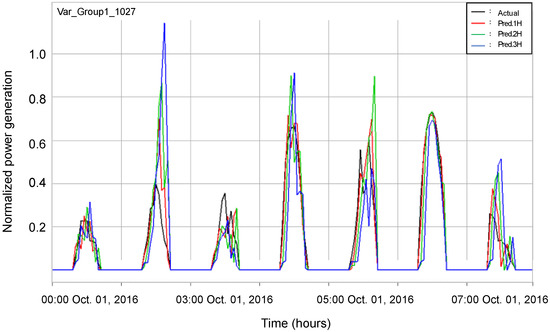
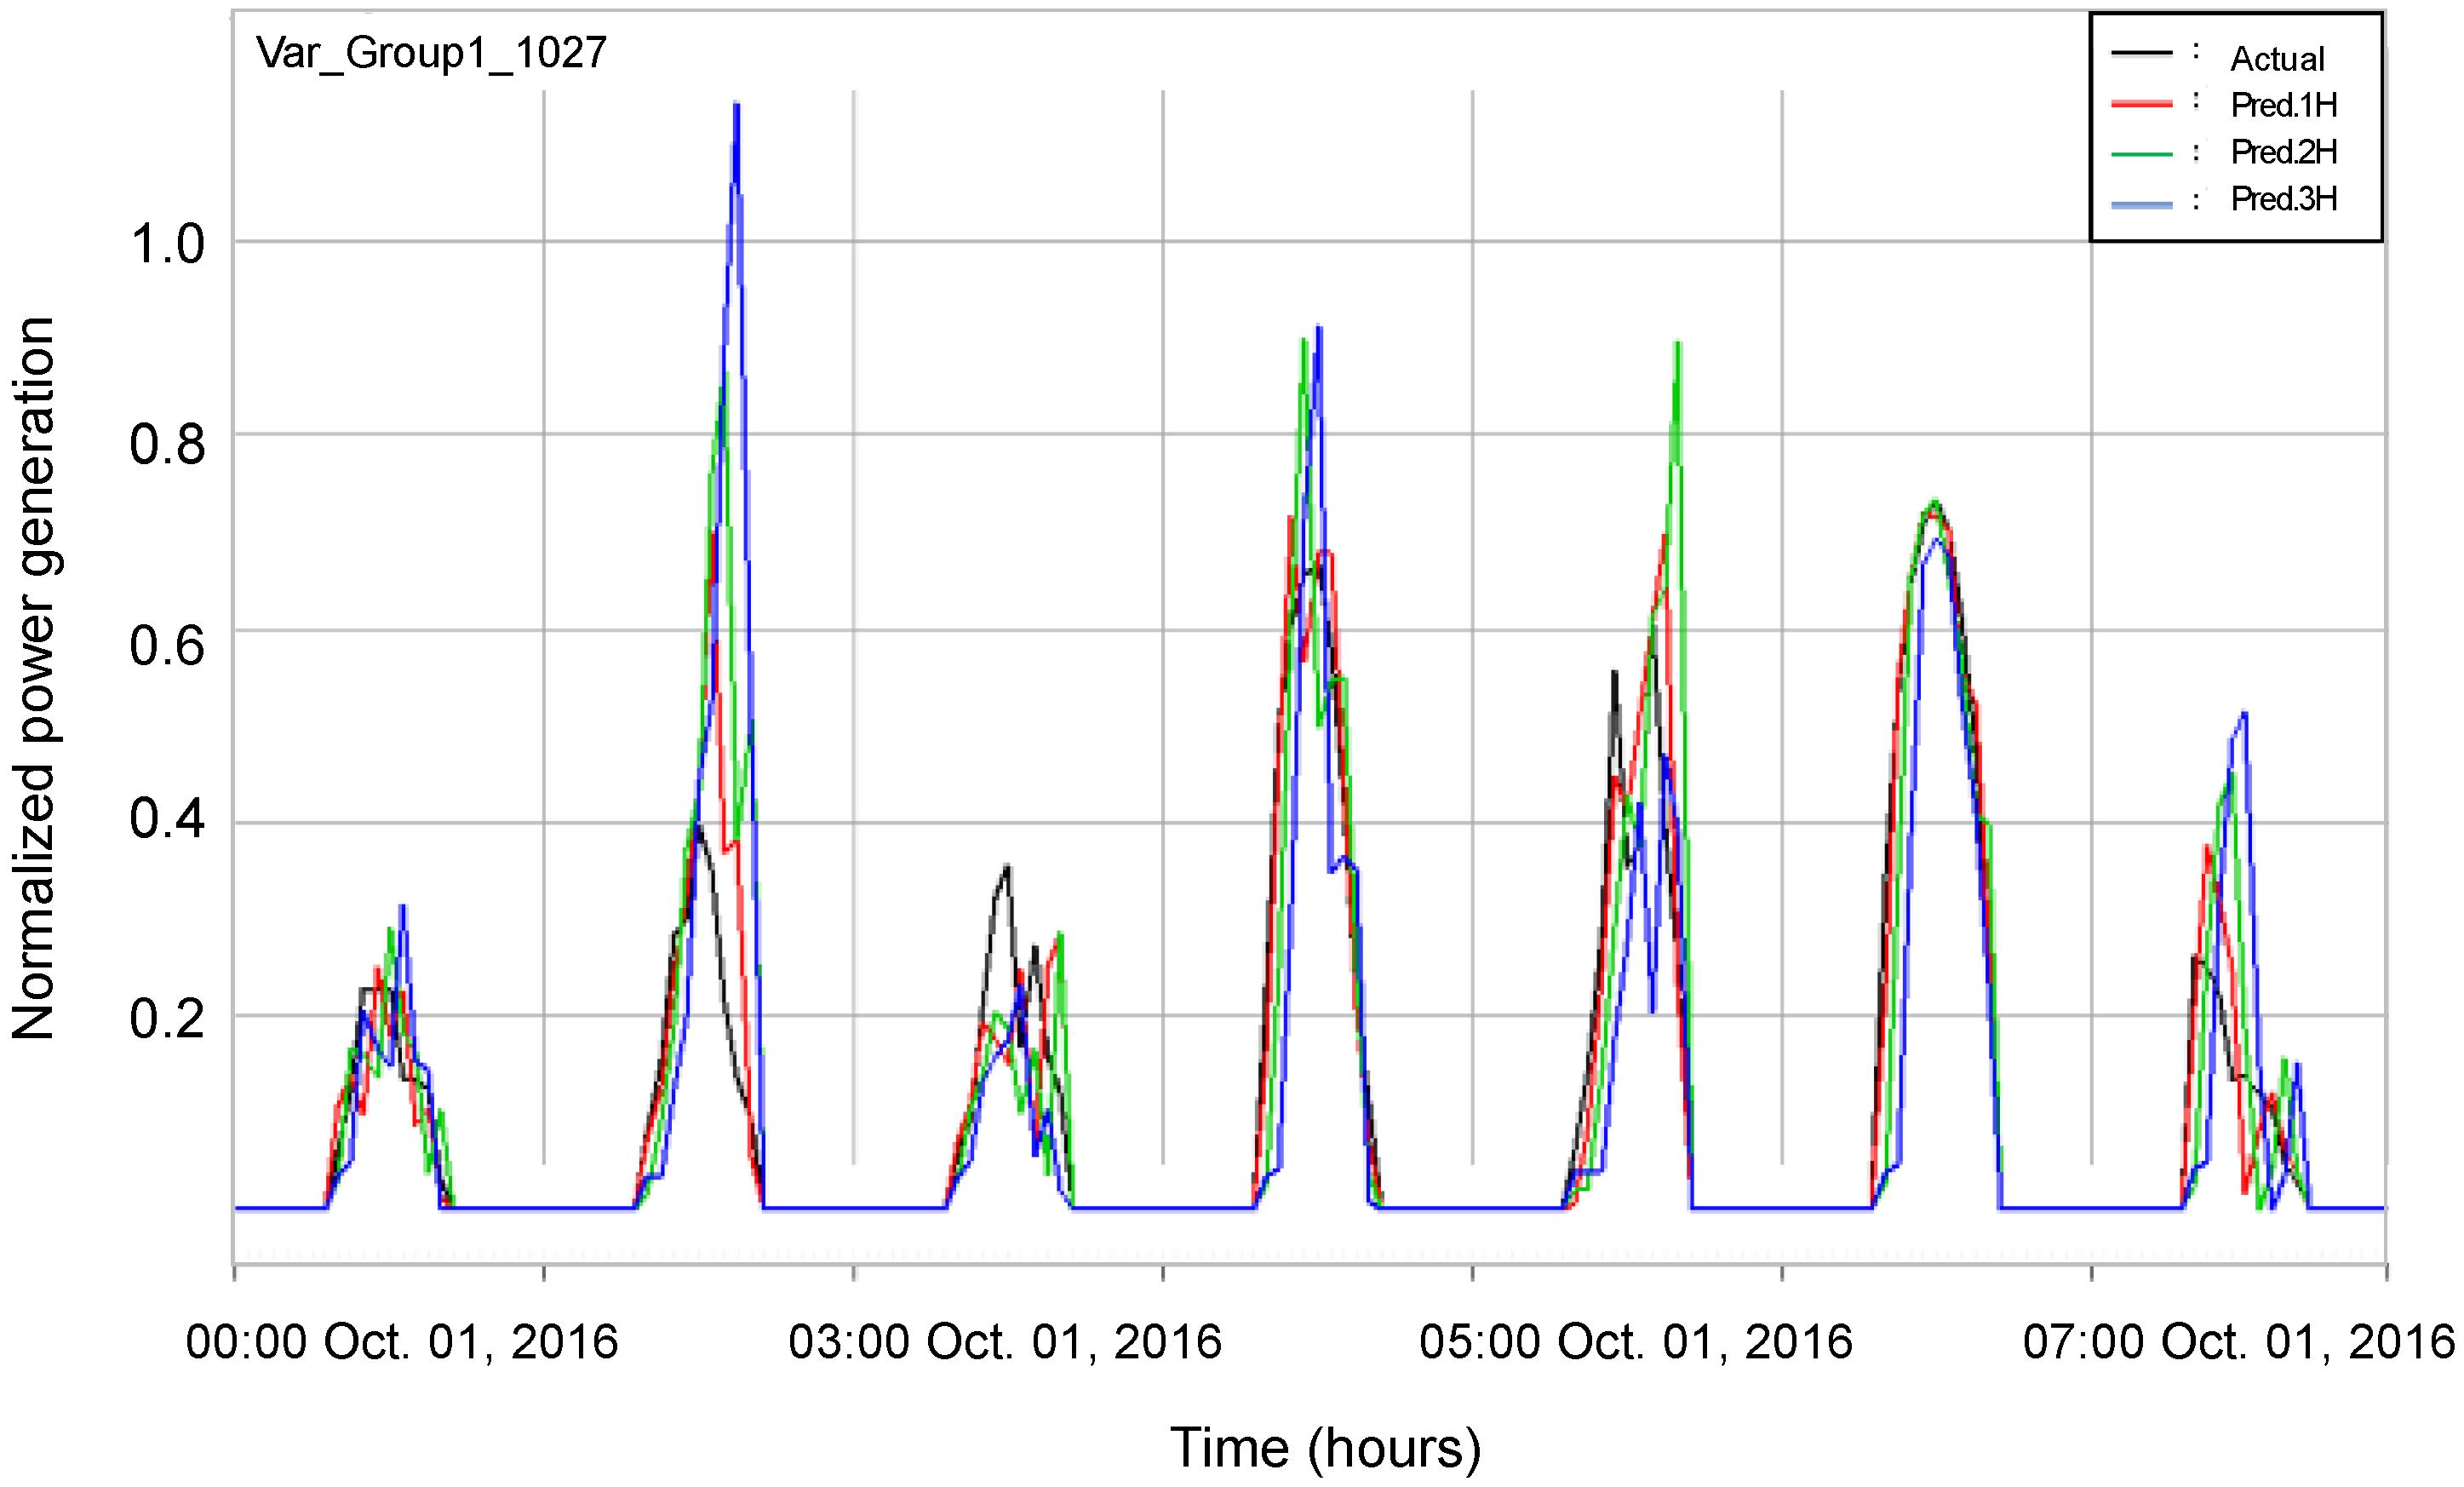
Figure 6 is a time-series plot comparing values predicted using the VAR model from 00:00 on 1 October 2016, to 23:00 on 7 October 2016. The black line represents actual observations, the red line represents the 1 h predicted values calculated using the model, the green line represents the 2 h predicted values, and the blue line represents the 3 h predicted values.
Figure 6.
Time-series plot comparing values predicted using the VAR model from 00:00 on 1 October 2016, to 23:00 on 7 October 2016.
3.2.2. ARIMA
The statistical model fit discrimination measures, AIC and SBC, were used to determine the p, d, and q values of the ARIMA (p,d,q) model. Lower results for both AIC and SBC indicate a better model fit. Table 4 shows the results of ARIMA model construction using the training dataset from 1 January 2014, to 31 December 2015 at power plant #9289 in Group 2. As shown in Table 4, the most suitable ARIMA model for solar power plant #9289 was the ARIMA model with the lowest AIC and SBC values. Table 5 presents the results of ARIMA model fitting for solar power plants with their frequencies in each cluster.
Table 4.
Fitting of p, d, q of the ARIMA model for power plant #9289.
Table 5.
Frequencies of ARIMA model results for solar power plants in each cluster.
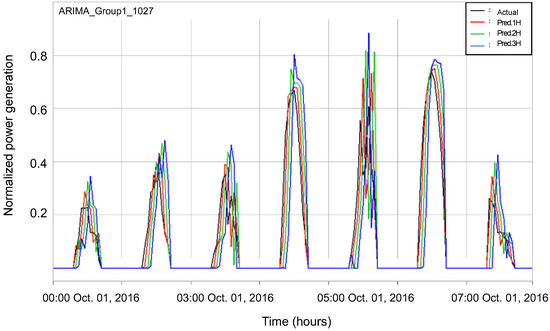
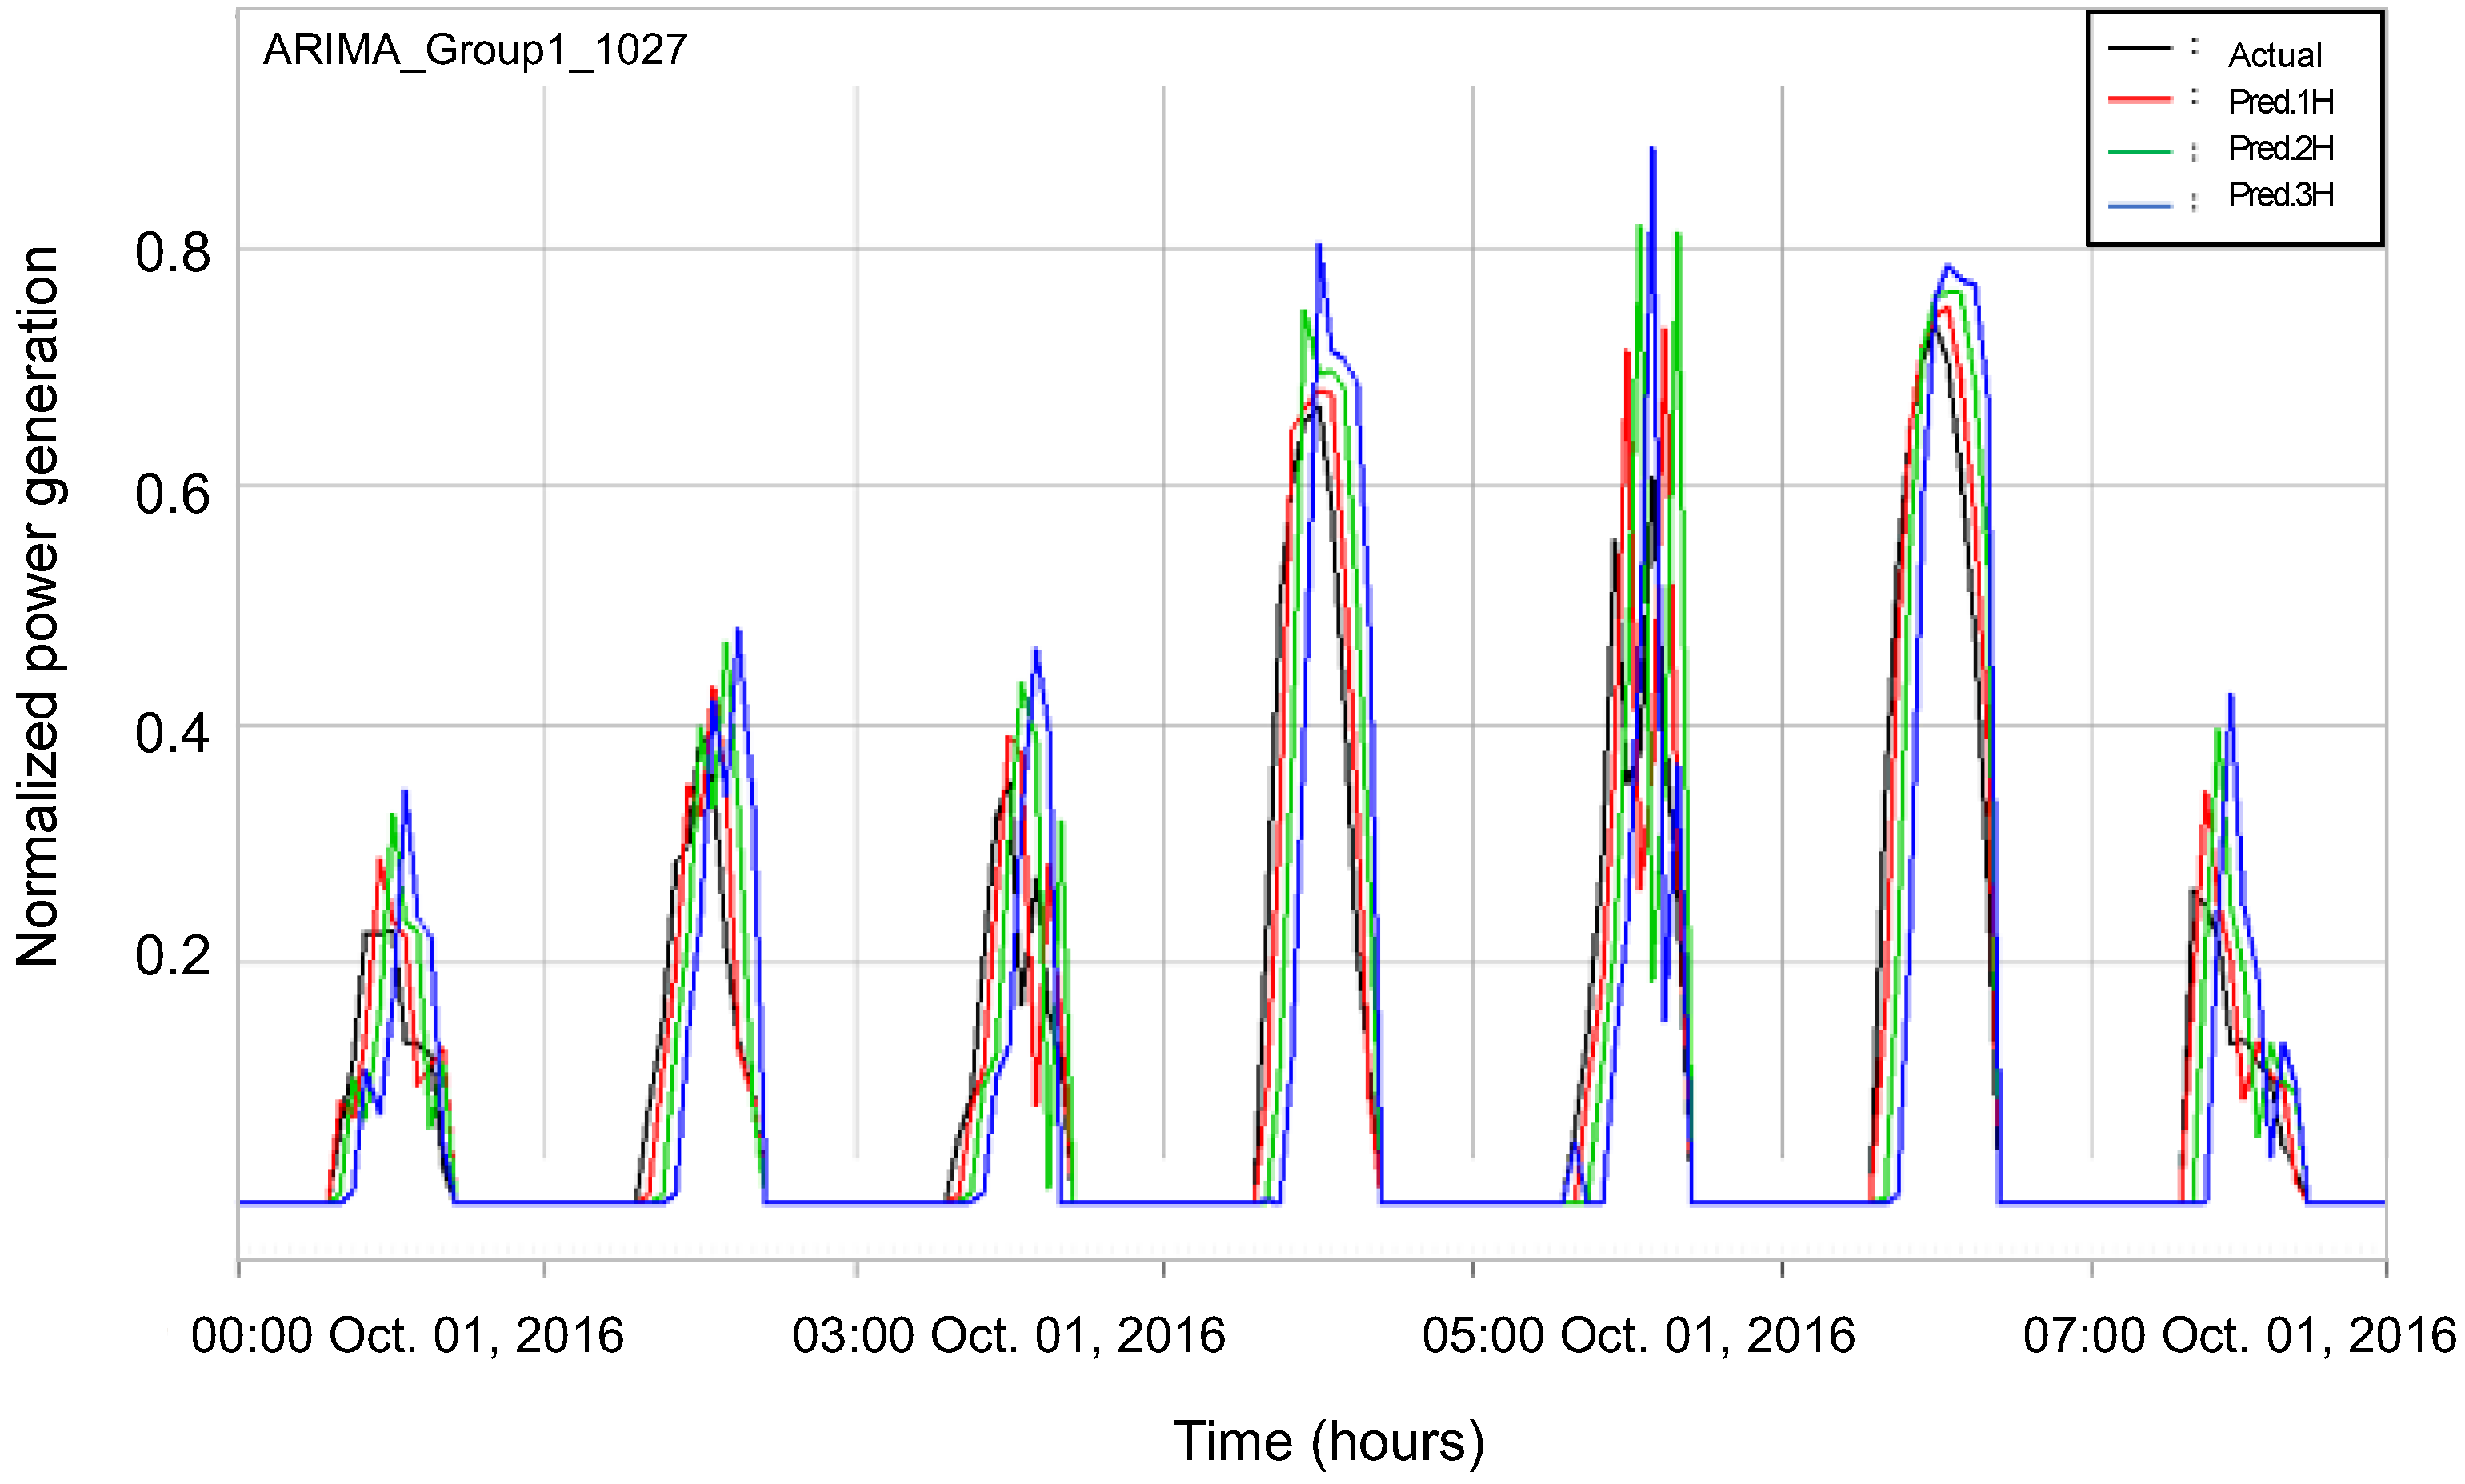
Figure 7 is a time-series plots comparing predicted values using the ARIMA model from 00:00 on 1 October 2016, to 23:00 on 7 October 2016. The black line represents actual observation, the red line represents the 1 h predicted values calculated using the model, the green line represents the 2 h predicted values, and the blue line represents the 3 h predicted values.
Figure 7.
Time-series plot comparing values predicted using the ARIMA model from 00:00 on 1 October 2016, to 23:00 on 7 October 2016.
3.3. Evaluation
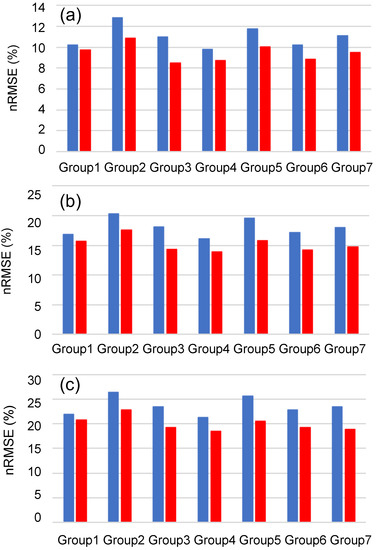
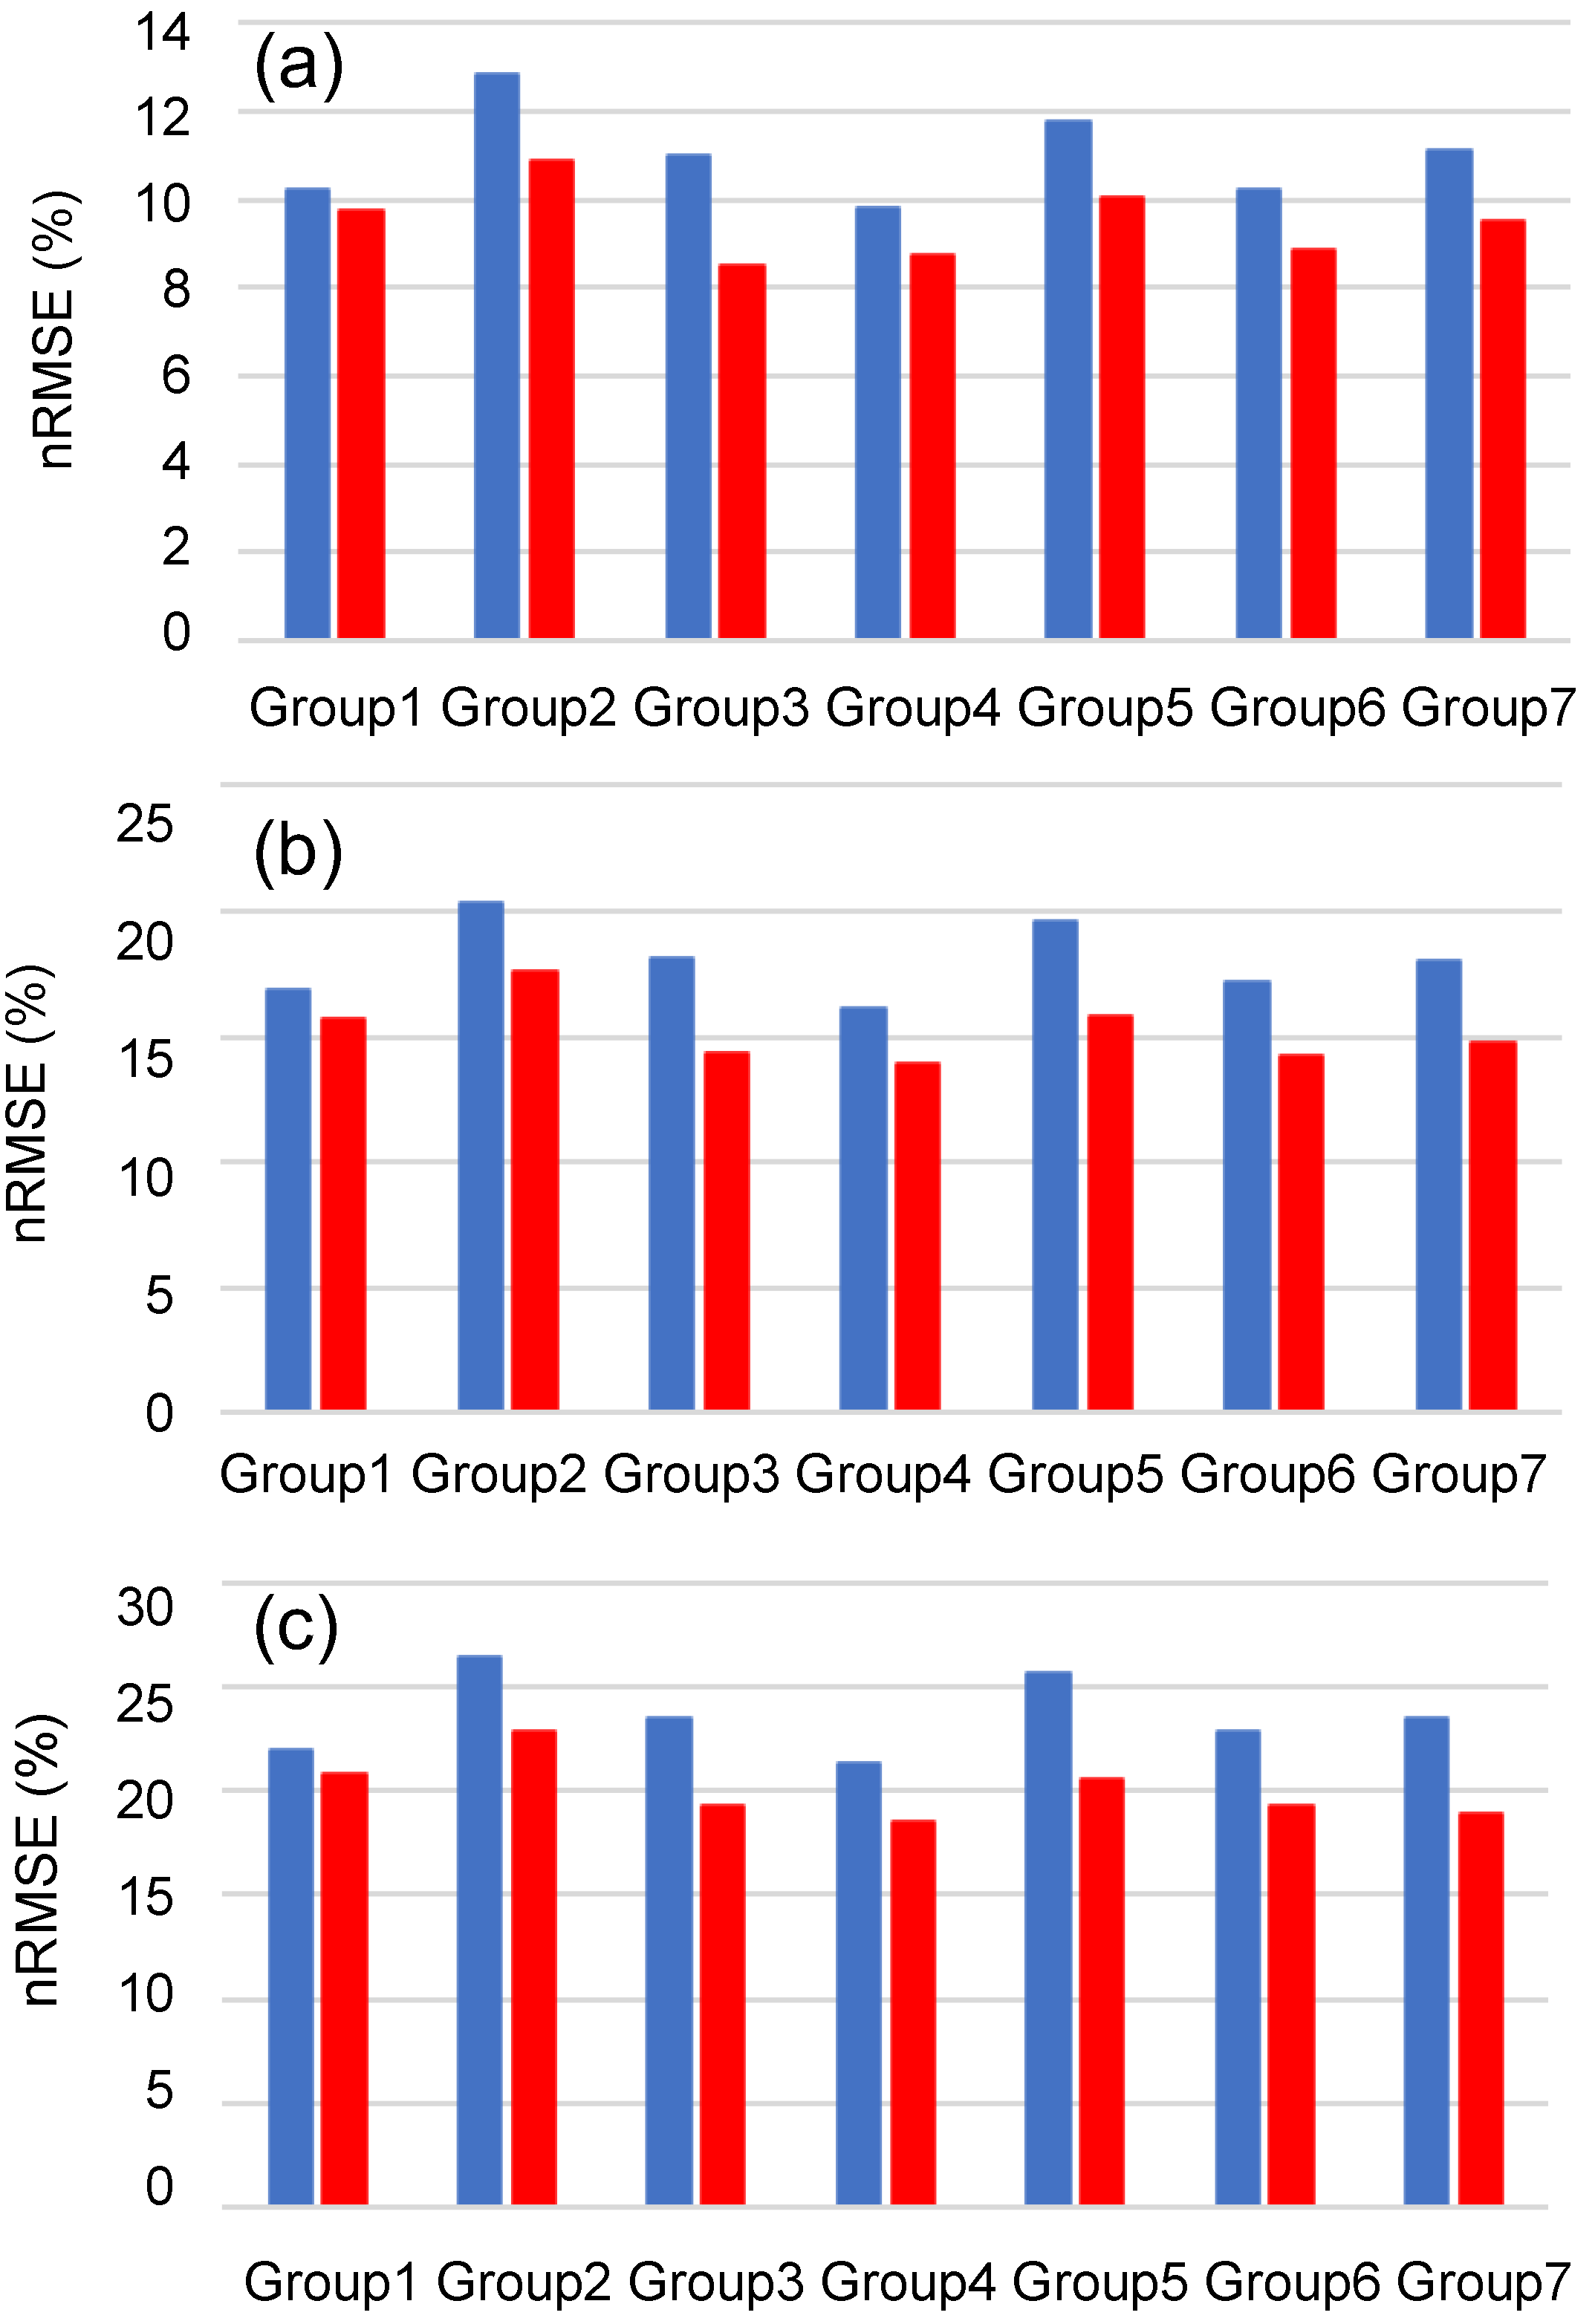
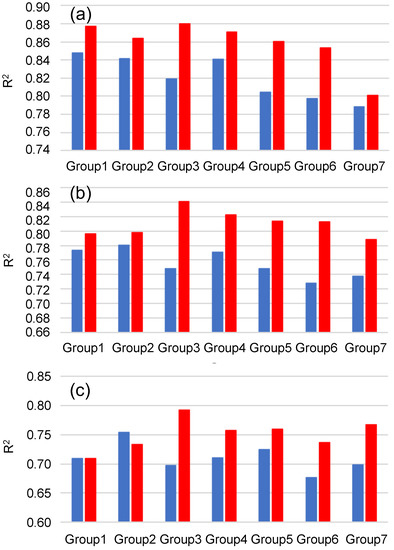
Predicted solar power generation levels for 1 to 3 h horizons were evaluated from 00:00 on 1 January 2016 to 23:00 on 31 December 2016. Table 6 and Table 7 compare the VAR model and ARIMA model based on nRMSE and values, which are calculated from comparison of predicted values for 1 to 3 h in advance with actual observations. Table 6 and Table 7 present the p-values obtained from Student’s t-test to identify significance between the prediction errors of the VAR and ARIMA models. Figure 8 and Figure 9 show bar plots of nRMSE and for 1 to 3-h advance predictions obtained from the VAR and ARIMA models.
Table 6.
Comparison of the VAR and ARIMA models based on nRMSE for 1–3 h advance power forecasting.
Table 7.
Comparison of the VAR and ARIMA models based on for 1–3 h advance power forecasting.
Figure 8.
nRMSE bar plot comparing the VAR and ARIMA models for (a) 1 h, (b) 2 h, and (c) 3 h advance forecasting, respectively. Blue and red indicate error statistics obtained from the VAR and ARIMA forecasting models, respectively.
Figure 9.
bar plot comparing VAR and ARIMA models for (a) 1 h, (b) 2 h, and (c) 3 h advance forecasting, respectively. Blue and red indicate error statistics obtained from the VAR and ARIMA forecasting model, respectively.
In all clusters, the prediction errors were smaller for the VAR model than the ARIMA model for 1, 2, and 3 h advance prediction of solar power generation values. In addition, values were higher for the VAR model than the ARIMA model for 1, 2, and 3 h advance prediction of solar power generation prediction. This pattern suggests that the VAR model is more suitable than the ARIMA model for forecasting solar power generation 1 to 3 h in advance.
The forecasting model constructed for the seven clustered regions showed slightly different prediction results than the VAR model. To investigate the possible causes of this difference, the properties of solar resources were compared. Groups 2 and 3 showed the worst and best model performance, respectively. Group 3 prediction had relatively good accuracy, with smaller nRMSE and larger than the corresponding average values. Averaged hourly variation in irradiance was 0.378–0.402 kWh for Group 3. On the other hands, Group 2 showed larger nRMSE and smaller R2 than other groups for 1 to 3 h prediction times. Averaged hourly variation in irradiance was 0.374–0.774 kWh for Group 2. Group 2 also exhibited greater spatial variation in hourly changes in irradiance than Group 3. Thus, VAR performance may be affected by regional differences in the spatiotemporal variation in hourly solar resources.
4. Summary and Conclusions
We developed a regional solar power generation model for short-term forecasting using time-series data for 215 operational power plants throughout Korea from 2014 to 2016. For Korean power system management, two types of VAR model, namely VAR (2) and VAR (3), were proposed for seven regions. Solar power can be accurately predicted using VAR, even when few models are constructed. The VAR model showed better predictability than the ARIMA model in terms of both qualitative and quantitation error statistics. The nRMSE values for hourly power generation obtained from the VAR model were 8.5–10.9% and 18.5–22.8% for 1 and 3 h forecasting horizons, respectively. In contrast, ARIMA had nRMSE values of 9.8–13.0% and 21.3–26.3% for 1 and 3 h forecasting horizons, respectively. Correlation values were 4–5% higher for the VAR model than the ARIMA model. The VAR model reflects the correlation of predicted values with previous solar power generation data as well as their correlation with solar power in adjacent areas, thereby providing more accurate predictions when sufficient data are available. This difference makes VAR highly suitable for constructing solar power generation forecast models. In this regard, VAR provides benefit of a stable power management, intuitive analysis and high predictive accuracy.
In the future, we plan to study the following topics. Due to the climatic of Korea, the patterns of solar radiation and solar power generation are strongly affected by seasonal changes. In addition, the regional presence of clouds affects solar radiation and solar power generation. Therefore, to improve the accuracy of solar radiation and solar power generation prediction model, a VAR model that considers seasonality or a prediction model in the form of a transition function including the presence of clouds as an exogenous variable should be used. Photovoltaic system operation in relation to various solar radiation parameters requires consideration in future advanced forecasting models, as suggested previously [30]. Recent research trends on solar radiation and solar power generation prediction show that both time-series and machine learning methods are applicable. Thus, more accurate predictions may be obtained using machine learning in future studies.
Author Contributions
Conceptualization, J.-Y.K. and Y.-S.L.; methodology, A.-H.J., D.-H.L. and Y.-S.L.; software, A.-H.J. and D.-H.L.; validation, Y.-S.L.; formal analysis, A.-H.J., D.-H.L. and Y.-S.L.; investigation, C.K.K. and Y.-S.L.; resources, J.-Y.K. and H.-G.K.; data curation, J.-Y.K. and C.K.K.; writing—original draft preparation, A.-H.J.; writing—review and editing, J.-Y.K. and Y.-S.L.; visualization, A.-H.J. and D.-H.L.; supervision, Y.-S.L.; project administration, H.-G.K. and Y.-S.L.; funding acquisition, H.-G.K. and Y.-S.L. All authors have read and agreed to the published version of the manuscript.
Funding
This work was conducted under framework of the research and development program of the Korea Institute of Energy Research (C2-2410) and Yung-Seop Lee’s work was supported by the National Research Foundation of Korea (NRF) grant funded by the Korea government (MSIT) (No. NRF-2021R1A2C1007095).
Data Availability Statement
Not applicable.
Conflicts of Interest
The authors declare no conflict of interest.
References
- European Commission (EU). REPowerEU: Affordable, Secure and Sustainable Energy for Europe. Publishing EUweb. Available online: https://ec.europa.eu/info/strategy/priorities-2019-2024/european-green-deal/repowereu-affordable-secure-and-sustainable-energy-europe_en (accessed on 13 October 2022).
- International Energy Association (IEA). Korea Renewable Energy 3020 Plan. Publishing IEAweb. Available online: https://gggi.org/wp-content/uploads/2018/10/Presentation-by-Mr.-Kyung-ho-Lee-Director-of-the-New-and-Renewable-Energy-Policy-Division-MOTIE.pdf (accessed on 13 October 2022).
- Wang, Y.; Feng, B.; Hua, Q.-S.; Sun, L. Short-term solar power forecasting: A combined long short-term memory and gaussian process regression method. Sustainability 2021, 13, 3665. [Google Scholar] [CrossRef] [Scilit]
- Poudyal, R.; Loskot, P.; Parajuli, R. Techno-economic feasibility analysis of a 3-kW PV system installation in Nepal. Renew. Wind Water Sol. 2021, 8, 4182. [Google Scholar] [CrossRef] [Scilit]
- Impram, S.; Nese, S.V.; Oral, B. Challenges of renewable energy penetration on power system flexibility: A survey. Energy Strategy Rev. 2020, 31, 100539. [Google Scholar] [CrossRef] [Scilit]
- Wu, Y.-K.; Chen, C.-R.; Rahman, H.A. A novel hybrid model for short-term forecasting in PV power generation. Int. J. Photoenergy 2014, 2014, 569249. [Google Scholar] [CrossRef] [Scilit]
- Bouzerdoum, M.; Mellit, A.; Massi Pavan, A. A hybrid model (SARIMA–SVM) for short-term power forecasting of a small-scale grid-connected photovoltaic plant. Solar Energy 2013, 98, 226–235. [Google Scholar] [CrossRef] [Scilit]
- Antonanzas, J.; Osorio, N.; Escobar, R.; Urraca, R.; Martinez-de-Pison, F.J.; Antonanzas-Torres, F. Review of photovoltaic power forecasting. Solar Energy 2016, 136, 78–111. [Google Scholar] [CrossRef] [Scilit]
- Huang, R.; Huang, T.; Gadh, R.; Li, L. Solar generation prediction using the ARMA model in a laboratory-level micro-grid. In Proceedings of the 2012 IEEE Third International Conference on Smart Grid Communications (SmartGridComm), Tainan, Taiwan, 5–8 November 2012; pp. 528–533. [Google Scholar]
- Kim, S. A study on solar irradiance forecasting with weather variables. Korean J. Appl. Stat. 2017, 30, 1005–1013. (In Korean) [Google Scholar]
- Raza, M.Q.; Nadarajah, M.; Ekanayake, C. On recent advances in PV output power forecast. Solar Energy 2016, 136, 125–144. [Google Scholar] [CrossRef] [Scilit]
- Reikard, G. Predicting solar radiation at high resolutions: A comparison of time series forecasts. Solar Energy 2009, 83, 342–349. [Google Scholar] [CrossRef] [Scilit]
- Samanta, M.; Bharath, K.S.; Jayesh, B.Y. Short-Term Power Forecasting of Solar PV Systems Using Machine Learning Techniques. Environ. Sci. Comput. Sci. 2014, 2014, 18566286. [Google Scholar]
- Wang, L.; Hu, H.; Ai, X.-Y.; Liu, H. Effective electricity energy consumption forecasting using echo state network improved by differential evolution algorithm. Energy 2018, 153, 801–815. [Google Scholar] [CrossRef] [Scilit]
- Kushwaha, V.; Pindoriya, N.M. A SARIMA-RVFL hybrid model assisted by wavelet decomposition for very short-term solar PV power generation forecast. Renew. Energy 2019, 140, 124–139. [Google Scholar] [CrossRef] [Scilit]
- Fara, L.; Diaconu, A.; Craciunescu, D.; Fara, S. Forecasting of Energy Production for Photovoltaic Systems Based on ARIMA and ANN Advanced Models. Int. J. Photoenergy 2021, 2021, 6777488. [Google Scholar] [CrossRef] [Scilit]
- Potter, C.W.; Negnevitsky, M. Very short-term wind forecasting for Tasmanian power generation. IEEE Trans. Power Syst. 2006, 21, 965–972. [Google Scholar] [CrossRef] [Scilit]
- Barbounis, T.G.; Theocharis, J.B.; Alexiadis, M.C.; Dokopoulos, P.S. Long-term wind speed and power forecasting using local recurrent neural network models. IEEE Trans. Energy Convers. 2006, 21, 273–284. [Google Scholar] [CrossRef] [Scilit]
- Barbounis, T.G.; Theocharis, J.B. A locally recurrent fuzzy neural network with application to the wind speed prediction using spatial correlation. Neurocomputing 2007, 70, 1525–1542. [Google Scholar] [CrossRef] [Scilit]
- Bui, L.D.; Nguyen, N.Q.; Doan, B.V.; Sanseverino, E.R. Forecasting energy output of a solar power plant in curtailment condition based on LSTM using P/GHI coefficient and validation in training process, a case study in Vietnam. Electr. Power Syst. Res. 2022, 2013, 2–582. [Google Scholar] [CrossRef] [Scilit]
- Alkhayat, G.; Hasan, S.-H.; Mehmood, R. Senergy: A Novel Deep Learning-Based Auto-Selective Approach and Tool for Solar Energy Forecasting. Energies 2022, 15, 6659. [Google Scholar] [CrossRef] [Scilit]
- Kuo, W.-C.; Chen, C.-H.; Chen, S.-Y.; Wang, C.-C. Deep learning neural networks for short-term PV Power Forecasting via Sky Image method. Energies 2022, 15, 4779. [Google Scholar] [CrossRef] [Scilit]
- Wentz, V.H.; Maciel, J.N.; Ledesma, J.J.G.; Junior, O.H.A. Solar Irradiance Forecasting to Short-Term PV Power: Accuracy Comparison of ANN and LSTM Models. Energies 2022, 15, 2457. [Google Scholar] [CrossRef] [Scilit]
- Akhter, M.N.; Mekhilef, S.; Mokhlis, H.; Almohaimeed, Z.M.; Muhammad, M.A.; Kahiruddin, A.S.M.; Akram, R.; Hussain, M.M. An Hour-Ahead PV Power Forecasting Method Based on an RNN-LSTM Model for Three Different PV Plants. Energies 2022, 15, 2243. [Google Scholar] [CrossRef] [Scilit]
- Baile, R.; Muzy, J.F.; Poggi, P. Short-term forecasting of surface layer wind speed using a continuous random cascade model. Wind Energy 2011, 14, 719–734. [Google Scholar] [CrossRef] [Scilit]
- Davò, F.; Alessandrini, S.; Sperati, S.; Menache, L.D.; Airoldi, D.; Vespucci, M.T. Post-processing techniques and principal component analysis for regional wind power and solar irradiance forecasting. Solar Energy 2016, 134, 327–338. [Google Scholar] [CrossRef] [Scilit]
- Das, S. Short term forecasting of solar radiation and power output of 89.6 kWp solar PV power plant. Mater. Today Proc. 2021, 39, 1959–1969. [Google Scholar] [CrossRef] [Scilit]
- Dong, J.; Olama, M.M.; Kuruganti, T.; Lelin, A.M.; Djouadi, S.M.; Zhang, Y.; Xue, Y. Novel stochastic methods to predict short-term solar radiation and photovoltaic power. Renew. Energy 2019, 145, 333–346. [Google Scholar] [CrossRef] [Scilit]
- Akaike, H. A new look at the statistical model identification. IEEE Trans. Autom. Control 1974, 19, 716–723. [Google Scholar] [CrossRef] [Scilit]
- Libra, M.; Beránekb, V.; Sedláčeka, J.; Pouleka, V.; Tyukhov, I.I. Roof photovoltaic power plant operation during the solar eclipse. Sol. Energy 2016, 140, 109–112. [Google Scholar] [CrossRef] [Scilit]

Publisher’s Note: MDPI stays neutral with regard to jurisdictional claims in published maps and institutional affiliations. |
© 2022 by the authors. Licensee MDPI, Basel, Switzerland. This article is an open access article distributed under the terms and conditions of the Creative Commons Attribution (CC BY) license (https://creativecommons.org/licenses/by/4.0/).