


Abstract
A condition-based maintenance policy for offshore wind turbines is presented in consideration of the maintenance uncertainty and the weather effect. In this paper, the offshore wind turbine is divided into four main assemblies—namely, the rotor, gearbox, generator, and pitch system. The support vector machine classification technique is implemented to analyze the failure information, which was collected from field data in China. According to the results of fault diagnosis and prediction, the assembly that reaches the corresponding maintenance threshold will be repaired. At the same time, a maintenance opportunity occurs for the rest of the components, and an optimized plan can be determined by arranging the maintenance combination and time. The calculated results indicate that the proposed condition-based maintenance policy is beneficial to reduce the maintenance expenditure of offshore wind turbines.
1. Introduction
With the characteristics of stable wind energy resources, large power generation, and easy consumption, offshore wind energy has developed rapidly in recent years and has a broad market prospect [1,2]. Offshore wind energy has significant advantages compared with onshore. (1) Energy reserves are more than three times those of onshore wind. (2) Average available hours of offshore wind power are more than 3000 h per year, which is higher than the 2000 h of onshore wind power [3]. This happens because the offshore wind is more stable and the average wind speed is higher, which can meet the minimum wind speed requirements for longer time than onshore wind power. (3) The offshore wind turbine (OWT) has little impact on human life and is close to the coastal electricity concentration area, which is convenient for the supply of wind energy.
Despite the great potential of offshore wind power, its high risk of failure and serious consequences of failure pose challenges to safe and efficient energy development [4,5]. As an important wind energy collection and conversion equipment, OWTs are in a harsh climate, and the waves, tides, and other factors are complex and variable, resulting in the risk of failure changing with the increase of running time [6,7]. The design life of OWT is 20 years, and its cost of the operation and maintenance (O&M) occupy approximately 25–30% of the 75–90% of the investment costs or whole energy generation cost [8,9]. It can be explained by the following: (1) insufficient accessibility due to the unpredictable weather and the remote location; (2) compared with onshore ones, more failures owing to the oceanic environment, for example, storm surge, sea wave, sea ice; (3) extra inventory expense, specific vessels, and technicians are needed.
Risk control measures should analyze the influences of various factors such as safety, economy, and cost [10]. Under the traditional periodic maintenance and time-based maintenance methods, if the system conditions are acceptable when performing preventive maintenance work, it will cause a waste of the remaining life of the system, and if the system deteriorates faster than expected, a failure may occur. Recently, researches related to data-based wind turbines condition monitoring are proposed. Pandit et al. [11] presented a reference power curve using Supervisory Control And Data Acquisition (SCADA) datasets from a healthy turbine, which is developed by using a Gaussian Process and then was compared with a power curve from an unhealthy turbine. Yang et al. [12] studied a new condition monitoring method with the help of the concept of the transmissibility of Frequency Response Functions. Experiment of verification showed that the new technique is effective not only in damage detection but in damage location in certain conditions. With the continuous maturity of state monitoring, storage and analysis technologies, condition-based maintenance (CBM) is a solution of this problem and has become a hot issue in the field of risk control [13,14]. The CBM method focuses on the specific operating conditions of the system, evaluates the true state of the monitored equipment, overcomes the blindness of maintenance, and can effectively reduce accidental failures caused by insufficient maintenance and waste of resources due to over-maintenance. Simulation methods are usually used in studying the effect of CBM in any type of system [15]. Scheu et al. [16] presented a transparent risk-based methodology for the prioritization of OWT systems toward the application of condition monitoring systems. Calculated results contained information related to various kinds of wind turbines and substructure concepts. This work shows details of paths that leads to critical failure modes, which is the basis of designing a condition monitoring system. Shafiee et al. [17] proposed a CBM optimization model for a multi-blade fan system. The calculation results show that the CBM method can effectively reduce the maintenance cost. Ghamlouch et al. [18] proposed a method of condition-based maintenance strategy mainly adopting option theory, which solved the maintenance interval optimization problem of complex systems considering the uncertainty of production and deterioration. Verbert et al. [19] analyzed the multi-component problem of the research object and proposed a new CBM optimization method. Based on the analysis of economic correlation and structural correlation between components, the rational planning of maintenance tasks can be made to achieve system-level maintenance program optimization.
In terms of multi-component systems such as OWTs, whenever a component of the OWT system needs to be repaired, other components will be given the opportunity to repair in advance and form a certain number of group maintenance plans [20]. Opportunistic maintenance, often abbreviated as OM, has superiority in the following aspects: (1) it is critical for OWTs that joint maintenance processes only spend one portion of the fixed cost; (2) vessels, technicians, and tools are all maintenance resources that can also be in common use. Whereas, the preventative maintenance (usually abbreviated as PM) should not be conducted when the previous maintenance date results in the loss of assemblies. Regarding Remaining Useful Life (RUL), by comparing the maintenance costs corresponding to different grouping schemes, the best repair solution could be determined. Song et al. [21] introduced a two-stage framework to optimize the operation of offshore wind farms. Computational models were developed for opportunistic condition-based maintenance. Minimum maintenance costs are calculated and used to determine the schedule of periodic inspections. Pandit et al. [22] presented a support vector regression-based pitch curve, which was adopted in anomaly detection exploration. The comparative results in consideration of a binned pitch curve showed that the blade pitch curve closely follows the binned pitch curve, but above the rated wind speed. Zhou and Yin [23] formulated a dynamic opportunistic condition-based maintenance strategy. The varying maintenance lead-time effect on the maintenance decision was analyzed, which remarkably affects the maintenance cost. The comparative analysis illustrated the capability of the proposed strategy. Lu et al. [24] proposed a CBM optimization method for OWT systems in consideration of opportunities. An artificial neural network (ANN) was employed to analyze the RUL based on the system monitoring data. A comparative study was performed, and the feasibility of the presented approach was proved.
The objective of this paper is to achieve an optimized economy and availability by an opportunistic maintenance policy. First, we calculate the preventive repair threshold and the opportunity maintenance threshold from the parameters such as the lost shutdown loss, maintenance cost, and failure probability of the component. By comparing the support vector machine (SVM) fault prediction results with the maintenance thresholds, the components that need to be repaired at that time are identified, and finally the maintenance operation optimization scheme in the entire calculation interval is formed. The core idea of this method is to obtain the optimal repair time and maintenance combination by analyzing the correlation between components, so as to reduce the number of repairs and reduce the repair cost.
The following sections of the paper are organized as this: Section 2 presents the OWT system description. The fault diagnosis model based on SVM is introduced in Section 3. A case study is performed in Section 4, including the discussion of the results. Conclusions are addressed in the last section.
2. System Description of a Generic Offshore Wind Turbine
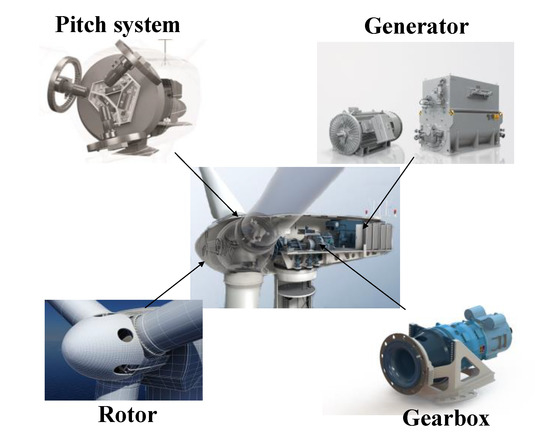
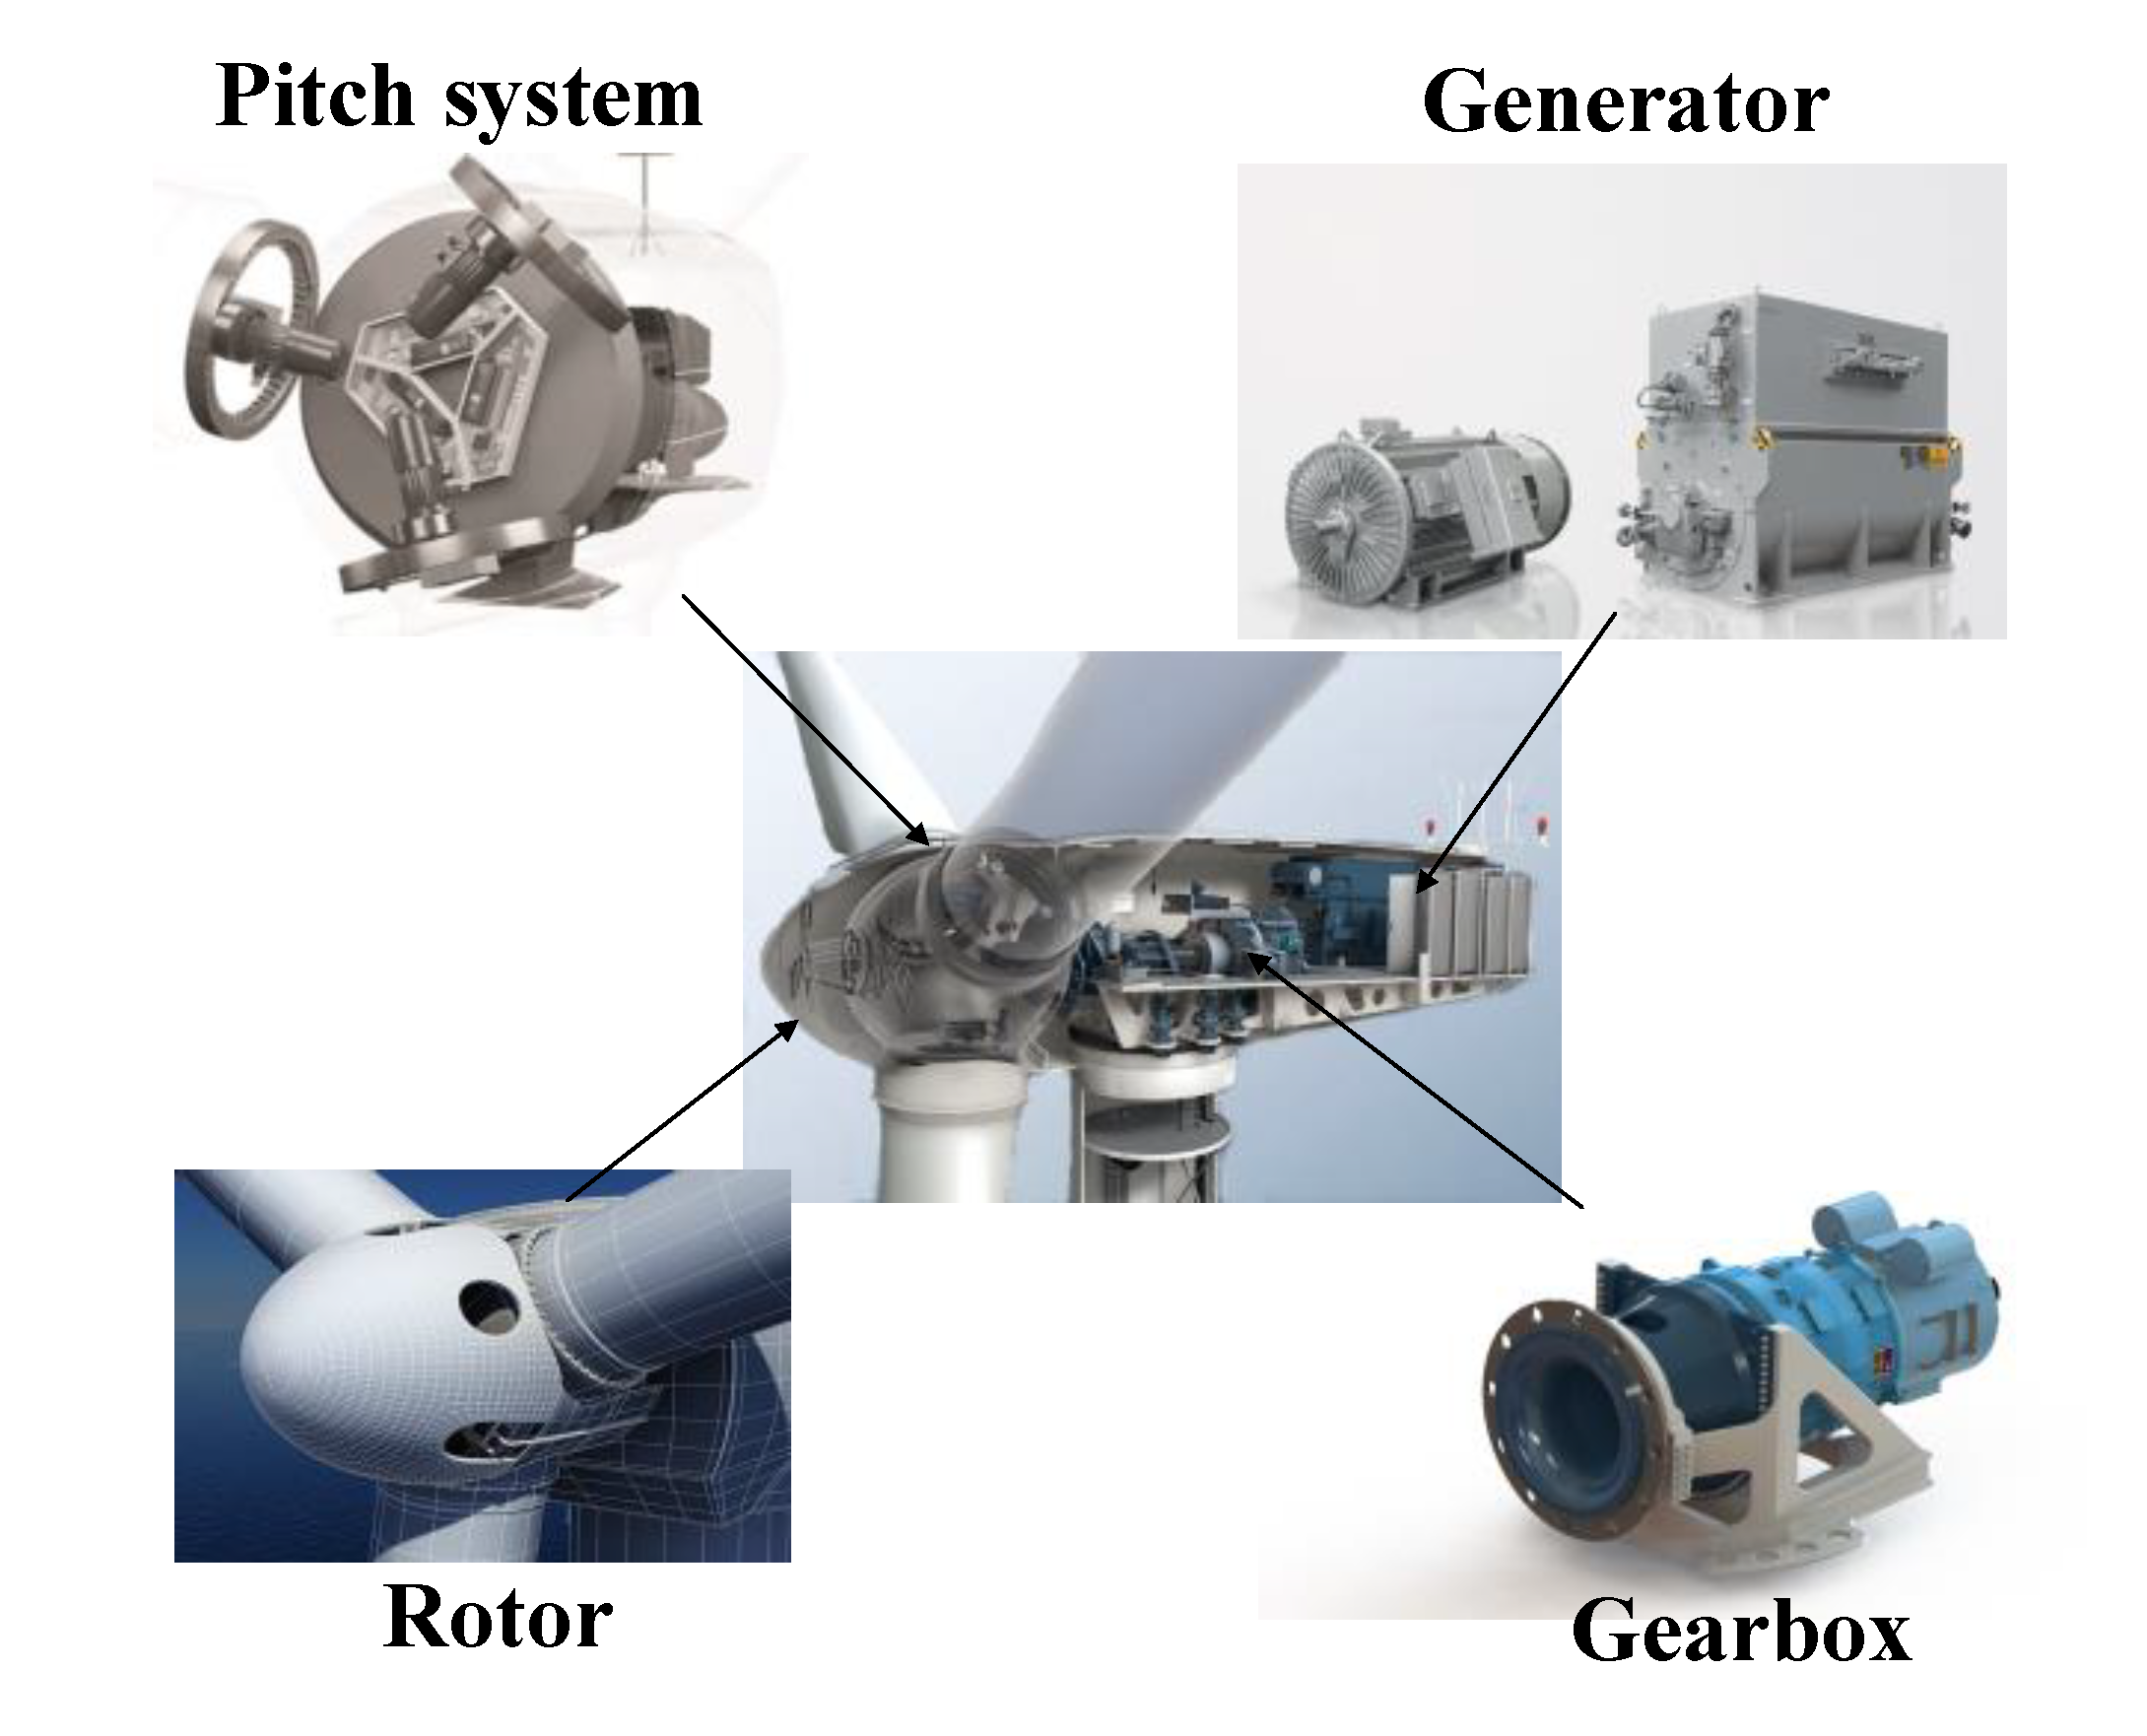
The basic function of the OWT is to use the rotor blade system to absorb wind energy and convert it into mechanical energy; then, transfer the mechanical energy to the generator system through the transmission system; then, convert it into electric energy by the generator; and finally, output the electric energy through the grid to complete the whole process. In the entire process of converting to electricity, OWTs can be divided into a certain amount of assemblies according to various functions. In this paper, the OWTs system [25] is divided into four main assemblies according to the various functions (Figure 1), which are the more relevant ones from a failure rate point of view [26].
Figure 1.
Components of the offshore wind turbine (OWT) system.
A rotor can be divided into three components, including rotor blades, rotor bearings, and a rotor hub. A rotor system functions to absorb and transmit the wind energy. A generator is installed inside the nacelle. This equipment is used to convert mechanical energy to electrical energy and adapt the output energy from the wind turbine to the grid. The gearbox functions to transform high-torque to low-torque and transform the low speed of the main shaft to the high speed of the generator. A pitch system is a mechanism that turns the blade, or part of the blade, in order to adjust the angle of attack of the wind.
Carroll et al. [27] addressed three parameters of offshore wind turbines including maintenance cost, repair time, and failure rate. The results indicate that the pitch system and generator are the largest contributors to failure rates, and the gearbox has the highest average cost per failure. The downtime of the gearbox and rotor are the longest, which can be explained by the high installation position and weight.
3. Support Vector Machine Classification Algorithm
Fault analysis based on big data is the frontier method for the risk identification of offshore wind turbines. Support vector machine (SVM) classifiers is an effective data processing technology, which is based on the structural risk minimization principle solving a quadratic programming problem [28]. By applying the kernel function, the method can map the data into a higher dimensional input space and construct an optimal hyperplane. In this study, “ν”-Soft Margin Support Vector Classifiers (SVC), a class of ν-SVM, is applied, which can predetermine the fraction of training sample that are support vectors [29].
Given a training dataset as , the goal is to find a function to construct the classifier, taking the form
where is the weight vector; is the nonlinear function; and is the bias term. For the original Support Vector Classifier (SVC) algorithm, the optimization process can be described as follows
subject to
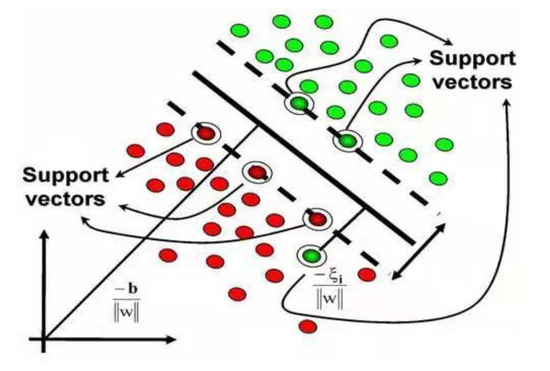
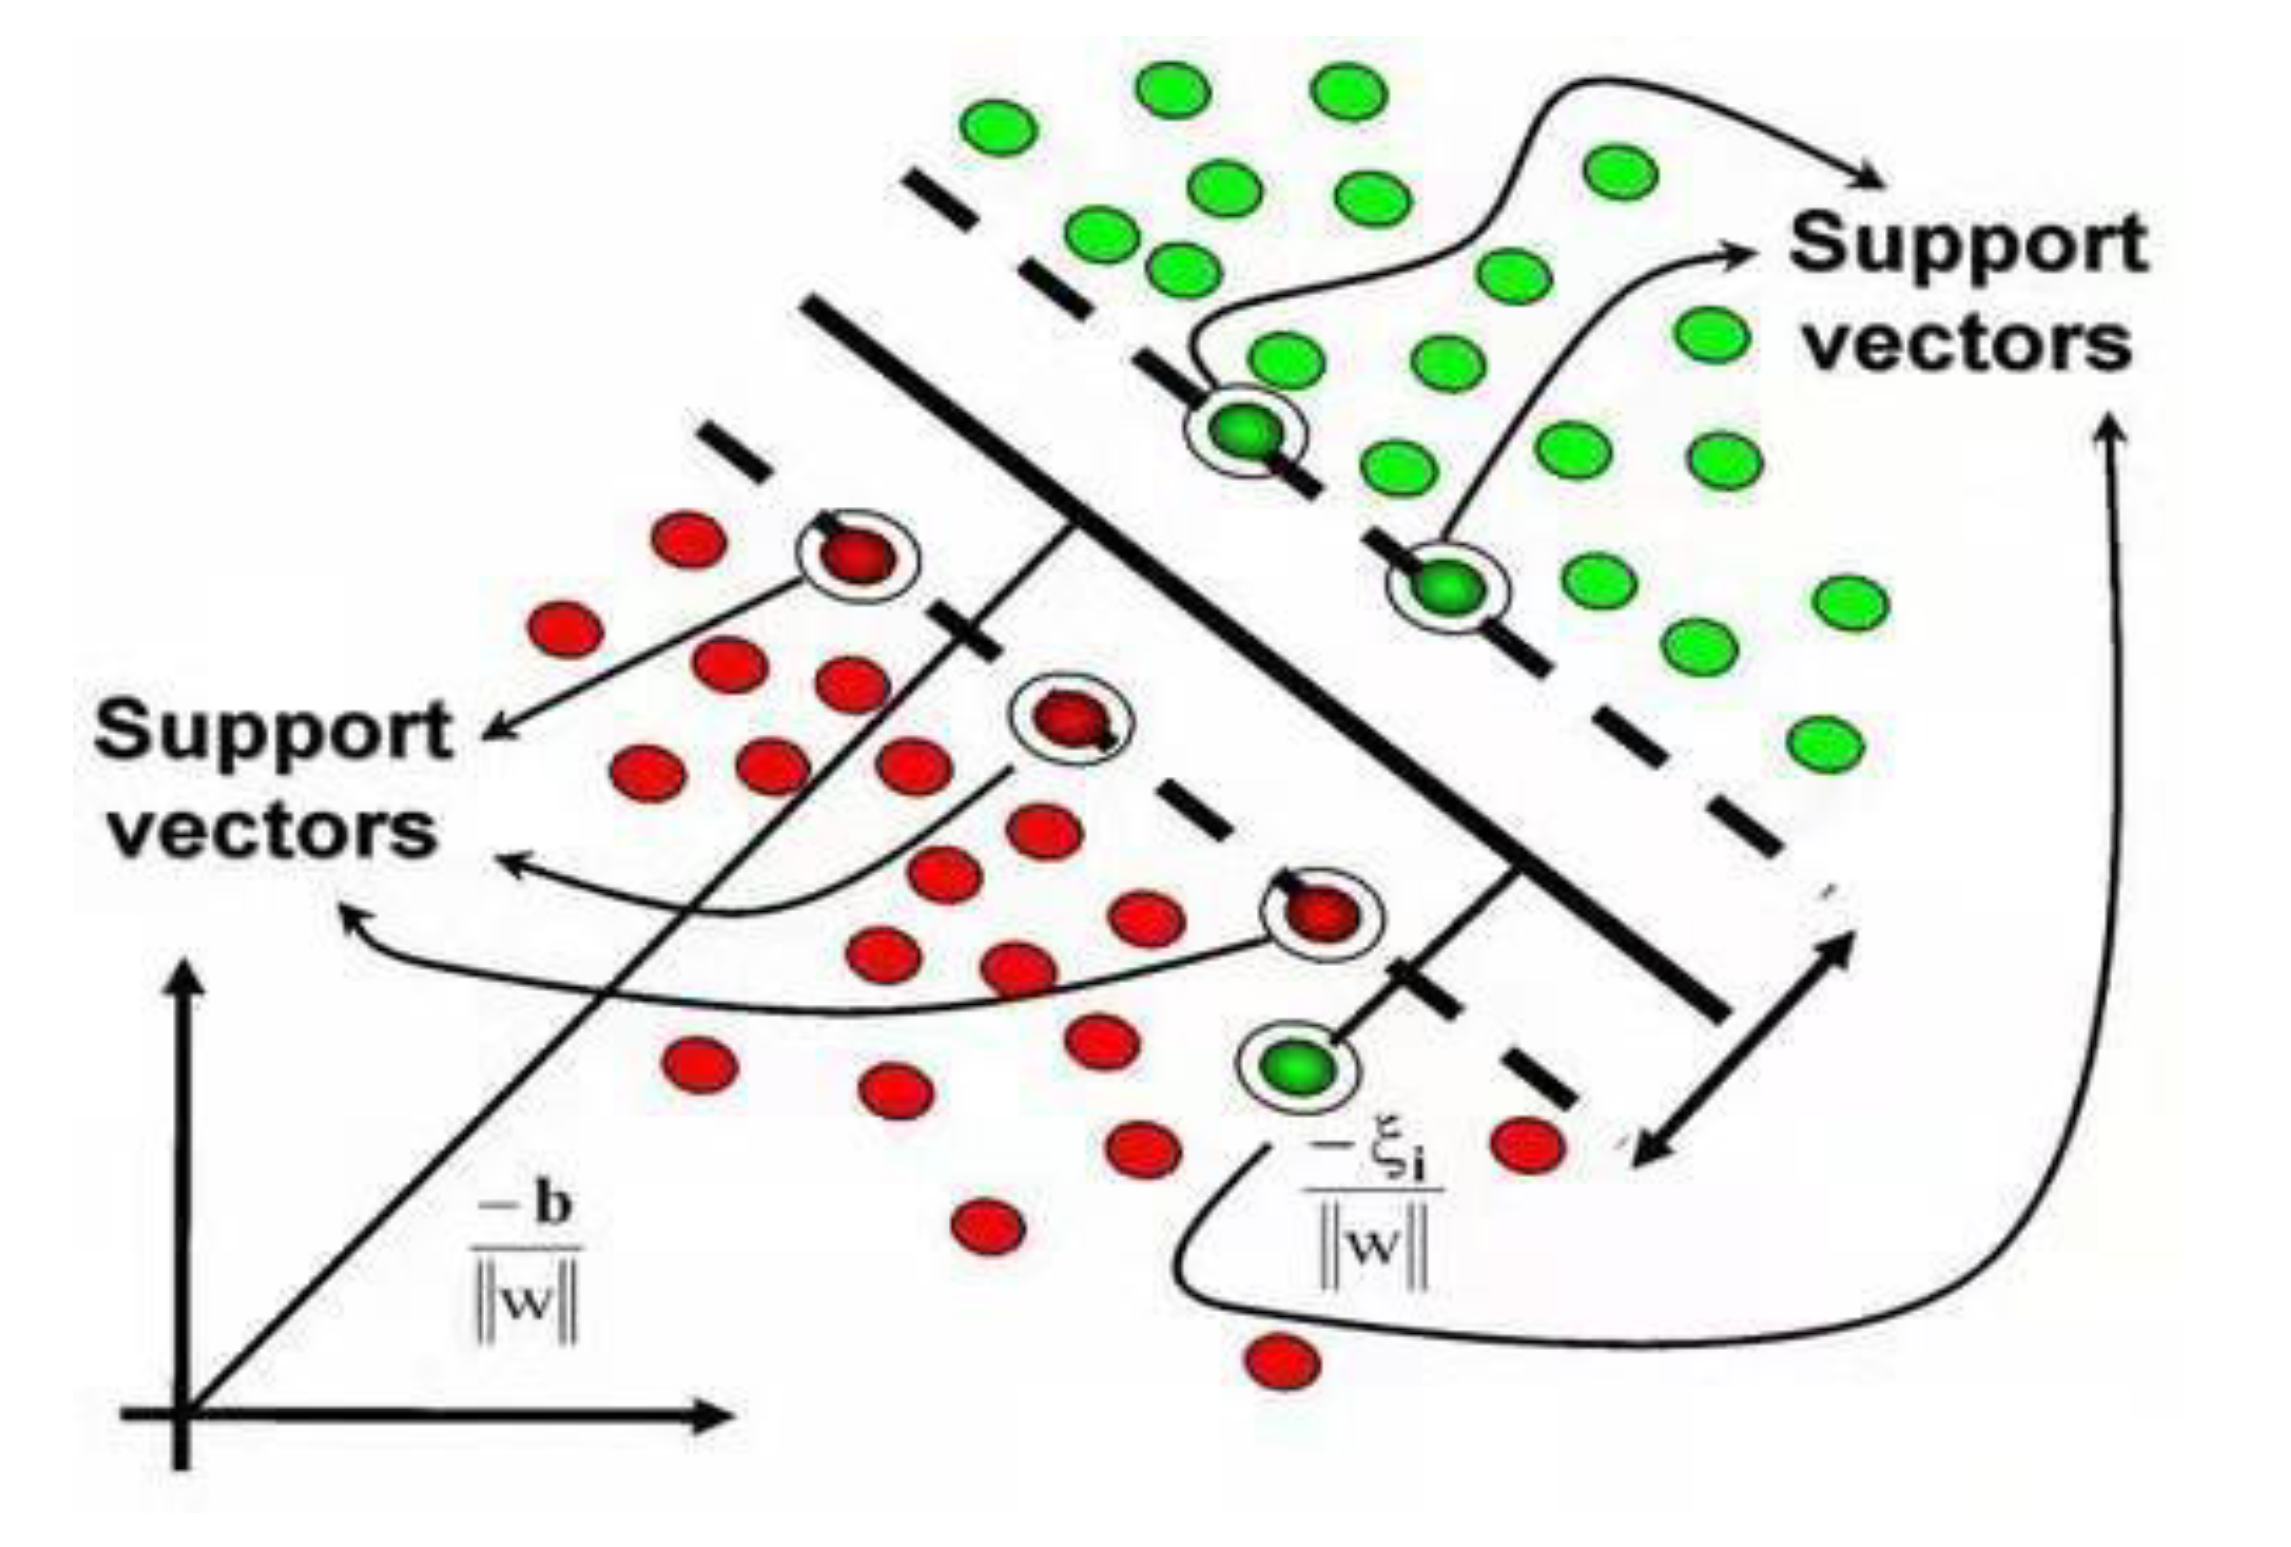
The regularization constant determines the trade-off of a large margin and noise tolerance, which is a hyperparameter that needs to be determined. Data points that are closer to the hyperplane and affect the position and orientation of the hyperplane are called support vectors (as shown in Figure 2). In the -SVC algorithm, the hyperparameter is replaced by the formulation of constant to control the number of margin errors and the support vectors. The optimization problem becomes
subject to
Figure 2.
Linear SVM scenario.
Note that does not appear in the objective function. Instead, a parameter and an additional variable are added to be optimized. The new hyperparameter is an upper bound on the fraction of margin errors and a lower bound on the fraction of Support Vectors (SV) [29]. To derive the dual, the Lagrangian can be constructed as
where are Lagrange multipliers. The optimal solution is given by the saddle point of the Lagrangian. Thereby, the conditions are
Substituting Equation (7) into Equation (6), the -SVC is obtained in a Lagrange dual form
subject to
In the above equations, the dot product of is substituted by kernel functions. In this study, the Gaussian kernel is used to map the data into a higher dimensional input space, meanwhile avoiding the dimensionality curse
is the hyperparameter that determines the width of the Gaussian kernel. Then, the regression function Equation (1) can be rewritten as follows
Only the training data belonging to the Support Vectors will affect the classifier, and the number of Support Vectors is controlled by the hyperparameters . It should be noted that the selection of hyperparameters and is significant to avoid overfitting. They can be selected by the cross-validation procedure, finding the support vector classifiers with a good performance on data not yet observed.
4. Opportunistic CBM Optimization for OWTs
The downtime of OWT brings an opportunity for joint maintenance activities. This section proposed a maintenance method that aims to take advantage of the opportunity to determine the optimized maintenance plan aiming to obtain the minimum long-term operational expenditure.
The Opportunistic CBM method presented in this study is based on an assumption that an OWT is regarded as a multi-component system consisting of n independent units. A binary model is applied to describe the condition of each unit, which means that the components are either in a functional or failure state.
4.1. Reliability Threshold Calculation
According to the Opportunistic CBM strategy, the maintenance decision for each component can be concluded.
The probability density f(t) can be described by
where is the corresponding survivor function. The failure rate can be derived as
Since R(0) = 1, then
where expresses the cumulative failure risk of component i in maintenance cycle j, implying that the number of corrective maintenance (CM) for component i in each maintenance cycle is equal to , which is considered as the PM threshold.
Since the number of CM during Δti,j is , assuming that the maintenance times for component i during the operation period is Mi, the mean maintenance cost per unit time of this component is defined as follows
where τi,j is the PM duration and τ’i,j is the CM duration. τi,j consists of the repair time and travel time, and τ’i,j is usually longer than τi,j because CM requires extra logistic time, resulting in more downtime losses. The influence of changeable marine environment is considered in the presented model. In Equation (15), Wt is the waiting time for an appropriate sea condition, which satisfied the requirement of offshore operation. CCM(i) is the CM cost, including the recovery expense and the downtime losses. C′PM(i) and CD(i) represent the imperfect PM expense and unit downtime losses, respectively. C′PM(i) is related to age reduction factor σ i,j and PM cost CPM(i), which can be evaluated as
The individual optimal Ri,j(t) can be obtained by minimizing . Obtaining threshold Ri,j(t) is the basis of the presented approach.
4.2. The Calculation of Assemblies’ Remaining Life
In this paper, the SVM method proposed in Section 3 is implemented to address the collected OWT monitoring information. A dataset with 80% of the historical data is used as incentive data to complete the training of the model. The remaining 20% of the historical data are used as verification data to prove the accuracy of the model prediction. In practice, temperature and vibration are closely related to system failure. Therefore, this research selects these two feature quantities as the regressors. The trained SVM model is employed to identify the real-time status of the components. If the threshold Ri,j(t) is reached, a PM activity should be performed.
In the modeling process, “kernel trick” is used to approximate the upper bound of the generalization error by minimizing the norm of the weights in the feature space. The Gaussian kernel function is used to determine the nonlinear mapping of regressors. Compared to the polynomial kernels, the Gaussian kernel has less numerical difficulty, and only one hyperparameter needs to be determined, which is easier to choose. In this way, the model structure is chosen with a trade-off between empirical errors in training data and model complexity. By using the kernel dot product trick, the curse of dimensionality, which usually happens in other black-box modeling methods such as ANN, can be avoided, and a unique global solution can be solved through a convex optimization problem.
4.3. Determination of the Maintenance Group
For an OWT system, when units k and i are jointly repaired, the corresponding cost preservation can be evaluated as
where is the downtime cost preservation resulting from the joint maintenance, which can be defined as
When the component i is recovered in advance, the unexpected failures would be reduced. The cost saving for the decline of random malfunctions is , which can be expressed as
After one PM activity is performed in advance, every planned maintenance time should be rearranged. Assuming represents the previous maintenance time and represents the latest one, the overall time switch should be
in which represents the originally planned number of PM, and is the number of PM activities after the update.
However, the substantial RUL is wasted when the unit is repaired in advance and the penalty cost is
The cost savings can be achieved based on Equations (17)–(21).
The maintenance activities of components can be regarded as a finite set Φ in terms of a multi-component system. When a maintenance opportunity appears, each maintenance combination Φ1, Φ2, …, Φl is a subcollection of Φ, satisfying
The size of Φ explodes as the amount of element rises, making the solution process extremely complicated. When a CM or planned PM is performed on component , all the opportunistic maintenance (OM) combination can be identified, and the expense preservation should be
The OM combination corresponding to the maximum C(Φl) can be identified as the optimized solution.
4.4. Rolling-Horizon Update
If ti,1 is the j-th maintenance execution time of unit i (i = 1, 2, …, N), thus, the following equations can be established:
and
where tbegin is the initial time, which is generally set as 0. Δti,1 is the interval of the first PM activity. Wt is the waiting time for a weather window. After completing a maintenance activity, the failure rate of the corresponding component is renewed. If one preventative maintenance or failure replacement is conducted for unit I, a new life period need to be started.
4.5. Maintenance Schedule Determination and Maintenance Cost Calculation
The total maintenance expenditure of OWT can be derived as follows when the last inspection is accomplished.
represents the inspection interval, and represents the inspection time of the OWT operation process. The entire cost at inspection time is denoted as Ct, which can be calculated by
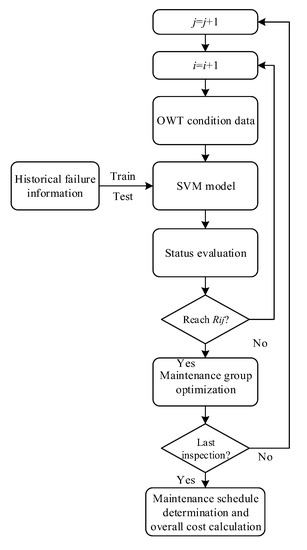
where N represents the amount of OWT assemblies. The complete calculation process of opportunistic CBM optimization based on SVM is presented in Figure 3.
Figure 3.
Flow diagram of OWT Opportunistic condition-based maintenance (CBM) optimization.
5. Case Study
5.1. Input Information
Carroll et al. [27] collated and analyzed the operation data of 1768 turbine years, including malfunction and repair information. The calendar ages of the selected OWTs are from 3 to 10 years, which is a period where the failure rate is relatively stable. Some OWT component parameters are also listed in [10,30]. These studies are the main references of the maintenance cost information for each piece of component information in Table 1.
Table 1.
Maintenance cost information for each component.
Assuming the capacity of the analyzed OWTs is 3 MW and the electricity tariff is 0.1 €, therefore, the financial loss caused by system unavailability is Cd(i) = 3000 24 0.1 = 7200 (€/d).
The maintenance activities of OWTs are significantly affected by the marine environment such as wind speed and effective wave height [31,32]. The maintenance ship needs to wait for the appropriate time to complete the O&M activities and a round trip. According to Scheu et al. [33], wave height is the key factor to determine the accessibility of an offshore site. Generally, the significant wave heights (Hs) less than 3.5 m are considered as the operational environmental conditions. Martins et al. [34] studied the winter months (December, January, February) wave height data in the North Atlantic Portuguese waters. The results are presented in Table 2, demonstrating the waiting time for a weather window corresponding to different significant wave heights.
Table 2.
The waiting time (in days) information corresponding to different wave heights (2–3.4 m).
Lu et al. [24] presented the condition monitoring information of an invalidation period and the suspended period for five OWTs, which is the data source for SVM model training and validation. Partial information including time, vibration velocity, and temperature (abbreviated as T (days), V (mm/s), T (°C)) of OWT-rotor, OWT-gearbox, OWT-generator, and OWT-pitch is listed in Table 3, Table 4, Table 5 and Table 6, respectively.
Table 3.
Invalidation period and the suspended period for an OWT rotor.
Table 4.
Invalidation period and the suspended period for an OWT gearbox.
Table 5.
Invalidation period and the suspended period for an OWT generator.
Table 6.
Invalidation period and the suspended period for an OWT pitch.
5.2. Maintenance Optimization Based on Condition-Based Maintenance Method
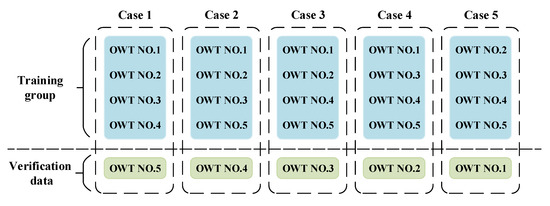
In this paper, the cross-validation method is used to calculate the accuracy of fault evaluation under a small amount of real data and verify the feasibility of the SVM algorithm. Then, white noise is added to these real data to generate simulation data for the determination of maintenance schedule. Due to the insufficient data, this paper verifies the accuracy of the state assessment using a cross-validation method (Figure 4). One of the OWTs is regarded as the verification data, and the remaining four were used as the training group, forming five different grouping schemes, and the SVM model is constructed and tested five times. The advantage of this method is that the information of real data is fully mined and the influence of simulation data on calculation results is avoided. The results are presented in Table 7. Case 2 and Case 3 have the highest and lowest accuracy, which means that the sample size has a significant impact on the results. With the least amount of training data, the accuracy of Case 3 is over 85%, indicating that the SVM classification algorithm is able to recognize the OWT fault.
Figure 4.
Schematic diagram of cross-validation grouping.
Table 7.
Results of SVM classification.
This paper adds white noise based on existing statistics to generate a set of simulated data. According to industry suggestions, Gaussian noise is used to better simulate unknown real noise. The real noise is regarded as the sum of various random variables with different probability distributions, and each random variable is independent. Based on the Central Limit Theorem, the normalized sum increases with the number of noise sources and is finally close to a Gaussian distribution. The Gaussian noise function is determined by four parameters: μ, σ, m, and n. According to industry suggestions, in this paper μ is set to 3.5 and 55 in vibration and temperature series, respectively. σ is set to 0.12 and 1.06 in vibration and temperature series, respectively. m and n together determine the dimensions of the matrix, which are set to 30,000 and 1.
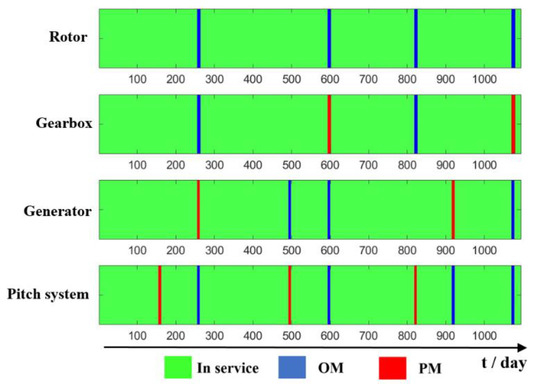
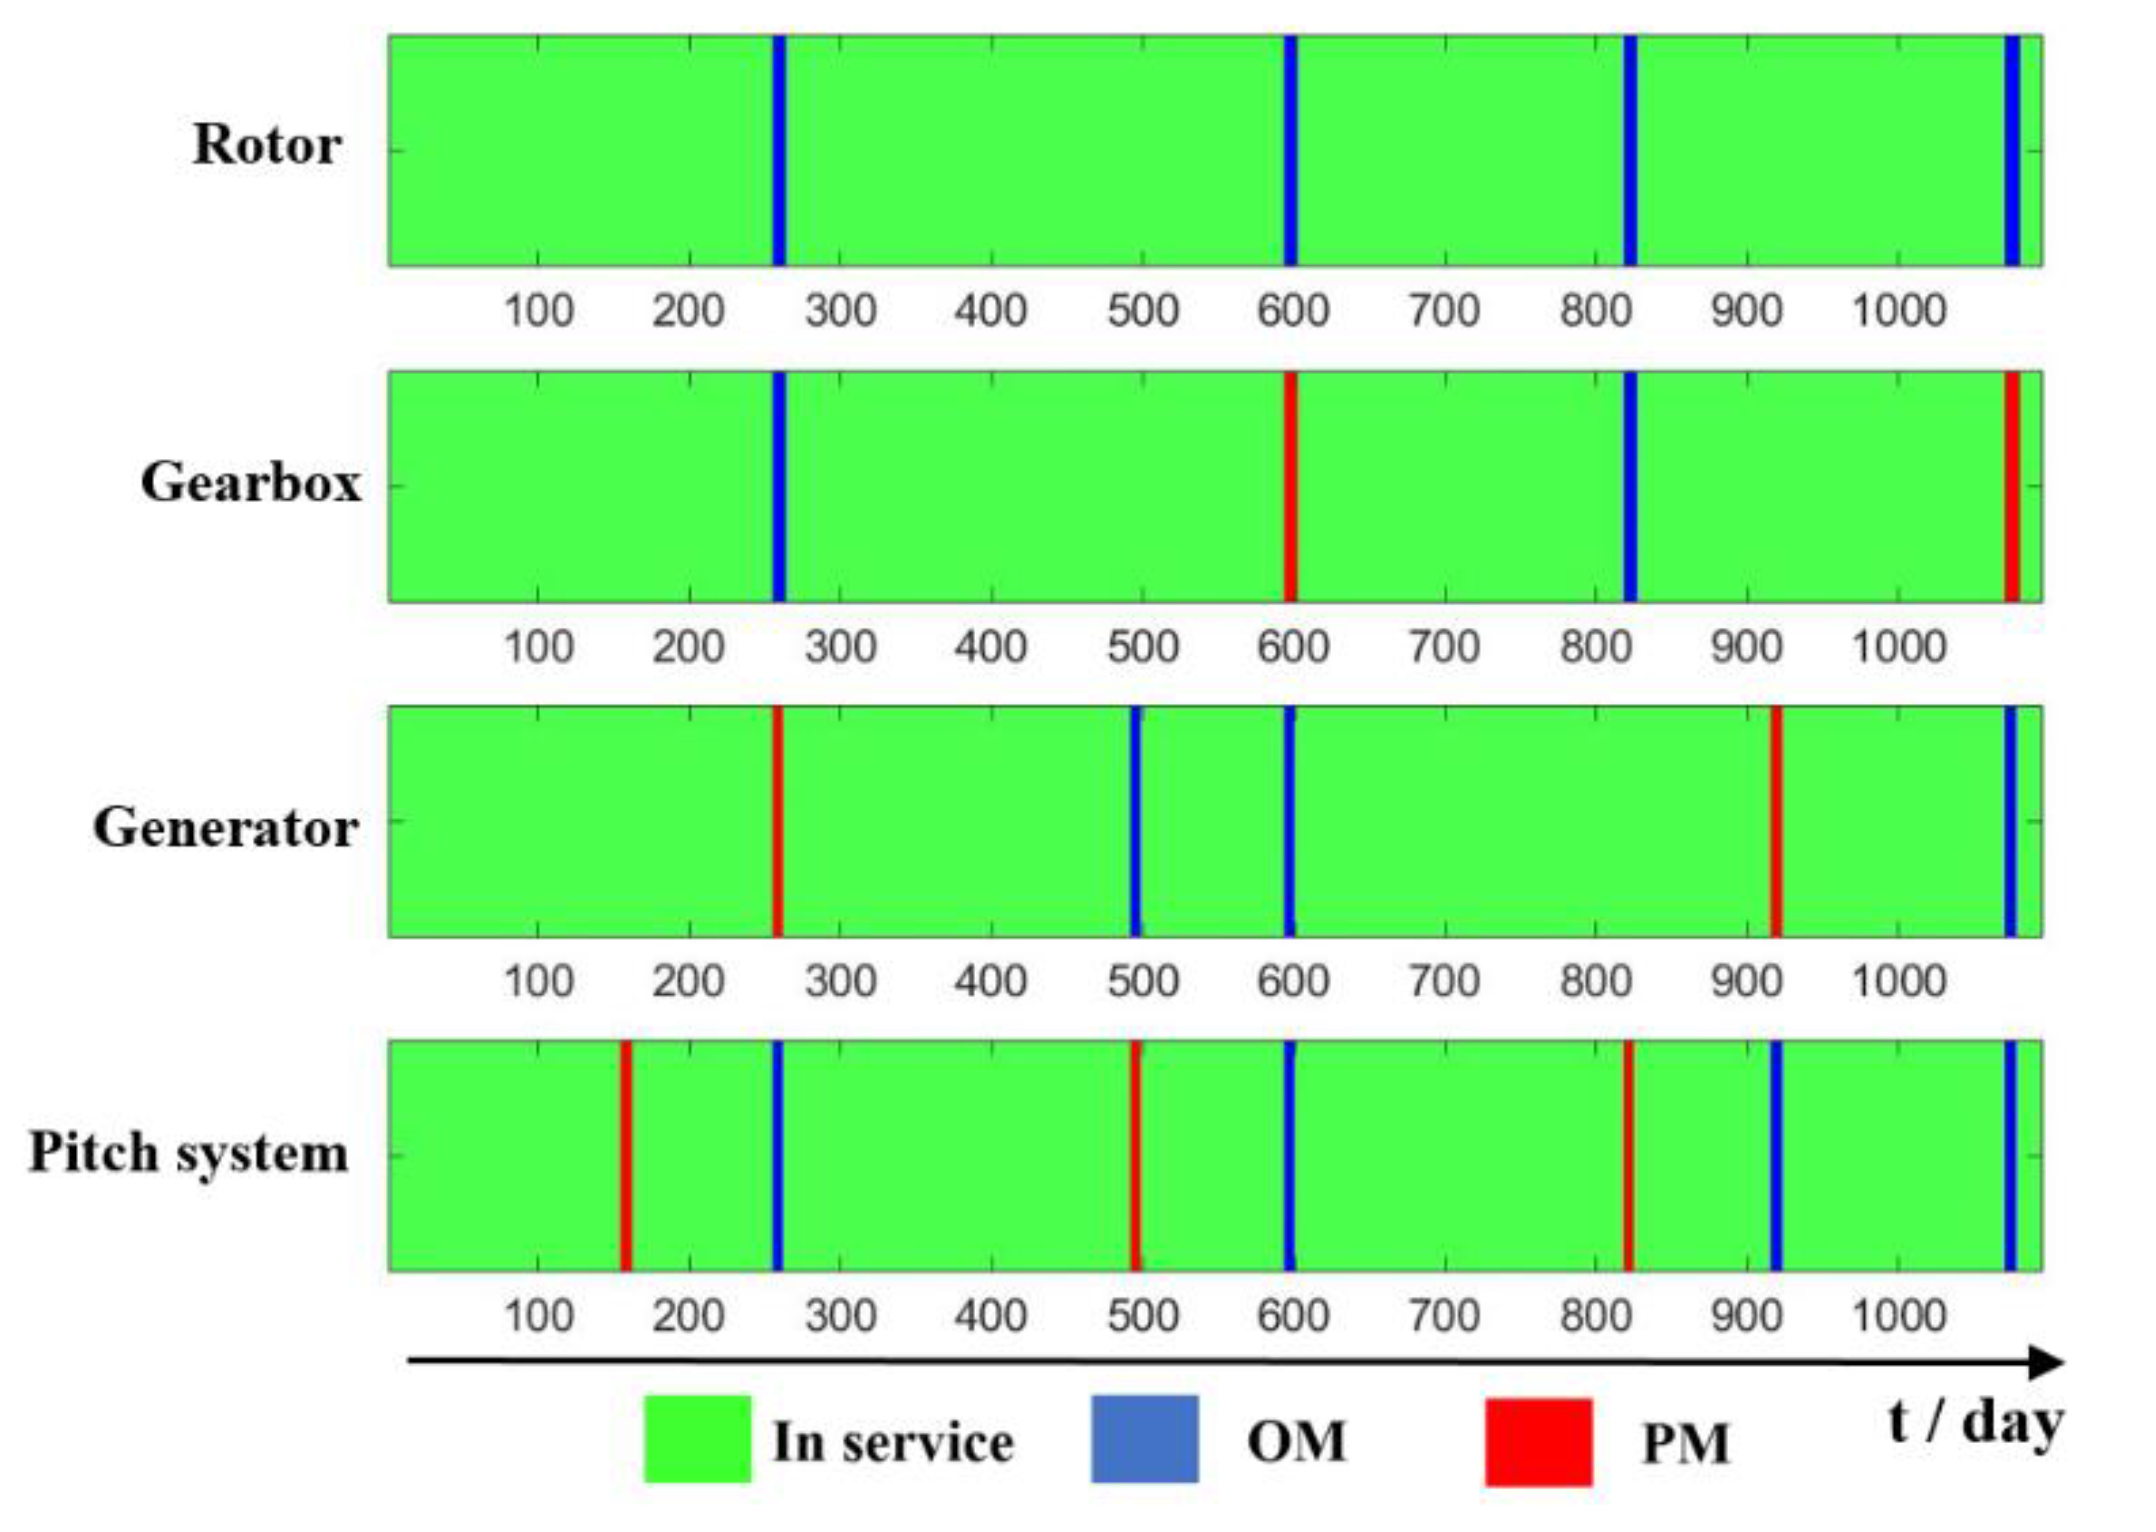
The proposed CBM method is adapted to optimize the maintenance planning for OWT during the mission period with the simulated data. Assuming that the critical operation wave height is 3 m and the age reduction factor is 0.01, a detailed maintenance schedule and the cost savings in the first three calendar days are presented in Figure 5 and Table 8. The outcomes demonstrated that the overall cost savings is 120,000 Euros, and the maintenance expenses are significantly reduced through the presented strategy.
Figure 5.
Schematic diagram of cross-validation grouping.
Table 8.
The maintenance schedule and cost savings in the first year. OM: opportunistic maintenance, PM: preventative maintenance.
In Table 9, the OWT is repaired 7 times in the first three years, including 5 PM activities and 13 OM activities. No CM is executed during this period. It is worth noting that every assembly was maintained on the 258th, 597th, and 1074th day, leading to the largest cost saving happening at these time points. On the 158th day, only one PM activity is performed; thereby, the cost saving is zero.
Table 9.
Summary of different types of maintenance activities.
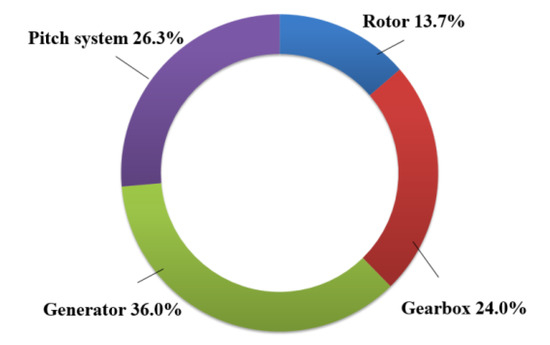
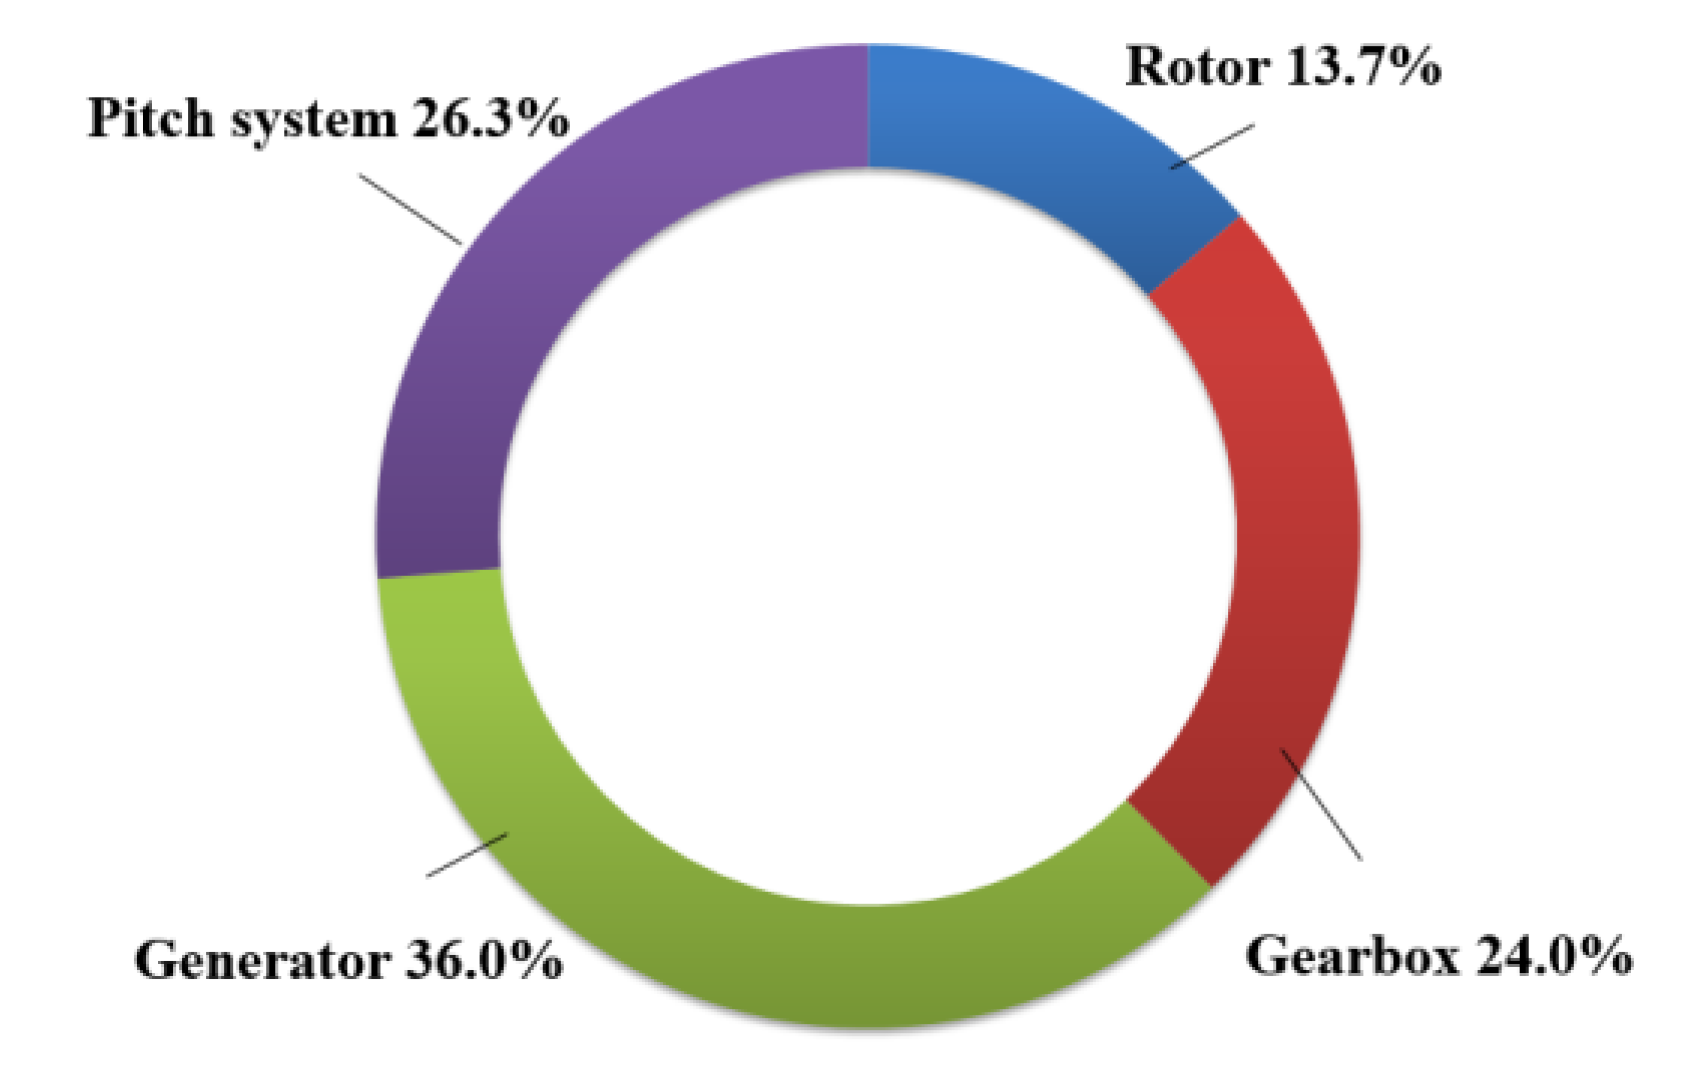
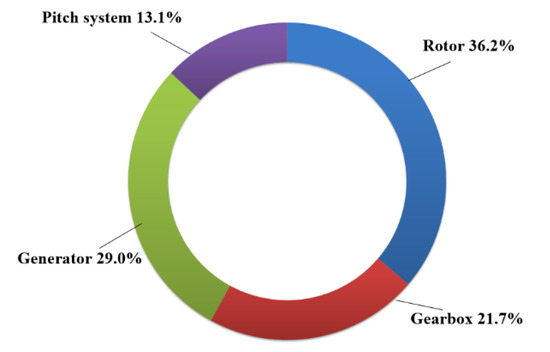
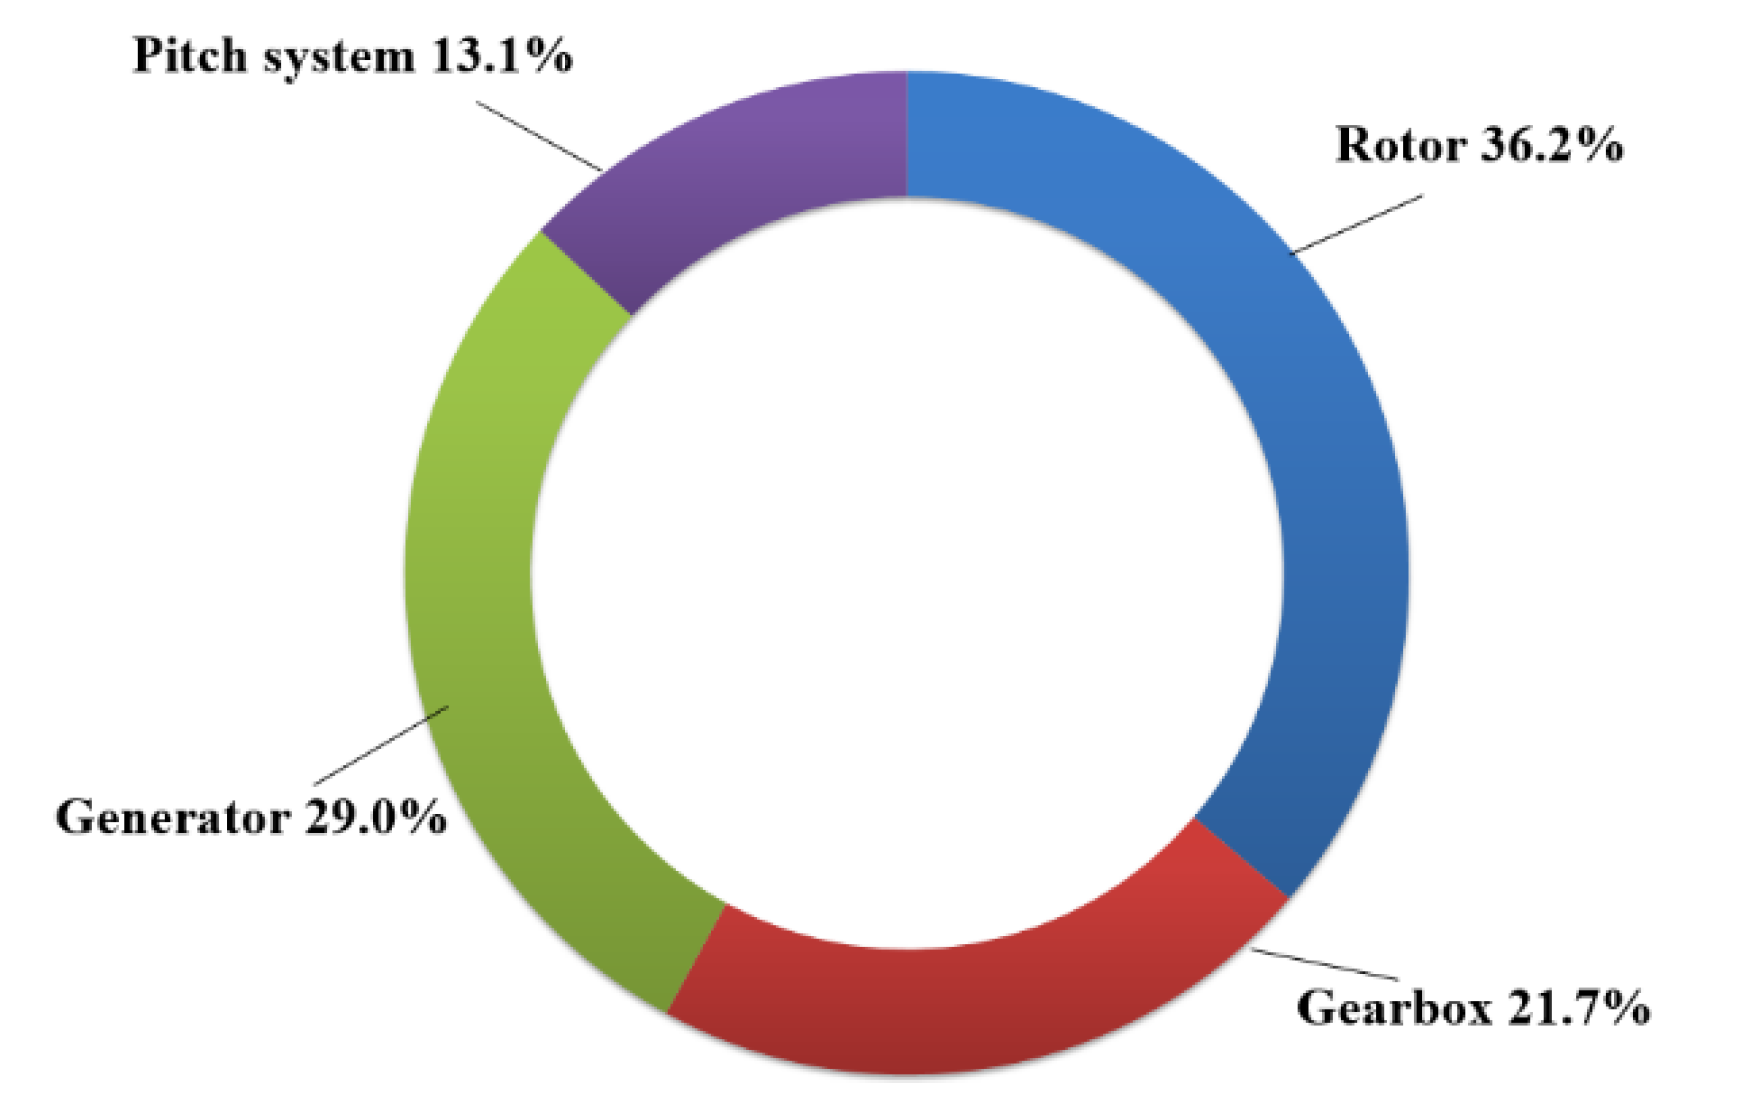
Figure 6 indicates that the generator is the largest contributor to overall costs, followed by the pitch system and gearbox. It can be explained that the failure probability and maintenance cost of the generator are relatively higher within the entire system. In terms of pitch and gearbox, they have the highest repair frequency and expense respectively, explaining their large cost proportions. In Figure 7, the rotor ranks on the top of cost savings. One reason is that the rotor has 4 times the amount of OM, which is more than the rest of the assemblies except for the pitch system. Another reason is that the cost saving of the rotor in a single maintenance operation is relatively larger.
Figure 6.
The proportion of costs.
Figure 7.
The proportion of cost savings.
5.3. Comparison Analysis
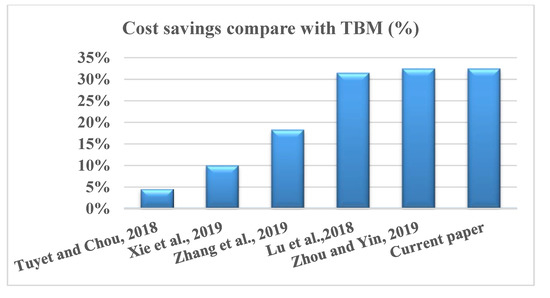
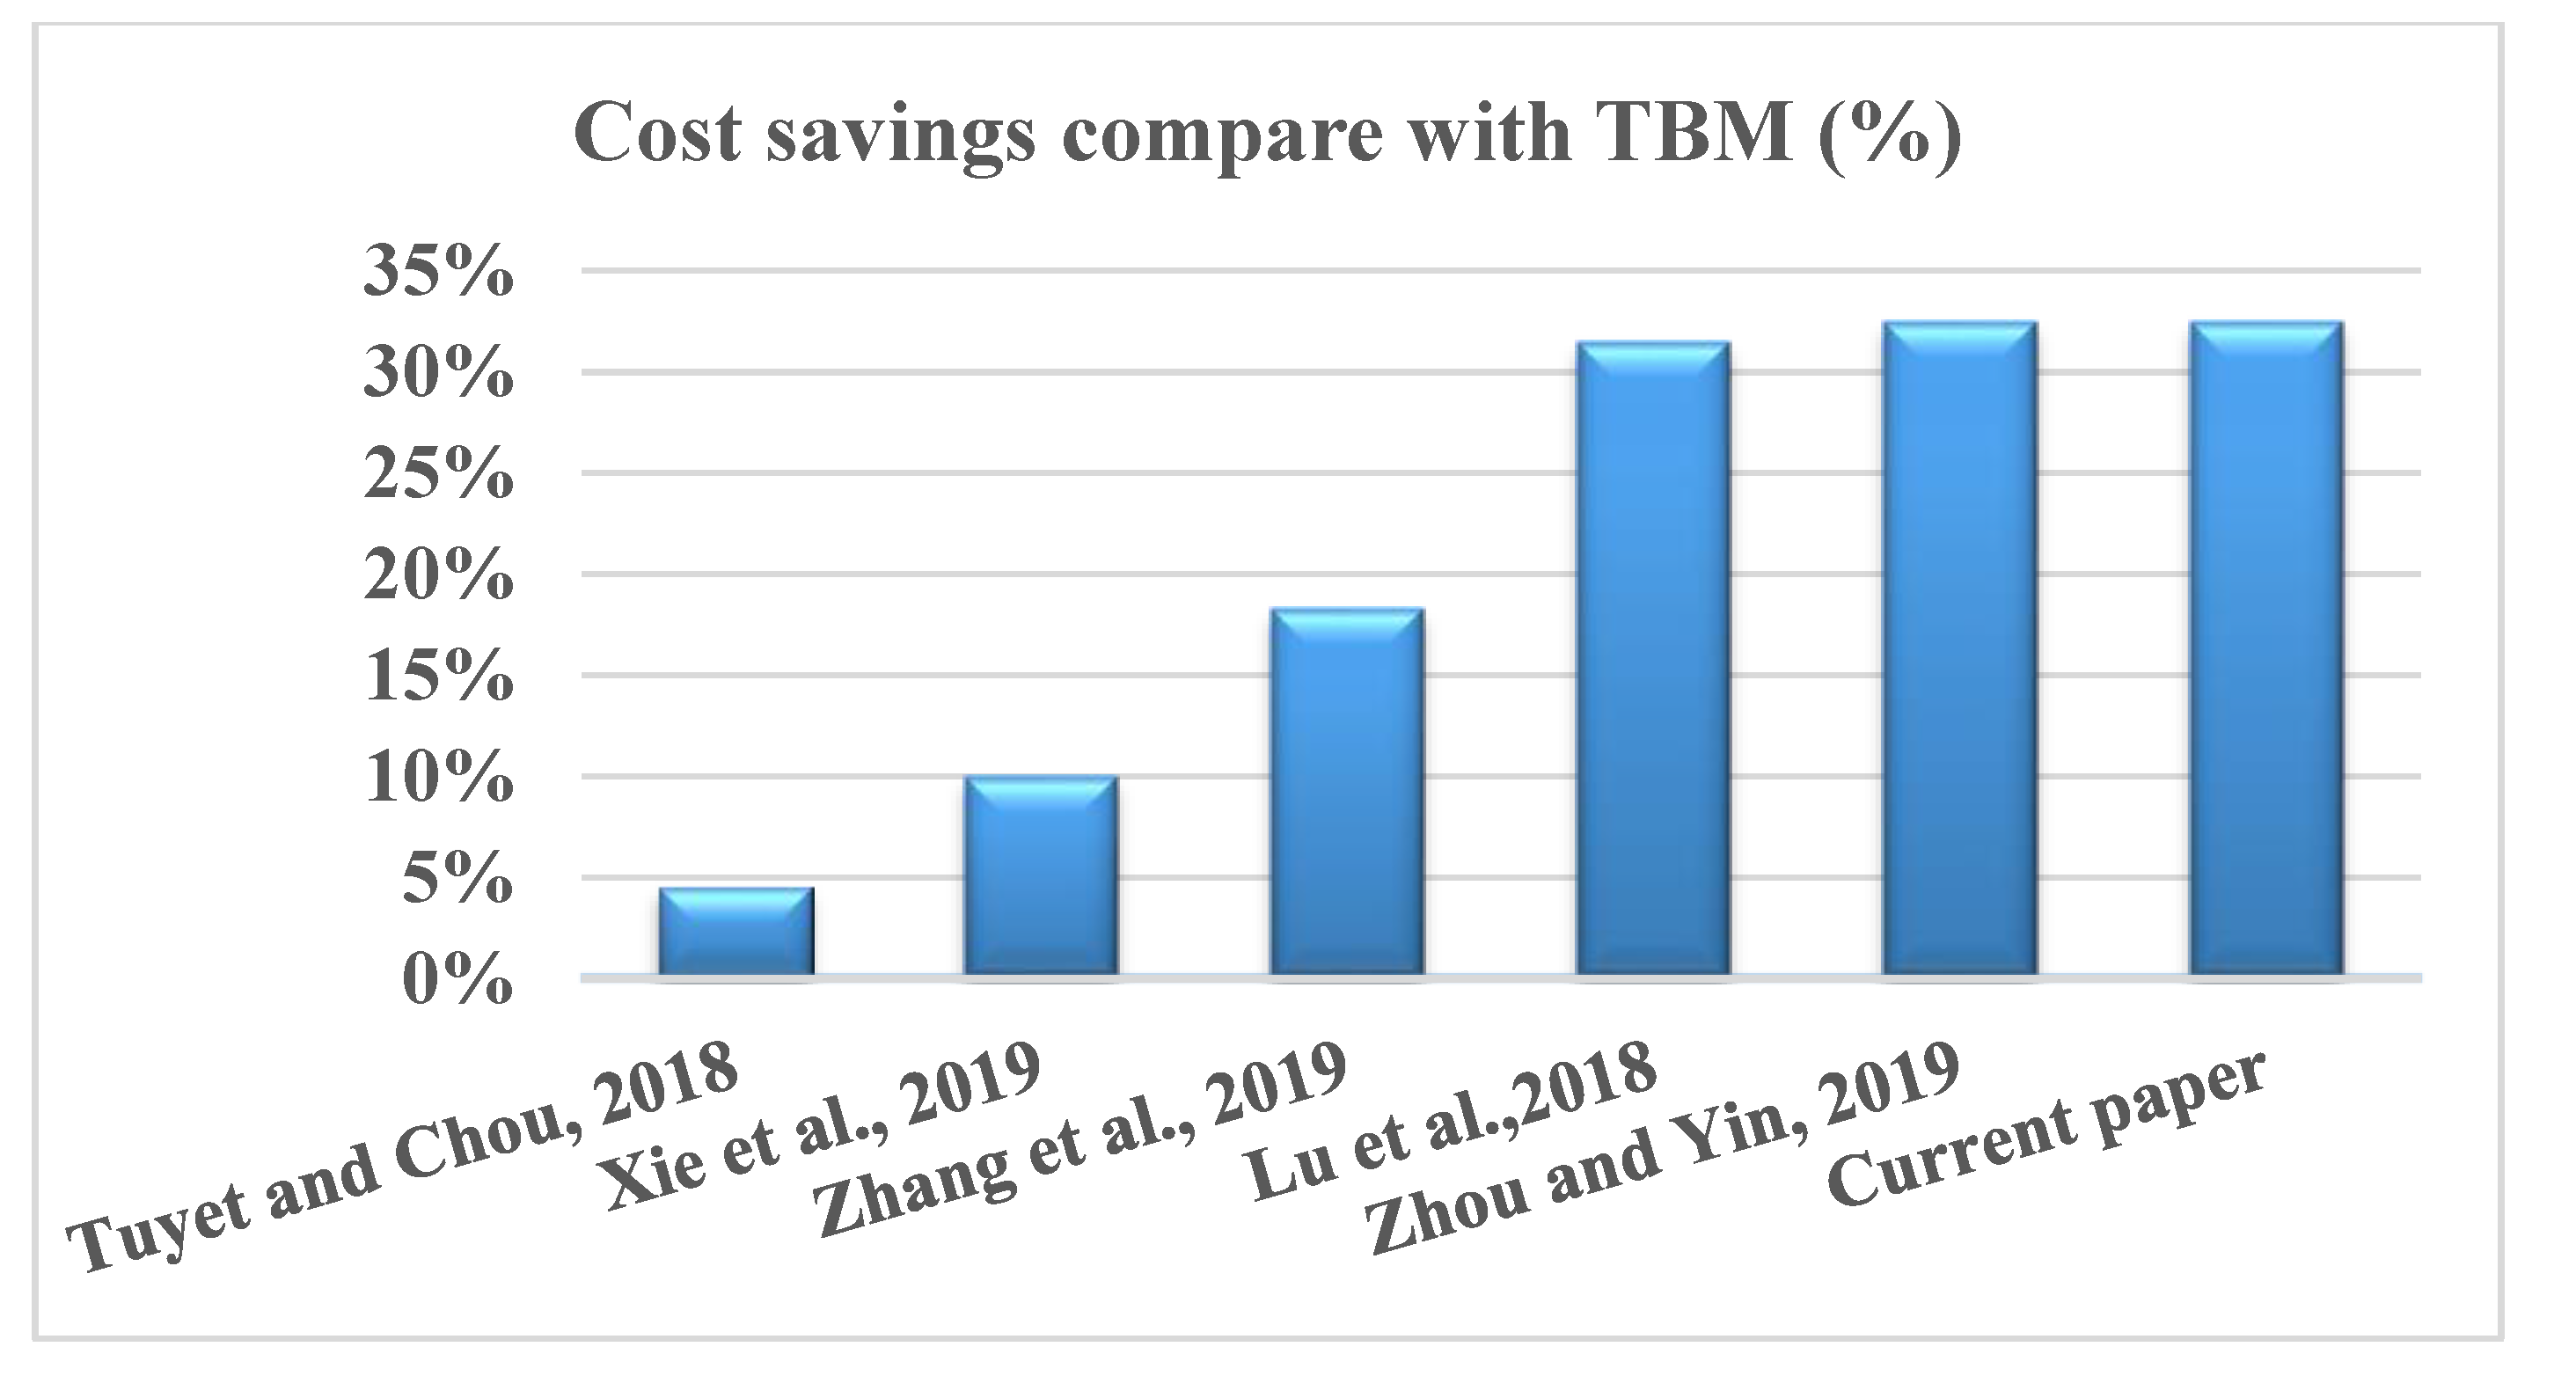
The maintenance strategy can be divided into three categories, namely time-based maintenance (TBM), reliability-based maintenance (RBM), and the CBM method. The TBM method has been widely implemented in practice [35]. Under this maintenance strategy, PMs are carried out on device and structures at constant intervals, and CMs are conducted after system malfunctions. In Goldwind Sci. and Tech. Co., Ltd., a leading wind energy developer in China, the period of overall inspection is six months. In order to improve the maintenance efficiency, researchers established different RBM and CBM models considering joint maintenance, attempting to achieve the optimized cost savings. This section performs a comparison analysis of five representative studies and the current paper; the results are presented in Figure 8 and Table 10.
Figure 8.
Cost saving compared with time-based maintenance (TBM).
Table 10.
Comparison of maintenance costs. RBM: reliability-based maintenance.
Tuyet and Chou [36] used two-parameter Weibull distribution to describe the OWT degradation and established a maintenance optimization algorithm considering maintenance duration and power loss. The proposed grouping maintenance schedule saved 4.56% of maintenance cost over the baseline maintenance schedule. Xie et al. [37] developed the system degradation model based on the three-parameter Weibull distribution. The outcomes demonstrated that the failure rate short-term prediction of the three-parameter Weibull model was superior to the two-parameter Weibull model when the fault data were limited, improving the cost savings pare part arrangement issue the time window of waiting for appto 10%. Zhang et al. [38] presented a dynamic opportunistic maintenance strategy, considering the sropriate weather. In this research, when the wind speed is high, the maintenance decision tends to concentrate on restoring the OWT and starting its function as soon as possible, in order to generate more power. Conversely, when the wind speed is low, the decision-making algorithm tends to carry out joint maintenance. The O&M cost for the presented method showed a decline of 18.3%.
In terms of CBM strategy, Lu et al. [23] and Zhou and Yin [24] developed an ANN predictive model based on statistics failure information and assessed the RUL of OWT components. With real-time status evaluation data, the optimized maintenance decisions can be determined, improving the cost savings to over 30%. It is notable that Zhou and Yin [24] investigated the influence of maintenance lead time, including the time required to assemble the maintenance team, arrange the spare parts, prepare the specific equipment, and travel to the offshore site. The results of Lu et al. [23] and the current paper show that CM does not happen during the calculation cycle, conforming the statistics provided by Goldwind Science and Technology Corporation., Ltd. The reason is that the corrective replacement leads to huge economic losses, compelling the maintenance decision-making models to prepare adequate security redundancy to avoid it happening.
In Table 10, it can be summarized that (1) the cost-saving rates of CBM are generally higher than RBM, resulting from a more accurate assessment of the real-time state of the system; (2) the more interference factors (weather window, inventory management, etc.) are considered, the greater the cost savings that are achieved, demonstrating the necessity of research on the maintenance strategy.
6. Conclusions
In this research, a CBM strategy based on the SVM algorithm is introduced to optimize the OWT maintenance arrangement. The SVM classifier is implemented to determine whether the component needs to be repaired. The maintenance activities are grouped, taking into account the economic dependence of different assemblies, aiming at reducing the overall expenditures. The extra downtime caused by a changeable marine environment is also addressed. The calculated results demonstrate that the presented strategy can significantly preserve the costs compared with separate periodic maintenance, improving the cost savings to 32.5%. The pitch system is the top assembly in terms of total maintenance times, which is caused by its high system complexity and frequent failures. The generator is the largest contributor to maintenance cost due to its high failure rates and repair expenditures. The rotor is the top assembly part in terms of cost savings, since it requires more maintenance opportunities, and the cost of its single maintenance activity is relatively higher. It can be concluded that the developed model provides an economically efficient method of OWT maintenance planning. Future research could be conducted by taking into account the failure interactions between OWT components and the limited maintenance resources, including vessels and technicians.
Author Contributions
Conceptualization, J.K. and C.G.S.; methodology, J.K.; software, J.K. and Z.W.; validation, J.K.; formal analysis, J.K.; investigation J.K.; resources, J.K.; data curation, J.K.; writing—original draft preparation, J.K. and Z.W.; writing—review and editing, C.G.S.; supervision, C.G.S.; project administration and funding acquisition, C.G.S. All authors have read and agreed to the published version of the manuscript.
Funding
This study was performed within the project ARCWIND-Adaptation and implementation of floating wind energy conversion technology for the Atlantic region, which is co-financed by the European Regional Development Fund through the Interreg Atlantic Area Programme under contract EAPA 344/2016. This work contributes to the Strategic Research Plan of the Centre for Marine Technology and Ocean Engineering (CENTEC), which is financed by the Portuguese Foundation for Science and Technology (Fundação para a Ciência e Tecnologia-FCT) under contract UIDB/UIDP/00134/2020.
Conflicts of Interest
The authors declare no conflict of interest.
References
- Global Wind Energy Council. Global Wind Report Annual Market Update 2013. Available online: http://www.gwec.net/publicaionts/global-wind-report-2/ (accessed on 25 May 2020).
- Diaz, H.M.; Guedes Soares, C. Review of the current status, technology and future trends of offshore wind farms. Ocean. Eng. 2020, 209, 107381. [Google Scholar] [CrossRef] [Scilit]
- Study on the Dynamic Characteristics of Floating Offshore Wind Turbine, Natural Science Foundation of China Project. (NSFC, Grant No.: G1917010). Available online: http://www.nsfc.gov.cn/ (accessed on 3 June 2020).
- Leimeister, M.; Kolios, A. A review of reliability-based methods for risk analysis and their application in the offshore wind industry. Renew. Sustain. Energy Rev. 2018, 91, 1065–1076. [Google Scholar] [CrossRef] [Scilit]
- Castro-Santos, L.; Silva, D.; Bento, A.R.; Salvacao, N.; Guedes Soares, C. Economic feasibility of floating offshore wind farms in Portugal. Ocean. Eng. 2020, 207, 107393. [Google Scholar] [CrossRef] [Scilit]
- Kang, J.C.; Sun, L.P.; Guedes Soares, C. Fault Tree Analysis of Floating Offshore Wind Turbines. Renew. Energy. 2019, 133, 1455–1467. [Google Scholar] [CrossRef] [Scilit]
- Horn, J.T.; Krokstad, J.R.; Leira, B.J. Impact of model uncertainties on the fatigue reliability of offshore wind turbines. Mar. Struct. 2019, 64, 174–185. [Google Scholar] [CrossRef] [Scilit]
- Márquez, F.P.G.; Tobias, A.M.; Pérez, J.M.P.; Mayorkinos, P. Condition monitoring of wind turbines: Techniques and methods. Renew. Energy 2012, 46, 169–178. [Google Scholar] [CrossRef] [Scilit]
- Pandit, R.K.; Infield, D. Using Gaussian process theory for wind turbine power curve analysis with emphasis on the confidence intervals. In Proceedings of the 6th International Conference on Clean Electrical Power (ICCEP), Santa Margherita Ligure, Italy, 27–29 June 2017; IEEE: Piscataway, NJ, USA, 2017; pp. 744–749. [Google Scholar]
- Santos, F.P.; Teixeira, A.P.; Guedes Soares, C. Modelling, simulation and optimization of maintenance cost aspects on multi-unit systems by stochastic Petri nets with predicates. Simul: Trans. Soc. Modeling Simul. Int. 2018, 7, 1–18. [Google Scholar]
- Pandit, R.K.; Infield, D. Performance assessment of a wind turbine using SCADA based Gaussian Process model. Int. J. Progn. Health Manag. 2018, 9, 23. [Google Scholar]
- Yang, W.X.; Lang, Z.Q.; Tian, W.Y. Condition monitoring and damage location of wind turbine blades by frequency response transmissibility analysis. Ieee Trans. Ind. Electron. 2015, 62, 6558–6564. [Google Scholar] [CrossRef] [Scilit]
- Liu, B.; Wu, S.; Xie, M.; Kuo, W. A condition-based maintenance policy for degrading systems with age- and state-dependent operating cost. Eur. J. Oper. Res. 2017, 263, 879–887. [Google Scholar] [CrossRef] [Scilit]
- Kang, J.C.; Sobral, J.; Guedes Soares, C. Review of condition-based maintenance strategies for offshore wind energy. J. Mar. Sci. Appl. 2019, 18, 1–16. [Google Scholar] [CrossRef] [Scilit]
- Barata, J.; Guedes Soares, C.; Marseguerra, M.; Zio, E. Simulation Modelling of Repairable Multi-Component Deteriorating Systems for “On Condition” Maintenance Optimization. Reliab. Eng. Syst. Saf. 2002, 76, 255–264. [Google Scholar] [CrossRef] [Scilit]
- Scheu, M.N.; Tremps, L.; Smolka, U.; Kolios, A.; Brennan, F. A systematic Failure Mode Effects and Criticality Analysis for offshore wind turbine systems towards integrated condition based maintenance strategies. Ocean. Eng. 2019, 176, 118–133. [Google Scholar] [CrossRef] [Scilit]
- Shafiee, M.; Finkelstein, M.; Bérenguer, C. An opportunistic condition-based maintenance policy for offshore wind turbine blades subjected to degradation and environmental shocks. Reliab. Eng. Syst. Saf. 2015, 142, 463–471. [Google Scholar] [CrossRef] [Scilit]
- Ghamlouch, H.; Fouladirad, M.; Grall, A. The use of real option in condition-based maintenance scheduling for wind turbines with production and deterioration uncertainties. Reliab. Eng. Syst. Saf. 2019, 188, 614–623. [Google Scholar] [CrossRef] [Scilit]
- Verbert, K.; De Schutter, B.; Babuška, R. Timely condition-based maintenance planning for multi-component systems. Reliab. Eng. Syst. Saf. 2017, 159, 310–321. [Google Scholar] [CrossRef] [Scilit]
- Santos, F.P.; Teixeira, A.P.; Guedes Soares, C. Modelling and simulation of the operation and maintenance of offshore wind turbines. J. Risk Reliab. 2015, 299, 385–393. [Google Scholar] [CrossRef] [Scilit]
- Song, S.; Li, Q.; Felder, F.A.; Wang, H.; Coit, D.W. Integrated optimization of offshore wind farm layout design and turbine opportunistic condition-based maintenance. Comput. Ind. Eng. 2018, 120, 288–297. [Google Scholar] [CrossRef] [Scilit]
- Pandit, R.K.; Infield, D. Comparative assessments of binned and support vector regression-based blade pitch curve of a wind turbine for the purpose of condition monitoring. Int. J. Energy Environmen. Eng. 2019, 10, 181–188. [Google Scholar] [CrossRef] [Scilit]
- Zhou, P.; Yin, P.Y. An opportunistic condition-based maintenance strategy for offshore wind farm based on predictive analytics. Renew. Sustain. Energy Rev. 2019, 109, 1–9. [Google Scholar] [CrossRef] [Scilit]
- Lu, Y.; Sun, L.P.; Zhang, X.Y.; Feng, F.; Kang, J.C.; Fu, G.Q. Condition based maintenance optimization for offshore wind turbine considering opportunities based on neural network approach. Appl. Ocean. Res. 2018, 74, 69–79. [Google Scholar] [CrossRef] [Scilit]
- Uzunoglu, E.; Karmakar, D.; Guedes Soares, C. Floating Offshore Wind Platforms; Castro-Santos, L., Diaz-Casas, V., Eds.; Springer International Publishing: Cham, Switzerland, 2016; pp. 53–76. [Google Scholar]
- Santos, F.P.; Teixeira, A.P.; Guedes Soares, C. Review of wind turbine accident and failure data. In Renewable Energies Offshore; Guedes Soares, C., Ed.; Taylor & Francis Group: London, UK, 2015; pp. 953–959. [Google Scholar]
- Carroll, J.; McDonald, A.; McMillan, D. Failure rate, repair time and unscheduled O&M cost analysis of offshore wind turbines. Wind Energy 2015, 19, 1107–1119. [Google Scholar]
- Cortes, C.; Vapnik, V. Support-vector networks. Mach. Learn. 1995, 20, 273–297. [Google Scholar] [CrossRef] [Scilit]
- Schölkopf, B.; Smola, A.J.; Williamson, R.C.; Bartlett, P.L. New support vector algorithms. Neural Comput. 2000, 12, 1207–1245. [Google Scholar] [CrossRef] [Scilit] [PubMed]
- Zhang, X.; Sun, L.P.; Sun, H.; Guo, Q.; Bai, X. Floating offshore wind turbine reliability analysis based on system grading and dynamic FTA. J. Wind Eng. Ind. Aerodyn. 2016, 154, 21–33. [Google Scholar] [CrossRef] [Scilit]
- Pandit, R.K.; Kolios, A.; Infield, D. Data-Driven weather forecasting models performance comparison for improving offshore wind turbine availability and maintenance. IET Renew. Power Gener. 2020. [Google Scholar] [CrossRef] [Scilit]
- Cheng, W.Y.Y.; Bourgeois, A.J.; Liu, J.; Wu, J.; Haupt, S.E. Short-term wind forecast of a data assimilation/weather forecasting system with wind turbine anemometer measurement assimilation. Renew. Energy 2017, 107, 340–351. [Google Scholar] [CrossRef] [Scilit]
- Scheu, M.; Matha, D.; Muskulus, M. Validation of a Markov-Based Weather Model for Simulation of O&M for Offshore Wind Farms; International Society of Offshore and Polar Engineers (ISOPE): Mountain View, CA, USA, 2012. [Google Scholar]
- Martins, D.; Muraleedharan, G.; Guedes Soares, C. Weather Window Analysis of a Site off Portugal; Guedes Soares, C., Santos, T.A., Eds.; Taylor & Francis Group: London, UK, 2015; pp. 1329–1337. [Google Scholar]
- Erich, H. Wind Turbines: Fundamentals, Technologies, Applications, Economics; Springer: Basingstoke, UK, 2006. [Google Scholar]
- Tuyet, N.T.A.; Chou, S.Y. Maintenance strategy selection for improving cost-effectiveness of offshore wind systems. Energy Convers. Manag. 2018, 157, 86–95. [Google Scholar]
- Xie, L.; Rui, X.; Li, S.; Hu, X. Maintenance Optimization of Offshore Wind Turbines Based on an Opportunistic Maintenance Strategy. Energies 2019, 12, 2650. [Google Scholar] [CrossRef] [Scilit]
- Zhang, C.; Gao, W.; Yang, T.; Guo, S. Opportunistic maintenance strategy for wind turbines considering weather conditions and spare parts inventory management. Renew. Energy 2019, 133, 703–711. [Google Scholar] [CrossRef] [Scilit]

© 2020 by the authors. Licensee MDPI, Basel, Switzerland. This article is an open access article distributed under the terms and conditions of the Creative Commons Attribution (CC BY) license (http://creativecommons.org/licenses/by/4.0/).