


Abstract
Recently, Low-Voltage DC (direct current) distribution systems have received high lights according to the expansion of DC generations and DC loads such as photovoltaics (PV) generations, electric vehicles (EVs), light emitting diodes (LEDs), computers, DC homes, etc. Low-Voltage DC distribution systems have optimistic perspectives since DC has various good aspects compared to alternating current (AC). However, ensuring safety of human and electric facility in Low-Voltage DC is not easy because of arc generation and difficulty of arc-extinguishing. This paper constructs a low-voltage DC circuit and studies the arc interruption that occurs when separating electrodes from where load currents flow. Also, arc extinguishers are experimented upon and analysed in various levels of source voltage and load currents conditions. Voltage and current characteristics for arc interruption are identified based on experimental results, and we establish the electric generation for arc interruption. Further, the voltage–current characteristics and the correlation of arc during arc duration time arc are verified, and the voltage–current equation and DC arc resistance model for the breaking arc are developed.
1. Introduction
With the recent increase in loads using direct current (DC) power, such as TVs, computers, Light Emitting Diodes (LED) lights, and the like, and increase of renewable power sources in the form of distributed generation, demand for DC distribution is increasing [1,2]. The rapid development of the information society has led to an increase in the direct current loads such as Information Technology (IT)-related digital devices. In electricity-isolated areas where the people do not receive electricity, renewable power generation with distributed generation form is the most effective means to provide electric energy. In this situation, it is possible to reduce the power conversion step to supply DC load by changing the power distribution system from Alternating Current (AC) system to DC system, which reduces installation cost and increase energy efficiency. These advantages are expected to increase the demand for DC distribution system in homes and buildings.
However, in order to enable the DC distribution system, it is important to solve the problem of melting of contacts, fire, etc. caused by the arc in a socket-outlet plug [3] and circuit breaker [4]. However, knowledge of the arc in DC system has not been fully discovered, and there has not yet been a clear definition of the arc in DC power system.
In 1889, Paschen experimented to find that the voltage at which gas discharge begins depends on the type of gas and is proportional to the product of the pressure of the gas and the distance between electrodes. Paschen experimented with a situation where a so-called parallel arc was generated by applying a constant voltage to a test circuit where the distance between electrodes are fixed with no initial current. Through this experiment, it is possible to find that the parallel arc arises when the distance between the electrodes is reduced to a certain level during by applying a constant voltage [5].
Compared with the parallel arc, a series arc is generated when contact electrodes are separated in condition that initial current flows. The series arc has been applied in the principle of arc lamp and arc welding from the 1800s to the present. Since 1902, various models for the series arc have been suggested. In these models, an arc voltage is defined as a function of an arc current and a gap distance [6,7,8,9,10]. As the conventional studies for the series arc are concentrated on the arc lamp applications, only the quasi-static arc characteristic was investigated when the arc is continuously sustained in the fixed gap distance.
Recently, a series-breaking arc in circuit breakers, switches, and socket outlets and plugs as a protective device for DC distribution has been researched [11]. The series-breaking arc generated in the protective devices is likely to cause fire by high temperature plasma generation. The problem in the protective devices should be properly solved to install them in electric facilities. Therefore, it is necessary to understand precisely the initiation, sustenance, and extinguishment of the series breaking arc generated in the protective device during the contact electrodes are separating. Until now, many researches have been made on DC breaking arc generated at electrodes during load currents flow without clearly clarified, the relationship between the voltage and current characteristics at the electrodes [12,13,14].
This paper has composed a low-voltage DC circuit, and experimented on breaking arc that occurs when separating electrodes at various levels of source voltage and load current conditions.
2. DC Arc Experiment Method
2.1. Experimental Setup
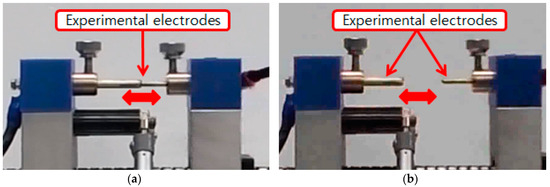
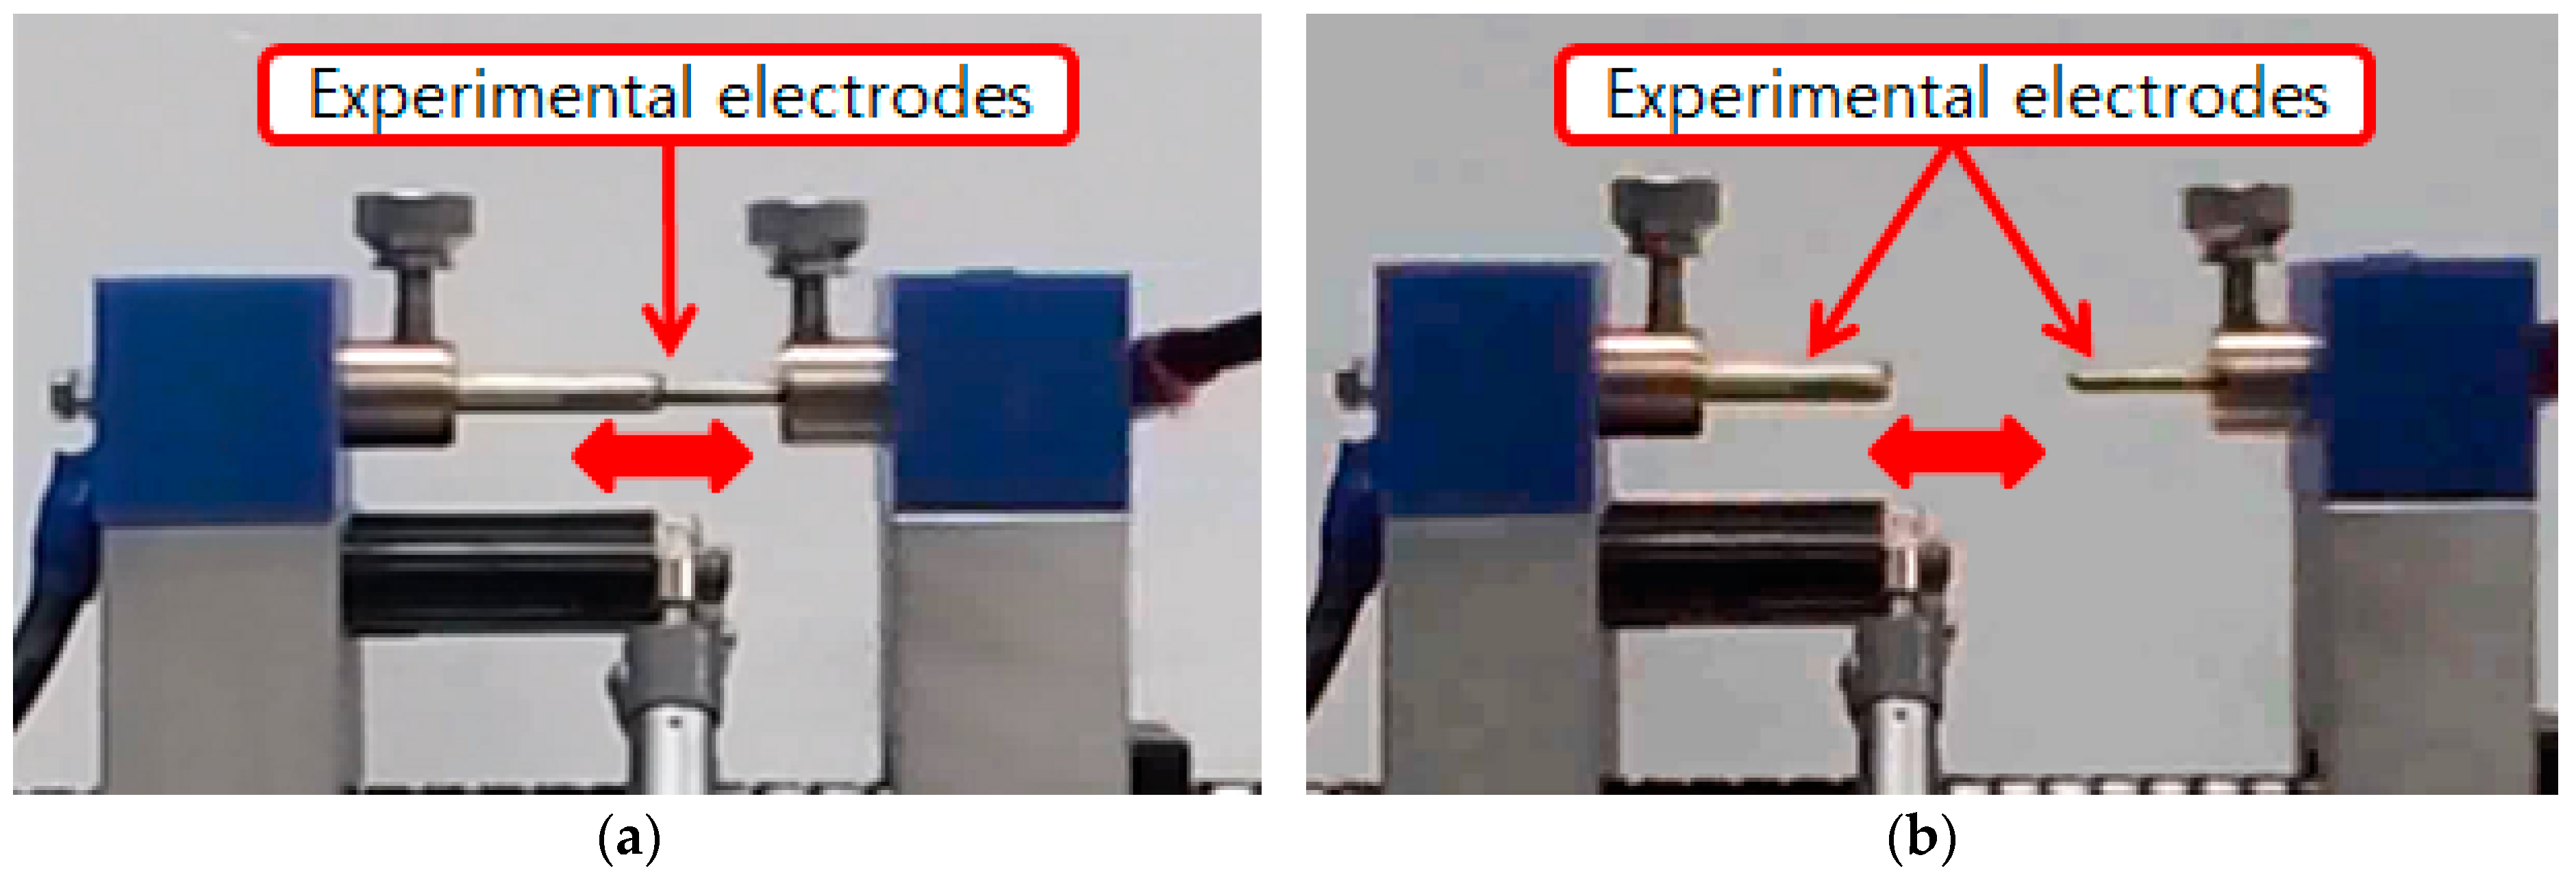
As shown in Figure 1, a switching device is developed to experiment occurrences of arcs when electrodes are separated during load current flows. The experiment device was installed on horizontal level, and the material for electrodes is pure bronze.
Figure 1.
Switching device for experiment; (a) ON state, (b) OFF state.
In this experiment, the maximum separation distance of the electrodes was 20 mm and the electrode separation speed was set at 150 mm/s. The power supply voltage varied from 50 V to 400 V and the load current varied from 0.5 A to 10 A to investigate DC breaking arcs at various voltages and currents. Each experiment was performed 3 times to reduce measurement error. Voltage and current were measured using an oscilloscope during the electrodes are separating. Experimental conditions are as shown in Table 1.
Table 1.
Experiment condition.
2.2. Experiment of DC Arc
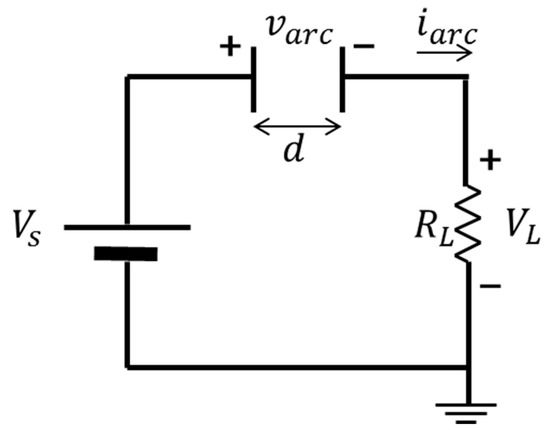
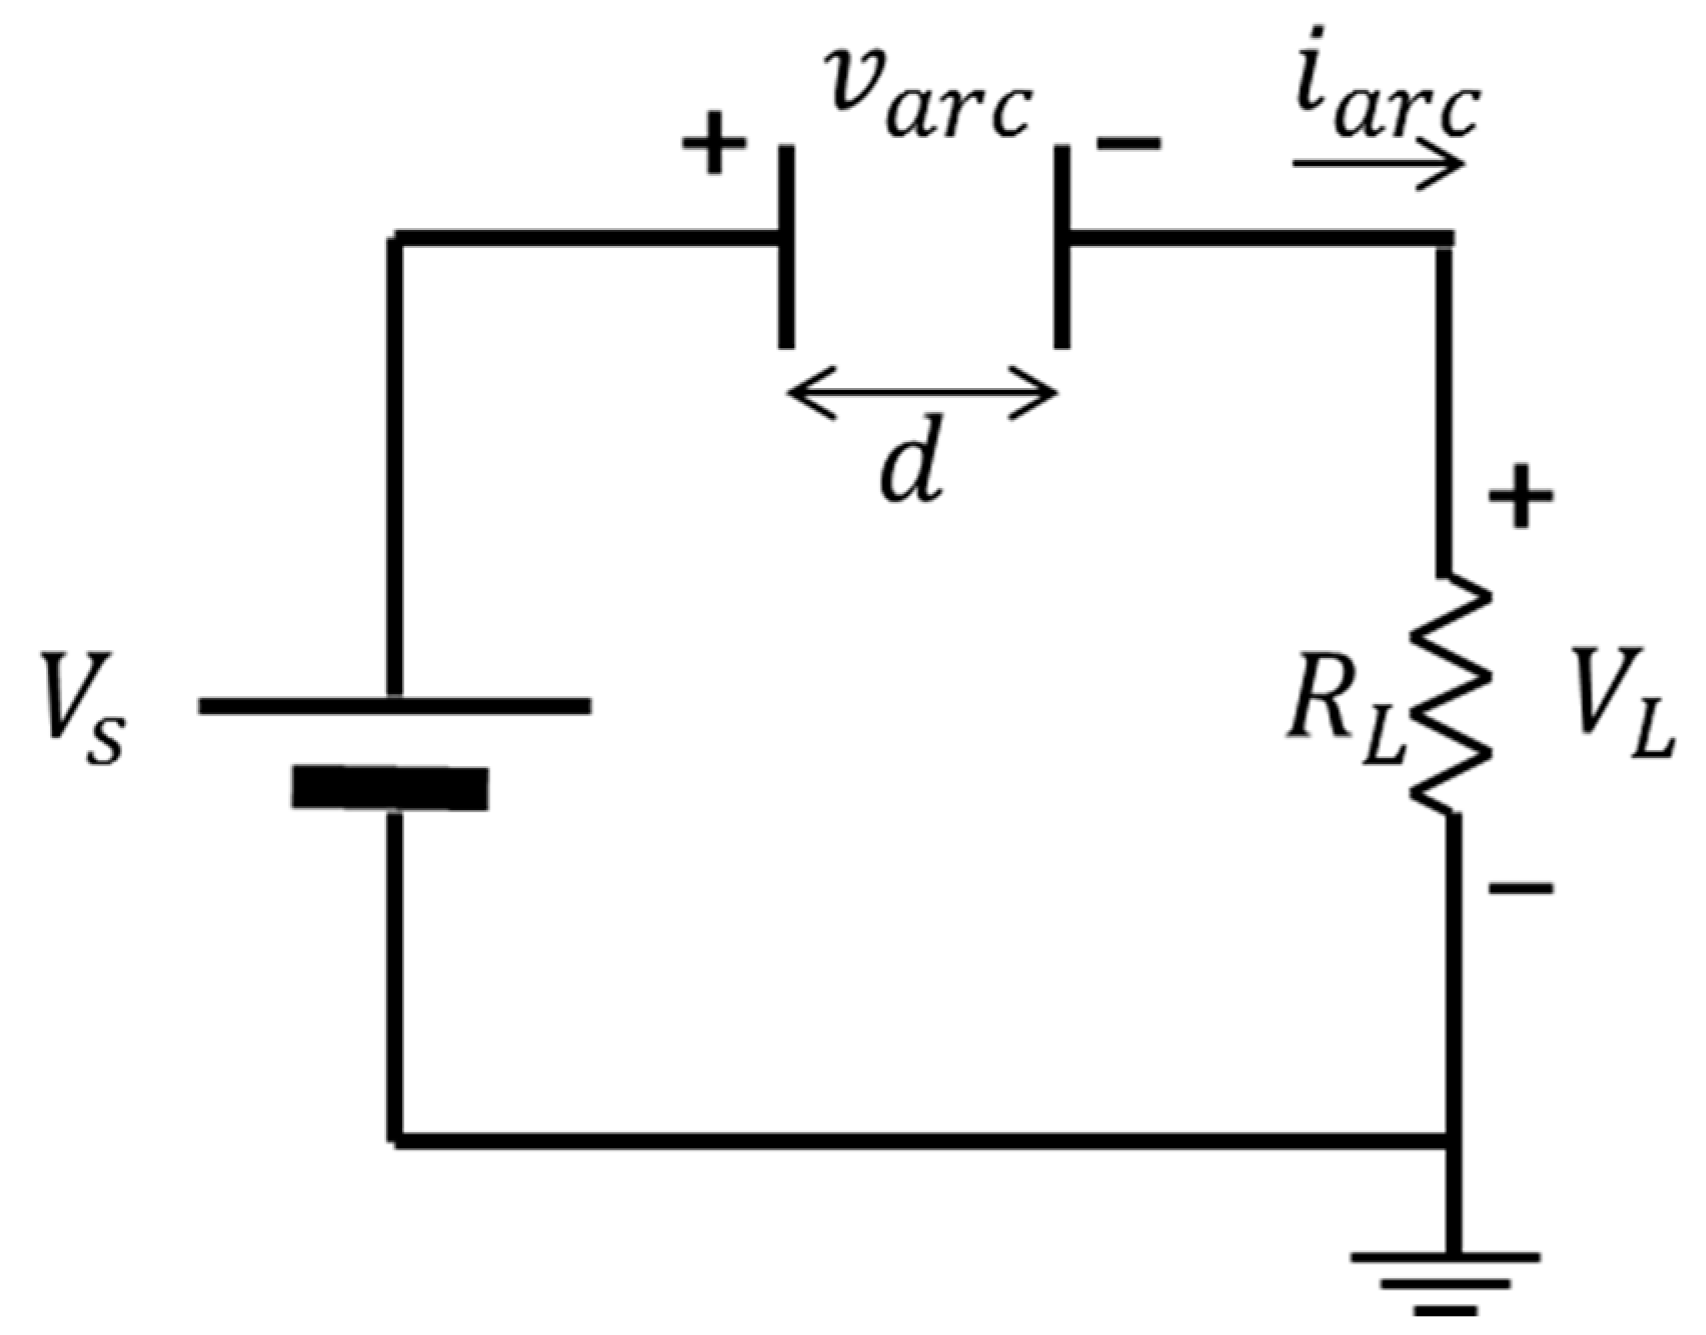
In this study, the arc experiment of DC circuit as shown in Figure 2 was constructed to investigate the arc generation during the electrode is separating in a state in which initial load current flows.
Figure 2.
Direct current (DC) arc experiment circuit.
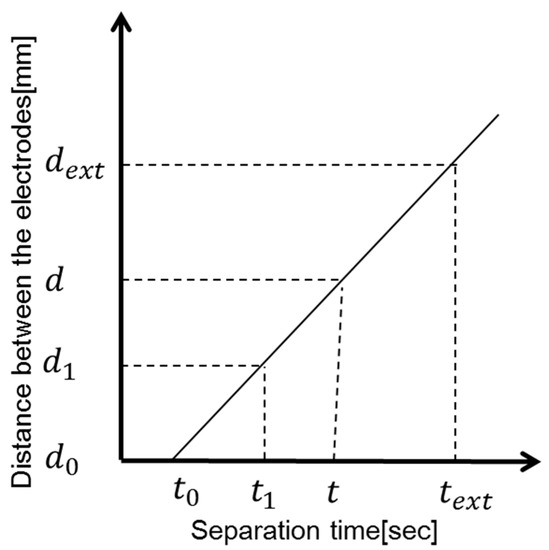
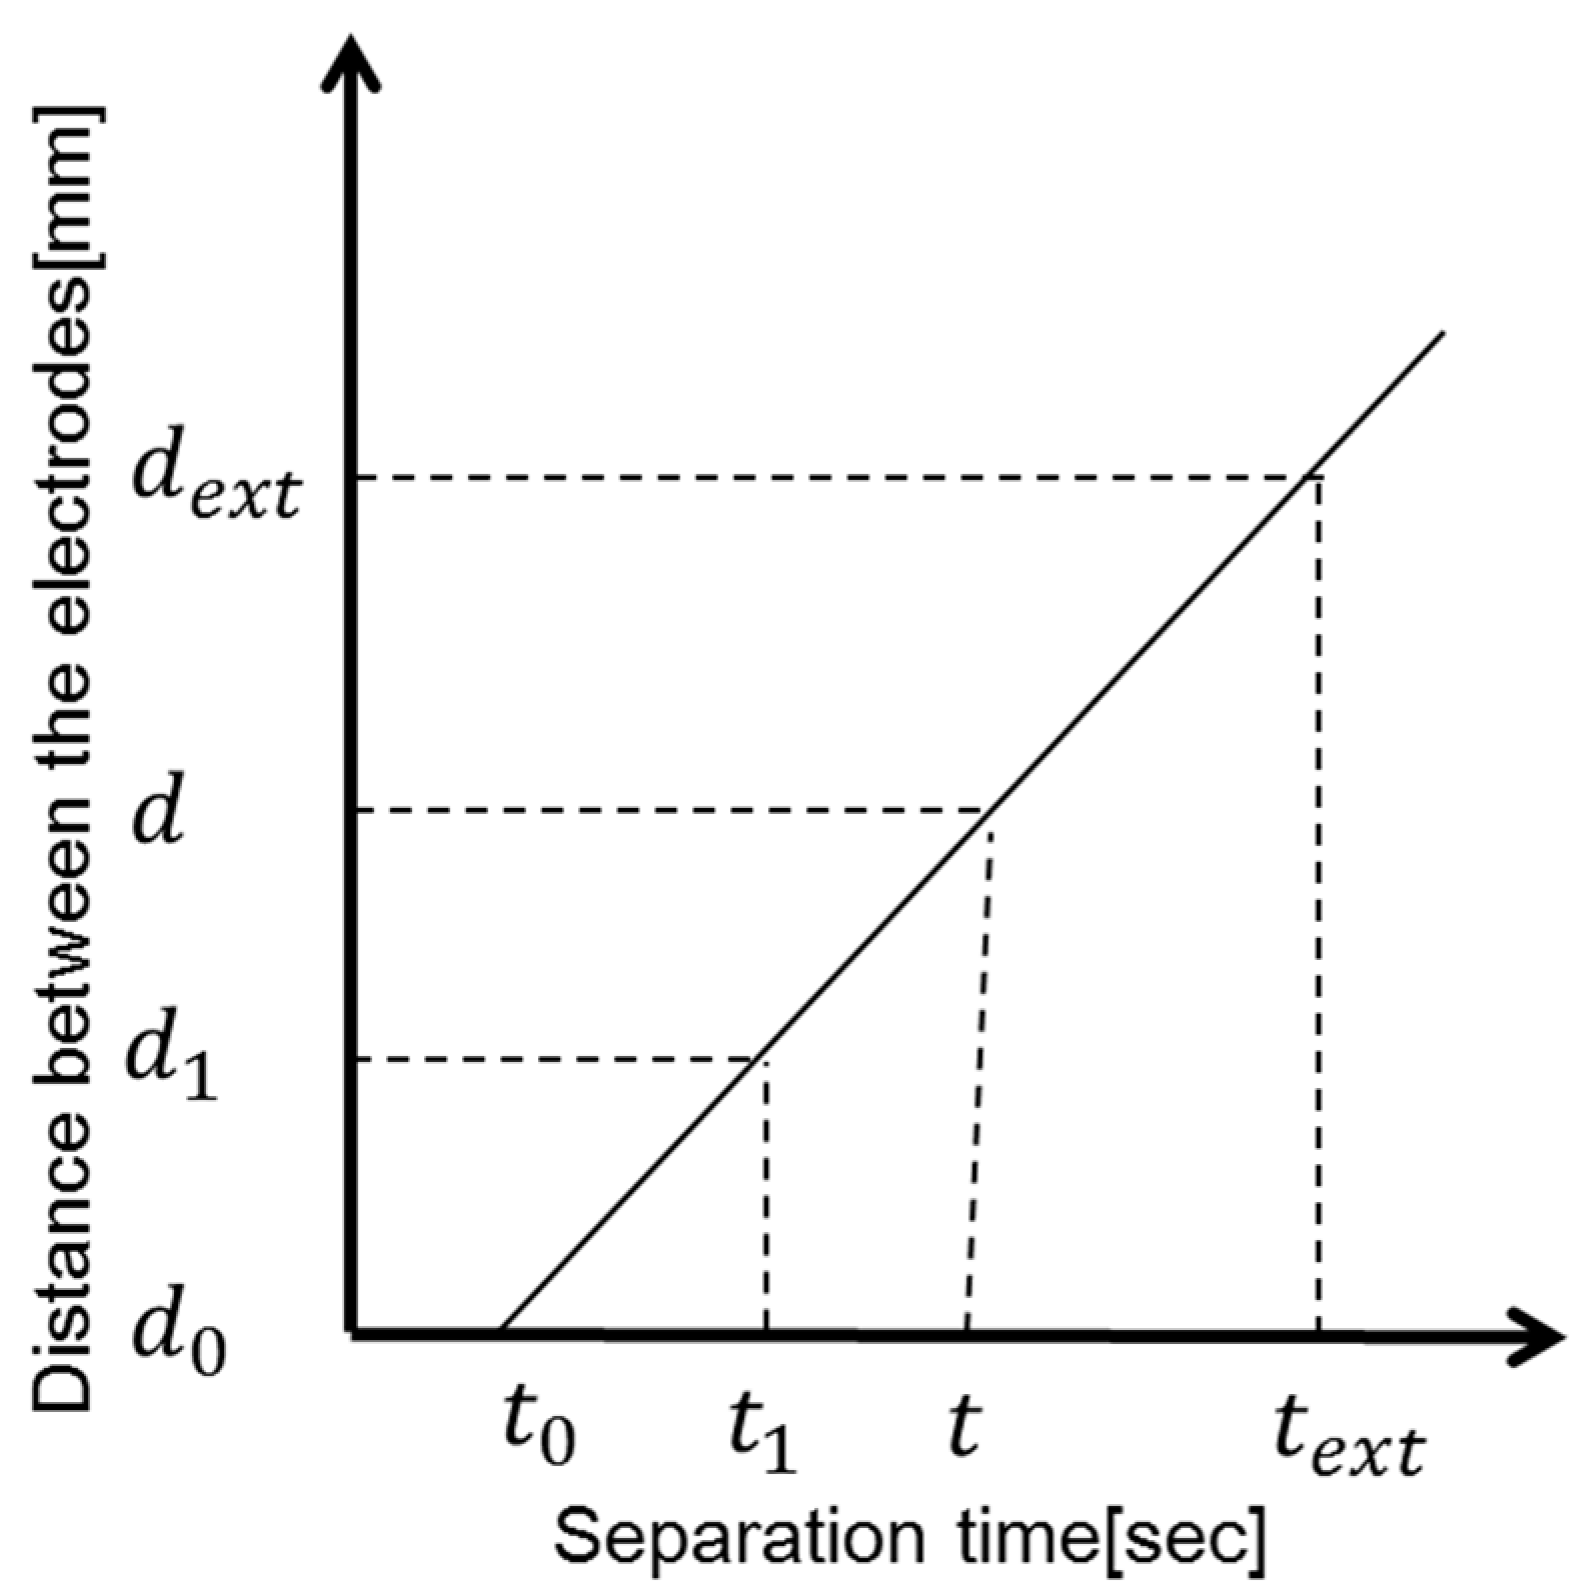
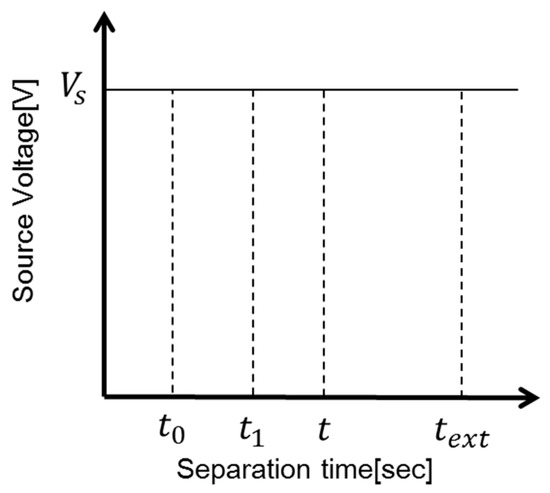
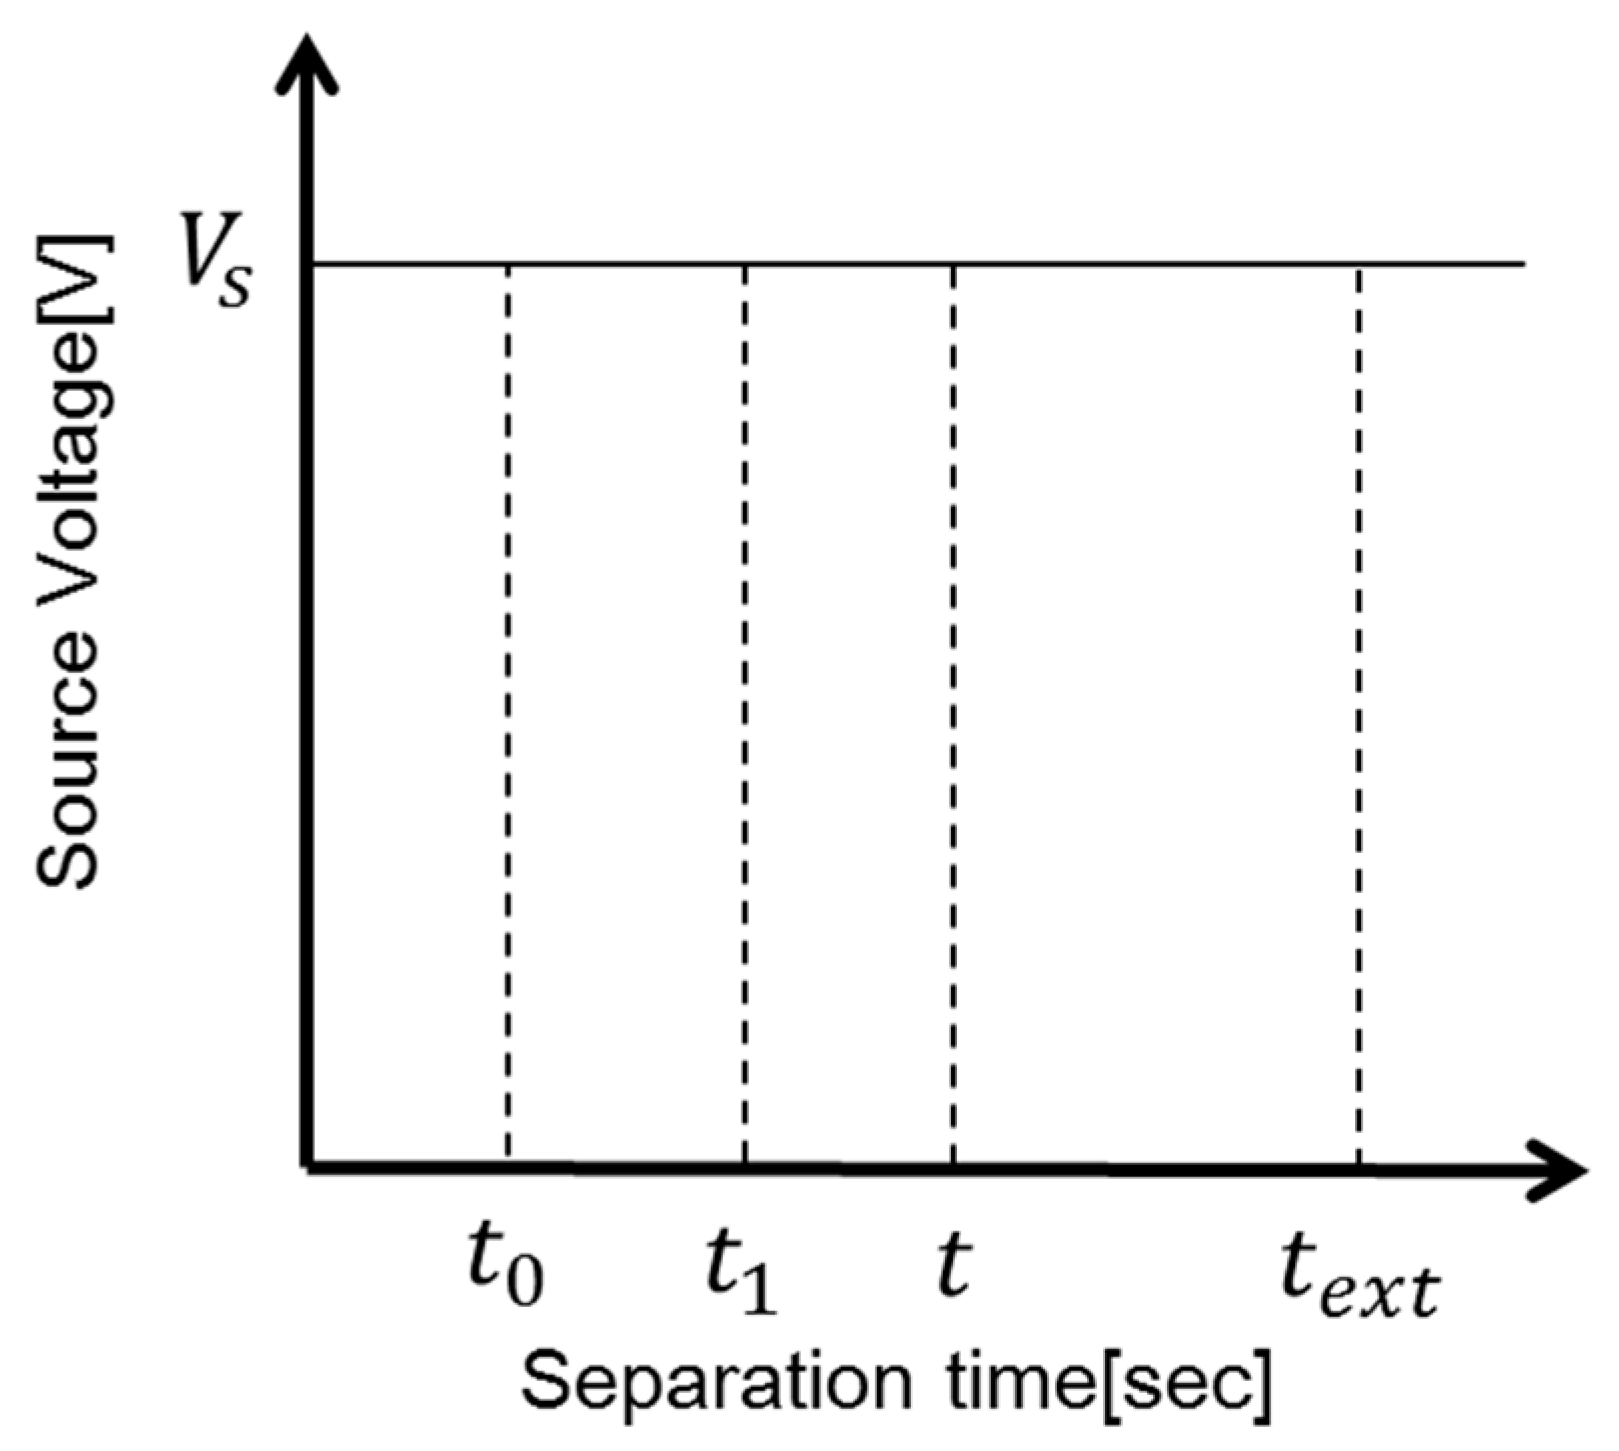
Figure 3 shows the relation between the separation time (t) and the distance between electrodes (d) with a separating speed of 150 mm/s. Figure 4 shows the relation between the separation time (t) and the source voltage (VS).
Figure 3.
Distance between the electrode.
Figure 4.
Source voltage.
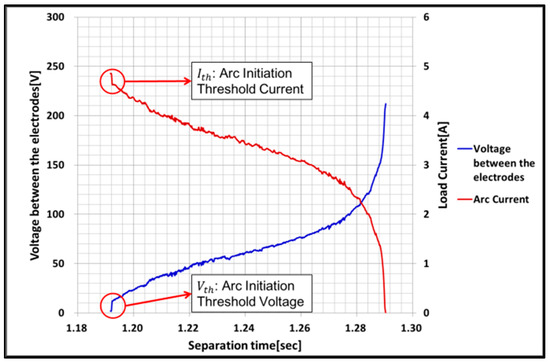
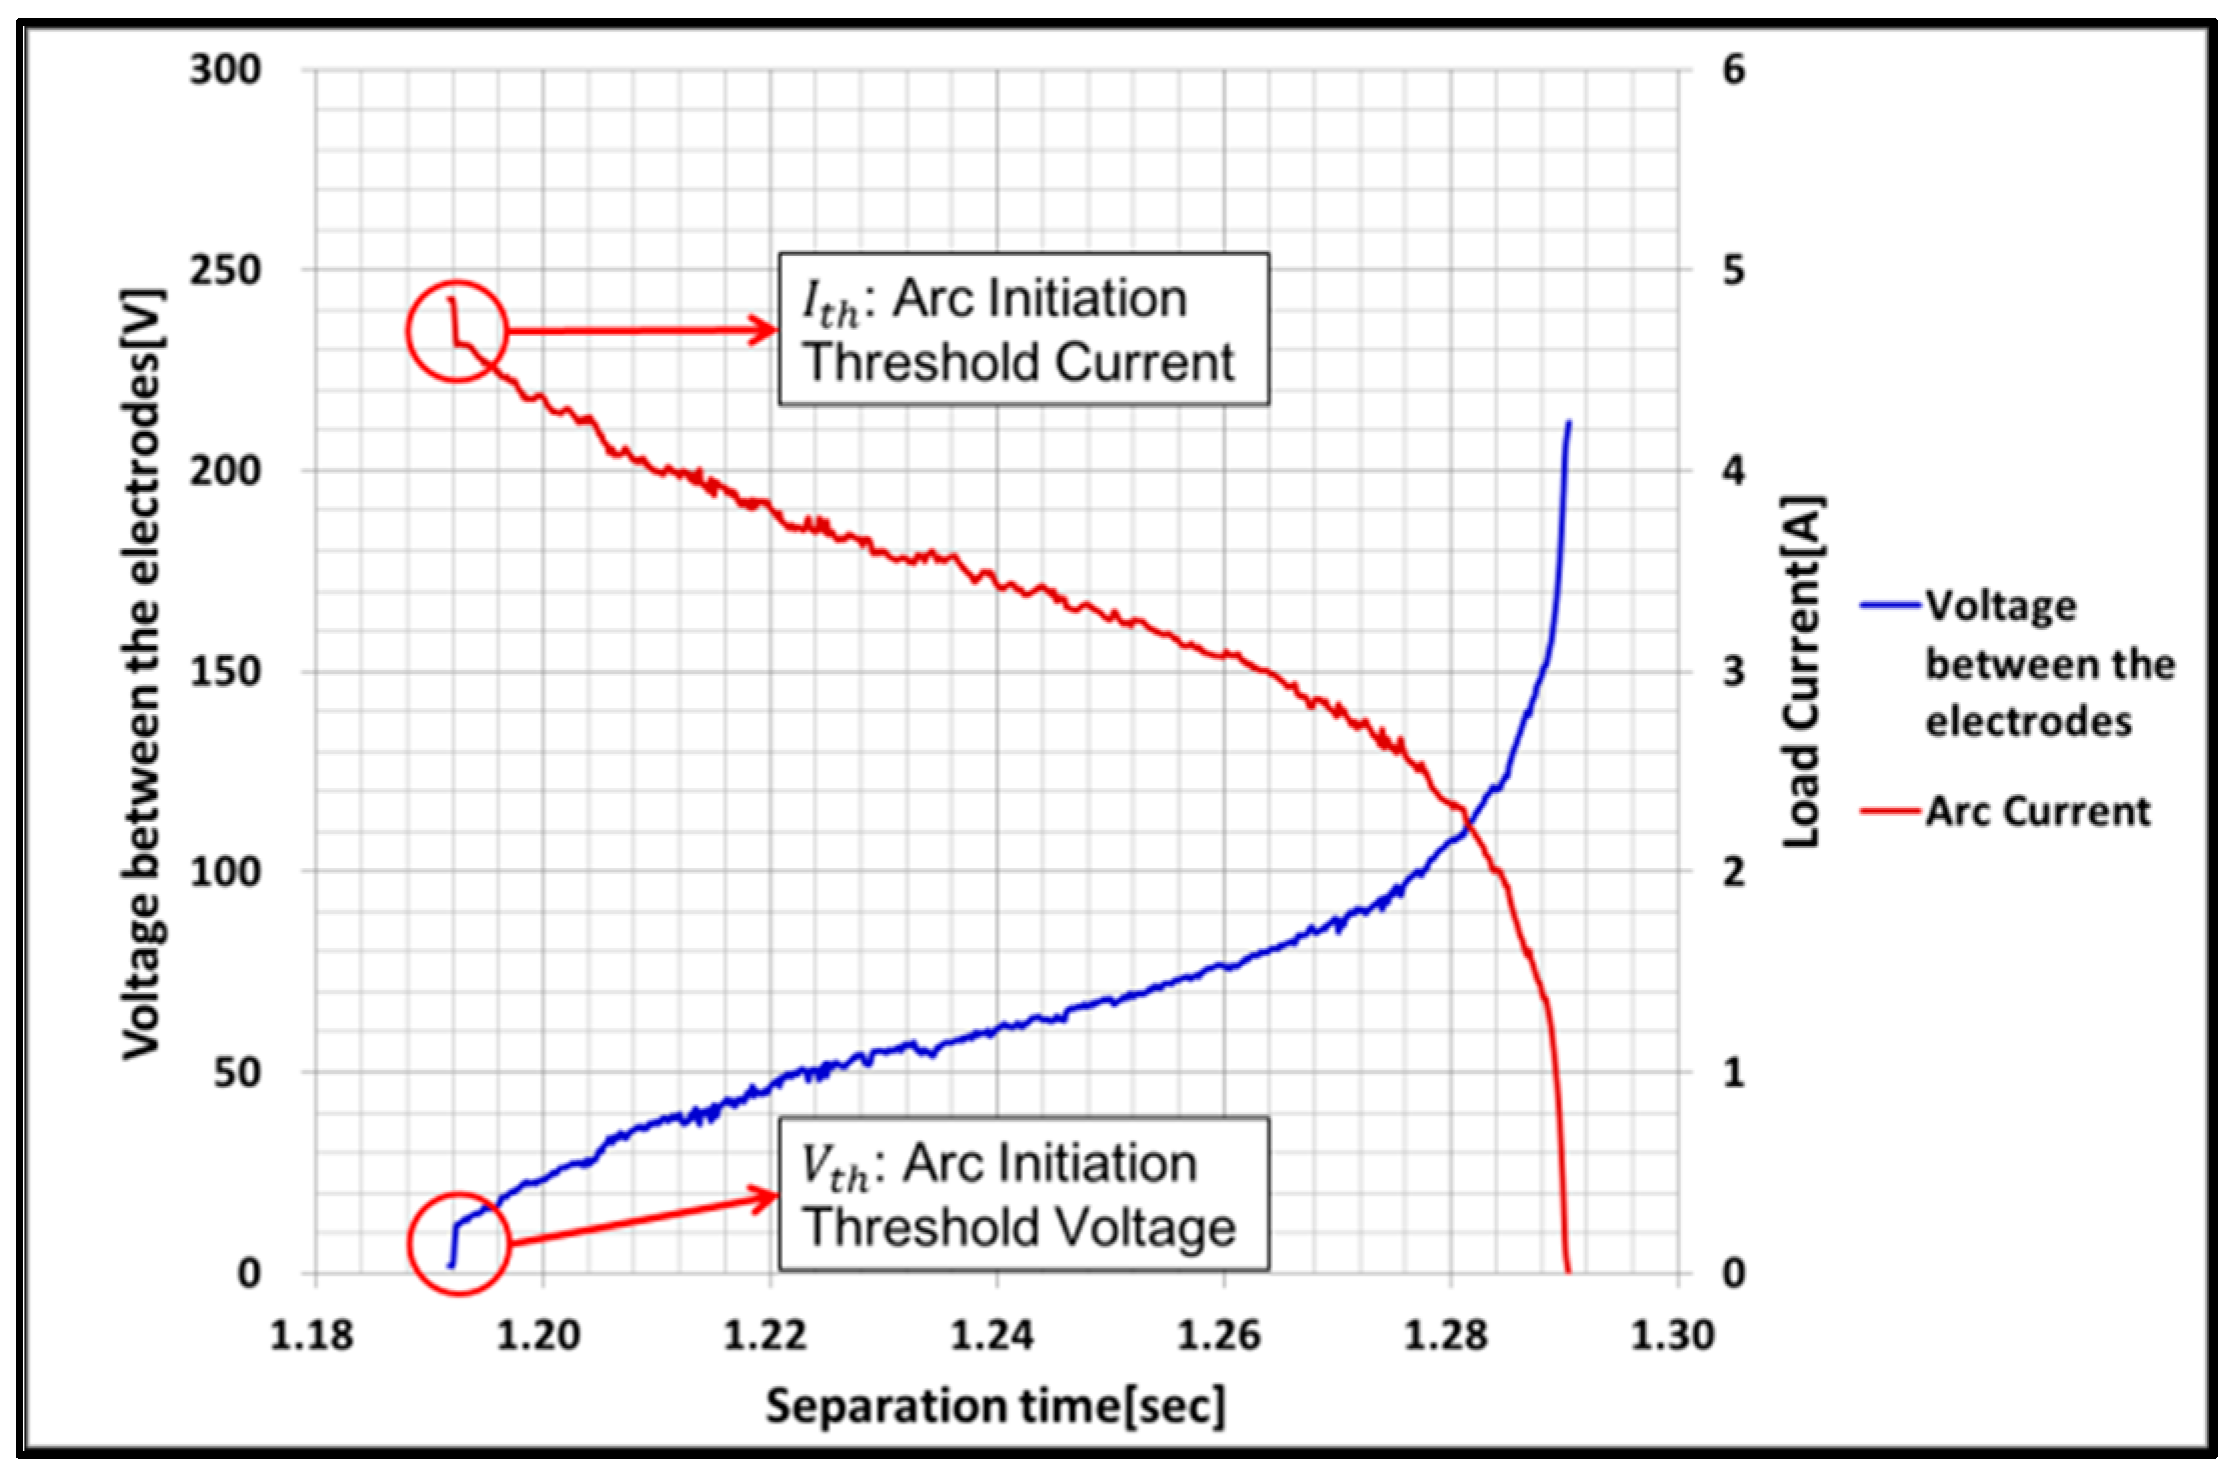
When the electrode is separated in a state in which the initial load current flows, the measured experimental waveforms are as follows in Figure 5.
Figure 5.
Experimental waveforms.
In Figure 5, the instantaneously increased voltage between the electrodes during arc initiation is defined as arc initiation threshold voltage Vth; and the instantaneously decreased current during arc initiation is defined as arc initiation threshold current Ith.
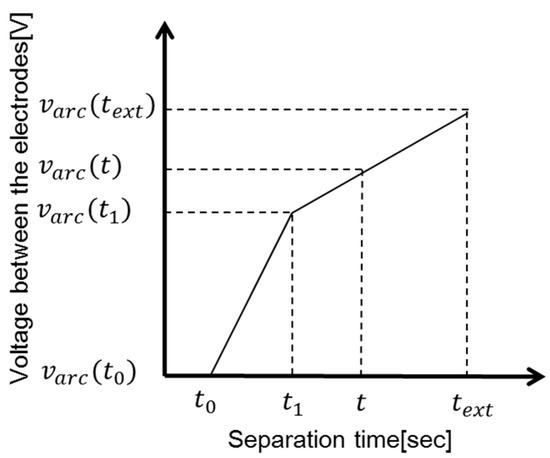
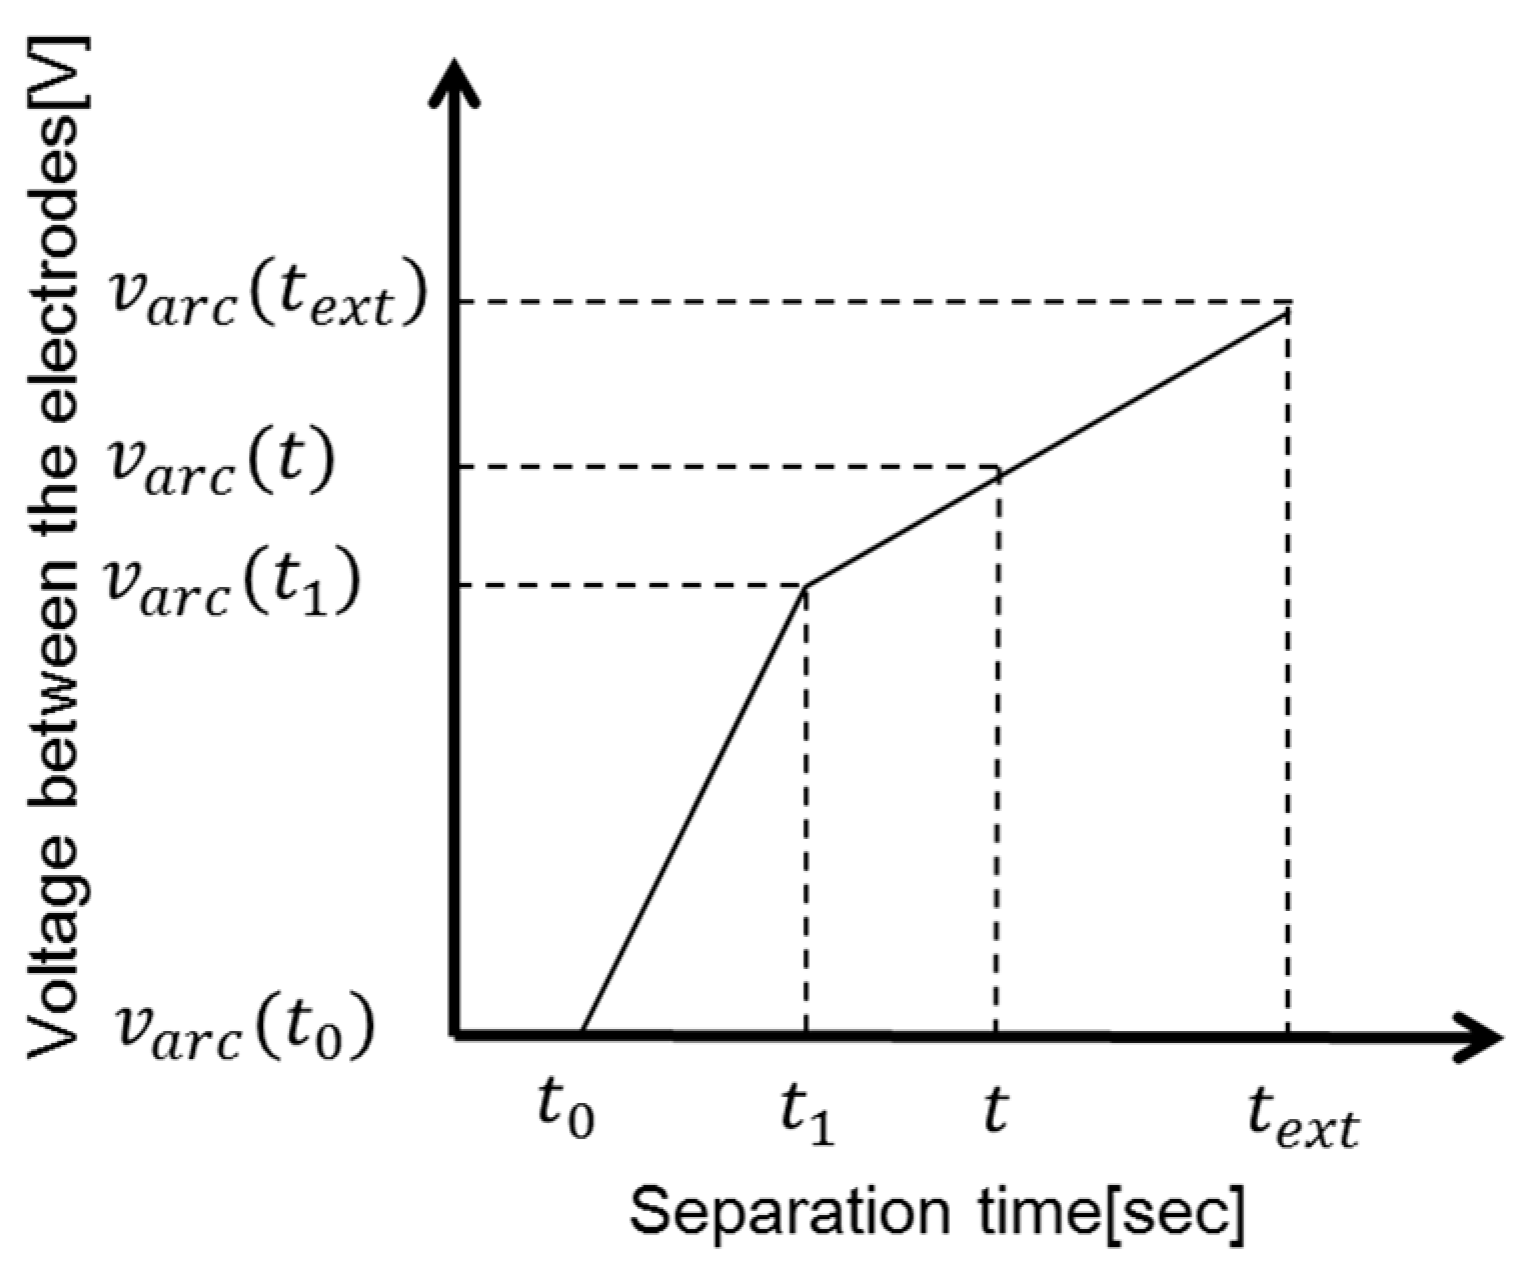
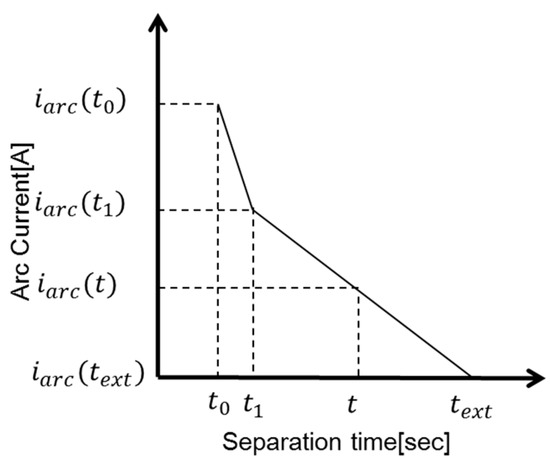
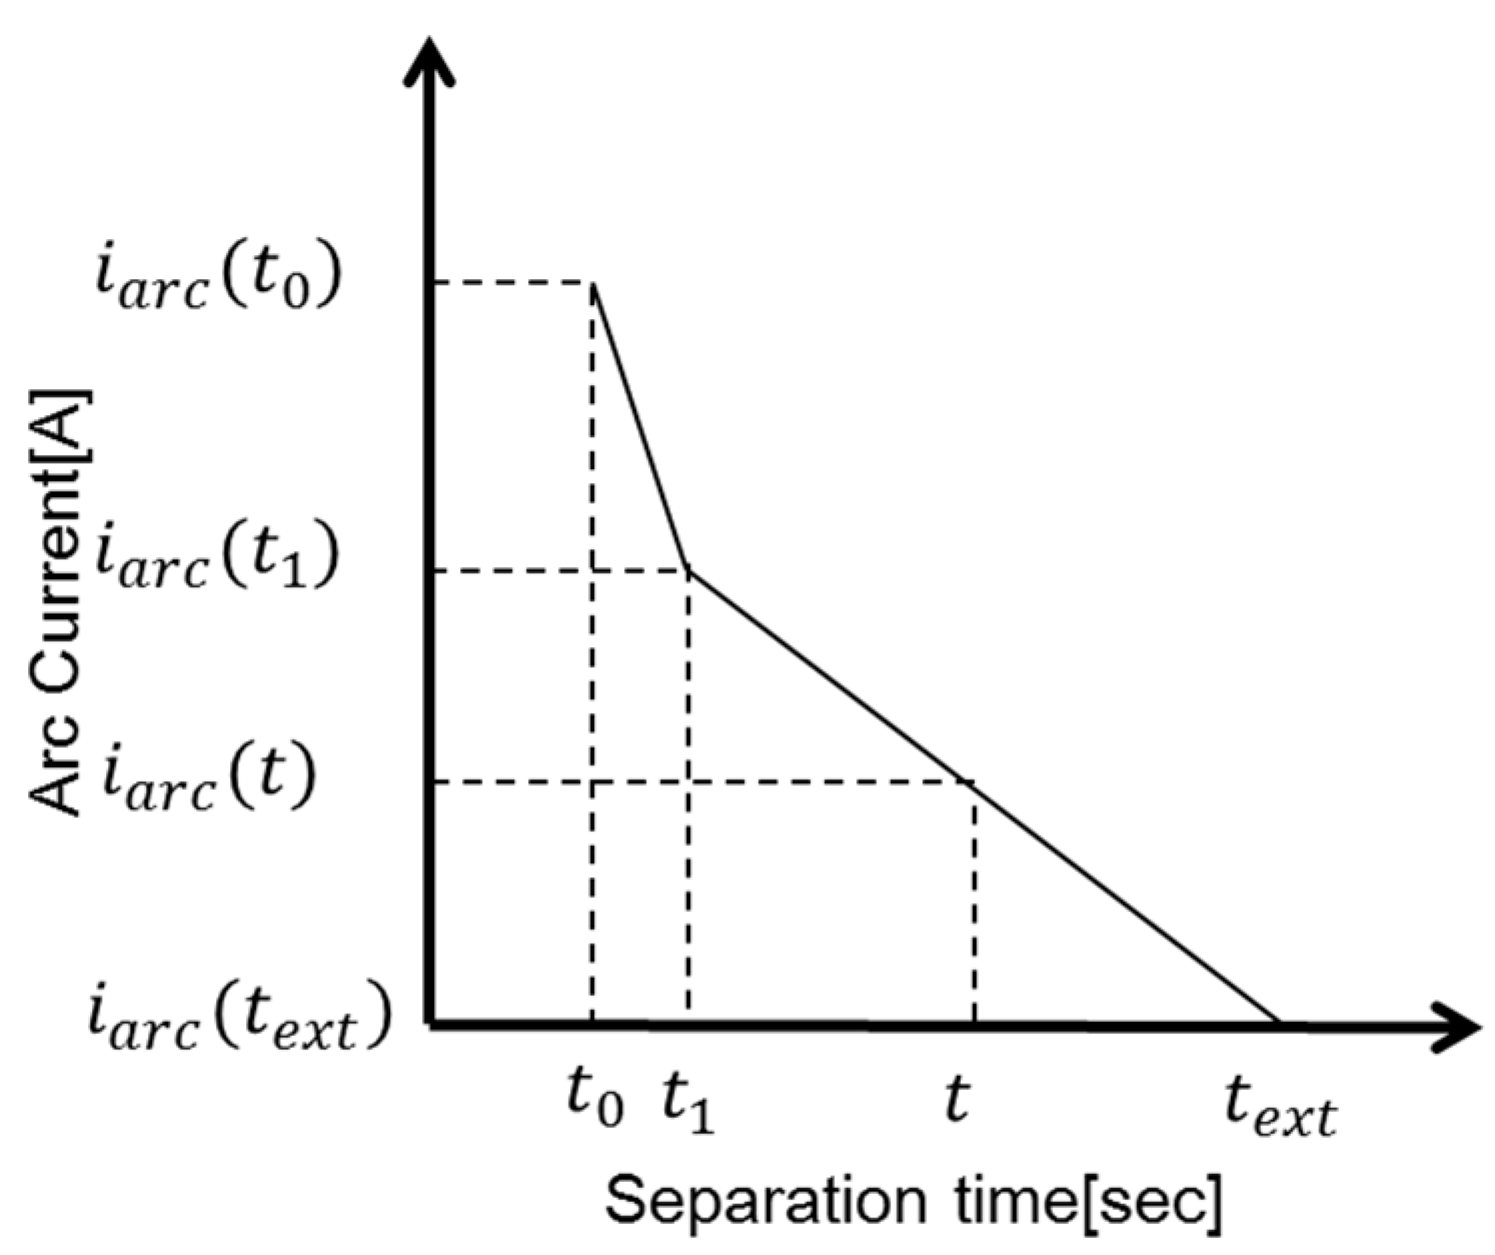
Figure 6 shows the relation of arc voltage between electrodes (varc) and separation time (t). Figure 7 shows the relation of arc current (iarc) and arc separation time (t).
Figure 6.
Arc voltage between the electrodes.
Figure 7.
Arc current.
varc(t0) is voltage between electrodes at separation start time, which is equal to zero. varc(text) is voltage between electrodes at the arc extinguishing point, which is equal to the source voltage (Vs). The voltage between electrodes increase rapidly between t0 and t1 and an arc occurs at t1. The voltage between electrodes at t1 is varc(t1) = Vth. The arc begins from t1 and continues to text, and the voltage between electrodes gradually increases.
Also, the arc current iarc(t0) is equal to load current IL at the electrode separation point. iarc(text) is equal to zero at the arc extinguishing point. The arc current rapidly decreases between t0 and t1, and the arc current at t1 is iarc(t1) = ILoad − Ith. The arc current continuously decreases from the arc initiation time (t1) to the arc extinguishing time (text).
3. The Experimental Results of DC Breaking Arc
3.1. Analysis of Arc Initiation Threshold Voltage ()
On the several source voltage levels in the experiment circuit in Figure 2 (50 V, 100 V, 200 V, 300 V, 400 V), load currents were variously changed and examined. After separation of the electrodes, arc initiation threshold voltage () was confirmed at the arc initiation time ().
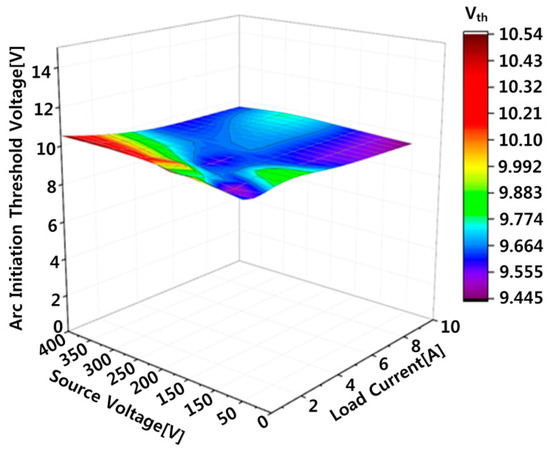
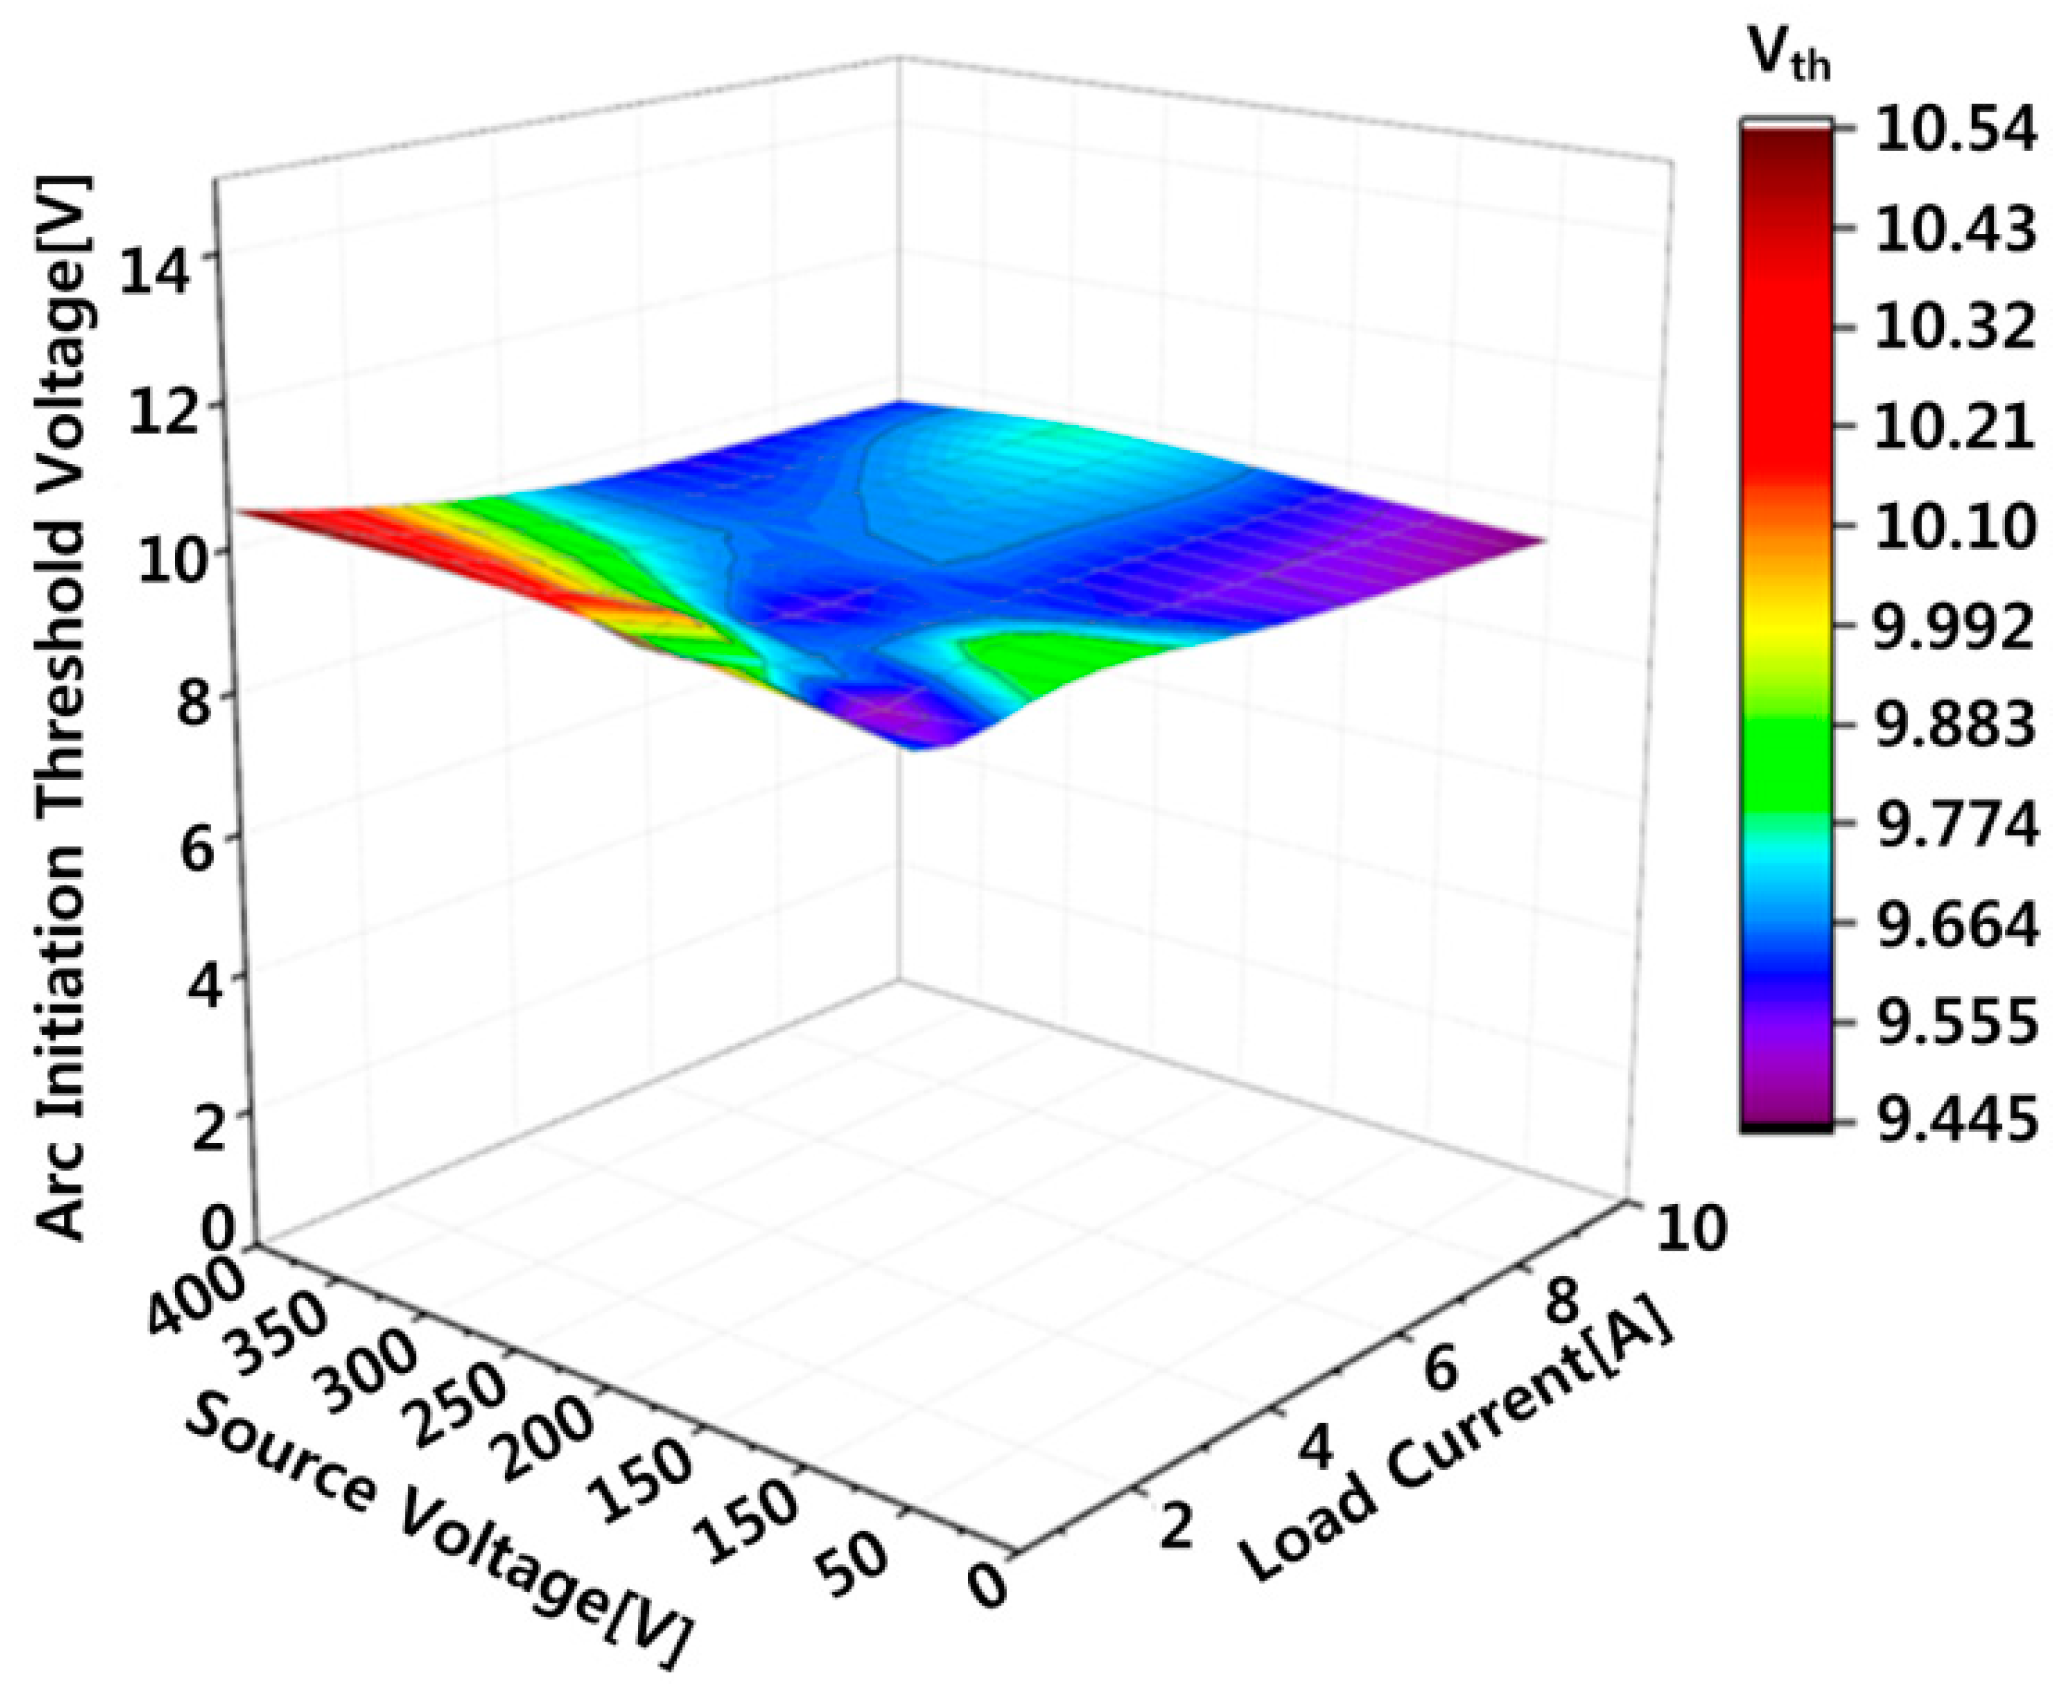
From the experimental results of DC breaking arc initiation, the arc initiation threshold voltage () at the arc initiation point () distributed within 9.45–10.54 V as shown in Figure 8 and Table 2, regardless of the magnitude of the source voltage and load currents. That is, breaking arc initiation voltage at DC can be confirmed as constant at about 10 V.
Figure 8.
Characteristics of arc initiation threshold voltage as source voltage and load current.
Table 2.
Arc initiation threshold voltage experimental results.
This can be confirmed that the arc starts when the voltage between the electrodes (voltage formed across the electrodes of the circuit breaker or switch) is about 10 V.
3.2. Analysis of Arc Initiation Threshold Current ()
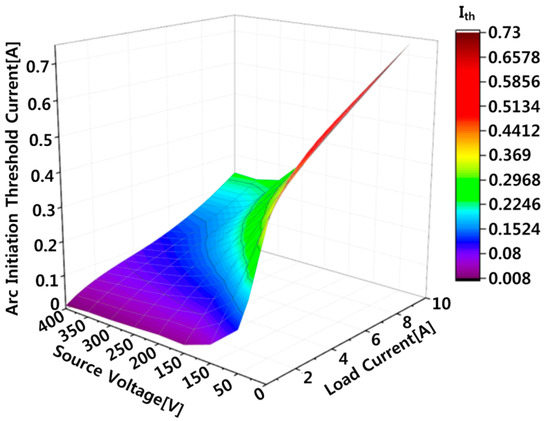
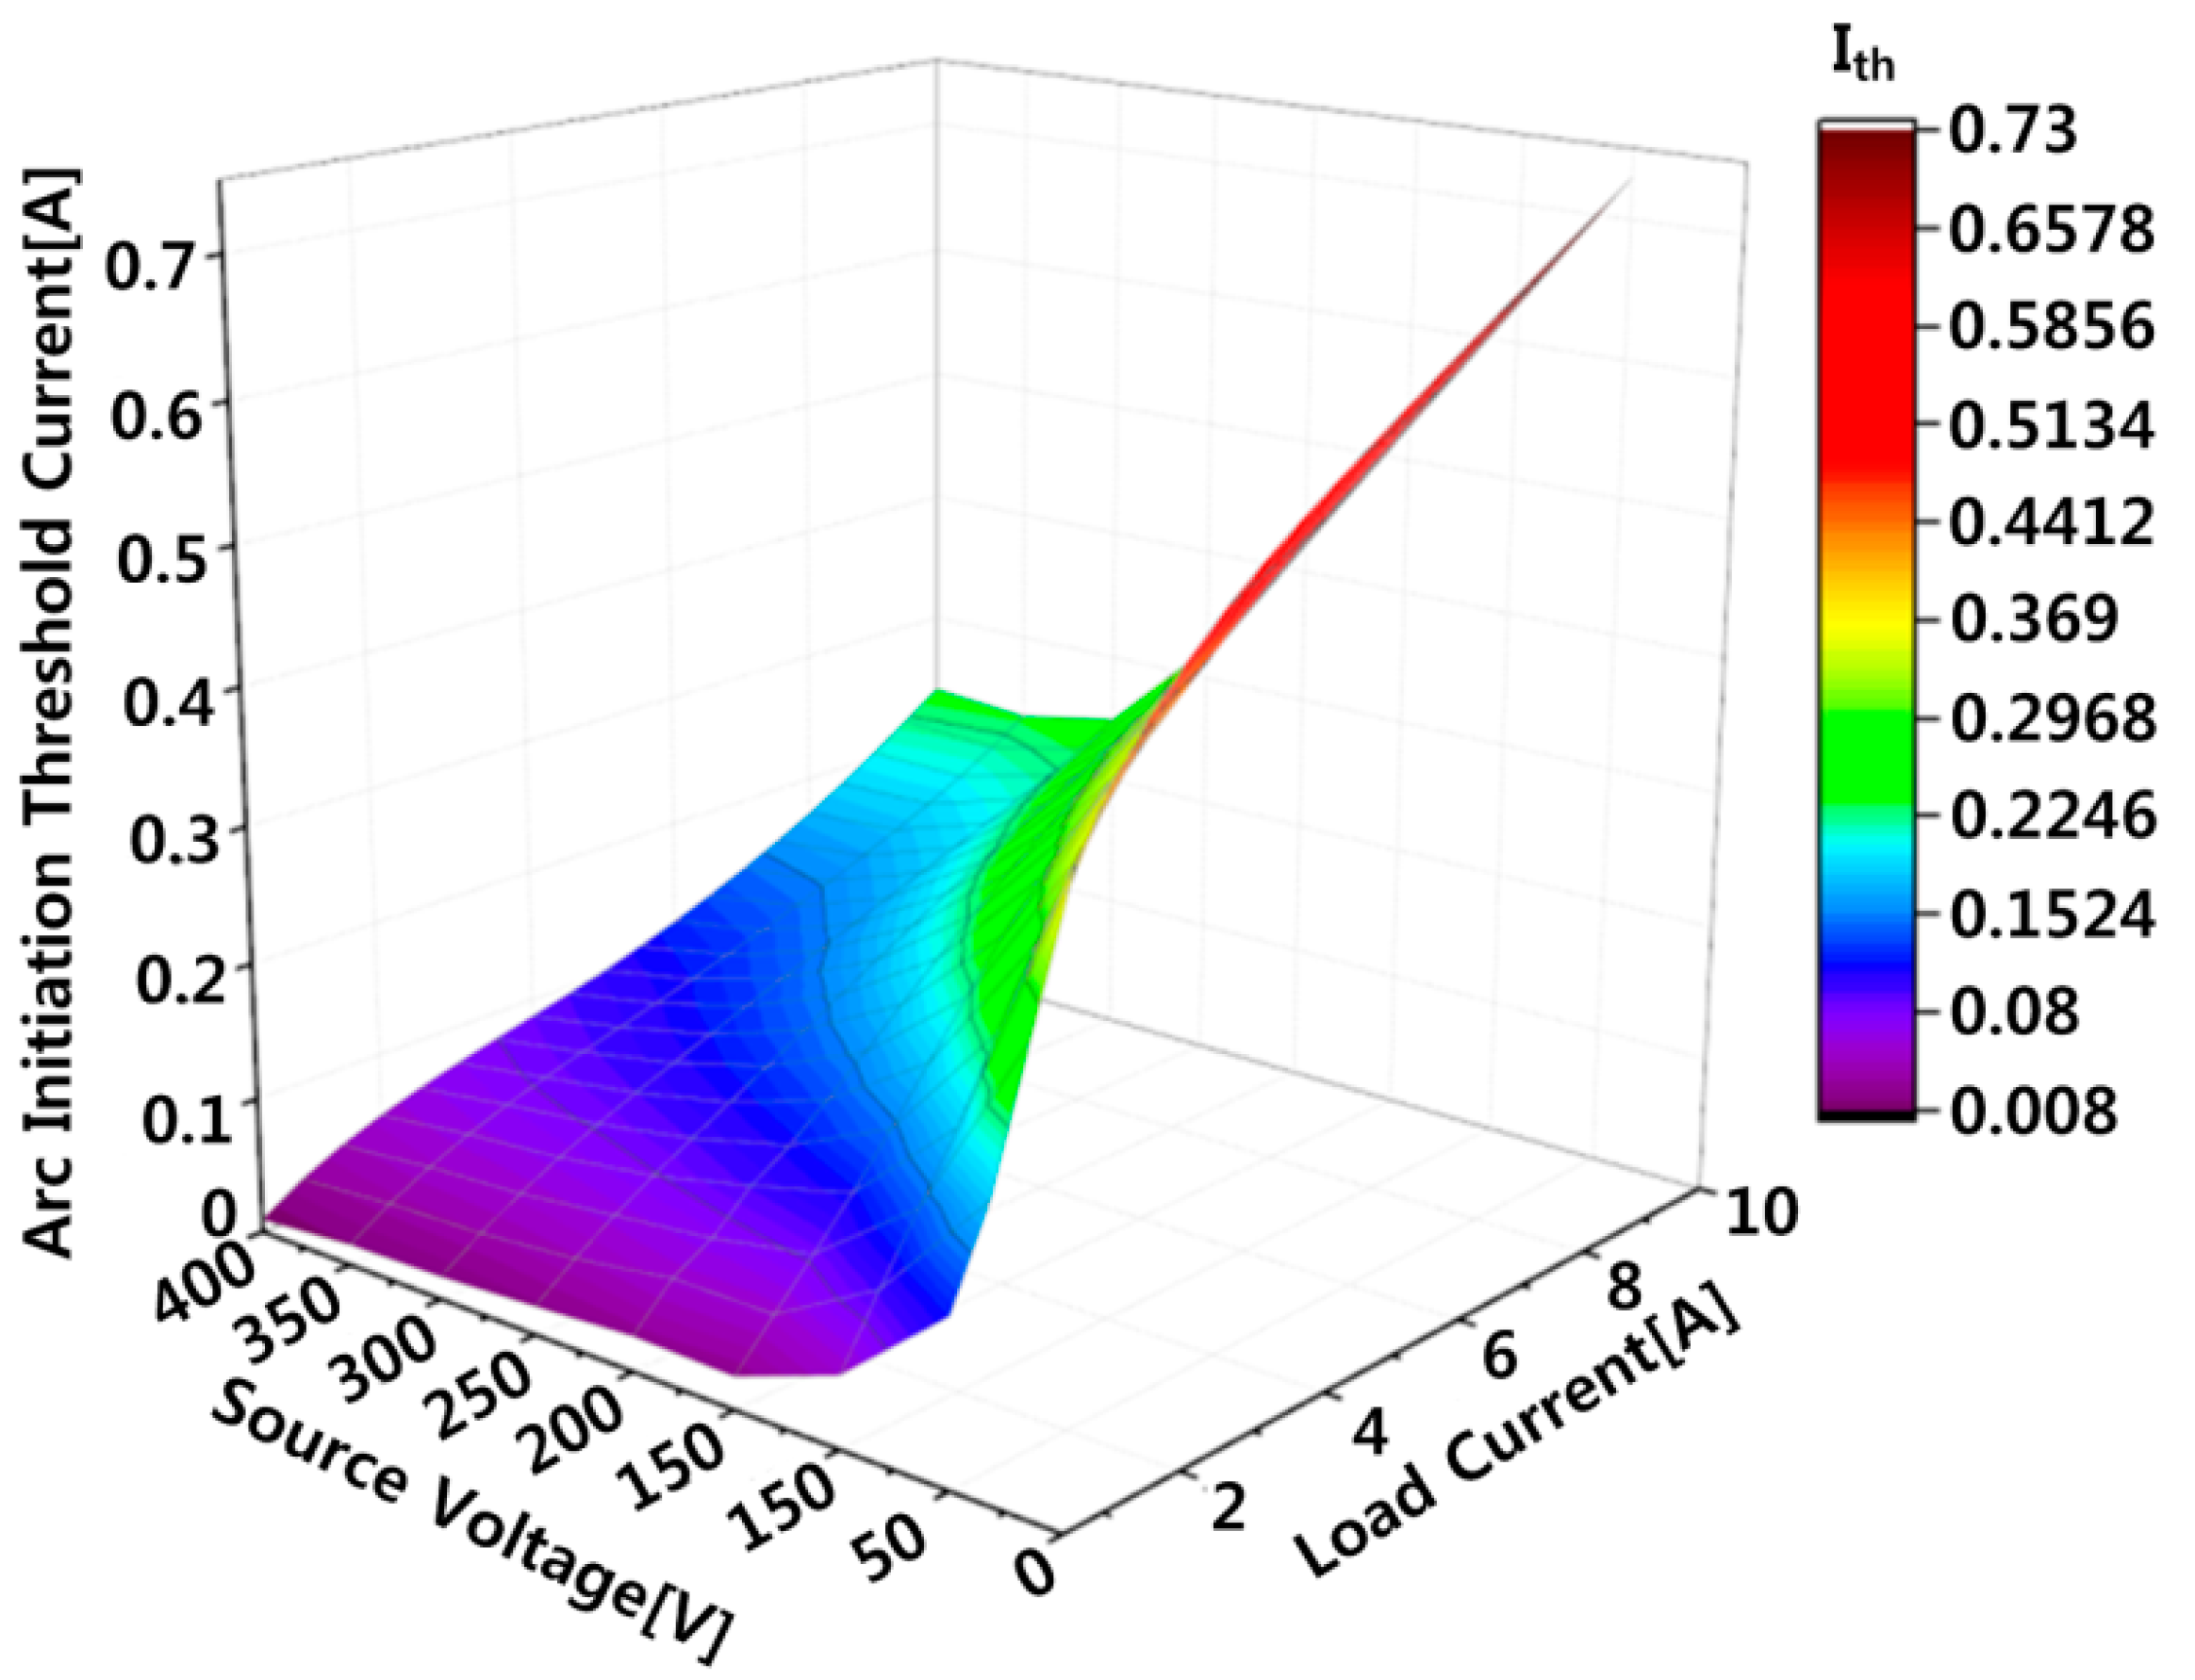
On the several source voltage levels in the experiment circuit in Figure 2 (50 V, 100 V, 200 V, 300 V, 400 V), load currents were variously changed and examined. Based on the experimental results, and are measured and the difference is calculated. The arc initiation threshold current () was confirmed at the arc initiation time ().
With the arc initiation experimental results, the arc initiation threshold current () was found to be inversely proportional to the source voltage () and proportional to the load current () as shown in Figure 9 and Table 3.
Figure 9.
Characteristics of arc initiation threshold current as source voltage and load current.
Table 3.
Arc initiation threshold current experimental results.
3.3. Analysis of Relationship between Arc Voltage () and Arc Current () between Electrodes
Equation (1) is derived based on the characteristics of the arc initiation threshold current () inversely proportional to the source voltage () and proportional to the load current ().
To find the value of a random constant , the following equation (2) is used. The constant was approximately 10 V, equal to the arc initiation threshold voltage ().
The result of Equation (2) can be applied as with Equation (3), and it is confirmed that the value of dividing the arc initiation threshold voltage by the arc initiation threshold current is equal to the load resistance ().
Since and = , Equation (4) can be as follows.
It has been confirmed that Equation (4) satisfies any random time between to . In conclusion, Equations (5–7) can be as follows.
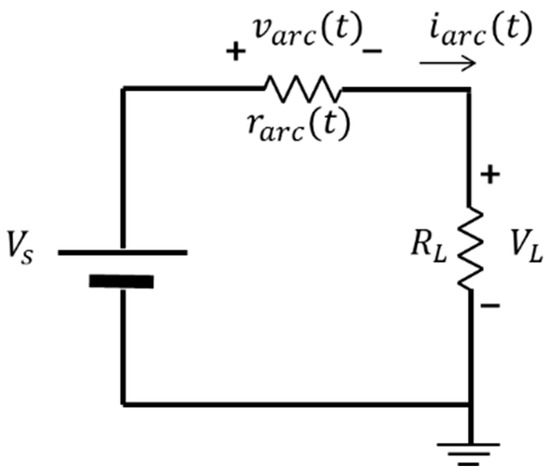
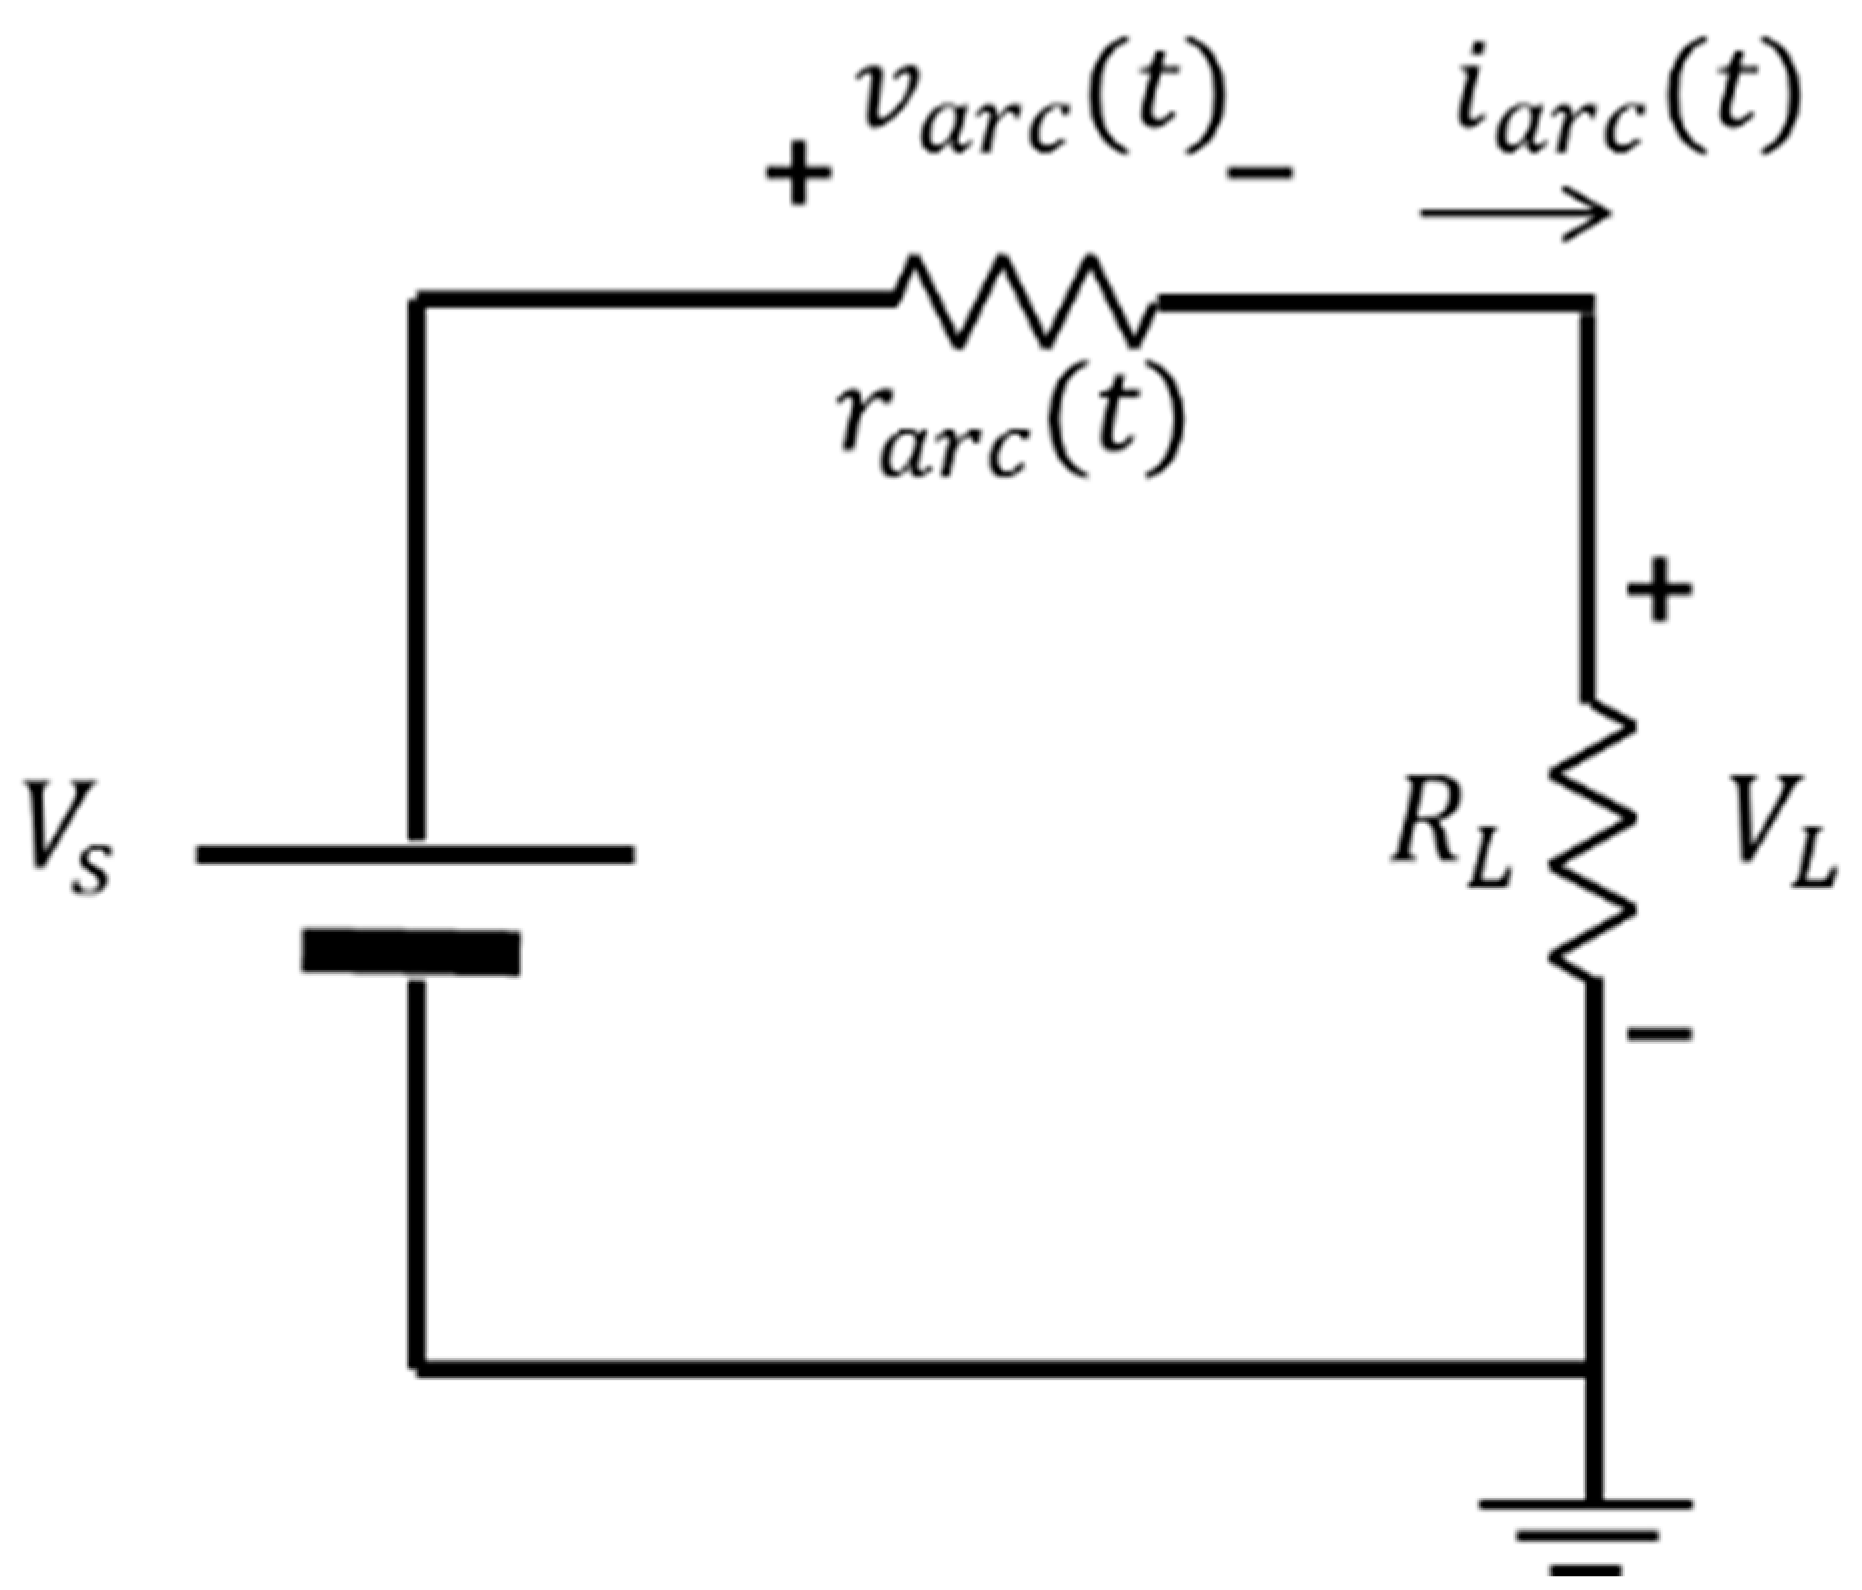
can be seen here as the product of and at ( ≤ ≤ ) as stated in Equation (8), and can be illustrated as the DC arc model in Figure 10.
Figure 10.
DC circuit within arc duration.
Equations (7) and (8) can be summarized in regards to as stated in Equation (9).
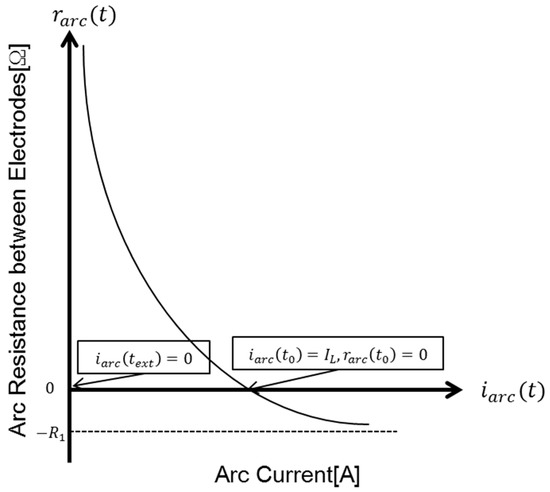
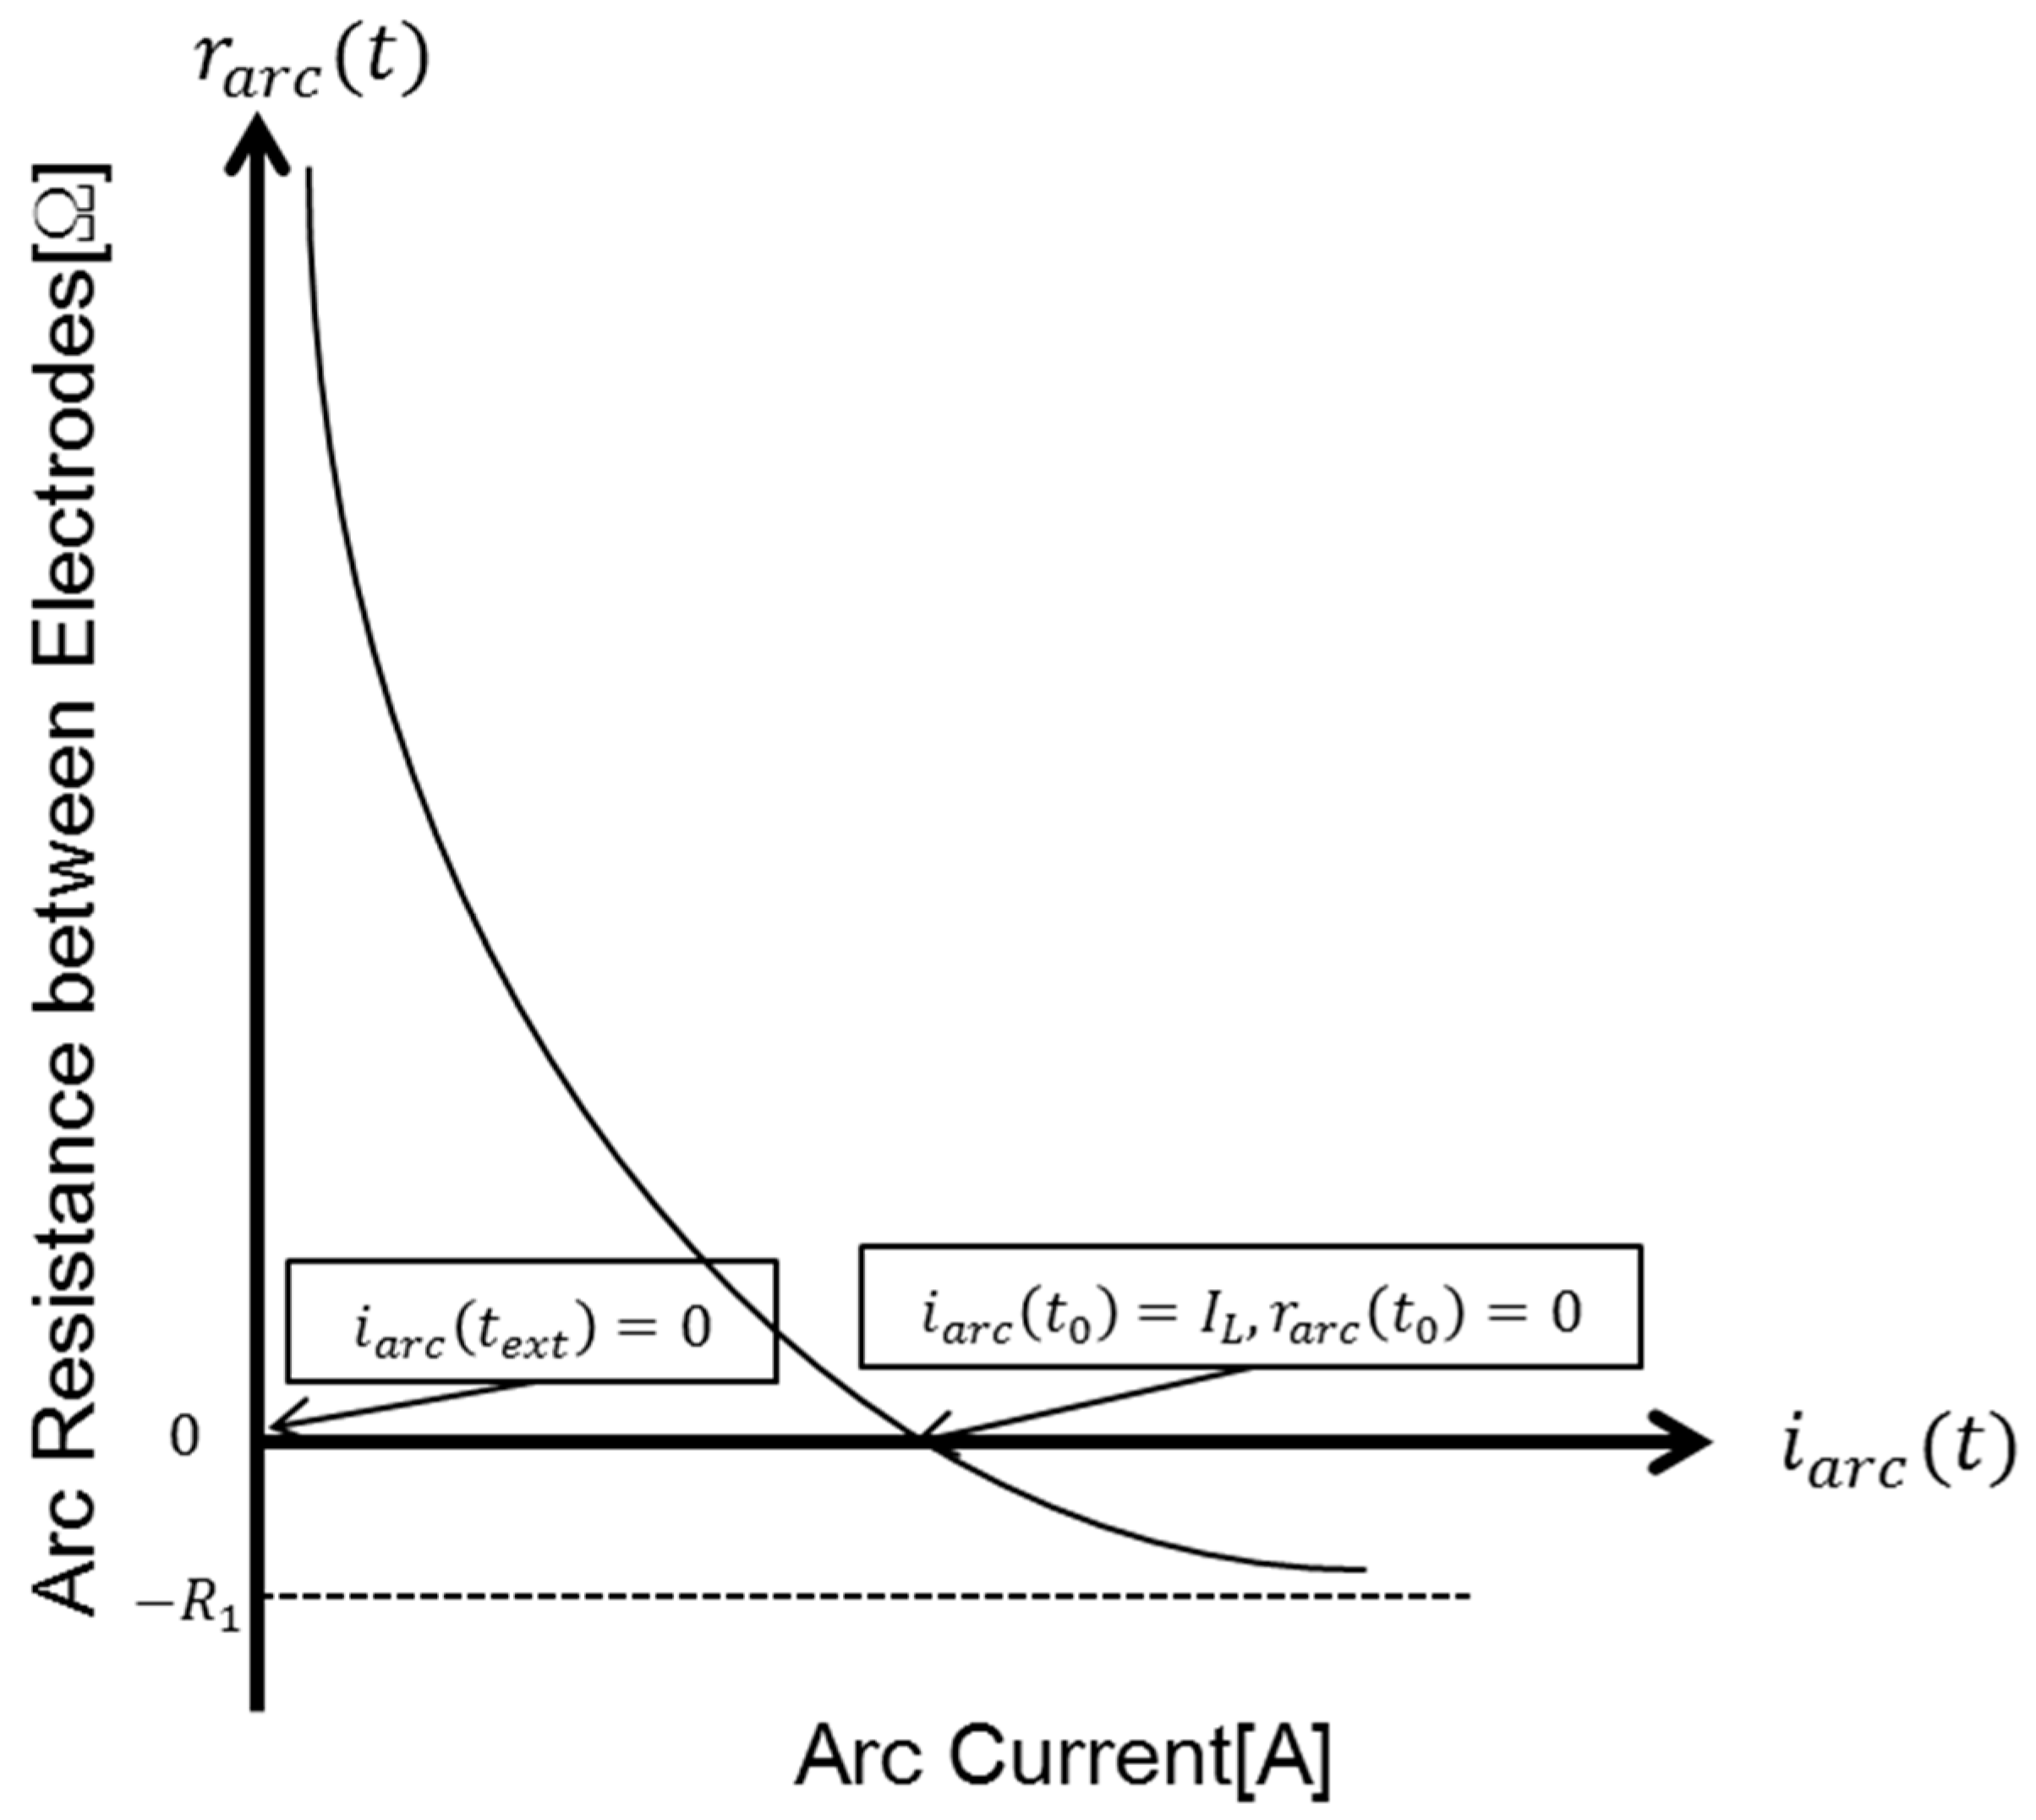
, and . Relations of arc resistance (), source voltage (), arc current (), load resistance () can be represented as a graph in Figure 11.
Figure 11.
Relation between arc resistance, source voltage, arc current, and load resistance relation graph.
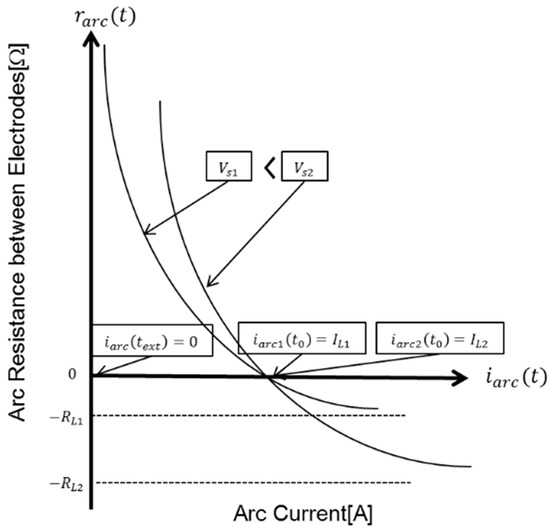
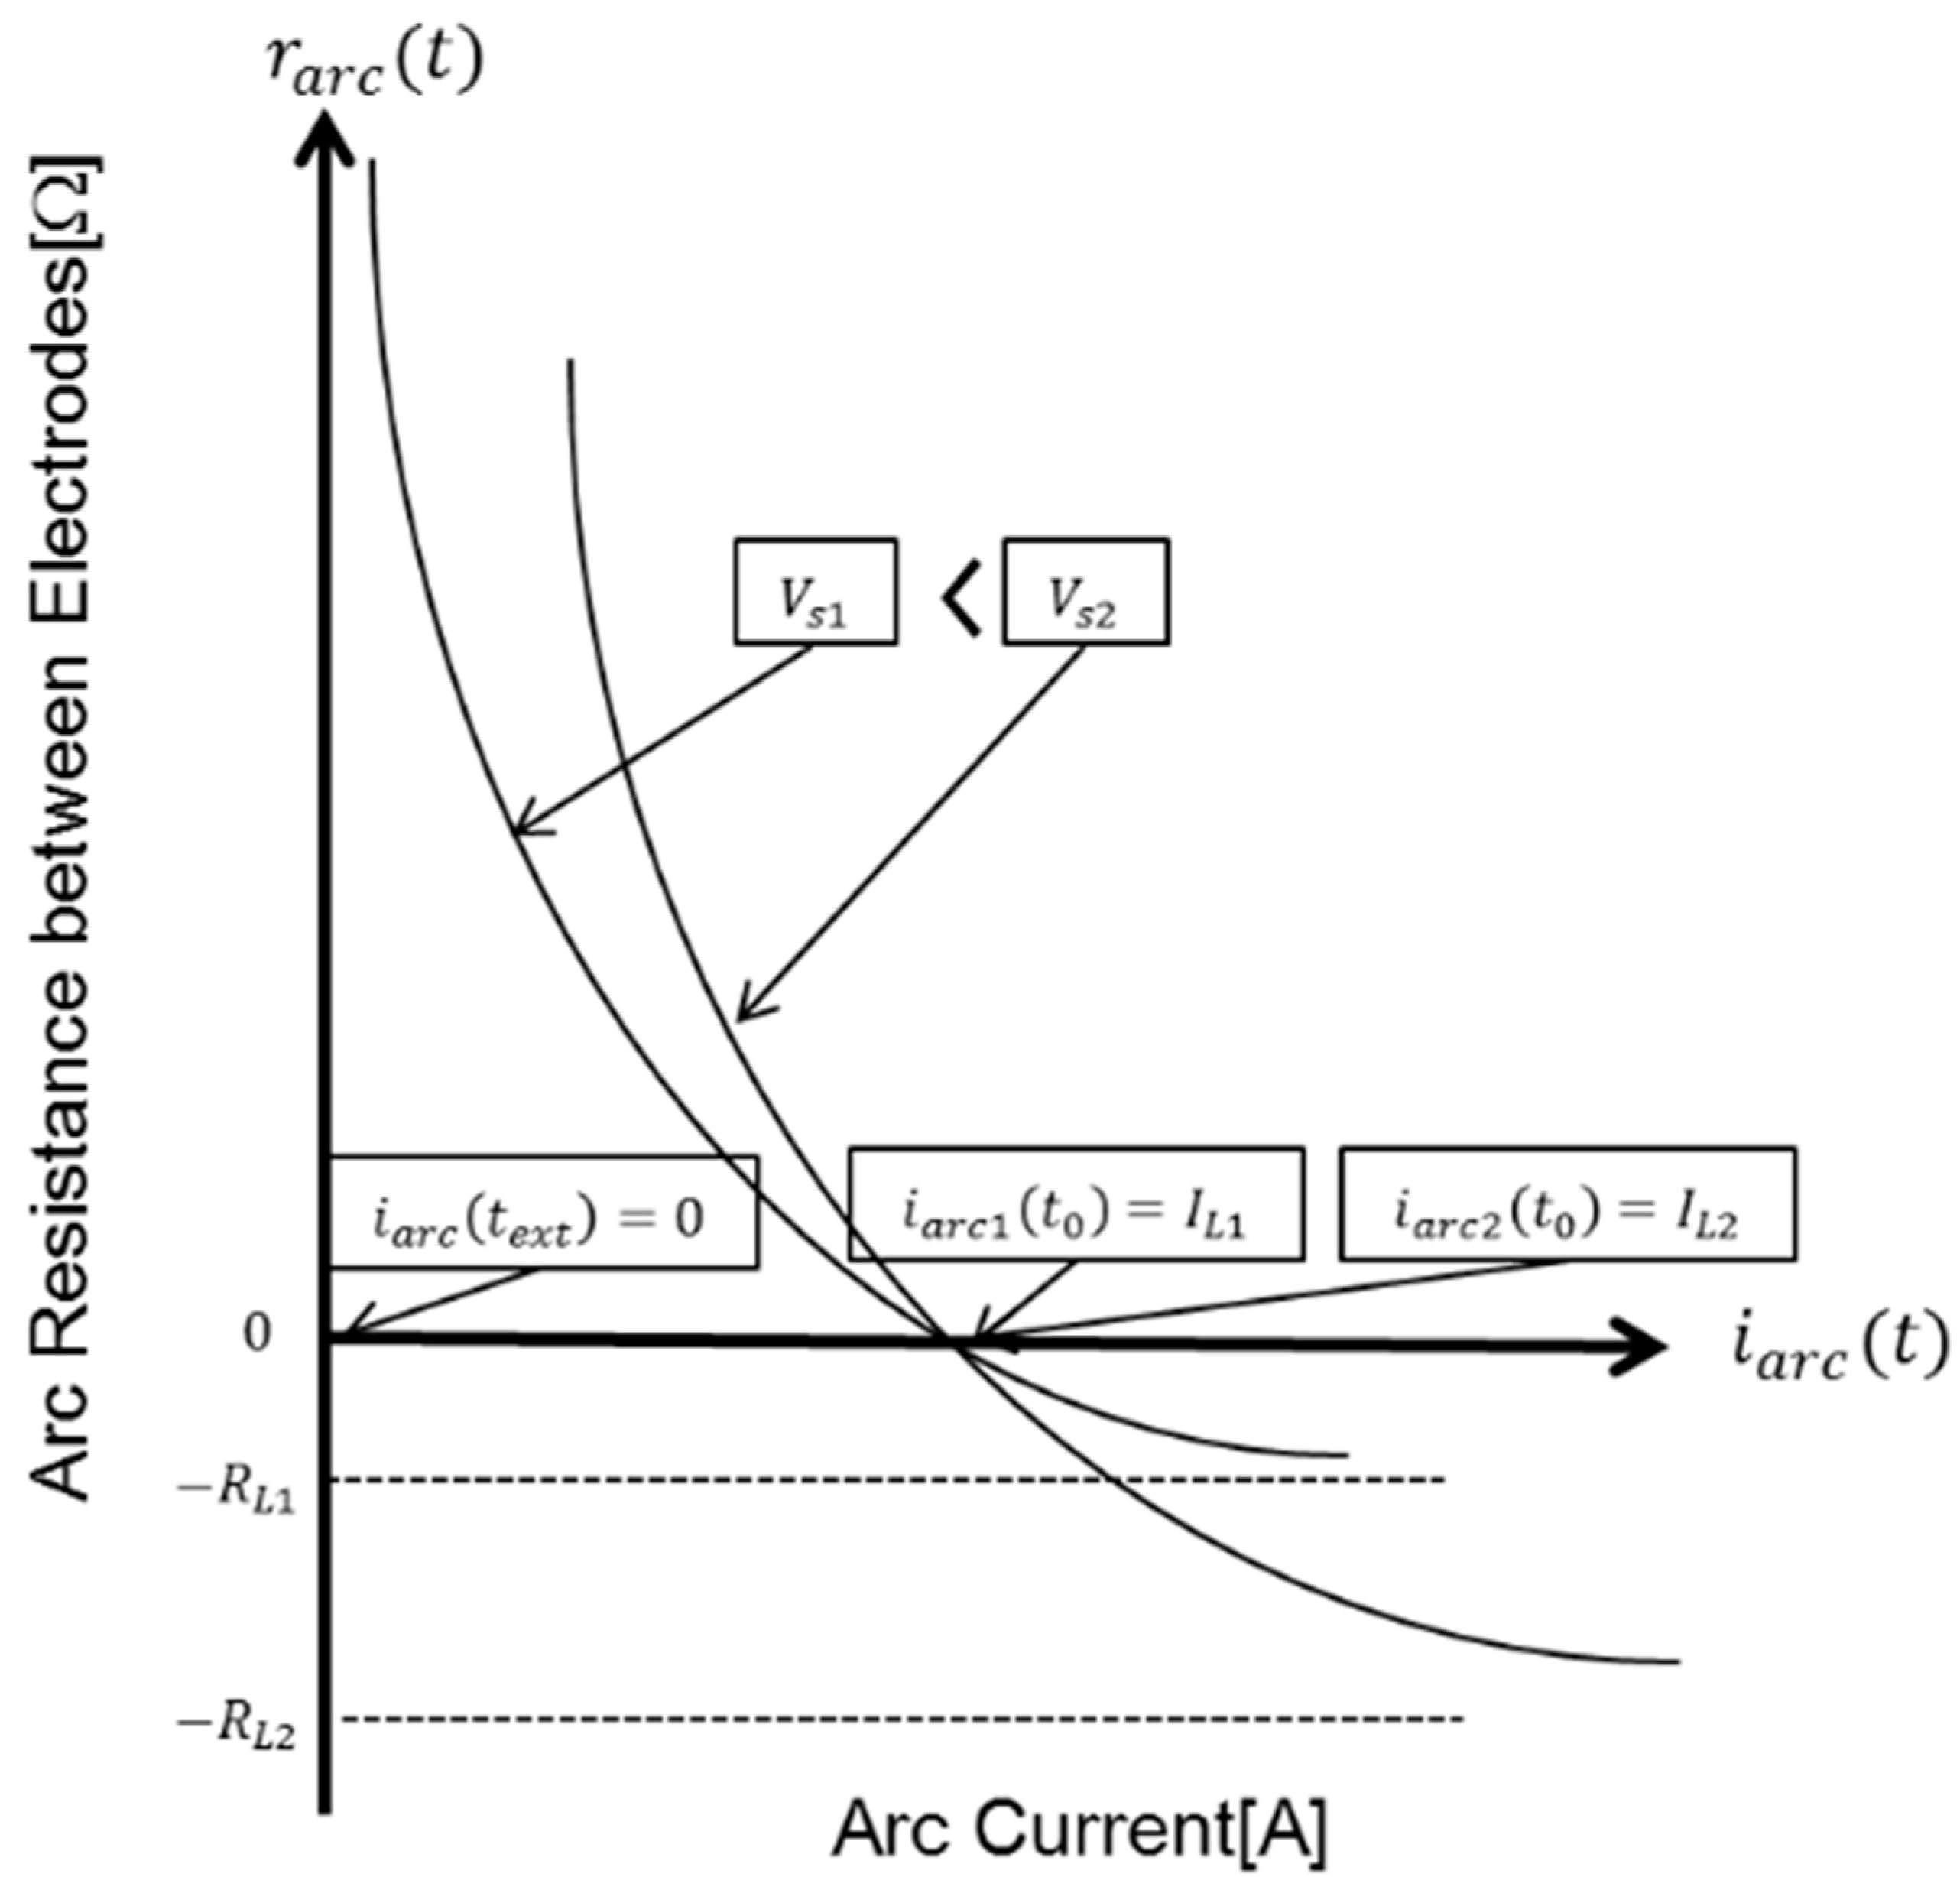
Figure 12 shows the relationship between and under source voltage condition . When load current is , the load resistance is proportional to the magnitude of the source voltages , , therefore .
Figure 12.
Relation between arc resistance and arc current with the parameter of source voltage change.
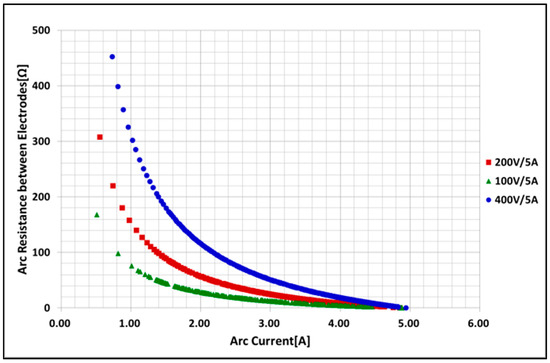
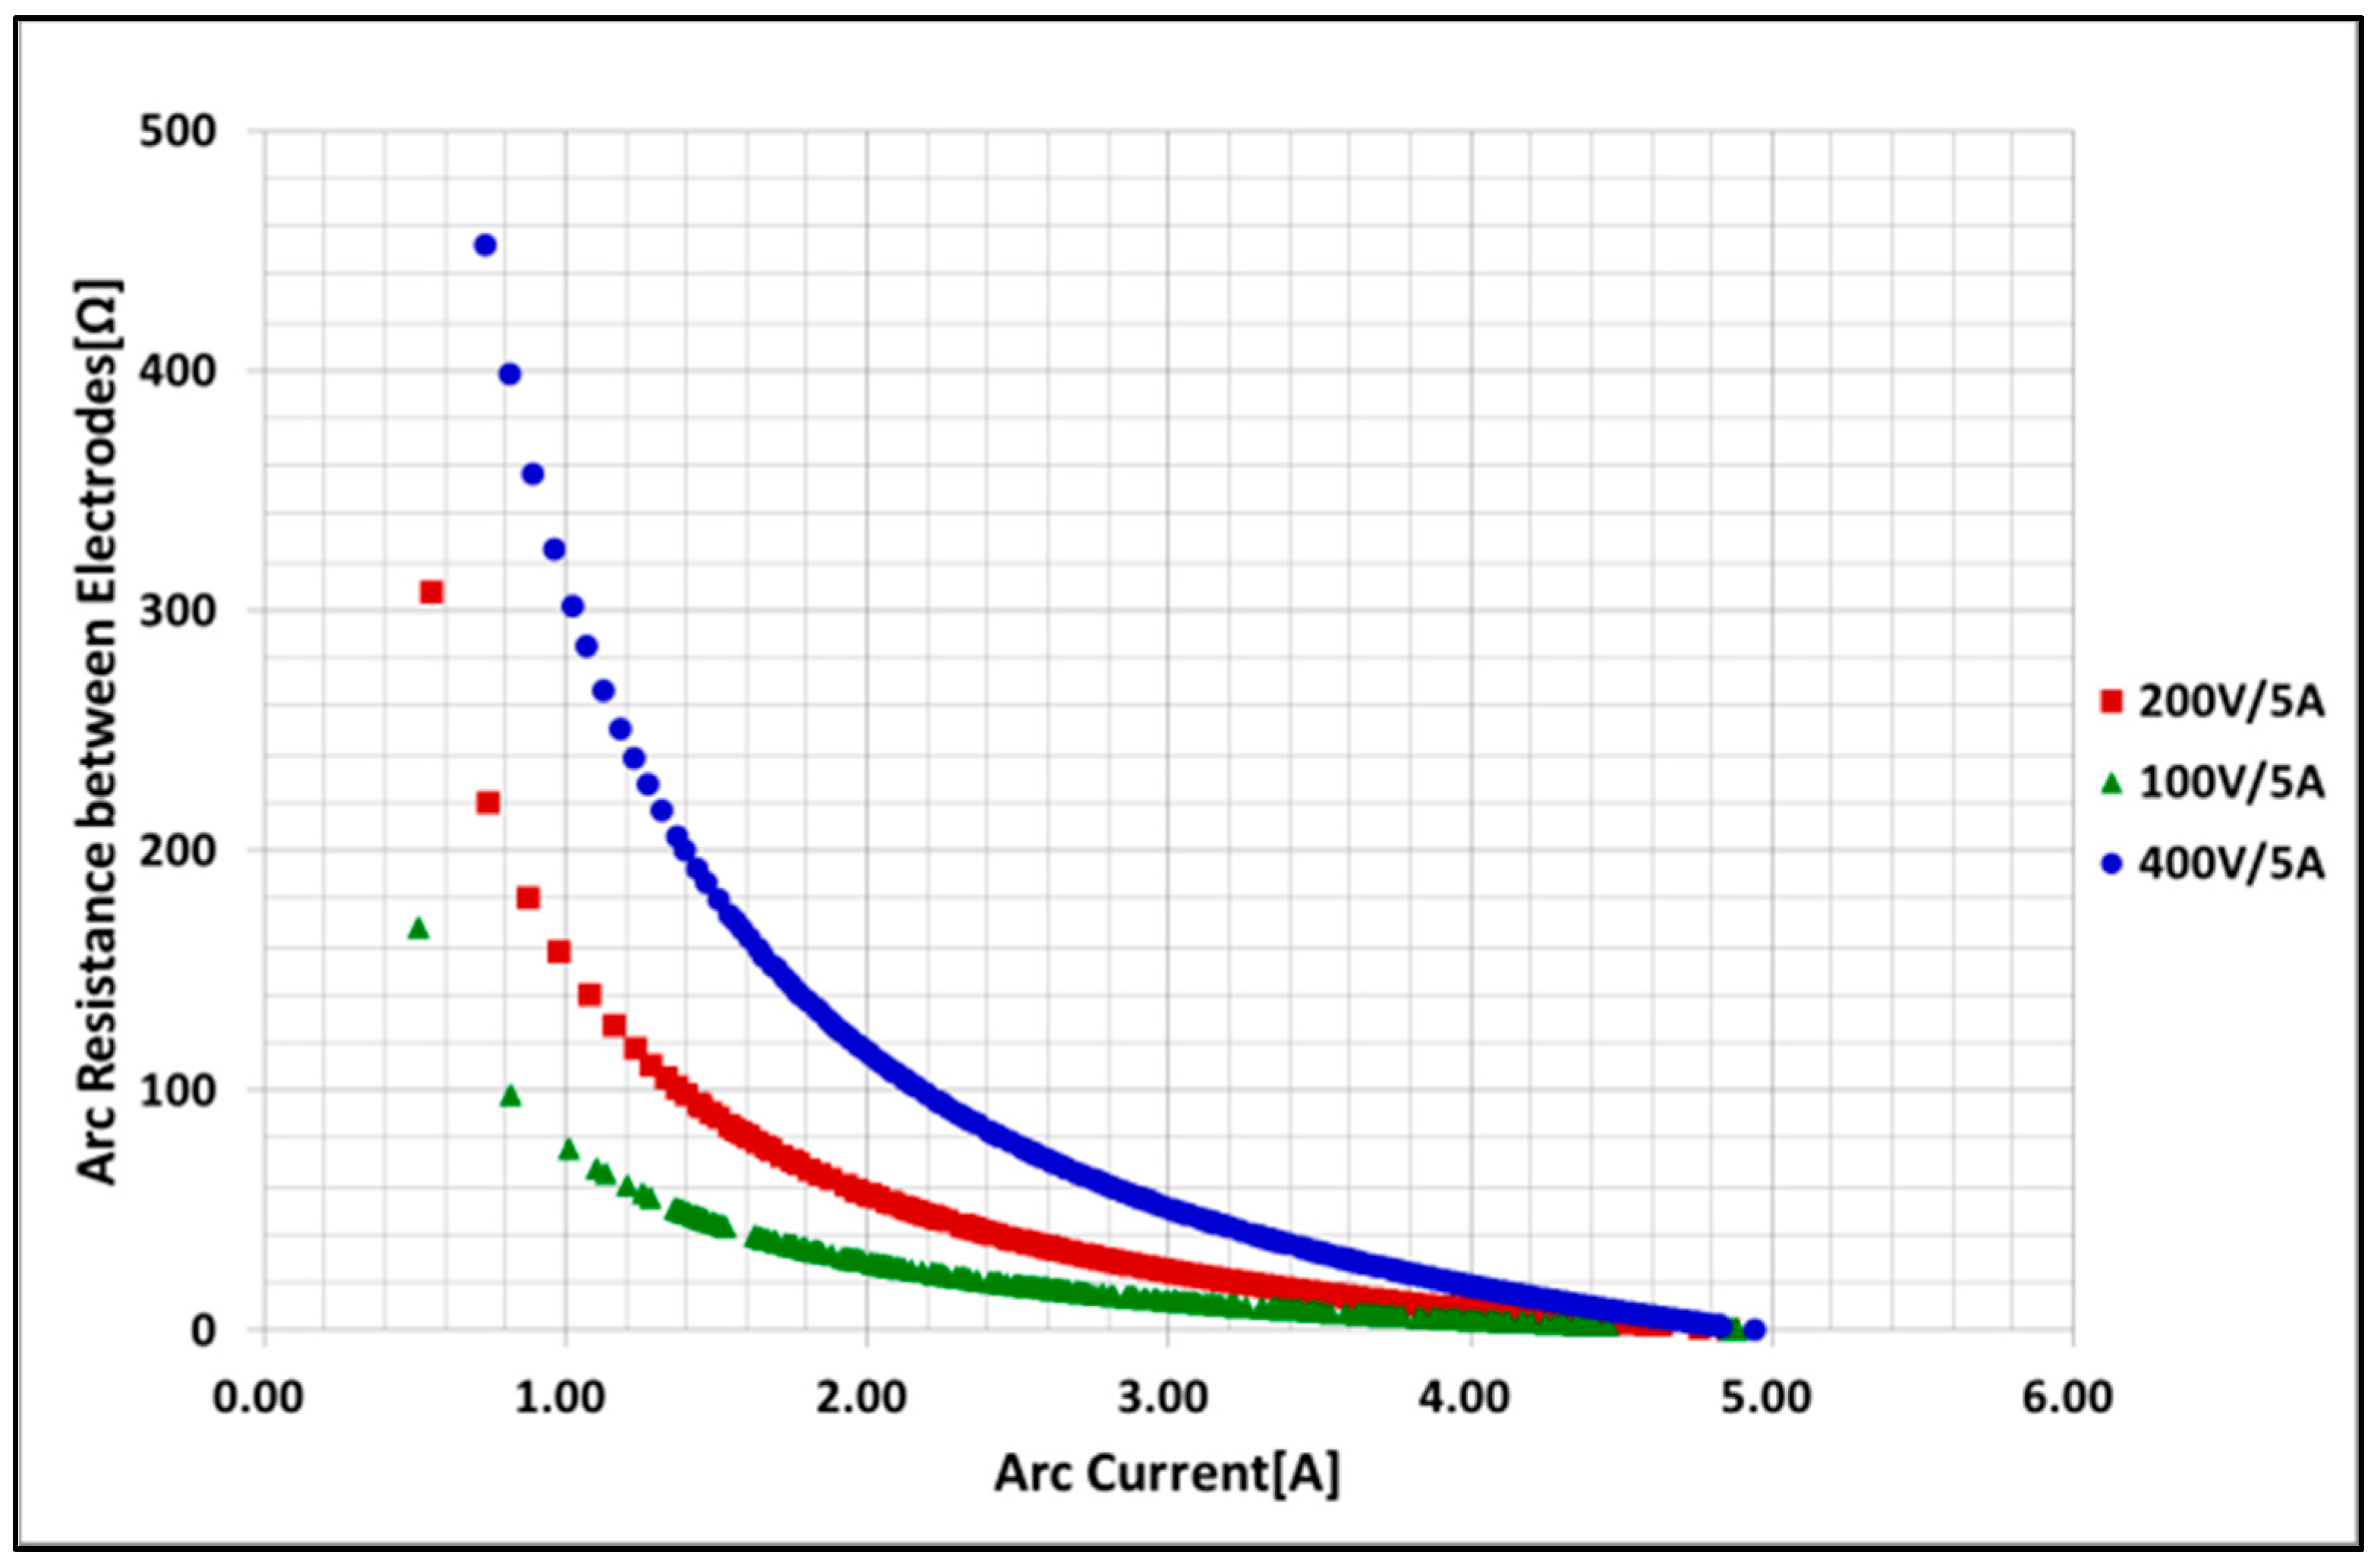
Figure 13 is the experimental result graph of and according to the changes in source voltage.
Figure 13.
Arc resistance and arc current experimental results (source voltage change).
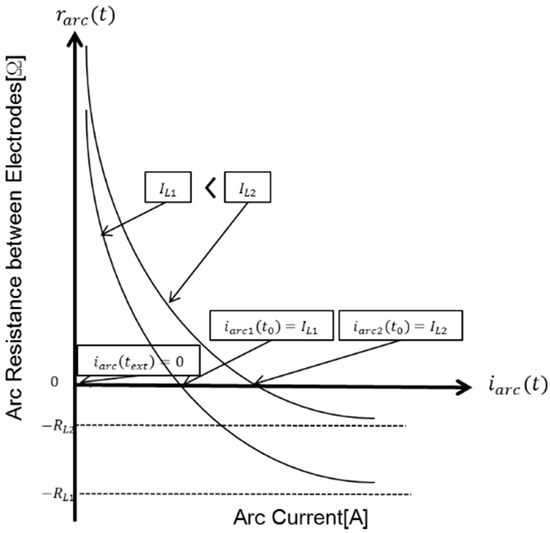
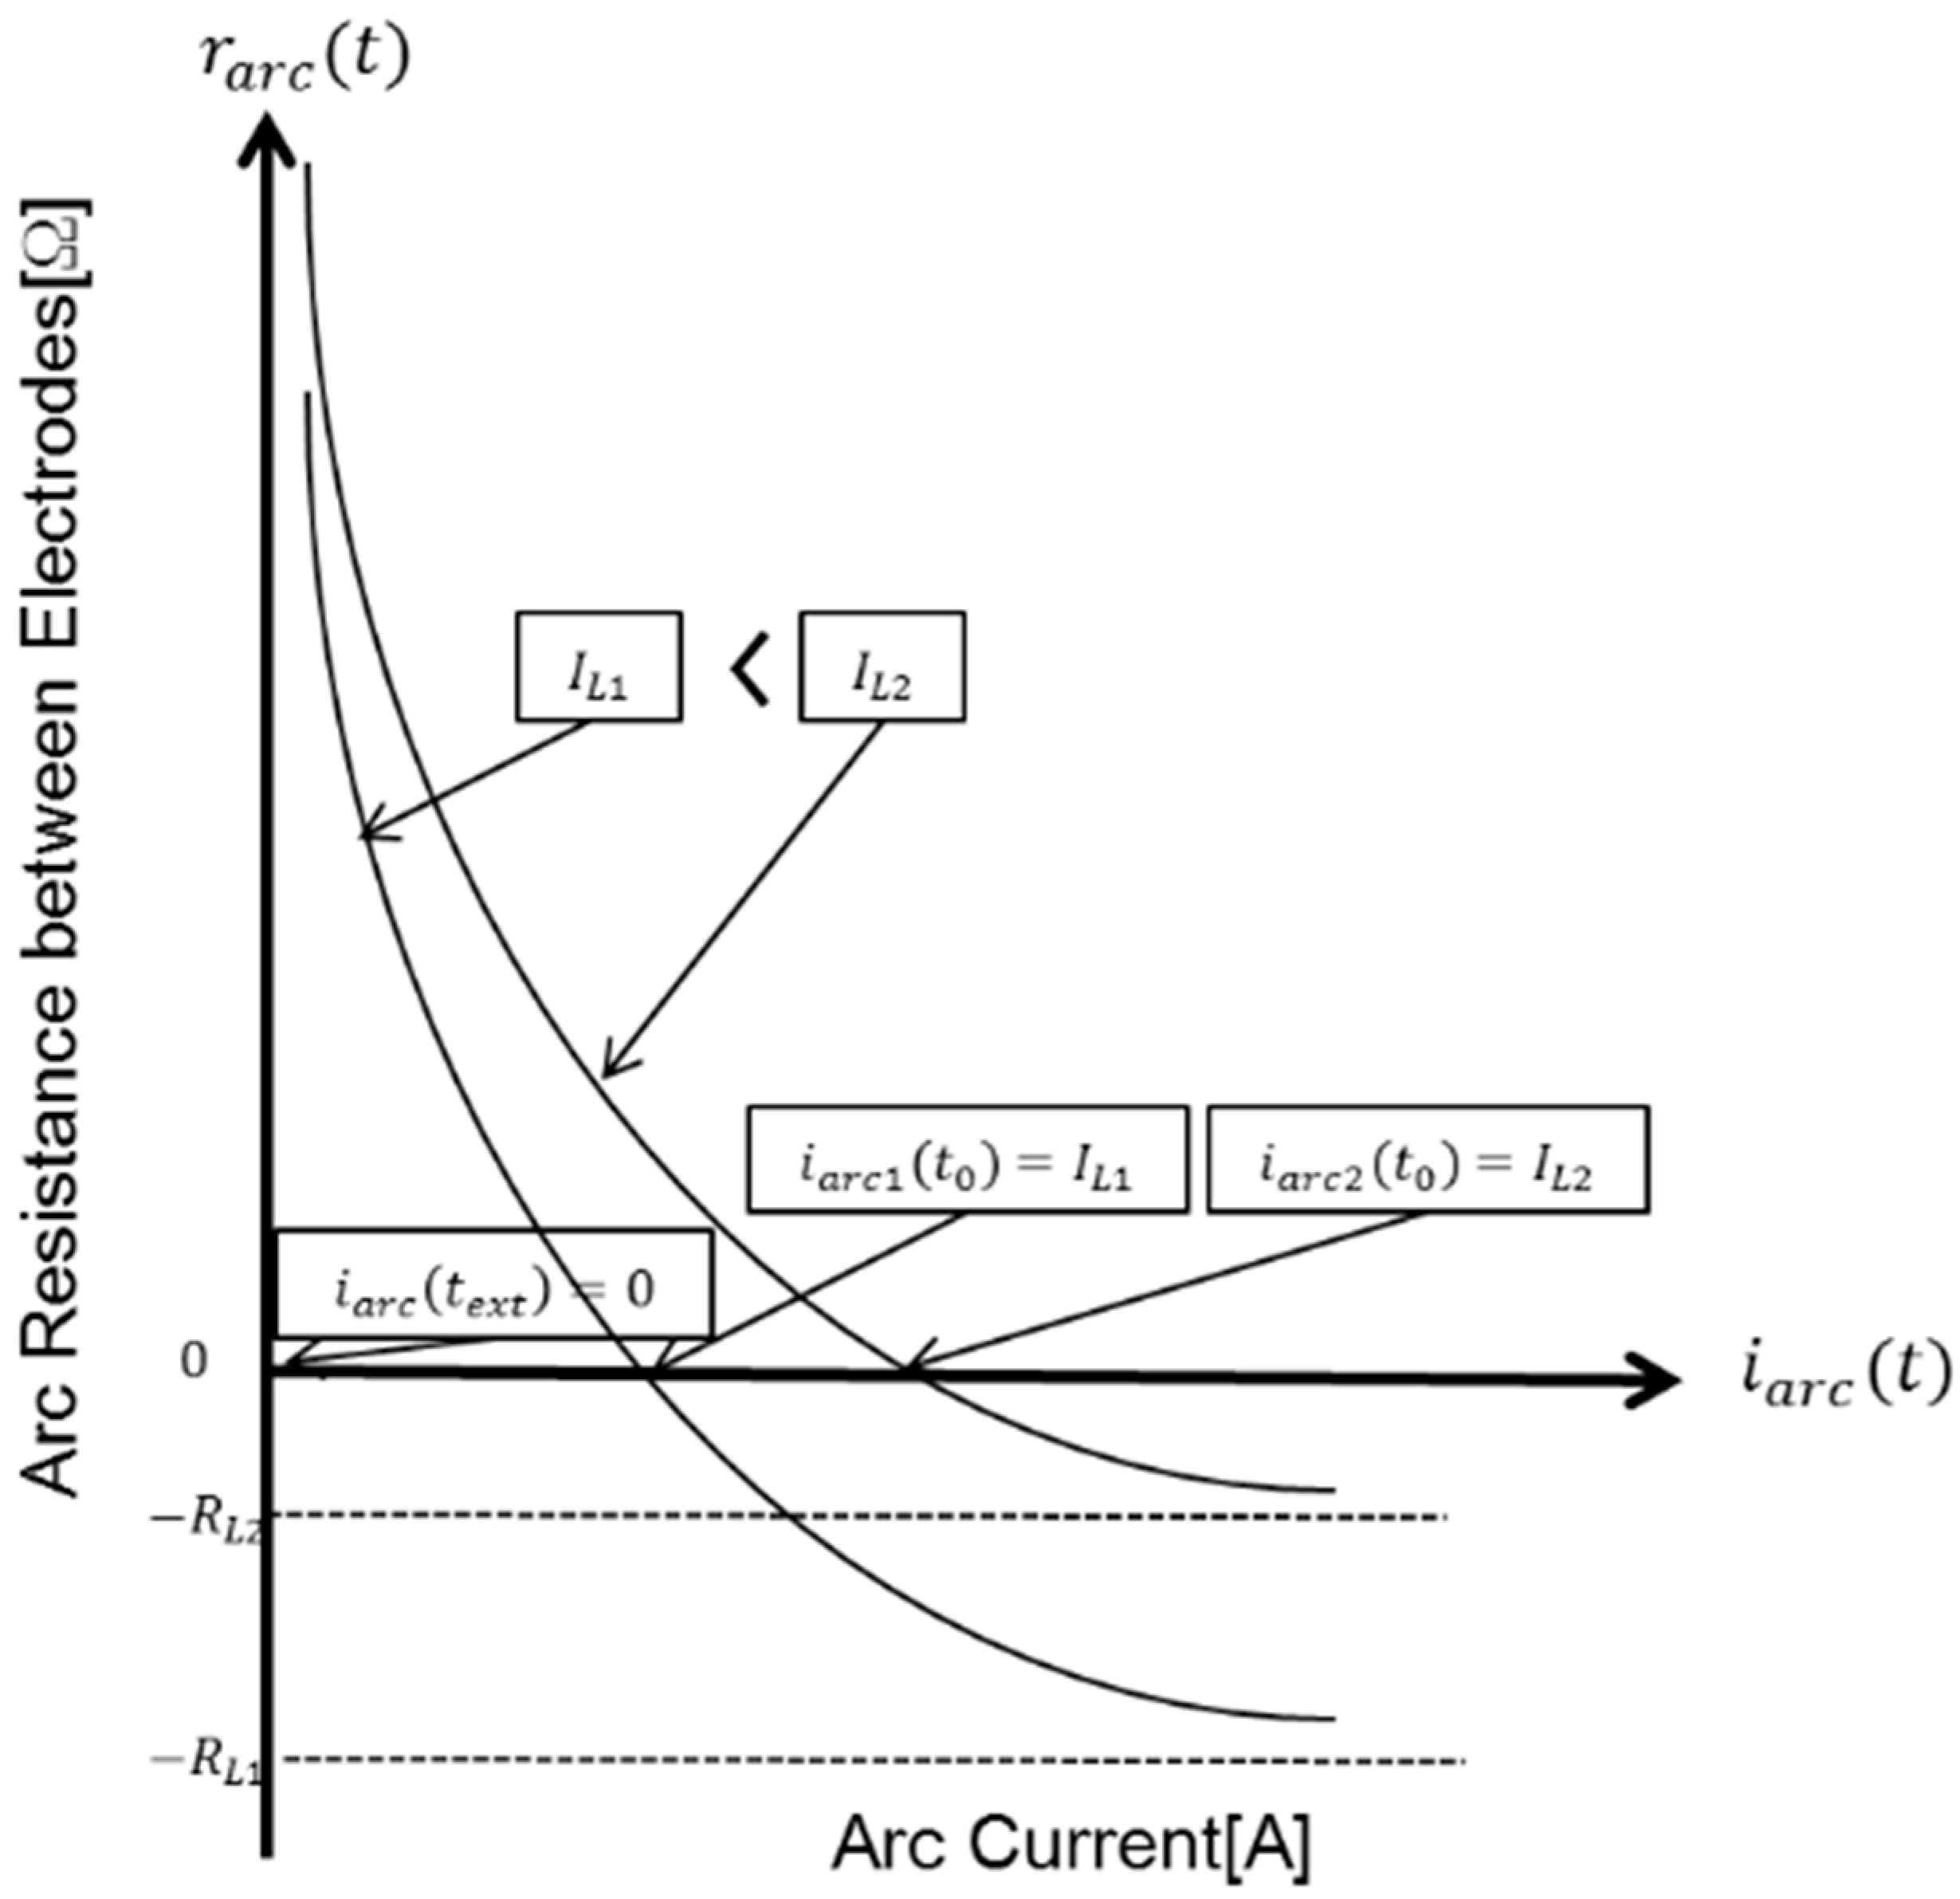
Figure 14 is a graph of the relation between and under load current conditions . When the source voltage is equal, is inversely proportional to the magnitude of the load currents and , and therefore
Figure 14.
Relation between arc resistance and arc current with the parameter of load current change.
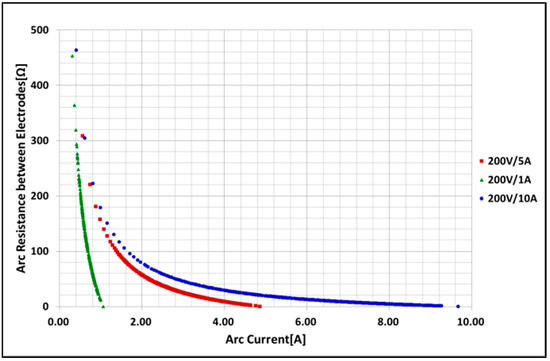
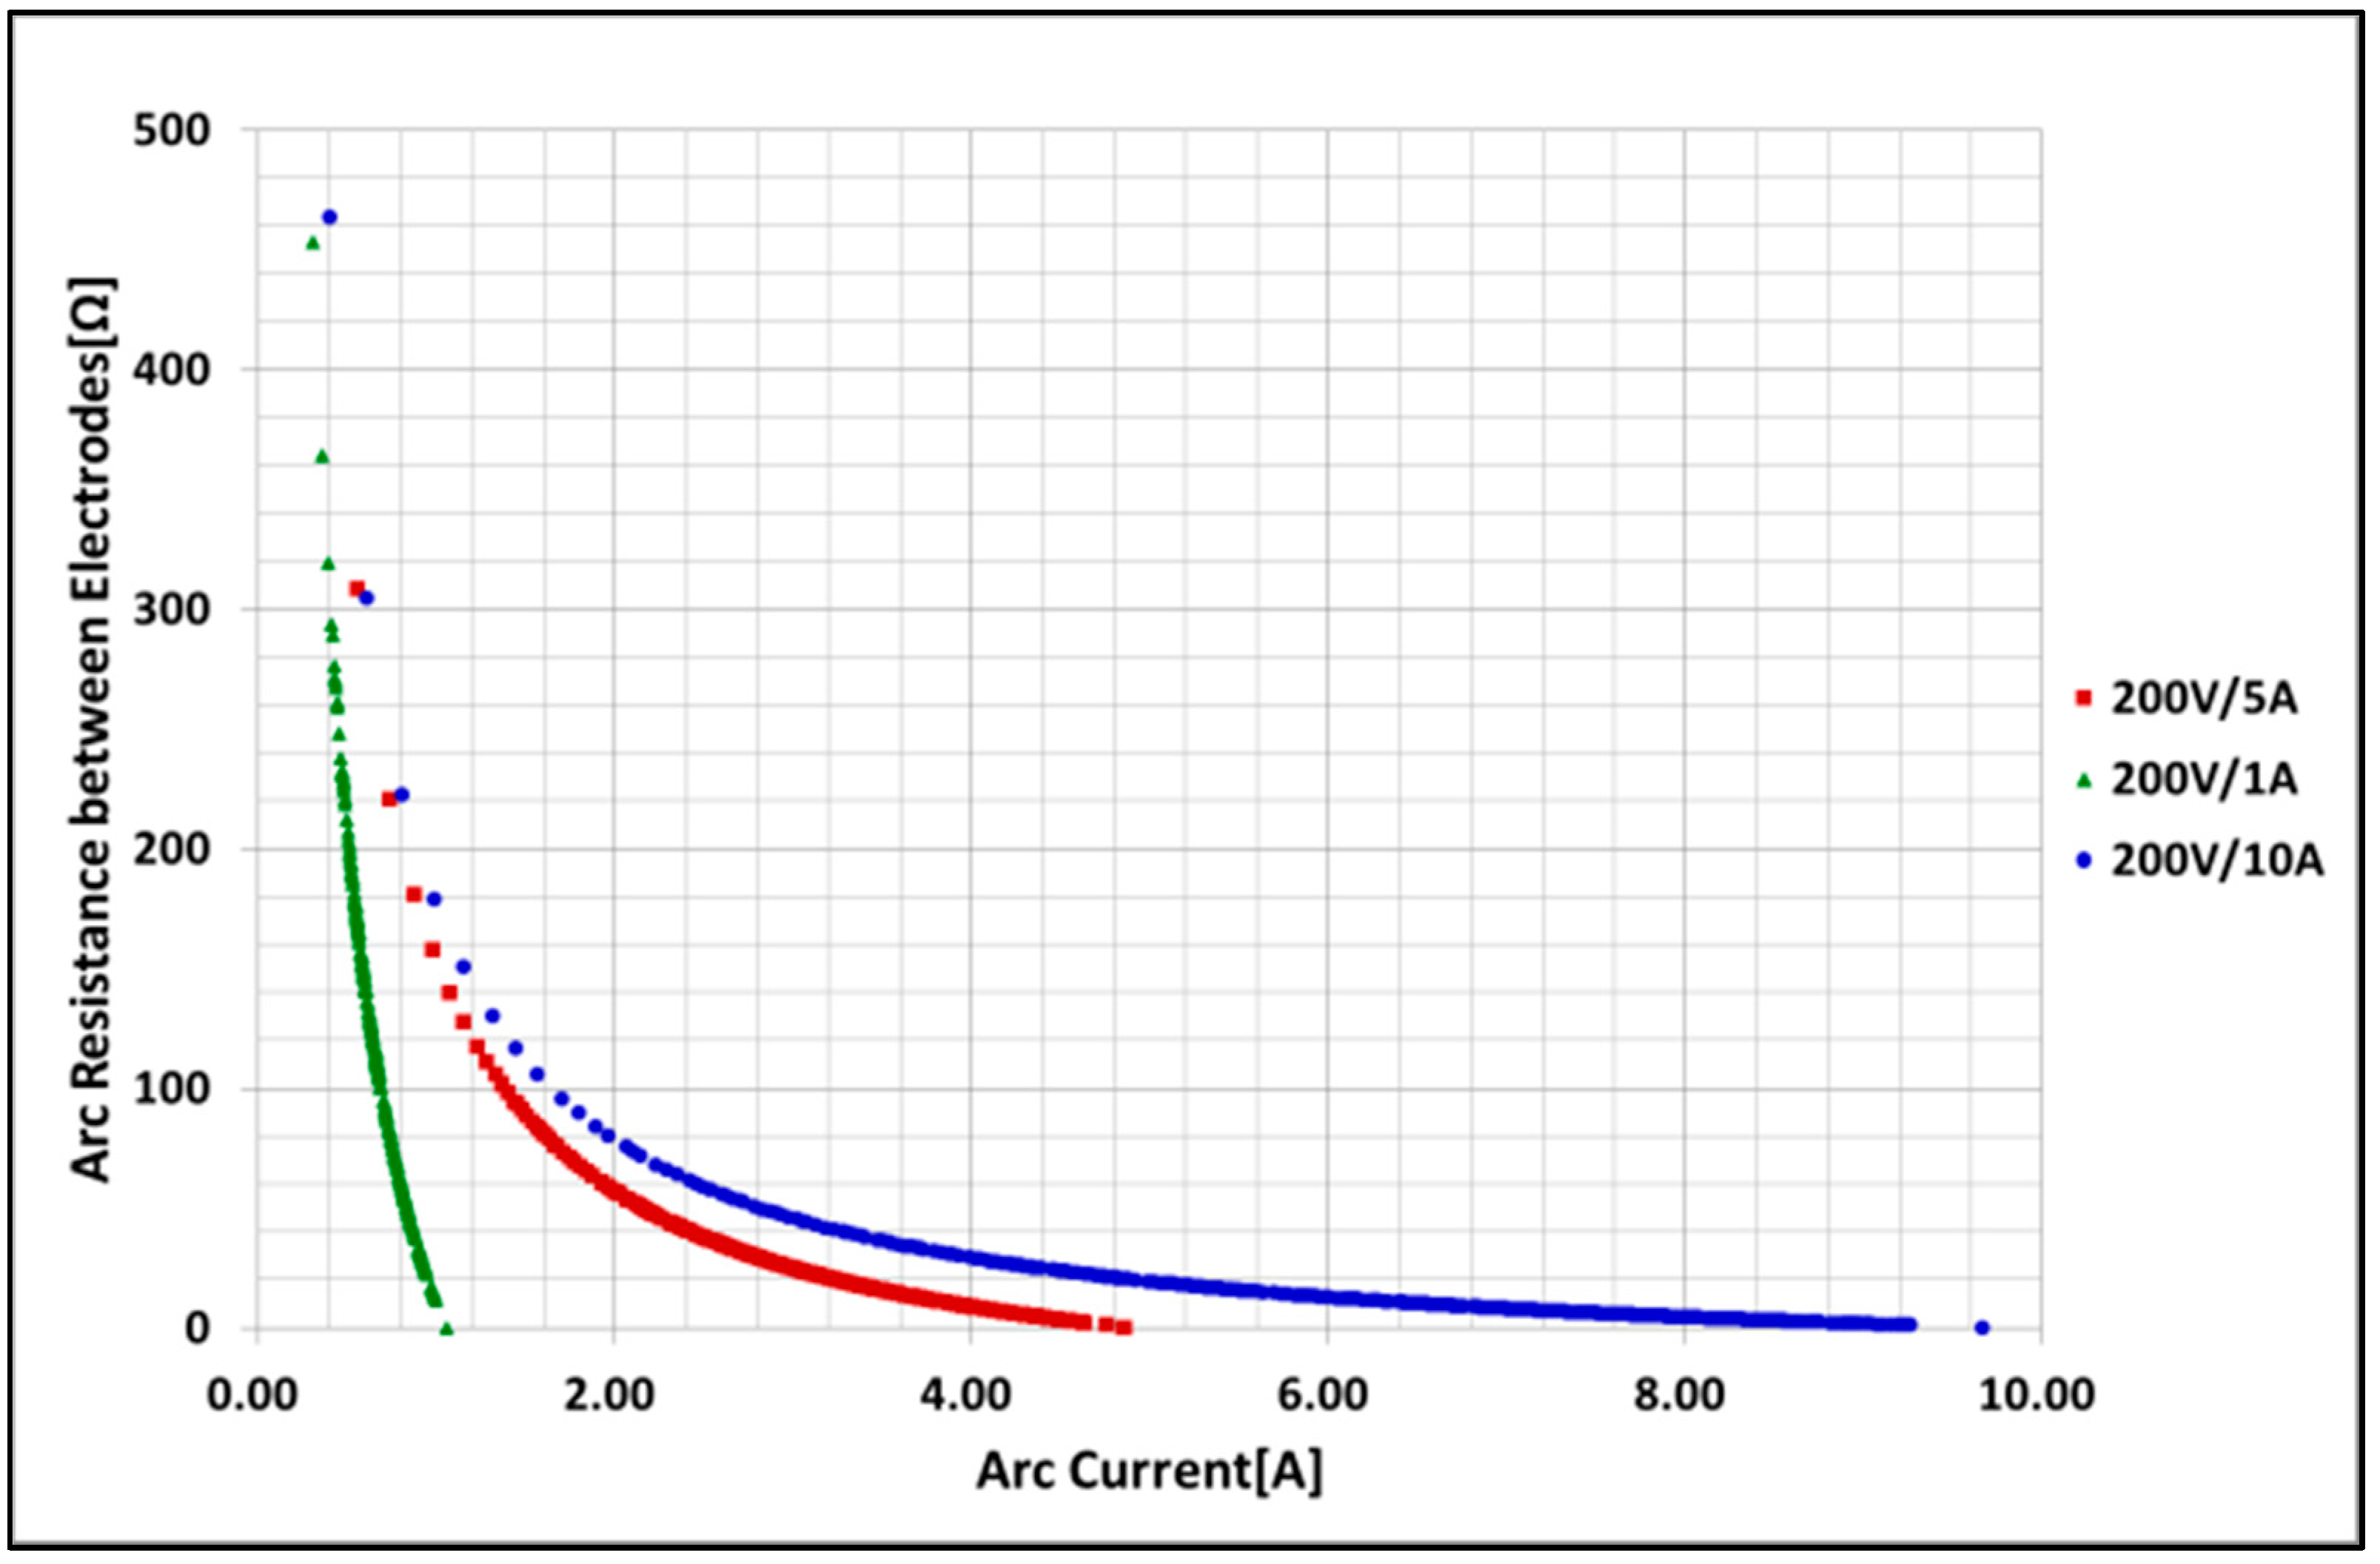
Figure 15 is an experimental result graph of and according to the changes in source voltage.
Figure 15.
Arc resistance and arc current experimental results (load current change).
As increase and decrease, the interval between the results increases. This result indicates that, as these approach closer to the arc extinguishing point, the increase rate of and the decrease rate of get faster because sampling rate is equal to 1/6, 250 s.
3.4. Power Analysis between Electrodes at Random Time within Arc Duration
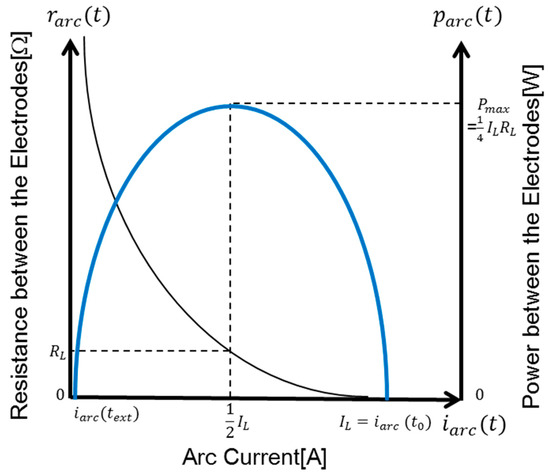
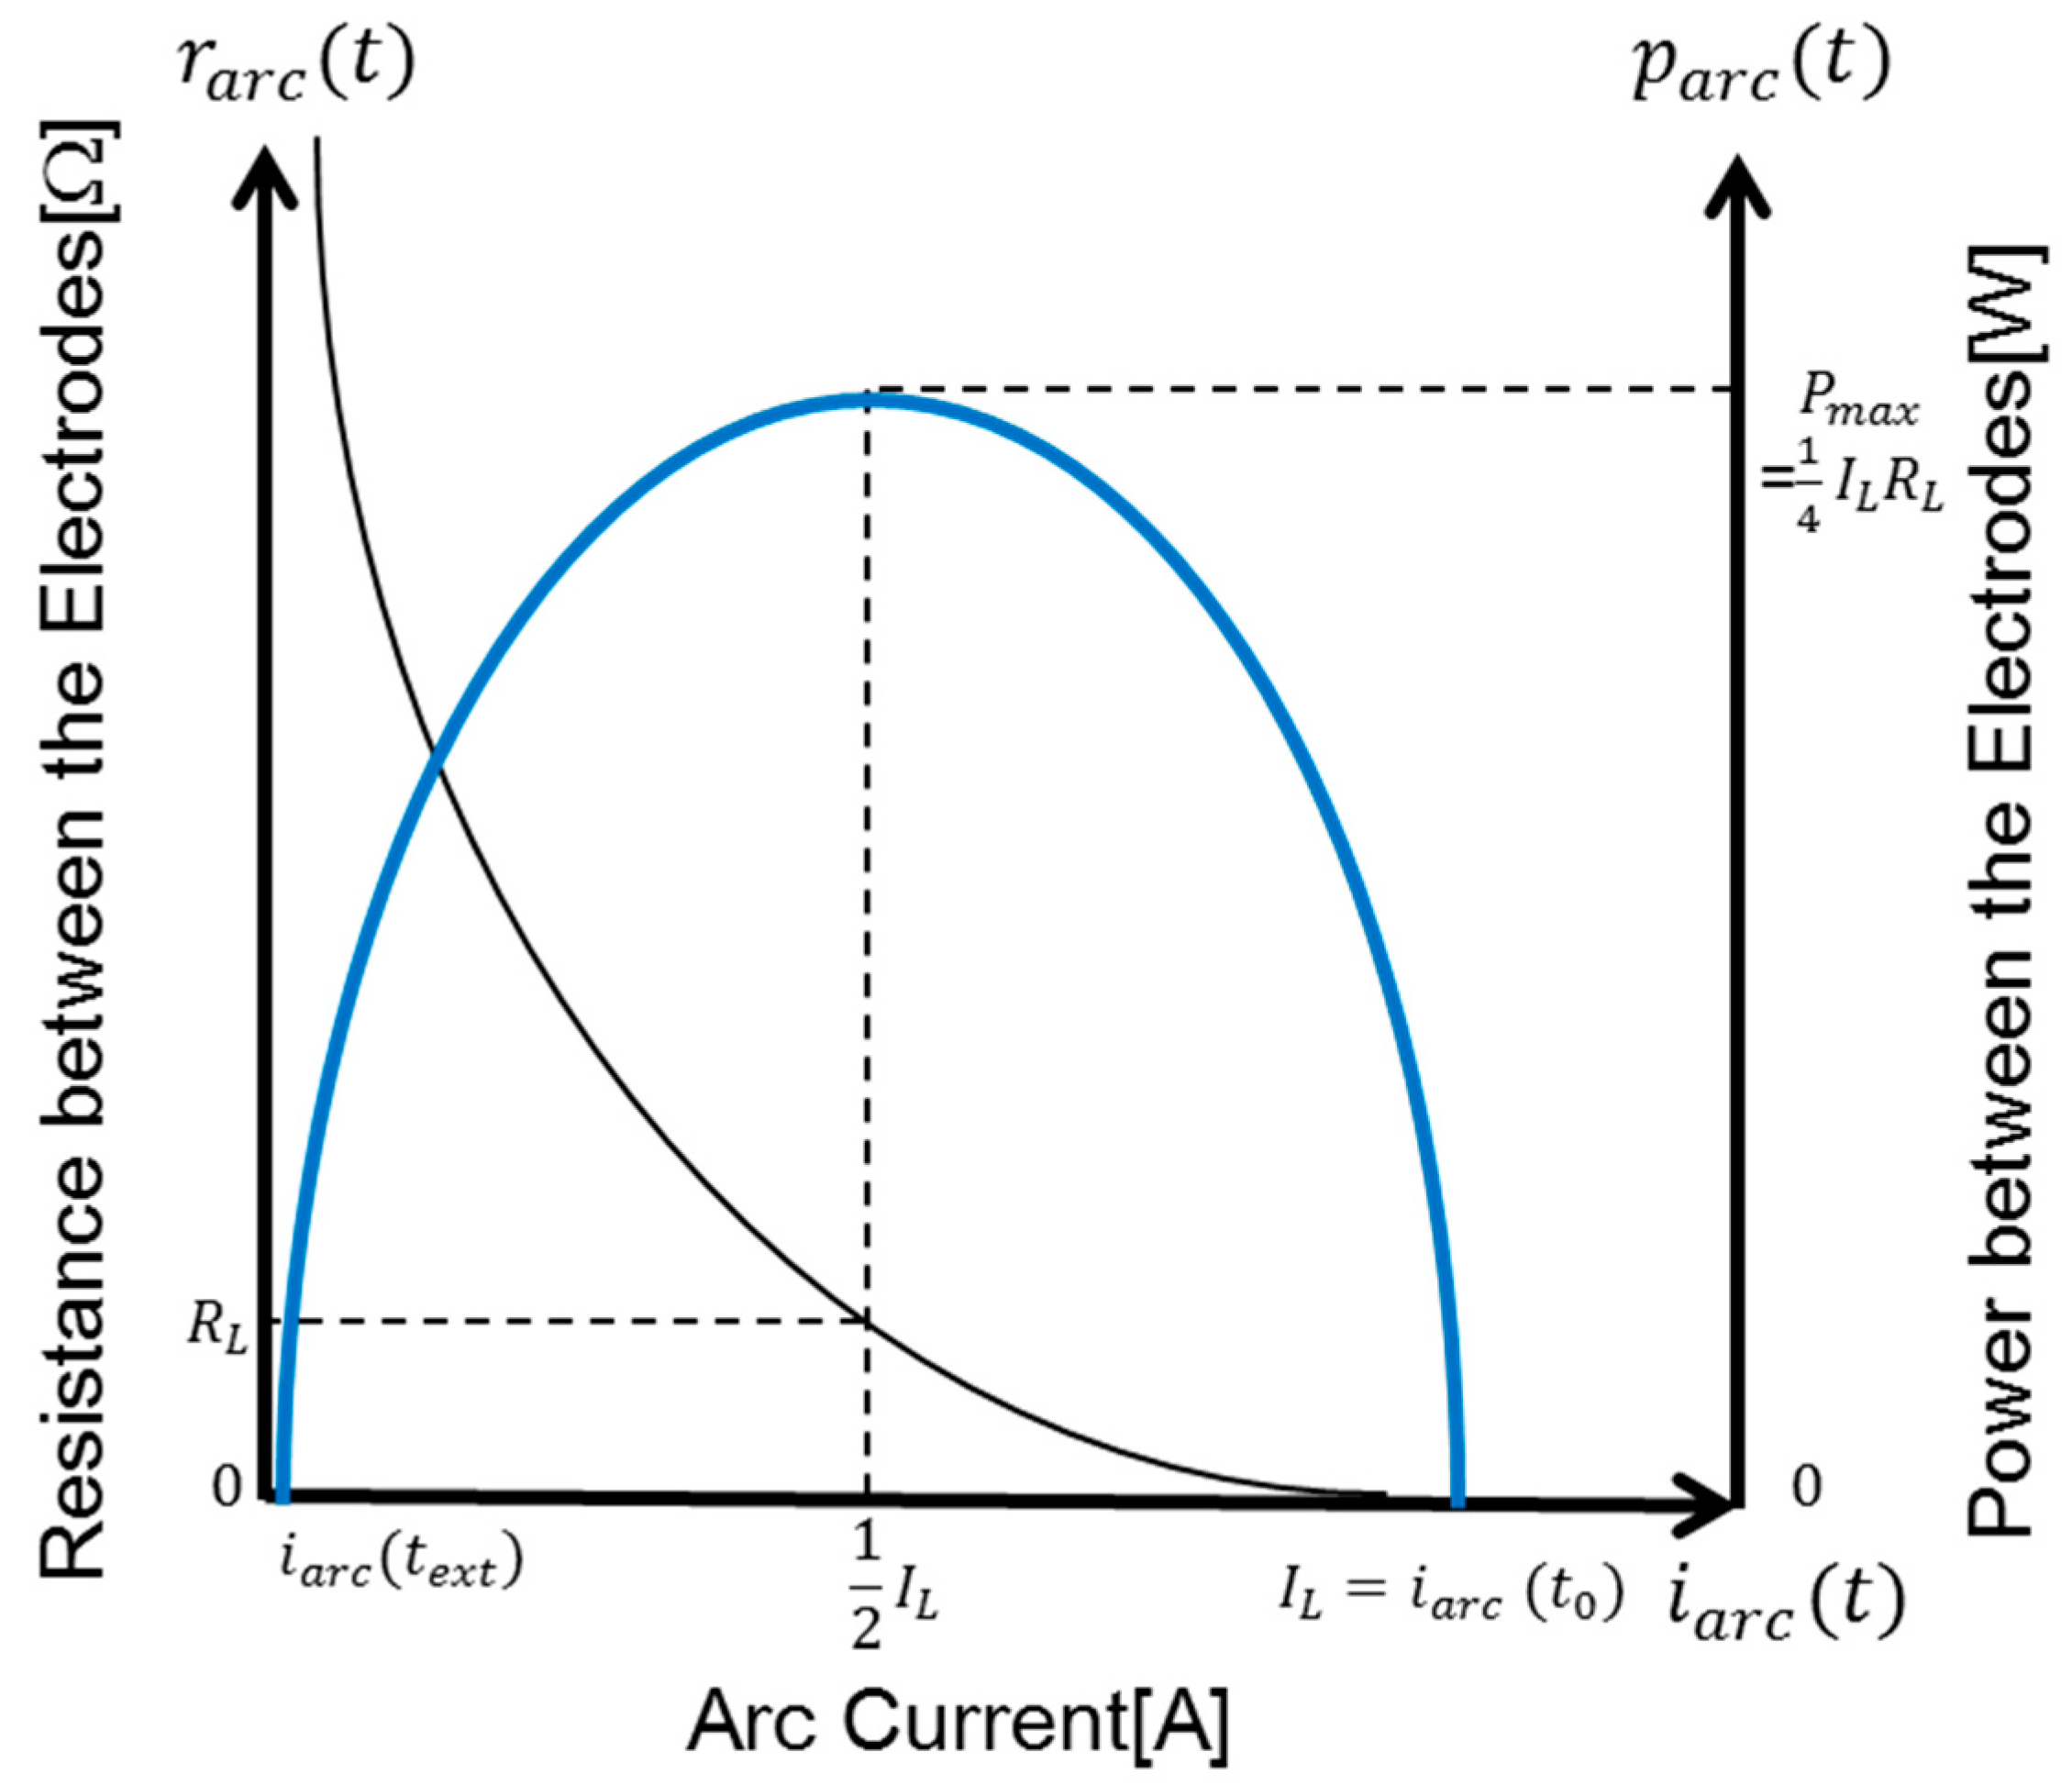
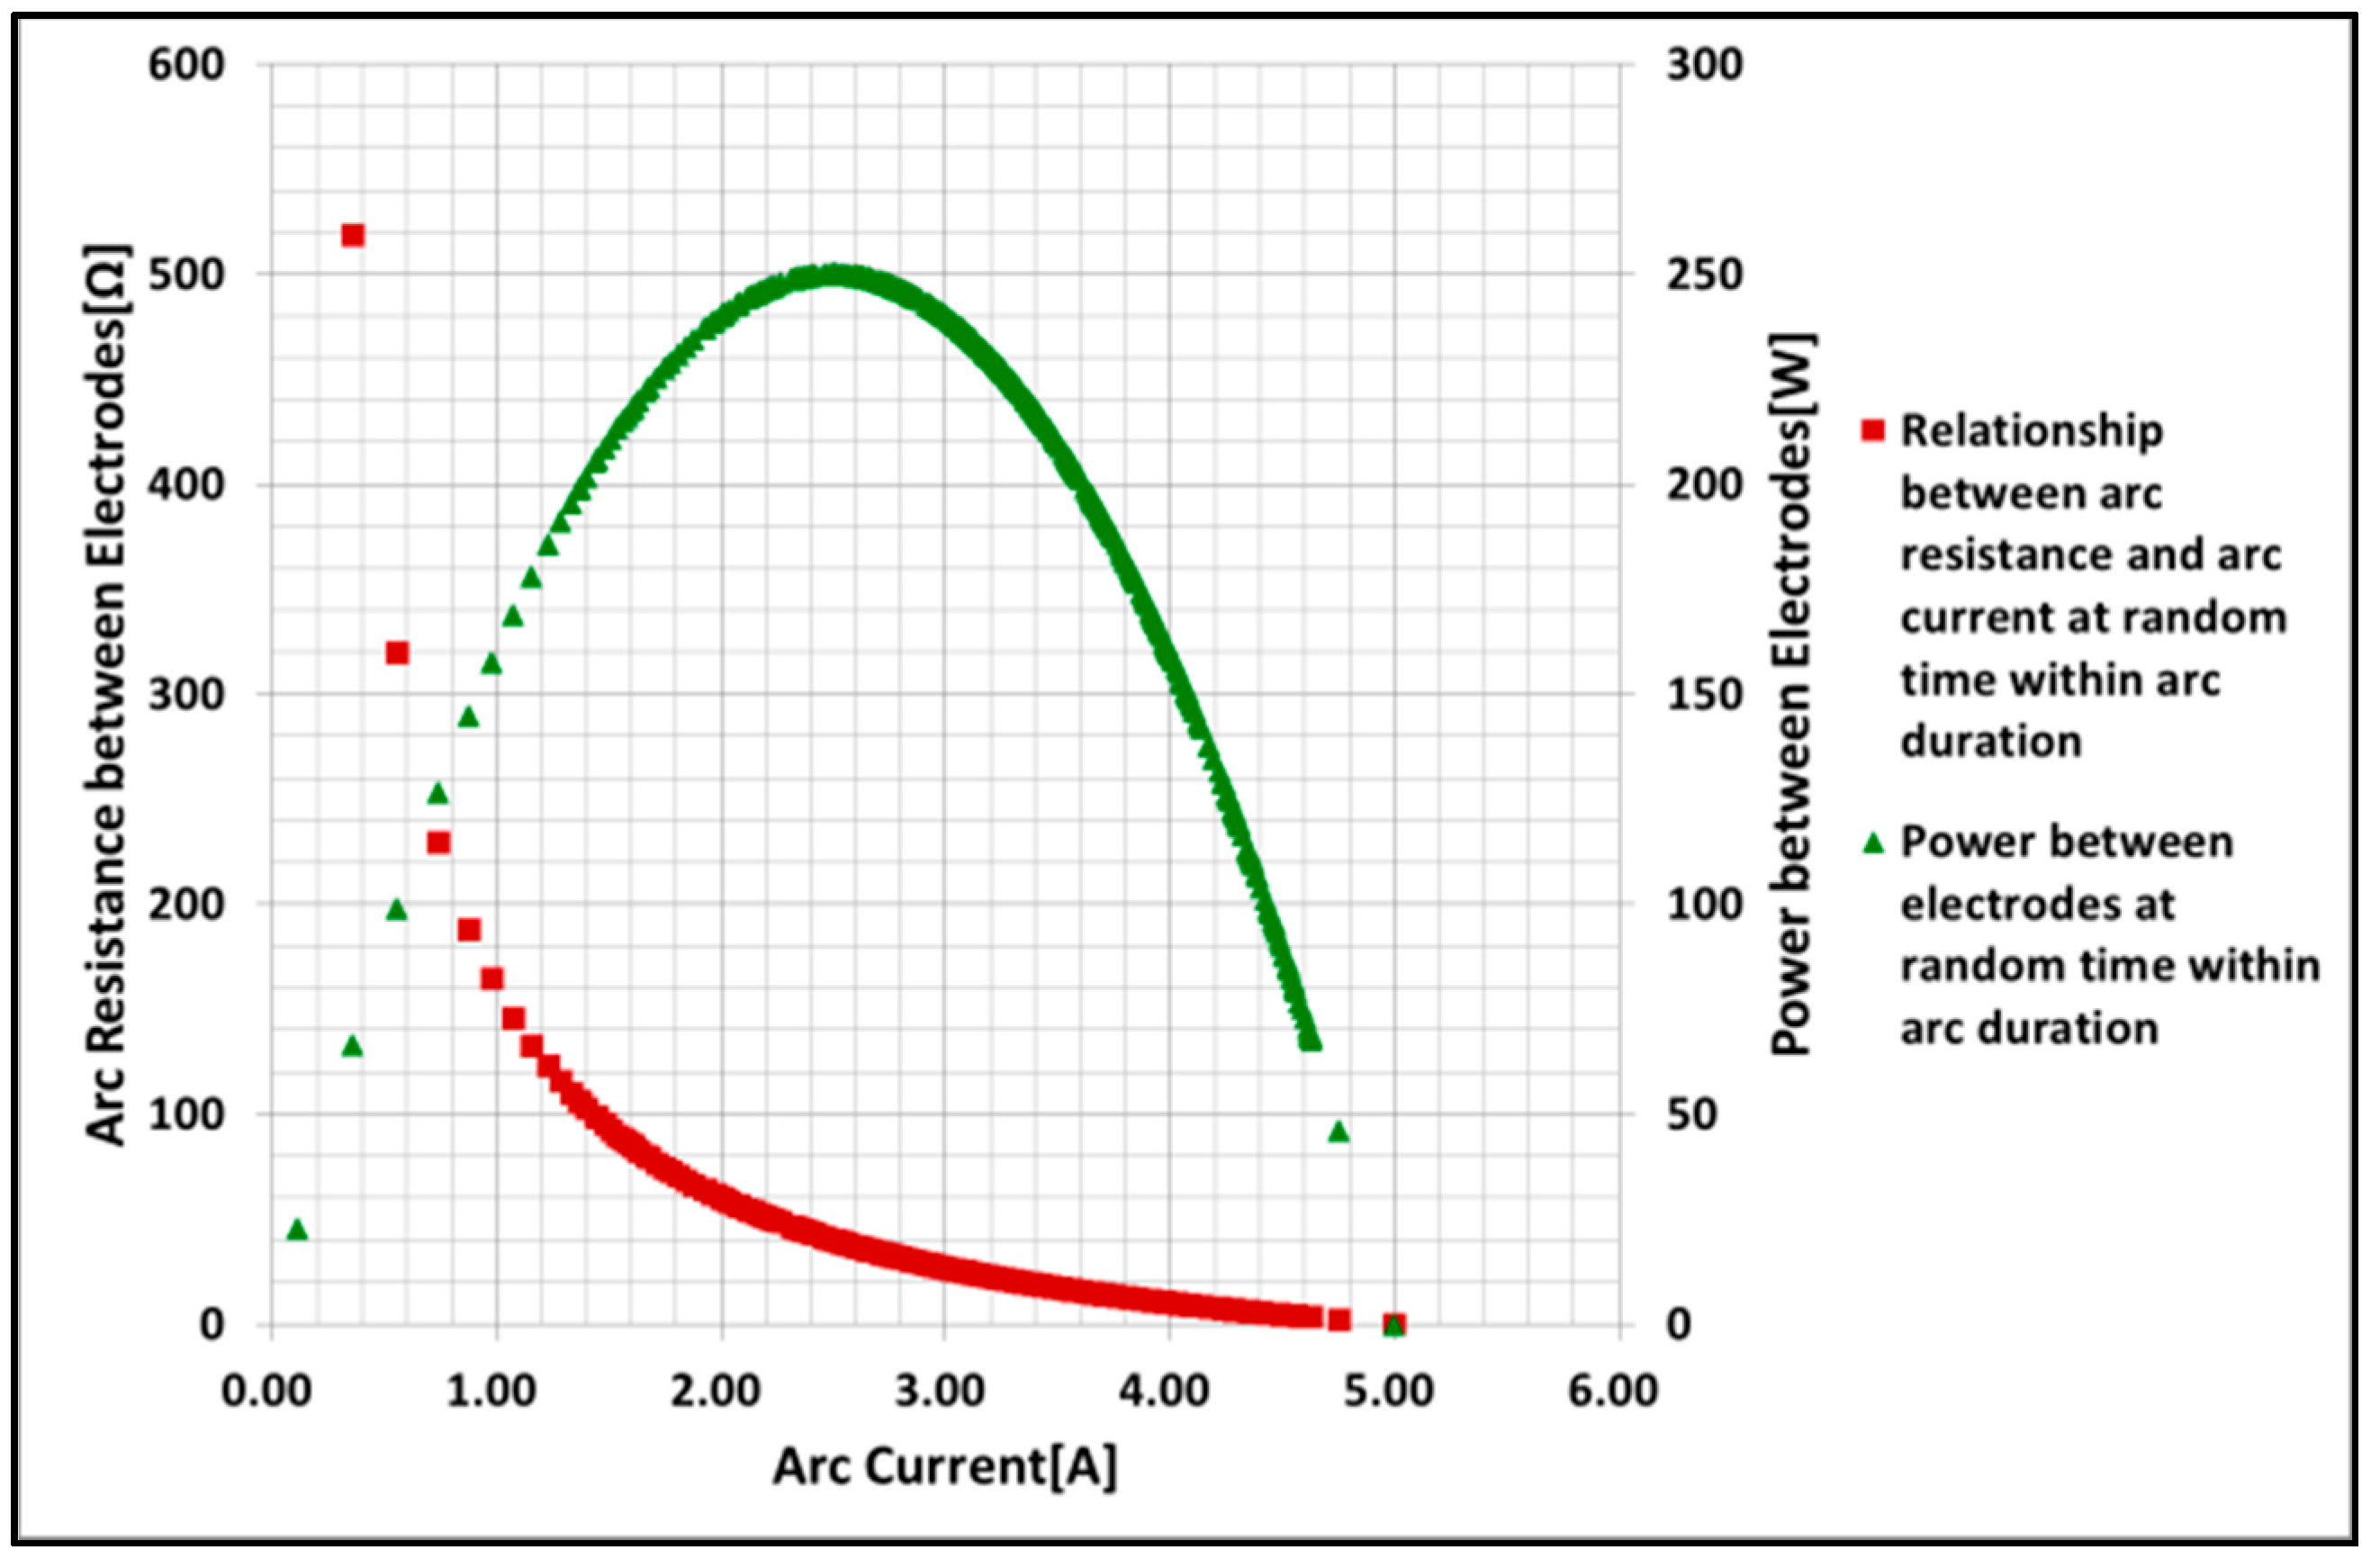
Equation (13) and Figure 16 show that the arc power is maximum the at 1/2 value of the load current (). At the same time, the maximum arc power becomes 1/4 value of the load power before electrodes separation.
Figure 16.
, , relation graph.
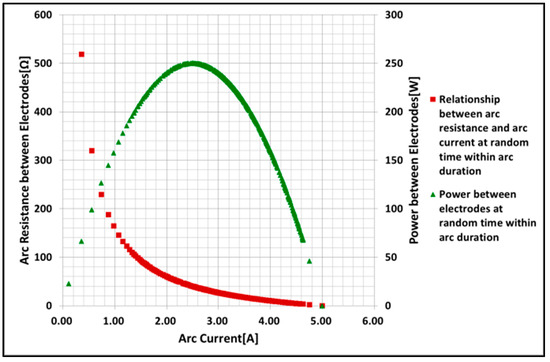
Figure 17 shows the graph of applying the experimental result of 200 V/5 A to Equation (13). This result demonstrates that the arc power has its maximum value at 2.5 A where .
Figure 17.
Power between electrodes at 200 V/5 A.
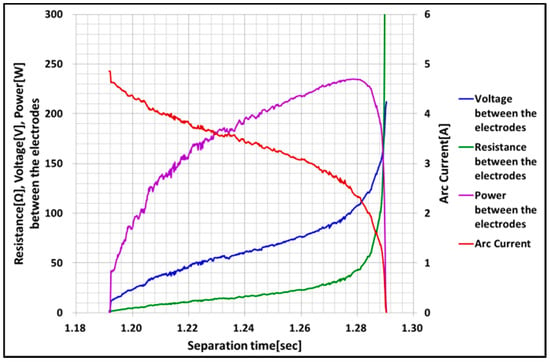
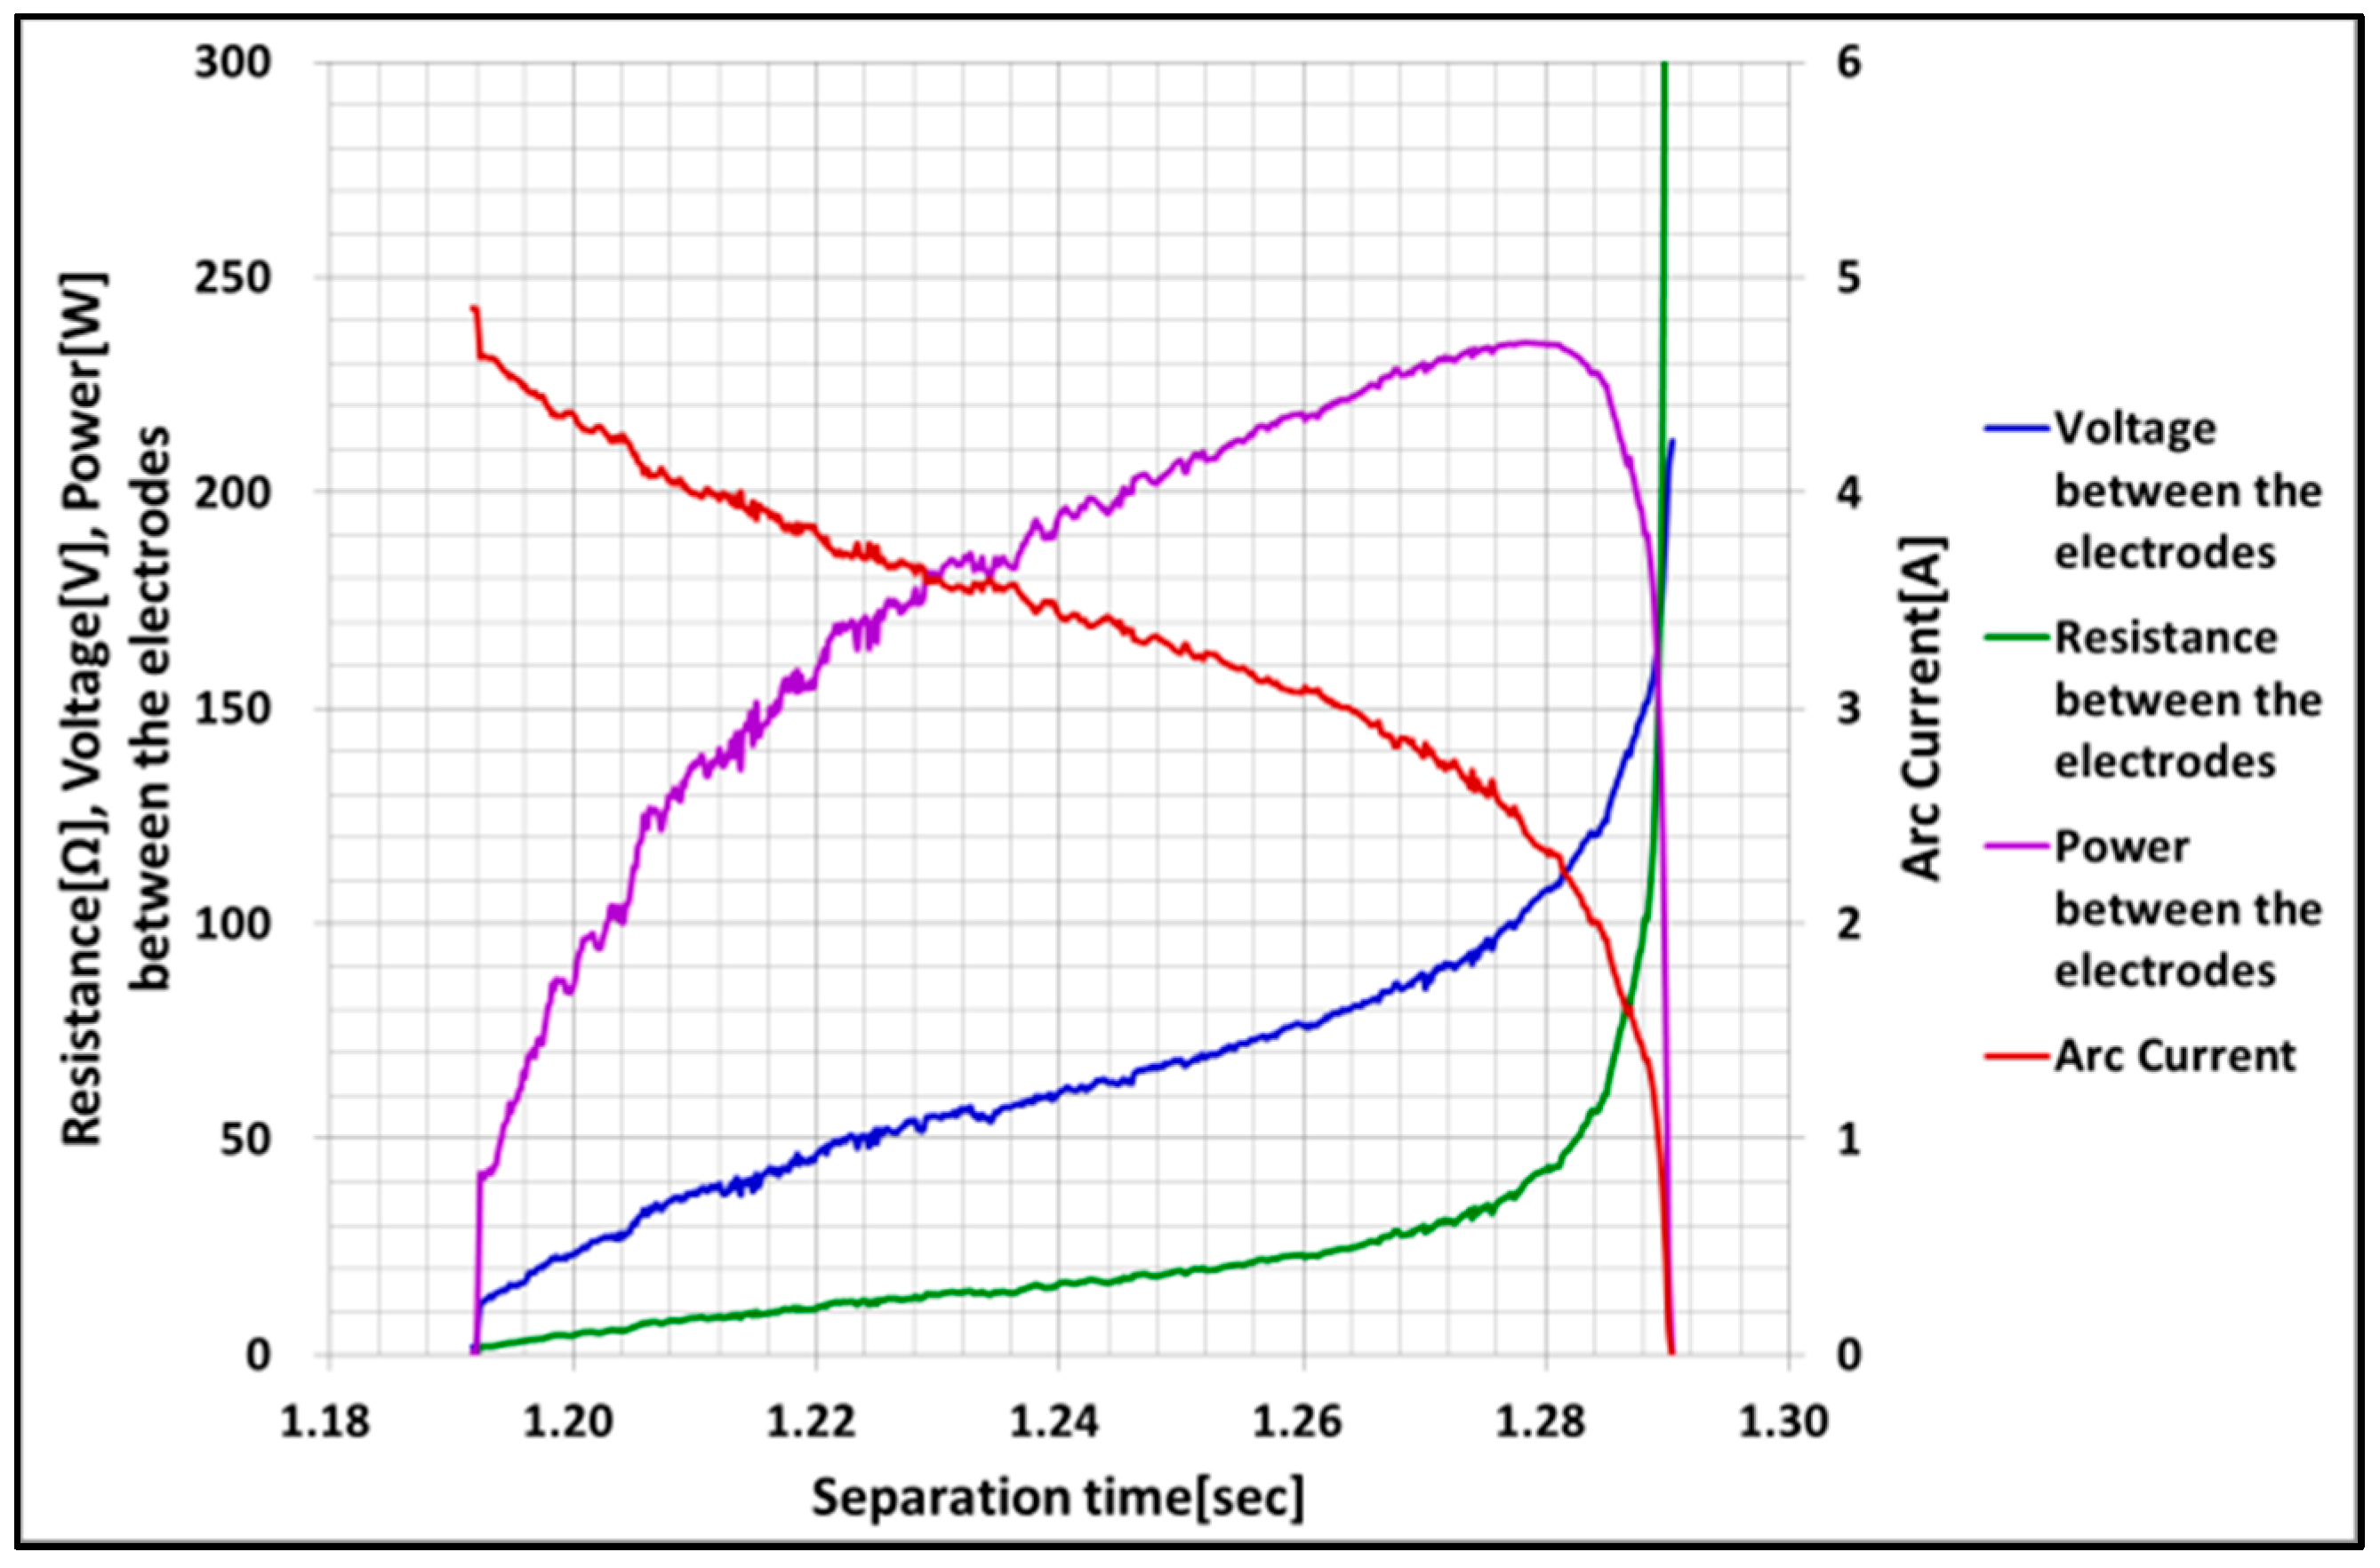
Figure 18 shows the experimental results of arc voltage, arc current, arc resistance, and power between electrodes during electrodes separation. As shown in Figure 16 and Figure 17, the power between electrodes becomes its maximum when arc current becomes . As shown in Figure 18, and are rapidly decreased and is rapidly increased when the arc power is maximum, and it is ascertained that arc is rapidly extinguished.
Figure 18.
200 V/5 A experimental results graph (arc power, arc voltage, arc current, arc resistance).
3.5. Arc Extinguishing Threshold Point
Previous Section 3.4, it is shown that increase of and decrease of are accelerated and the variation width becomes larger based on the time point passing . The relationship between the time () to reach and the arc extinguishing time () is analyzed as shown in Table 4.
Table 4.
(time at maximum arc power) at (maximum arc power) and (arc extinguishing time) relationship.
According to the experimental conditions in Table 1, / was analyzed to be 0.80 on the average. It is ascertained that arc extinguishing duration time is 20% of the total arc duration time.
4. Conclusions
In this paper, arc initiation voltage and arc initiation current characteristics were shown through arc initiation experiments. Electrodes were separated under various source voltages and load currents conditions. After arc occurred, voltage between electrodes and current changes were measured and experimental results were analyzed.
After the electrode separation, the voltage between electrodes rose instantaneously and the arc was initiated. Here it was confirmed that the instantaneous increased voltage level was about 10 V regardless of the source voltage and the load current value. After the electrode separation, the load current decreased instantaneously. This value was inversely proportional to the supply voltage () and proportional to the load current (). By applying these characteristics to experimental values, it is confirmed that the value of dividing the arc initiation threshold voltage by the arc initiation threshold current is equal to the load resistance . Based on this, the voltage–current characteristics and the correlation of the breaking arc were verified, and the voltage–current equation and DC arc resistance model for the breaking arc were developed.
The characteristics of , and of the breaking arc at random point during arc duration time were analyzed. The variation width of and was shown to increase as the arc approached extinguishing point, and was ¼ of the load power before electrode separation. The increase of and decrease of were accelerated at the point reaching and the arc was rapidly extinguished.
Author Contributions
W.K. carried out the main research tasks and wrote the full manuscript. Y.-J.K. performed the experiments. H.K. planned and designed the work.
Funding
This work was supported in part by Basic Science Research Program through the National Research Foundation of Korea (NRF) funded by the Ministry of Education. (Grants No. 2016R1D1A3B01008279).
Acknowledgments
This work was supported in part by Korea Electric Power Corporation (Grants No. R17XA05-46).
Conflicts of Interest
The authors declare no conflict of interest.
Nomenclature
| VS | Source voltage, |
| IL | Load current, |
| RL | Load resistance, |
| t0 | Separation start time of electrodes, |
| t1 | Arc initiation time, |
| text | Arc extinguishing time, |
| Time between t1 and text | Arc duration time, |
| d0 | Distance when electrodes are connected = 0, |
| d1 | Distance between electrodes at t1, |
| dext | Distance between electrodes at text, |
| Vth | Arc initiation threshold voltage, |
| Ith | Arc initiation threshold current, |
| Varc | Instantaneous arc voltage between electrodes, |
| Iarc | Instantaneous arc current, |
| rarc | Instantaneous arc resistance between electrodes, |
| parc | Instantaneous arc power between electrodes, |
| pmax | Maximum arc power. |
References
- Kim, H. DC distribution systems and circuit breaking technology. J. Korean Inst. Power Electron. 2010, 15, 40–46. [Google Scholar]
- Babasaki, T.; Tanaka, T.; Nozaki, Y.; Aoki, T.; Kurokawa, F. Developing of Higher Voltage Direct-Current Power-Feeding Prototype System. In Proceedings of the INTELEC 2009—31st International Telecommunications Energy Conference, Incheon, Korea, 18–22 October 2009. [Google Scholar]
- Yuba, T.; Baek, S.; Kiryu, K.; Nakamura, A.; Miyazawa, H.; Noritake, M.; Hirose, K. Development of Plug and Socket-outlet for 400 Volts Direct Current Distribution System. In Proceedings of the 8th International Conference on Power Electronics (ECCE Asia), Jeju, Korea, 30 May–3 June 2011. [Google Scholar]
- Lee, S.; Kim, H. Development of DC circuit breaker using magnet arc extinguisher. Trans. Korean Inst. Power Electron. 2012, 17, 21–26. [Google Scholar] [CrossRef] [Scilit]
- Berzak, L.F.; Dorfman, S.E.; Smith, S.P. Paschen′s Law in Air and Noble Gases. Available online: http://www-eng.lbl.gov/~shuman/XENON/REFERENCES&OTHER_MISC/paschen_report.pdf (accessed on 19 September 2018).
- Ayrton, H. The Electric Arc; Electrician: London, UK, 1902. [Google Scholar]
- Nottingham, W.B. A new equation for the static characteristic of the normal electric arc. Trans. Am. Inst. Elect. Eng. 1923, 42, 12–19. [Google Scholar] [CrossRef] [Scilit]
- Van, A.R.; Warrington, C. Reactance relays negligibly affected by arc impedance. Electron. World 1931, 98, 502–505. [Google Scholar]
- Stokes, A.D.; Oppenlander, W.T. Electric arcs in open air. J. Phys. D Appl. Phys. 1991, 24, 26–35. [Google Scholar] [CrossRef] [Scilit]
- Rau, S.H.; Lee, W.J. DC arc model based on 3-D DC arc simulation. IEEE Trans. Ind. Appl. 2016, 52, 5255–5261. [Google Scholar] [CrossRef] [Scilit]
- Kim, Y.J.; Kim, H.S. Modeling for series arc of DC circuit breaker. In Proceedings of the 2017 IEEE 6th International Conference on Renewable Energy Research and Applications (ICRERA), San Diego, CA, USA, 5–8 November 2017. [Google Scholar]
- Ammerman, R.F.; Gammon, T.; Sen, P.K.; Nelson, J.P. DC-arc models and incident-energy calculations. IEEE Trans. Ind. Appl. 2010, 46, 1810–1819. [Google Scholar] [CrossRef] [Scilit]
- Sawa, K.; Tsuruoka, M.; Yamashita, S. Fundamental arc Characteristics at DC Current Interruption of Low Voltage (<500 V). In Proceedings of the 27th International Conference on Electrical Contacts, Dresden, Germany, 22–26 June 2014. [Google Scholar]
- Uriarte, F.M.; Gattozzi, A.L.; Herbst, J.D.; Estes, H.B.; Hotz, T.J.; Kwasinski, A.; Hebner, R.E. A DC arc model for series faults in low voltage microgrids. IEEE Trans. Smart Grid 2012, 3, 2063–2070. [Google Scholar] [CrossRef] [Scilit]

© 2018 by the authors. Licensee MDPI, Basel, Switzerland. This article is an open access article distributed under the terms and conditions of the Creative Commons Attribution (CC BY) license (http://creativecommons.org/licenses/by/4.0/).