The Burden of Road Traffic Accidents on Facial Fractures: National Trends, Injury Patterns, and Disparities in 154,185 Patients
 ,
,
Abstract
Introduction
Patients and Methods
Inclusion/Exclusion Criteria
Data Collection
Statistical Analysis
Results
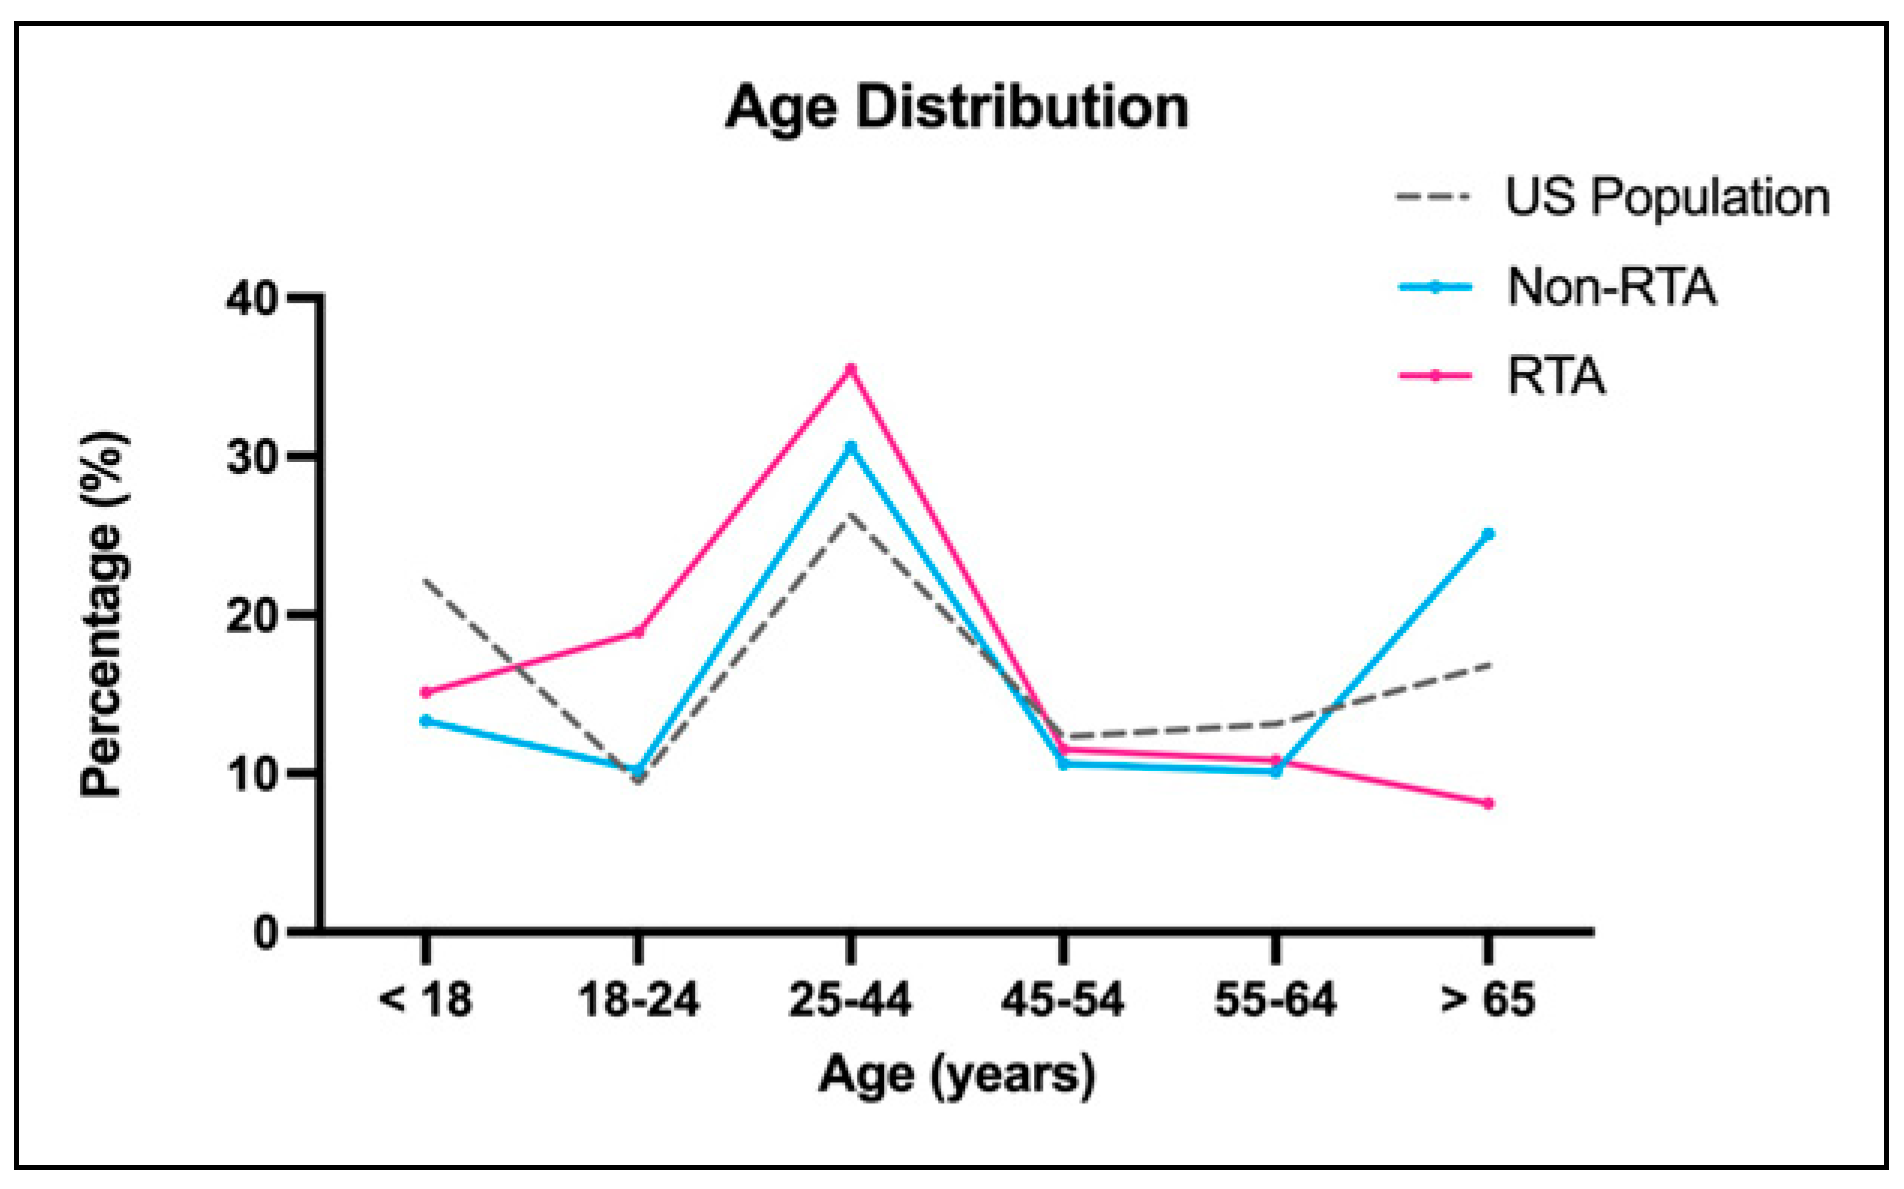
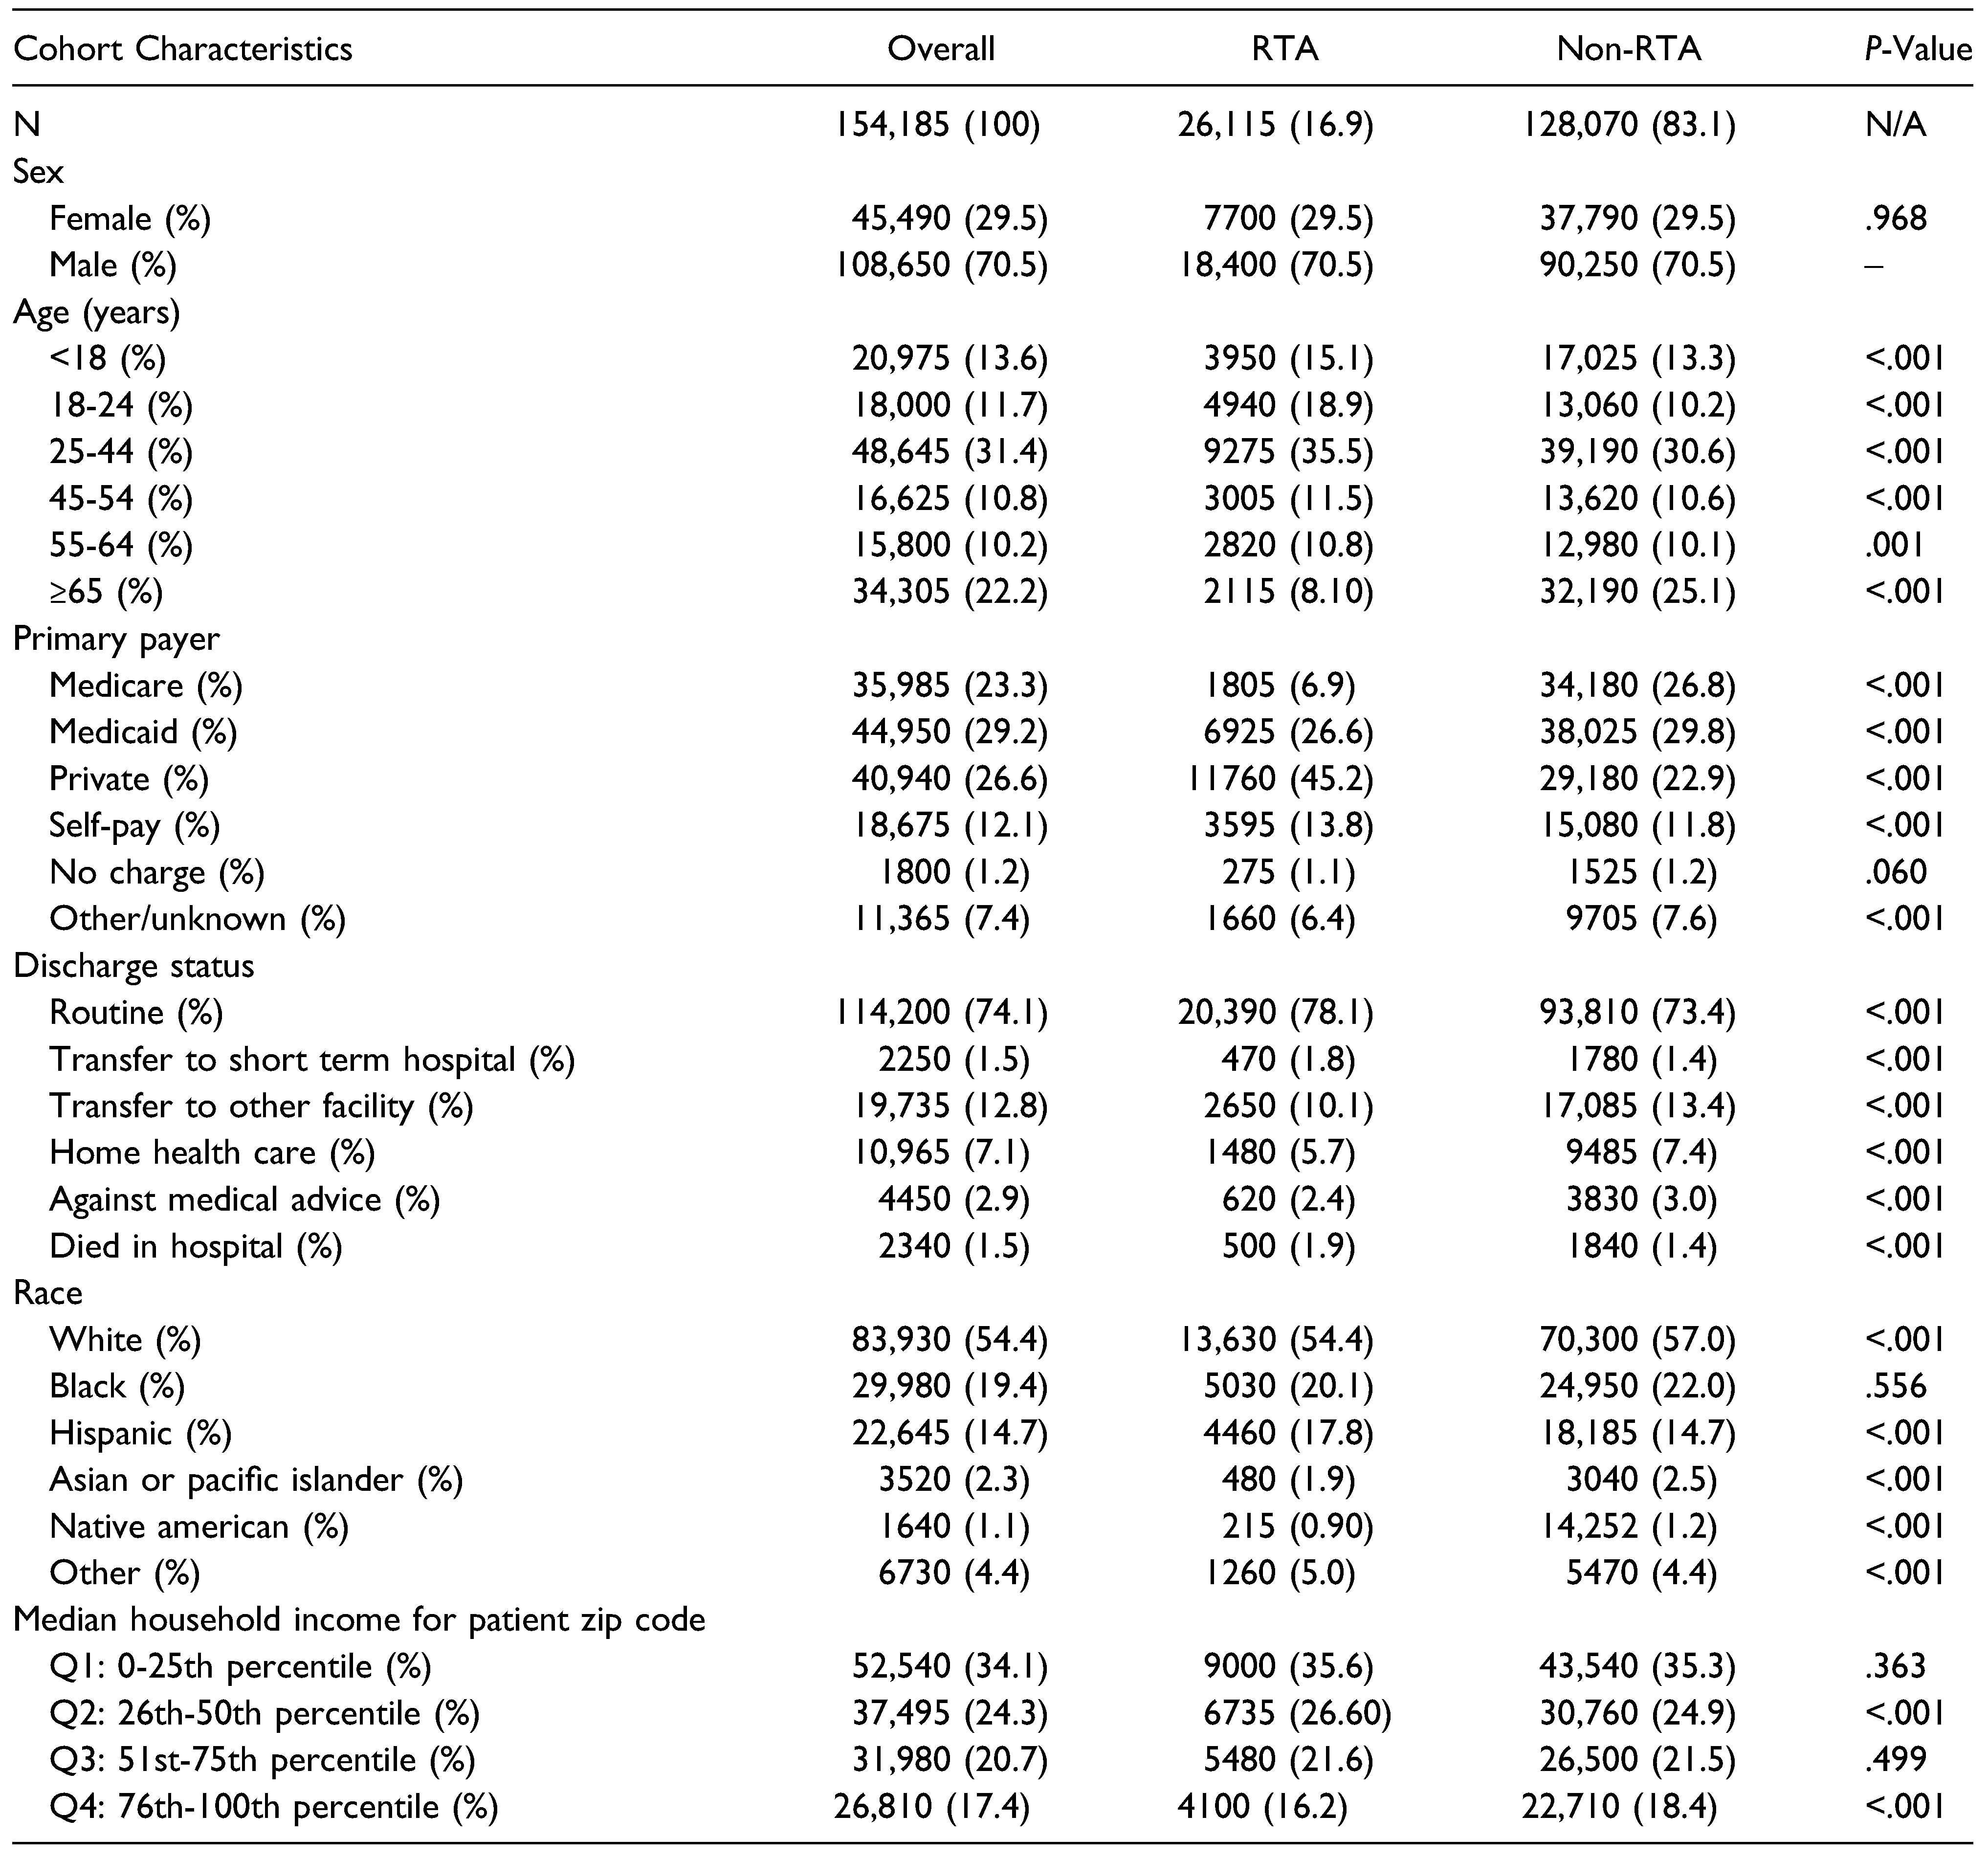
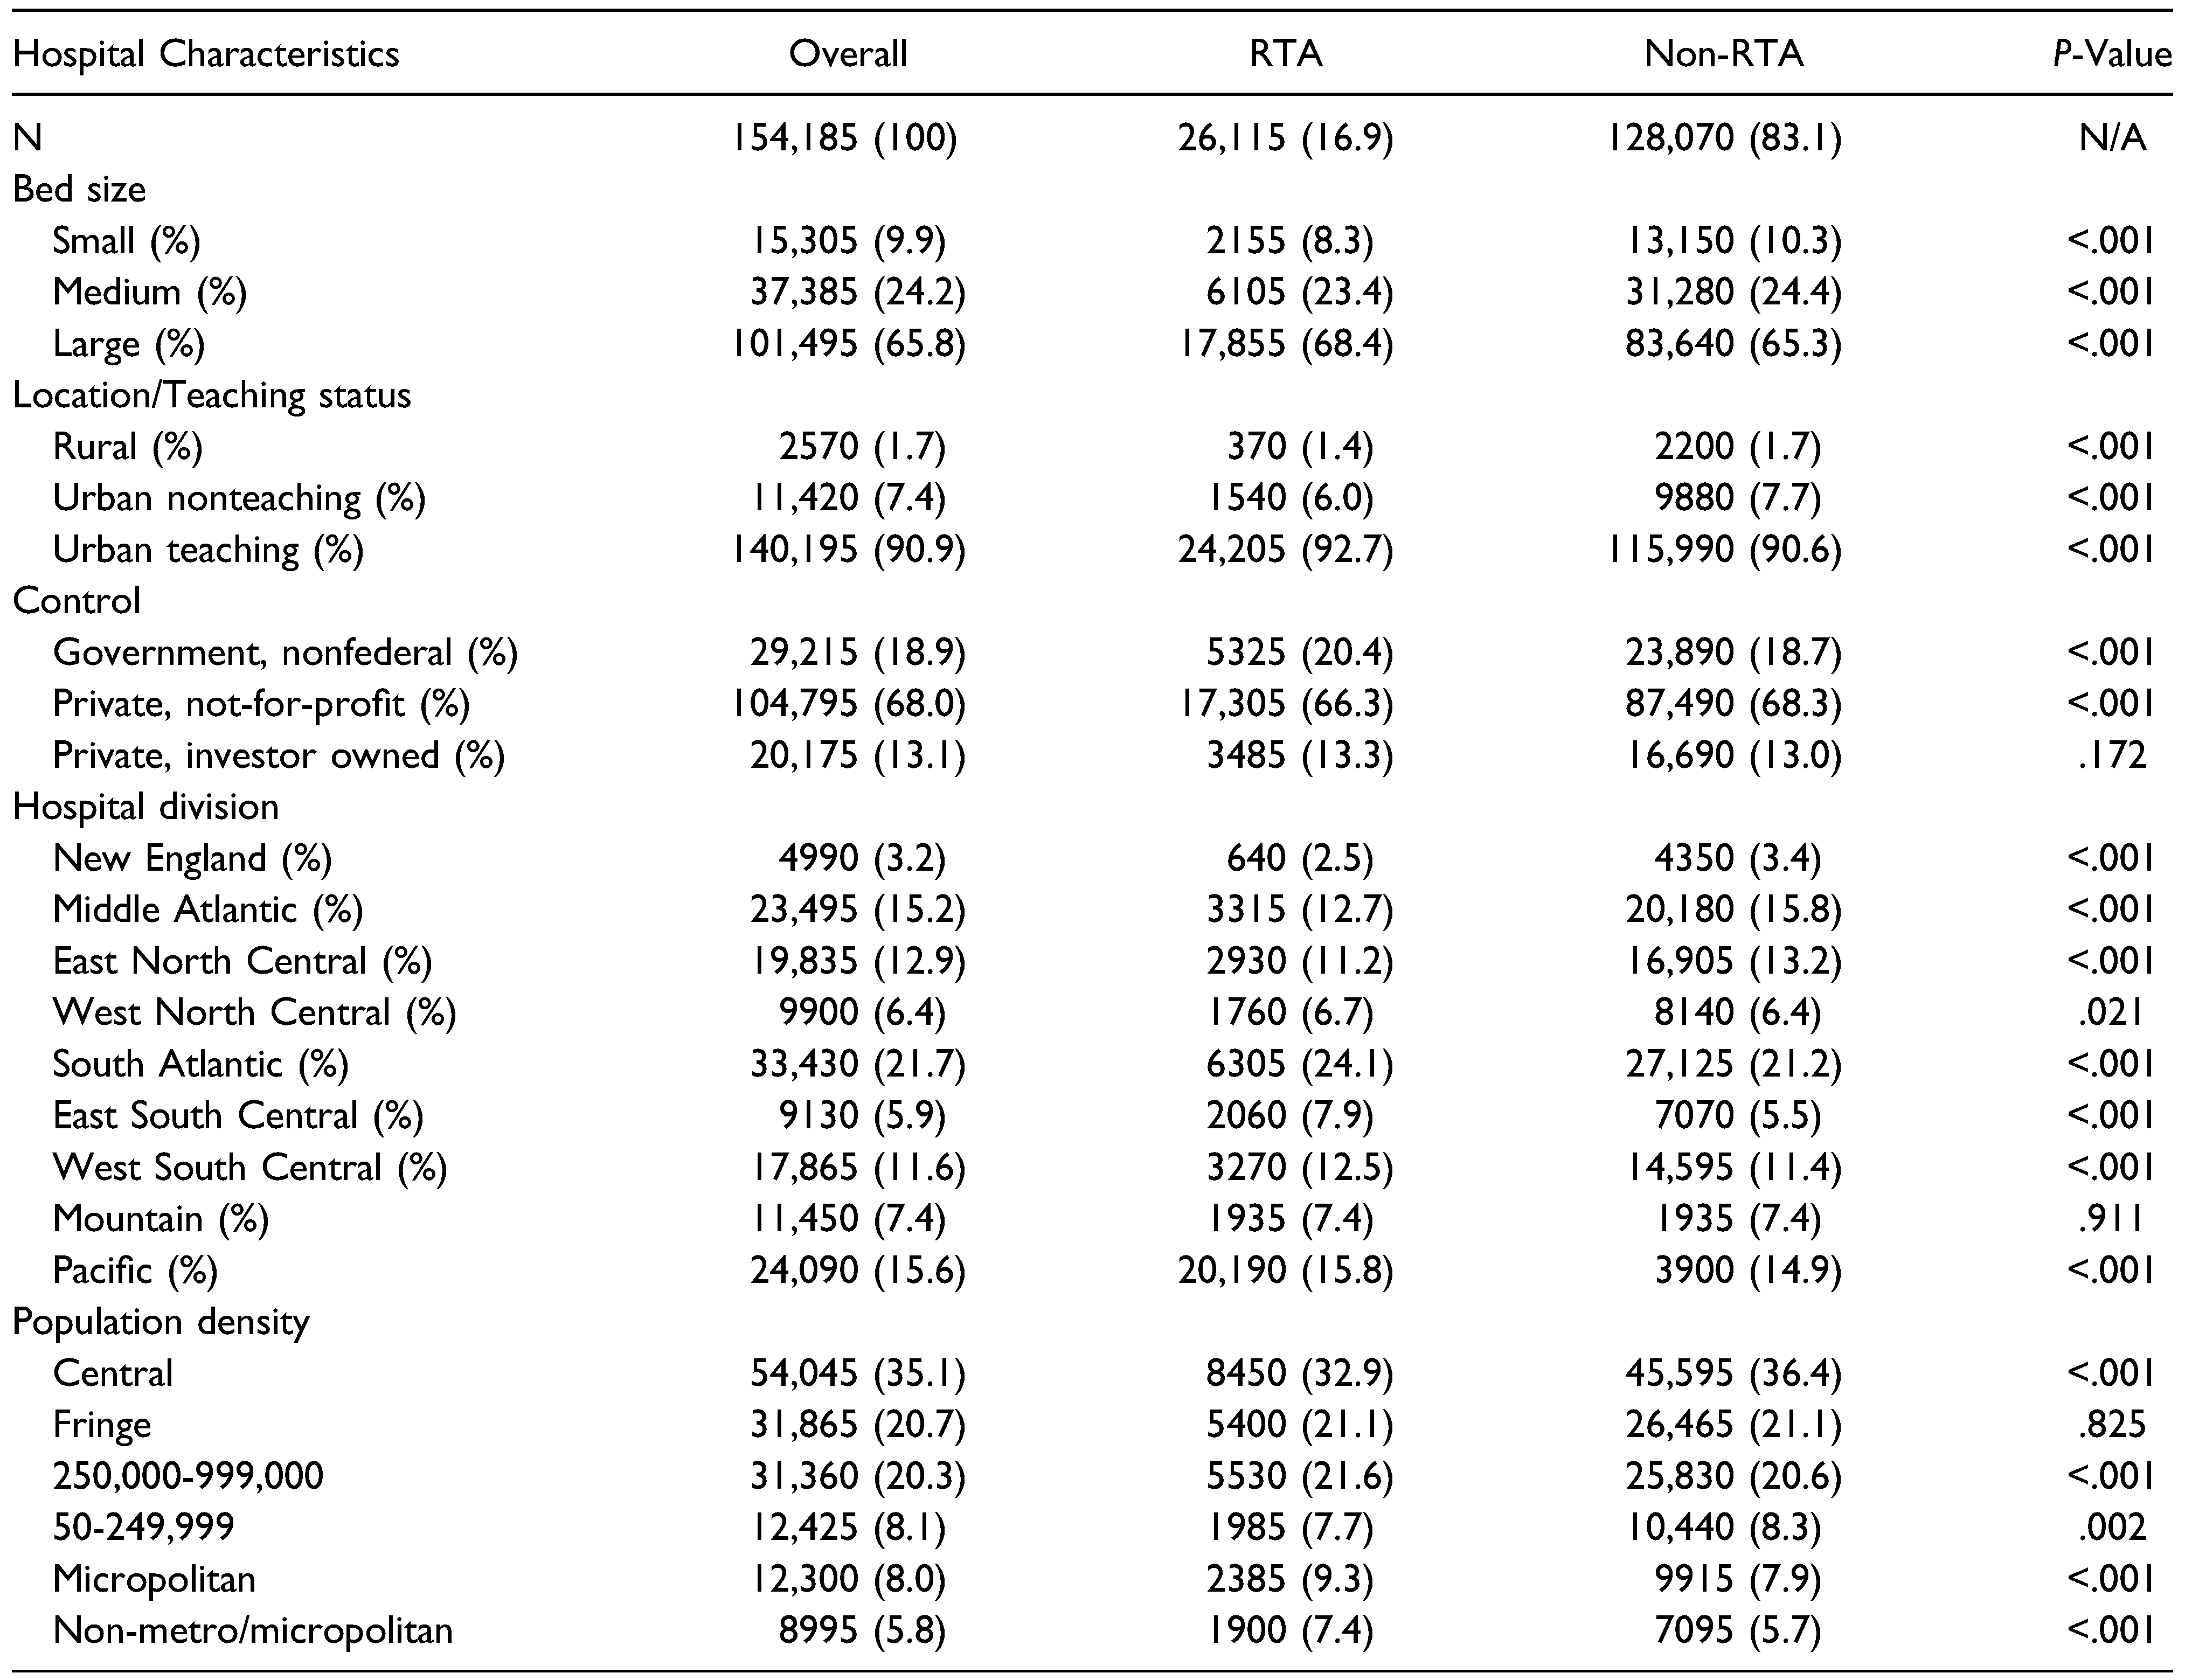
Cohort Characteristics
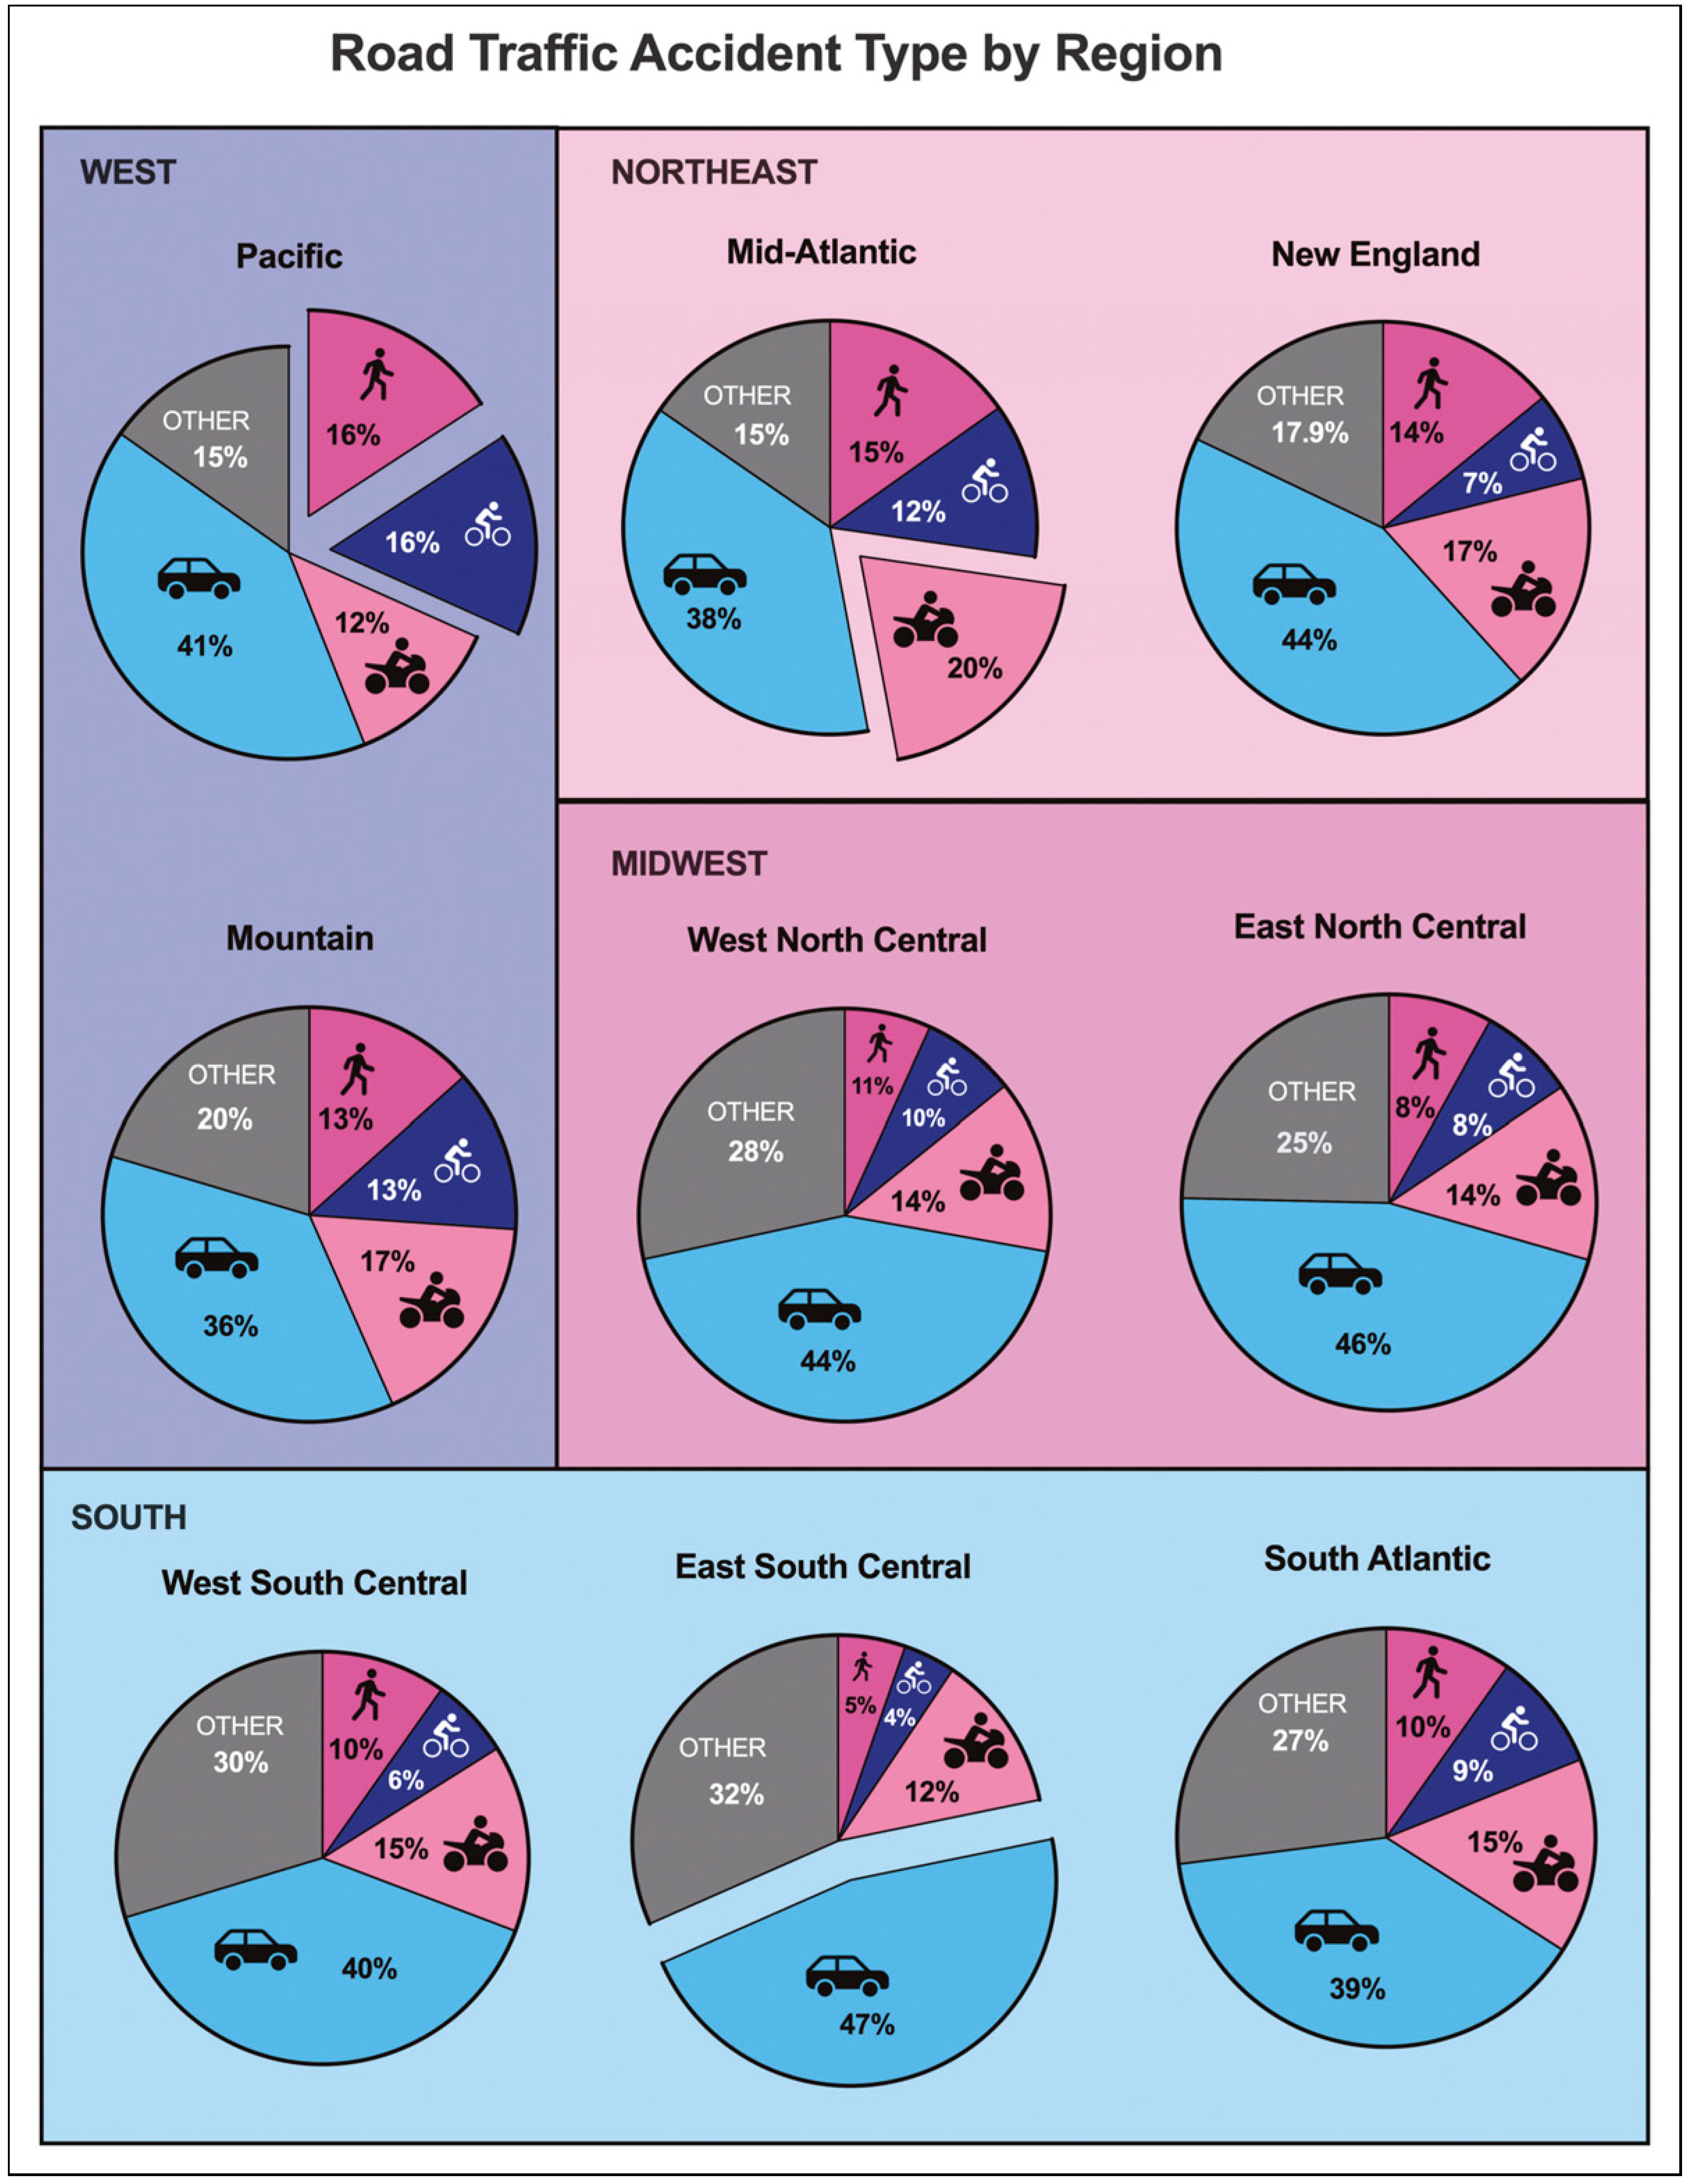
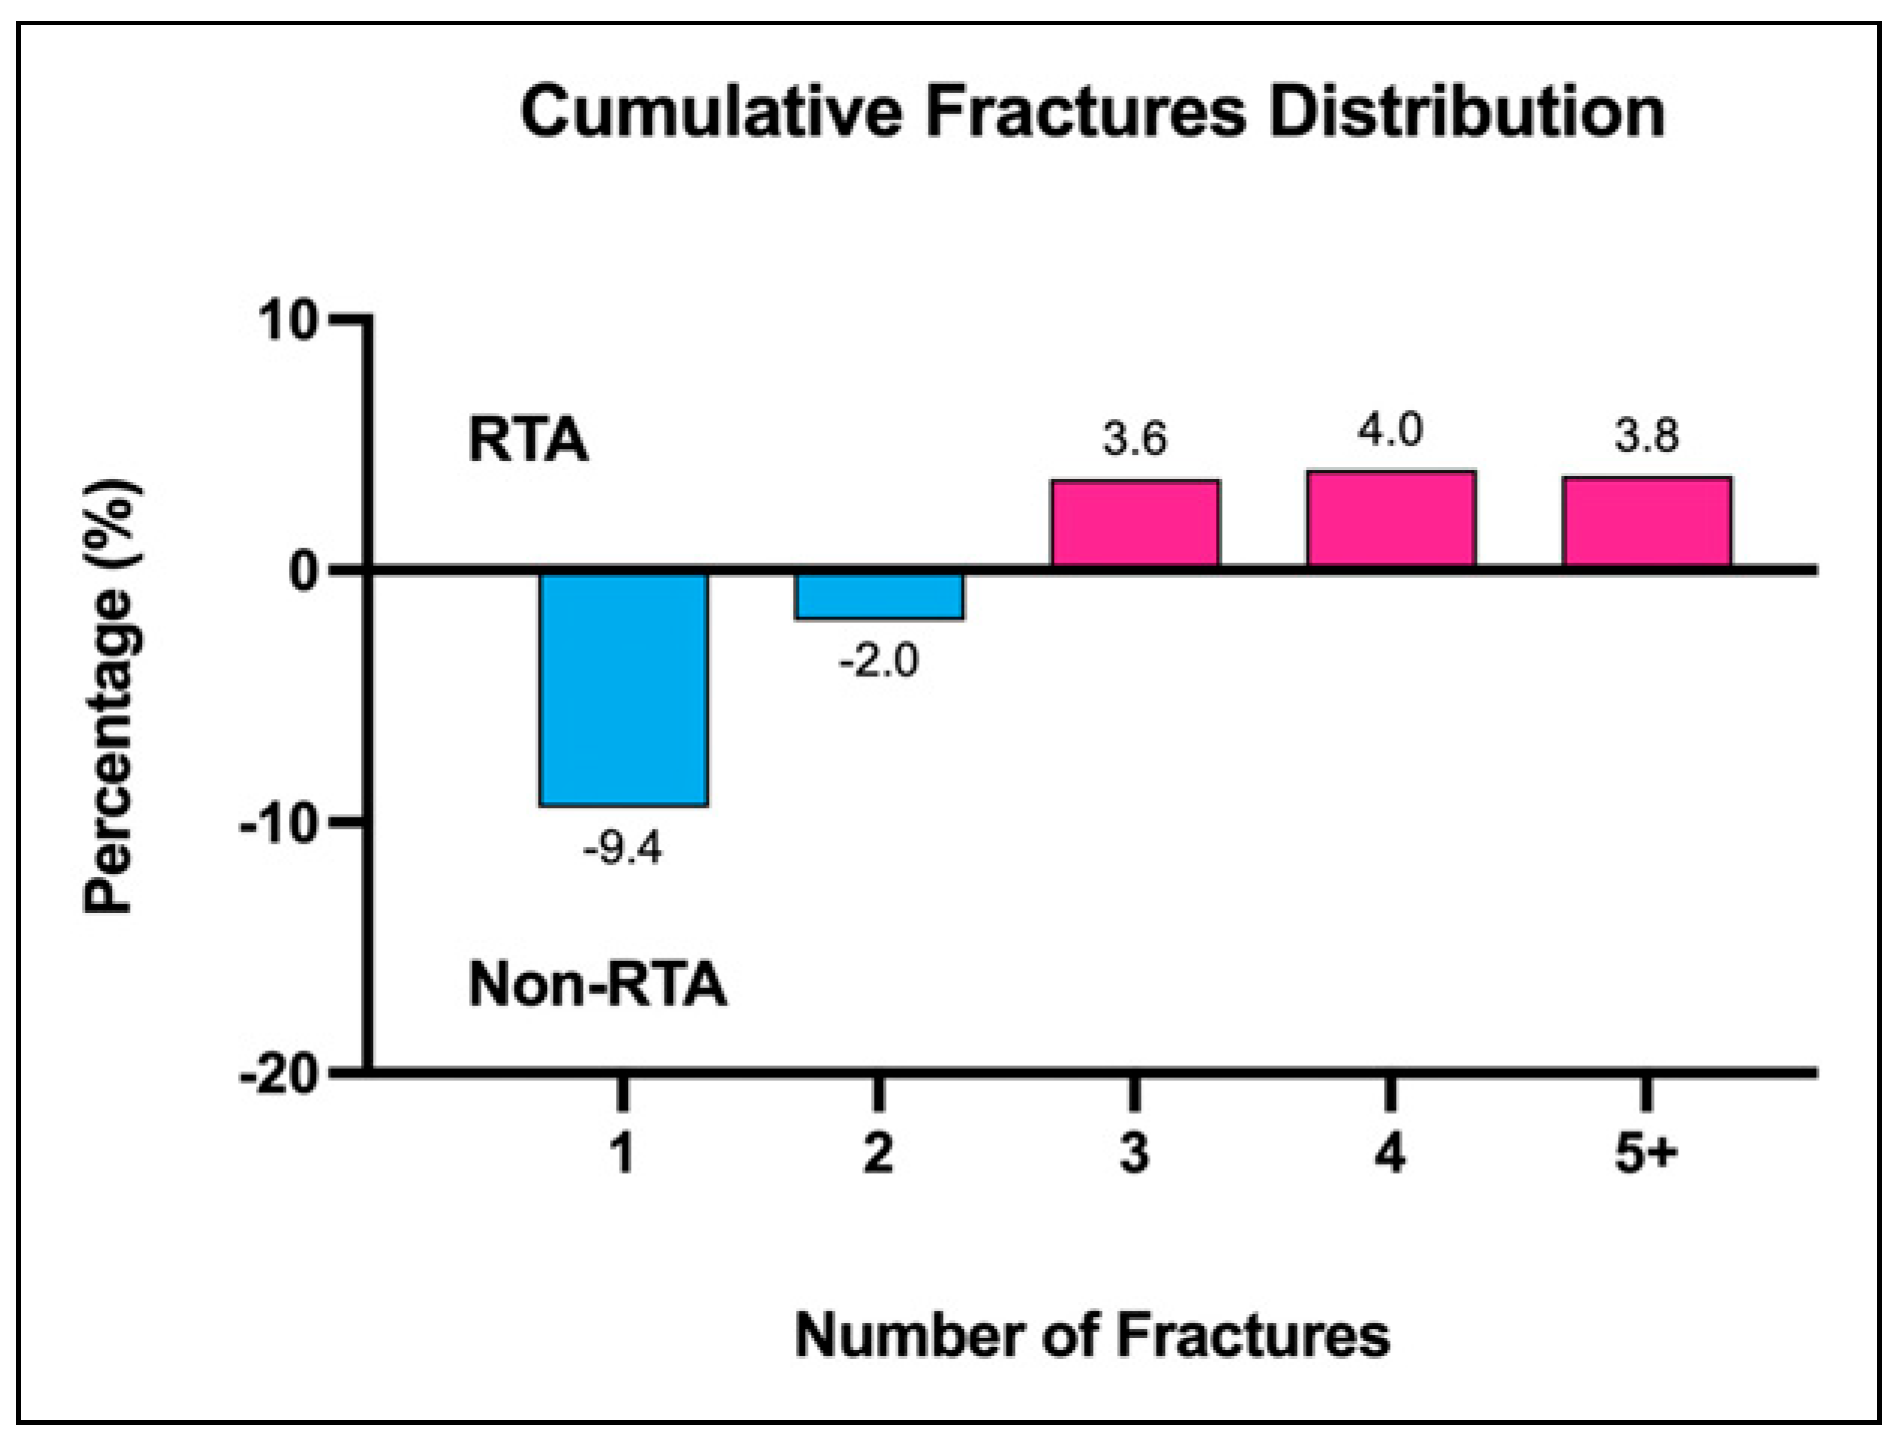
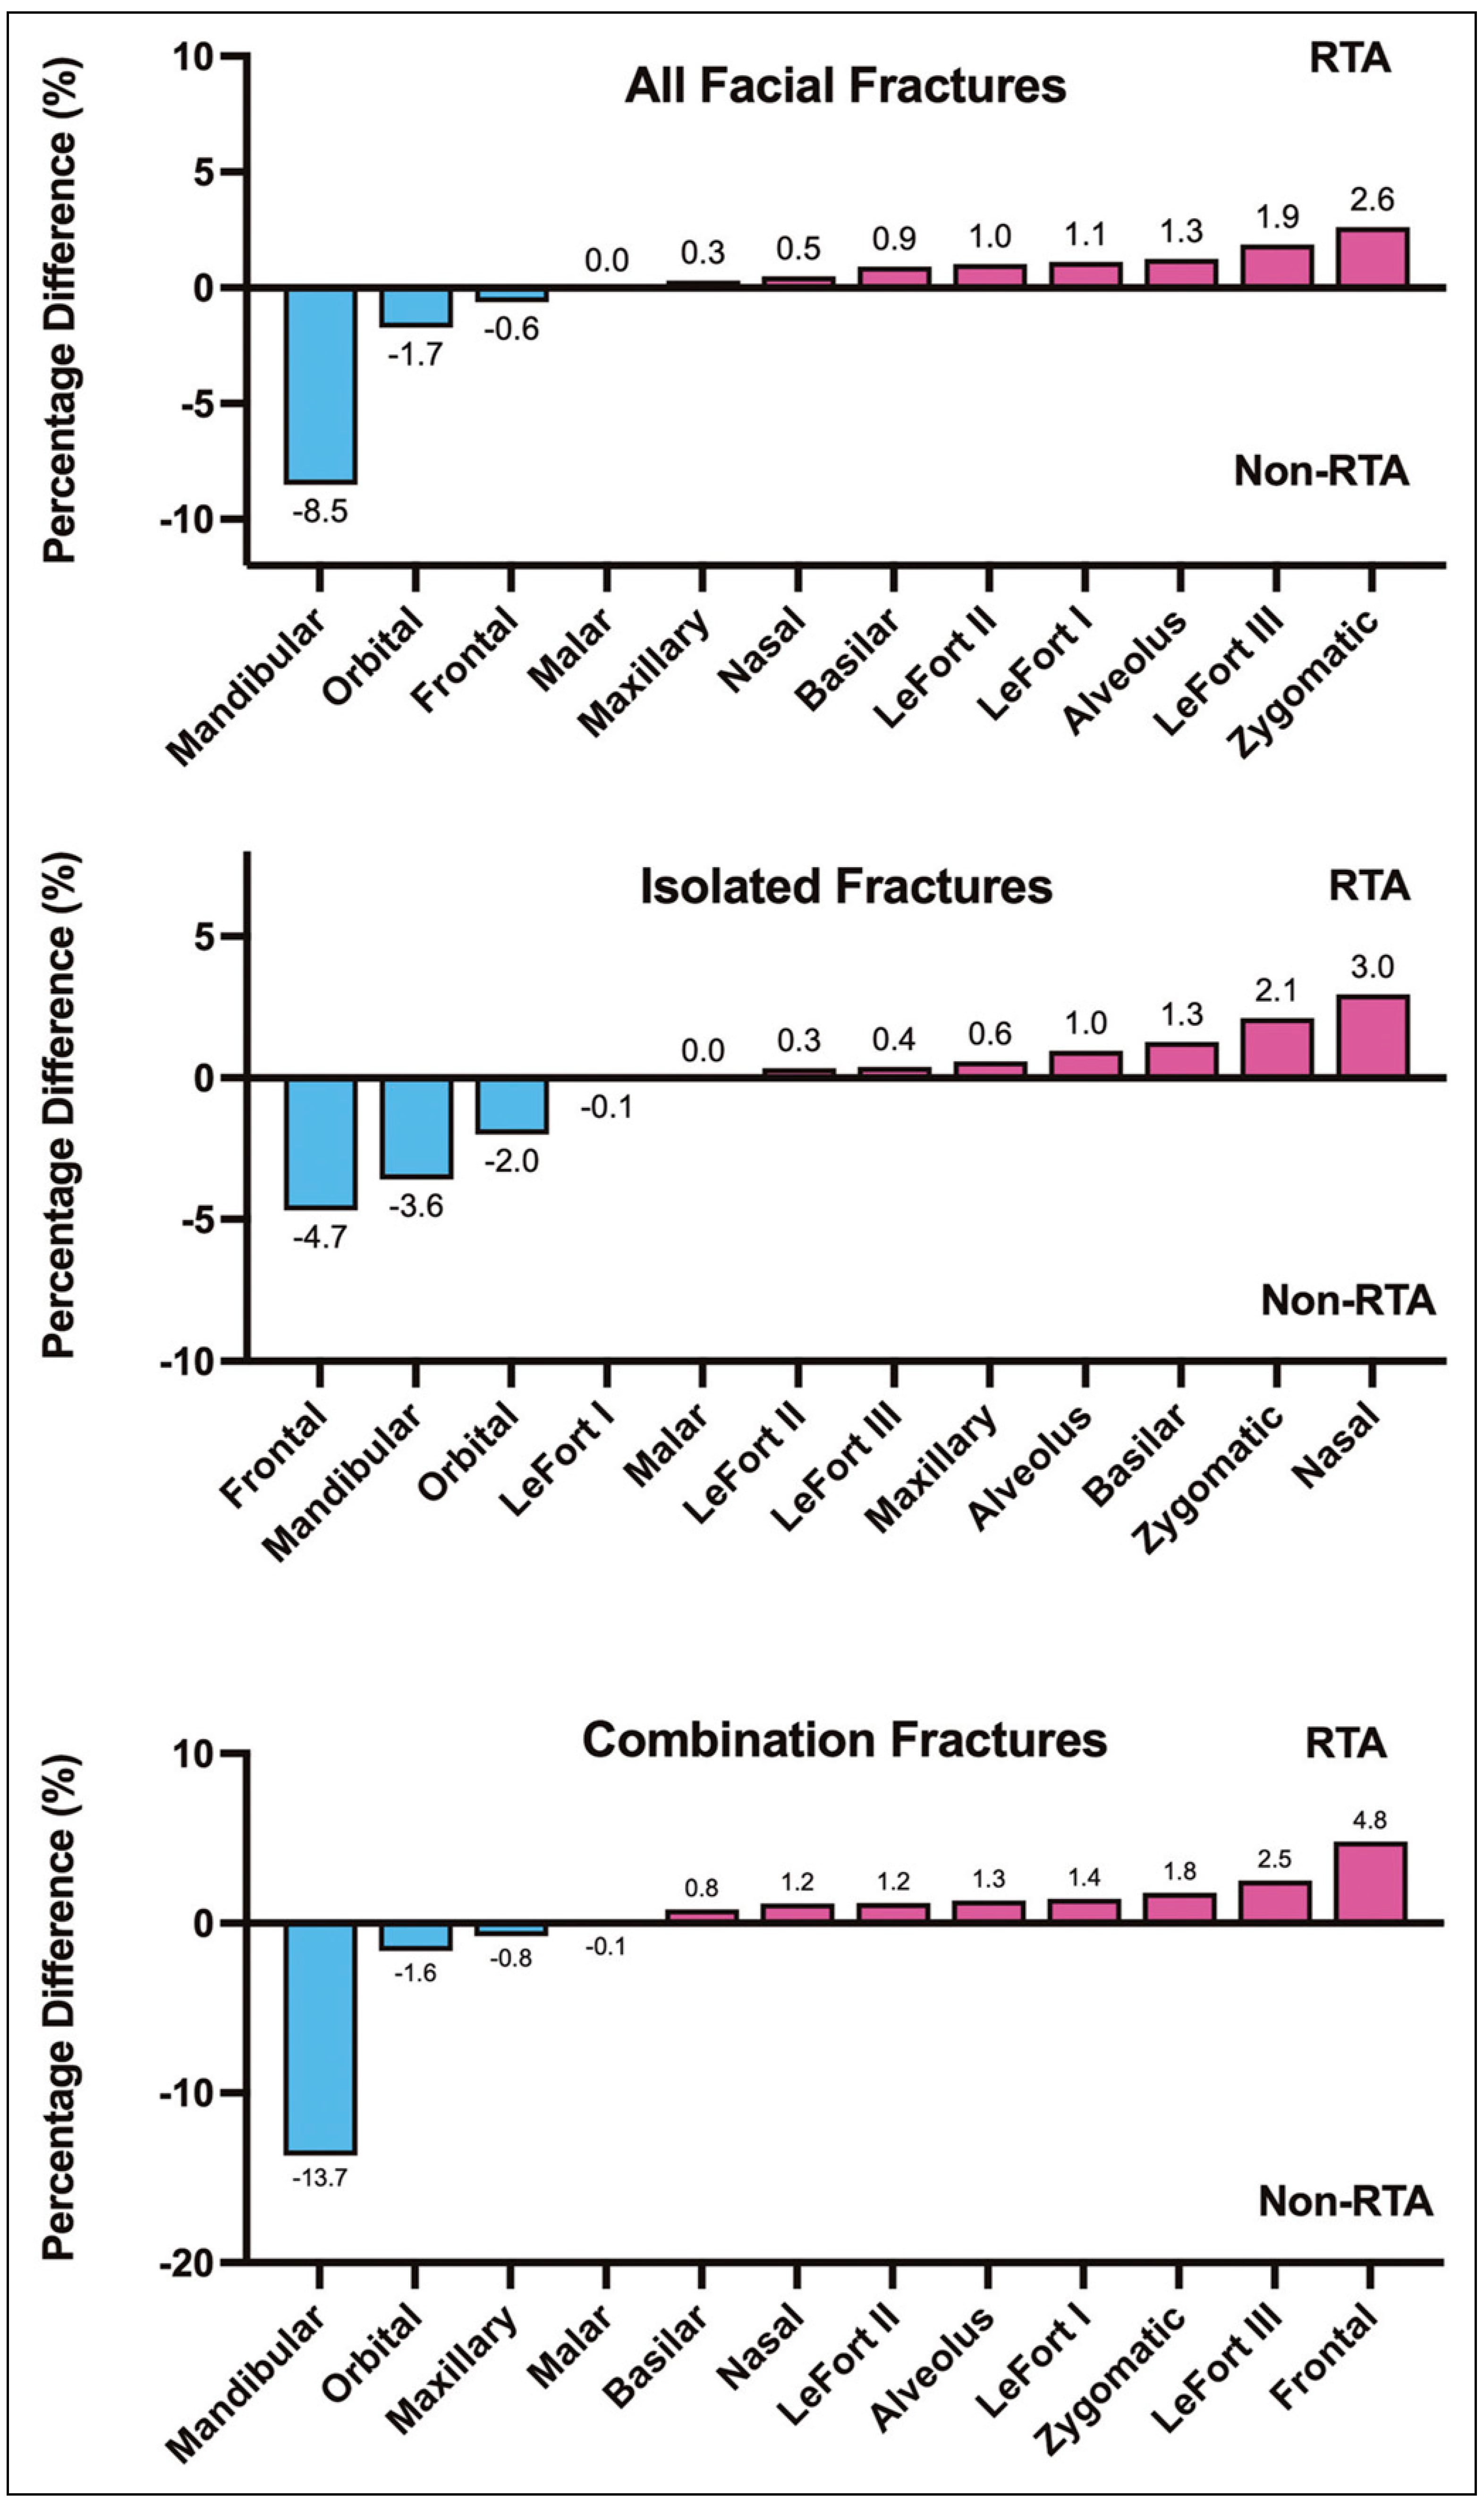
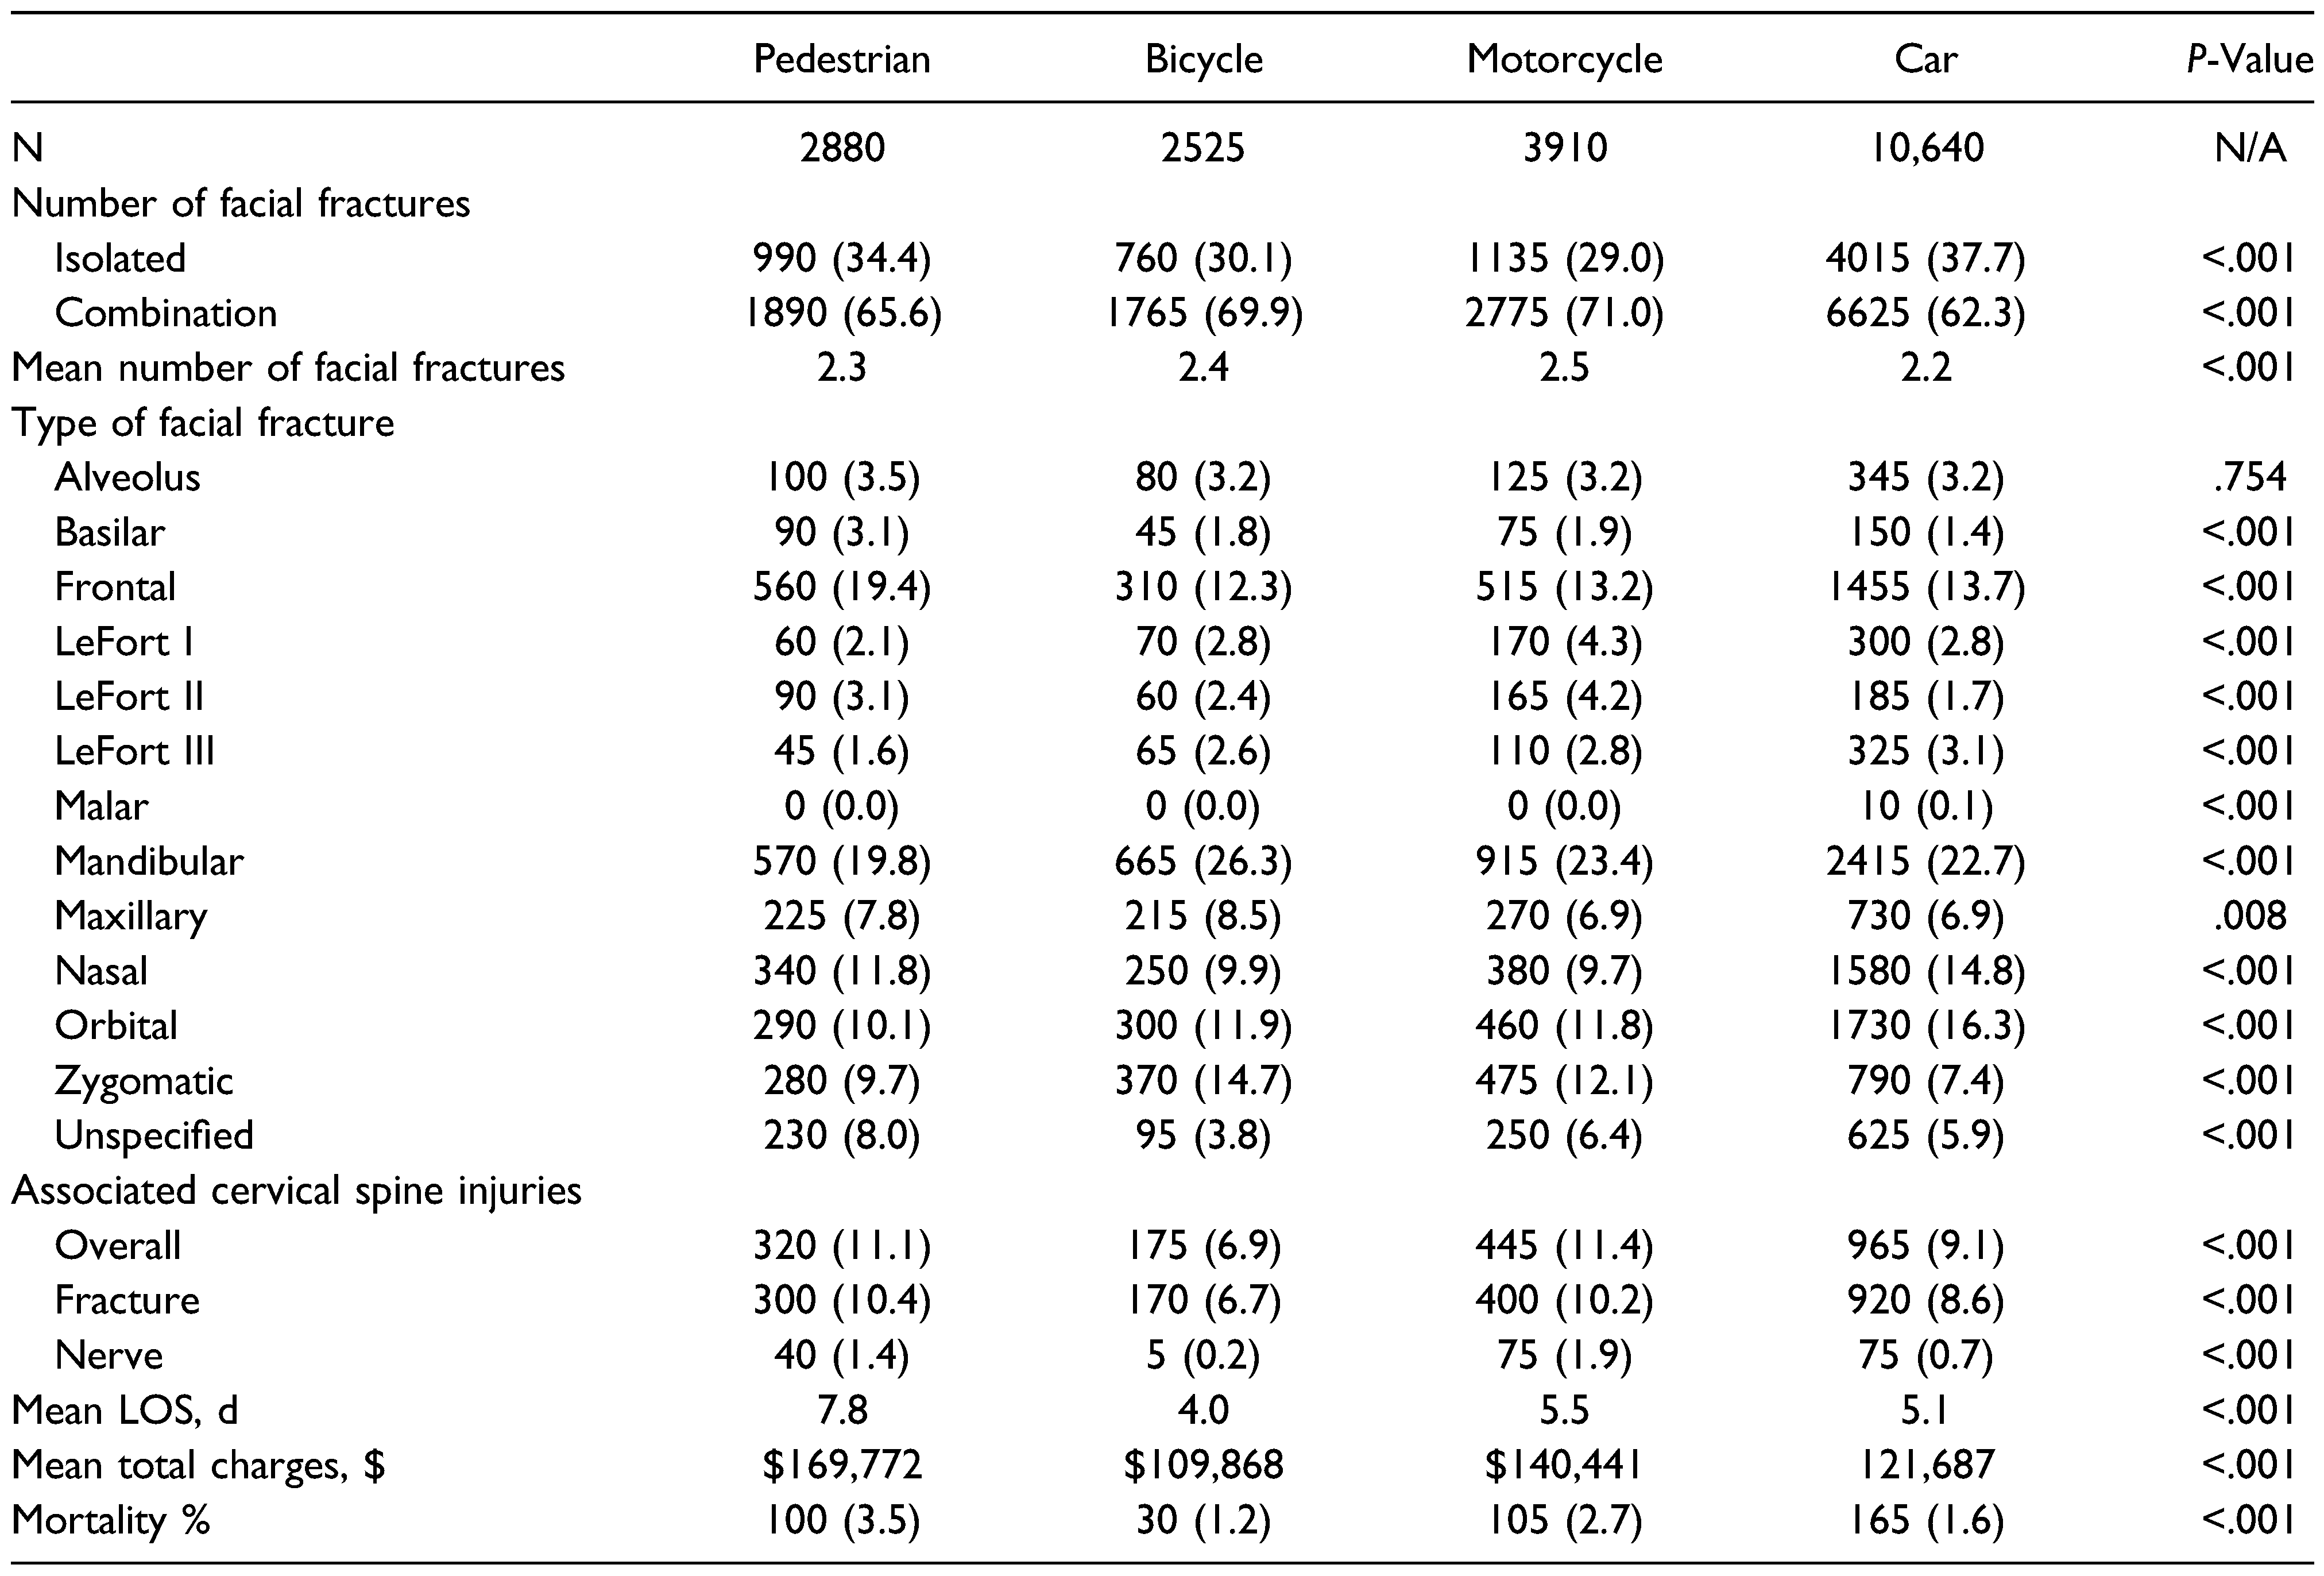
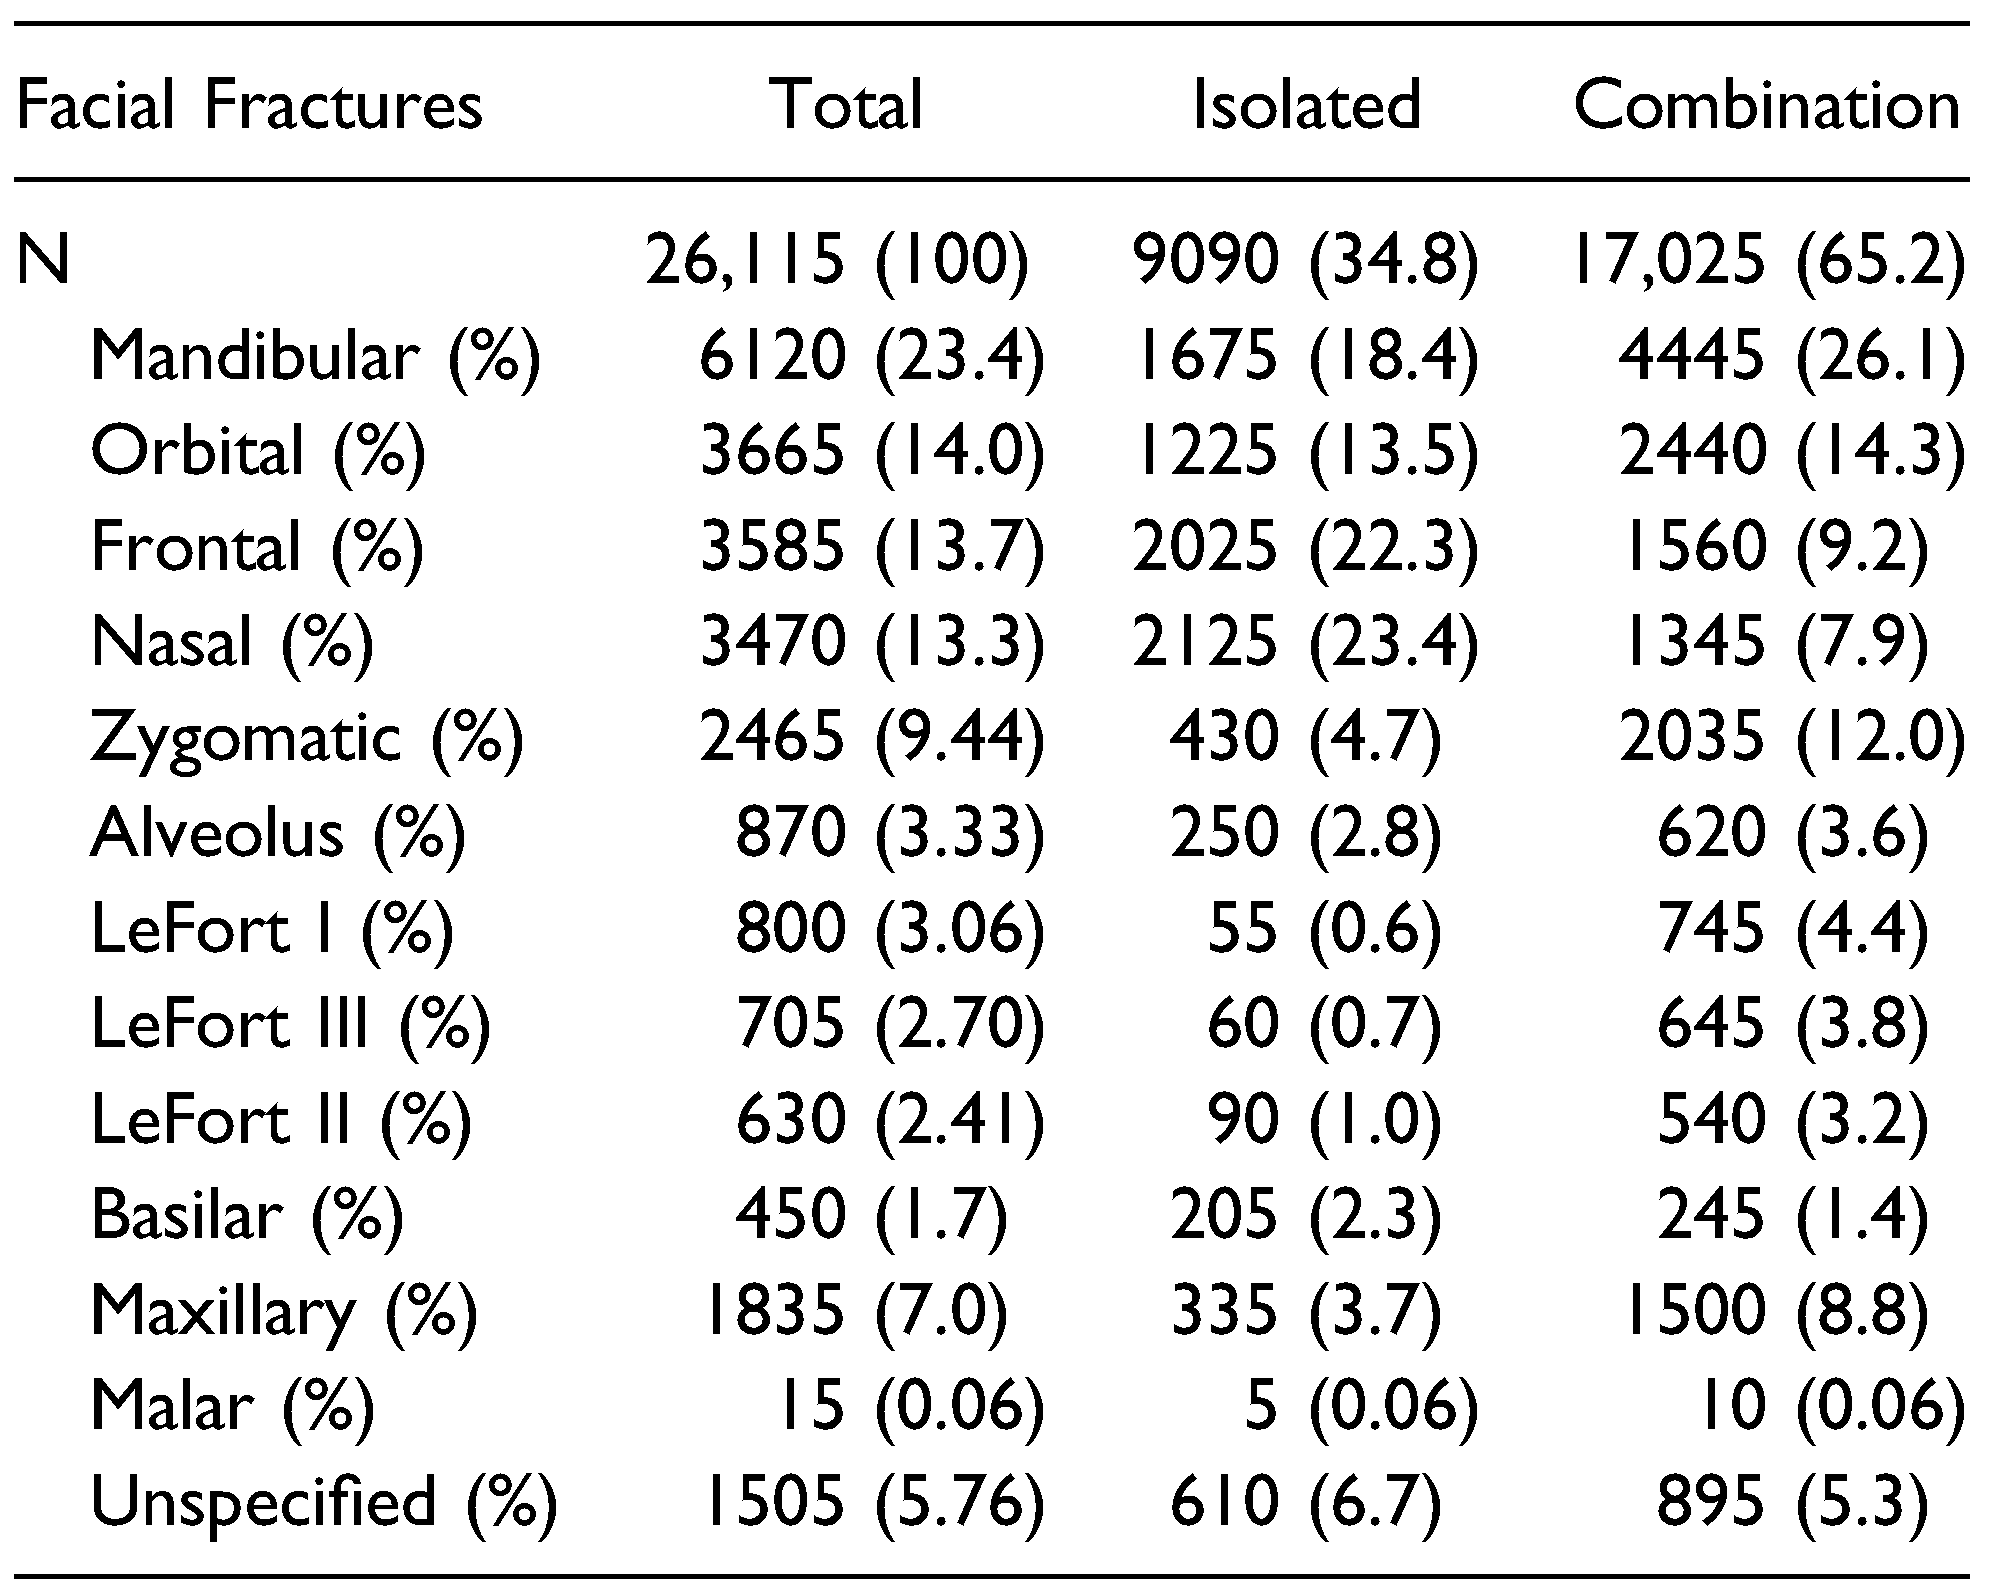
Injury Patterns
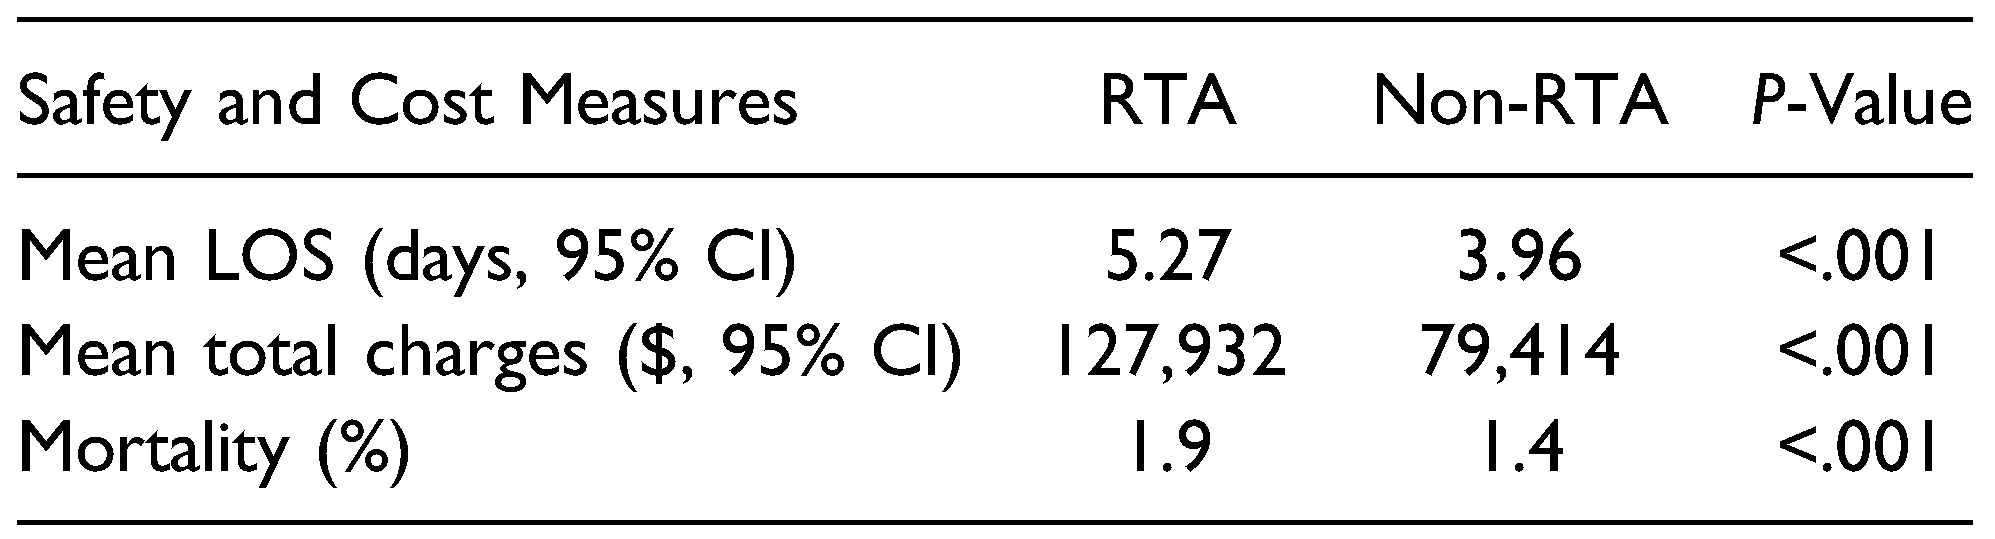
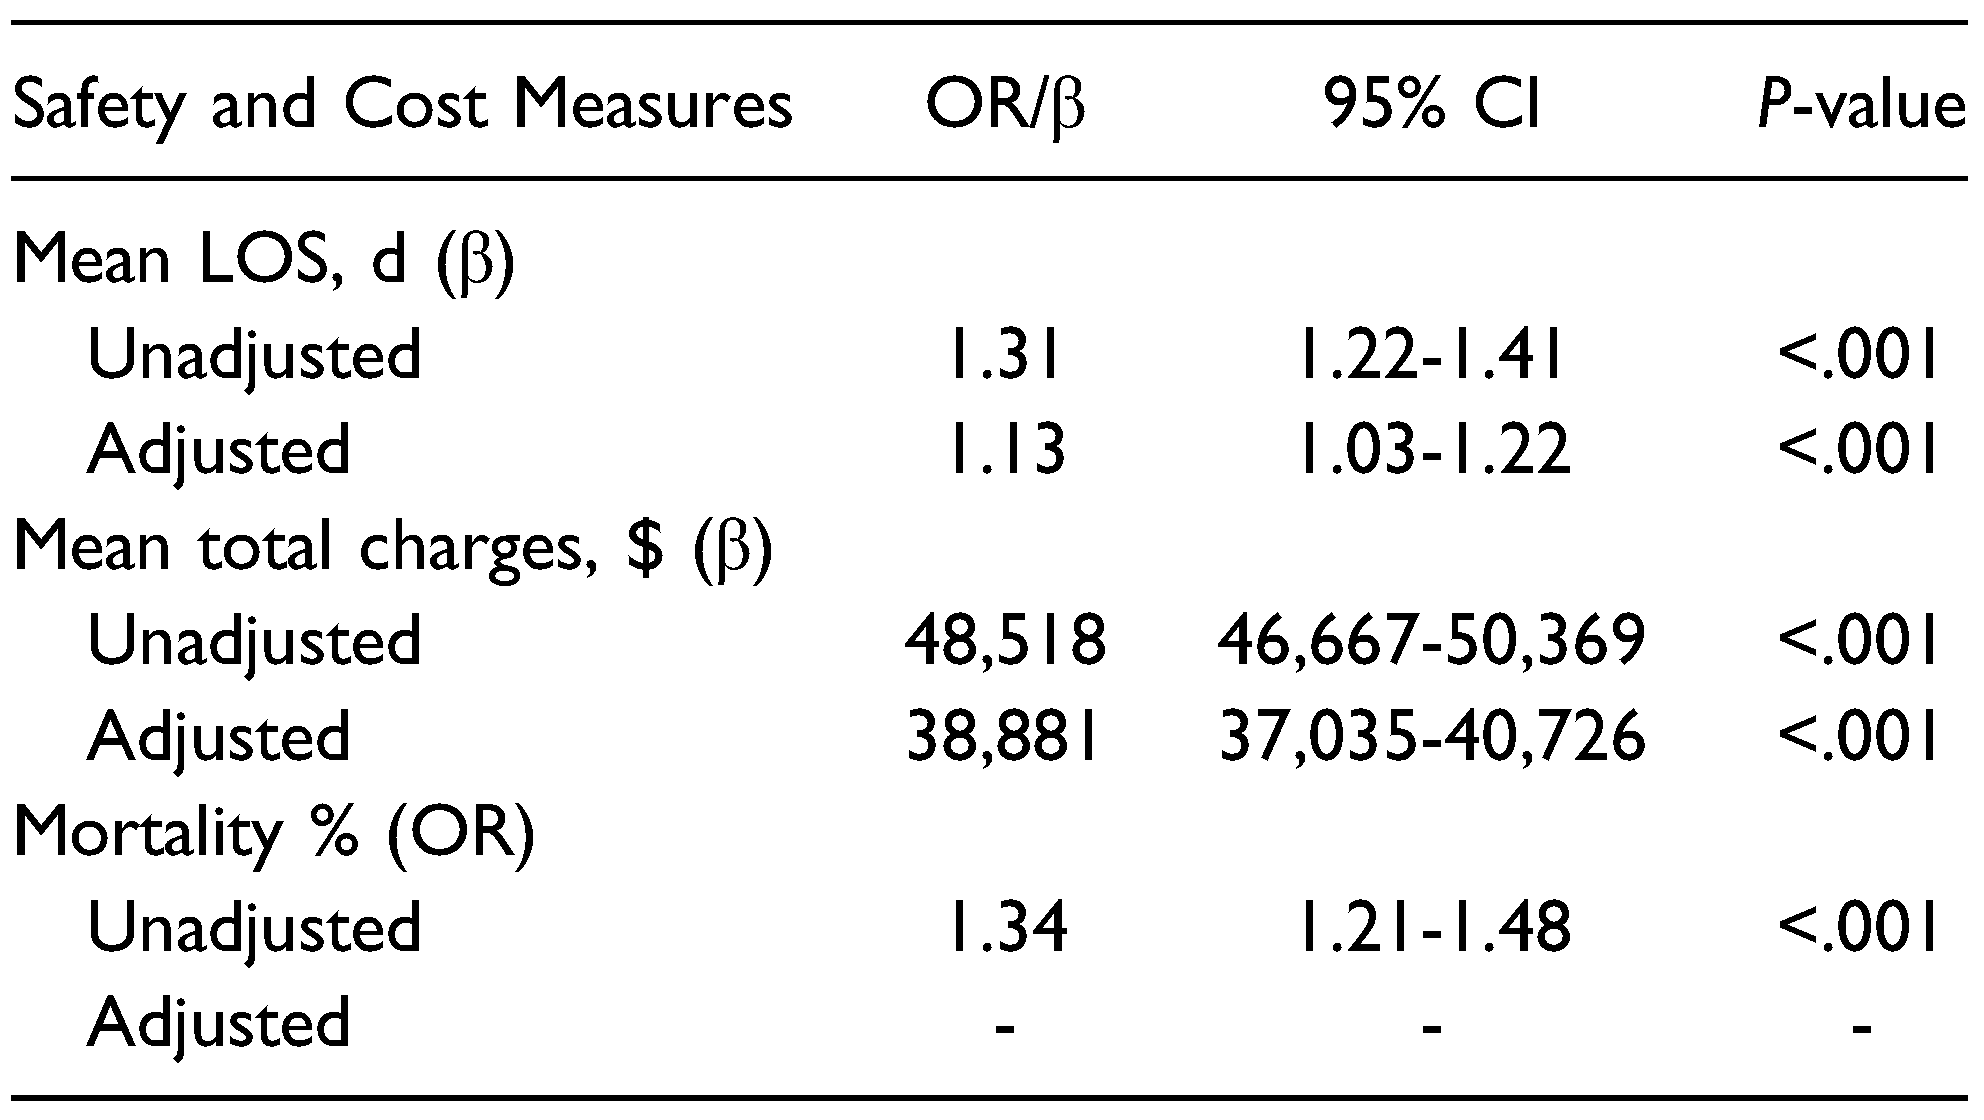
Inpatient Safety and Cost Measures
Discussion
Conclusion
Supplementary Materials
Funding
Institutional Review Board Statement
Conflicts of Interest
References
- Imahara, S.D.; Hopper, R.A.; Wang, J.; Rivara, F.P.; Klein, M.B. Patterns and Outcomes of Pediatric Facial Fractures in the United States: A Survey of the National Trauma Data Bank. J. Am. Coll. Surg. 2008, 207, 710–716. [Google Scholar] [CrossRef] [PubMed]
- Shayyab, M.; Alsoleihat, F.; Ryalat, S.; Khraisat, A. Trends in the pattern of facial fractures in different countries of the world. Int J Morphol. 2012, 30, 745–756. [Google Scholar] [CrossRef]
- Boffano, P.; Roccia, F.; Zavattero, E.; Dediol, E.; Uglešić, V.; Kovačič, Ž.; Vesnaver, A.; Konstantinović, V.S.; Petrović, M.; Stephens, J.; et al. European Maxillofacial Trauma (EURMAT) project: A multicentre and prospective study. J. Cranio-Maxillofacial Surg. 2015, 43, 62–70. [Google Scholar] [CrossRef] [PubMed]
- Allareddy, V.; Nalliah, R.P. Epidemiology of Facial Fracture Injuries. J. Oral Maxillofac. Surg. 2011, 69, 2613–2618. [Google Scholar] [CrossRef] [PubMed]
- VandeGriend, Z.P.; Hashemi, A.; Shkoukani, M. Changing Trends in Adult Facial Trauma Epidemiology. J. Craniofacial Surg. 2015, 26, 108–112. [Google Scholar] [CrossRef] [PubMed]
- Roccia, F.; Sotong, J.; Savoini, M.; Ramieri, G.; Zavattero, E. Maxillofacial Injuries Due to Traffic Accidents. J. Craniofacial Surg. 2019, 30, e288–e293. [Google Scholar] [CrossRef] [PubMed]
- Choi, S.H.; Gu, J.H.; Kang, D.H. Analysis of Traffic Accident-Related Facial Trauma. J. Craniofacial Surg. 2016, 27, 1682–1685. [Google Scholar] [CrossRef] [PubMed]
- Shaer, M. Why are American drivers so deadly? The New York Times. Available online: https://www.nytimes.com/2024/01/10/maga-zine/dangerous-driving.
- Yellman, M.A.; Sauber-Schatz, E.K. Motor Vehicle Crash Deaths — United States and 28 Other High-Income Countries, 2015 and 2019. Mmwr-Morbidity Mortal. Wkly. Rep. 2022, 71, 837–843. [Google Scholar] [CrossRef] [PubMed]
- Transportation USD of. Our Nation’s Roadway Safety Crisis. ArcGIS StoryMaps. 2023. Available online: https://storymaps.arcgis.
- Injuries and Violence Are Leading Causes of Death | Injury Center. CDC. 2023. Available online: https://www.cdc.gov/injury/wisqars/ animat-ed-leading-causes.html.
- Romeo, I.; Roccia, F.; Aladelusi, T.F.; Rae, E.; Laverick, S.; Ganasouli, D.; Zanakis, S.N.; Gorla, L.F.d.O.; Pereira-Filho, V.A.; Gallafassi, D.D.; et al. A Multicentric Prospective Study on Maxillofacial Trauma Due to Road Traffic Accidents: The World Oral and Maxillofacial Trauma Project. J. Craniofacial Surg. 2022, 33, 1057–1062. [Google Scholar] [CrossRef] [PubMed]
- Stacey, D.H.; Doyle, J.F.; Gutowski, K.A. Safety Device Use Affects the Incidence Patterns of Facial Trauma in Motor Vehicle Collisions: An Analysis of the National Trauma Database from 2000 to 2004. Plast. Reconstr. Surg. 2008, 121, 2057–2064. [Google Scholar] [CrossRef] [PubMed]
- Agency for Healthcare Research and Quality. HCUP-US NIS Overview. HCUP-US NIS Overview. 2023. Available online: https://hcup-us.ahrq.gov/nisoverview.jsp.
- Chuang, K.-T.; Chu, Y.-Y.; Chen, C.-T.; Liao, H.T. Facial Fracture Patterns and Severity of Associated Injuries After Motorcycle Accidents. Ann. Plast. Surg. 2023, 90, S26–S31. [Google Scholar] [CrossRef]
- Irgebay, Z.B.; Kahan, E.H.B.; Park, K.E.; Choi, J.; Zellner, E.G. Characteristics and Patterns of Facial Fractures in the Elderly Population in the United States Based on Trauma Quality Improvement Project Data. J. Craniofacial Surg. 2022, 33, 1294–1298. [Google Scholar] [CrossRef] [PubMed]
- Hyman, D.A.; Saha, S.; Nayar, H.S.; Doyle, J.F.; Agarwal, S.K.; Chaiet, S.R. Patterns of Facial Fractures and Protective Device Use in Motor Vehicle Collisions From 2007 to 2012. JAMA Facial Plast. Surg. 2016, 18, 455–461. [Google Scholar] [CrossRef] [PubMed]
- Su, P.; Paquet, C.; O'Dell, K.; Reinstadler, D.; Kokot, N.; Granzow, J.; Chambers, T.N.; Kochhar, A. Trends in Operative Complex Middle and Upper Maxillofacial Trauma: A 17-Year Study. Laryngoscope 2021, 131, 1985–1989. [Google Scholar] [CrossRef] [PubMed]
- World Health Organization. Global status report on road safety. 2018. Available online: https://www.who.int/publications-detail-redi-rect/9789241565684.
- McKenzie, B. Who Drives to Work? Commuting by Auto-mobile in the United States: 2013. Census.gov. 2023. Available online: https:// www.census.gov/library/publications/2015/acs/acs-32.html.
- Burrows, M.; Burd, C.; McKenzie, B. Commuting by Public Transportation in the United States; 2019.
- Stanbouly, D.; Kocaelli, H.; Arce, K.; Selvi, F. Risk factors for increased length of hospital stay among young pediatric patients who suffer facial fractures. Dent. Traumatol. 2022, 38, 457–465. [Google Scholar] [CrossRef] [PubMed]

© 2024 by the author. The Author(s) 2024.
Share and Cite
Wang, C.Y.; Kwon, D.Y.; Oleru, O.; Seyidova, N.; Shamamian, P.E.; Montalmant, K.E.; Sarosi, A.; Taub, P.J. The Burden of Road Traffic Accidents on Facial Fractures: National Trends, Injury Patterns, and Disparities in 154,185 Patients. Craniomaxillofac. Trauma Reconstr. 2024, 17, 49. https://doi.org/10.1177/19433875241272440
Wang CY, Kwon DY, Oleru O, Seyidova N, Shamamian PE, Montalmant KE, Sarosi A, Taub PJ. The Burden of Road Traffic Accidents on Facial Fractures: National Trends, Injury Patterns, and Disparities in 154,185 Patients. Craniomaxillofacial Trauma & Reconstruction. 2024; 17(4):49. https://doi.org/10.1177/19433875241272440
Chicago/Turabian StyleWang, Carol Y., Daniel Y. Kwon, Olachi Oleru, Nargiz Seyidova, Peter E. Shamamian, Keisha E. Montalmant, Alex Sarosi, and Peter J. Taub. 2024. "The Burden of Road Traffic Accidents on Facial Fractures: National Trends, Injury Patterns, and Disparities in 154,185 Patients" Craniomaxillofacial Trauma & Reconstruction 17, no. 4: 49. https://doi.org/10.1177/19433875241272440
APA StyleWang, C. Y., Kwon, D. Y., Oleru, O., Seyidova, N., Shamamian, P. E., Montalmant, K. E., Sarosi, A., & Taub, P. J. (2024). The Burden of Road Traffic Accidents on Facial Fractures: National Trends, Injury Patterns, and Disparities in 154,185 Patients. Craniomaxillofacial Trauma & Reconstruction, 17(4), 49. https://doi.org/10.1177/19433875241272440