


Abstract
To determine whether differences exist in the longitudinal arch angle based on sex or extremity, the longitudinal arch angle was assessed in 21 men and 21 women using a digital image of the medial aspect of each subject’s feet. The image was obtained with the subject in relaxed standing posture and in maximum internal rotation of the lower leg. To determine whether the longitudinal arch angle could be used to predict dynamic foot posture during walking, 50 different subjects were asked to walk across a 6-m walkway while the medial aspect of each foot was videotaped. The longitudinal arch angle was digitized from digital images obtained at midstance for three walking trials. No differences in the longitudinal arch angle were found based on sex or extremity. The longitudinal arch angles obtained in the static positions of relaxed standing posture and maximum internal rotation were highly predictive of dynamic foot posture at midstance during walking. Relaxed standing posture and maximum internal rotation significantly contributed to explaining more than 90% of the variance associated with the longitudinal arch angle position at midstance during walking. These results validate use of the longitudinal arch angle as part of the foot and ankle physical examination.
The use of static foot measurements to predict dynamic foot posture can assist the clinician in understanding how static foot posture and mechanics change during activity. If a static foot measurement was shown to be predictive of foot motion or position during activity, then the foot measurement could be incorporated into the examination scheme. Use of the static measure could enhance the evaluation procedures used to determine an appropriate method for the fabrication of foot orthoses. A critical requirement for any static measurement, however, is a high degree of intrarater and interrater reliability. [1]
Previous attempts to assess the ability of static measurements to predict dynamic foot posture have not been successful. Hamill et al [2] studied knee and rearfoot motion in 24 subjects who walked barefoot over ground. They also performed a lower-extremity examination that included 16 static measurements using protocols described by Root et al. [3] They concluded that none of the static examination measurements could predict rearfoot motion during walking. A weakness of the study by Hamill et al [2] was that 4 of the 16 static measurements—subtalar joint pronation, ankle dorsiflexion, ankle plantarflexion, and tibiocalcaneal angle—had to be excluded because of poor intrarater reliability. This aspect of the study leads one to question whether the same predictive results would have been obtained had all static measurements been included in the analysis of the results. The fact that several of the foot measurements obtained in the study by Hamill et al demonstrated poor reliability is not surprising considering that several previous investigations [1,4,5] have reported poor reliability when assessing the static measurements described by Root et al. [3] McPoil and Cornwall [6] used a similar grouping of static foot and lower alignment measurements in an attempt to predict the posture of the rearfoot at the point of maximum pronation in 27 subjects during walking. The 17 static measurements included hip joint range of motion, malleolar torsion, subtalar joint neutral position, passive mobility of the rearfoot, forefoot-to-rearfoot alignment, neutral calcaneal stance position, relaxed calcaneal stance position, difference in navicular height, and leg-length difference. One clinician performed all of the measurements, and a high level of intrarater reliability was obtained. The results of a multiple regression analysis indicated that only one static measurement, difference in navicular height, could be used to predict the posture of the rearfoot at the point of maximum pronation. The difference in navicular height, however, could explain less than 20% of the rearfoot position at the point of maximum pronation. McPoil and Cornwall [6] concurred with the previous findings from Hamill et al [2] by concluding that static measurements of the lower extremity and foot are poor predictors of rearfoot posture during dynamic movement.
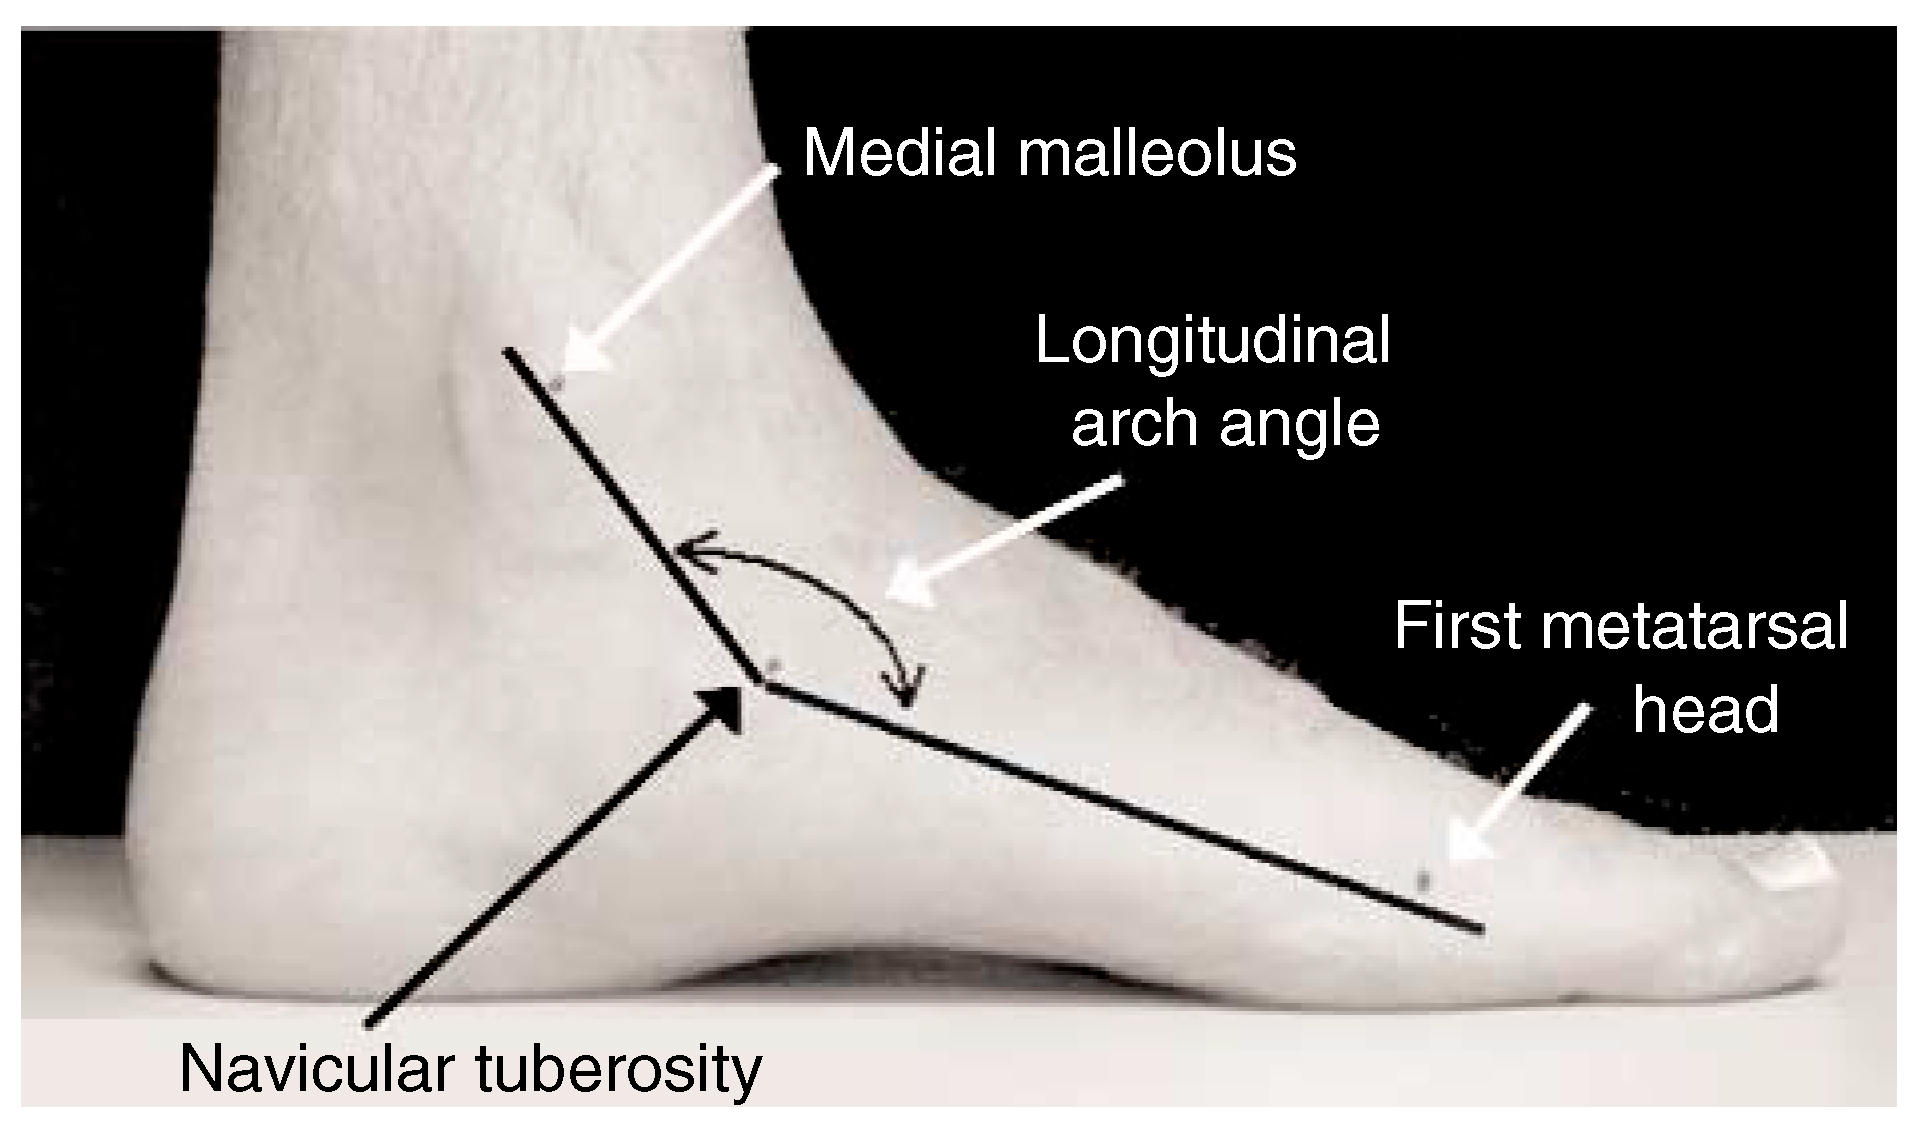
The longitudinal arch angle (LAA) was first reported by Dahle et al. [7] The LAA is based on Feiss’ line, which was proposed as a technique to assist clinicians in assessing the static foot posture of the medial longitudinal arch. The LAA is operationally defined as the angle formed by two vectors—one passing through the midpoint of the medial malleolus to the navicular tuberosity and the other passing through the midpoint of the medial aspect of the first metatarsal head to the navicular tuberosity (Fig. 1). Thus the apex of the LAA is the navicular tuberosity. Dahle et al used the LAA to perform a visual subjective assessment of medial longitudinal arch posture in 77 subjects. In their study, subjects visually observed to have an LAA equal to 90° were classified as having low arches, whereas individuals with an LAA equal to 180° were considered to have high arches. Subjects with an LAA between 120° and 150° were classified as having normal arches. Although Dahle et al did not attempt to objectively measure the LAA, they did report a substantial degree of intrarater reliability using the LAA.
Figure 1.
Illustration of the longitudinal arch angle.
Sommer and Vallentyne [8] attempted to use the LAA to determine retrospectively the development of medial tibial stress syndrome in 25 folk dancers. They objectively measured the LAA in 14 dancers with a history of medial tibial stress syndrome and in 36 symptom-free feet. They concluded that an LAA of 140° was an accurate threshold for determining risk of medial tibial stress syndrome. Although these authors reported that the mean LAA was 137° for the injured group and 145° for the symptom-free group, they did not provide any further descriptive statistics that would permit an assessment of the variability of the LAA measurement.
Jonson and Gross [9] assessed the LAA in 63 healthy navy recruits as part of a study that assessed intrarater and interrater reliability of lower-extremity and foot skeletal measurements. They reported that the mean ± SD LAA for this group was 141.6° ± 7.67°. The range of the LAA for this group of subjects was 122° to 160°. Unlike previous static measurements of the foot, they found that the LAA was a highly reliable measure, with an intrarater reliability of 0.90 and an interrater reliability, established using two examiners, of 0.81. Although the level of interrater reliability reported by Jonson and Gross is quite high, they did not clarify whether the two raters individually identified the required bony landmarks.
On the basis of the results of these previous investigations, the LAA would seem to be a consistent measure of the bony architecture of the medial longitudinal arch and might have some predictive value in determining lower-extremity injuries. Unfortunately, these studies did not address whether there is a statistically significant difference in the LAA between left and right feet or between females and males. Furthermore, could the LAA measured during static standing be similar to the LAA determined dynamically at a specific point in the walking cycle, such as midstance? The ability of the LAA to predict dynamic foot posture at midstance would be extremely valuable because recent studies [10,11] that assessed the pattern of rearfoot and midfoot motion during walking have indicated that the maximum degree of foot pronation occurs between 50% and 55% of the stance phase. Thus the purpose of this study was twofold. The first phase of the study sought to determine whether differences in the LAA exist between females and males as well as between left and right feet. The second phase sought to determine whether the LAA, assessed in static standing, could be used to predict the LAA measured at midstance during walking.
Methods
Subject Characteristics
For the first phase of the study, 42 healthy subjects (21 men and 21 women) voluntarily consented to participate. The mean age of the subjects was 33.8 years (range, 22–63 years). For the second phase of the study, a different group of 50 healthy subjects (17 men and 33 women) voluntarily consented to participate. The mean age of the second group of subjects was 26.3 years (range, 21–38 years).
None of the subjects selected for either phase of the study had any history of lower-extremity trauma or injury within 6 months before data collection or any traumatic or congenital deformities of either lower extremity. The Northern Arizona University human subjects review board approved the protocols for both phases of the study, and each subject signed an informed consent form before participation. All subjects were informed that they could withdraw from the study at any time.
Procedures
In the first phase of the study, each subject was asked to stand on an elevated platform, and the midpoint of the medial malleolus, the tuberosity of the navicular bone, and the midpoint of the medial aspect of the first metatarsal head were identified by palpation and were marked on each foot. The subject was instructed to place the feet 6 inches apart and to position the foot not being photographed posteriorly so that it did not obstruct the view of the foot being recorded. The subject was then instructed to stand relaxed and to place equal weight on both feet so that a digital image could be obtained of the medial aspect of the foot. The procedure was then repeated for the other foot.
The digital camera used to capture the image (model D-340L; Olympus America, Melville, New York) was positioned 0.65 m from the medial aspect of the foot being recorded. The subject was constantly observed during the 2 to 3 sec that was required to obtain the digital image to ensure that the relaxed standing posture and equal weightbearing posture were maintained. A 1,280 × 960-pixel image for each foot was stored on magnetic film for future analysis.
In the second phase of the study, each subject was asked to stand in the middle of a 6-m walkway using the same foot placement and procedure described in the previous paragraph except that the medial aspect of the foot was recorded using a video camera rather than a digital camera. The video camera used to capture the image (model B4-400; Panasonic Corp, Cypress, California) was connected to a super VHS videocassette recorder (model AG-1960, Panasonic Corp). Video images from the camera were recorded at 60 fields per second, with a shutter speed of 1/250 sec. The camera was calibrated using a known linear distance in the field of view to correct for any lens aberrations that might affect the linear measurements. The video camera was positioned 2 m from the midpoint of the 6-m walkway, with the lens perpendicular to the midline. As in phase 1, the subject was constantly observed during the 2 sec that was required to obtain the video image to ensure that the posture and the equal weight on both feet were maintained. Next, the subject was asked to internally rotate the right lower leg and to place as much weight as possible on the foot to cause pronation of the right foot without lifting the left foot off the ground. The subject was again observed during the 2 sec that was required to obtain the video image to ensure that the pronated position of the right foot was maintained. Once completed, the procedure was repeated for the left foot. The subjects were then instructed to practice walking barefoot at a self-selected speed along the 6-m walkway for several minutes. Walking speed was monitored using two infrared photocells (Tandy Corp, Fort Worth, Texas) positioned 4 m apart and connected to a digital timer (model 54030; Lafayette Instrument Co, Lafayette, Indiana). When betweentrial walking speed was consistent (variation of <5% between trials), the subject was asked to walk barefoot over the walkway three times while video images of the medial aspect of each foot were recorded (six trials total).
Before the start of data collection in either phase of the study, 12 volunteers were randomly selected so that two experienced raters could assess the intrarater and interrater reliability of the LAA measurement. To ensure that the raters would not be biased by permanent marking of bony landmarks, removable paper markers were used, and all measurements were recorded by a third clinician. After each rater identified and positioned the paper markers on each bony landmark, the rater positioned the subject’s feet using the same procedure previously described and recorded digital images of the medial aspect of each foot.
Data Analysis
The digital images obtained from phase 1 as well as for the reliability assessment were downloaded to a computer and printed so that the LAA could be measured and recorded. A video copy processor (model P71U; Mitsubishi, Cypress, California) was used to print the static and dynamic video images obtained in the second phase of the study. Three dynamic video images were obtained for both feet at midstance in the walking cycle. Midstance was determined by first calculating the number of video frames for the entire stance phase, beginning with heel contact and ending with toe-off, and then calculating the midpoint frame. The selection of midstance as the dynamic LAA position for comparison with the static LAA measurements was based on previous kinematic studies of rearfoot and midfoot motion. These studies [10,11] have shown that maximum rearfoot and midfoot pronation occurs at or just after midstance during walking. Once all of the digital and video images were obtained, the LAA was measured and recorded for each image using a digitizing tablet (model 34120; GTCO CalComp Inc, Columbia, Maryland). All LAA measurements were repeated three times for each image to determine intrarater reliability.
Statistical Analysis
In addition to descriptive statistics, type (3,1) intraclass correlation coefficients (ICCs) [12] and the SEM were used to determine the level of intrarater and interrater reliability of the LAA measurement. [13] A type (3,1) ICC was chosen rather than a type (2,1) ICC because the observations were not expected to be random. [12] The SEM is a number in the same units as that of the original measurement and represents the way a single score will vary if the LAA is measured more than once. As the SEM decreases relative to its mean value, the measurement becomes more reliable. [13] For this study, the measurement was considered to be reliable if its SEM was less than 5% of the mean value. The level of reliability for the ICCs was classified using the characterizations reported by Landis and Koch [14]: slight, the coefficient ranged from 0 to 0.20; fair, 0.21 to 0.40; moderate, 0.41 to 0.60; substantial, 0.61 to 0.80; and almost perfect, 0.81 to 1.00.
To assess the data from phase 1, t-tests were used to determine differences in the LAA based on sex and extremity. To assess the data from phase 2, a type (2,1) ICC was first calculated to determine the reliability of the stance phase duration for the three trials of the dynamic LAA measurements. This ensured that the walking speeds used by each subject for the three walking trials for each foot were consistent. Pearson product moment correlation coefficients were then used to determine the ability of static LAA measurements obtained in relaxed standing and maximum internal rotation to predict the dynamic LAA at midstance during walking. Because of the relatively large number of t-tests performed in this study, α = .01 was used for all tests of statistical significance, thus reducing the probability of committing a type II error.
Results
The mean ± SD LAA for the 12 subjects used to assess measurement reliability was 145.0° ± 6.3°. The SEM for both raters on the subject subset was 1.3°. The ICC values for intrarater reliability of the LAA were 0.95 for rater 1 and 0.96 for rater 2. The ICC for interrater reliability of the LAA was 0.67.
For the 42 subjects assessed in phase 1 of the study, the mean ± SD LAA was 139.9° ± 7.4°. The SEM was 0.8°. The mean ± SD LAA was 139.2° ± 7.8° for the left foot and 141.5° ± 6.7° for the right foot. The mean ± SD LAA was 138.6° ± 7.3° for the men and 141.1° ± 7.3° for the women. On the basis of the t-test results, no significant differences were found between left and right feet (P = .06) or between men and women (P = .13).
For the 50 subjects assessed in phase 2 of the study, the mean ± SD values for the static LAA obtained in relaxed posture and maximum internal rotation and for the dynamic LAA measured at midstance are listed in Table 1. The ICC for reliability of the dynamic LAA obtained from the three trials collected on each foot at midstance was 0.97. The Pearson product moment correlation coefficient for the static LAA measured in a relaxed standing posture in relation to the dynamic LAA measured at midstance was r = .97 (r2 = .94). The Pearson product moment correlation coefficient for the static LAA measured in maximum internal rotation in relation to the dynamic LAA measured at midstance was r = .95 (r2 = .91).
Table 1.
Longitudinal Arch Angle Data for Relaxed Standing Posture, for Maximum Internal Rotation in Standing, and at Midstance During Walking in 100 Feet.

Discussion
Our first concern in interpreting the results of this study was intrarater and interrater reliability of the LAA measurement. As previously noted, an essential requirement for any foot measurement is a high degree of consistency not only for an individual clinician but also between different clinicians so that they can compare their findings. The characterizations of the LAA measurement were “almost perfect” for the intrarater ICC values and “substantial” for the interrater ICC values on the basis of the criteria established by Landis and Koch. [14] The SEM was 1.3° for both raters, which was less than 1% of the mean score. Because the mean LAA for the 12 subjects in the reliability component of the study was 145.0°, and knowing that the SEM was 1.3°, the true measurement of the LAA would be between 142.5° and 147.5°.
The interrater ICC reported by Jonson and Gross [9] (0.81) is higher than the ICC reported in the present study (0.67), although both values would be classified as at least “substantial” using the ICC classification system proposed by Landis and Koch. [14] As noted at the beginning of this article, it is unclear from the study by Jonson and Gross whether the raters marked their own bony landmarks independently or whether both raters used the same identified bony landmarks. In the present study, each rater was required to identify each bony landmark using removable paper markers, which could explain the lower ICC values obtained. The fact that the SEM for each rater in the reliability component of the study was less than 1% would indicate that the degree of error associated with the LAA is extremely low. On the basis of the intrarater and interrater ICC and SEM values obtained in this initial portion of the study, we concluded that the reliability of the LAA was acceptable and that further analyses of the data from phase 1 and phase 2 could occur.
The purpose of the study was twofold. In the first phase of the study, we sought to determine whether differences exist in the LAA between females and males as well as between left and right feet. The results of two separate t-tests to determine whether the LAA was different between males and females and between left and right feet were not significant. On the basis of these results, the data were pooled so that phase 1 included 84 feet and phase 2 included 100 feet.
The purpose of the second phase of the study was to determine whether the LAA assessed in static standing could be used to predict the LAA measured at midstance during walking. The Pearson product moment correlation coefficients indicate that the static LAA measurement obtained in either relaxed standing posture or maximum internal rotation could explain more than 90% of the variance associated with the LAA measured at the instant of or just after midstance during walking. Several previously published studies [10,11] that have assessed the movement of the rearfoot and midfoot during walking have shown that maximum rearfoot and midfoot pronation occur at or immediately after midstance during walking. Because of the ease in obtaining the static digital image in relaxed standing posture, we recommend the use of relaxed standing posture and not maximum internal rotation when incorporating the LAA measure into the examination scheme.
On the basis of these results, the static measurement of the LAA, whether obtained in relaxed standing posture or maximum internal rotation, is highly predictive of the dynamic posture of the foot that occurs at midstance during walking. These results validate the use of the LAA as a component of the physical examination of the foot and ankle.
Sommer and Vallentyne [8] reported a mean LAA of 145° collected from both feet of 25 subjects (n = 50 feet). Jonson and Gross [9] reported mean LAA values of 141.6° for males (n = 57) and 146.5° for females (n = 6), with a range of 122° to 160°. In our study, the mean LAA for the phase 1 group (n = 84 feet) was 139.9° (range, 124° to 157°), and the mean LAA for the phase 2 group (n = 100 feet) was 139.4° (range, 114° to 165°). If the subjects from both phase 1 and phase 2 are combined (n = 184 feet), the mean ± SD LAA is 139.8° ± 10.5° (SEM, 0.8°). Thus, in addition to having a substantial level of reliability and being highly predictive of dynamic foot posture, the LAA seems to be a consistent measurement even when obtained from different heterogeneous groups of subjects.
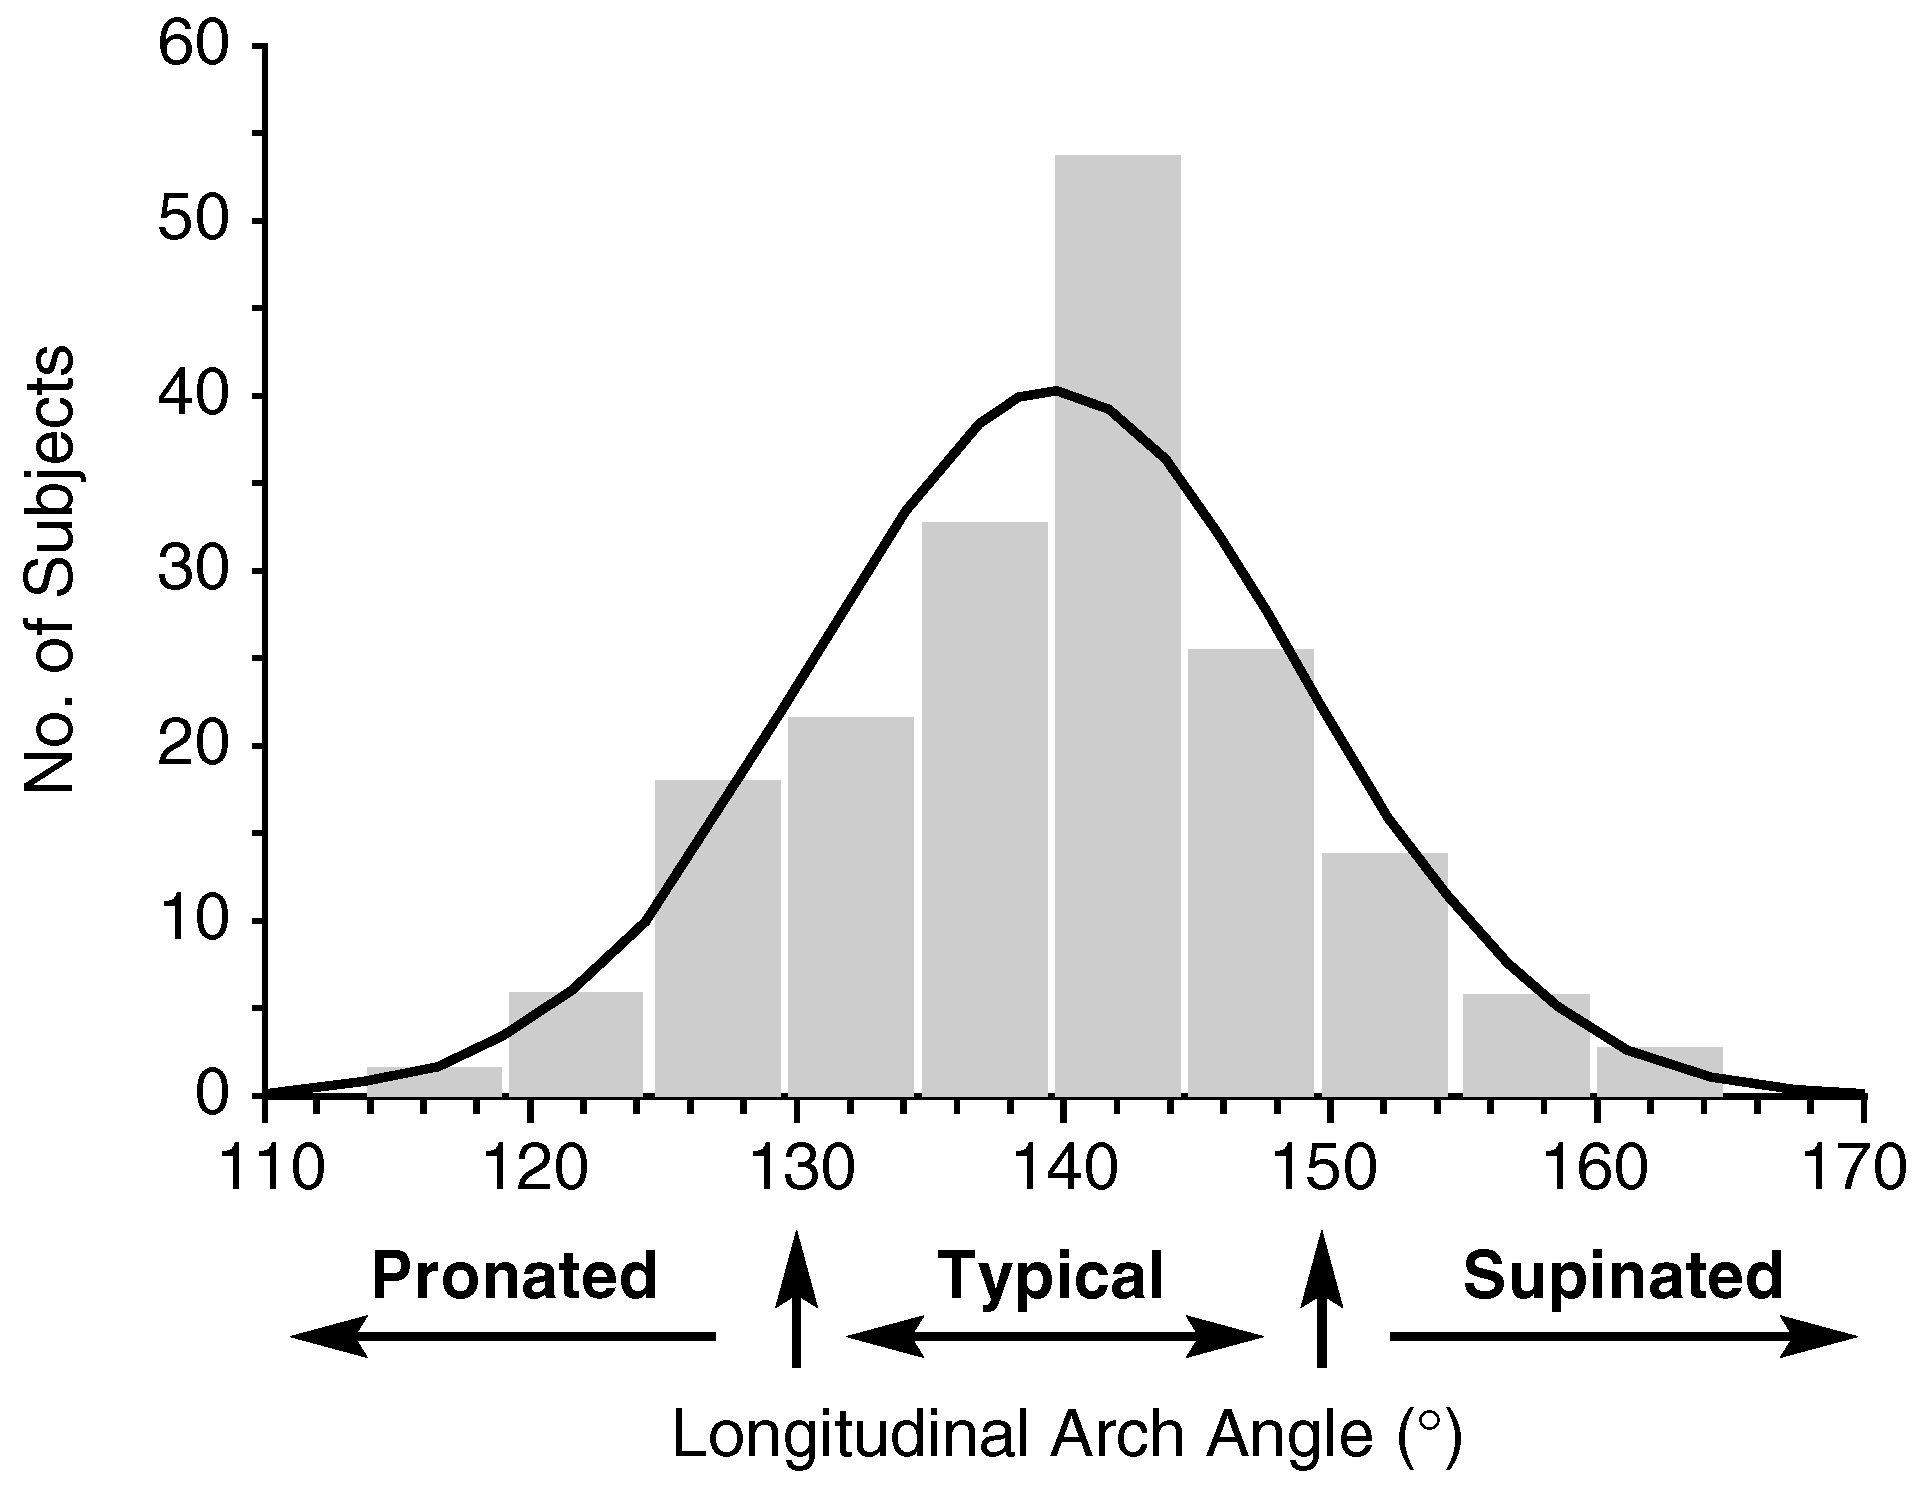
For the purpose of using the LAA as a method of classifying foot structure, we suggest the classification scheme proposed by Jonson and Gross, [9] which was based on mean and SD values from a combined subject pool. A foot would be classified as having a typical foot structure if its LAA was within ±1 SD of the mean. A foot would be classified as having a pronated foot structure if the LAA was less than 1 SD or as having a supinated foot structure if the LAA was greater than 1 SD from the mean. As previously noted, the mean ± SD LAA for the combined subject pool of 184 feet was 139.8° ± 10.5°. Using the classification scheme proposed by Jonson and Gross [9] with the LAA data from our study, a typical foot structure would have an LAA between 130° and 150°. A pronated foot posture would have a mean LAA less than 130°, whereas a supinated foot posture would have an LAA greater than 150°. Using the combined subject pool of 184 feet, 128 feet would have a typical foot posture, 29 would be classified as pronated, and 27 would be classified as supinated (Fig. 2). An LAA of 140°, cited by Sommer and Vallentyne [8] in their study as the threshold for the development of medial tibial stress syndrome, would fall within the LAA values defined for the typical foot structure group in our study. The fact that the study conducted by Sommer and Vallentyne [8] was retrospective and that only 14 of the 50 subjects in their study had medial tibial stress syndrome could account for this discrepancy. Future studies should be designed not only to assess the ability of the LAA to predict injury but also to determine specific LAA threshold values for various injuries.
Figure 2.
Histogram showing the distribution of typical, pronated, and supinated foot-type classifications based on the longitudinal arch angle.
A concern with any study that attempts to quantify foot motion or posture during a dynamic activity such as walking is movement of the skin that could displace the skin-mounted markers being used to define the bony landmarks. The excessive movement of the skin-mounted markers in relation to the actual underlying bone movement, termed “skin movement artifact,” could be a major source of error in determining the actual movement of the bones during dynamic activity. In our study, although the typical type of reflective skin marker system was not used, three bony landmarks on the foot were identified by palpation, and the skin above those landmarks was marked using a black felt-tip pen: the medial malleolus, the tuberosity of the navicular bone, and the midpoint of the medial aspect of the first metatarsal head. Tranberg and Karlsson [15] assessed the magnitude of displacement between skin-mounted markers and the underlying bony structures of the foot using two-dimensional roentgen photogrammetry, with the ankle joint positioned in neutral, 20° of dorsiflexion, and 30° of plantarflexion. In relation to the underlying bones, skin markers placed over the medial malleolus and navicular tuberosity were found to move up to 4.3 mm, whereas more distally positioned markers, such as those positioned over the medial aspect of the first metatarsal head, moved a maximum of only 1.8 mm. Skin marker movement, in relation to the underlying bones, was maximal at the end ranges of ankle dorsiflexion and plantarflexion and minimal when the ankle was positioned at or near neutral. In our study, the dynamic LAA was measured when the foot was at or just after midstance during walking. The position of the ankle joint at or near midstance is on average 5° of ankle dorsiflexion or less. Although the study by Tranberg and Karlsson [15] illustrates that the amount of foot bone movement recorded using video-based motion-analysis systems could be significantly exaggerated as a result of skin movement, their study serves to validate the dynamic LAA values measured in the present study because they report minimal skin movement over underlying bony landmarks at or near ankle joint neutral.
Conclusion
It is critical for the clinician to use tests and measures in the physical examination of the foot and ankle that not only demonstrate intrarater and interrater reliability but also are predictive of foot posture during dynamic activities, such as walking. This study focused on use of the LAA as a component of the foot and ankle physical examination. The initial purpose of this study was to determine whether differences in the LAA exist between men and women or between extremities. Once it was determined that such differences did not exist, the focus of the study became to determine whether the LAA assessed in static standing could be used to predict the LAA measured at midstance during walking. The results indicate that the static measurement of the LAA, whether obtained in relaxed standing posture or maximum internal rotation, is highly predictive of the dynamic posture of the foot that occurs at midstance during walking. On the basis of the results of this study, the LAA should be included as a component of the foot and ankle physical examination and can be used as a method of classifying foot structure.
References
- VAN GHELUWE, B.; KIRBY, K.A.; ROOSEN, P. ET AL: Reliability and accuracy of biomechanical measurements of the lower extremities. JAPMA 2002, 92, 317. [Google Scholar] [CrossRef] [Scilit] [PubMed]
- HAMILL, J.; BATES, B.T.; KNUTZEN, K.M.; et al. Relationship between selected static and dynamic lower extremity measures. Clin Biomech 1989, 4, 217. [Google Scholar] [CrossRef] [Scilit]
- ROOT, M.L.; ORIEN, W.P.; WEED, J.H. ET AL: Biomechanical Evaluation of the Foot,; Clinical Biomechanics Corp: Los Angeles, 1971; Vol 1, p. 175. [Google Scholar]
- ELVERU, R.A.; ROTHSTEIN, J.M.; LAMB, R.L. Goniometric reliability in a clinical setting: subtalar and ankle joint measurements. Phys Ther 1988, 68, 672. [Google Scholar] [CrossRef] [Scilit] [PubMed]
- SMITH-ORICCHIO, K.; HARRIS, B.A. Interrater reliability of subtalar neutral, calcaneal inversion and eversion. J Orthop Sports Phys Ther 1990, 12, 10. [Google Scholar] [CrossRef] [Scilit] [PubMed]
- MCPOIL, T.G.; CORNWALL, M.W. The relationship between static lower extremity measurements and rearfoot motion during walking. J Orthop Sports Phys Ther 1996, 24, 309. [Google Scholar] [CrossRef] [Scilit] [PubMed]
- DAHLE, L.K.; MUELLER, M.; DELITTO, A. ET AL: Visual assessment of foot type and relationship of foot type to lower extremity injury. J Orthop Sports Phys Ther 1991, 14, 70. [Google Scholar] [CrossRef] [Scilit] [PubMed]
- SOMMER, H.M.; VALLENTYNE, S.W. Effect of foot posture on the incidence of medial tibial stress syndrome. Med Sci Sports Exerc 1995, 27, 800. [Google Scholar] [CrossRef] [Scilit] [PubMed]
- JONSON, S.R.; GROSS, M.T. Intraexaminer reliability, interexaminer reliability, and mean values for nine lower extremity skeletal measures in healthy naval midshipmen. J Orthop Sports Phys Ther 1997, 25, 253. [Google Scholar] [CrossRef] [Scilit] [PubMed]
- PIERRYNOWSKI, M.R.; SMITH, S.B. Rear foot inversion/eversion during gait relative to the subtalar joint neutral position. Foot Ankle Int 1996, 17, 406. [Google Scholar] [CrossRef] [Scilit] [PubMed]
- CORNWALL, M.W. MCPOIL TG: Three-dimensional movement of the foot during the stance phase of walking. JAPMA 1999, 89, 56. [Google Scholar] [CrossRef] [Scilit] [PubMed]
- SHROUT, P.E.; FLEISS, J.L. Intraclass correlations: uses in assessing rater reliability. Psychol Bull 1979, 86, 420. [Google Scholar] [CrossRef] [PubMed]
- ROTHSTEIN, R.M. Measurement and Clinical Practice: Theory and Application. In Measurement in Physical Therapy; Rothstein, R.M., Ed.; Churchill Livingstone: New York, 1985. [Google Scholar]
- LANDIS, J.R. KOCH GG: The measurement of observer agreement for categorical data. Biometrics 1977, 33, 159. [Google Scholar] [CrossRef] [Scilit] [PubMed]
- TRANBERG, R.; KARLSSON, D. The relative skin movement of the foot: a 2-D roentgen photogrammetry study. Clin Biomech 1998, 13, 71. [Google Scholar] [CrossRef] [Scilit] [PubMed]
© 2005 American Podiatric Medical Association