


Abstract
The purpose of this study was to determine the degree of symmetry for in-shoe plantar pressure and vertical force patterns between the left and right feet of healthy subjects during walking. Thirty subjects with a mean age of 29.6 years participated in the study. Each subject walked a distance of 8 m three times while in-shoe plantar pressure and vertical force data were collected. A total of 12 steps were analyzed for both feet, and maximum vertical force, peak pressure, and pressure-time integrals were calculated for four plantar regions of the foot. No differences in the three variables were noted between male and female subjects. Plantar pressure and vertical force patterns were found to be symmetrical between the left and right feet, except for two of the four plantar regions studied. Only the forefoot and rearfoot regions were found to show significant differences between the left and right feet for plantar pressure and vertical force, respectively. The degree of asymmetry for these two plantar regions in the same foot, however, was minimal.
The degree of symmetry in plantar pressure and vertical force between the left and right feet during walking has been used as a measure of the effectiveness of treatment outcomes. The efficacy of spinal manipulation, [1] surgical treatment of the ankle, [2] and knee ligamentous instability in athletes [3] have been evaluated by assessing the degree of plantar pressure or vertical force asymmetry between the left and right feet. The most common method of measuring the degree of symmetry between extremities has been by means of a force or pressure platform mounted in a specially constructed walkway.
Hasan et al [3] compared the ground-reaction force patterns for two subject groups: a group with injured and completely ruptured anterior cruciate ligaments and a separate uninjured group. Their results demonstrated significant differences between the injured and uninjured groups in the pattern of ground-reaction forces during walking and pivoting. The authors, however, failed to report the degree of symmetry between the left and right lower extremities for both the injured and uninjured subject groups.
Robinson et al [1] used measurements of ground-reaction force to quantify the effects of chiropractic manipulation on gait symmetry. Nine subjects walked across a force platform, then had spinal manipulation performed by a chiropractor, and were again asked to walk across the force platform. While the authors reported that there was a tendency toward increased gait symmetry following the manipulative treatment, they did not indicate the degree of symmetry between the left and right lower extremities for the nine subjects.
The basis for the assumption that ground-reaction force patterns are symmetrical was a result of a study conducted by Hamill et al. [4] In this study, ten healthy subjects performed ten trials for each leg while walking over a force platform. Their results indicated no statistically significant differences in ground-reaction force variables between the left and right legs during walking. In a later study, however, Herzog et al [5] reported that none of the 62 subjects assessed exhibited perfect gait symmetry during walking. They used the symmetry index (SI) to determine the degree of asymmetry for selected gait variables with the use of a force platform. Their results indicated that the mean SIs for the vertical component of the ground-reaction force deviated less than 4% from zero for all variables and that neither the left nor the right leg was used preferably by any of the subjects. The SI was originally proposed by Robinson et al [1] and is based on the following formula:
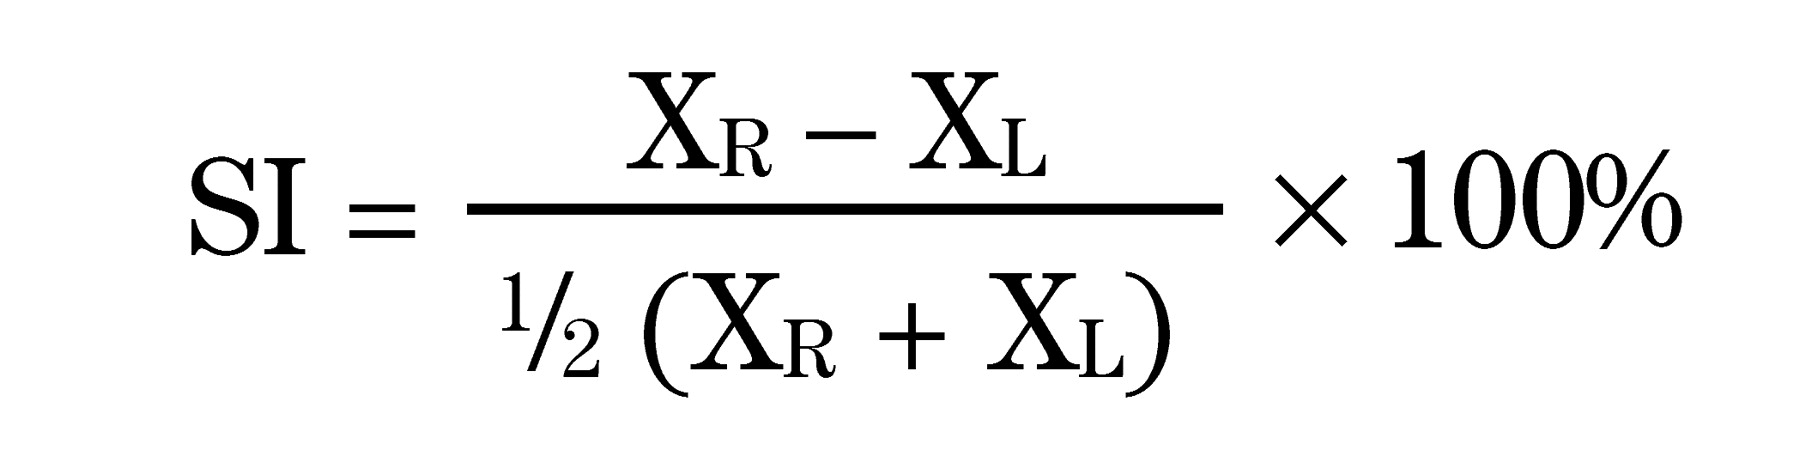
where XR is the gait variable recorded for the right leg and XL is the corresponding variable for the left leg. A value of zero for the SI would indicate that there is no difference between the variables XR and XL and that there is therefore perfect symmetry for that particular pressure or force variable.
Becker et al [2] used the SI to determine the degree of gait asymmetry in young adults who had successful surgical management of an ankle fracture. With the use of a pressure-sensor platform, the peak pressures and force-time integrals were recorded for 48 male patients treated surgically for an ankle fracture as well as for a control group of 90 males without a history of lower-extremity problems. The SI calculated for the force-time integral for the patient group ranged from –11.5% to +5.5% and did not differ significantly from that for the control group, which ranged from –6.2% to +5.6%. While the authors listed the mean peak pressure and force-time integral values for the patient group, they did not list these values for the control group.
Although previous studies have attempted to assess the degree of symmetry between the left and right extremities during walking, the use of a pressure-sensor or force platform to record plantar pressures or ground-reaction forces could contribute to the amount of asymmetry reported. Because pressure-sensor and force platforms permit the analysis of only a single foot strike with each trial, only isolated left and right steps can be analyzed. Thus, studies using this methodology do not provide insight into the ongoing step-to-step variations, which can be determined with in-shoe pressure or force measurements. In addition, when platforms are used for data collection, subjects will often “target” the platform to ensure that their foot contacts the platform surface. [6] Targeting a platform, however, can result in atypical pressure or force values.
In an attempt to overcome the problems associated with platform measurements, Zhu et al [7] used 14 discrete pressure sensors to determine the effect of walking cadence on the plantar pressures of eight subjects. They also reported the mean values for peak pressure and pressure-time integral for the left and right feet for their subjects. While this investigation did provide actual values for extremity differences in peak pressure and pressure-time integral, the number of subjects was small and discrete pressure sensors were used. The use of discrete sensors has several disadvantages, including the placement of sensors in predetermined locations, sensor migration due to shear stress at the foot-shoe interface, and the possibility of the sensor acting as a foreign body within the shoe, thus altering pressure measurements. [8] The use of a matrix of pressure sensors in the form of an insole allows for the assessment of the entire plantar surface of the foot without these drawbacks.
While the above-mentioned studies have provided some insight into the degree of symmetry that can be expected during walking, further study using matrix-designed pressure-sensor insoles would appear justified, as these systems are currently being used to determine the outcome of the gait-training portion of rehabilitation programs. An important determinant of success following a prolonged period of immobilization is the resumption of a normal walking pattern after a period of gait training. A major factor in determining whether a normal walking pattern has been achieved is the degree of symmetry between the right and left extremities. Therefore, the purpose of this study was to determine whether in-shoe plantar pressure and vertical force patterns were symmetrical between the left and right feet of healthy subjects during walking.
Materials and Methods
Subjects
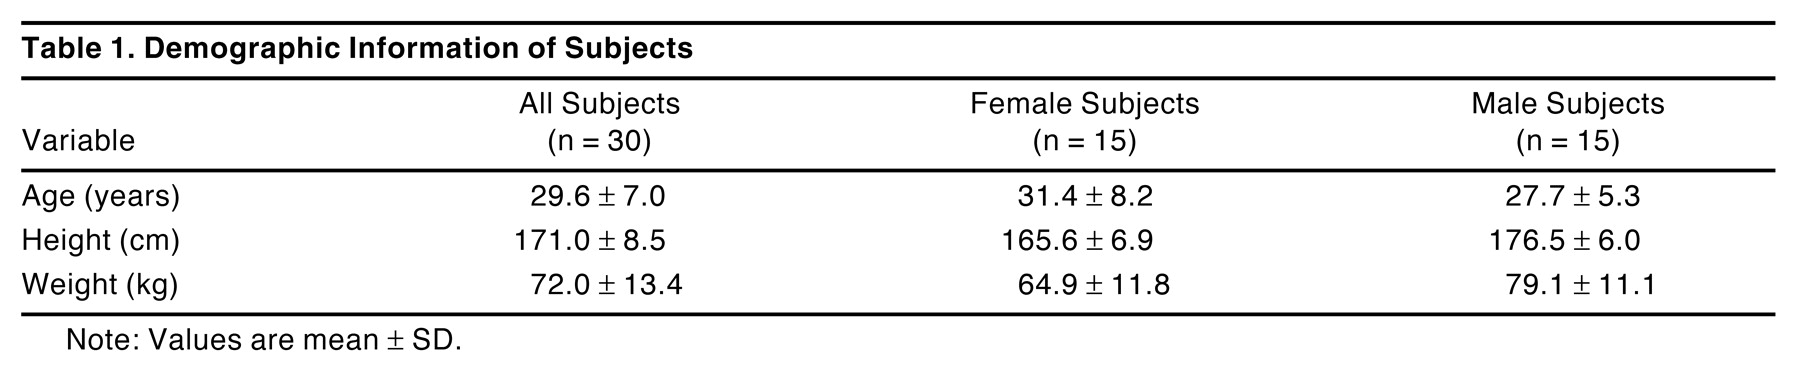
Thirty subjects, 15 men and 15 women, were selected from a group of volunteers to participate in the study. The subjects selected were between the ages of 19 and 50 years, had no history of low-back or lower-extremity trauma or injury within the 12 months preceding data collection, and had no traumatic or congenital deformities of either lower extremity. In addition, all of the volunteers underwent a physical examination of both feet prior to selection to ensure that they met the following inclusion criteria: symmetrical range of motion in the subtalar and midtarsal regions of the foot; at least 10° of talocrural joint dorsiflexion; a resting calcaneal stance position ranging from 2° inversion to 2° eversion; and at least 90° of first metatarsophalangeal joint extension. Furthermore, any volunteers determined to have a limb-length discrepancy or a forefoot deformity (varus or valgus) of greater than 3° were eliminated from the subject pool. Subject demographic information is listed in Table 1. The Northern Arizona University Institutional Review Board approved the study protocol, and each subject provided written informed consent prior to participation.

Table 1.
Demographic Information of Subjects
Instrumentation
The EMED Pedar pressure-measurement system (Novel Electronics, Inc, St Paul, Minnesota), with a sampling rate of 50 Hz, was used to record the pressure and force data. The validity of the capacitance sensor used with the Pedar system has been previously documented. [6] The EMED capacitance sensor insole, which was attached to the Pedar system, consisted of a matrix of 90 to 100 capacitance transducers and was approximately 2 mm thick. The five pairs of insoles used in this study were calibrated prior to the start of data collection by means of a rubber bladder, which was pressurized with compressed air. The calibration procedure consisted of applying a linear range of pressures to each insole with a minimum value of 0 kPa and a maximum value of 700 kPa. The input pressure saturation range for each capacitance sensor used in the Pedar insole was 700 kPa. In the current study, none of the subject trials achieved pressure saturation. A 6-m cable connected the Pedar unit to a computer for data collection and storage.
Footwear
To permit standardization of footwear used during testing, the sensor insoles were placed in martial arts shoes that had a leather upper and a firm rubber outsole (Tiger Claw Martial Artist’s Athletic Shoes, Pioneer Interstate, Inc, Nashville, Tennessee). The original cushioned sock liner from the martial arts shoe was removed and replaced with a piece of nonmolded Aliplast 10 material (AliMed, Inc, Dedham, Massachusetts). Aliplast 10 is a firm, closed-cell polyurethane material with a durometer of 50 to 55 (Shore A gauge). None of the subjects reported any discomfort or were observed to change their typical walking pattern as a result of using the study footwear.
Procedure
After height and weight were recorded, each subject was fitted with a pressure-sensor insole of the appropriate size. Once the sensor insole size was selected, the subject was asked to don a standardized pair of cotton socks. The pressure sensor was then placed in a martial arts shoe of the appropriate size, which was placed on the subject’s foot. Once the shoes were donned, the subject was asked to stand behind a line marked on the laboratory’s linoleum tile floor. For each trial, the subject was asked to walk 8 m across the floor. Prior to each walking trial, the subject was instructed to stand with his or her weight equally distributed on both feet and to begin walking at a self-selected walking speed when given the command to proceed. Each subject performed two practice trials, immediately followed by three data-collection trials. For all five trials, each subject was visually monitored to ensure that the self-selected walking speed was consistent.
Data Analysis
The EMED Pedar expert software system (Novel Electronics, Inc) was used to select two left and two right steps from each of the three data-collection trials for a total of 12 steps. The two left and two right steps were selected from the middle 4.6-m portion of the 8-m walking distance to ensure that the subjects were neither accelerating nor decelerating from their self-selected walking speed. Twelve steps were selected for analysis on the basis of the work of Kernozek et al. [9] They reported that a minimum of three to six consecutive steps were needed to achieve a level of reliability greater than 0.90 using the EMED Pedar system for the peak pressure, pressure-time integral, and maximum vertical force variables.
Once the 12 steps were selected, the EMED NovelWin software system (Novel Electronics, Inc) was used to divide the foot into the following four regions: heel, midfoot, forefoot, and hallux/toes. These regions were based on a percentage of the total foot length and width and were consistently applied to each subject’s footprint. The heel was from 0% to 30% and the midfoot from 30% to 60% of foot length. The forefoot was from 60% to 85% and the hallux/toes from 85% to 100% of foot length. Once the four regions for each step were defined, the following variables were calculated for each region: peak pressure (in kilopascals), pressure-time integral (in kilopascal-seconds), and maximum vertical force (in newtons). A mean for the left and right feet (six steps per foot) was calculated for each variable and used for further statistical analysis. To permit comparison between female and male subjects, maximum vertical force values were normalized with the use of each subject’s body weight. Thus, the unit of measure for normalized maximum vertical force was newtons per kilogram. The stance-phase duration (in milliseconds) for the entire foot was also calculated to determine the between-trial reliability of the subject’s self-selected walking speed.
Statistical Analysis
In addition to descriptive statistics, the standard error of mean (SEM) was calculated for the stance-phase duration to determine the degree of reliability between the six steps selected for the left and right feet. Rothstein [10] has noted that the SEM is one of the most useful indexes for assessing the reliability of variables such as stance-phase duration. It was arbitrarily determined, on the basis of the SEM, that a maximum between-trial variation of 2% for the mean stance-phase duration was required to permit further statistical analyses.
To determine whether differences in the three dependent variables were due to sex or variations between the left and right feet, a series of t-tests were conducted. If a t-test was significant for either sex or extremity, then the SI as defined by Robinson et al [1] was also determined. The SI was calculated to provide an index of the degree of asymmetry among the plantar regions studied. An alpha level of .01 was used for all tests of statistical significance.
Results
The means, SDs, and SEMs for the stance-phase duration of all 30 subjects and the male and female subject groups are listed in Table 2. The SEM was 5.4 milliseconds for all 30 subjects, and 6.2 milliseconds and 7.8 milliseconds for the female and male subjects, respectively.
The results of the t-tests to determine sex differences in the four plantar regions of the foot did not show statistical significance for peak pressure, maximum vertical force, or pressure-time integral. The levels of significance for this series of t-tests are shown in Table 3.
The means and SDs for the peak pressure values for the left and right feet are listed in Table 4. The t-test results for peak pressure indicated that the only region demonstrating a significant difference between feet was the forefoot.
The means and SDs for the pressure-time integral values for the left and right feet are listed in Table 5. The t-test results for pressure-time integral indicated that none of the four regions studied demonstrated a significant difference between feet.
Table 2.
Means, SDs, and SEMs for Stance-Phase Duration (in milliseconds)
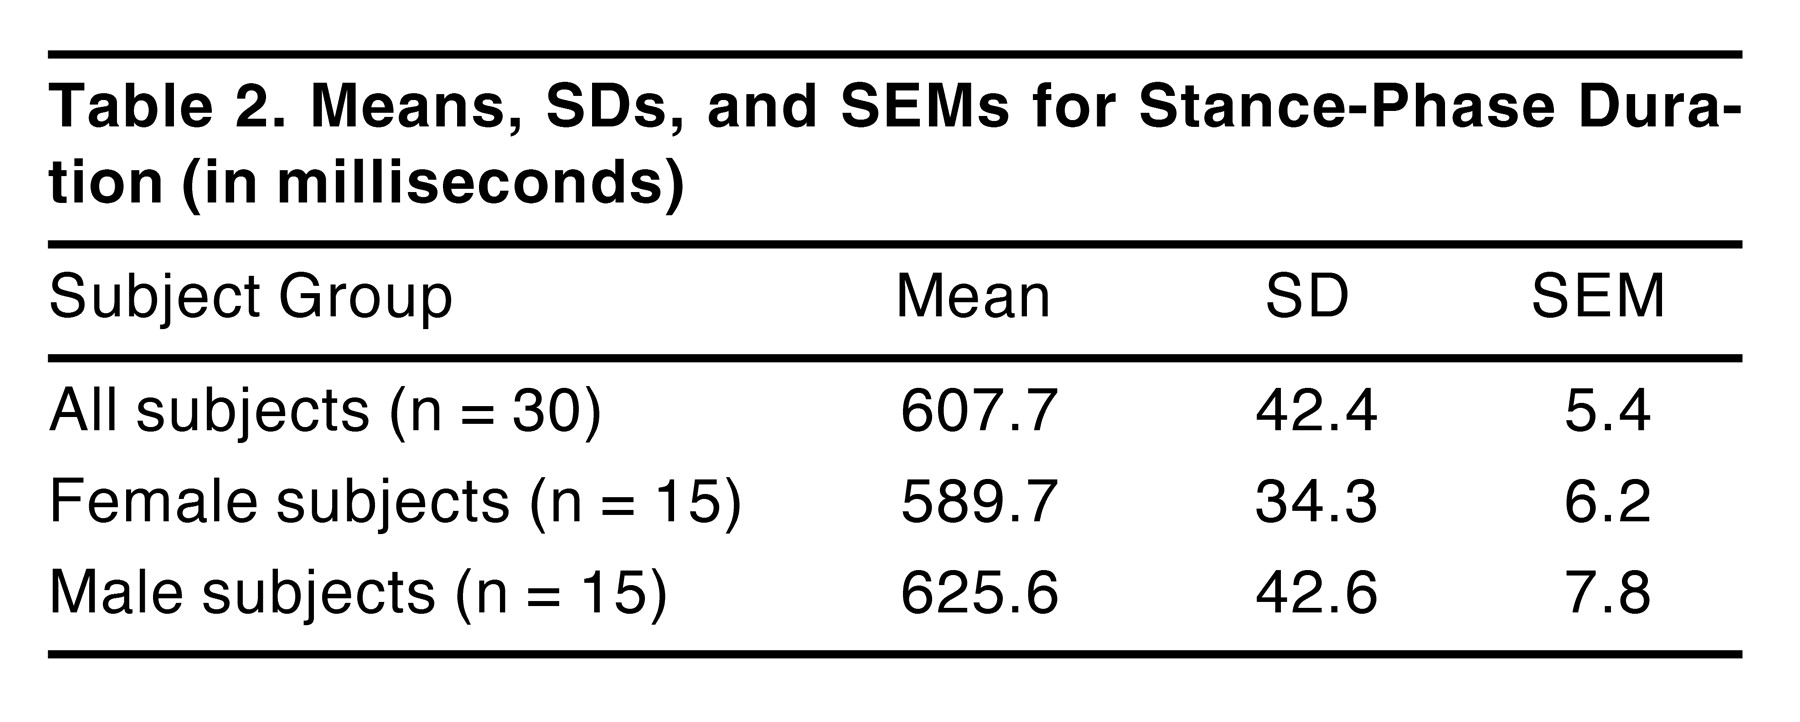
Table 3.
Level of Significance for t-tests Evaluating Sex Differences in Peak Pressure, Pressure-Time Integral, and Maximum Vertical Force
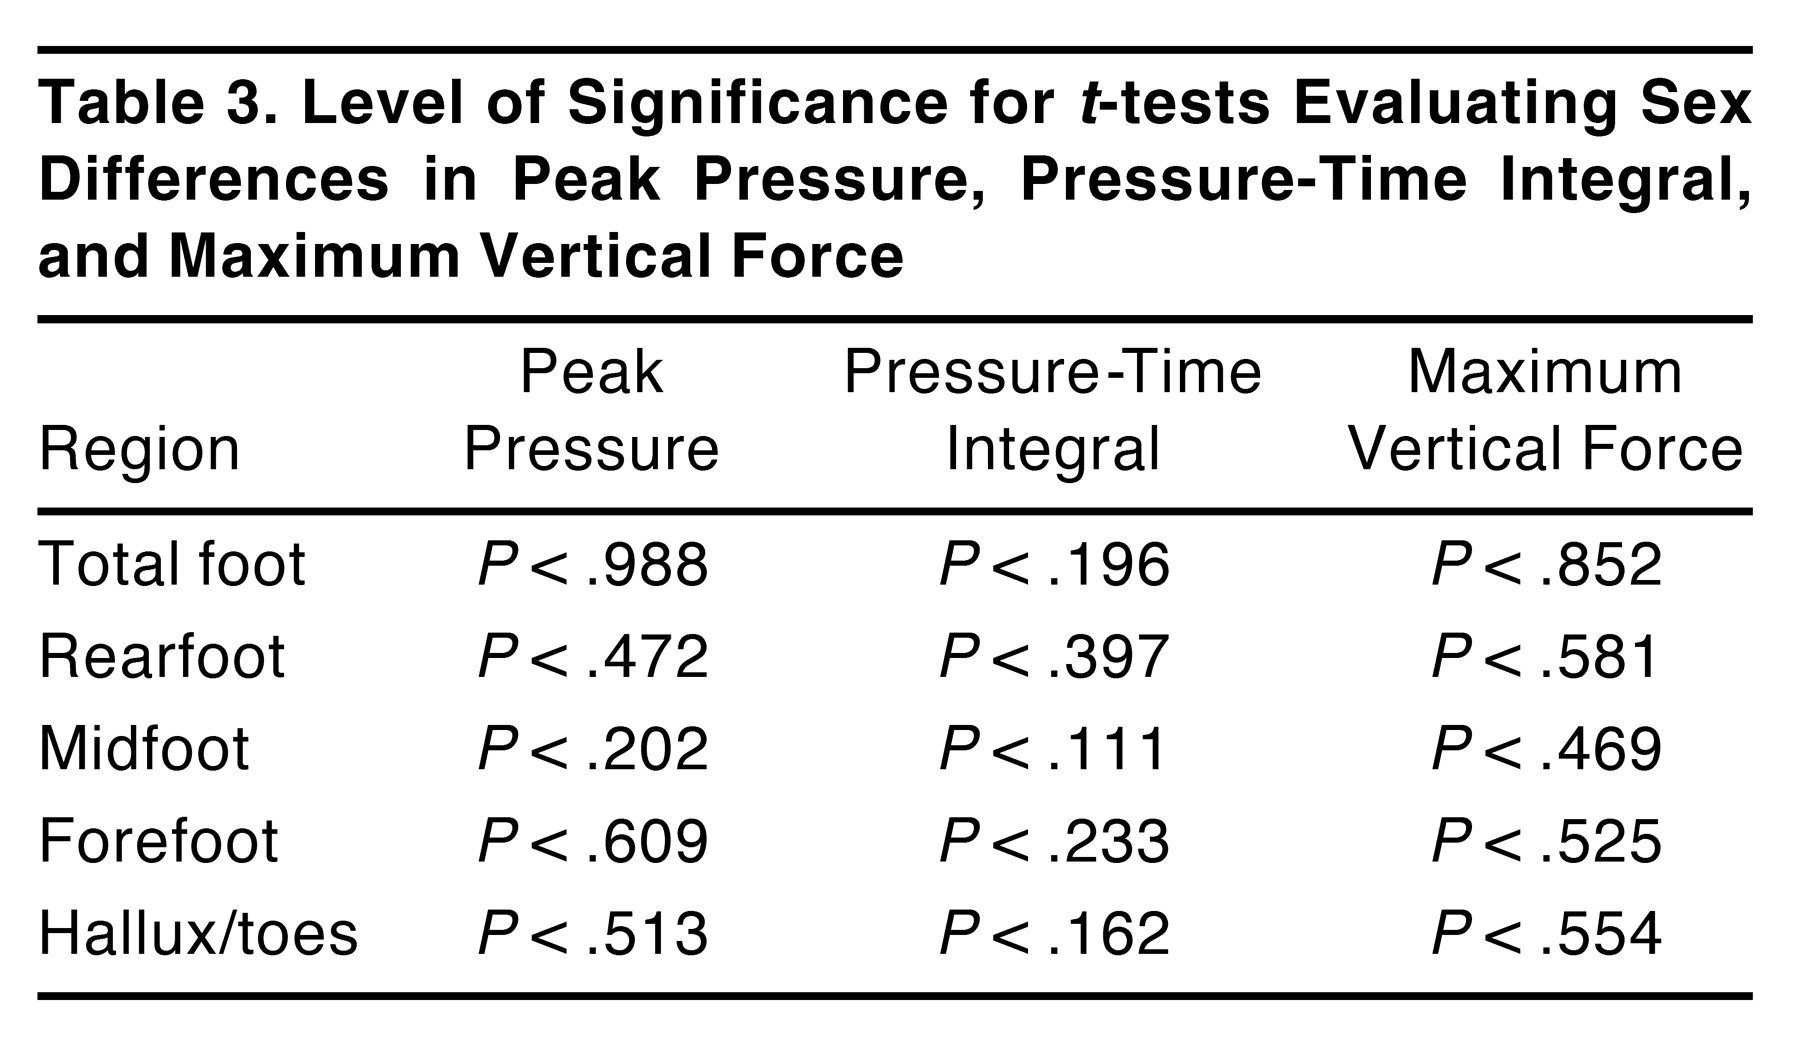
Table 4.
Mean (±SD) Peak Pressure for the Left and Right Feet (in kilopascals)

Table 5.
Mean (± SD) Pressure-Time Integral for the Left and Right Feet (in kilopascals)

Finally, the means and SDs for the maximum vertical force values for the left and right feet are listed in Table 6. The t-test results for maximum vertical force indicated that the only region demonstrating a significant difference in maximum vertical force between feet was the rearfoot.
Table 6.
Mean (±SD) Maximum Vertical Force for the Left and Right Feet (in newtons per kilogram)

On the basis of the t-test results that were significant, the SI was calculated for the forefoot plantar pressures and rearfoot maximum vertical force. The SI between the left and right forefoot for plantar pressure was 4.6%, while the SI between the left and right rearfoot for maximum vertical force was 3.9%.
Discussion
The first step in interpreting the results of this study was to determine whether the stance-phase durations for the 12 steps analyzed for each subject were consistent, especially since data were collected over three distinct walking trials. Both Zhu et al [7] and Kernozek et al [9] have noted that changes in walking speed between testing trials can affect the consistency of both pressure and vertical force values. The SEM was 5.4 for all subjects, and 6.2 and 7.8 for the female and male subject groups, respectively. These values indicate that the maximum degree of variation in the walking speed was less than 1% for all subjects and less than 1.5% for both the male and female subject groups. Using the criterion of variation of less than 2%, the authors concluded that the between-trial stance-phase durations were extremely consistent for all subjects and that further analyses of the results could be performed.
The second step in interpreting the findings of this study was to determine whether differences in the peak pressure, pressure-time integral, and maximum vertical force were due to sex. If the male and female subject groups demonstrated significant differences in the values obtained for the dependent variables studied, then further analyses for each subject group would be required. The results of the statistical tests to determine whether sex differences existed were not significant for the three variables studied across the four regions of the foot. On the basis of the results of these statistical tests, data for the male and female subjects were combined to form a single group of 30 subjects for further analyses.
The purpose of this investigation was to determine whether in-shoe plantar pressure and vertical force patterns were symmetrical between the left and right feet for healthy subjects during walking. To determine the degree of symmetry, a series of t-tests were conducted between the right and left extremities across all four plantar regions for the three variables studied. The findings indicate that for the healthy female and male subjects evaluated in this study, the plantar pressure and maximum vertical force patterns were symmetrical except for two plantar regions. The only plantar region for which peak pressure was found to be significantly different between the right and left feet was the forefoot. The SI value for peak pressure in the forefoot region was 4.6%. None of the plantar regions had significant differences in pressure-time integrals between the right and left extremities. Only the rearfoot region was found to show significant differences between the right and left sides for maximum vertical force. The SI value for maximum vertical force in the forefoot region was 3.9%.
The findings of this investigation suggest that the plantar pressure and force-loading patterns for healthy subjects without a history of lower-extremity pathology or pain are symmetrical between feet during walking, except for two plantar regions. This finding agrees with previously published studies that have evaluated the degree of symmetry for either plantar pressure or relative impulse between the left and right feet. Herzog et al [5] reported the SI for maximum vertical force to be 1.7%, but with the upper and lower limits ± 6.3% for 62 subjects while walking over a force platform. Whereas Becker et al [2] evaluated peak pressures and relative impulse on their control subject group, they reported only the SI for relative impulse. They noted a mean SI for relative impulse of 0.3% but with a range from –6.2% to +5.6%.
The findings of this study can be applied to assessment of the outcome of prolonged immobilization secondary to surgical intervention or fracture casting or bracing. An important determinant of success following a prolonged period of immobilization is the resumption of a normal walking pattern after a period of gait training. A major factor in determining whether a normal walking pattern has been achieved is the degree of symmetry between the right and left feet. Various in-shoe pressure and force-sensor systems, such as the Pedar system used in this study, have been developed for clinical use to determine the degree of symmetry between the extremities as a measure of a successful treatment outcome. As previously noted, minimal data currently exist regarding the degree of asymmetry expected between feet for peak pressure, pressure-time integral, and maximum vertical force. The current study has provided this information to assist the clinician in determining whether an acceptable degree of gait symmetry has been achieved during the gait-training portion of the rehabilitation program.
Conclusion
The results of this investigation indicate that the plantar pressure and force-loading patterns for a group of healthy subjects without a history of lower-extremity pathology or pain are symmetrical between the right and left feet during walking. Differences in the plantar pressure and vertical force patterns between male and female subjects were not found. Plantar pressure and vertical force patterns between the left and right feet also were not significantly different, except for two of the four plantar regions studied. Only the forefoot and rearfoot regions were found to show significant differences between the left and right feet for plantar pressure and vertical force, respectively. The degree of asymmetry for these two plantar regions, however, was minimal.
References
- Robinson RO, Herzog W, Nigg BM: Use of force platform variables to quantify the effects of chiropractic manipulation on gait symmetry. .J Manipulative Physiol Ther10::172. ,1987. .
- Becker HP, Rosenbaum D, Kriese T, et al: Gait asymmetry following successful surgical treatment of ankle fractures in young adults. .Clin Orthop311::262. ,1995. .
- Hasan SS, Edmondstone MA, Limbird TJ, et al: Reaction force patterns of injured and uninjured knees during walking and pivoting. .J Electromyogr Kines1::218. ,1991. .
- Hamill J, Bates B, Knutzen KM: Ground reaction force symmetry during walking and running. .Med Sci Sports Exerc15::170. ,1983. .
- Herzog W, Nigg BM, Read LJ, et al: Asymmetries in ground reaction force patterns in normal human gait. .Med Sci Sports Exerc21::110. ,1989. .
- McPoil TG, Cornwall MW, Yamada W: A comparison of two in-shoe plantar pressure measurement systems. .Lower Extremity2::95. ,1995. .
- Zhu H, Wertsch JJ, Harris GF, et al: Walking cadence effect on plantar pressures. .Arch Phys Med Rehabil76::1000. ,1995. .
- Cavanagh PR, Hewitt FG Jr, Perry JE: In-shoe plantar pressure measurements: a review. .Foot2::185. ,1992. .
- Kernozek TW, LaMott EE, Dancisak MJ: Reliability of an in-shoe pressure measurement system during treadmill walking. .Foot Ankle Int17::204. ,1996. .
- Rothstein JM: “Measurement and Clinical Practice: Theory and Application,” in Measurement in Physical Therapy, ed by JM Rothstein, p 1, Churchill Livingstone, New York, 1985..
© 2001 American Podiatric Medical Association