


Abstract
Background: Many arch structure classification methods exist, but arch structure may be influenced by factors such as age and physical activity. It is unknown if previous arch structure classifications from adult populations are appropriate for adolescents. The purpose of our study was to compare arch structure classifications between adolescent-specific and previously published classification systems. Methods: We enrolled 141 uninjured adolescents who participated in long-distance running activities. We measured arch height index (AHI) for both feet in seated and standing positions and classified arch structure as cavus, rectus, or planus. We calculated kappa and percent agreement to compare arch structure classification for our participants with previously published classifications. We performed one-sample t tests to compare mean AHI values from our participants with previously published values. We performed Pearson correlation and percent agreement for arch structure classification for AHI measured in seated and standing for our participants. Results: We observed no to weak and unacceptable agreement (κ = −0.008 to 0.702; P < .001 to .77; 29–72%) for seated and standing AHI between our classification and most prior classifications. Our seated and standing mean AHI values differed from most prior studies (P < .001 to .99; d = 0.00–1.52). We observed a very large positive correlation (r = 0.90; P < .001) with moderate and acceptable classification agreement (κ = 0.641; P < .001; 83%) between mean AHI values measured in seated and standing positions. Conclusions: Arch structure classification varied based on classification system and showed poor agreement between most previously reported classification systems. Mean AHI values were significantly different for adolescent runners in our study compared with most previously reported mean values. Researchers and clinicians may classify arch structure in a seated or standing position if position-specific criteria are applied. Special care should be taken before extrapolating classification systems originating from populations with different characteristics, such as age, sport participation, and health status.
The foot is the base of support for activities of sport and daily living. The longitudinal arch structure, which links the hindfoot to the forefoot, has been proposed as a risk factor in lower-extremity bony and soft-tissue injuries [1,2,3,4,5,6]. Arch structure is typically classified into three categories (cavus/high arch, rectus/normal, and planus/low arch), and nonrectus arch structures are thought to be more prone to injury [4,5,6].
Many arch structure classification methods have been proposed, and arch structure may be classified by visual observation (eg, change in navicular bone height between seated and standing), goniometric measurement of the angle between the calcaneus and midpoint of the calf, or radiographs [2,3,7]. Weightbearing radiographs are considered the gold standard for assessing arch structure[8] but are not available in many facilities, which requires clinicians to rely on visual observation to assess arch structure [1,9,10,11]. However, visual observation of arch structure provides only a subjective measure and may not be reliable between raters [3]. Higher reliability without the need for radiographs can be achieved with the arch height index (AHI), a validated tool[3,12,13,14] that promotes a uniform objective classification system. The AHI has demonstrated good to excellent intrarater and interrater reliability for children (ages 6–12 years, intraclass correlation coefficient ≥0.76)[14] and adults (intraclass correlation coefficient ≥0.94) [3].
Previous literature has reported thresholds for arch structure classification according to AHI values, but there are inconsistencies among cutoff value methodologies (eg, quartiles, SD, fixed ranges) and testing positions (eg, seated, standing) [1,3]. Thresholds for arch structure classifications may be population-specific [3,14]. However, it is unknown if the thresholds used for adult classifications are appropriate for use in adolescents [14]. Therefore, the primary purpose of our study was to compare arch structure classifications between adolescent-specific and previously published classifications from children, adults, and collegiate runners (Supplementary Materials). We hypothesized that there would be poor agreement in arch structure classification between our adolescent-specific classifications and previously published classifications. Our secondary aims were to 1) compare mean adolescent AHI values with previously published mean AHI values and 2) evaluate the relationship between seated and standing adolescent AHI values and agreement between seated and standing arch structure classifications. We hypothesized that 1) our mean AHI values would differ from previously published mean AHI values and 2) there would be a positive relationship and acceptable agreement between seated and standing AHI values in adolescents.
Materials and Methods
This study was a secondary analysis from a cross-sectional study of 141 adolescent long-distance runners (female = 79; male = 62; age = 13.5 ± 2.7 years; height = 1.58 ± 0.15 m; mass = 48.0 ± 13.6 kg) [15]. From April 2017 to June 2019, we recruited adolescent athletes (ages 9–19 years old) who participated in long-distance running activities, including track and field (running distances ≥600 m), cross country, and soccer [16,17,18]. Participants were excluded if they reported a running-related injury within the last 6 months or had a history of lower-extremity surgery. Prior to data collection, participants provided signed informed consent (parental permission and assent if age <18 years old) following methods approved by the hospital’s institutional review board. Participants completed a single visit to our laboratory, where they underwent AHI assessment.
Right and left AHI values were measured barefoot in seated and standing positions using methods previously described [3]. Seated AHI was measured first for all participants, and the first side tested (ie, right or left foot) alternated between participants. Participants sat on the edge of a chair so that their hips, knees, and ankles were positioned at approximately 90° with feet hip-width apart [3,14]. Maximum foot length was measured from the heel to the end of the longest toe. Truncated foot length was measured from the heel to the base of the first metatarsophalangeal joint. Dorsal arch height was measured using the height at the most prominent aspect of the dorsum of the foot at the midpoint of truncated foot length [3]. Seated measurements were then recorded for the contralateral foot and repeated in bipedal standing for each foot. The AHI measurement was performed by a research assistant or one of two physical therapists, including one of the authors of the current study (C McKeone), with 1 to 6 years of experience who were trained according to the previously applied methods.
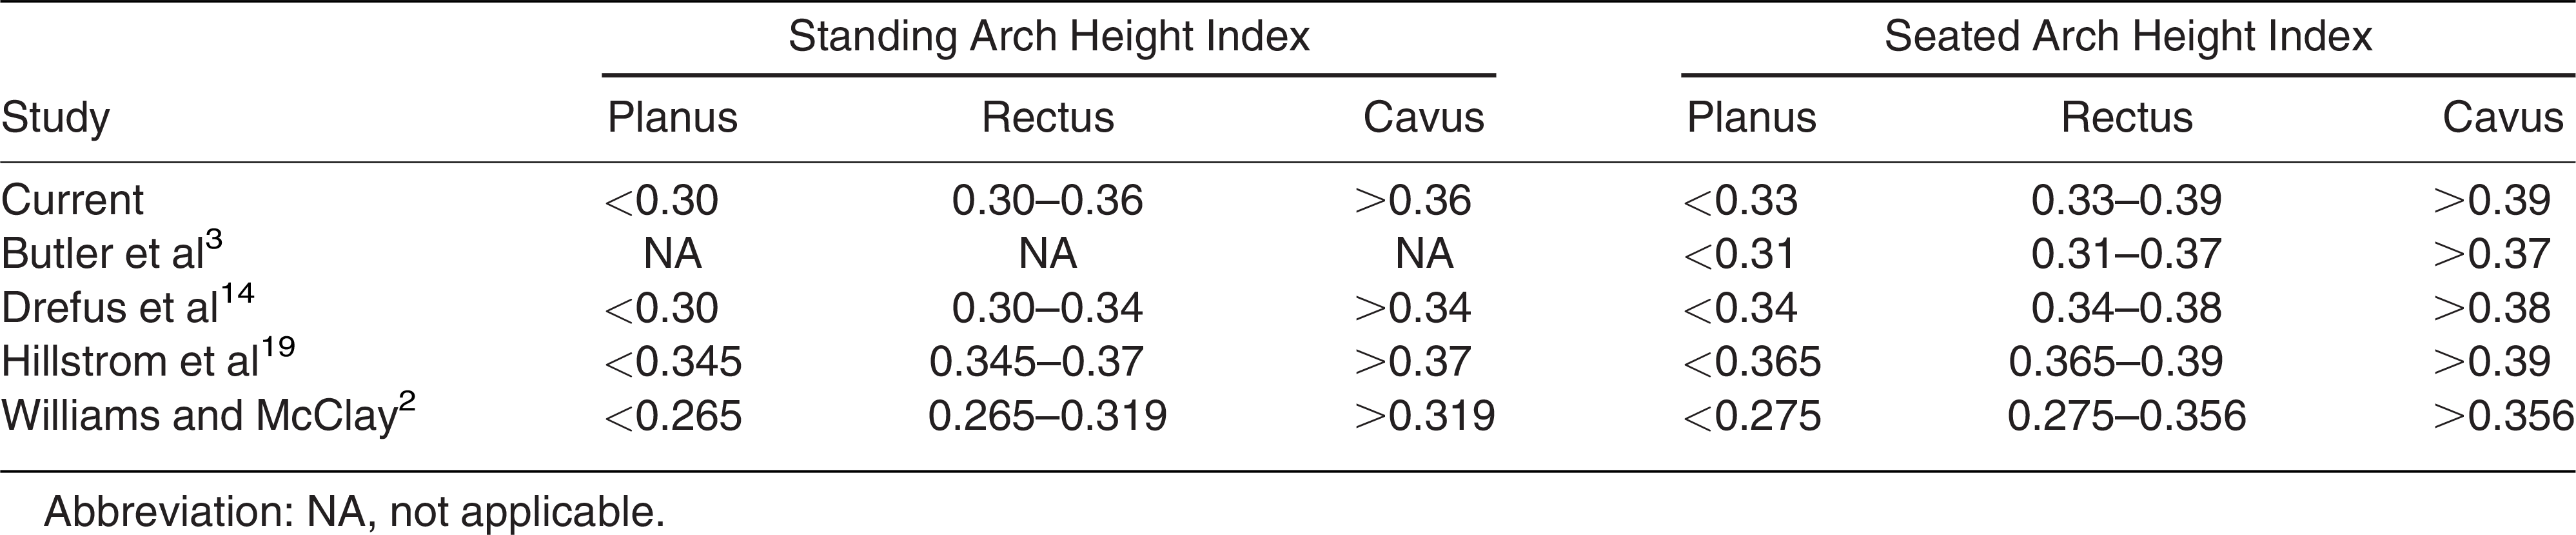
We calculated AHI as the dorsal arch height divided by the truncated foot length for each foot and computed the group mean for seated and standing [3]. Feet that were ≥1 SD above or below the mean AHI value were classified as cavus or planus, respectively [19]. We also classified arch structure using previously reported AHI values (Table 1) [3,14,19,20,21]. When specific arch structure classifications were not presented [3,20,21], cavus and planus were defined as AHI value ≥1 SD above and below, respectively, the reported mean AHI or according to defined AHI ranges [14,19].

Table 1.
Arch Structure Classification Thresholds Among Studies
Statistical Analysis
SPSS Statistics 26 (IBM, Armonk, New York) was used to conduct all statistical analyses. For our primary aim, we calculated kappa and percent agreement to compare arch structure classification of our participants with previously published AHI classifications and values (Table 1). For our secondary aims, we performed one-sample t tests to compare our group means with previous studies (Supplementary Materials)[2,3,14,19,20,21] for seated and standing AHI. Effect sizes (Cohen d) assessed the magnitude of differences (none, d <0.2; small, 0.2 ≤ d <0.5; medium, 0.5 ≤ d <0.8; and large, d ≥0.8) [22]. We also performed a paired t test to compare seated and standing AHI mean values and Pearson correlations to investigate the relationship between seated and standing AHI. Correlation strength was interpreted as small (r <0.3), moderate (0.3 ≤ r <0.5), large (0.5 ≤ r <0.7), or very large (r >0.7) [23]. We calculated kappa and percent agreement to compare agreement among classifications between seated and standing positions. Strength of kappa agreement analysis was categorized as none (κ <0.20), minimal (0.20 ≤ κ <0.40), weak (0.40 ≤ κ <0.60), moderate (0.60 ≤ κ ≤0.80), strong (0.80 ≤ κ <0.90), or almost perfect (κ ≥0.90) [24]. Percent agreement between seated and standing classifications was calculated as the number of feet classified the same divided by the total number of feet. Percent agreement ≥75% was determined to be acceptable [22]. Significance was set at P ≤ .05 for all analyses.
Results
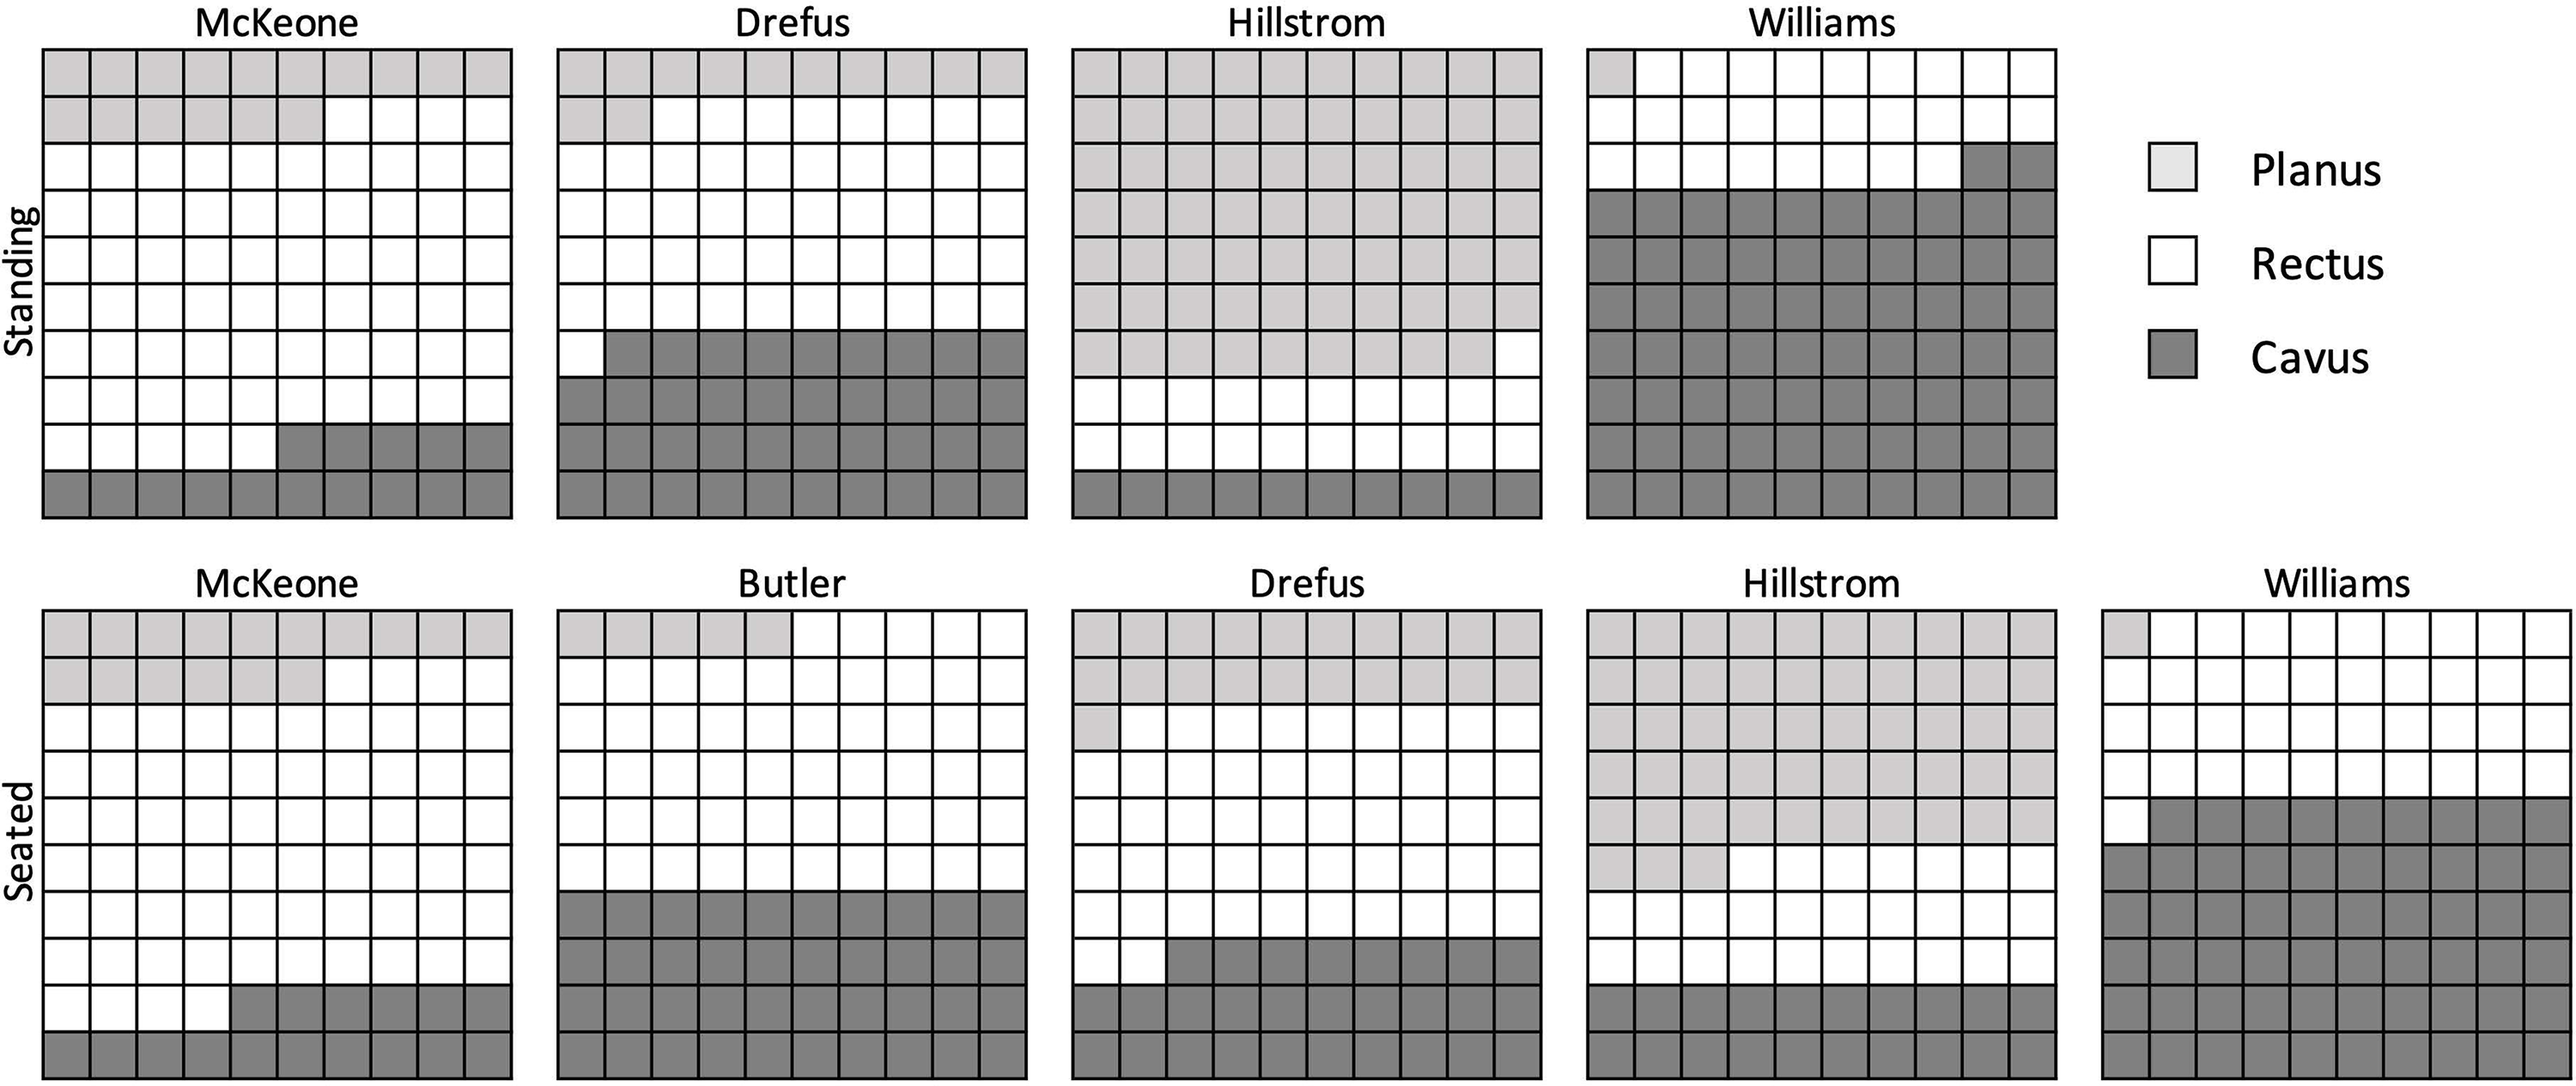
The seated AHI was 0.36 ± 0.03 and the standing AHI was 0.33 ± 0.03. In the seated position, a foot was classified planus if AHI was <0.33 (n = 45 [16.0%]), rectus if AHI was between 0.33 and 0.39 (n = 193 [68.4%]), and cavus if AHI was >0.39 (n = 44 [15.6%]) (Fig. 1). In the standing position, a foot was classified planus if AHI was <0.30 (n = 41 [14.5%]), rectus if AHI was between 0.30 and 0.36 (n = 197 [69.9%]), and cavus if AHI was >0.36 (n = 44 [15.6%]).
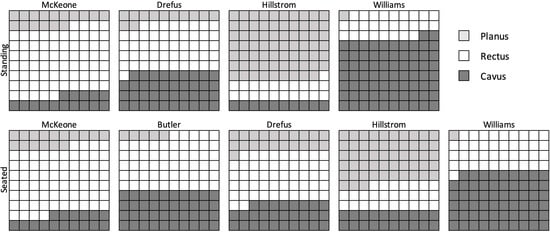
Figure 1.
Distribution percentage of arch structure classification of participants in standing and seated positions using previously published classification criteria. Each box represents 1%.
In the seated position, we observed no to weak and unacceptable agreement (κ = 0.083–0.408; P < .001 to .02; 43–66%) between our classification and the classification criteria used by most prior studies[2,3,14] and weak but acceptable agreement (κ = 0.702; P < .001; 83%) with one study (Table 2) [14]. In the standing position, we observed no to weak and unacceptable agreement (κ = –0.008 to 0.516; P < .001 to .77; 29–72%) between our classification and the classification criteria used by published studies (Table 3) [2,14].
Table 2.
Kappa and Percent Agreement Among Seated Arch Structure Classifications Using Previously Published Values

Table 3.
Kappa and Percent Agreement Among Standing Arch Structure Classifications Using Previously Published Values

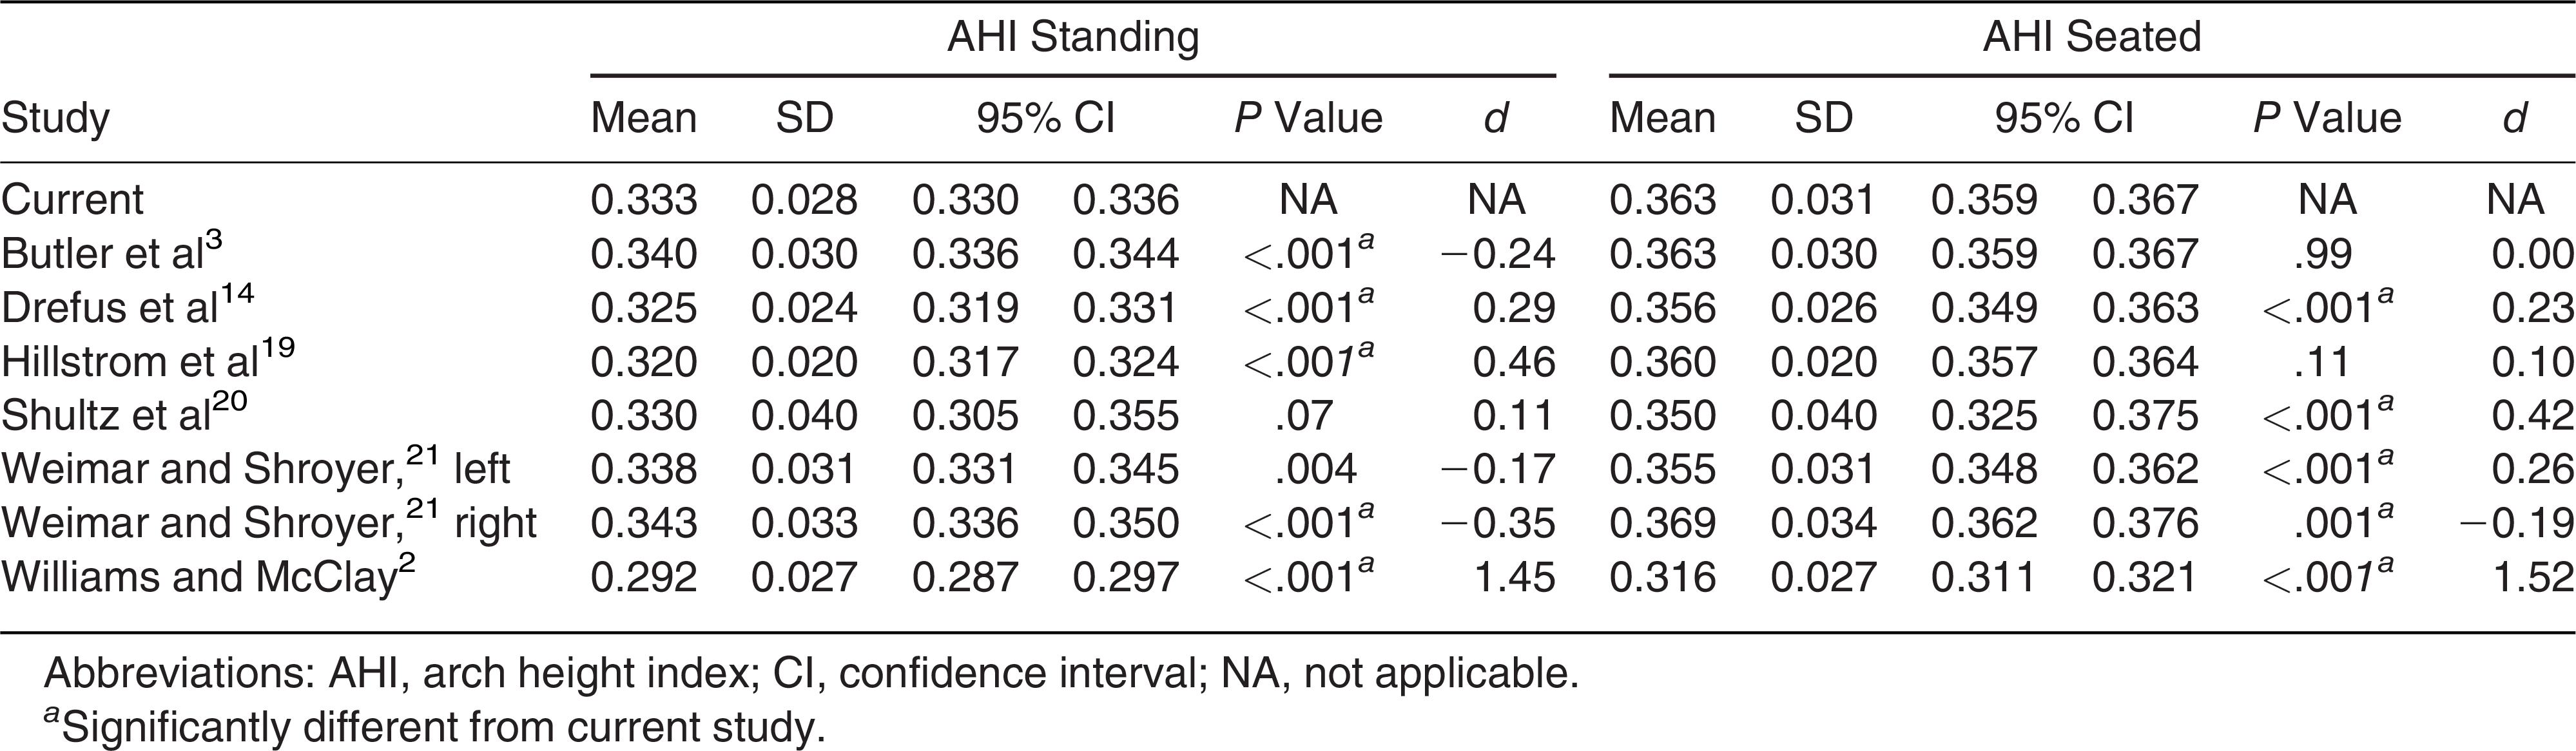
Our mean seated AHI was significantly higher than that of Williams and McClay[2] (P < .001; d = 1.52), Drefus et al[14] (P < .001; d = 0.23), Shultz et al[20] (P < .001; d = 0.42), and Weimar and Shroyer[21] left foot (P < .001; d = 0.26) but significantly lower than that of Weimar and Shroyer right foot (P = .001; d = −0.19) (Table 4). Our mean standing AHI was significantly higher than that of Drefus et al[14] (P < .001; d = 0.29), Hillstrom et al[19] (P < .001; d = 0.46), and Williams and McClay[2] (P < .001; d = 1.45) but significantly lower than that of Butler et al[3] (P < .001; d = −0.24) and Weimar and Shroyer[21] right foot (P < .001; d = −0.35).
Table 4.
Arch Height Index Comparisons With Previous Studies
Our seated AHI (0.36 ± 0.03) was significantly greater than our standing AHI (0.33 ± 0.03) (P < .001). We observed a very large positive correlation (r = 0.90; P < .001) with moderate and acceptable classification agreement (κ = 0.641; P < .001; 83%) between mean AHI values measured in seated and standing positions.
Discussion
The primary purpose of our study was to compare arch structure classification in adolescents with previously published arch structure classifications. We found poor agreement when classifying arch structure using most previously published classifications. Our secondary aims were to compare our AHI values with previously published values and to evaluate the relationship and classification agreement between seated and standing AHI values. We found significant differences in AHI values compared with most of the other previously reported findings but strong relationships and similar classifications between our seated and standing AHI values and classifications.
We found that our sample-specific arch structure classification using mean and 1 SD thresholds in adolescents did not agree with previously published classification criteria. Arch structure classifications are often based on sample means and 1 SD [2,3,20]. However, inconsistencies in arch classification threshold criteria[14,19] may contribute to the lack of agreement between our classifications and previously published classifications. Participant characteristics, including activity level, age, sex, and anthropometric variables, could also influence agreement, which has led others to advise against applying AHI mean values outside the specific study population [3,21]. A more robust classification system, such as cluster analysis, may be needed to account for various characteristics among populations and warrants future investigation. Our findings highlight the wide variability and lack of classification agreement among cohorts and support the need for population-specific classification criteria.
Mean seated and standing AHI values from our population differed significantly from ten of the 14 (71.4%) previously reported mean AHI values with small to large effect sizes [2,3,14,19,20,21]. Our findings further support that mean AHI values are sample-specific[3] and differ among populations, as our sample was specific to adolescent endurance athletes, whereas previously published samples differed in age and physical activity level. Sample size could also influence population differences, with our study having a substantially larger sample size than most of the previously published studies (Supplementary Materials). Future research in a large, diverse sample is needed to better understand which population characteristics (eg, age, sex, sport, or physical activity) contribute to differences in AHI.
We observed significantly different AHI values in seated and standing positions in our population, similar to previous findings [3,14,21]. The differences in mean AHI we observed between seated and standing positions suggest that position-specific criteria are needed for classifying arch structure. However, we found a large positive correlation and acceptable agreement in seated and standing AHI within our population when using position-specific criteria. This suggests that researchers and clinicians may classify arch structure in a seated or standing position if position-specific criteria are applied.
Limitations
Our results should be interpreted within the context of our study’s limitations. First, we did not measure our interrater reliability for the AHI measurements taken seated and standing. Although interrater reliability has not been assessed for all ages included in our population, good reliability has been reported for children ages 6 to 12 [3,14]. Second, we targeted adolescent athletes who participated in long-distance running activities, including both runners and soccer players. We had 43 athletes who played only soccer, 20 who both ran and played soccer, and 78 who participated in only running. Although over 6 miles is run during an average soccer game [16,17,18], we did not set inclusion criteria for a specific volume of running per week or per season, nor did we specify years of running experience. Third, as our study sample was based on 141 adolescent endurance athletes, our findings may not be generalizable to all adolescents. Fourth, we did not control for maturational status and included prepubertal (n = 45), midpubertal (n = 37), and postpubertal (n = 59) participants. Although maturation has been reported to influence AHI [14,25], we did not compare among maturational status to allow for a larger sample size of adolescents and are therefore unable to assess maturational effects in our population. Finally, arch structure has been reported to influence injuries in adult recreational runners [26], but it is unknown if AHI is predictive of running injuries in adolescent runners. Further research is needed to better understand the influence of population characteristics on AHI.
Conclusions
Arch structure classification varied based on classification system and showed poor agreement between most previously reported classification systems. Mean AHI values were significantly different for adolescent runners in our study compared with a majority of previously reported mean values from different populations. Although we observed significant differences in mean AHI between seated and standing positions, a very large positive relationship and acceptable classification agreement were observed between testing positions. Special care should be taken before extrapolating classification systems originating from populations with different characteristics, such as age, sport participation, and health status.
Financial Disclosure
This work was supported by a Cincinnati Children’s Hospital Medical Center Division of Patient Services grant. The funding body had no role in the design of the study or the collection, analysis, or interpretation of data.
Conflict of Interest
None reported.
References
- Hollander K, Zech A, Rahlf AL, et al: The relationship between static and dynamic foot posture and running biomechanics: a systematic review and meta-analysis. Gait Posture 72: 109, 2019.
- Williams DS, McClay IS: Measurements used to characterize the foot and the medial longitudinal arch: reliability and validity. Phys Ther 80: 864, 2000.
- Butler RJ, Hillstrom H, Song J, et al: Arch height index measurement system: establishment of reliability and normative values. JAPMA 98: 102, 2008.
- Hespanhol Junior LC, Costa LO, Carvalho AC, et al: A description of training characteristics and its association with previous musculoskeletal injuries in recreational runners: a cross-sectional study. Rev Bras Fisioter 16: 46, 2012.
- Hespanhol Junior LC, Pena Costa LO, Lopes AD: Previous injuries and some training characteristics predict running-related injuries in recreational runners: a prospective cohort study. J Physiother 59: 263, 2013.
- Kaufman KR, Brodine SK, Shaffer RA, et al: The effect of foot structure and range of motion on musculoskeletal overuse injuries. Am J Sports Med 27: 585, 1999.
- Dars S, Uden H, Banwell HA, et al: The effectiveness of non-surgical intervention (foot orthoses) for paediatric flexible pes planus: a systematic review: update. PLoS One 13: e0193060, 2018.
- Shin BJ, Lee KM, Chung CY, et al: Analysis of factors influencing improvement of idiopathic flatfoot. Medicine (Baltimore) 100: e26894, 2021.
- Barton CJ, Bonanno DR, Carr J, et al: Running retraining to treat lower limb injuries: a mixed-methods study of current evidence synthesised with expert opinion. Br J Sports Med 50: 513, 2016.
- Matias AB, Taddei UT, Duarte M, et al: Protocol for evaluating the effects of a therapeutic foot exercise program on injury incidence, foot functionality and biomechanics in long-distance runners: a randomized controlled trial. BMC Musculoskelet Disord 17: 160, 2016.
- Taddei UT, Matias AB, Duarte M, et al: Foot core training to prevent running-related injuries: a survival analysis of a single-blind, randomized controlled trial. Am J Sports Med 48: 3610, 2020.
- Hollander K, Stebbins J, Albertsen IM, et al: Arch index and running biomechanics in children aged 10–14 years. Gait Posture 61: 210, 2018.
- Scholz T, Zech A, Wegscheider K, et al: Reliability and correlation of static and dynamic foot arch measurement in a healthy pediatric population. JAPMA 107: 419, 2017.
- Drefus LC, Kedem P, Mangan SM, et al: Reliability of the arch height index as a measure of foot structure in children. Pediatr Phys Ther 29: 83, 2017.
- Taylor-Haas JA, Long JT, Garcia MC, et al: The influence of maturation and sex on pelvis and hip kinematics in youth distance runners. J Sci Med Sport 25: 272, 2022.
- Castagna C, D’Ottavio S, Abt G: Activity profile of young soccer players during actual match play. J Strength Cond Res 17: 775, 2003.
- Harley JA, Barnes CA, Portas M, et al: Motion analysis of match-play in elite U12 to U16 age-group soccer players. J Sports Sci 28: 1391, 2010.
- Aslan A, Acikada C, Guvenc A, et al: Metabolic demands of match performance in young soccer players. J Sports Sci Med 11: 170, 2012.
- Hillstrom HJ, Song J, Kraszewski AP, et al: Foot type biomechanics part 1: structure and function of the asymptomatic foot. Gait Posture 37: 445, 2013.
- Shultz SP, Sitler MR, Tierney RT, et al: Consequences of pediatric obesity on the foot and ankle complex. JAPMA 102: 5, 2012.
- Weimar WH, Shroyer JF: Arch height index normative values of college-aged women using the arch height index measurement system. JAPMA 103: 213, 2013.
- Cohen J: A coefficient of agreement for nominal scales. Educ Psychol Meas 20: 37, 1960.
- Hopkins WG, Marshall SW, Batterham AM, et al: Progressive statistics for studies in sports medicine and exercise science. Med Sci Sports Exerc 41: 3, 2009.
- McHugh ML: Interrater reliability: the kappa statistic. Biochem Med (Zagreb) 22: 276, 2012.
- Zifchock RA, Davis I, Hillstrom H, et al: The effect of gender, age, and lateral dominance on arch height and arch stiffness. Foot Ankle Int 27: 367, 2006.
- Perez-Morcillo A, Gomez-Bernal A, Gil-Guillen VF, et al: Association between the Foot Posture Index and running related injuries: a case-control study. Clin Biomech (Bristol) 61: 217, 2019.
© 2025 American Podiatric Medical Association