


Abstract
Background: The plantar fascia of the foot is complex in both its structure and function. Previous research using ultrasound-based techniques has focused on nonweightbearing assessment of plantar fascia thickness (PFT) and plantar fascia stiffness (PFS). However, weightbearing assessment (closed chain) has not previously been performed in a way to demonstrate the response of the plantar fascia to load. This study aimed to develop a protocol that enables precise and consistent measurement of the PFT and PFS while bearing weight in a fixed calcaneal stance position. Methods: An ultrasound probe capable of shear wave elastography was integrated into a bespoke three-dimensional printed platform incorporating a window to allow positioning of the ultrasound probe. This allowed a closed-chain assessment of the plantar fascia in which a standardized protocol was developed for measurement of the PFT and PFS. The images produced were composed of clips, which were then subdivided into multiple frames. Results: A total of 13 participants (26 feet) had PFT and PFS assessed using the protocol. The results showed a low coefficient of variation (CV) in frame analysis for PFT (CV, 0) and PFS (CV, 0.01). One-clip analysis also demonstrated a low CV for PFT (CV, 0.02) and PFS (CV, 0.01). In addition, a cluster analysis indicated two distinct groups that demonstrated a strong correlation between PFT and PFS (group 1 and group 2 correlation coefficients, 0.83 and 0.98, respectively). Conclusions: The protocol reported in this study was shown to be a valid and reliable method for assessing PFT and PFS in a weightbearing position, which has many clinical and research implications.
In normal walking, the heel strikes the ground first and is prone to diverse types of injuries, such as trauma, impact, inflammation, and stress-related conditions. Plantar heel pain has been linked to more than 20 different causes, with the most common being plantar fasciitis (plantar fasciosis), which affects the plantar fascia at its attachment to the heel bone [1]. The plantar fascia is a long, tendon-like structure that runs from the heel bone to the forefoot and serves multiple functions, including providing support and propulsion during walking [2]. The windlass mechanism, which stabilizes the foot during propulsion, is a well-known role of the plantar fascia [3]. However, other structures, such as ligaments, muscles, and bone geometry, also contribute to foot stability [4]. Despite being technically inaccurate, plantar fasciitis is the widely used term for plantar heel pain and accounts for approximately 80% of cases [5]. It is prevalent in 10% of the population and typically affects people between 40 and 60 years old, resulting in 1 million patient visits to health-care professionals in the United States annually, with an estimated cost of $192 to $376 million per year [5,6]. The United Kingdom also experiences a similar prevalence rate, with 12.1% of all musculoskeletal foot and ankle consultations in primary care related to heel pain, 7.5% of which are specifically linked to plantar fasciitis.7 The incidence of plantar heel pain in the United Kingdom is 9.6%, but no economic data are available [8].
Observations in clinical settings have shown that plantar heel pain classically occurs after rest (also known as post-static dyskinesia) and can result in increased plantar fascia thickness (PFT) and plantar fascia stiffness (PFS) [9]. In the UK population, this condition can be so severe that it is considered disabling [8]. The reason behind the increased thickness of the plantar fascia in plantar fasciitis has been a topic of debate. It has been suggested that microtears, fiber degeneration, or edema [10] may be responsible for the reparative process that results in the thickening of the plantar fascia. It is widely accepted that a PFT greater than 4 mm is directly related to plantar fasciitis symptoms [11], but studies have suggested pathologic values of 5 mm12 and 6 mm [13]. The lack of a standardized assessment process and nonweightbearing studies may account for the variation in thickness. Therefore, having a standardized method to assess PFT is crucial for clinicians. Cross-sectional imaging, such as magnetic resonance imaging, and B-wave ultrasonography are commonly used techniques for measuring PFT.
The PFS can be determined by calculating Young’s modulus, which describes the relationship between stress and strain. This can be accomplished using ultrasound waves (also known as elastosonography). Two methods are recognized for measuring PFS using sonography. Strain elastography involves applying manual pressure to the tissue with the transducer, and displacement is calculated by analyzing the return velocities of the sound waves over time [14]. However, this method is subjective and can introduce errors owing to the pressure applied by the probe.
By contrast, shear wave elastography is an ultrasound-based technique that evaluates tissue mechanical properties by remotely inducing shear waves. Shear wave elastography calculates Young’s modulus based on the shear wave velocities, which are produced by a focused ultrasound pulse and measured using Doppler frequency modulation of simultaneously transmitted probing ultrasound waves. Consequently, the stiffer the tissue, the faster the shear waves propagate [14]. Shear wave elastography is a quantitative technique and has been validated against traditional muscle techniques with a strong correlation [15]. However, the probe should be perpendicular to the tissues for best results [16]. Furthermore, the thickness of the heel pad should be considered given the depth of penetration of the shear waves [17]. However, the thickness of the normal heel pad is considered to be less than 3 cm and should not be a limiting factor for the study [18].
In a systematic review of the literature, it was found that there is no agreement on a standard assessment technique or foot position for nonweightbearing assessment of the PFT and PFS. Ostermann et al. [19] reported that the plantar fascia is thicker in the “stretched” foot, especially in a symptomatic foot, whereas Granado et al. [20] found that foot dysfunction can be related to plantar fasciitis and, conversely, the PFT is reduced as the toes are extended. These findings suggest that nonweightbearing assessment may have inherent error due to foot position. However, in their systematic review of the risk factors for plantar fasciopathy, van Leeuwen et al. [21] identified a lack of evidence for the clinical and mechanical measures of foot function.
The aforementioned information indicates the variability in ultrasound assessment of the plantar fascia and the need for consistent and repeatable evaluation of the PFT and PFS from a weightbearing position. Hence, the objective of this study was to devise a technique that enables precise and consistent measurement of the PFT and PFS while bearing weight in the relaxed calcaneal stance position.
Materials and Methods
Following ethical approval, 13 participants (26 feet) who provided informed consent were recruited for this study. The study had strict exclusion criteria that included systemic diseases such as fibromyalgia, pain syndrome, and diabetes as well as inflammatory arthropathy; heel pain caused by tumors, infections, neuroma, or osteoarthritis; foot trauma; mobility impairment; disabling pain or cognitive disorders; and history of foot deformity or function treatment.
The position and function of the rearfoot can cause a change in forces transmitted through the plantar fascia because it is intricately linked to the medial tuberosity of the calcaneus. The complete protocol can be found in Figure 1. To perform weightbearing assessments in a closed-chain position, a linear array ultrasound probe (4–15 MHz, SL 15-4 linear transducer) was mounted on a rearfoot platform (Dynastat; Dynastat Systems Ltd, Penkridge, England) and adjusted and used with an Aixplorer ultrasound machine (SuperSonic Imagine, Aix-en-Provence, France). To ensure a perfect fit, a three-dimensional printed holder made of polyethylene terephthalate glycol was created to match the probe’s exact dimensions (Figure 2).
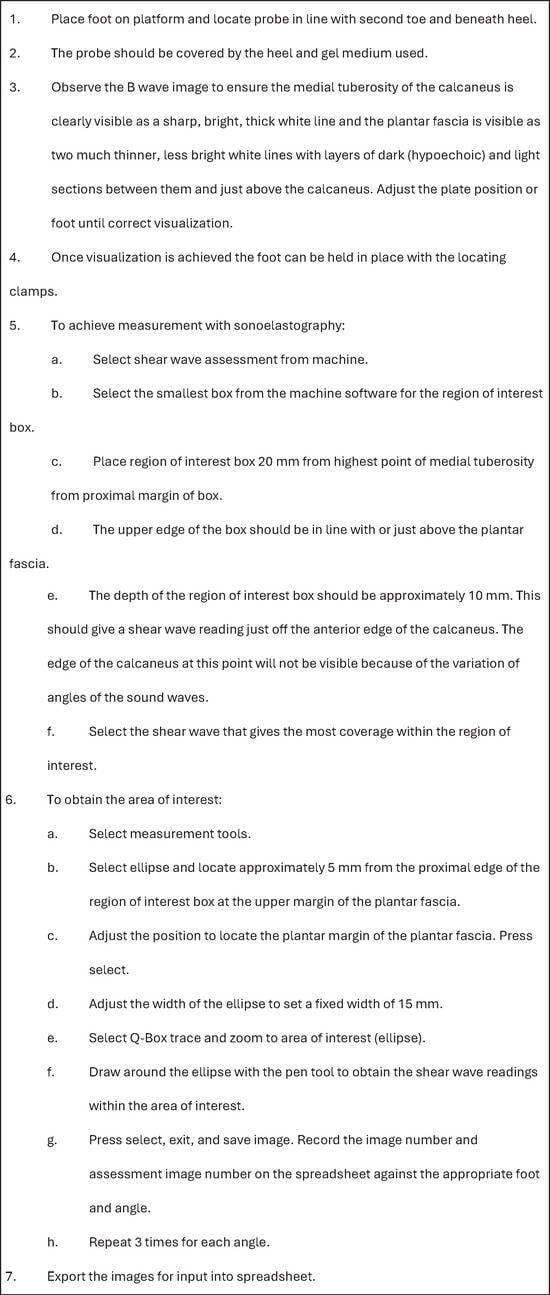
Figure 1.
Protocol for weightbearing assessment of the plantar fascia using elastosonography on an Aixplorer ultrasound machine.
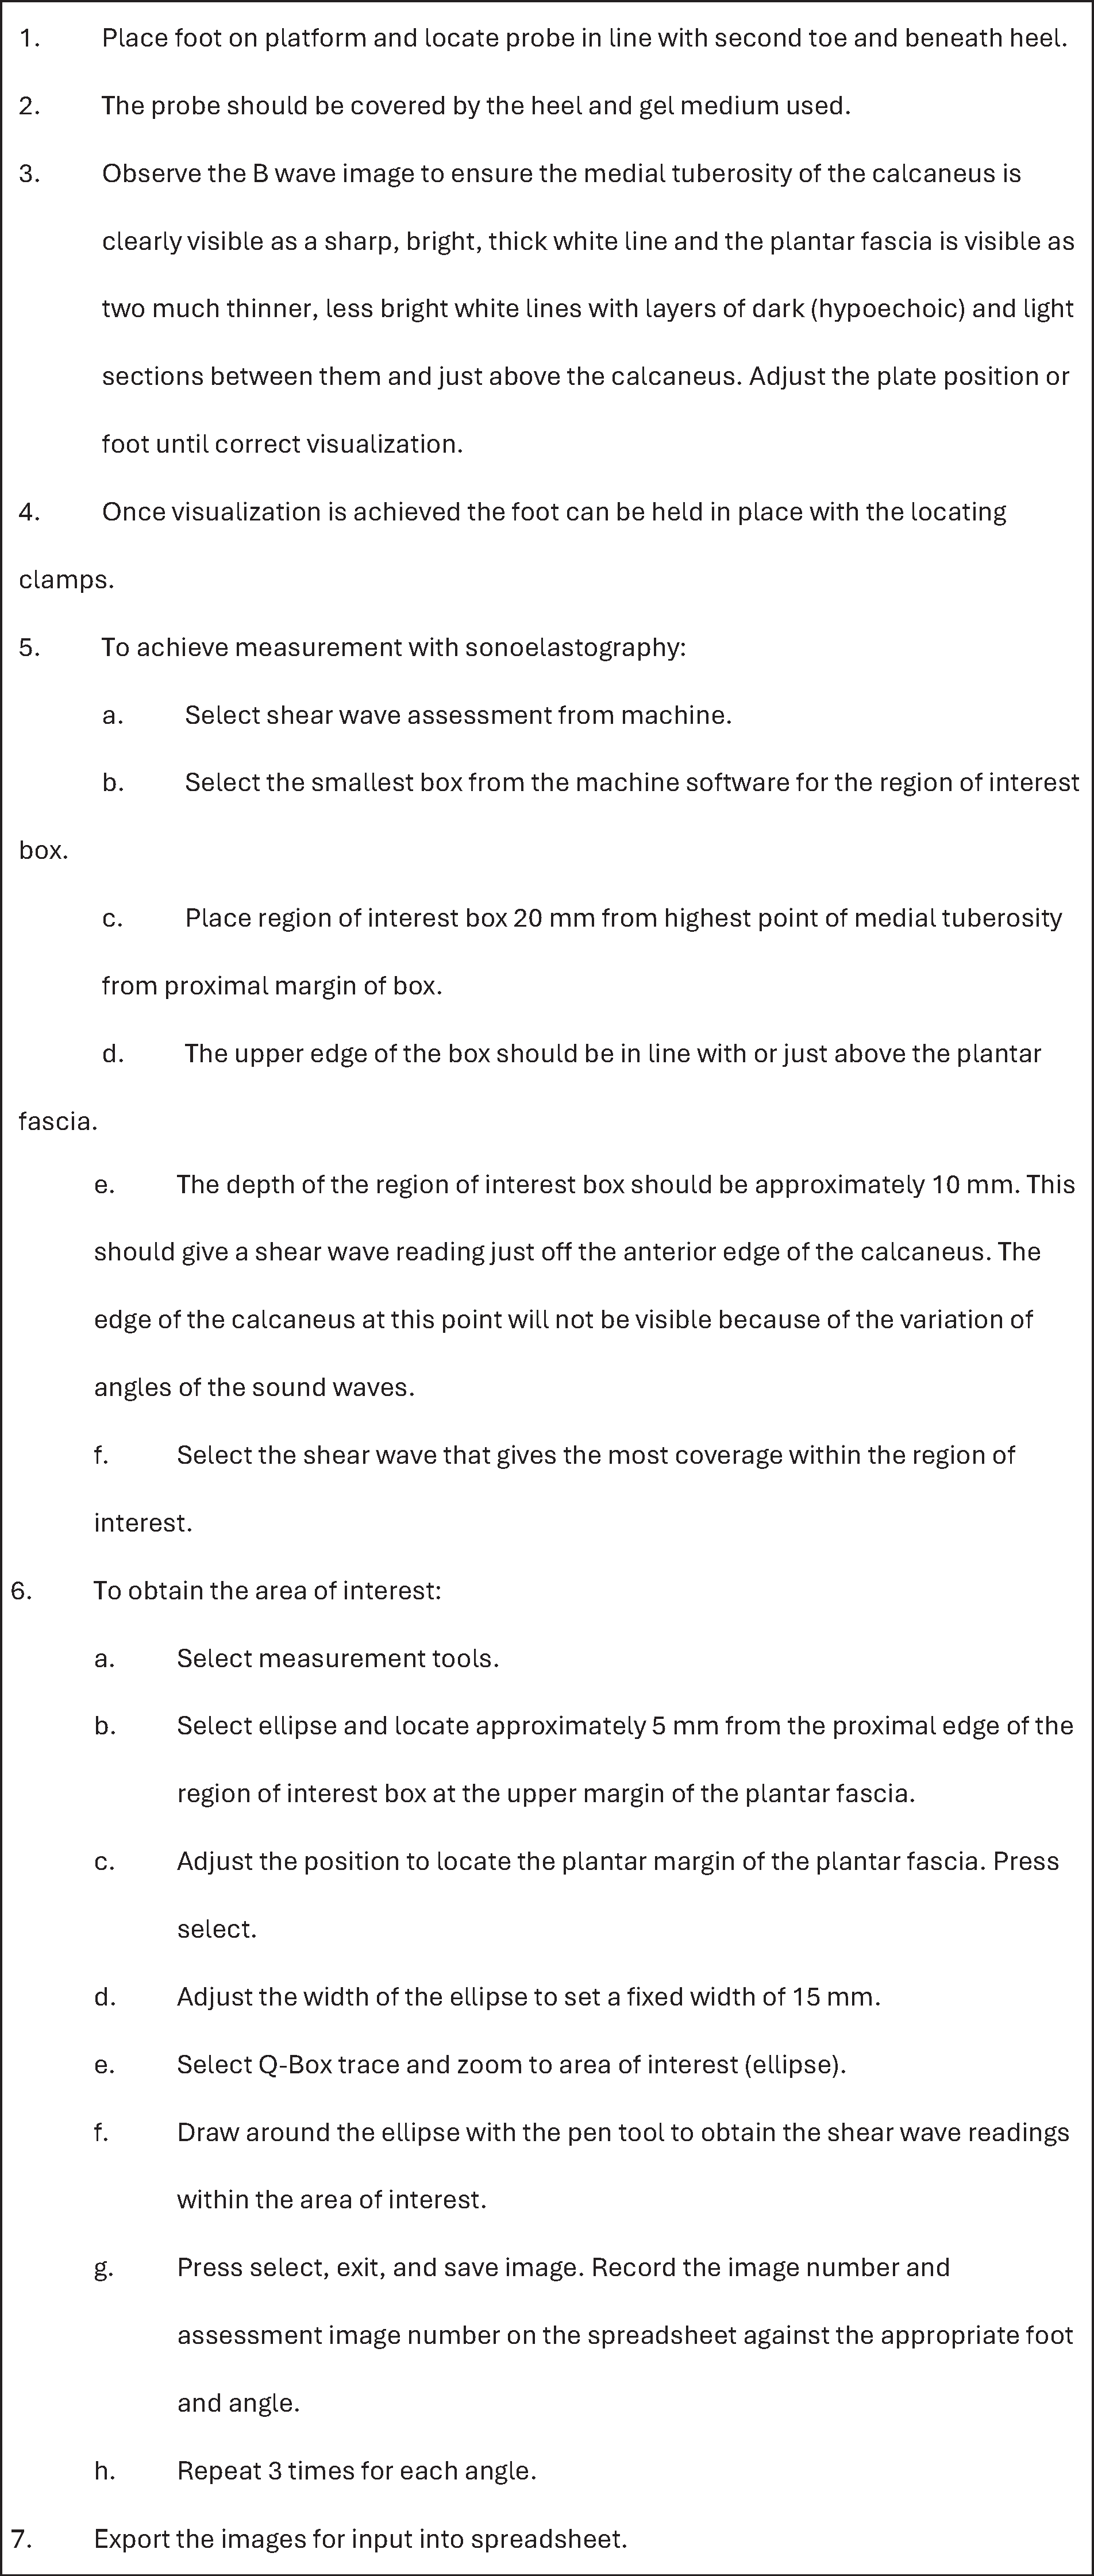
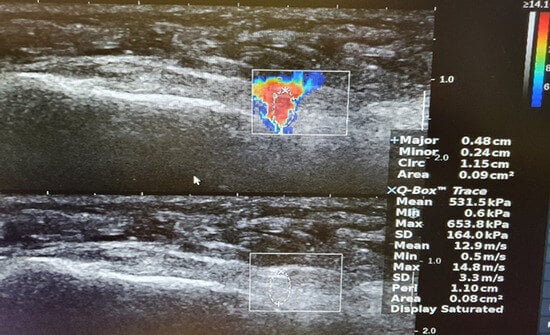
Figure 2.
Holder and probe in situ.
The three-dimensional printed probe holder was created using springs made from thermoplastic polyurethane, which were attached at each end with threaded bolts. This design enabled the probe to travel in the sagittal plane based on the weight applied to it while preventing the body mass index from affecting the reactive force from a fixed probe. The platform also had a support for the opposite foot and a step and frame for safe approach. This configuration allowed the probe to be adjusted at a parallel angle to the foot’s longitudinal axis, which provided better B-wave visualization of the plantar fascia. The foot was placed on the platform in a manner that covered the probe, and the platform was rotated in the transverse plane to align with the participant’s normal angle and base of gait. The probe was also rotated in the transverse plane to align with the medial tuberosity and the second toe to ensure accurate visualization of the plantar fascia (Figure 1). An ultrasound medium was applied to the probe.
The apex of the calcaneus was used as the reference landmark for placing the foot on the probe, which allowed B-wave visualization of the plantar fascia. The Aixplorer ultrasound machine was set up following the assessment protocol (Figure 1) to ensure good visualization and assessment.
To measure the thickness of the plantar fascia, we selected the point closest to its insertion into the calcaneus, where the inferior surface began to move superiorly, a position loosely described in previous studies [22,23]. For sonoelastographic measurement, the area of interest was identified by allowing the participant to stabilize on the platform with their arms by their side, and the sonographic assessment protocol was used to develop an overall region of interest before selecting the area of interest. The shear wave penetration depth was set at maximum for the foot and ankle measurement.
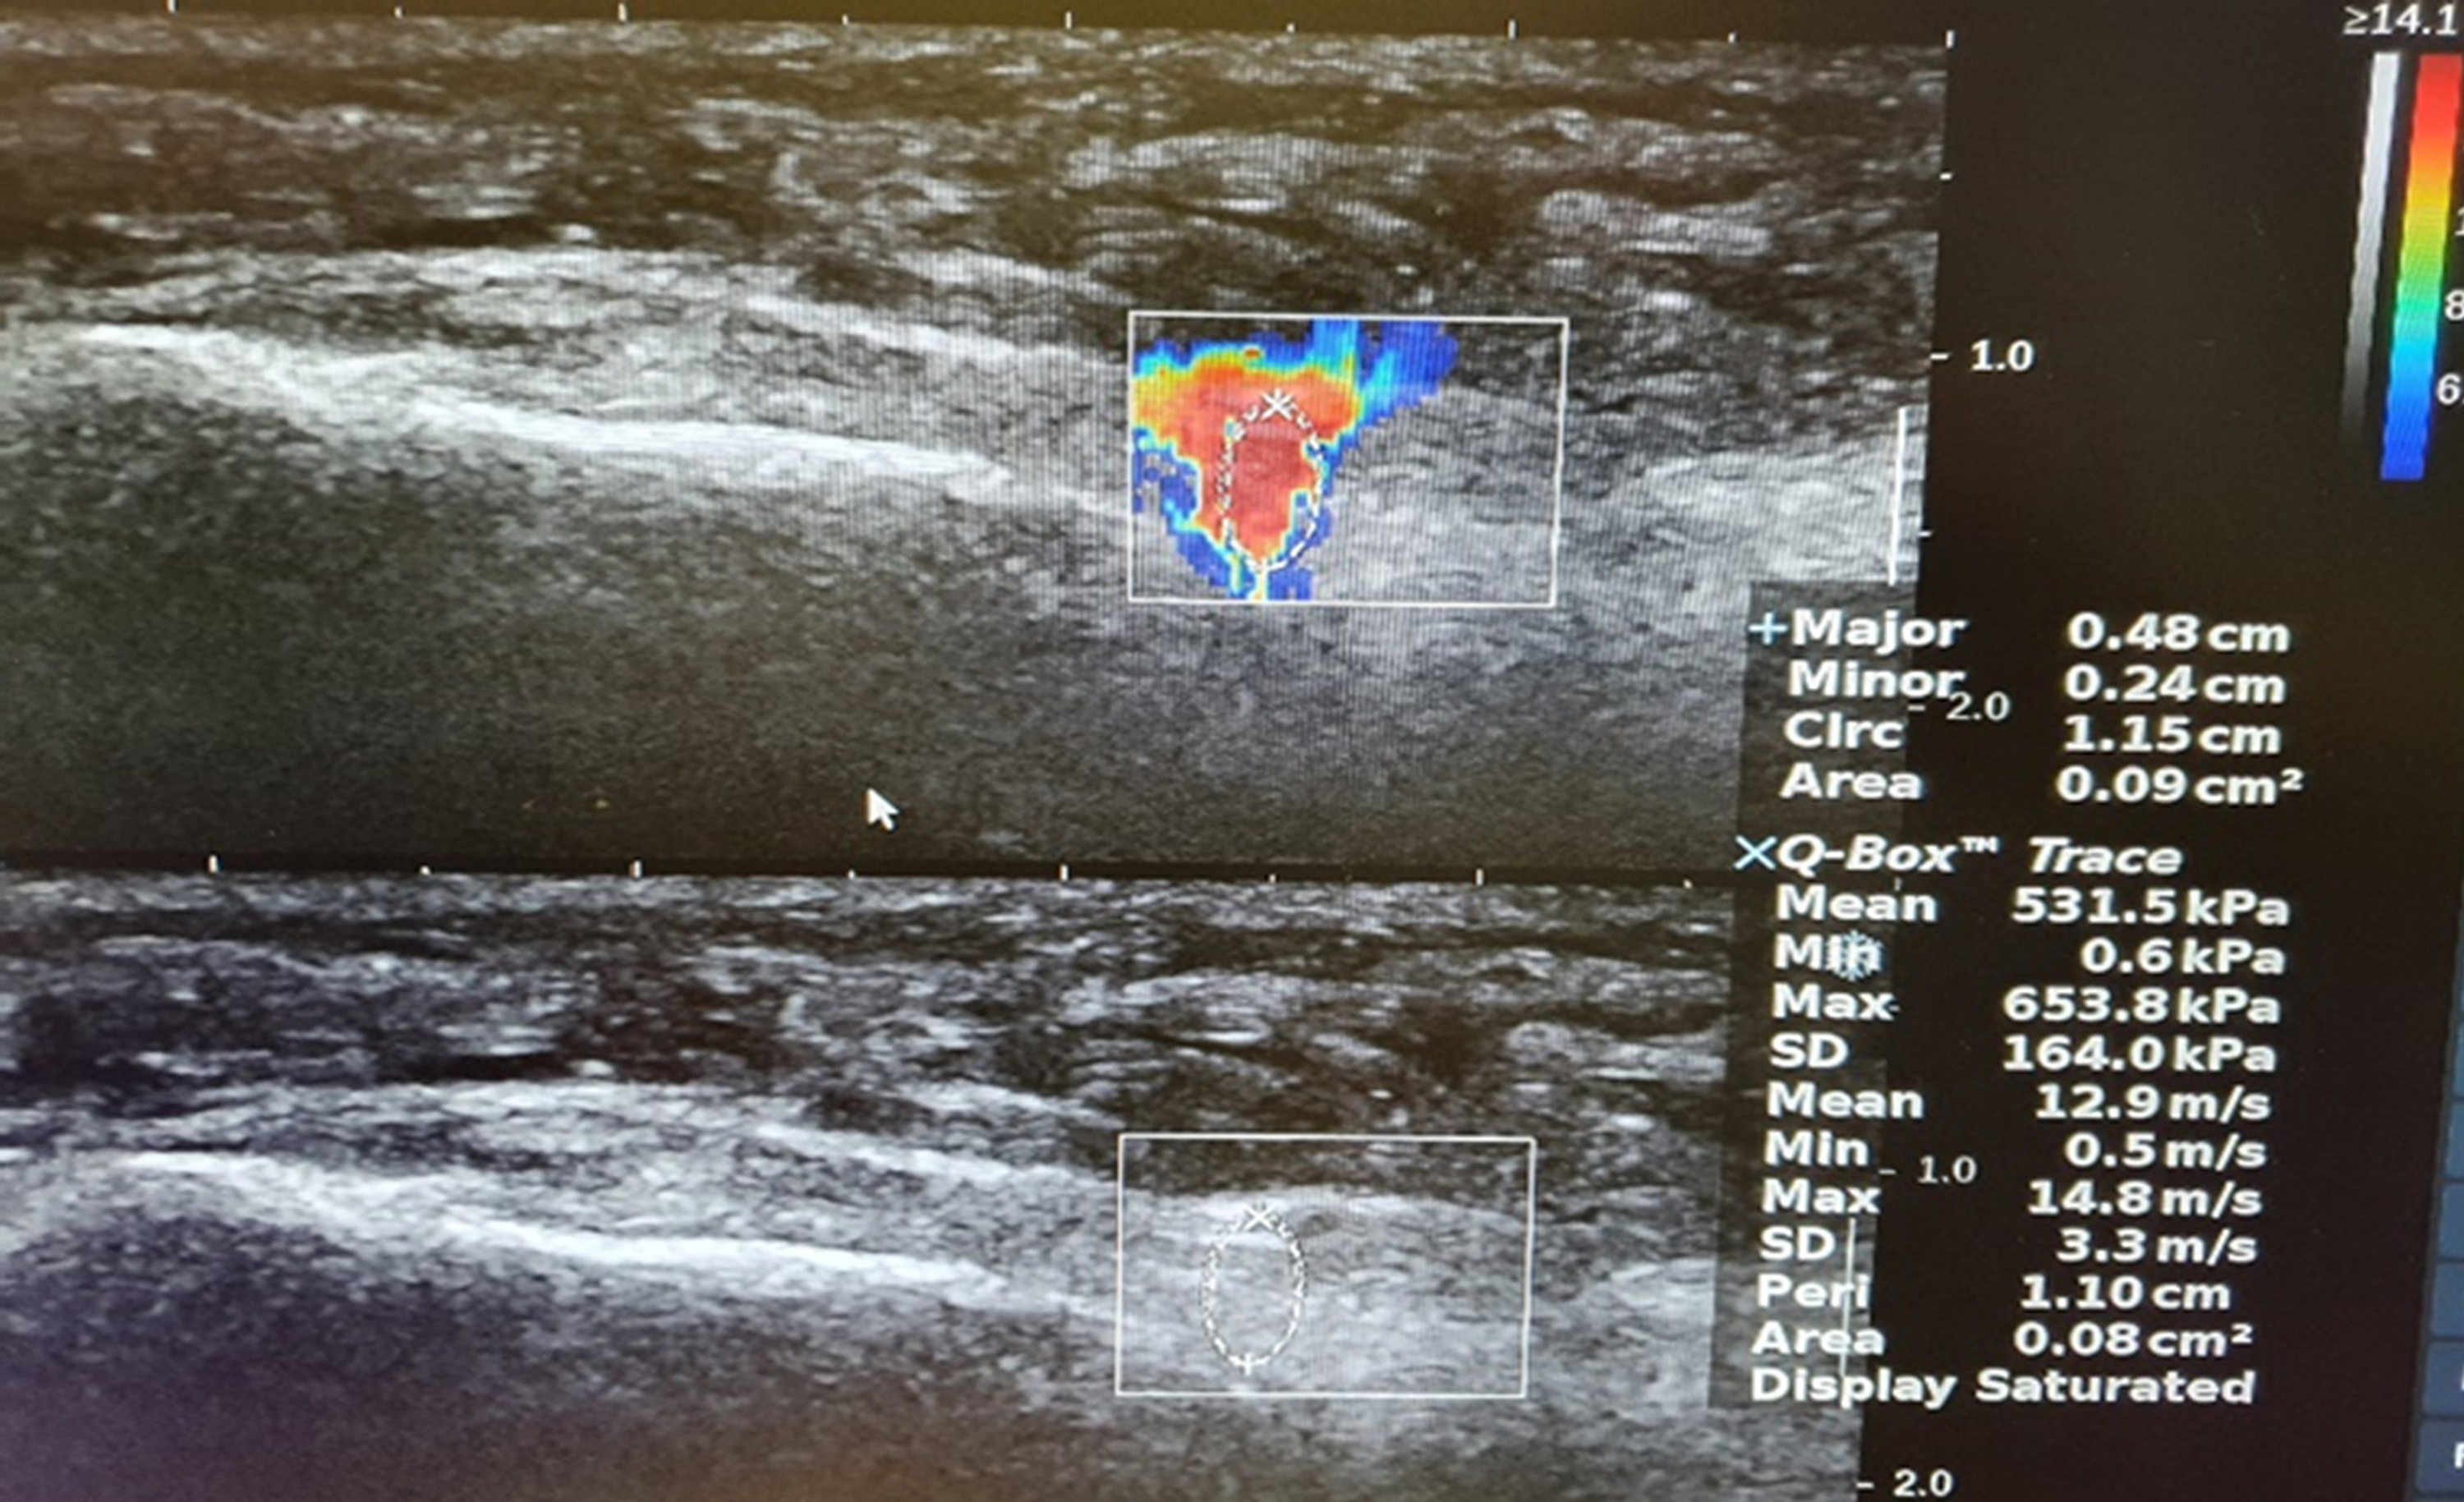
After successful visualization of the plantar fascia, the foot was secured using the side and rear locating clamps (Figure 2). The region of interest was then established by identifying the superficial and deep boundaries of the plantar fascia and selecting the smallest available box positioned at approximately 20 mm from the highest point of the medial tuberosity to the proximal margin of the ellipse (Figure 3). The upper edge of the box was aligned just above the plantar fascia and the depth was set to encompass the thickness of the plantar fascia, providing an ultrasound shear wave measurement just anterior to the calcaneus.
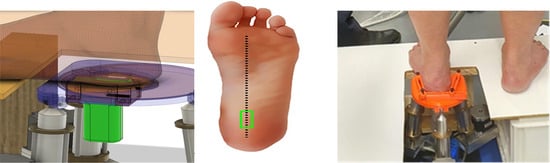
Figure 3.
Image obtained from the closed-chain assessment of the probe.
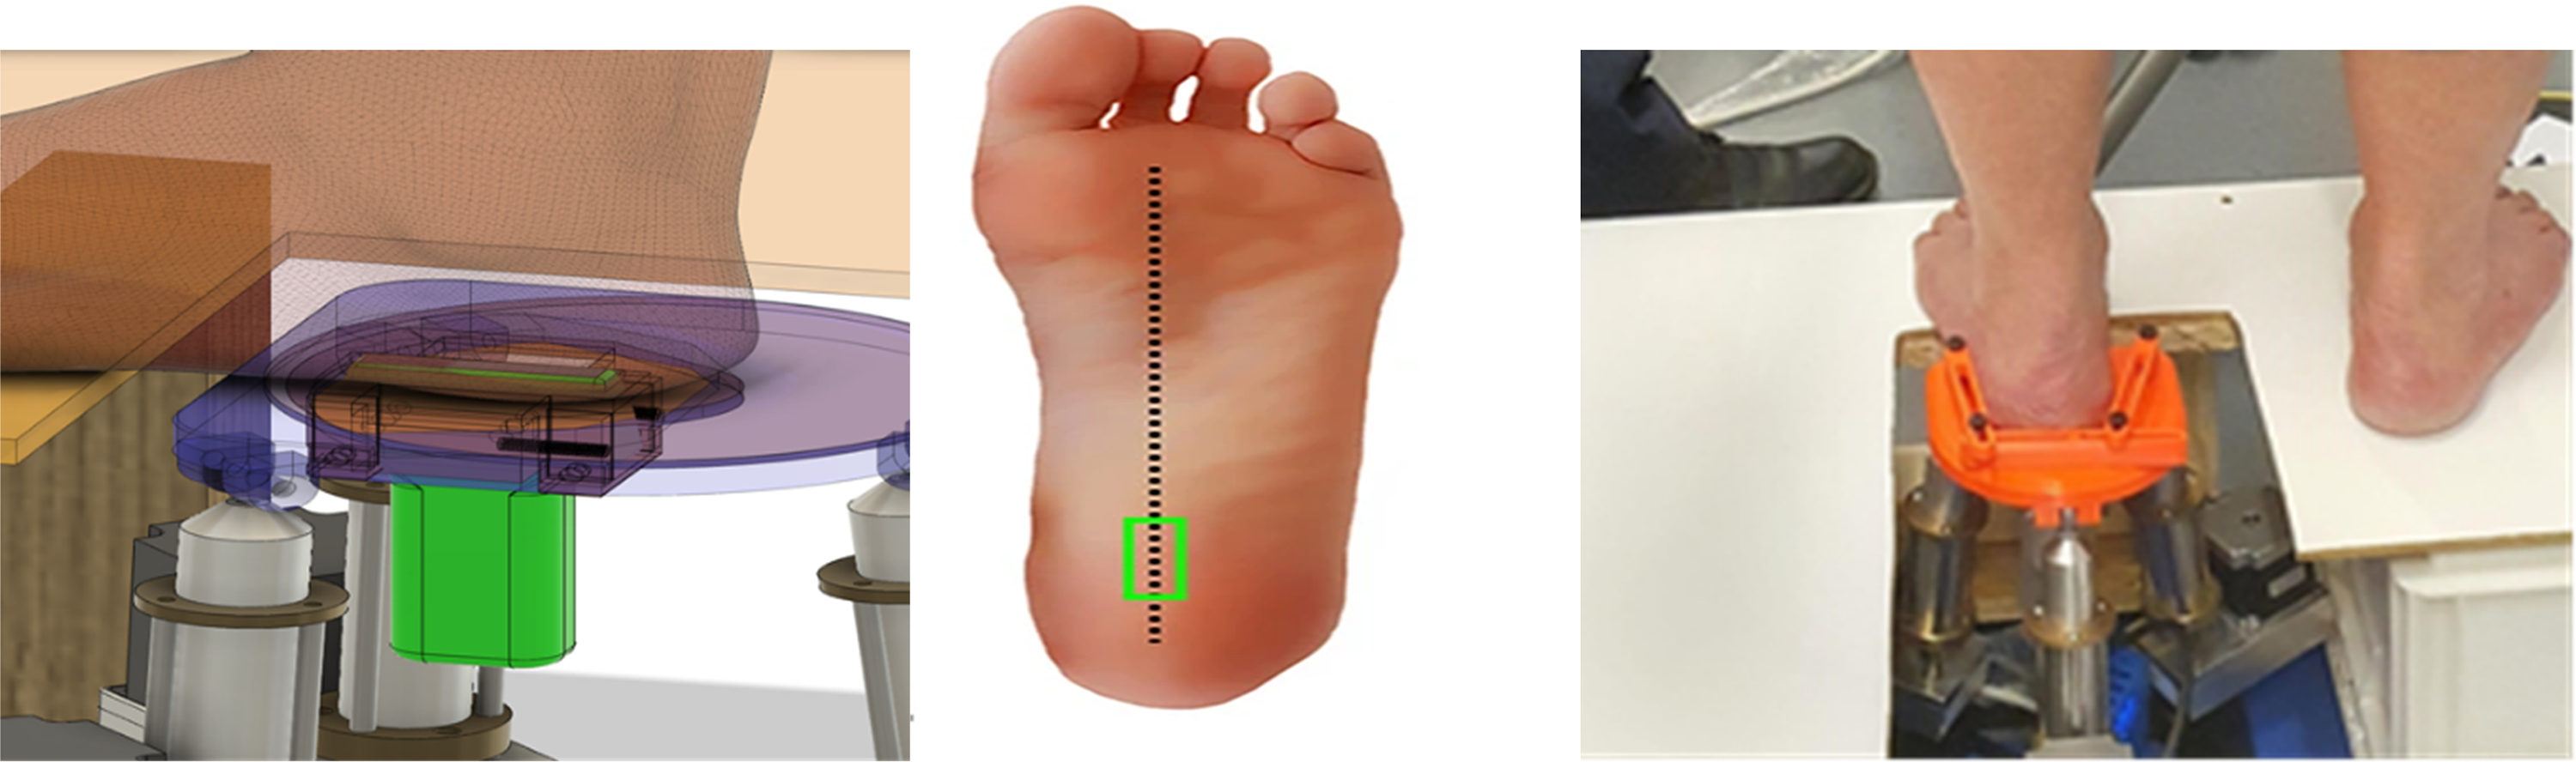
Establishing the area of interest for analysis involved using the shear wave display to identify the rectangular selection box with the most comprehensive coverage and freezing the frame. The ellipse facility was then used in the B-wave scan to set the height and length of the area, with a Q-Box trace manually performed by tracing over the ellipse using the pen tool provided. This produced an area suitable for comparative analysis (Figure 3).
To evaluate the protocol, one frame was randomly selected and assessed five times and one clip consisting of multiple frames was randomly selected, with five different frames assessed. Data were also collected for 13 participants (26 feet) for PFT and PFS using the protocol.
The sample group comprised 11 male and two female participants with an age range of 20 to 67 years (mean ± SD, 35.62 ± 15.04 years). The body mass index was calculated for each participant, with a range of 22 to 42 kg/m2 (mean ± SD, 30.31 ± 6.22 kg/m2).
A two-step cluster analysis was also performed to assess the relationship between PFT and PFS. Two-step cluster analysis uses an algorithm that identifies groups of cases that exhibit similar response patterns to several variables [24]. The data are initially allocated to smaller clusters (preclustering) before grouping them into larger similar clusters (hierarchical) while still employing the Bayesian information criterion.
In this study, two-step clustering was selected as it was considered the most reliable for the number of subgroups detected, classification probability of individuals to subgroups, and reproducibility of findings [25]. However, cluster analysis has its limitations, and the various cluster methods can produce different results based on the criterion for the merging of clusters. In addition, the hierarchical nature of the analysis method means that “judgments” made at the start of the process cannot be rectified and may influence the outcomes.
Results
Assessment of Technique
One Frame.
One random frame was analyzed five times to assess for repeatability of the assessment technique of the researcher. This assessed the area of selection and traceability of the Q-Box. The results obtained are summarized in Table 1.

Table 1.
Five Assessments of One Frame
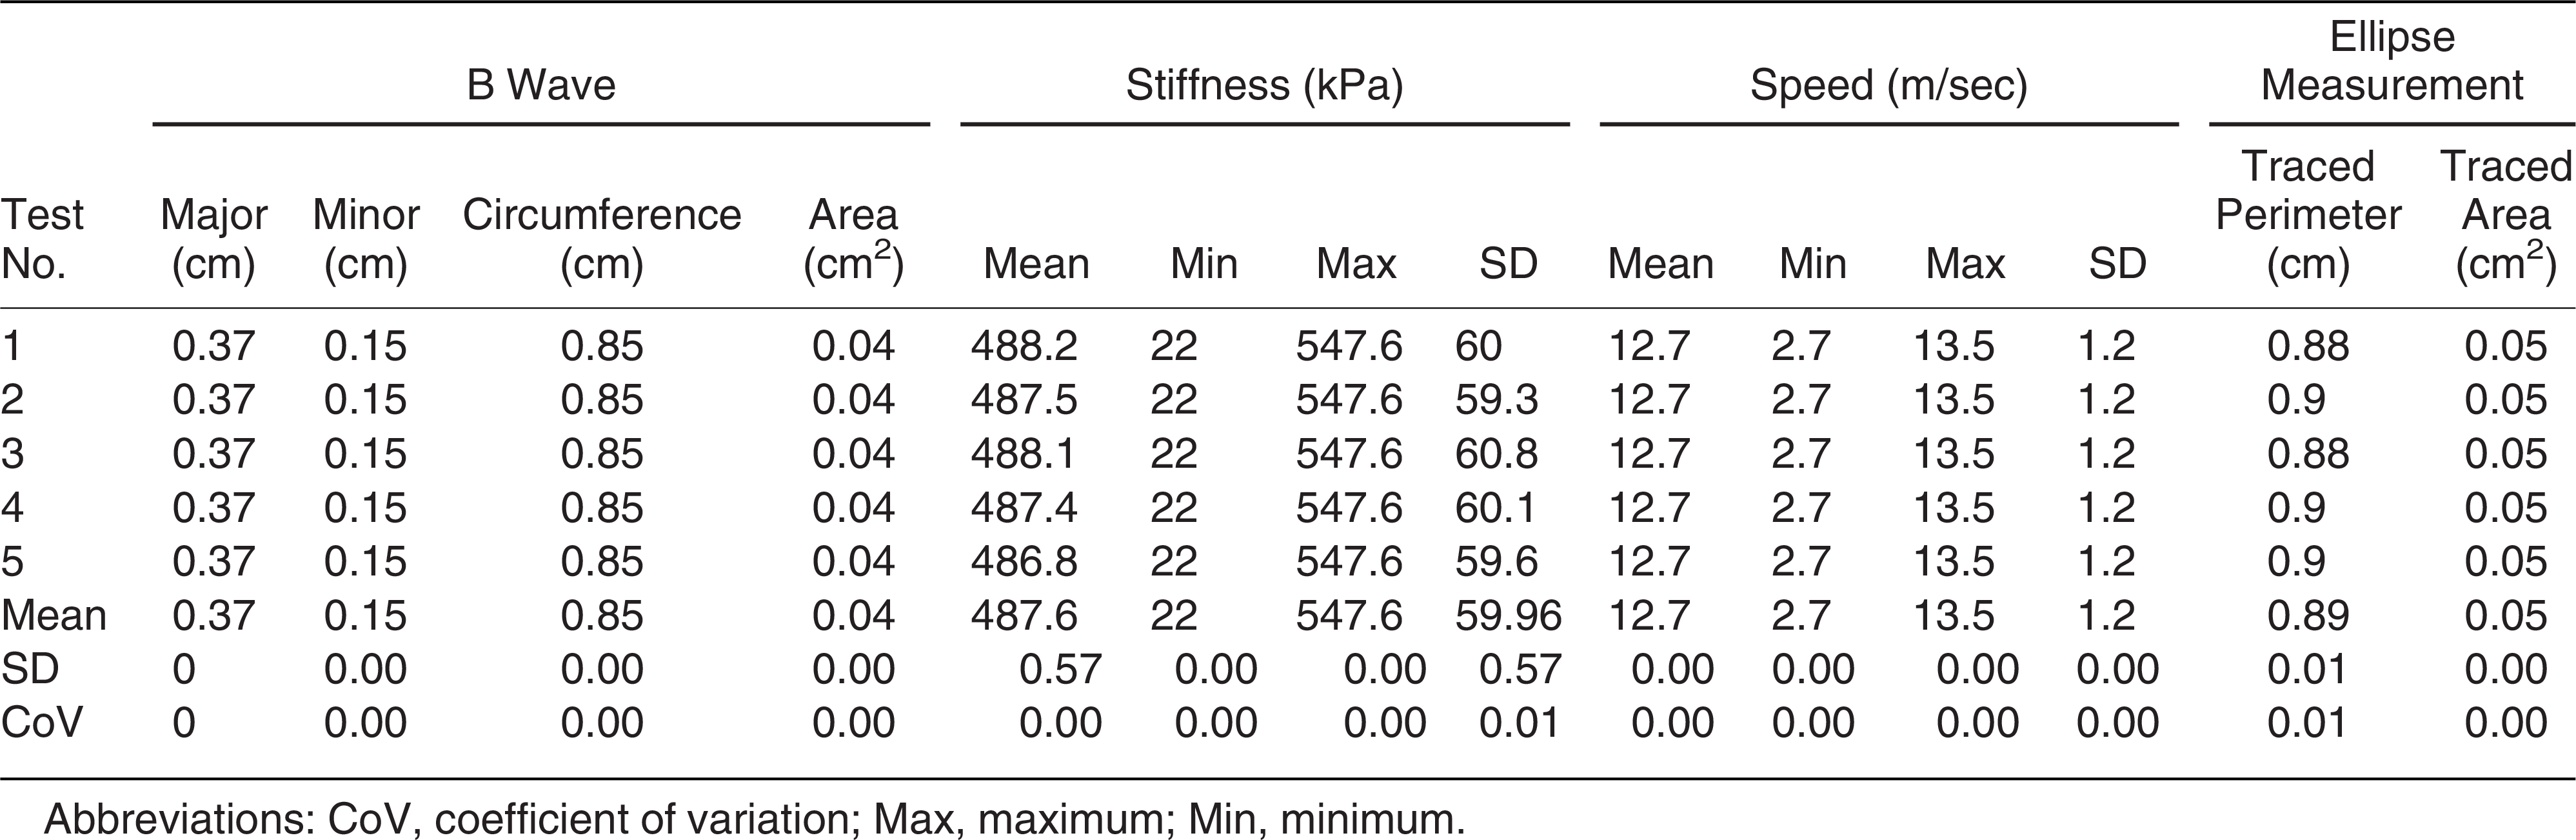
The one-frame analysis of PFT gave a consistent major measurement of 0.37 cm with an SD and coefficient of variation (CV) of 0.00. The one-frame analysis of PFS gave a consistent minimum and maximum of 22 and 547.6 kPa, respectively, with a mean PFS of 487.6 kPa (SD, 0.57) and CV of 0.00 to 0.01.
One Clip With Five Consecutive Frames.
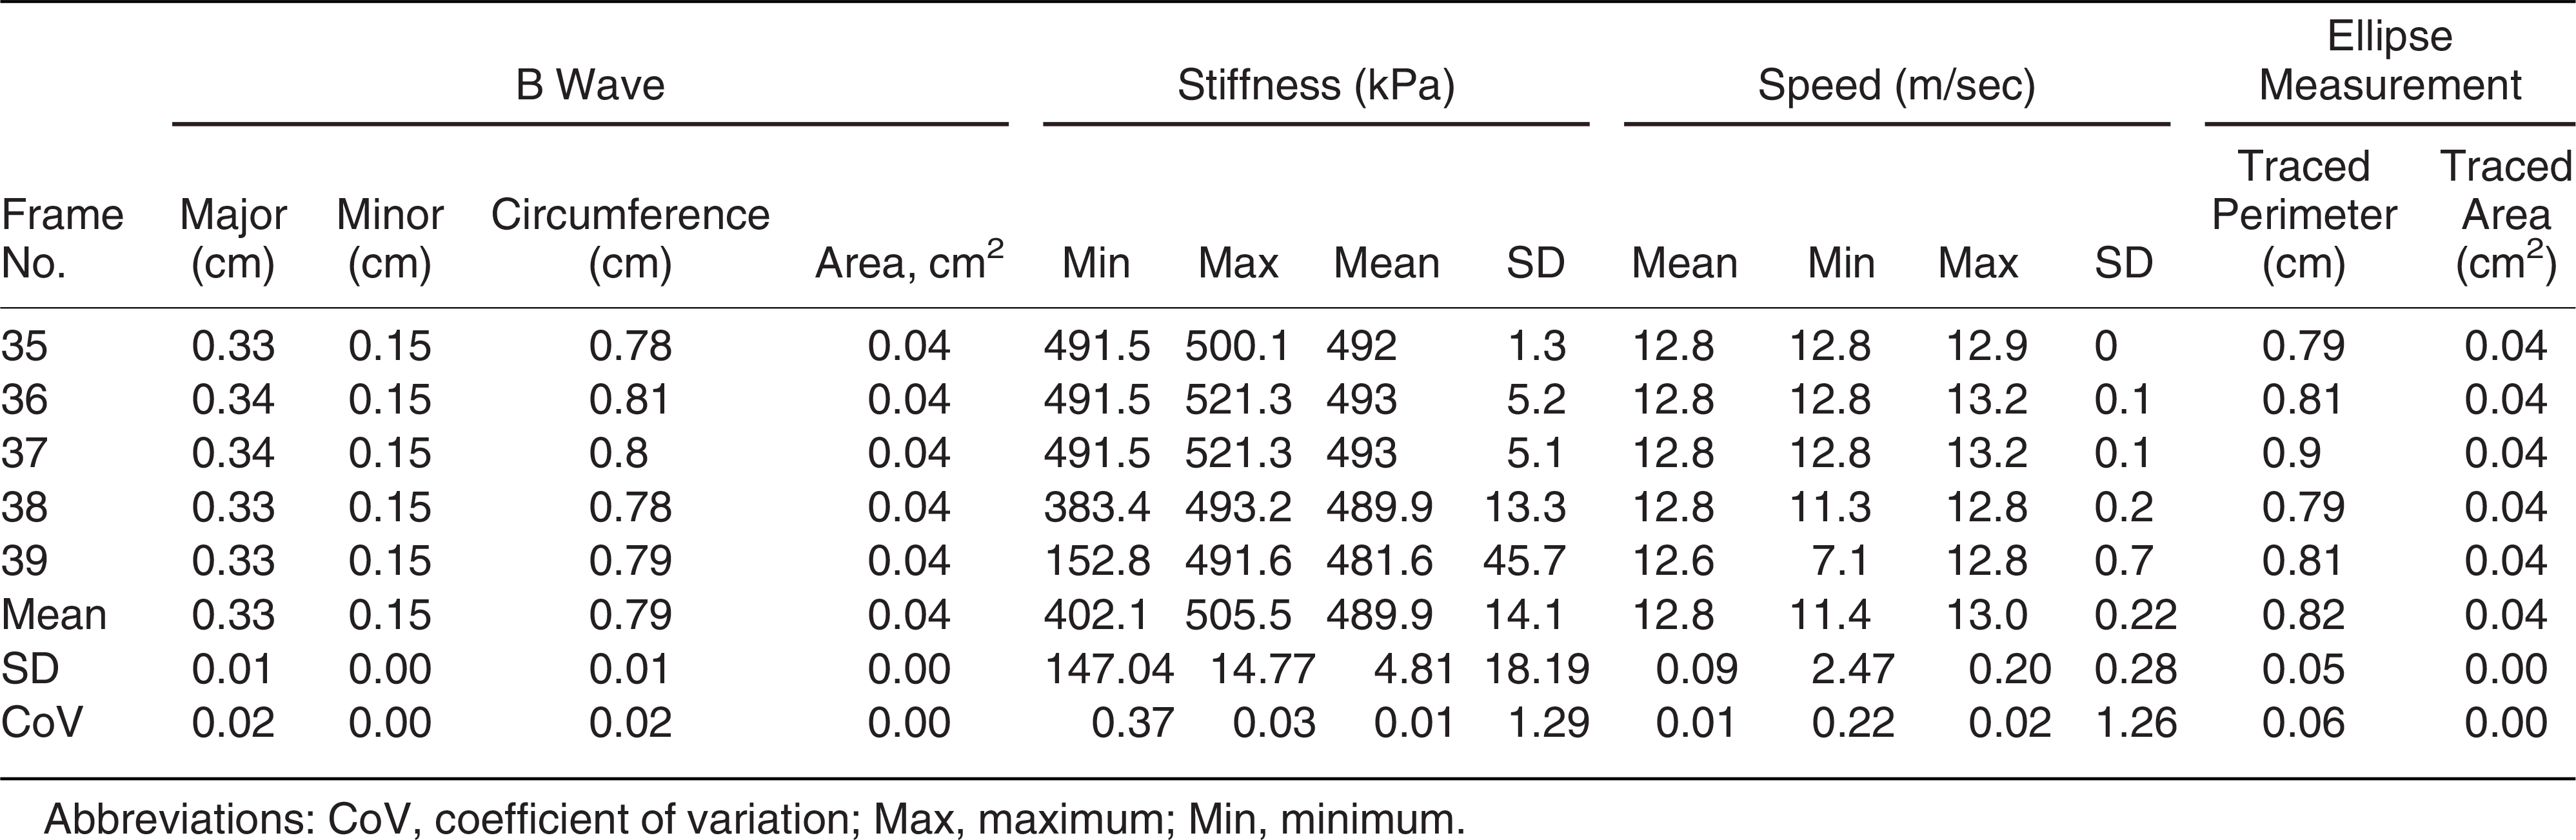
The results for the assessment of one clip with five consecutive frames are summarized in Table 2. The one-clip, five-frame analysis of PFT gave a major measurement of 0.33 to 0.34 cm (mean ± SD, 0.33 ± 0.01 cm) and CV of 0.02. The one-clip, five-frame analysis of PFS gave a minimum range of 152.8 to 491.5 kPa (mean ± SD, 402.1 ± 147.04 kPa) and maximum range of 491.6 to 521.30 kPa (mean ± SD, 505.5 ± 14.77 kPa) and CV of 0.01.
Table 2.
Assessment of One Clip with Five Consecutive Frames
Participant Results
The PFT and PFS results for the 13 participants in Table 3.
Table 3.
Averaged Results from Participants

Traceability
The circumference of the ellipse is the measurement created by the production of the oval used by the ellipse facility. This oval needs to be traced as part of the protocol, and the resultant value is the traced perimeter column given in the tables. This represents the traceability technique given in the protocol. Using SPSS Statistics 27 (IBM, Armonk, New York), a paired sample correlation test was performed to assess the traceability of the area of interest and the perimeter, which gave a correlation of 0.99 (N = 26, P < .001).
Relationship Between PFT and PFS
The mean PFT and PFS for each participant were also compared to assess the relationship between PFT and PFS. As the foot position was not controlled, a parametric analysis was not performed. However, a two-step cluster analysis showed good cluster quality with a cohesion and separation value of 0.6, with two clusters of 46.2% and 53.8% and predictor importance of PFT = 1.0 and PFS = 0.92 (Fig. 4). Within the clusters, group 1 showed a correlation coefficient of 0.83 and group 2 showed a correlation coefficient of 0.98, with an increased PFT giving an increased PFS. Within cluster 1, the mean ± SD (range) PFT was 0.32 ± 0.05 (0.2–0.39) and the mean ± SD (range) PFS was 419.13 ± 141.67 (254.37–764.73 kPa). Within cluster 2, the mean ± SD (range) PFT was 0.39 ± 0.03 (0.33–0.42 cm) and the mean ± SD (range) PFS was 609.57 ± 62.73 (530.47–718.90 kPa).
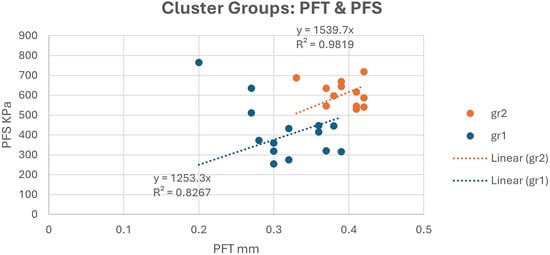
Figure 4.
Comparison of plantar fascia thickness (PFT) and plantar fascia stiffness (PFS) within the two cluster groups.
Discussion
The use of ultrasound in the assessment of the plantar fascia has been the subject of various studies and several comprehensive systematic reviews, and it has been concluded that it is an accurate and reliable technique for assessing the thickness of the plantar fascia [22,23]. It was therefore appropriate for use in this study. However, no research studies provided a formal protocol for the evaluation of the plantar fascia. Indeed, a formal reference point or protocol for measuring the plantar fascia was not given in any of the studies referenced in the systematic reviews, with only vague references to the “site of calcaneal insertion” or the “insertion” of the plantar fascia. The position of the patient and the foot was also quite variable (prone and supine, foot dorsiflexed and plantarflexed, toes in specified and unspecified positions). There were also no weightbearing studies of the plantar fascia identified.
The weightbearing protocol used in this study demonstrated that there was high repeatability, with minor variation, in repeated one-frame analysis, with a very low CV for both PTF and PFS. The one-clip analysis of five frames also demonstrated good consistency and minor variation for PFT, whereas PFS had minor variation because of an outlier in frame 39 (Table 2), which weakened the CV. This would suggest that the PFT is less sensitive to micromovements of the foot, whereas the PFS or speed of the sound waves is more sensitive to movement or body sway. However, the assessment of micromovements of the foot was outside the scope of this study.
The main instrument of this protocol is the production of a copy of the ellipse created by the device software (traceability), and this was assessed by comparing the circumference of the ellipse with the traced perimeter, which had a significant correlation of 0.99 (N = 26, P < .001), indicating high repeatability. Furthermore, the plantar fascia has been shown to have a unique structure and function, which can be influenced by the position or function of the foot. However, the function of the foot is complicated, and previous studies have assessed only the foot indices or provided poor standardized foot control or position when investigating plantar fascia responses. Furthermore, previous studies assessed all of the responses of the plantar fascia using various ultrasound protocols employing nonweightbearing assessments. The clinical implication of this protocol is a standardized assessment and measurement process of the PFT and PFS that removes a number of variables that may affect diagnosis of heel pain conditions.
In this study, the relationship between the PFT and PFS was assessed. Several authors have suggested that the PFT and PFS are linked to foot function [26,27] and, specifically, that frontal plane movement of the rearfoot (inversion and eversion component of pronation) is indirectly related to the PFS [28]. As the feet in this study were in the relaxed calcaneal position and therefore invariable everted (pronated) or inverted (supinated) positions, it was felt that no direct parametric comparison could be made. However, a cluster analysis showed that the feet in this study fell strongly into two groups, and within the groups there was a strong correlation between the PFT and PFS, with increased PFS with increased PFT (Figure 4). Further research using this protocol could assess the reaction of the plantar fascia to changes in lower limb mechanics and create a better understanding of complex heel pain conditions.
The ability to reliably perform a closed-chain ultrasound assessment of the plantar fascia was a noteworthy achievement, and no evidence of this being performed before could be found in the literature. The protocol developed for the study shows high internal validity based on the testing of the data collected and is recommended for consideration in future studies of the plantar fascia given that it offers a repeatable and standardized process for assessment of the weightbearing plantar fascia.
Financial Disclosure: None reported.
Conflict of Interest: The device used in the study was developed by Mark Price, and Thomas Mychost is the chief technical officer for the company that provided it.
References
- Cole C, Seto C, Gazewood J: Plantar fasciitis: evidence-based review of diagnosis and therapy. Am Fam Physician 72: 2237, 2006.
- Chen D, Li B, Aubeeluck A, et al: Anatomy and biomechanical properties of the plantar aponeurosis: a cadaveric study. PLoS One 9: e84347, 2014.
- Aquino A, Payne C: Function of the plantar fascia. Foot (Edinb) 9: 73, 1999.
- Huang CK, Kitaoka HB, An KN, et al: Biomechanical evaluation of longitudinal arch stability. Foot Ankle 14: 353, 1993.
- Neufeld SK, Cerrato R: Plantar fasciitis: evaluation and treatment. J Am Acad Orthop Surg 16: 338, 2008.
- Riddle DL, Schappert SM: Volume of ambulatory care visits and patterns of care for patients diagnosed with plantar fasciitis: a national study of medical doctors. Foot Ankle Int 25: 303, 2004.
- Menz H, Jordan K, Roddy E, et al: Characteristics of primary care consultations for musculoskeletal foot and ankle problems in the UK. Rheumatology (Oxford) 49: 1391, 2010.
- Thomas MJ, Whittle R, Menz HB, et al: Plantar heel pain in middle-aged and older adults: population prevalence, associations with health status and lifestyle factors, and frequency of healthcare use. BMC Musculoskelet Disord 20: 337, 2019.
- Taş S, Bek N: Effects of morphological and mechanical properties of plantar fascia and heel pad on balance performance in asymptomatic females. Foot (Edinb) 36: 30, 2018.
- Cardinal E, Lafortune M, Burns P: Power Doppler US in synovitis: reality or artifact? Radiology 200: 868, 1996.
- Sabir N, Demirlenk S, Yagci B, et al: Clinical utility of sonography in diagnosing plantar fasciitis. J Ultrasound Med 24: 1041, 2005.
- McNally E, Shetty S: Plantar fascia: imaging diagnosis and guided treatment. Semin Musculoskelet Radiol 14: 334, 2010.
- Baur D, Schwabl C, Kremser C, et al: Shear wave elastography of the plantar fascia: comparison between patients with plantar fasciitis and healthy control subjects. J Clin Med 10: 2351, 2021.
- Winn N, Lalam R, Cassar-Pullicino V: Sonoelastography in the musculoskeletal system: current role and future directions. World J Radiol 8: 868, 2016.
- Eby SF, Song P, Chen S, et al: Validation of shear wave elastography in skeletal muscle. J Biomech 46: 2381, 2013.
- Gennisson JL, Deffieux T, Macé E, et al: Viscoelastic and anisotropic mechanical properties of in vivo muscle tissue assessed by supersonic shear imaging. Ultrasound Med Biol 36: 789, 2010.
- Almutairi FF, Abdeen R, Alyami J, et al: Effect of depth on ultrasound point shear wave elastography in an elasticity phantom. Appl Sci 12: 6295, 2022.
- Belhan O, Kaya M, Gurger M: The thickness of heel fat-pad in patients with plantar fasciitis. Acta Orthop Traumatol Turc 53: 463, 2019.
- Ostermann S, Olesen JL, Holden S, et al: Stretching and relaxing the plantar fascia may change plantar fascia thickness but not pressure pain thresholds: a cross-sectional study of patients with plantar fasciopathy. BMC Musculoskelet Disord 21: 804, 2020.
- Granado MJ, Lohman EB, Daher NS, et al: Effect of gender, toe extension position, and plantar fasciitis on plantar fascia thickness. Foot Ankle Int 40: 439, 2019.
- van Leeuwen KDB, Rogers J, Winzenberg T, et al: Higher body mass index is associated with plantar fasciopathy/‘plantar fasciitis’: systematic review and meta-analysis of various clinical and imaging risk factors. Br J Sports Med 50: 972, 2016.
- Mohseni-Bandpei MA, Nakhaee M, Mousavi ME, et al: Application of ultrasound in the assessment of plantar fascia in patients with plantar fasciitis: a systematic review. Ultrasound Med Biol 40: 1737, 2014.
- Radwan A, Wyland M, Applequist L, et al: Ultrasonography, an effective tool in diagnosing plantar fasciitis: a systematic review of diagnostic trials. Int J Sports Phys Ther 11: 663, 2016.
- Horn B, Huang W: Comparison of segmentation approaches. Available at: https://citeseerx.ist.psu.edu/document?repid=rep1&type=pdf&doi=37746b0eff6967cd64d4e6a8528f72744235194c. Accessed March 24, 2022.
- Benassi M, Garofalo S, Ambrosini F, et al: Using two-step cluster analysis and latent class cluster analysis to classify the cognitive heterogeneity of cross-diagnostic psychiatric inpatients. Front Psychol 11: 1085, 2020.
- Granado MJ, Lohman E, Gordon K, et al: Metatarsophalangeal joint extension changes ultrasound measurements for plantar fascia thickness. J Foot Ankle Res 11: 20, 2018.
- Wearing SC, Smeathers JE, Sullivan PM, et al: Plantar fasciitis: are pain and fascial thickness associated with arch shape and loading? Phys Ther 87: 1002, 2007.
- Lee SY, Hertel J, Lee SC: Rearfoot eversion has indirect effects on plantar fascia tension by changing the amount of arch collapse. Foot (Edinb) 20: 64, 2010.
© 2025 American Podiatric Medical Association