


Abstract
Objective: Computed tomography (CT) is superior to plain radiography for evaluating ankle syndesmosis, but anatomical variations can affect the measurements. This study aimed to assess the radiologic parameters of the incisura fibularis and the factors that could affect these parameters. Materials and Methods: Lower-extremity CT angiography images were used to evaluate the morphology of the incisura fibularis, anterior and posterior tibiofibular distance, longitudinal and transverse length of the distal fibula, length and depth of the incisura fibularis notch, tibiofibular clear space, tibiofibular overlap, and fibular rotation. Each measured parameter was compared based on sex and body side. Also, the effect of age, height, weight, and body mass index (BMI) on parameters was evaluated. Results: A total of 123 patients (83 men and 40 women) were included, and 246 ankles were measured. The CT measurements demonstrated excellent intraobserver and interobserver reliability. No statistically significant sex or side differences were found in tibiofibular overlap (TFO) and tibiofibular clear space, the most-used parameters in radiographs. Age, weight, and BMI were found to be correlated with TFO. Conclusions: The present study provides CT measurements of the normal tibiofibular syndesmosis in the Turkish population. Also, the correlations of the parameters with age, height, weight, and BMI are presented. Therefore, TFO and tibiofibular clear space of the uninjured side can be used to plan the treatment of ankle injuries.
Ankle fractures are among the most common injuries in orthopedic trauma, and 11% to 13% of these fractures include the distal tibiofibular joint and the syndesmotic ligament complex [1,2,3,4]. Syndesmosis should be reduced to achieve an excellent clinical outcome and avoid post-traumatic arthritis [2,3,5,6]. The anatomical reduction of the distal tibiofibular joint required for better functional results cannot be achieved via a closed reduction of up to 52% [6,7]. The congruity of the ankle is affected in syndesmotic injuries. The incongruity of the joint increases the stress forces in the joint and decreases the contact area of the joint, which leads to degenerative changes and chronic instability [8,9,10].
Diagnosis of syndesmotic injuries can be made by some clinical findings and stress tests (tenderness in palpation, bruising, squeeze test, Frick test, Cotton test). However, sensitivity and specificity are low [1,2]. Although the alignment of the joint cannot be evaluated under physiologic loads on plain radiographs, routine radiologic evaluation includes plain radiographs. Tibiofibular clear space (TFCS) and tibiofibular overlap (TFO) are the most-used parameters to evaluate syndesmotic injuries on radiographs [11,12,13]. However, plain radiographs cannot determine subtle injuries and are also affected by the position [3,13,14,15]. The advantage of obtaining an axial view highlighted the role of computed tomography (CT) in diagnosing and treating ankle fractures. Also, the effect of the position of the ankle during radiologic evaluation is minimal in CT [14]. Wide anatomical variations of distal tibiofibular joint and ankle anatomy can make the diagnosis of ankle injuries complex and affect the treatment plan [3,16]. Although the anatomy of distal tibiofibular syndesmosis in dry bones and with magnetic resonance imaging (MRI) in sprains was studied, the morphology of syndesmosis in the Turkish population has yet to be investigated [17,18,19,20].
This study aimed to determine the radiologic measurements of distal tibiofibular syndesmosis from CT images of normal ankles in the Turkish population. We used CT angiography images of patients without acute or previous ankle injuries.
Materials and Methods
This retrospective study was conducted with the approval of the Gülhane Training and Research Hospital Ethics Committee (no: 2022/87). This study used lower-extremity CT angiography images taken for any reason except trauma between January 1, 2020, and March 31, 2022. Patients with new or previous fractures in the lower extremities, those with deformity-acquired or congenital malformation, and those with systemic inflammatory disease were excluded.
Lower-extremity CT angiography images were obtained from a 320-row CT scanner (Aquilion One; Canon Medical Systems Corp, Tustin, California). The CT data acquisition was performed with the following technical parameters: 100 to 120 kV, 50 to 500 mA, 0.3-sec rotation time, matrix size 512×512, pitch 0.8, and section thickness 0.5 mm. For analysis, studies were transferred into DICOM viewer software (RadiAnt DICOM Viewer 1.1; Medixant, Poznan, Poland). The images were reviewed using the bone window setting (window level: 500 Hounsfield units [HU], window width: 3,600 HU). Measurements were made 1 cm proximal to the ankle joint line, which was determined as the location of the syndesmosis in previous studies. Images parallel to the plafond in neutral rotation were reformatted to produce a standard axial CT scan. Neutral rotation was defined by the bimalleolar axis [3,17,21]. In addition, age, height, and weight data were obtained from medical records, and the patient’s body mass index (BMI) was calculated (the weight in kilograms divided by the square of the height in meters).
The following parameters were evaluated at the level of the distal tibiofibular syndesmosis:
- Morphology of the incisura fibularis (concave or shallow). A fibular incisura with a depth of 4 mm or more indicates that the syndesmosis is deep.
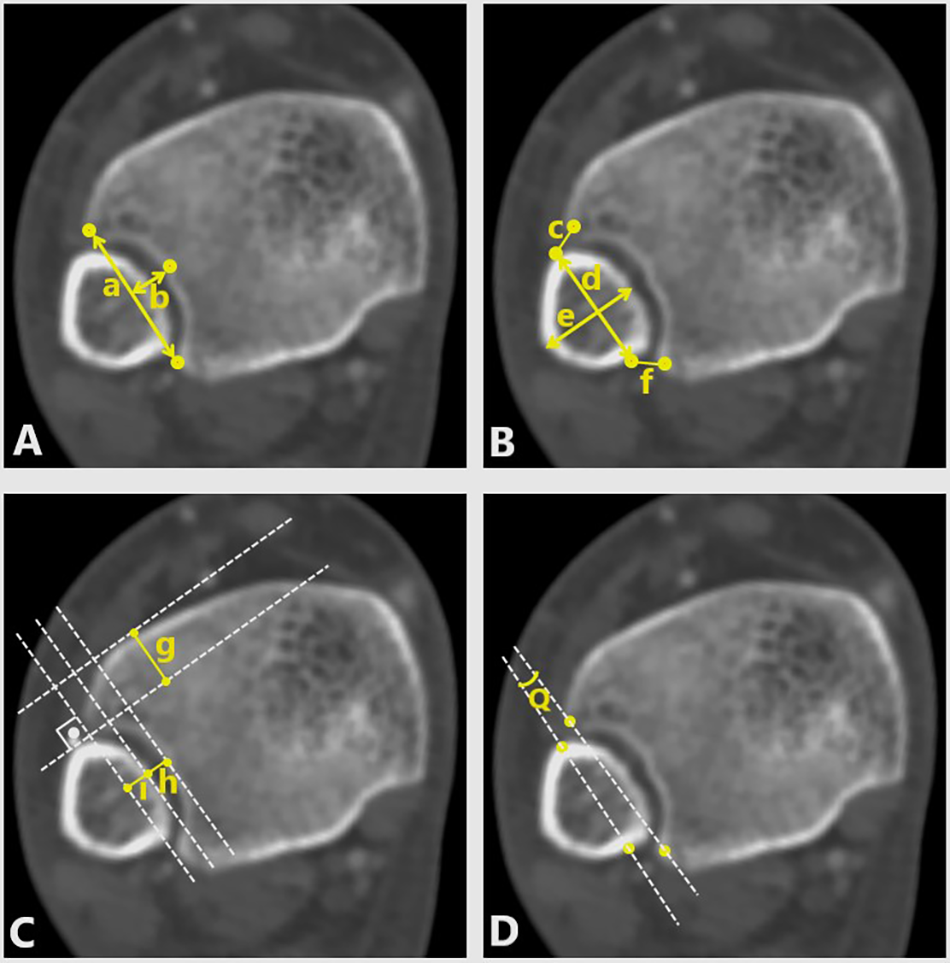
- The length and depth of the incisura fibularis notch (Fig. 1A [a and b]).
- Anterior tibiofibular distance (ATFD), the distance between the anterior border of the fibula and the nearest point of the anterior tibial tubercle (Fig. 1B [c]), and posterior tibiofibular distance (PTFD), the distance between the posterior border of the fibula and the nearest point of the posterior tibial tubercle (Fig. 1B [f]).
- Longitudinal and transverse lengths of the distal fibula (Fig. 1B [d and e])
- Anterior tibiofibular interval (ATFI), the distance from the anterior tibia to the anterior fibula (Fig. 1C [g])
- TFO, the interval from the medial fibula to the anterior tibial tubercle (Fig. 1C [i])
- TFCS, the interval from the medial fibula to the tip of the posterior tibial tubercle (Fig. 1C [h]).
- Q angle, the rotation of the fibula relative to the incisura (Fig. 1D).
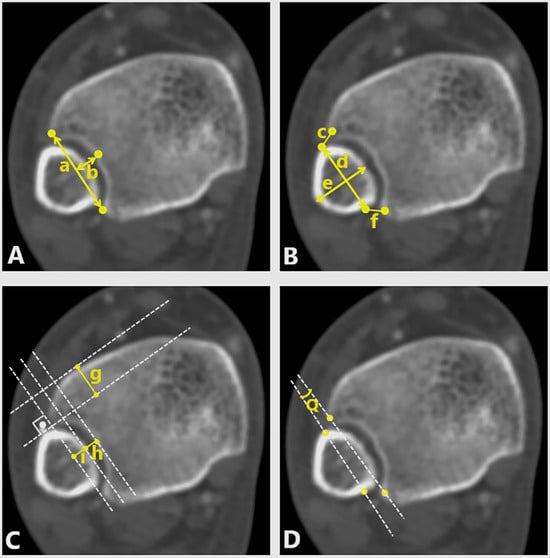
Figure 1.
Axial computed tomographic scan of the right ankle in a 38-year-old man. See the “Materials and Methods” section of the main text for descriptions of the parameters.
When comparing the parameters according to sex, parameters were calibrated as ratios of the longitudinal length of the fibula to avoid the effect of anatomical variations on the parameters, as was done in previous studies [21,22].
Mean ± SD, median, and range values are given in descriptive statistics for continuous data, and number and percentage values are given in discrete data. The Kolmogorov-Smirnov test was used to examine the conformity of the data to the normal distribution. An independent-samples t test was used for normally distributed data in comparing continuous data between the sexes. The Mann-Whitney U test was used for data that did not comply with normal distribution. The χ2 and Fisher exact tests were used for group comparisons (cross tables) of nominal variables. The Pearson correlation coefficient analyzed relationships between continuous data and ankle measurements. In comparing right and left ankle measurements, the paired-samples t test was used for normally distributed data, and the Wilcoxon test was used for data that did not fit the normal distribution. The difference between the right and left incisura fibularis types was evaluated by the McNemar test. Intraclass correlation coefficient was used for the intraobserver and interobserver reliability. A statistical software program (IBM SPSS Statistics for Windows, Version 20.0 (IBM Corp, Armonk, New York) was used in the evaluations, and P < .05 was accepted as the statistical significance limit.
Results
A total of 123 patients (83 men and 40 women) were included in this study. The mean ± SD patient age was 57.2 ± 14.7 years (range, 19–86 years). The morphology of the incisura fibularis was concave in 17 women (42.5%) and shallow in 23 women (57.5%). The morphology on the left and right feet was different in one man. The morphology of the incisura fibularis was concave in 127 feet (76.5%) and shallow in 39 feet (23.5%) in men.
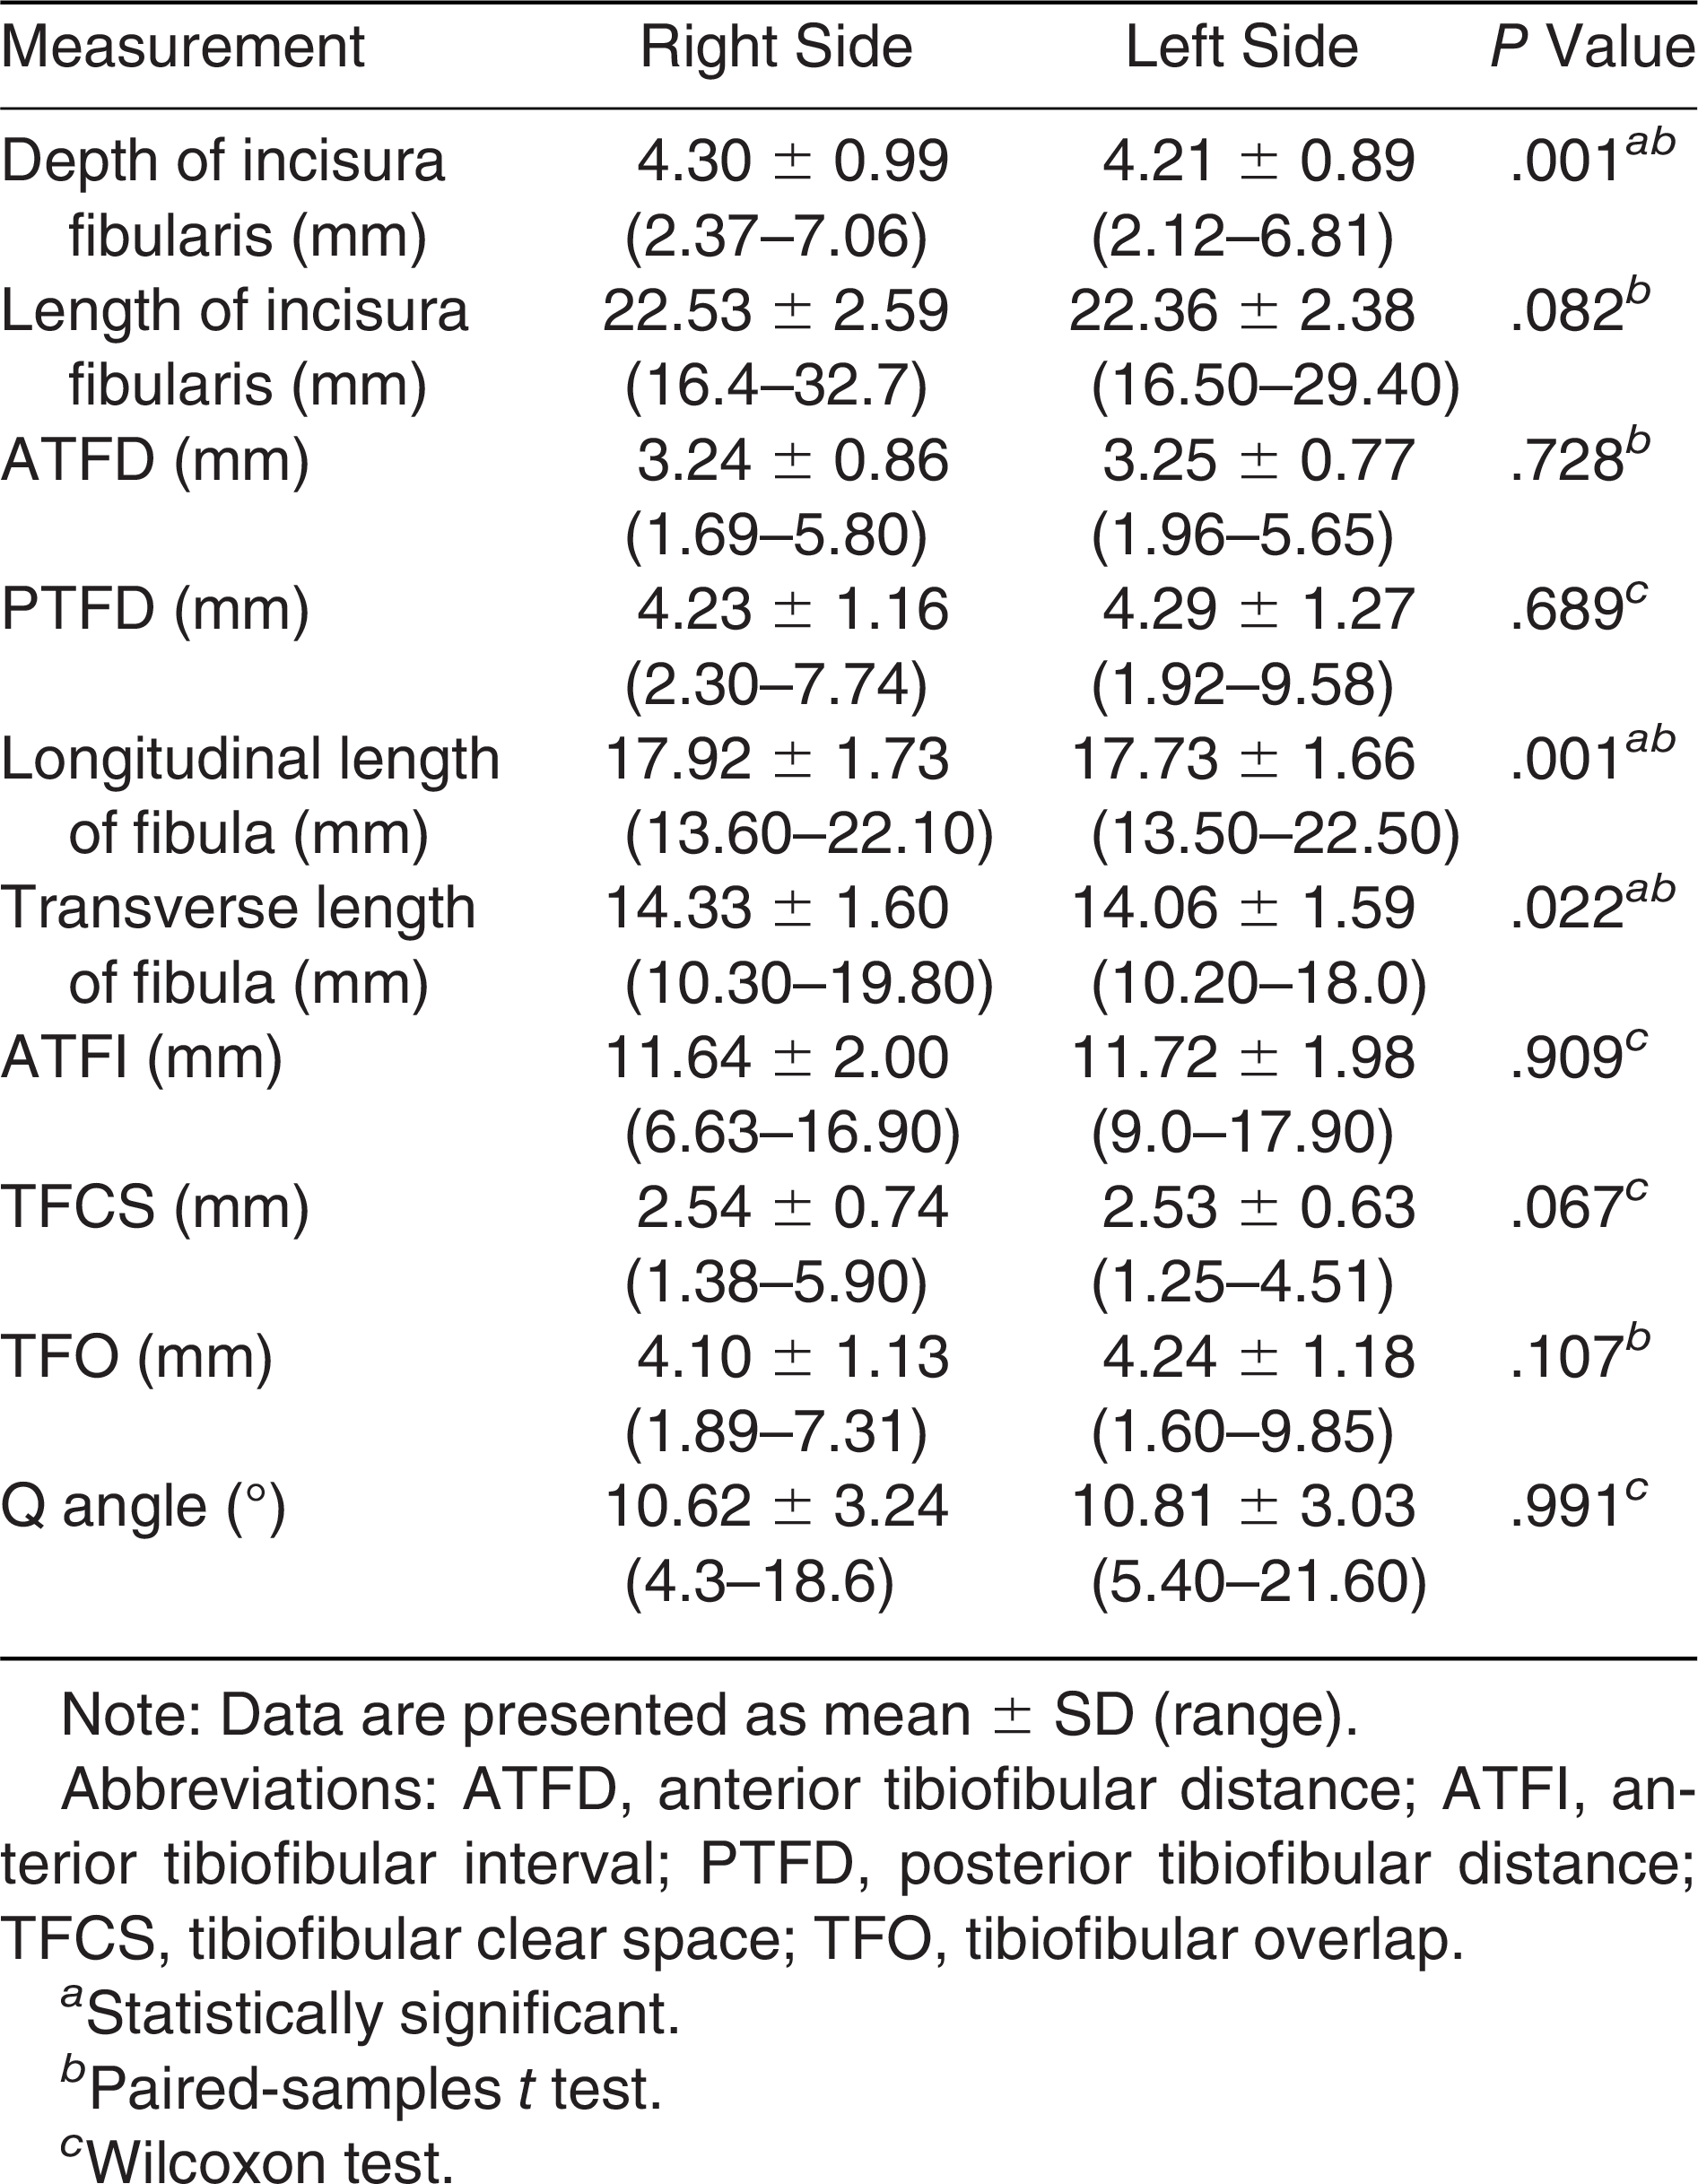
The mean ± SD depth of the incisura fibularis was 4.3 ± 0.94 mm, and the mean ± SD length was 22.4 ± 2.47 mm. The depth of the incisura fibularis, length of the incisura fibularis, longitudinal length of the fibula, ATFD, PTFD, and ATFI measurements were significantly greater in men than in women. However, calibrated ratios of these parameters did not differ between the sexes. Overall measurements are summarized in Table 1. When the measurements of the right and left feet were compared, the depth of the incisura fibularis and the longitudinal and transverse lengths of the fibula were statistically significantly different. The other measurements were similar between the feet (Table 2).

Table 1.
Computed Tomography Measurements Overall and According to Sex
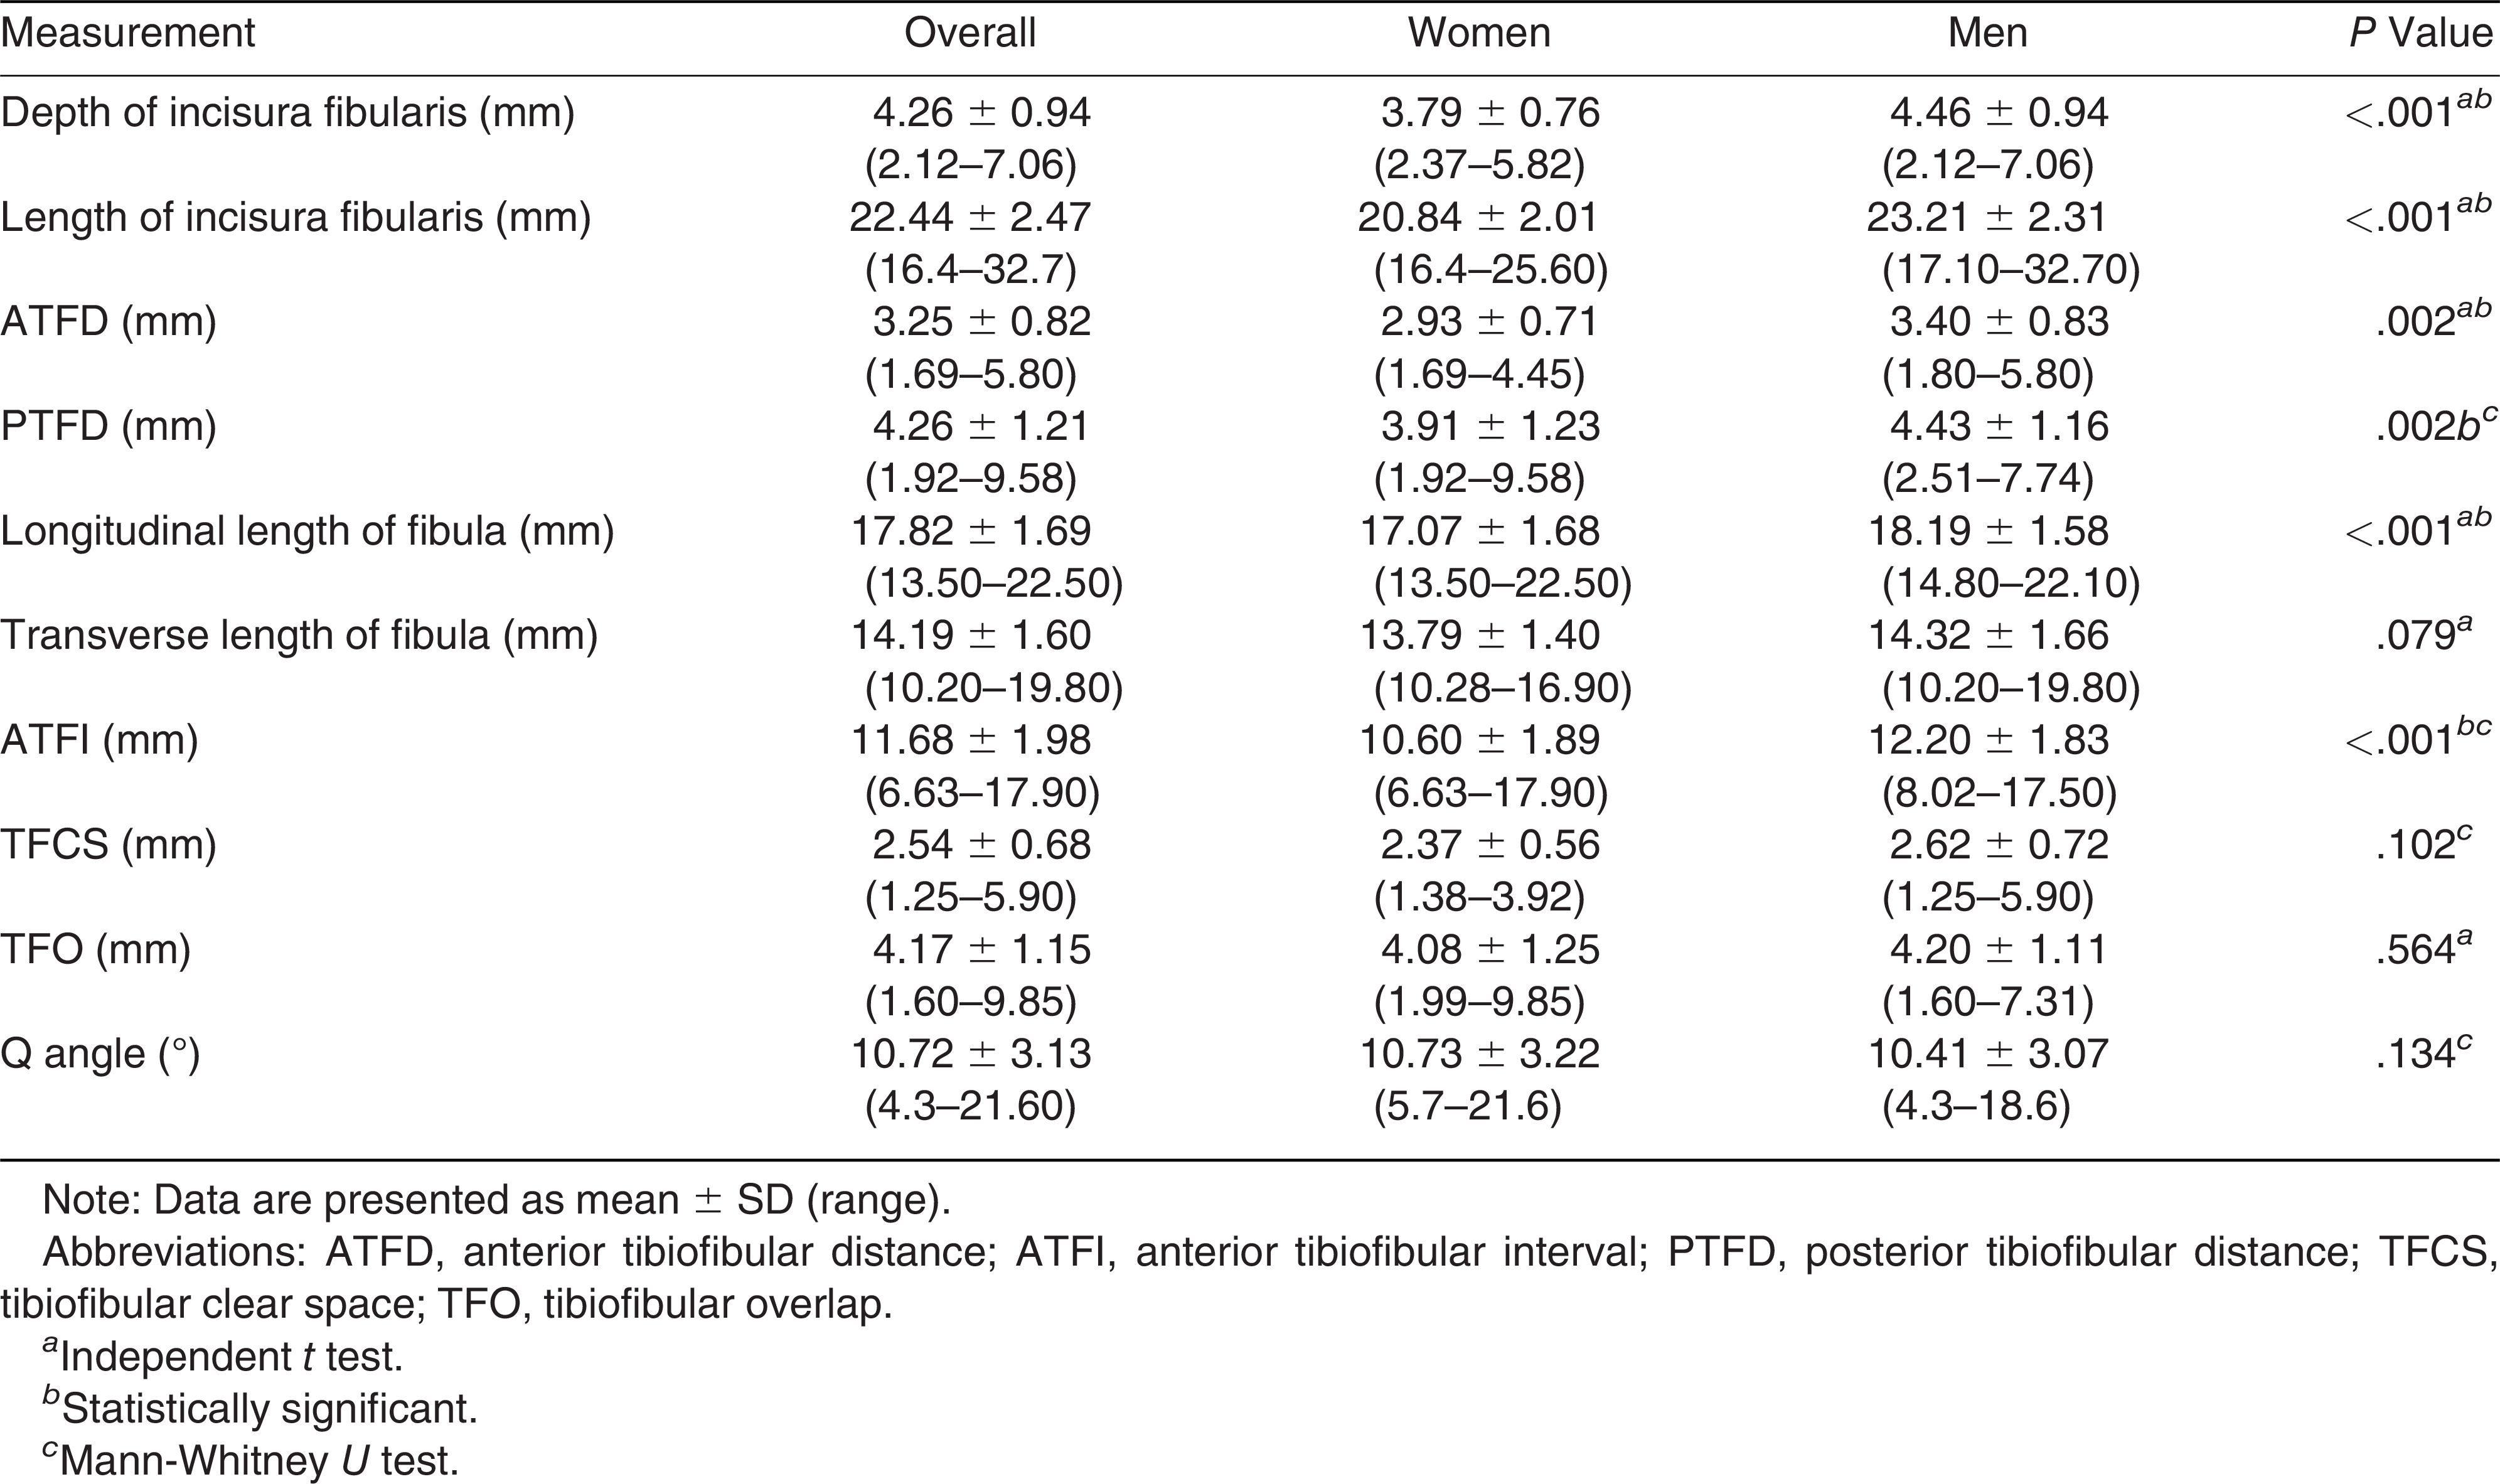
Table 2.
Computed Tomography Measurements According to Body Side
The depth of the incisura fibularis positively correlates with height (r = 0.261; P = .019) and negatively correlates with BMI (r = –0.275; P = .014) in women. The length of the incisura fibularis positively correlates with height (r = 0.327; P = .003) and weight (r = 0.282, P = .011) in women. The depth and length of the incisura fibularis positively correlate with height and weight (Table 3).
Table 3.
Correlations of Measurements and Between Age, Height, Weight, and BMI Values
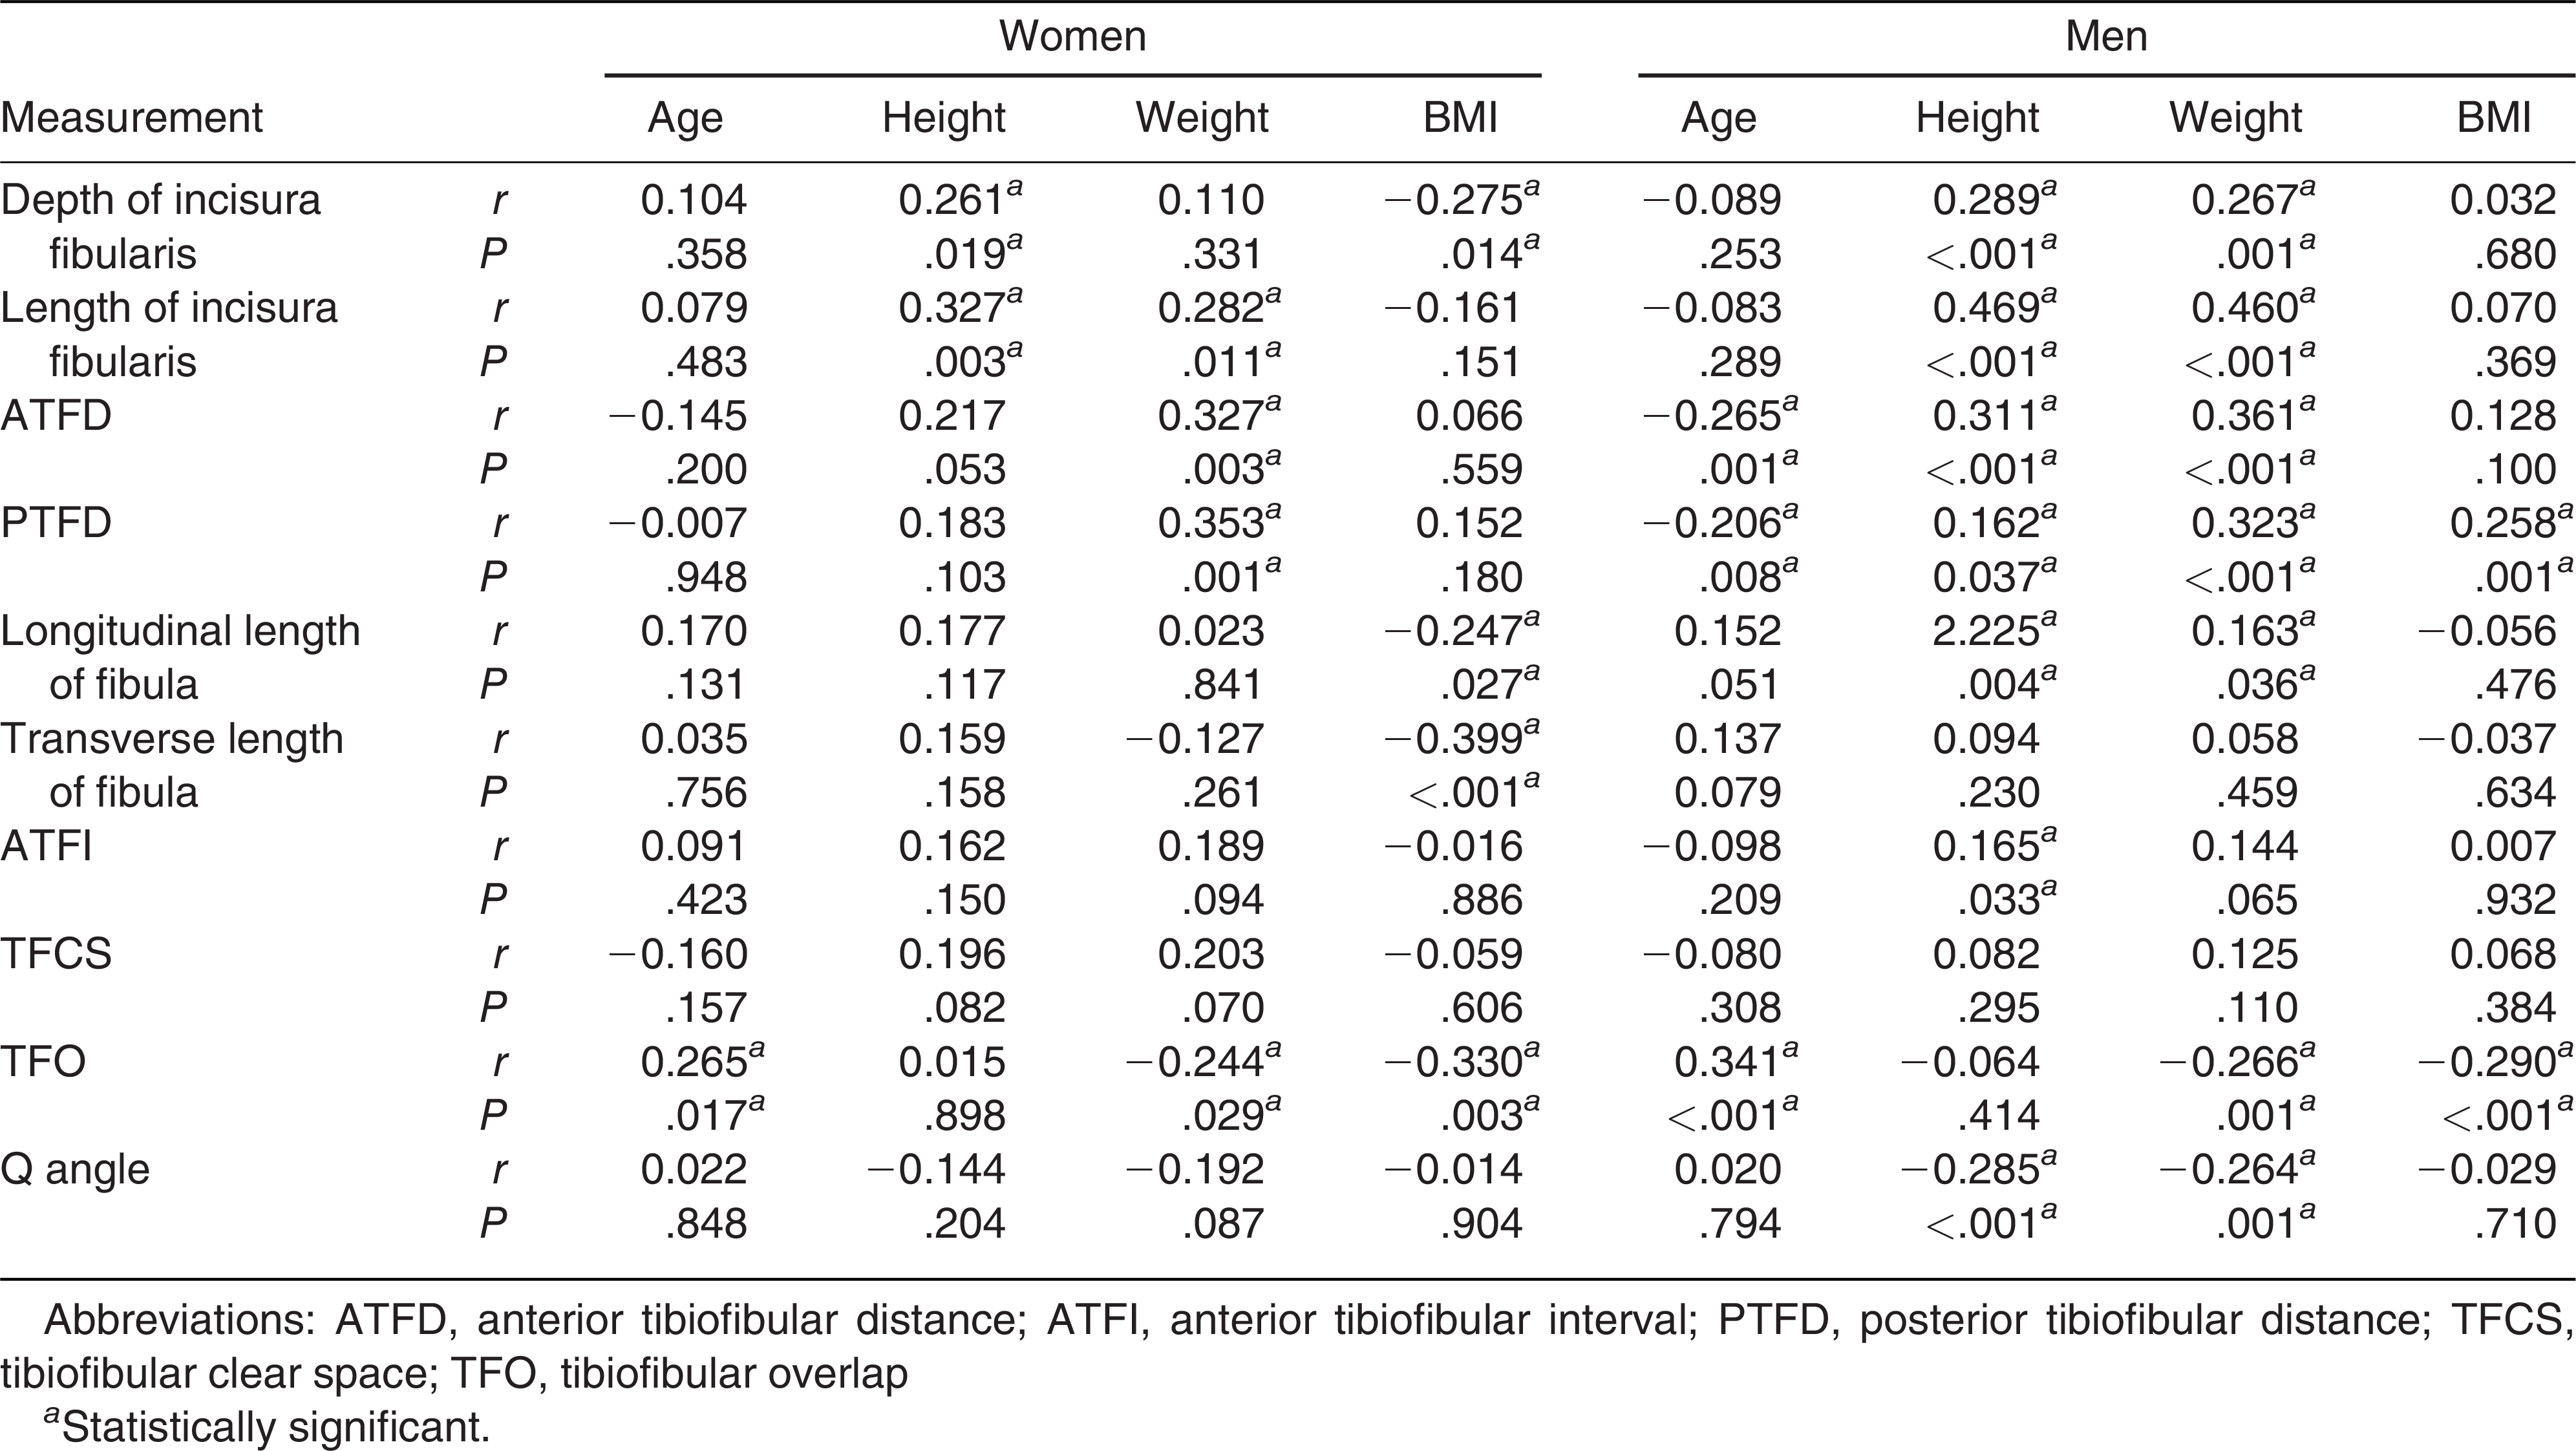
Women’s weight affects ATFD (r = 0.327; P = .003) and PTFD (r = 0.353; P = .001). These parameters have a negative correlation with age in men and positive correlations with height, weight, and BMI (only with PTFD). Although there are no correlations between the parameters and ATFI in women, height (r = 0.165; P = .033) positively correlated with ATFI in men. As age increases in both sexes, TFO increases. Weight and BMI negatively correlate with TFO in all of the populations. No relations were found between BMI and the morphology of the incisura fibularis. Q angle is negatively correlated with height and weight in men (Table 3). All of the correlations are detailed in Table 3.
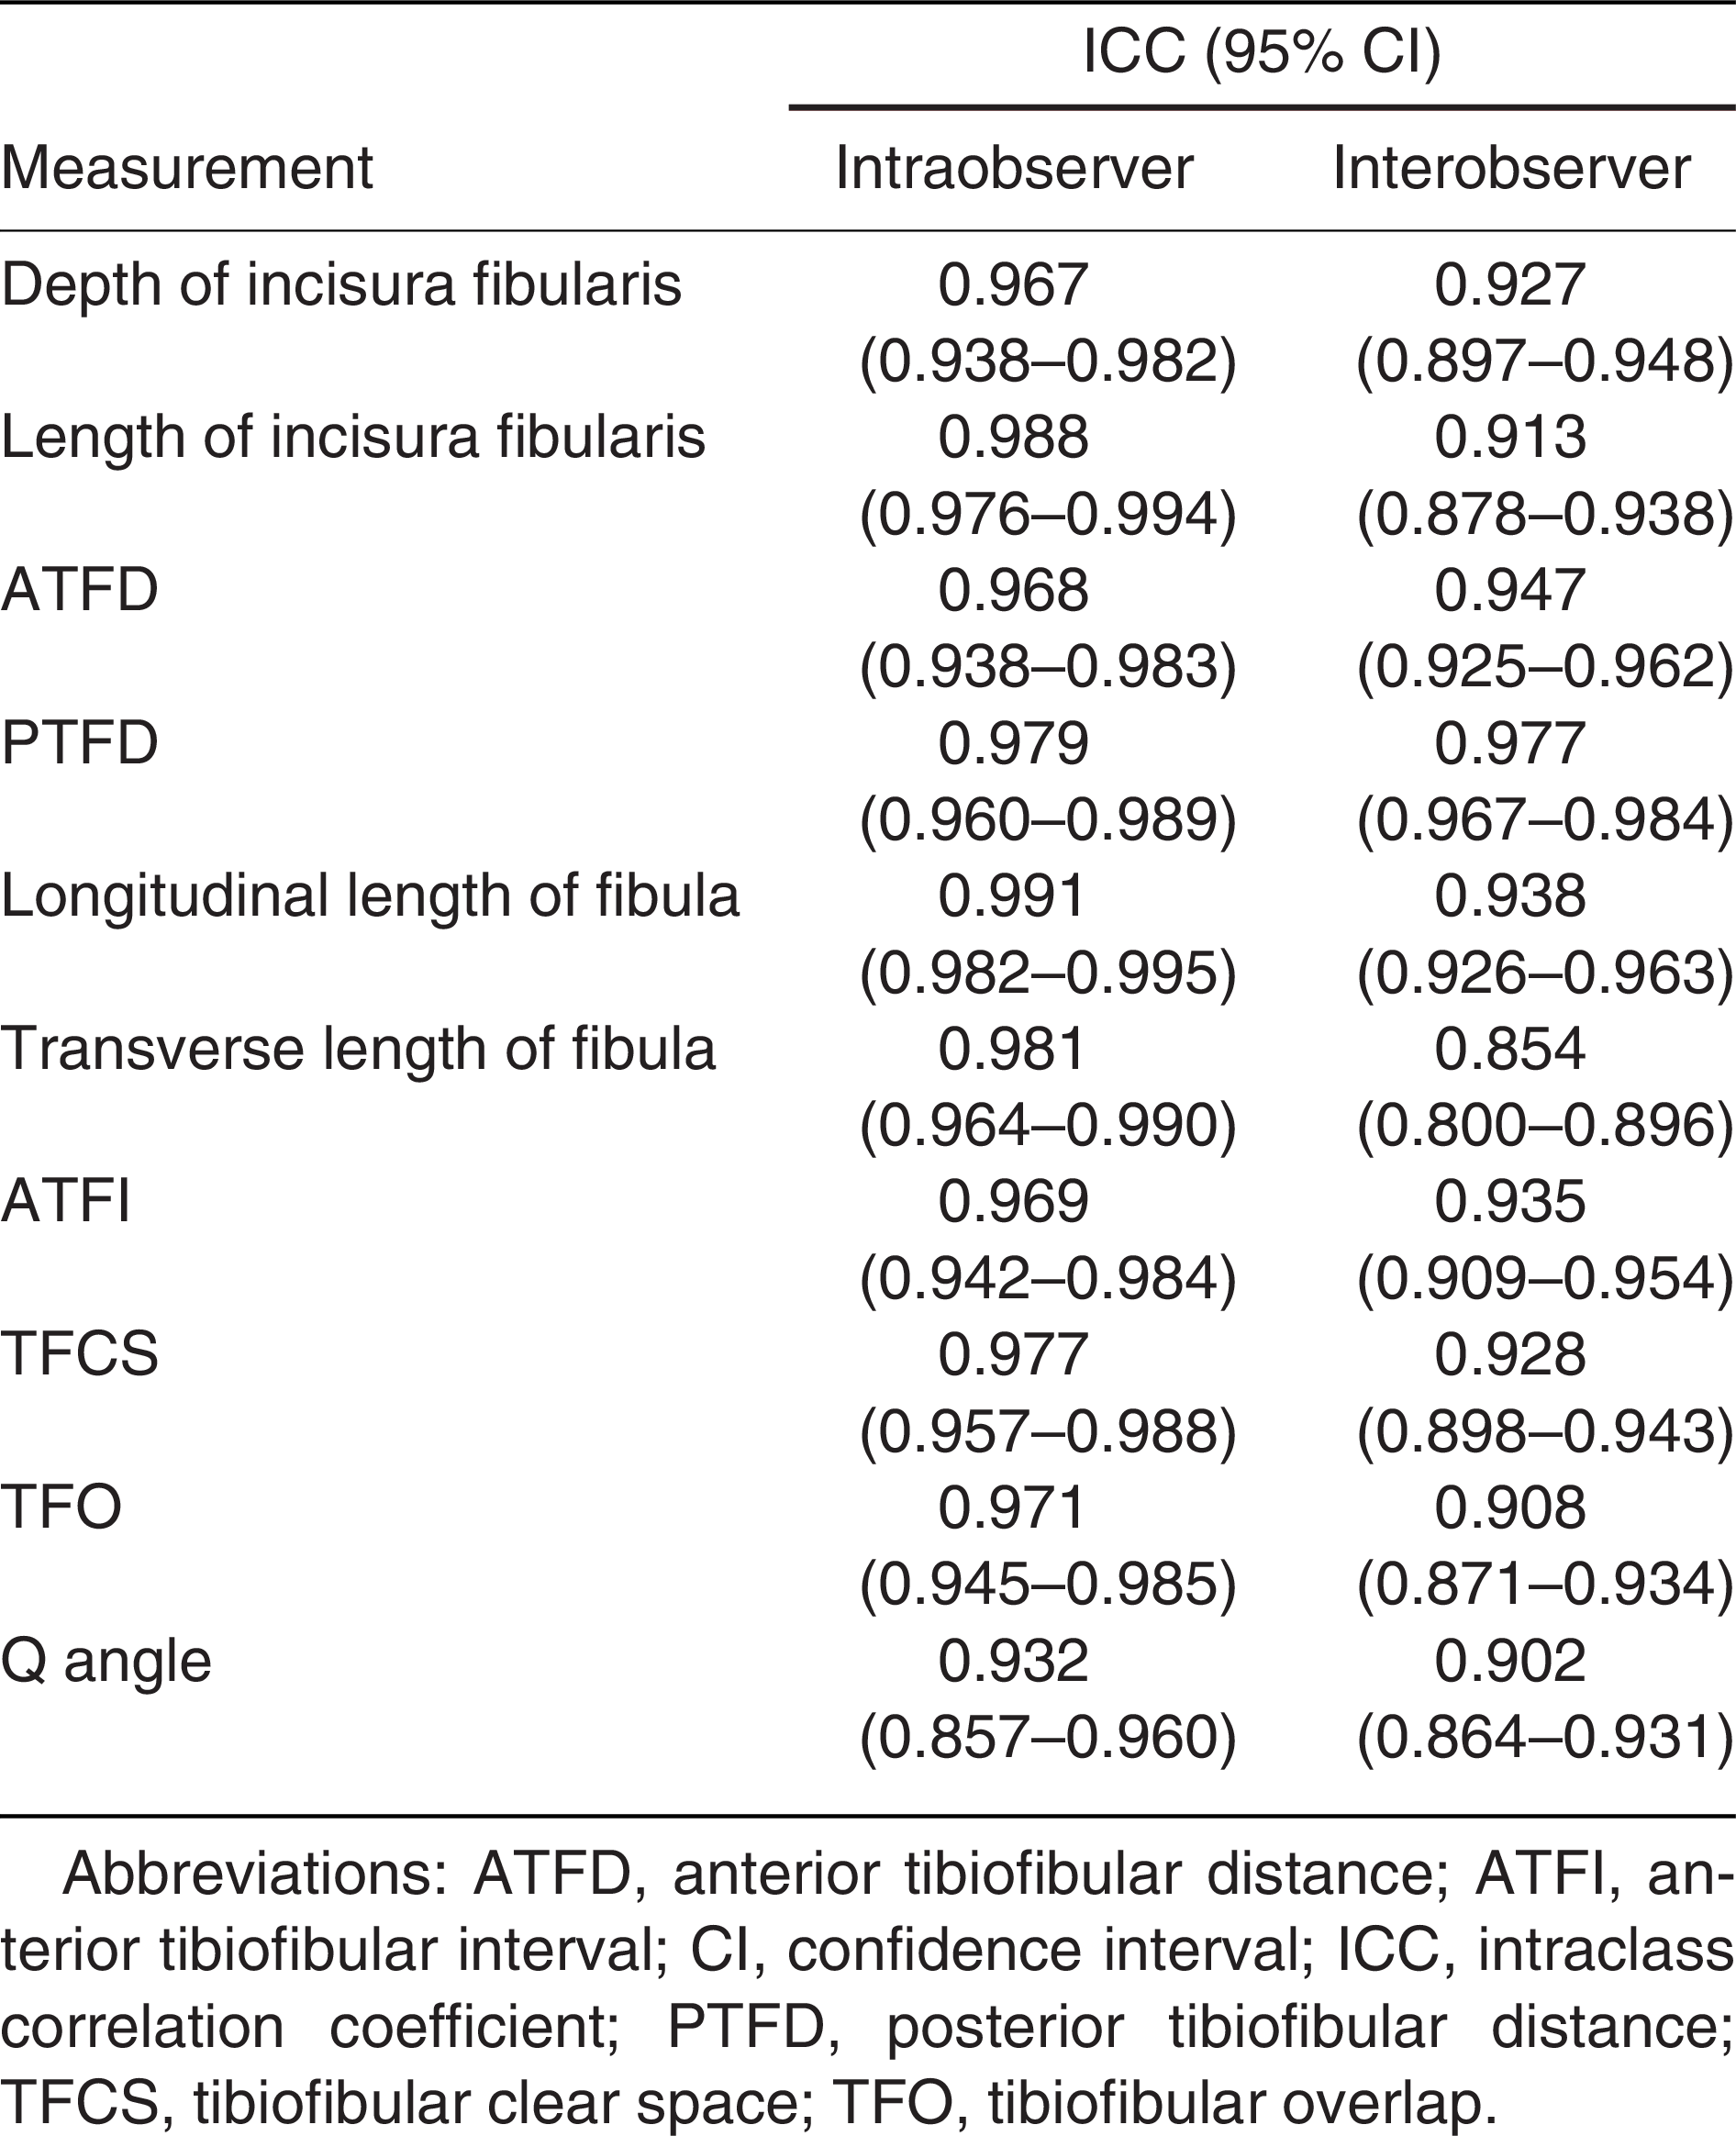
The intraobserver and interobserver reliabilities of the radiographic measurements are shown in Table 4. All of the CT measurements showed high intraobserver and interobserver reliabilities (Table 4).
Table 4.
Intraobserver and Interobserver Correlation Coefficients of the Measured Computed Tomography Parameters
Discussion
An intact distal tibiofibular syndesmosis is an important anatomical structure for normal ankle function and plays an essential role in joint stability and load transfer [17,18,21,23,24]. Furthermore, anatomical reduction of syndesmosis provides joint congruity and avoids post-traumatic arthritis in ankle traumas [21,25]. Therefore, an exact measurement of distal tibiofibular syndesmosis can help medical professionals treat ankle injuries. In this study, we demonstrated the radiologic measurements of distal tibiofibular syndesmosis using CT images obtained from angiography images of patients without ankle injuries and previous trauma in the Turkish population. Also, we evaluated the correlations between the radiologic parameters and age, weight, height, and BMI.
Because of the effects of the rotation of the ankle and the position of the foot during radiologic evaluation, measurements with radiographs avoid obtaining precise results [14,15,21,26]. The superiority of CT over plain radiographs has been demonstrated in previous studies [21,24,27]. Measurements that are difficult or impossible to evaluate with direct radiographs can be made with CT in three dimensions [28]. Previous studies assessed the morphology of the incisura fibularis on dry bones or with MRI in the Turkish population [17,20]. However, CT allowed us to evaluate exact measurements of the incisura fibularis in living persons. Using CT images for choosing anatomic landmarks allowed flawless measurements in this study. Intraobserver and interobserver reliability of these measurements supported the results of this study.
In this study, the most distinct difference between men and women was the morphology of the incisura fibularis. Unlike the study by Tonogai et al [3], which demonstrated no significant difference in morphology of the incisura fibularis between the sexes in a Japanese population, most women had a shallow-type and most men had a concave-type incisura fibularis in the Turkish population in this study. Previous studies in the Turkish population found similar results as the present study [18,20].
Length and depth of the incisura fibularis, ATFD, PTFD, ATFI, and fibula length showed a sex-specific difference in the present study. Previous studies demonstrated similar variations between the sexes but concluded that these were true anatomical variations, not actual differences when compared as ratios to the transverse length of the fibula [21,22]. Similarly, we did not find a significant difference between the sexes when these parameters were compared as ratios to the longitudinal length of the fibula.
The depth of the incisura fibularis and the transverse and longitudinal lengths of the fibula were different according to body side in this study. Also, one male had different incisura fibularis morphologies on his left and right feet. No significant difference was found for the other radiologic parameters. In their MRI-based study, Yildirim et al [20] revealed the differences in the depth of the incisura fibularis and ATFD in both sexes. On the other hand, a more recent and CT-based study by Park et al [22] demonstrated no differences in radiologic parameters between the feet. In this study, the parameters that can guide surgeons to treat ankle injuries compared with the uninjured side (ATFI, TFO, and TFCS) were similar between the feet. Therefore, these parameters in CT images of the uninjured side can be reliable in planning treatment strategies for ankle injuries.
Park et al [22] divided 120 volunteers into three age groups to evaluate distal tibiofibular syndesmosis with CT and found that age was the most critical factor affecting the radiologic parameters. As age increased, their patients’ ATFD, PTFD, and ATFI decreased. They advocated that the reason for this correlation could be a result of physiologic changes of aging or arthritic changes [22]. The patients in this study were investigated for correlation between age and radiologic parameters without dividing them into age groups. Similar to this study, a negative correlation between ATFD, PTFD, and age was found in the present study, but only in men. The decrease with age in women was not statistically significant. Unlike the study by Park et al [22], we also found a positive correlation between age and TFO in both sexes. As age increased, patients had higher TFO measurements.
Tonogai et al [3] demonstrated the relation between BMI and the morphology of the incisura fibularis. The participants in their study with concave morphology had higher BMI values. They suggested that higher weight is responsible for this correlation as the force across the ankle joint can increase up to four times the body weight [3,29]. Although there was no such correlation in this study, we demonstrated all correlations between the radiologic parameters of the incisura fibularis and the height, weight, and BMI in both sexes. We expect that the correlations we found will contribute to the treatment planning of physicians dealing with ankle injuries.
The most-used radiologic parameters to evaluate syndesmotic injuries are TFO and TFCS [11,12,13]. This study found these parameters to be similar between the sexes and the sides. Also, we found no correlations in TFCS. On the other hand, the TFO of the patients had a positive correlation with age and negative correlations with weight and BMI. In light of these findings, we demonstrated that age, weight, and BMI affect TFO, as shown in previous studies [21,22].
The present study demonstrated the radiologic parameters of the incisura fibularis on CT in the Turkish population, but it has some limitations. First, the retrospective design of the study prevents us from matching every parameter to compare. Second, we could not evaluate the parameters according to foot dominance. Third, this study did not investigate the effect of radiologic parameters on ankle injuries or the impact of physiologic loads on these parameters.
In conclusion, this study demonstrated the radiologic parameters of the incisura fibularis according to sex and body side in the Turkish population with CT. Also, the correlations of the parameters with age, height, weight, and BMI were presented. Although the clinical relevance of these parameters could not be demonstrated in this study, we showed the parameters that could be taken as a reference from the uninjured side. Therefore, TFO and TFCS of the uninjured side can be used to plan the treatment of ankle injuries.
Financial Disclosure
None reported.
Conflict of Interest
None reported.
References
- Vetter SY, Palesche N, Beisemann N, et al: Influence of syndesmotic injuries and posterior malleolar ankle fractures on fibula position in the ankle joint: a cadaveric study. Eur J Trauma Emerg Surg 47: 905, 2021.
- Liu J, Valentine D, Ebraheim NA: Management of syndesmosis injury: a narrative review. Orthop Res Rev 14: 471, 2022.
- Tonogai I, Hamada D, Sairyo K: Morphology of the incisura fibularis at the distal tibiofibular syndesmosis in the Japanese population. J Foot Ankle Surg 56: 1147, 2017.
- Lindsjö U: Operative treatment of ankle fractures. Acta Orthop Scand Suppl 189: 1, 1981.
- Stiene A, Renner CE, Chen T, et al: Distal tibiofibular syndesmosis dysfunction: a systematic literature review of dynamic versus static fixation over the last 10 years. J Foot Ankle Surg 58: 320, 2019.
- Sagi HC, Shah AR, Sanders RW: The functional consequence of syndesmotic joint malreduction at a minimum 2-year follow-up. J Orthop Trauma 26: 439, 2012.
- Chissell HR, Jones J: The influence of a diastasis screw on the outcome of Weber type-C ankle fractures. J Bone Joint Surg Br 77: 435, 1995.
- van den Bekerom MP, de Leeuw PA, van Dijk CN: Delayed operative treatment of syndesmotic instability: current concepts review. Injury 40: 1137, 2009.
- McKinley TO, Rudert MJ, Tochigi Y, et al: Incongruity-dependent changes of contact stress rates in human cadaveric ankles. J Orthop Trauma 20: 732, 2006.
- Tochigi Y, Rudert MJ, McKinley TO, et al: Correlation of dynamic cartilage contact stress aberrations with severity of instability in ankle incongruity. J Orthop Res 26: 1186, 2008.
- Pettrone FA, Gail M, Pee D, et al: Quantitative criteria for prediction of the results after displaced fracture of the ankle. J Bone Joint Surg Am 65: 667, 1983.
- Ostrum RF, De Meo P, Subramanian R: A critical analysis of the anterior-posterior radiographic anatomy of the ankle syndesmosis. Foot Ankle Int 16: 128, 1995.
- Brage ME, Bennett CR, Whitehurst JB, et al: Observer reliability in ankle radiographic measurements. Foot Ankle Int 18: 324, 1997.
- Saldua NS, Harris JF, LeClere LE, et al: Plantar flexion influences radiographic measurements of the ankle mortise. J Bone Joint Surg Am 92: 911, 2010.
- Beumer A, Swierstra BA: The influence of ankle positioning on the radiography of the distal tibial tubercles. Surg Radiol Anat 25: 446, 2003.
- Batıbay SG, Bayram S, Polat Ö: Bone morphology as a determinative risk factor for type of ankle fracture. JAPMA 113: 20, 2023.
- Taşer F, Toker S, Kilinçoğlu V: Evaluation of morphometric characteristics of the fibular incisura on dry bones. Eklem Hastalik Cerrahisi 20: 52, 2009.
- Mavi A, Yildirim H, Gunes H, et al: The fibular incisura of the tibia with recurrent sprained ankle on magnetic resonance imaging. Saudi Med J 23: 845, 2002.
- Sharif B, Welck M, Saifuddin A: MRI of the distal tibiofibular joint. Skeletal Radiol 49: 1, 2020.
- Yildirim H, Mavi A, Büyükbebeci O, et al: Evaluation of the fibular incisura of the tibia with magnetic resonance imaging. Foot Ankle Int 24: 387, 2003.
- Dikos GD, Heisler J, Choplin RH, et al: Normal tibiofibular relationships at the syndesmosis on axial CT imaging. J Orthop Trauma 26: 433, 2012.
- Park CH, Kim GB: Tibiofibular relationships of the normal syndesmosis differ by age on axial computed tomography-anterior fibular translation with age. Injury 50: 1256, 2019.
- Burns WC II, Prakash K, Adelaar R, et al: Tibiotalar joint dynamics: indications for the syndesmotic screw: a cadaver study. Foot Ankle 14: 153, 1993.
- Ebraheim NA, Lu J, Yang H, et al: Radiographic and CT evaluation of tibiofibular syndesmotic diastasis: a cadaver study. Foot Ankle Int 18: 693, 1997.
- McKinley TO, Tochigi Y, Rudert MJ, et al: Instability-associated changes in contact stress and contact stress rates near a step-off incongruity. J Bone Joint Surg Am 90: 375, 2008.
- Pneumaticos SG, Noble PC, Chatziioannou SN, et al: The effects of rotation on radiographic evaluation of the tibiofibular syndesmosis. Foot Ankle Int 23: 107, 2002.
- Chan KB, Lui TH: Isolated anterior syndesmosis diastasis without fracture. Arch Orthop Trauma Surg 127: 321, 2007.
- Magid D, Michelson JD, Ney DR, et al: Adult ankle fractures: comparison of plain films and interactive two- and three-dimensional CT scans. AJR Am J Roentgenol 154: 1017, 1990.
- Procter P, Paul JP: Ankle joint biomechanics. J Biomech 15: 627, 1982.
© 2024 American Podiatric Medical Association