


Abstract
Hallux valgus is a common foot deformity that may cause pain and functional limitation, and often requires surgical correction. Clinical and radiographic parameters are typically used to assess postoperative outcomes. Plantar pressure distribution systems represent an innovative additional tool to evaluate hallux functional outcome after surgery. A systematic review of the current literature was performed to assess evaluation systems used for plantar pressure analysis and differences before and after hallux valgus surgery, and a possible relationship between different surgical techniques and clinical and radiographic results. Preferred Reporting Items for Systematic Reviews and Meta-Analyses guidelines were used for this review. Initial search results yielded 40 studies. Two additional studies were found through cross-reference. Twenty-five studies were screened. A total of 10 articles were included in the review process. Two main plantar pressure analysis systems were identified. Hallux function restoration based on plantar pressure measurement did not always occur. No relevant relationships between plantar pressure distribution data and different surgical techniques were established. All patients achieved satisfactory clinical and radiographic outcomes, regardless of surgical techniques used; however, no clear relationships were observed between clinical and radiographic results and the change in foot plantar pressure patterns. The current literature on this topic showed several methodologic limitations. Therefore, it is not possible to provide sufficiently supported evidence-based data regarding plantar pressure distribution rebalance after surgery using current plantar pressure analysis systems. Further investigations are needed to fill these gaps in evidence.
During normal gait, the center of pressure in the foot moves rapidly from the heel to the central metatarsal area after heel strike, and there it remains for approximately one-half of the stance phase, before propagating distally and medially toward the great toe [1]. Because the first ray is the most heavily loaded foot structure during gait, proper weightbearing is essential for physiologic gait patterns. Under physiologic conditions, the weightbearing is distributed in a balanced way; however, even small deformities may be responsible of important load alterations [2,3].
Hallux valgus (HV) is one of the most common foot deformities, and affects both foot morphology and foot functions [4,5]. From a morphologic point of view, HV is characterized by lateral displacement of the hallux, associated with medial displacement of the first metatarsal bone, with progressive subluxation of the first metatarsophalangeal joint [6]. Morphologic changes in HV deformity affect forefoot kinematics and worsen its function. This condition leads to a decrease in loading at the hallux level and increases in peak pressure (PP) in the central forefoot, causing central metatarsalgia, mainly at the second and third metatarsal heads [7,8]. This condition is often associated with collapse of the anterior transverse arch, bursitis, and callus formation. Clinical symptoms include pain and reduced range of motion of the first metatarsophalangeal joint; because of transfer metatarsalgia, progressive deformities involving the lesser toes such as hammer toes or claw toes are common [6,9].
Hallux valgus treatment can be conservative and surgical. Several surgical techniques have been described, with the main goal of morphologic and functional rebalance [6]. Radiographic parameters are used to assess preoperative and postoperative outcomes, whereas the function is typically evaluated by different clinical scores and questionnaires. However, it is not so easy to use objective parameters to evaluate hallux function during normal gait before and after surgery. Plantar pressure distribution assessment systems represent an innovative tool to evaluate hallux functional outcome and could theoretically help to objectify the outcomes [10–19]. The purpose of the present article is therefore to perform a systematic review of the current literature to assess evaluation systems used for plantar pressures analysis, differences in plantar pressure parameters before and after HV surgery, possible relationship between different surgical techniques, and clinical and radiographic results.
Methods
Search Strategy and Selection Criteria
A review of the literature concerning plantar pressure patterns using pressure sensors before and after HV surgery was conducted using MEDLINE by means of PubMed on May 1, 2022. The following keywords were used: “plantar” [all fields] AND “pressure” [all fields] AND “hallux” [all fields] AND “valgus” [all fields] AND “osteotomy” [all fields]. We also searched the reference lists of all included publications for potential studies.
The literature search was performed by two of the authors (A.A. and B.M.), independent of each other. The Preferred Reporting Item for Systematic Reviews and Meta-Analyses guidelines were followed, and a flow chart was used to summarize the selection procedure of the reviewed studies [20].
Inclusion criteria were determined and agreed on between the reviewers. The inclusion criteria were as follows: articles written in the English language; diagnosis of HV deformity; and articles using the American Orthopaedic Foot and Ankle Society (AOFAS) functional rating or angular criteria such as hallux valgus angle (HVA). Clinical outcomes were graded using the AOFAS scale for functional evaluation, pain, activity level, and range of motion of the forefoot, with results categorized as excellent (91–100 points), good (81–90 points), fair (71–80 points), and poor (≤70 points). The HVA is the angle between the longitudinal axes of the first metatarsal and the proximal phalanx through anteroposterior and lateral weightbearing view radiographs (normal HV angle, <15°).
Patients treated surgically for HV correction, using osteotomy as an open procedure, were also included, as were articles dealing with differences in plantar pressure and loading parameters (PP of the hallux and the first metatarsal head, and PP of the second and third metatarsal heads) before and after surgery using a pedobarographic platform or insole system. The surgery, according to the literature, should improve the contribution of the hallux in the rollover process during walking. This is not immediately achieved postoperatively, as it a process that may take several months to 1 year [16]. Then, the postsurgery parameters in the tables were considered at a mean follow-up of 12 months.
Exclusion criteria consisted of the following: study population with other concomitant disease such as rheumatoid arthritis and cerebral palsy; finite element study, biomechanical model, or tool use for design of the intervention; study with patients who underwent concomitant lesser metatarsal osteotomies; study with patients who underwent HV correction using Lapidus procedures or metatarsophalangeal fusion to eliminate plantar pressure pattern artifact caused by the joint fusion; study with patients who underwent HV correction using percutaneous techniques without internal fixation; and review articles.
Titles and abstracts of all papers identified by the search strategy were scanned for eligibility independently by two reviewers (A.A. and B.M.) with a citation, moving to full-text review if either reviewer considered the citation eligible. At full-text review, agreement of two reviewers was needed for study inclusion or exclusion. In case of doubt regarding inclusion of an article, the senior author (C.F.) made the final decision. In particular, we assessed population characteristics of included studies; evaluation systems used for plantar pressures analysis; differences in plantar pressure parameters (using PP) before and after HV surgery (both at the hallux and central metatarsal levels); the relationship between different surgical techniques and the change in foot plantar pressure pattern; and the relationship between clinical and radiographic results and the change in foot plantar pressure pattern.
Data Abstraction and Quality Assessment
Data from included studies were extracted according to the PICO question (participants, intervention, comparisons, and outcomes) and included the following:
Participants: sample size and number of feet, patients demographic characteristics (age, sex, body mass index).
Intervention: the systems used for plantar pressures analysis and the surgical technique used for HV correction.
Comparisons: differences in plantar pressure parameters (using PP) before and after HV surgery.
Outcomes: clinical outcomes through the AOFAS scores and HVA on imaging findings, when available, and the plantar pressure distribution outcomes data.
Data collection was performed using Microsoft Excel (Microsoft Corp, Redmond, Washington) for Windows 10.
Two reviewers (A.A. and B.M.) assessed the risk of bias of included studies independently. Study quality of case series will be assessed using the quality appraisal checklist developed by the Institute of Health Economics (IHE) [21]. To improve the comparability between studies using different method designs, this review used the IHE scale to evaluate randomized controlled trial, and pretest and posttest control group design. The IHE scale assesses the risk of bias from 18 items of each study.
Statistical Analysis
A descriptive analysis was performed to report major findings, and no meta-analysis was planned, as diversity in intervention, comparators, and outcomes were expected. Information retrieved from the studies was reported with the use of descriptive statistics. Data were shown as ranges of absolute values in the results.
Results
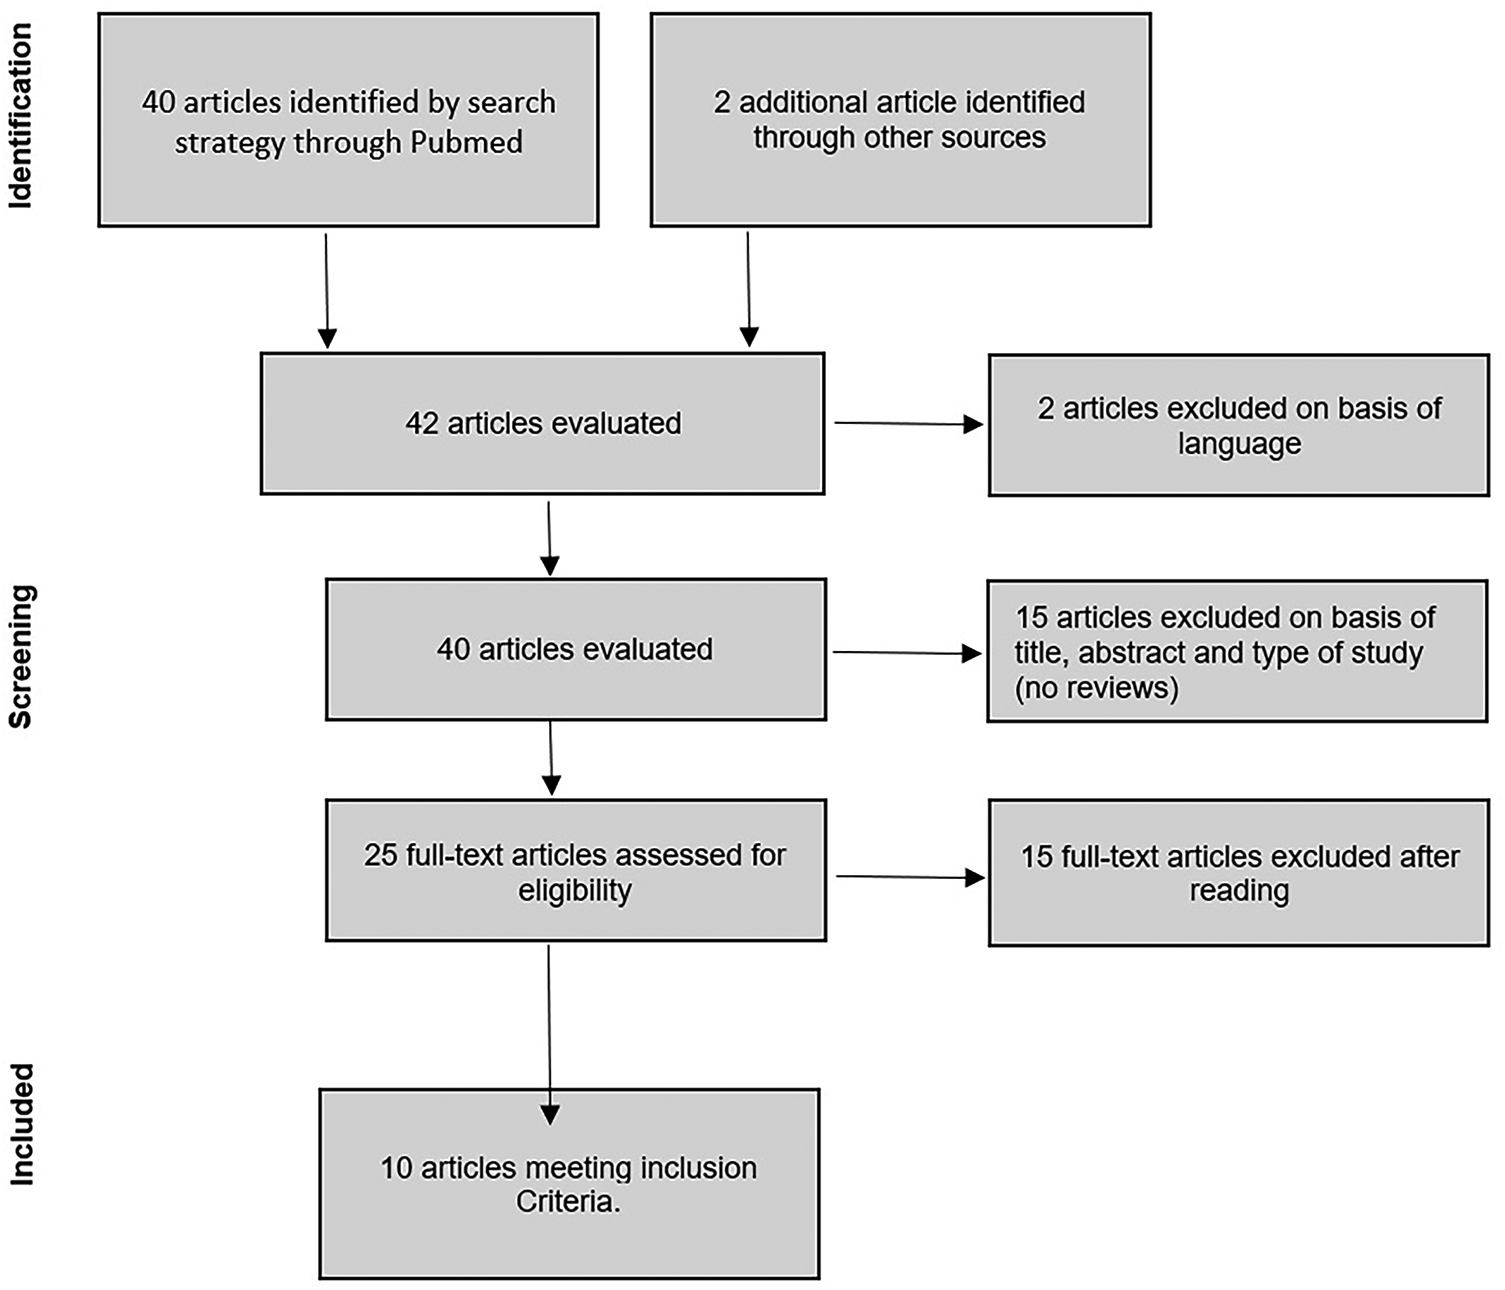
The initial search yielded 40 articles on the PubMed Database search engine. Two additional studies were found through cross-reference. After reviewing all studies according to exclusion criteria such as language, article type (no review paper included), presence of concomitant diseases, and finite element study, 25 articles were found to be eligible for evaluation. The remaining articles were obtained and evaluated for eligibility according to the inclusion criteria. After this evaluation, 10 studies were included in the review process (Fig. 1).
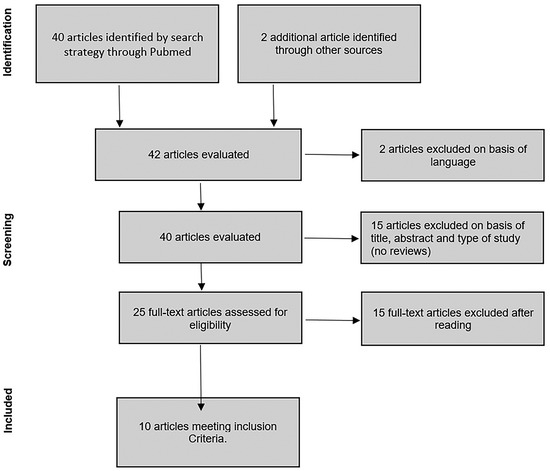
Figure 1.
Flowchart of review process by the preferred reporting items for systematic reviews and meta-analyses guidelines.
Of the included articles, six (60%) were prospective studies; two (20%) were prospective comparative studies with a control group; one was a prospective comparison of two different techniques (10%) (all classified as level of evidence III according to the Oxford Level of Evidence scale; and one study (10%) was a prospective, randomized, controlled trial, classified as level of evidence II. The considered articles were published between 2002 and 2022.
Methodologic Quality
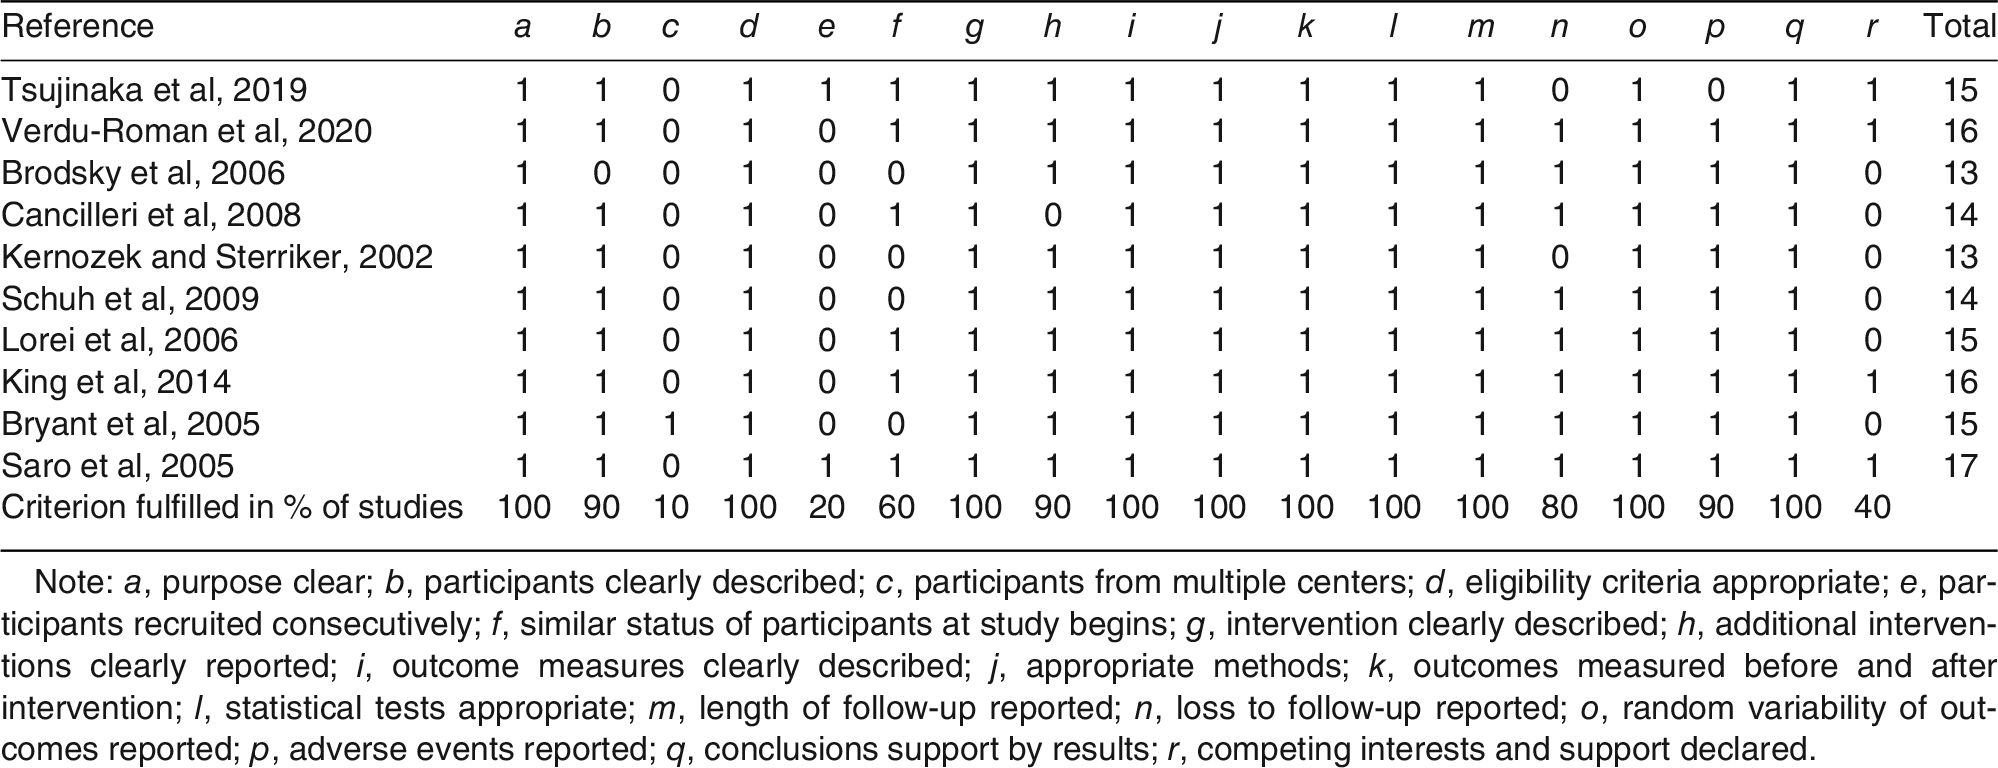
The assessment of the methodologic quality of 10 studies, as measured by the IHE scale, is summarized in Table 1. The mean value of the total score of each study was 14.8 (range, 13–17). All studies were awarded scores from items 1, 4, 7, 9, 10, 11, 13, and 17, containing the aim of the study clearly reported, eligibility criteria appropriate, intervention and outcome measures described clearly, appropriate methods, outcomes measured before and after the intervention, length of follow-up, and conclusions supported by results. The mean scores were lowest for items 3 and 5, with only one study recruiting participants from multiple centers, and only two studies containing participants that were recruited consecutively. Similar status of participants before the treatment was found in six studies, and the loss to follow-up was not mentioned in three studies.

Table 1.
Quality Assessment for Included Studies
Population
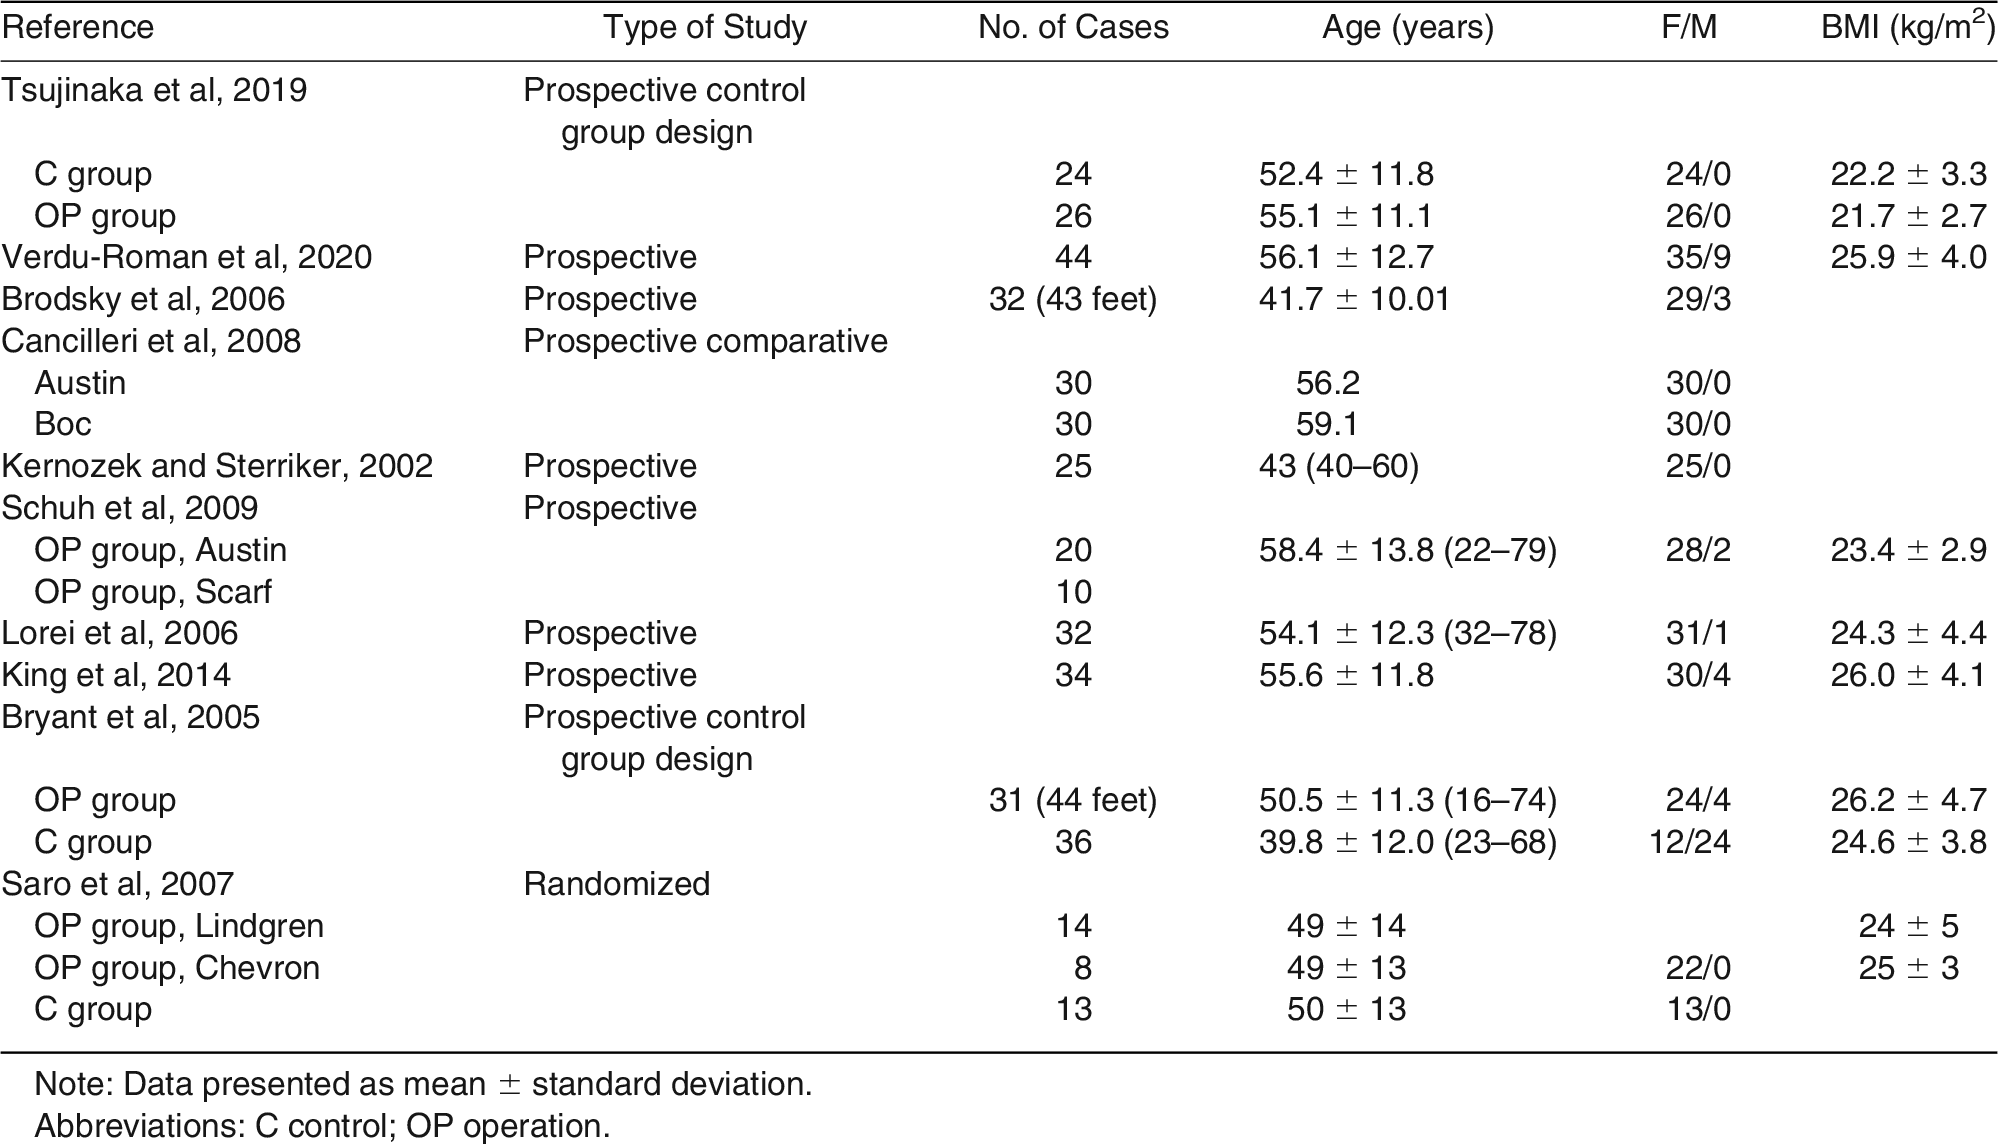
Patients’ characteristics are reported in Table 2. The total number of included patients was 336, and the number of treated halluces was 360. All the articles reported the gender distribution: in total, 310 women (92.2%) and 23 men (7.7%) were included. When reported, the mean age of patients at surgery was 52.6 years (range, 41.7–59.1 years).
Table 2.
Type and Demographic Characteristics of the Studies Included
Evaluation Systems Used for Plantar Pressure Analysis
The plantar foot pressure evaluation was performed using two measurement systems: 1) the plantar platform system/pedobarographic platform (in eight studies); and 2) in-sole/in-shoe systems (in two studies). Both systems are electronic devices for recording and analyzing plantar pressure distribution either in static or dynamic conditions through pressure sensors [22].
The plantar platform system, or pedobarographic platform, is a rigid floor-embedded platform, set up on a flat surface, allowing static posture and simple dynamic gait such as walking. The pressure sensors are positioned parallel to the supporting surface; this system thus provides a different amount of sensor numbers per area depending on the manufacturer’s specification. The in-sole or in-shoe systems can be embedded in the shoe to measure pressure between the foot and the shoe during natural gait. The sensor sheet is a thin, flexible, two-layer polyester sheet with inner surfaces printed with electrical circuits developed in various models according to sensor thickness and number of sensors per square centimeter. Both systems can integrate several pressure sensors available on the market [23], such as capacitive sensors, resistive sensors, piezoelectric sensors, and piezoresistive sensors. Different pressure sensors were used in the included articles:
Capacitive Sensors (in Seven Studies).
Capacitive sensors consist of two conductive electrically charged plates separated by a dielectric elastic layer. Commercial products based on this system are the Emed platform systems (Novel, Germany) [12,14–16,18] and RUNTIME platform (Diagnostic Support España S.L., Bormujos, Spain) [11], and Pedar in-shoe systems (Novel GmbH, Munich, Germany) [19].
Resistive Sensors (in Two Studies).
Resistive sensors measure the resistance of conductive foam between two electrodes when pressure is applied. The commercial products based on this principle are MatScan platform systems [17] (Tekscan, Inc, Norwood, Massachusetts) and F-Scan in-shoe systems (Tekscan) [10].
Regardless the sensor typology, the pressure sensors provide electrical signal output that is proportional to the measured pressure, and the informatics data are worked by a specific software and report the following main parameters:
- Peak pressure: the maximum pressure to which the ground is applied during the support phase of gait (in kilopascals).
- Maximum force: the maximum vertical force acting on a certain area and indicates its loading (in newtons).
- Contact area: the contact area of the foot to the support surface during the support phase (in centimeters squared).
- Contact time: reveals the time of contact with the ground (%/time).
- Force time integral: the area under the curve of force (in newtons per second) [9].
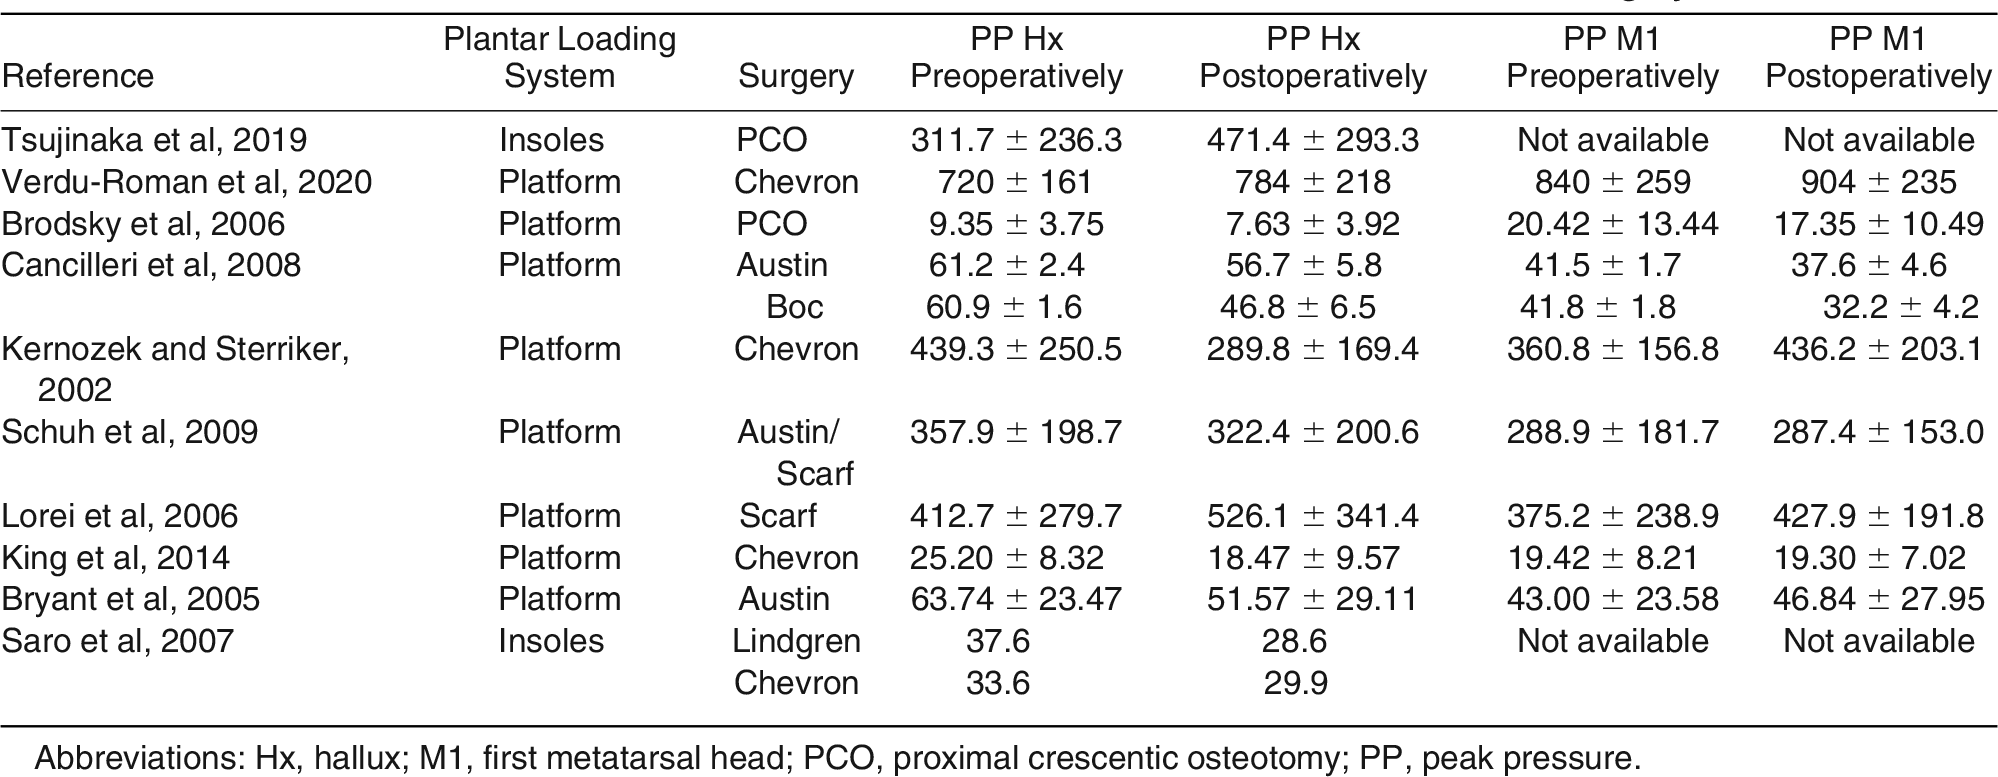
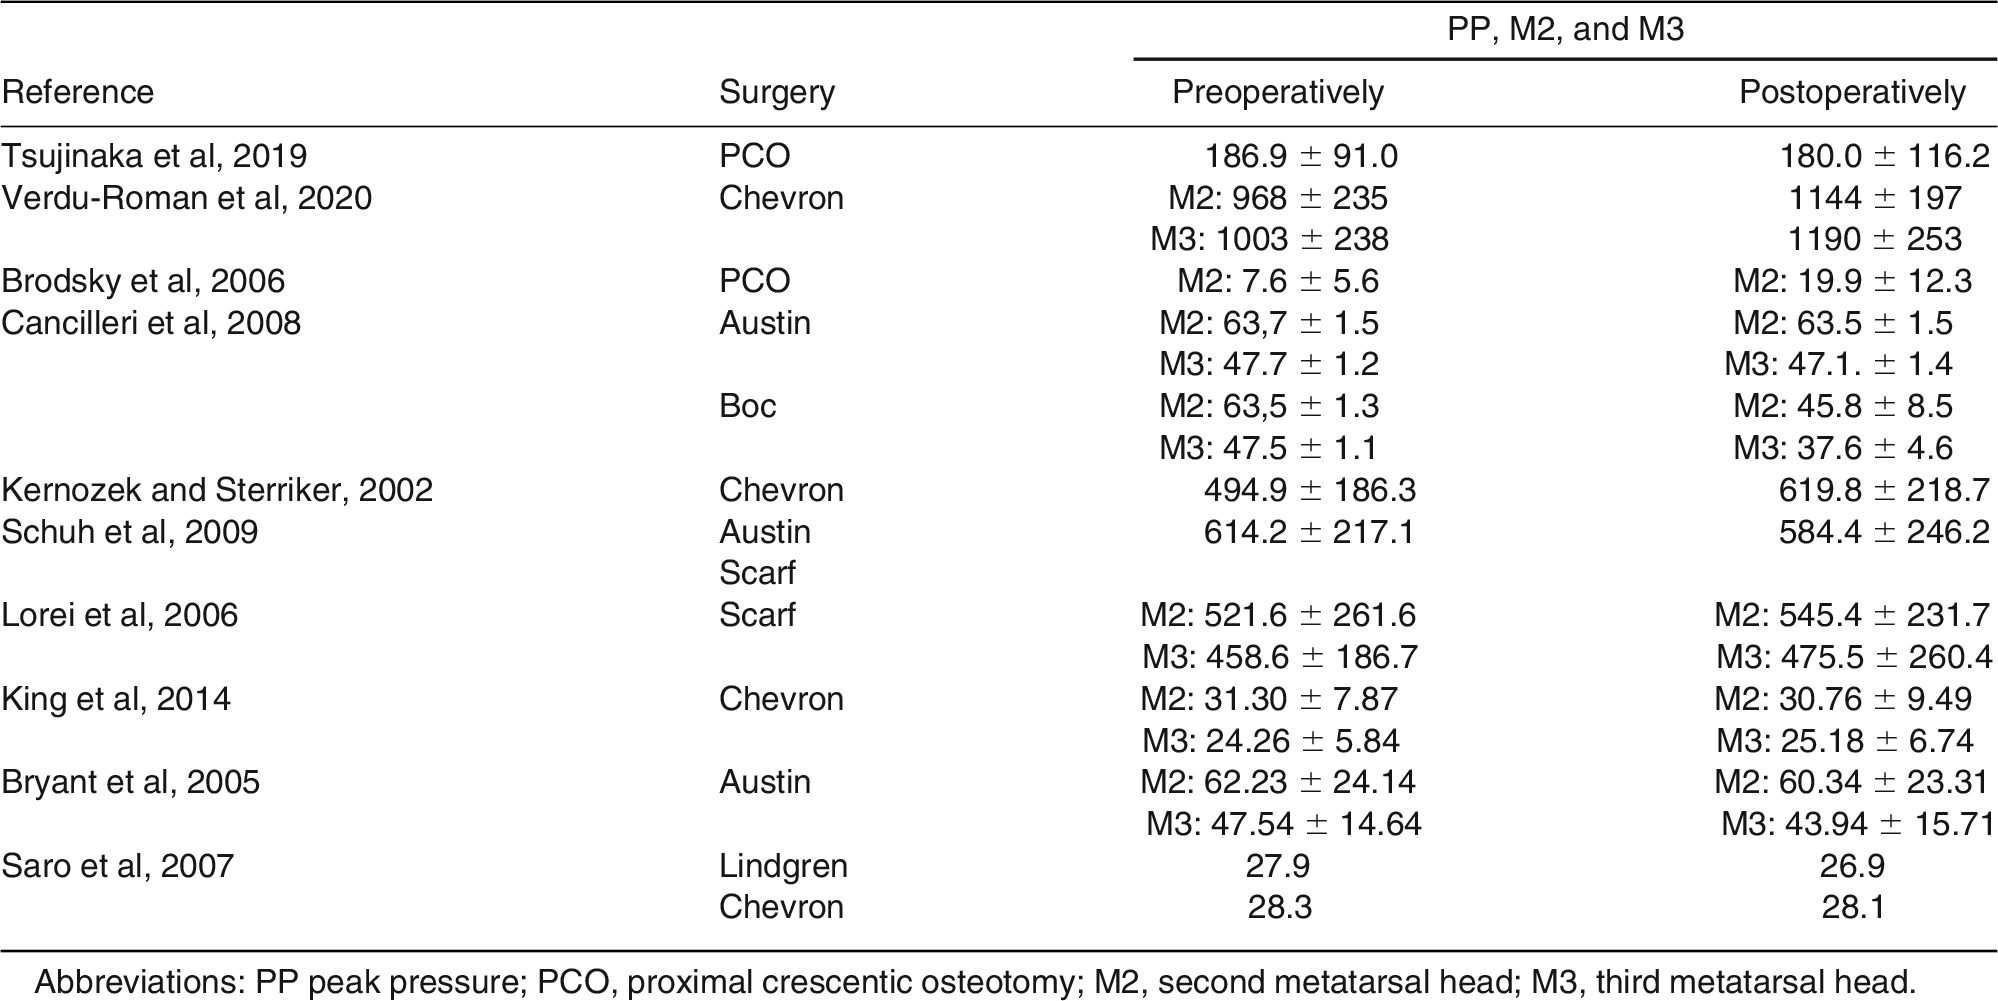
Some software considers the central metatarsal area as a unique region including the second and the third metatarsal heads; others consider the second and the third metatarsal heads as a distinct parameter (Table 3).
Table 3.
Plantar Pressure Parameters at the Hallux and the First Metatarsal Head Before and After Surgery
Differences in Plantar Pressure Parameters Before and After HV Surgery
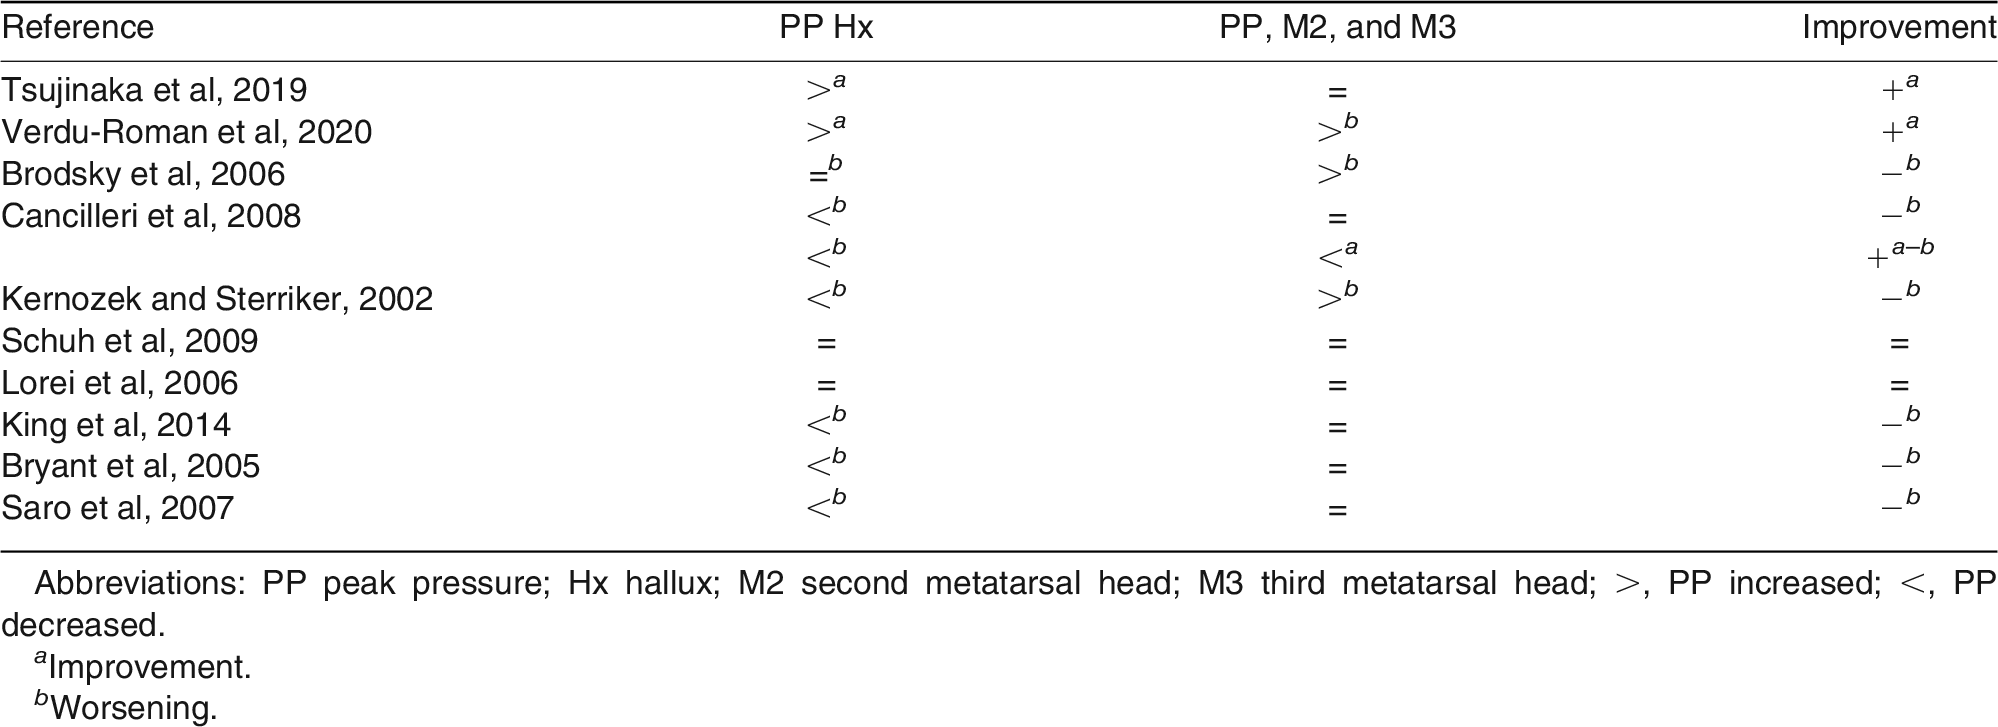
Before surgery, an abnormal overloading pattern at the second and the third metatarsal level, compared to the first metatarsal head, was recorded in all studies, except for three studies [10,12,19]. Plantar pressure of hallux and first metatarsal head data before and after surgery are reported in Table 3. The results show substantially higher PP either at hallux and first metatarsal head from the preoperative to the postoperative period [10,11], whereas many studies reported a lower PP after surgery [12–14,17–19].
Plantar pressure regarding the central metatarsal area before and after surgery are reported in Table 4. Although one study [13] reported a decreasing PP after surgery, others [11,12,14] recorded increasing PP.
Table 4.
Plantar Pressure Parameters of the Central Metatarsal Area
Relationship Between Different Surgical Techniques and the Change in Foot Plantar Pressure Pattern
Different surgical techniques were used in the included studies (Table 3). Chevron/Austin techniques were used in seven studies [11,13–15,17–19], Scarf was used in two studies [15,16], Boc was used in one study [13], Lindgren technique was used in another one [19], and a first metatarsal proximal crescentic osteotomy was used in two studies [10,12].
Some of the authors who performed Chevron/Austin osteotomy reported a loading improvement under the hallux but not at the central metatarsal area [11], whereas others reported [13,14,17,18] a decrease in PP at the hallux level associated with unchanged or increased PP under the second and third metatarsal head region. A concomitant PP decreasing under the hallux with unchanged PP beneath the central metatarsal area was reported for one study that performed Chevron and Lindgren osteotomy without considering outcomes of distinct groups [19].
Schuh et al [15], using Austin and Scarf technique, reported plantar pressure outcomes without considering separate groups and did not record significant changes either at the hallux or the central metatarsal area. The articles reporting results after Scarf osteotomy [16] did not record statistically significance changes. A significant decrease in PP at the central metatarsal area but a simultaneous decrease beneath the hallux level was reported after the Boc technique [13].
Considering proximal crescentic osteotomy technique, in one article, an increased loading under the hallux region associated with unchanged of PP at the central metatarsal area was reported [10]; whereas in another one [12], no substantial loading variations at the hallux level were detected, but an increase in PP at the central metatarsal area was detected.
Relationship Between Clinical and Radiographic Results and the Change in Foot Plantar Pressure Pattern
Patients were clinically and/or radiologically examined before and after surgery. Clinical outcomes were graded using the AOFAS scale, whereas radiologic findings included the measurement of HVA. The results suggest that patients affected by HV, regardless of the surgical techniques used, achieved good postoperative AOFAS score function: it increased from a mean of 50.1 before surgery (range, 35–60.7) to 87.3 (range, 80–94.5) after surgery; similarly, satisfactory restoration of radiologic HVA (mean HVA, 30.7 preoperatively [range, 24.3–36.2]; after surgery, mean HVA, 11.8 [range, 5.4–17.7]) was recorded.
Clinical and radiologic measurement were compared with plantar pressure parameters at the hallux level and the central metatarsal area before and after surgery (Table 5). In two studies [10,11], a variable good relationship between clinical or radiologic outcomes and the plantar pressure data were reported. In particular, one study [11] recorded a combination of excellent AOFAS scale score (ie, 93.3), and a substantial increase in PP under the hallux level; and one article [10] showed an HVA less than 15 associated with a significant increase in loading distribution at the hallux level.
Table 5.
Radiologic and Clinical Measurement Related to Plantar Pressure Parameters Before and After Surgery
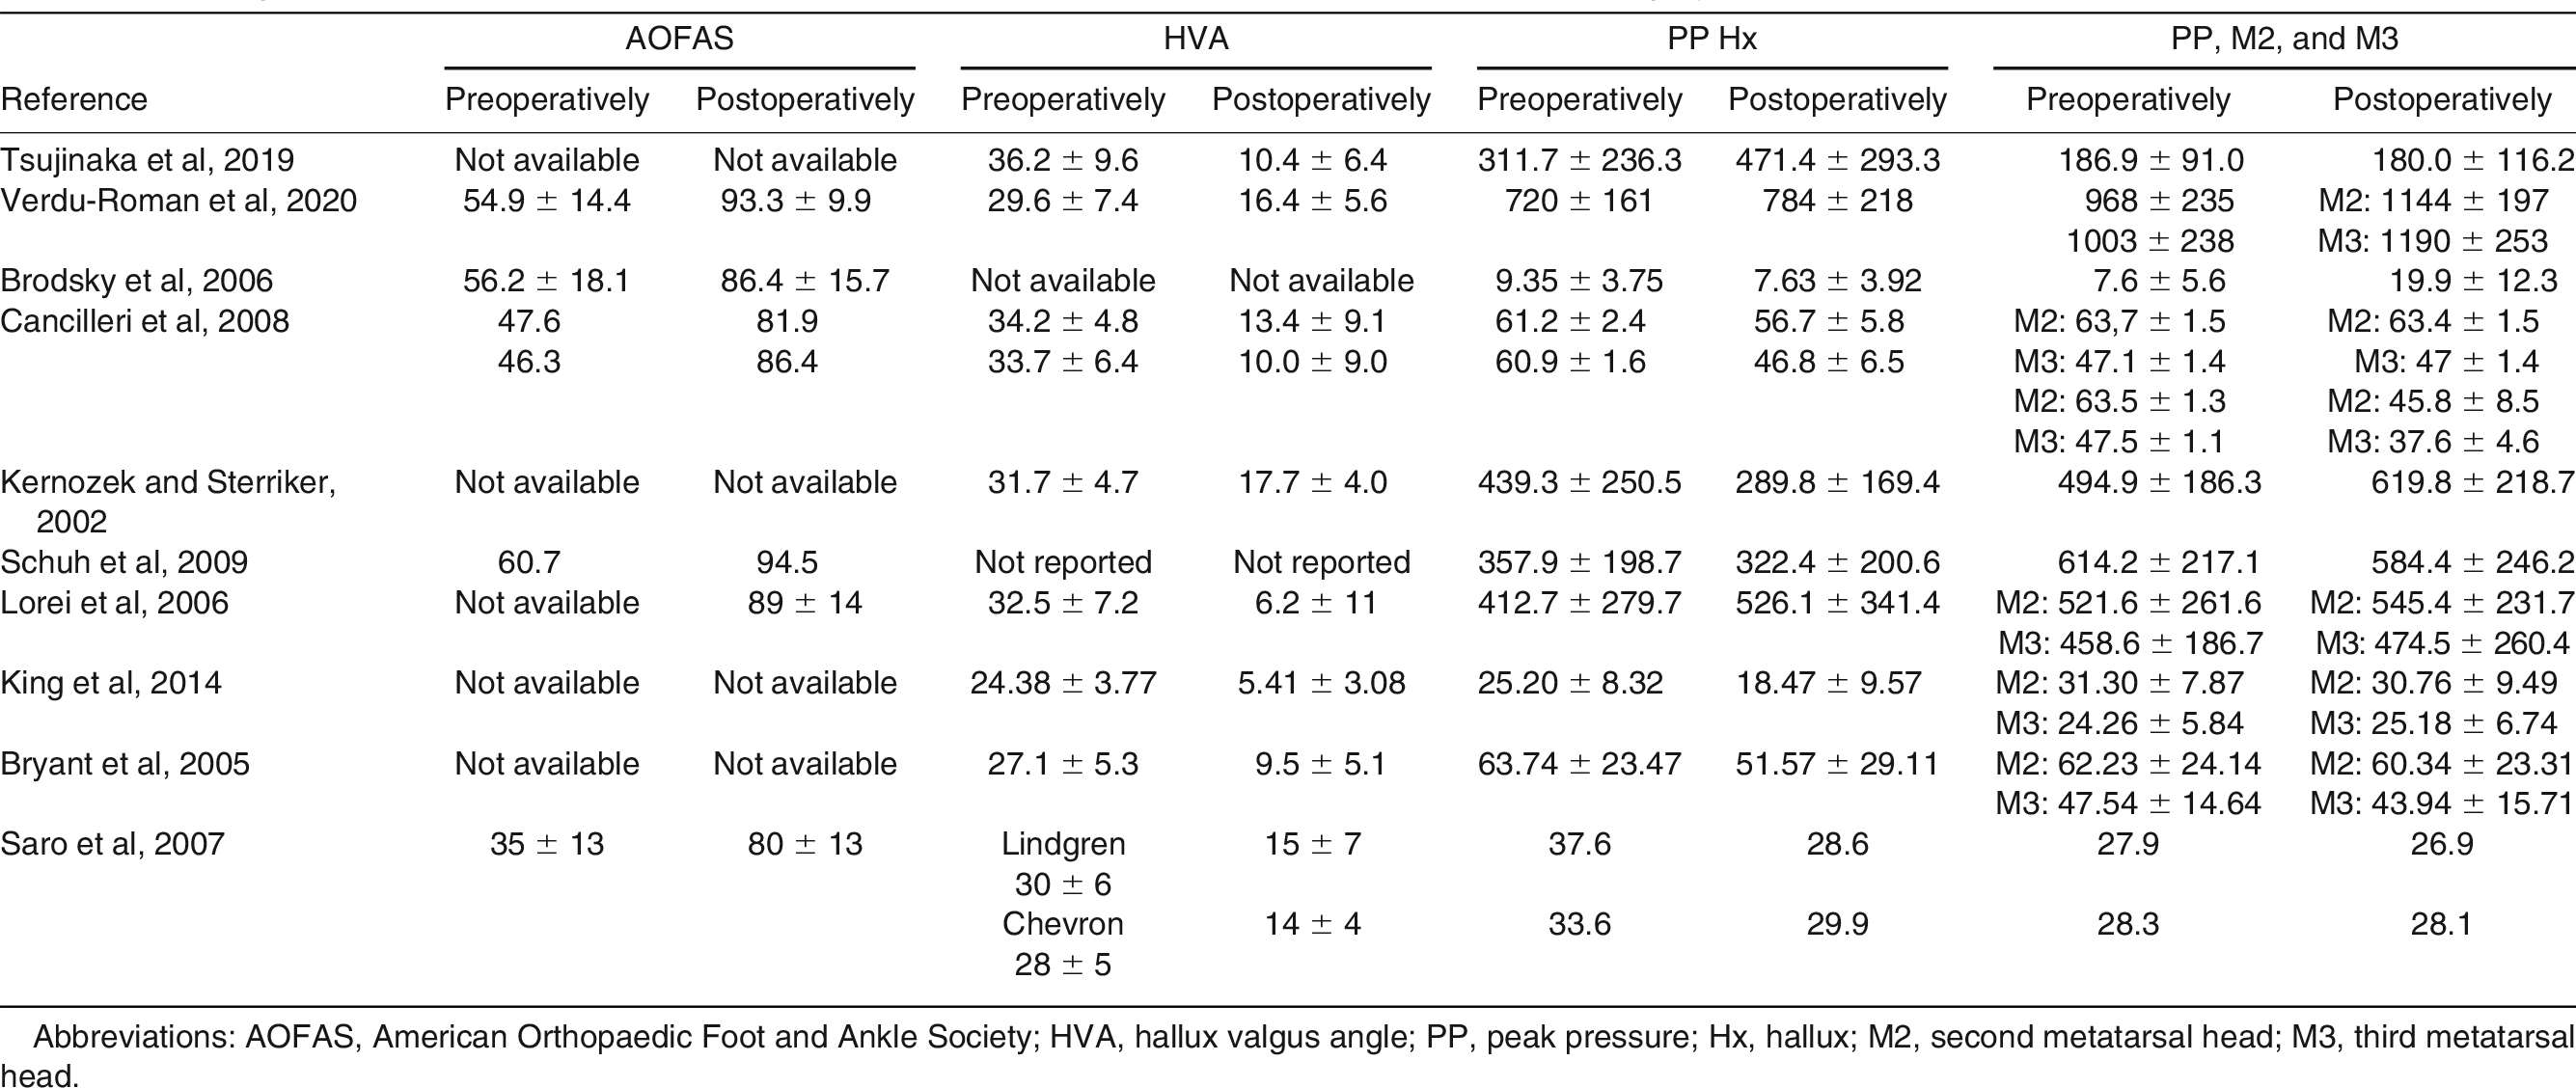
No study reported a simultaneous increase of loading distribution at the hallux level and PP decreasing in the central metatarsal heads (Tables 3 and 4). Despite the good radiologic and clinical outcomes, a PP decreasing beneath the central metatarsal heads was not always associated with an increase in plantar pressures at the hallux [13]. Two studies [15,16] recorded good AOFAS score and good radiologic outcome; however, the plantar pressure distribution pattern did not show significant variation after surgery compared to the preoperative period.
Discussion
Although HV deformity is a common condition, it is still difficult to objectify functional results after surgical correction. Plantar pressure measurement has been recently used to evaluate functional results after HV surgery. This technology is easy to use, straightforward, and may be used as a standard measurement tool to increase the reliability and comparability of results.
For this reason, we decided to evaluate the available literature and analyze plantar pressure distribution before and after HV surgery. Currently, two evaluation systems are used for plantar pressures analysis: plantar platform systems, used in the most studies, and in-sole systems. The main advantage of plantar platform systems is good spatial resolution, but the main limitations include the space required for the measurement, and the patient’s ability to contact the platform [23].
The in-sole system is flexible and embedded in the shoe; it is therefore portable and allows a wider variety of parameters to be evaluated, such as different gait tasks, footwear designs, and terrains [23]. Nevertheless, the in-sole system has low spatial resolution of the data compared to platform systems because of fewer sensors.
The plantar pressure systems seem to be an inexpensive tool, but no details in terms of cost are reported in literature, and this issue should be evaluated in future studies. The plantar pressure analysis resulted in variable postoperative pressure patterns compared to preoperative data (Table 6). Successful surgery should theoretically reverse the offloading mechanism of the first ray and decrease overload of the central metatarsal heads [22]. However, the results suggest that, despite an improvement in the hallux loading, reported as an increase in PP, in some cases, an overload of the central metatarsals remains [10,11]. Vice versa, the offload of the central metatarsal heads is not always associated with an increase in plantar pressures at the hallux [13]. These data demonstrate that, after HV correction surgery, each forefoot area seems to improve or worsen in plantar pressures, independent of the adjacent region.
Table 6.
Plantar Pressure Patterns After Surgery
Two studies [10,18] compare HV group outcomes with a control group. In one study [10] after surgery, no parameter of the great toe was considerably different between the operation group (OG) and the control group (CG), whereas the mean PP at the central forefoot was substantially higher in the OG than in the CG. In another study [18], the pressures beneath the first, second, and third metatarsal heads were significantly higher than in the CG.
Based on the data considered in this article, it is not possible to establish a superiority between different surgical techniques in terms of plantar pressure distribution values (Tables 3 and 4). In the review process, we decided to exclude articles with patients who underwent concomitant lesser metatarsal osteotomies, to avoid possible confounding factors. However, associated surgical procedure to hallux valgus correction may change plantar pressure distributions.
A recent article [24] reported the increase in PP at the hallux level together with simultaneous offload of the second metatarsal head after a first metatarsal proximal crescentic osteotomy together with lesser metatarsal proximal shortening osteotomy. The concomitant lesser metatarsal surgical procedure could explain the reason for the better pressure pattern compared to cases in which intervention was only at the first metatarsal level. Moreover, the study [24] showed no significant differences between the OG and the CG.
Regardless of the different surgical procedures for HV correction, all studies reported a satisfactory AOFAS score and/or a good HVA restoration, but only few studies [10,11] showed an association between the good clinical and radiologic outcomes and a substantial increase in loading distribution at the hallux level. All the articles seemed to have comparable sample sizes and similar characteristics with respect to the patient’s sex prevalence, age, and body mass index (Table 2). However, the data interpretation could be flawed by some bias. First, HV deformity in different articles had heterogeneous severity grading. In addition, the foot pain may have distorted the plantar pressure values because the patient could have adopted antalgic positions during tests. The extrapolated data are difficult to compare between studies because of the different software used among the studies; moreover, only a few articles reported a complete series of data, before and after surgery, regarding radiologic and clinical parameters, and plantar pressure distribution measurements.
Because of these methodologic limitations, it is not possible to provide sufficiently supported evidence-based data regarding plantar pressure distribution rebalance after surgery. All patients achieved satisfactory clinical and radiographic outcomes, regardless of surgical techniques used; however, no clear relationships were observed between clinical and radiographic results, and the change in foot plantar pressure patterns.
Conclusions
Based on the analysis performed, little evidence regarding plantar pressure distribution rebalance after surgery is reported by the current literature. Further studies are therefore necessary to facilitate comparison of results across studies, and to overcome current issues.
Financial Disclosure: None reported.
Conflict of Interest: None reported.
References
- Coughlin MJ, Mann RA: “Adult hallux valgus,” in Surgery of the Foot and Ankle, 7th Ed, p 297, Mosby, St. Louis, 2007.
- Jacob HA: Forces acting in the forefoot during normal gait—an estimate. Clin Biomech (Bristol, Avon) 16: 783, 2001.
- Rodgers MM: Dynamic biomechanics of the normal foot and ankle during walking and running. Phys Ther 68: 1822, 1988.
- Myerson MS, Badekas A: Hypermobility of the first ray. Foot Ankle Clin 5: 469, 2000.
- Coughlin MJ, Jones CP: Hallux valgus: demographics, etiology, and radiographic assessment. Foot Ankle Int 28: 759, 2007.
- Giannini S, Faldini C, Nanni M, et al: A minimally invasive technique for surgical treatment of hallux valgus: simple, effective, rapid, inexpensive (SERI). Int Orthop 37: 1805, 2013.
- Deschamps K, Birch I, Desloovere K, et al: The impact of hallux valgus on foot kinematics: a cross-sectional, comparative study. Gait Posture 32: 102, 2010.
- Hida T, Okuda R, Yasuda T, et al: Comparison of plantar pressure distribution in patients with hallux valgus and healthy matched controls. J Orthop Sci 22: 1054, 2017.
- Waldecker U: Metatarsalgia in hallux valgus deformity: a pedographic analysis. J Foot Ankle Surg 41: 300, 2002.
- Tsujinaka S, Shima H, Yasuda T, et al: Comparison of plantar pressure distribution between postoperative hallux valgus feet and healthy feet. Foot Ankle Int 40: 578, 2019.
- Verdu-Roman C, Sanz-Reig J, Martinez-Gimenez E, et al: Plantar pressure improvement in moderate hallux valgus with modified chevron osteotomy: clinical and radiographic outcomes. Foot Ankle Surg 26: 205, 2020.
- Brodsky JW, Beischer AD, Robinson AHN, et al: Surgery for hallux valgus with proximal crescentic osteotomy causes variable postoperative pressure patterns. Clin Orthop Relat Res 443: 280, 2006.
- Cancilleri F, Marinozzi A, Martinelli N, et al: Comparison of plantar pressure, clinical, and radiographic changes of the forefoot after biplanar Austin osteotomy and triplanar Boc osteotomy in patients with mild hallux valgus. Foot Ankle Int 29: 817, 2008.
- Kernozek TW, Sterriker S: Chevron (Austin) distal metatarsal osteotomy for hallux valgus: comparison of pre- and post-surgical characteristics. Foot Ankle Int 23: 503, 2002.
- Schuh R, Hofstaetter SG, Adams SB, et al: Rehabilitation after hallux valgus surgery: importance of physical therapy to restore weight bearing of the first ray during the stance phase. Phys Ther 89: 934, 2009.
- Lorei TJ, Kinast C, Klärner H, et al: Pedographic, clinical, and functional outcome after scarf osteotomy. Clin Orthop Relat Res 451: 161, 2006.
- King CM, Hamilton GA, Ford LA: Effects of the Lapidus arthrodesis and chevron bunionectomy on plantar forefoot pressures. J Foot Ankle Surg 53: 415, 2014.
- Bryant AR, Tinley P, Cole JH: Plantar pressure and radiographic changes to the forefoot after the Austin bunionectomy. JAPMA 95: 357, 2005.
- Saro C, Andrén B, Felländer-Tsai L, et al: Plantar pressure distribution and pain after distal osteotomy for hallux valgus: a prospective study of 22 patients with 12-month follow-up. Foot 17: 84, 2007.
- Moher D, Liberati A, Tetzlaff J, et al: Preferred reporting items for systematic reviews and meta-analyses: the PRISMA statement. Ann Intern Med 151: 264. 2009.
- Moga C, Guo B, Schopflocher D, et al: Development of a quality appraisal tool for case series studies using a modified Delphi technique. Institute of Health Economics Alberta, Canada, 2012. Available at: https://www.ihe.ca/advanced-search/development-of-a-quality-appraisal-tool-for-case-series-studies-using-a-modified-delphi-technique. Accessed June 8, 2022.
- Orlin MN, McPoil TG: Plantar pressure assessment. Phys Ther 80: 399, 2000.
- Abdul Razak AH, Zayegh A, Begg RK, et al: Foot plantar pressure measurement system: a review. Sensors 12: 9884, 2012.
- Togei K, Shima H, Yasuda T, et al: Plantar pressure distribution in hallux valgus feet after a first metatarsal proximal crescentic osteotomy with a lesser metatarsal proximal shortening osteotomy. Foot Ankle Surg 27: 665, 2021.
© 2023 American Podiatric Medical Association