


Abstract
Background: Foot problems are reported by approximately 70% to 80% of adults and 30% of children. One of the most important characteristics affecting its incidence is medial longitudinal arch. Assessing arch height provides valuable information for prescribing appropriate footwear that reduces the consequences of flatfoot. The main goals of this study were to explore epidemiologic factors that affect arch height and to predict arch height in children with flatfoot based on five variables using widely accessible, low-cost tools. Methods: This study examined plantar arch height in 80 children with flatfoot aged 7 to 15 years. The evaluation criteria included low arch height, correct knee and heel position, and correct body symmetry. To measure arch height, the children sat in a chair and placed their feet on level ground. A caliper was used to measure the height between the bottom of the navicular tuberosity and the floor. Using least mean square error scheme, a multivariable model was fitted to the plantar arch height for all of the participants using independent variables, including age, Cole index, sex, place of residence, and physical activity. Results: Arch height increased as age increased in boys and girls in rural and urban areas. A significant increase in arch height occurred in 12- to 15-year-old boys and 10- to 15-year-old girls. In boys, arch height was 30% lower than in girls (P = .05). In children in cities, arch height was lower by 26% than in children in rural areas (P = .05). Arch height increased by 41.8% in inactive boys and by 115.2% in inactive girls in rural areas. It was reduced by 59.4% in boys and by 47.4% in girls as the Cole index increased from 82.2 to 152.0. The suggested model predicted arch height using the child’s age, Cole index, sex, place of residence, and physical activity (r > 0.97, error < 0.04 mm [2%], P < .05). Conclusions: Flat feet in children may be affected by age, sex, Cole index, place of residence, and physical activity. The proposed model allows plantar arch heights in children with flat feet to be predicted without the need for sophisticated technology via controlling the child’s weight and physical activity for prescribing appropriate footwear.
Foot problems are reported by approximately 70% to 80% of adults and 30% of children. Flatfoot is a common foot deformity in children[1,2] that has been associated with reduced walking speed, higher plantar pressure distribution, difficulty in performing activities of daily living, increased risk of falls, and other deformities in future life, such as scoliosis and posture problems.[3–7] Flatfoot is an informal reference to a medical condition in which the arch of the foot collapses, with the entire sole of the foot coming into complete or near-complete contact with the ground. One common way to categorize the human foot is using arch structure.
There are several methods for assessing the medial longitudinal arch; most are quantitative arch measures, and some are based on observation. Medial longitudinal arch height is one of the characteristics presenting the level of variability in the human foot. It provides a quantitative measurement of the plantar arch that can be compared with other measurements. Various techniques have been reported to assess arch height, with radiographic measurements and footprint analysis being the most commonly used methods.[1,2] Some authors[8] have classified the nonweightbearing foot as either high or low arched by visual assessment alone. Even among experienced clinicians, however, visual categorization of the arch is highly inconsistent. Arch height may be used for diagnosis of abnormal foot biomechanics due to flatfoot. Several studies[4–7] have explored the causes of flat feet, but, to date, little is known about the factors affecting the development of flat feet in children.
Recognition of epidemiologic and anthropometric factors affecting the normal development of the foot and the mechanism by which foot problems increase risks of flat feet have not been explored in detail. Several factors have been associated with arch height; however, the effect of age, Cole index, sex, physical activity, and place of residence on arch height is not entirely clear from the available literature. The main goals of this study were to explore the epidemiologic factors affecting arch height and to develop a model to predict arch height in children with flatfoot using five variables that could be determined using widely accessible and low-cost tools. To our knowledge, no model has been proposed to predict flat feet in children that addresses the possible contributions of body weight and physical activity.
Methods
Participant Recruitment
The evaluation was performed on a convenience sample of 80 symptomatic flexible flat feet in children aged 7 to 15 years (51.3% girls). This sample is representative of other primary schools in Poland. Children were randomly selected from a total population of 450 primary schoolchildren. The study received ethical approval in accordance with the Bialystok Medical Chamber institutional review board. All of the parents provided informed consent before the start of measurement. Participants were screened via a detailed medical history and were not treated for any systematic disease. Clinical diagnosis of flat feet was based on observation of ankle dorsiflexion and plantarflexion and on rearfoot, midfoot, and forefoot ranges of motion in triplane. Gait observation was conducted when the child was barefoot. The inclusion criteria were age 7 to 15 years, sex differential, differential association of Cole index and place of residence, low arch height of bilateral feet (<20 mm), heel position, and body symmetry (Table 1).
The exclusion criteria were injuries and a gait or any other disorder different from flatfoot. The child’s body weight was measured using a scale with resolution of 100 g. The child’s height was measured by stadiometer. The Cole index was used to describe body mass and height because it is more accurate for children.[9] The Cole index was determined as follows:
 where mc indicates body mass (in kilograms); wc, body height (in centimeters); wcst, standard body height (in centimeters); and mcst, standard body mass (in kilograms). Standard body mass and standard body height were determined from centile curves for boys and girls separately.[10] The standard body mass was approximately the 50th centile. The Cole index range was presented as follows: less than 75 indicates emaciation; 75 to 85 indicates malnutrition; 85 to 90 indicates low malnutrition; 90 to 110 indicates typical; greater than 110 indicates excessive nutrition.
Measurement Protocol
Measuring the Calcaneal Inclination Angle and the Calcaneal–First Metatarsal Angle
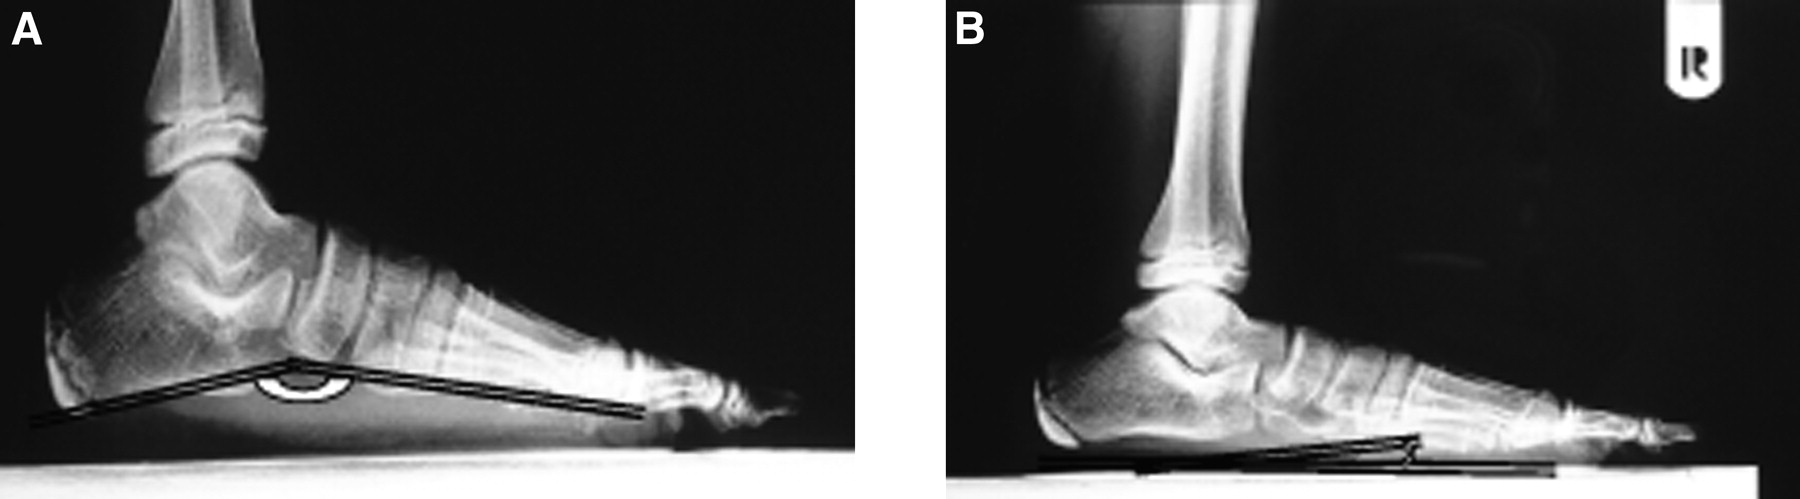
Radiographs of the feet were used to evaluate the severity of the flatfoot during full weightbearing (radiography at the anteroposterior and mediolateral planes). Specifically, the calcaneal inclination angle and the calcaneal–first metatarsal angle were estimated from radiographs to assess foot abnormality.[11] The calcaneal inclination angle was defined as the angle between the tangent to the inferior surface of the calcaneus and the platform on which the foot is standing. The calcaneal–first metatarsal angle was defined as the angle subtended by the tangent to the inferior surface of the calcaneus and the first metatarsal.[12]
Measuring Arch Height
Flatfoot was also evaluated based on measuring arch height. To measure arch height, the children sat in a chair and placed their feet on level ground. A caliper was used to measure the height between the bottom of the navicular tuberosity and the floor. The measurement was repeated three times. Participants were tested in random order.
Measuring Children’s Physical Activity
The Physical Activity Questionnaire for Older Children was used to assess the physical activity of the children.[13] The same questionnaire was completed by child and parent (mainly mothers) separately on the same day. The information gathered was leisure-time physical activity (biking, gymnastics, swimming, football, volleyball, basketball, etc). Children and parents were asked about the children’s activity (talking, reading, doing homework, running, walking around, etc) in the previous 7 days during the lunch period, right after school, evenings, the previous weekend, and for each day in the previous week. Physical activity was determined in minutes per week. Additional children and parents were asked about the elements of a sedentary lifestyle (watching television, watching videos, playing computer games, reading a book, and doing homework) during the average summer and winter weeks for the year before the interview.
Table 1.
Participant Anthropometric and Foot Posture Characteristics
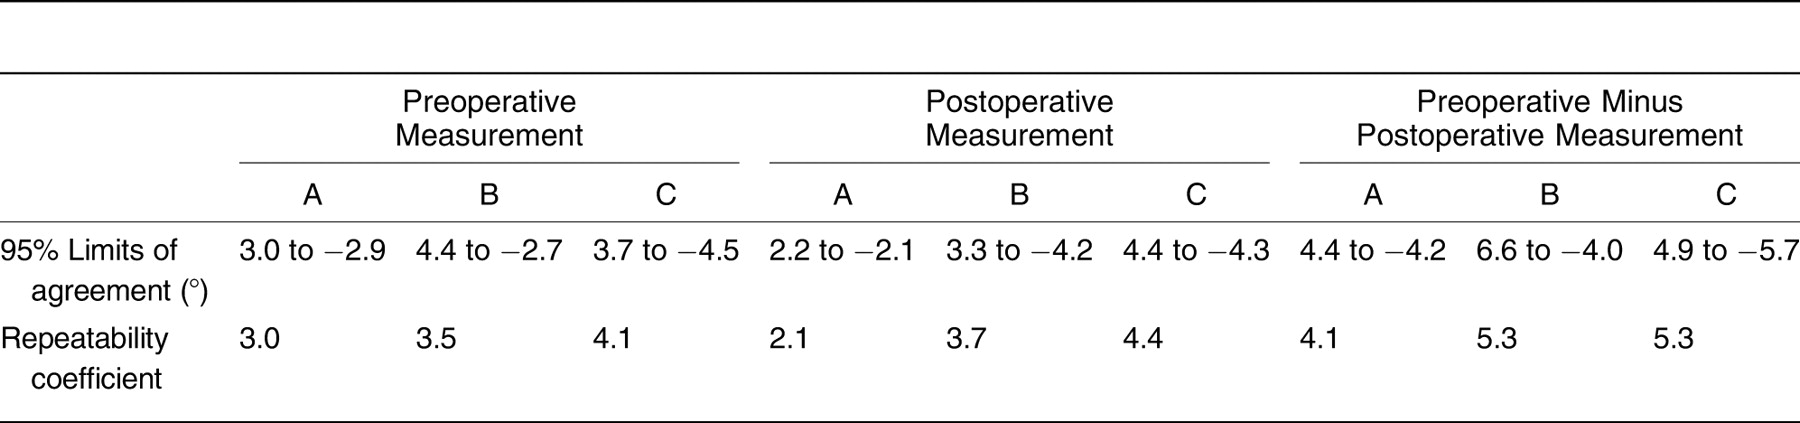
Model for Estimating Arch Height
The following model was suggested to estimate arch height (Ŷ):
 where Ŷ is the dependent variable (model output); X1 . . . X5, the independent variables (model input); and a1 . . . a5, model coefficients.
Independent variables in this model were age (denoted as X1), Cole index (denoted as X2), sex (denoted as X3), place of residence (denoted as X4), and physical activity (denoted as X5). To estimate the model coefficients, the least squares method was used[14] based on the following formula:
 where X is the matrix of independent variables Xj; XT, the transposition of matrix X; and Y, the vector of dependent variables. Sex, place of residence, and physical activity were assigned discrete levels as follows: girls (−1) and boys (+1), urban (+1) and rural (−1), and high physical level (+1), middle physical level (0), and low physical level (−1).
Statistical Testing and Model Development
The agreement between variable distributions and normal distributions was used to fit the model and to conduct statistical comparisons. Outliers were excluded with the Shapiro-Wilk test before modeling and statistical analysis. The degree of correlation between independent and dependent variables was examined with the Spearman rank correlation. Coefficients were assumed to have no significant impact on output if their P values were greater than 0.05. Accuracy was examined using root mean square error between measured (Y) and predicted (Ŷ) data. The agreement in physical activity declared by children and parents was tested with Landis and Koch categories.[15] Time spent by the child on physical activity was qualified to one of three categories: low activity levels (less than the first quartile), middle activity levels (middle quartile), and high activity levels (greater than the third quartile).[15] The time spent on different forms of physical activity declared by child and parent was examined using the Spearman rank correlation. Means and standard deviations were calculated for the total participant sample for the data from the anthropometric measurements. A commercially available software program (Statistica 8.0; StatSoft Inc, Tulsa, Oklahoma) was used for the statistical computations.
Results
Diagnosis of Flatfoot
The mean ± SD body mass index (calculated as weight in kilograms divided by height in meters squared) was 40.4 ± 9.9, Cole index was 108.7 ± 14.2, and arch height was 10.9 ± 4.6 mm. The children were divided into two groups: those living in cities (51.3%) and those living outside of town (rural). Regression assumes that variables have a normal distribution; nonnormally distributed variables can distort relationships and significance tests. Based on the Shapiro-Wilk test, 20 observations of flat feet in children did not fall into a normal distribution, so further analysis was performed on only the 60 patients with flat feet.
Figure 1 illustrates typical radiographs used for measuring the calcaneal–first metatarsal angle and the calcaneal inclination angle. Using radiographic images, the value of the calcaneal inclination angle was 145° to 150° (P < .05). However, the value of the calcaneal–first metatarsal angle was 14° to 20° (P < .05).
Assessing Children’s Physical Activity Levels
Sixteen children with flat feet had high levels of physical activity (weekly time spent on different types of physical activity was ≥325.4 min), six children had middle levels of physical activity (weekly time spent on different types of physical activity was ≥99 min and 325.4 min), and 38 children had low levels of physical activity (weekly time spent on different types of physical activity was ≤99 min). The most popular forms of physical activity were bicycle riding (100%), swimming (40%), and playing football (40%). The least popular forms were gymnastics, volleyball, and basketball. Passive activities included watching television (100%), playing computer games (90%), and doing homework (100%). The least popular activity was reading a book (18%).
Most categories of leisure-time physical activity and sedentary lifestyle did not differ significantly from child and parent declaration. However, the differences between child and parent reports were statistically significant, especially in time spent on biking (mean ± SD: 102.3 ± 185.4 min/week by child declaration versus 85.4 ± 151.2 min/week by parent declaration, P < .05). On the same note, the results showed significant differences for playing football (mean ± SD: 102.0 ± 136.8 min/week by child declaration versus 88.5 ± 131.3 min/week by parent declaration, P < .05) and reading a book (mean ± SD: 165.0 ± 141.8 min/week by child declaration versus 123.4 ± 143.7 min/week by parent declaration, P < .05). Significant differences were also observed in time spent watching television (mean ± SD: 824.6 ± 386.5 min/week by child declaration versus 603.7 ± 465.1 min/week by parent declaration, P < .05). However, for most analyzed categories of physical activity, significant correlation coefficients (r > 0.50) were observed, and the agreement between child and mother agreement was substantial (κ > 0.6). For time spent in a sedentary lifestyle, correlation coefficients were fair.
Model-Fitting Results
Five independent variables were used to assess epidemiologic factors affecting plantar arch development in children with flat feet: age (X1), Cole index (X2), sex (X3), place of residence (X4), and physical activity (X5). The independency among the five variables was confirmed by examining the correlation coefficients (r < 0.3, P > .05). Specifically, matrix Rx represents the correlation analysis between age, Cole index, sex, place of residence, and physical activity.
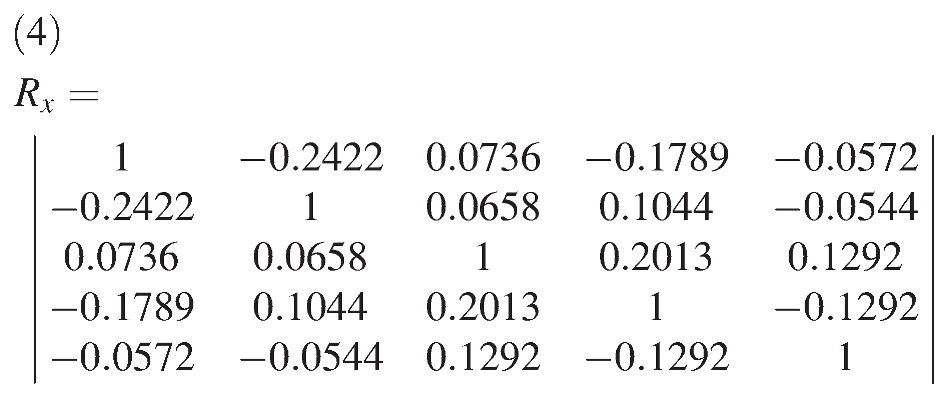 In addition, the correlations between the dependent variable (Y = arch height) and age, Cole index, sex, place of residence, and physical activity were rx1,y = 0.50, rx2,y =−0.54, rx3,y =−0.34, rx4,y =−0.57, and rx5,y = 0.27, respectively (P < .05 for all). Statistical analysis of the model’s coefficients showed that the model coefficients (a23, a24, a34, and a35) are not significant (P > .05) and, therefore, were excluded from the model. The final version of the regression model is as follows:
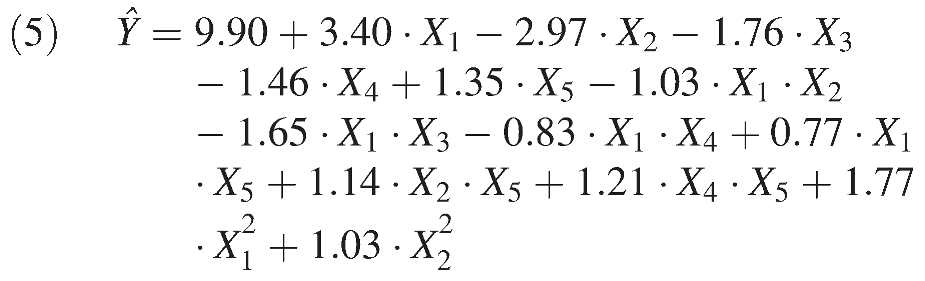
All of the coefficients had a significant impact on the final outcome (P < .05). The root mean square error between the model output (Ŷ) and the measured value (Y) was ∑ (Yi − Ŷi)2 = 7.7123. Similarly, the results suggest that the model fitted the measured values (R2 =0.97, S2r = 0.162, f1 = 59, f2 = 46).
These results demonstrate differences in arch height according to age, sex, Cole index, place of residence, and physical activity. Arch height increased by 80% in active boys and by 145.4% in active girls in rural areas as age increased from 7 to 15 years (Fig. 2). The highest increase in arch height was found during pubescence (age 12 to 15 years for boys and 10 to 15 years for girls). In addition, the results suggest a reduction in arch height (27% in boys and 21.7% in girls) as the Cole index increased from 82.2 to 152.0.
Figure 1.
Radiographic parameters for measuring the calcaneal–first metatarsal angle (A) and the calcaneal inclination angle (B).
It was found that arch height increased by 33.5% in active boys and by 96.8% in active girls in cities as age increased from 7 to 15 years (Fig. 3). Similarly, the results show the higher increase in arch height during pubescence. The results suggest a reduction of 28.4% for boys and 22.3% for girls in arch height as the Cole index increased. Finally, arch height increased more in active girls in cities and in active children in rural areas.
These results show that arch height increased by 41.8% in inactive boys and by 115.2% in inactive girls in rural areas as age increased. However, arch height was reduced by 59.4% in boys and by 47.4% in girls as the Cole index increased. In addition, arch height increased more in inactive boys in rural populations.
Figure 2.
Effect of age and Cole index on arch height in active boys (A) and girls (B) in rural areas.
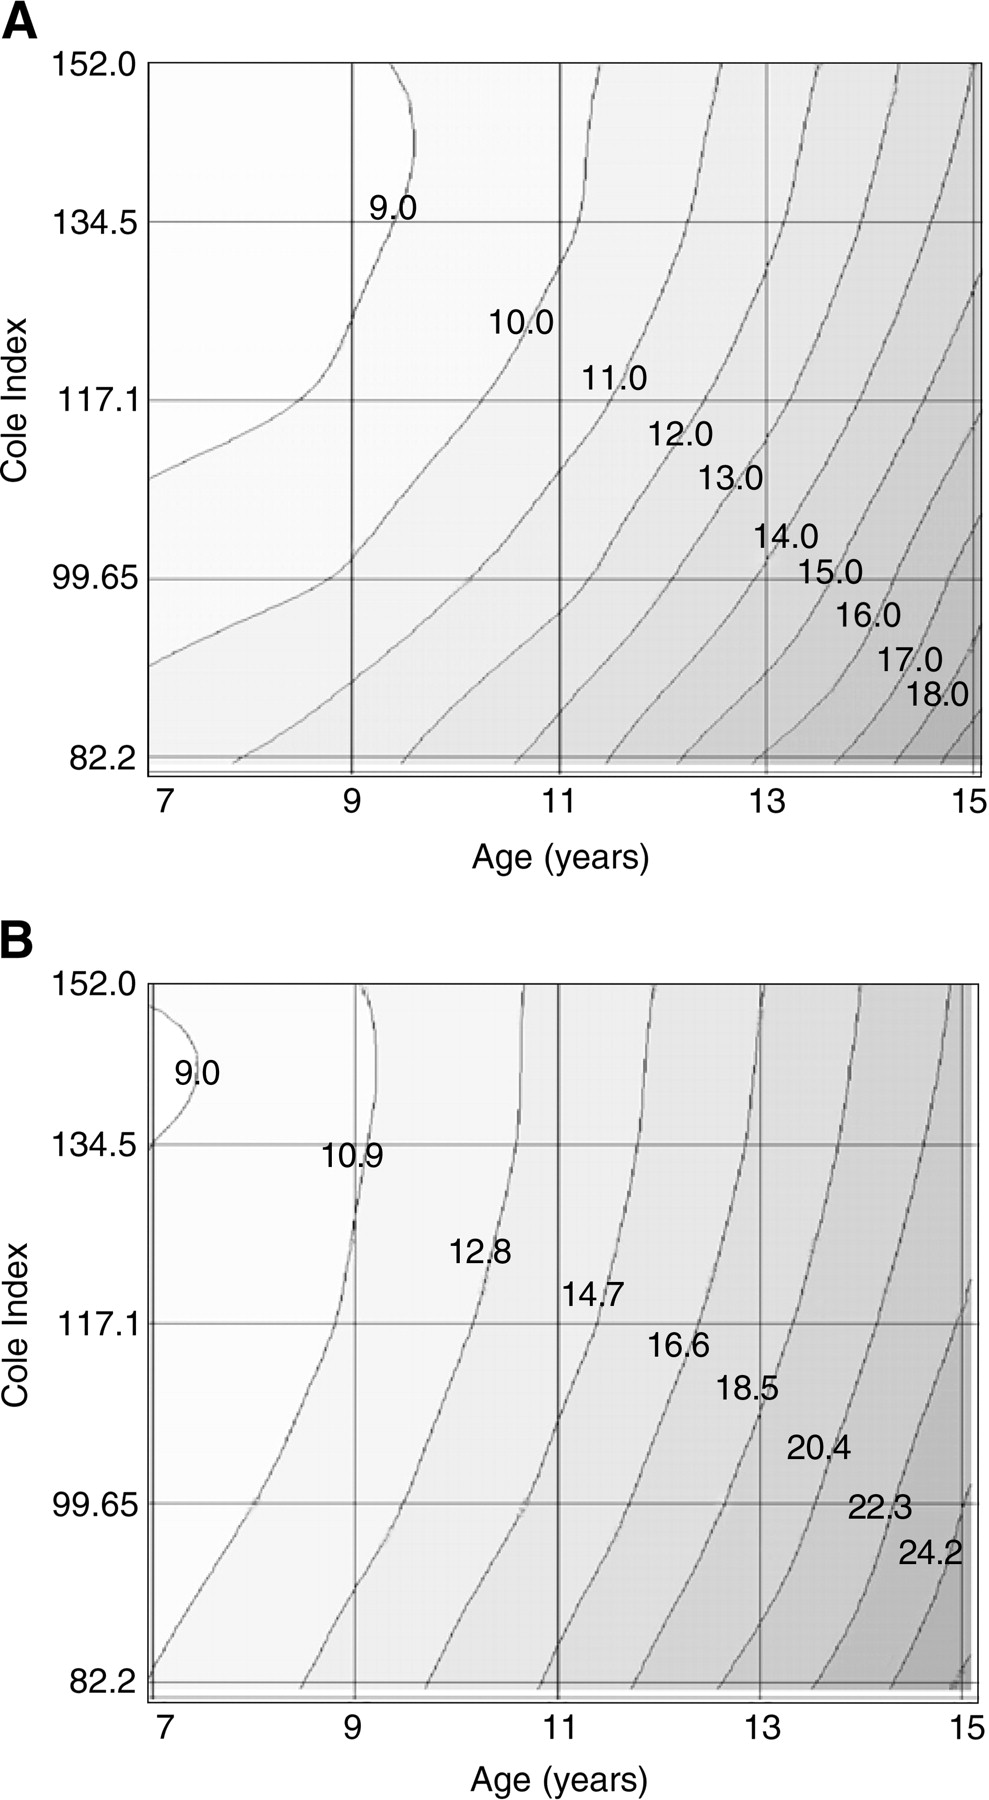
These results suggest that arch height increased by 32.6% in inactive boys and by 132.9% in inactive girls in cities. It was reduced in inactive boys by 96.8% and in inactive girls by 68.4% as the Cole index increased from 82.2 to 152.0. In addition, arch height increased more in low-activity boys in cities. Finally, although arch height increased as physical activity increased, it decreased as the Cole index increased. Moreover, arch height was lower by 30% in boys than in girls. A statistically significant difference was also observed between the urban and rural populations. Arch height in urban children was 26% lower than that in children in rural areas.
Figure 3.
Effect of age and Cole index on arch height in active boys (A) and girls (B) in cities.
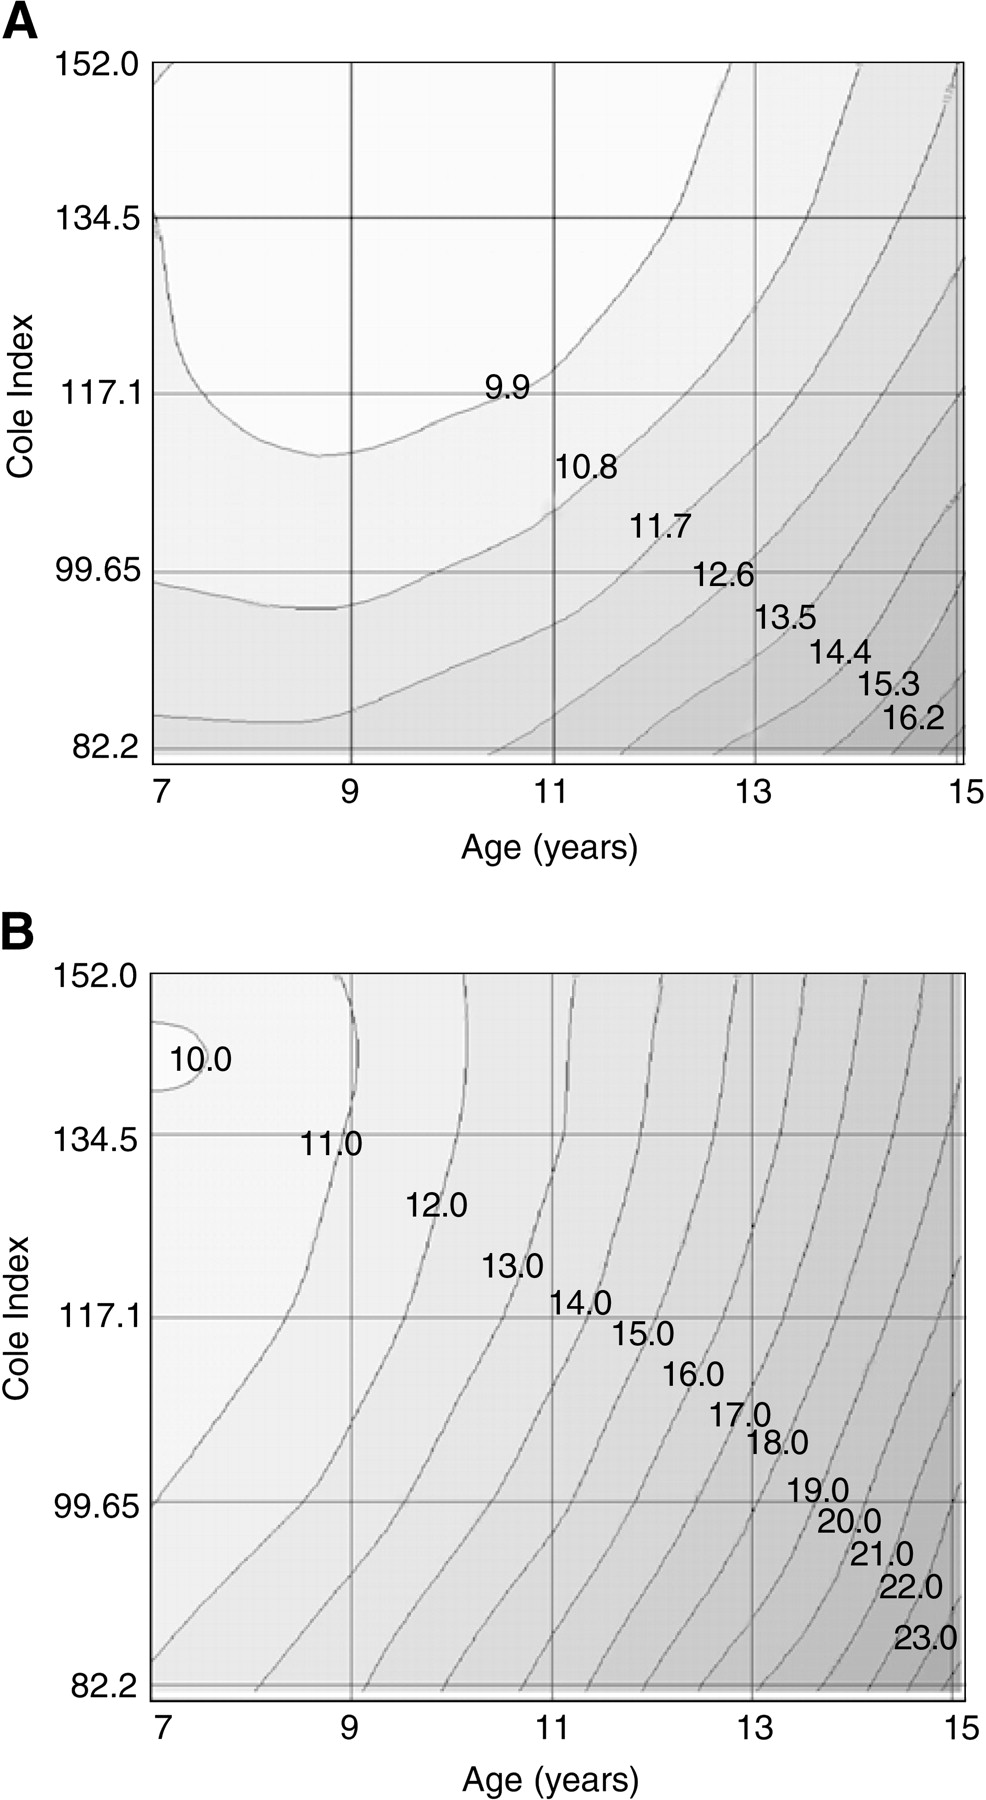
Discussion
Despite the many investigations on development of the plantar arch in children, little is known about the factors affecting plantar arch height in children with flat feet. The present results suggest that arch height is affected by age, Cole index, sex, place of residence, and physical activity.
There are few reports in the literature concerning the influence of these factors on arch height in children, especially in healthy children. Rose[16] states that the critical age for development of the plantar arch is 6 years. Some authors, such as Volpon,[17] state that the feet of most children who displayed the condition as infants become structurally normal by the time they are 12 years old. In contrast, the present results show that there is rapid growth in arch height after age 12 years in boys and around age 12 years in girls.
The most significant difference was observed for arch height in active and inactive children living in rural areas: approximately 40% higher in active boys and 30% higher in active girls. This increase suggests that arch height increased faster in active children than in children with flat feet who are inactive. This finding is consistent with the results reported by Furgal and Adamczyk,[18] who demonstrated progression of all of the foot components in physically active children. They analyzed the difference in arch height in 100 typical children (50 active children and 50 inactive children) aged 9 to 10 years. This is also consistent with the results reported by Kutzner-Kozinska,[19] who assessed arch height in typical children. However, Galas and Florek[20] showed that the structure of the feet in children who participated in sports was different from that of the nonactive children.
Considering how difficult it is to determine the impact of different factors on arch height in children, we explored the feasibility of predicting arch height using easily measurable parameters. The present results demonstrate that using five independent variables, including age, Cole index, sex, place of residence, and physical activity, arch height can accurately be estimated (r > 0.97, error < 0.04 mm [2%]). The model suggests that arch height increases with increasing age and increasing physical activity. Similarly, a reduction in body mass produces a higher arch height. These findings are consistent with the literature in which a significant relationship between arch height and body mass has been reported. For example, several studies[5,21,22,23] have reported a direct relationship between arch height and body mass. It has been reported[24] that obese children have a greater tendency for flatfoot than do normal-weight children, and the present results generally agree with those findings. Dowling et al[22] reported structural changes, especially flattening of the longitudinal arch, associated with obesity, but whether this change is reversible or whether obese children will later experience foot abnormalities is not clear. We observed that the effect of the Cole index on arch height decreased as age and children’s physical activity increased. The relationship between arch height and body mass has also been reported by Hodzic et al,[23] who determined the impact of body mass on arch height in 118 children aged 6 to 9 years. These results did not agree with those of Makarchuk et al,[25] who reported that body weight may not have a major impact on arch height in schoolchildren. In our opinion, the increasing number of obese and overweight children will increase the number of children with flat feet in the future.
Few studies have examined the differences in arch structure between males and females. It has been previously shown that females have a greater tendency toward flat feet.[26] The present results show that arch height is approximately 30% lower in boys than in girls. However, we observed that arch height increased more in active boys in rural areas. In addition, these results suggest more intensive arch height change in inactive boys in cities.
A significant difference was also observed between the city and rural populations. Echarri and Forriol[27] demonstrated a greater proportion of flat feet in children in cities. They studied the effect of living in cities versus rural areas as a predictor of flat feet. We also observed that arch height was 26% lower in urban children than in children in rural areas. The present results show that arch height increased by 80% in active boys in rural areas and by 145.4% in active girls. In addition, in active children in cities, arch height increased slower (33.5% in boys versus 96.8% in girls) than in children in rural areas.
Conclusions
This study showed that foot arch characteristics depend significantly on age, Cole index, sex, place of residence, and physical activity. The influence of the presented factors on arch height was estimated by a logistic regression model. This study introduced a simple model based on five independent variables to predict arch height with relatively high accuracy. This may suggest a causal link between higher body mass and increased flattening of the arch of the foot. The proposed model can be used by clinicians or parents as an easy tool for predicting arch height using age, the Cole index, place of residence, sex, and physical activity. The metric values for coefficients are as follow: a0 = 9.90 (constant value); a1 = 3.40 (the coefficient for age); a2 =−2.97 (the coefficient for the Cole index); a3 = −1.76 (the coefficient for sex); a4 = −1.46 (the coefficient for place of residence); a5 = 1.35 (the coefficient for physical activity); a1a2 = −1.03 (the coefficient for multiplication of age and Cole index); a1a3 = −1.65 (the coefficient for multiplication of age and sex); a1a4 = −0.83 (the coefficient for multiplication of age and place of residence); a1a5 = 0.77 (the coefficient for multiplication of age and physical activity); a2a5 = 1.14 (the coefficient for multiplication of the Cole index and physical activity); a4a5 = 1.21 (the coefficient for multiplication of place of residence and physical activity); a1a1 = 1.77 (the coefficient for multiplication square of age); and a2a2 = 1.03 (the coefficient for multiplication square of the Cole index). This information is important in reducing the consequences of flat feet by controlling body weight and increasing physical activity.
Funding
None reported.
Acknowledgment
This study was supported by the Polish Ministry (N N501 0088 33) and Bialystok Technical University (W/WM/11/2010).
Conflicts of Interest
None reported.
References
- Barry, RJ and PEScrantonJr: Flat feet in children. Clin Orthop Relat Res181: 68, 1993.
- Cavanagh, PR and MMRodgers: The arch index: a useful measure from footprints. J Biomech20: 547, 1987.
- Dequeker, J: Rheumatology in art. Ann Rheum Dis60: 894, 2001.
- Dayton, P, FDGoldman, and EBarton: Compartment pressure in the foot: analysis of normal values and measurement technique. JAPMA80: 521, 1990.
- Ghosh, AK, DNTibarewala, PMukherjee, et al: Preliminary study on static weight distribution under the human foot as a measure of lower extremity disability. Med Biol Eng Comput17: 737, 1979.
- Huang, CK, HBKitaoka, KNAn, et al: Biomechanical evaluation of longitudinal arch stability. Foot Ankle14: 353, 1993.
- Bennett, PJ, AEStocks, and DJWhittam: Analysis of risk factors for neuropathic foot ulceration in diabetes mellitus. JAPMA86: 112, 1996.
- Cowan, DN, JRRobinson, BHJones, et al: Consistency of visual assessment of arch height among clinicians. Foot Ankle Int15: 213, 1994.
- Cole, TJ, MCBelizzi, KMFlegal, et al: Establishing a standard definition for child overweight and obesity worldwide: international survey. BMJ320: 1, 2000.
- Szilagyi-Pagowska, I: Axiology: progressing in pediatric. Pract Med Pediatr2: 127, 2002.
- Simkin, A, ILeichter, MGiladi, et al: Combined effect of foot arch structure and an orthotic device on stress fractures. Foot Ankle10: 25, 1989.
- Razeghi, M and MEBatt: Foot type classification: a critical review of current methods. Gait Posture15: 282, 2002.
- Kowalski, KC, PRECrocker, and RAFaulkner: Validation of the Physical Activity Questionnaire for Older Children. Pediatr Exerc Sci9: 74, 1997.
- Sen, A and MSrivastava: Regression Analysis: Theory, Methods and Applications. ,Springer-Verlag. ,New York. ,1990.
- Landis, JR and GGKoch: The measurement of observer agreement for categorical data. Biometrics30: 159, 1997.
- Rose, GK: Flat feet in children. BMJ301: 1330, 1990.
- Volpon, JB: Footprint analysis during the growth period. J Pediatr Orthop14: 83, 1994.
- Furgal, W and AAdamczyk: The arch structure according to the level of physical activity. Med Sportive5: 311, 2008.
- Kutzner-Kozinska, M: The Processes of Human Posture Correction, AWF, Warsaw, 2001.
- Galas, A and MFlorek: Comparability of carer proxy and self reports on physical activity among schoolchildren. Probl Hig Epidemiol89: 351, 2008.
- Wrobel, JS, NJBirkmeyer, JLDercoli, et al: Do clinical examination variables predict high plantar pressures in the diabetic foot?JAPMA93: 367, 2003.
- Dowling, A, JSteele, and LBaur: How does obesity and gender affect foot shape and structure in children?Proceedings of the International Society of Biomechanics XXth Congress–American Society of Biomechanics 29th Annual Meeting;August 5, 2005;Cleveland, OH.
- Hodzic, Z, GBjekovic, BMikic, et al: Early verticalization and obesity as risk factors for development of flat feet in children. Acta Kinesiol2: 14, 2008.
- Lin, CJ, KALai, TSKuan, et al: Correlating factors and clinical significance of flexible flatfoot in preschool children. J Pediatr Orthop21: 378, 2001.
- Makarczuk, A, AKazmierczak, and PKijo: Disorders of physical development of six-year-old children from Warsaw. Ann Universitatis Mariae-Curie Sklodowska40: 301, 2005.
- Demczuk-Wlodarczyk, E: The Foot Structure During Progressive Development. ,Monograph AWF. ,Wroclaw. ,2003.
- Echarri, JJ and FForriol: The development in footprint methodology in 1851 Congolese children from urban and rural areas, and the relationship between this and wearing shoes. J Pediatr Orthop12: 141, 2003.
© 2012 American Podiatric Medical Association