


Abstract
As countries accelerate their transition toward low-carbon economies, understanding the drivers of green finance is essential for shaping effective sustainability policies. This study investigates how FinTech development, digitalization, financial access, and structural factors influence public renewable energy investment—a measurable dimension of green finance—across 29 European countries over 2000–2022, using the Method of Moments Quantile Regression (MMQR). Results reveal strong distributional heterogeneity: FinTech consistently promotes green investment across all quantiles, digital infrastructure amplifies this effect in advanced regimes, and financial access is most binding at lower quantiles. Natural resource dependence exerts a persistent resource curse constraint that intensifies at higher quantiles. Three robustness strategies—2SLS-IV and quantile fixed effects QFE confirm a causal positive FinTech effect. Quantile-specific policy implications are derived: early-stage green investors should prioritize financial access and digital infrastructure, while advanced economies should deepen FinTech adoption and address resource-dependence constraints.
1. Introduction
The European economy has experienced substantial growth over the past two decades. The European Union’s GDP increased from about USD 11.32 trillion in 2000 to roughly USD 19.4 trillion in 2024, while per capita GDP more than doubled from USD 17,000 to approximately USD 43,100 (WDI, 2024). This economic expansion, however, has been accompanied by growing environmental pressures. Climate-related hazards have increasingly strained the European economy as the frequency and intensity of extreme events have risen. Between 1980 and 2024, total losses reached about EUR 822 billion, mainly from floods (47%), storms (27%), and heatwaves (18%). Average annual losses rose from EUR 8.6 billion in the 1980s to EUR 44.9 billion in 2020–2024 (EEA, 2025). Germany and Italy experienced the highest aggregate losses, while Slovenia and Luxembourg recorded the largest per capita losses (EEA, 2025).
In response, EU member states have committed to achieving climate neutrality by 2050 and have implemented a comprehensive policy framework to support the transition toward a low-carbon economy (Mizgajski & Stępniewska, 2022). Central to this framework is the EU Emissions Trading System, complemented by green bond markets and large-scale investment in renewable energy technologies such as wind and solar power. These instruments aim to reduce emissions while mobilizing financial resources toward environmentally sustainable activities.
Within this context, green finance has become a key mechanism for channelling capital toward renewable energy, clean technologies, and climate-resilient infrastructure, while internalizing climate-related risks into financial decision-making (Xiong & Dai, 2023; Zheng et al., 2025). It promotes corporate accountability through green bonds, environmental ratings, and sustainability-oriented regulation (Y. Tan et al., 2025), enhances corporate competitiveness and social responsibility (Sheng et al., 2024), and supports sustainable development. Empirical studies show that green finance reduces pollution (Wu et al., 2024), stimulates private renewable energy investment (Ahmad et al., 2025), and fosters technological innovation (Fu et al., 2024).
Recent research highlights financial technology (FinTech) as a potentially transformative force in this process. By leveraging digital platforms, big data, and algorithmic tools, FinTech reduces transaction costs, enhances transparency, improves risk assessment, and expands access to financial services (Goldstein et al., 2019; Lv & Xiong, 2022). Drawing on Diamond’s (1984) theory of financial intermediation, FinTech represents an evolution of the intermediary role that reduces informational frictions and improves capital allocation. Diffusion-of-innovation theory further suggests that digital financial technologies accelerate the adoption of sustainable practices across financial ecosystems (X. Tan et al., 2024).
FinTech can support green finance by expanding financial inclusion, lowering barriers to investment, improving project screening, and mobilizing private capital for renewable energy projects (Attia & BinEid, 2025; Olaoye et al., 2025; Zeng et al., 2024). Its integration with ICT enables more accurate environmental risk assessment and data-driven resource allocation (Chang et al., 2022). However, its effectiveness depends on institutional quality, ICT infrastructure, and macroeconomic conditions (Al-Assaf et al., 2025).
FinTech has evolved into a multidimensional system encompassing mobile payments, online banking, digital lending, and algorithmic credit evaluation, reshaping traditional financial mechanisms and broadening access to finance. Evidence suggests that FinTech integration supports eco-efficient finance and directs resources toward low-carbon investments (Al Hammadi & Nobanee, 2019; Bel Hadj Miled, 2025; Nassiry, 2018).
Despite growing interest, empirical evidence on the FinTech–green finance nexus remains limited. Much of the literature focuses on financial inclusion and stability (Vuković et al., 2024), environmental sustainability and energy transition (Umar et al., 2025), or green investment and innovation (Y. Li et al., 2024). Fewer studies examine how FinTech affects explicit green finance flows, and many rely on broad ESG or “sustainable finance” proxies instead (Broby & Yang, 2025; Dar et al., 2024). Moreover, most existing studies are single-country analyses or do not adequately account for cross-country heterogeneity in regulation, ICT development, financial access, economic development, and natural resource endowments.
Against this backdrop, this study examines how FinTech development influences public renewable energy investment across 29 European countries over 2000–2022, accounting for heterogeneity across countries and across green finance distribution. Green finance is proxied by public investment in renewable energy, FinTech development is measured by internet banking penetration, and a set of structural controls including financial access, ICT development, economic growth, trade openness, natural resource rents, and inflation are incorporated. The study employs the Method of Moments Quantile Regression (MMQR) framework of Machado and Santos Silva (2019) which, unlike mean-group estimators (Pesaran & Smith, 1995) or standard quantile regression with fixed effects (Canay, 2011), allows covariates to affect both the location and scale of the conditional distribution, capturing heterogeneous effects across countries at different levels of green investment. Endogeneity is addressed through 2SLS-IV estimation using fixed broadband subscriptions as an external instrument, and distributional robustness is confirmed through Canay (2011) quantile fixed effects and bootstrap quantile regression.
The main findings reveal substantial distributional heterogeneity in the drivers of green finance. FinTech development exerts a consistently positive and statistically significant effect on public renewable energy investment across all quantiles, with the effect increasing monotonically from 0.088 at the 20th quantile to 0.105 at the 80th quantile, indicating that FinTech’s impact is strongest precisely where green investment is already most advanced. ICT infrastructure amplifies this effect at higher quantiles, while financial access is the binding constraint at lower quantiles. Natural resource rents exert a persistent and intensifying negative effect across the distribution, consistent with a resource curse mechanism. These results are robust to endogeneity correction, alternative fixed-effects assumptions, and a dual-proxy robustness test replacing the primary measures with FinTech credit per capita and green bond issuance.
The study makes four contributions. First, it provides pan-European causal evidence on the FinTech–green finance relationship using explicit public investment measures rather than aggregate ESG proxies. Second, it develops a distribution-dependent theoretical framework predicting that FinTech shifts from financial inclusion mechanisms at lower quantiles to efficiency mechanisms at higher quantiles, and derives six testable hypotheses, formally stated as H1–H6 in Section 3, directly from this framework. Third, it advances causal identification through 2SLS-IV and Canay (2011) QFE alongside MMQR. Fourth, it derives quantile-specific policy recommendations that differentiate between early-stage and advanced green investors.
2. Literature Review
2.1. FinTech, Financial Inclusion, and the Foundations of Green Finance
Financial services have long been dominated by traditional banks and financial institutions, but technological innovations are fundamentally reshaping this landscape by broadening access to financial services across society, including underserved households and firms (Chiad et al., 2021). FinTech has emerged as a foundational pillar not only for conventional banking services but also for sustainable finance more broadly (Kashif et al., 2024). Empirical evidence demonstrates that inclusive digital finance fosters household consumption (J. Li et al., 2020), while mobile-money and digital payment systems enhance financial inclusion and stimulate economic growth (Senyo & Osabutey, 2020; Song & Appiah-Otoo, 2022; Yang & Zhang, 2022). By systematically lowering barriers to financial participation, FinTech helps lay the groundwork for broader societal engagement in green finance.
2.2. Green Finance: Market Failures and the Role of FinTech
Green finance seeks to correct market inefficiencies associated with environmental public goods by directing capital toward sustainable projects through instruments such as green bonds and carbon-pricing schemes (Dutta et al., 2021). Several structural obstacles continue to limit its effectiveness: information asymmetry generates principal–agent problems that enable issuers to exaggerate environmental performance, eroding investor confidence, and weak regulatory oversight further constrains disclosure quality and enforcement. FinTech-based solutions, including blockchain-enabled verification and AI-driven ESG auditing, can alleviate these challenges by enhancing transparency and strengthening the alignment of green finance with sustainable development objectives (J. Wang et al., 2024). Beyond addressing these market failures, digital platforms efficiently connect investors to sustainable projects, reducing transaction costs and accelerating investment flows toward environmentally sustainable initiatives (Addy et al., 2024; S. Wang & Wang, 2023), while real-time project tracking and reporting strengthen accountability and build investor trust (Q. Liu & You, 2023; Rerung et al., 2024). FinTech-enabled instruments such as green bonds, sustainable investment funds, and crowdfunding platforms further diversify funding sources for renewable energy and climate-resilient investments, including for small and medium-sized enterprises (Tanchangya et al., 2025).
A growing body of empirical evidence affirms FinTech’s positive role in green finance and environmental performance. Systematic reviews confirm that artificial intelligence, blockchain, big data, and digital platforms are increasingly applied to green finance to improve risk assessment, governance, and resource allocation (Saeedi & Ashraf, 2024), and that sustainability-oriented strategies motivate banks to adopt FinTech in ways that accelerate sustainability goals (Galeone et al., 2024). At the country level, FinTech innovation significantly improves the efficiency and transparency of green finance markets, especially where regulatory environments are sound (Chien et al., 2025), and a panel study on European banks over 2011–2021 shows that FinTech adoption increases green lending without compromising bank profitability (Mirza et al., 2023). At the firm level, digital banking transformation improves green credit allocation in Chinese banks (Shang & Niu, 2023), and financial technology contributes to reductions in carbon emissions across Chinese cities through industrial structure upgrading, financing constraints alleviation, and green technology innovation (Cheng et al., 2023). The FinTech–green innovation nexus is further shown to be non-linear and moderated by environmental awareness (Liao, 2025), while CS-ARDL estimation for BRICS economies confirms that financial technology plays a substantive role in promoting green projects and environmental sustainability (Bel Hadj Miled, 2025). These reviews collectively highlight persistent empirical gaps—particularly regarding large-scale, cross-country analyses linking FinTech adoption to real green finance flows (Kwong et al., 2023; Roy & Vasa, 2025; Saeedi & Ashraf, 2024).
2.3. FinTech, ESG Risk, and the Limits of Green Finance
Emerging research underscores FinTech’s potential to mitigate sustainability-related risks. FinTech adoption reduces ESG greenwashing—one of the most pervasive threats to the credibility of sustainable finance (Z. Liu & Li, 2024)—and enhances the provision of green credit among listed banks, although the effect is non-linear during early stages of FinTech development, highlighting the importance of institutional context (He et al., 2024). Green finance has been identified as a key driver of energy-efficiency improvements (P. Wang & Xu, 2025), and FinTech more broadly facilitates environmentally oriented lending and investment (Zhou et al., 2022). Financial innovation further enhances banks’ green finance and green investment outcomes (Yang & Zhang, 2022), although the relationship between green finance and green investment is not uniformly positive across all institutional contexts, with some studies reporting mixed evidence (Q. J. Wang et al., 2022). These findings underscore that the effectiveness of FinTech in channelling funds toward green investments is conditioned by regulatory quality, governance effectiveness, and macroeconomic context (Al-Assaf et al., 2025; Chien et al., 2025).
2.4. Heterogeneity, Institutional Context, and the Research Gap
The literature reviewed above collectively establishes that FinTech has the theoretical capacity and empirical tendency to improve financial efficiency, expand access to financial services, and support environmentally oriented investment. However, four specific gaps limit the policy relevance of existing evidence for Europe’s green finance agenda.
First, most existing studies employ mean-based estimators—OLS, fixed effects, GMM—that impose homogeneous slope coefficients across countries and levels of green investment. As Saha and Dutta (2023) demonstrate, slope coefficients vary substantially across countries, and mean estimates can obscure precisely the heterogeneity that matters for policy design. If FinTech operates through different mechanisms at early versus advanced stages of green finance development—as the theoretical framework in Section 3 predicts—a mean estimator will average across these mechanisms and conceal the distributional structure. The MMQR framework of Machado and Santos Silva (2019) addresses this directly by allowing both the location and scale of the conditional distribution to vary with covariates.
Second, causal identification remains weak in the existing literature. Mirza et al. (2023) provide important European evidence on FinTech and green bank lending but use mean-based estimation without external instruments. Chien et al. (2025) examine FinTech’s effect on green finance efficiency across countries but do not combine distributional estimation with IV strategies. No prior study simultaneously employs distributional quantile regression, external IV identification, and an alternative fixed-effects quantile estimator (Canay, 2011) within a single European panel.
Third, most existing studies use composite ESG scores or broad sustainable finance proxies that conflate public and private finance flows and are sensitive to cross-country reporting differences (Broby & Yang, 2025; Dar et al., 2024). The present study uses a harmonized, publicly reported measure—IRENA public renewable energy investment—that isolates the sovereign fiscal channel, complemented by a robustness test using green bond issuance and FinTech credit per capita from Cornelli et al. (2020).
Fourth, Europe-specific cross-country heterogeneity remains underexplored. Most large-scale panel studies are global or focused on China and BRICS economies. Within Europe, regulatory quality, ICT development, resource dependence, and financial development vary substantially across countries. Zia et al. (2024) provide the closest European comparator, examining FinTech, green financing, and energy outcomes across European nations, but rely on DOLS and FMOLS estimators that impose homogeneous slopes and do not address distributional heterogeneity or causal identification (Zia et al., 2024). Al-Assaf et al. (2025) highlight that macroeconomic conditions fundamentally condition FinTech’s effectiveness, but their study addresses emerging markets rather than Europe.
These gaps collectively motivate the present study and justify the adoption of MMQR alongside 2SLS-IV and Canay (2011) robustness strategies.
3. Theoretical Framework and Hypotheses
The relationship between FinTech and green finance is grounded in financial intermediation theory (Diamond, 1984), diffusion-of-innovation theory (Rogers et al., 2014), and the economics of environmental public goods under market frictions (Dutta et al., 2021).
Green investments are characterized by features that systematically generate underinvestment relative to the social optimum: long-term payoff horizons, complex environmental externalities, difficult-to-verify impact claims, and high upfront evaluation costs (Dutta et al., 2021). These features create three interlinked frictions—adverse selection between financiers and project issuers, prohibitively high transaction costs from regulatory compliance and impact monitoring, and financial exclusion of smaller firms that cannot meet conventional collateral requirements (Diamond, 1984; Goldstein et al., 2019). FinTech directly targets each of these frictions. Digital platforms and algorithmic screening reduce adverse selection by improving environmental project assessment (Lv & Xiong, 2022; J. Wang et al., 2024), automated processes lower coordination and monitoring costs (Addy et al., 2024; S. Wang & Wang, 2023), and relaxed collateral constraints broaden access to finance for innovative green projects typically excluded from conventional banking channels (Olaoye et al., 2025; Yang & Zhang, 2022). Together, these mechanisms predict a positive average effect of FinTech on green finance, forming the basis of the first hypothesis.
H1:
FinTech development is positively associated with public green finance across all quantiles of the conditional distribution.
The effectiveness of these mechanisms is conditioned by a country’s existing level of financial development, digital infrastructure, and institutional readiness. Drawing on diffusion-of-innovation theory (Rogers et al., 2014), FinTech adoption follows a non-linear trajectory: in early-stage economies, FinTech primarily alleviates financial exclusion; in more advanced systems, it shifts toward enhancing efficiency and enabling complex instruments such as green bonds and ESG-linked lending (Chien et al., 2025; X. Tan et al., 2024). This state dependence implies that the marginal effect of FinTech increases with a country’s position in the conditional distribution of green investment, as efficiency-enhancing mechanisms compound upon an already-developed base. Digital infrastructure reinforces this pattern, becoming a more binding complementary input only at higher levels of green finance development (Fambeu & Yomi, 2024; Zheng & Zhang, 2025), while traditional financial access matters most where FinTech platforms have not yet displaced conventional banking channels.
H2:
The positive effect of FinTech on green finance increases monotonically across quantiles, reflecting its greater efficiency-enhancing role in countries with advanced green finance systems.
H3:
ICT infrastructure has a stronger positive effect on green finance at higher quantiles, where advanced digital ecosystems are required to support complex green finance operations.
H4:
Financial access has the strongest positive effect on green finance at lower quantiles, where traditional financial inclusion remains the binding constraint.
Structural economic factors introduce countervailing forces. Resource-dependent economies face a carbon lock-in effect whereby fossil fuel revenues reduce both fiscal incentives and political will for public green investment, a constraint that deepens as green investment potential grows (Bel Hadj Miled, 2025). Highly open economies at advanced green-investment levels can access imported renewable technology and attract foreign private capital, substituting for domestic public green expenditure.
H5:
Natural resource rents exert a negative and intensifying effect on green finance across quantiles, consistent with a resource curse mechanism.
H6:
Trade openness exerts a negative effect on green finance at higher quantiles, consistent with substitution of domestic public expenditure by imported technology and foreign private capital.
4. Data and Model Specification
4.1. DATA
This study examines a balanced panel of 29 European countries over 2000–2022: Austria, Belgium, Bulgaria, Cyprus, Czechia, Denmark, Estonia, Finland, France, Germany, Greece, Hungary, Iceland, Ireland, Italy, Latvia, Lithuania, Luxembourg, Malta, Netherlands, Norway, Poland, Portugal, Romania, Slovakia, Slovenia, Spain, Sweden, and Switzerland. This timeframe spans major disruptions—the global financial crisis and the COVID-19 pandemic—and coincides with heightened climate-policy activity and substantial changes in energy investment across Europe.
Green finance (GF) is proxied by public investment in renewable energy, sourced from the International Renewable Energy Agency (IRENA). This measure captures governments’ direct financial commitment to low-carbon energy transitions, isolating the sovereign fiscal channel rather than relying on broad ESG composites that conflate public and private flows. Public finance functions as the primary risk-mitigation mechanism that unlocks subsequent private renewable energy investment, particularly in countries with nascent green finance ecosystems (IRENA & CPI, 2023), and the IRENA measure is harmonized and panel-balanced across all 29 countries and the full sample period—properties that many composite indices do not share (Ahmad et al., 2025; Umar et al., 2025). We acknowledge that this proxy does not capture private green bonds, sustainable lending, or ESG-linked equity instruments. To address this limitation, Section 7.3 presents a robustness test replacing public investment with green bond issuance from the IMF Climate Database and simultaneously replacing the primary FinTech proxy with FinTech credit per capita from Cornelli et al. (2020), confirming that the results are not proxy-dependent.
FinTech development (FINT) is measured using two complementary proxies. The primary proxy is the percentage of individuals using internet banking to make online payments, obtained from Eurostat. This indicator captures the demand-side diffusion of digital financial services at the population level, aligning with diffusion-of-innovation theory (Rogers et al., 2014). It has been adopted in panel studies using the same European context, sample, and period—most directly by Umar et al. (2025) across the same 29 countries over 2000–2022—and documents meaningful cross-country variation in digital financial participation (Fasano & Cappa, 2022; Grigorescu et al., 2023). We acknowledge that this proxy does not distinguish between dedicated FinTech platforms, mobile payments, and digital banking channels, nor does it capture blockchain, AI-driven credit scoring, or peer-to-peer lending. The secondary proxy, used exclusively in the robustness analysis (Section 7.3), is FinTech credit per capita from Cornelli et al. (2020), which captures the supply-side output dimension of FinTech including peer-to-peer lending, marketplace lending, crowdfunding, and invoice trading (Hussain et al., 2026).
Several control variables are included to account for structural and macroeconomic factors that may influence green finance. Financial access (FA), obtained from the IMF’s Financial Development Index, captures the accessibility of formal financial institutions. Economic growth (EG) reflects overall macroeconomic performance. Total natural resource rents (TNR) measure the degree of resource dependence. Information and communication technology development (ICT) captures access to digital infrastructure. Trade openness (TR) is defined as the ratio of total exports and imports to GDP, and inflation (INF) controls for price-level instability. All control variables are sourced from World Development Indicators (WDI). All variables are transformed into natural logarithms prior to estimation to reduce scale-induced correlations, stabilize variance, and mitigate heteroscedasticity.
4.2. Model Specification
Based on the theoretical framework and prior empirical evidence, this study specifies a model to examine the relationship between fintech development and green finance across European countries. We formulate the baseline relationship as:
where the regression is as follows:
where i indexes countries and t denotes time.
Based on theoretical and empirical considerations, we expect FINT to be positively associated with green finance across all quantiles of the conditional distribution, reflecting fintech’s role in improving financial efficiency, lowering transaction costs, and facilitating sustainable investment. Similarly, ICT, FA, and EG are expected to exert positive effects on green finance by enhancing digital infrastructure, expanding financing opportunities, and increasing demand for sustainable investments. In contrast, INF and TNR are hypothesized to exert negative effects on green finance, as macroeconomic instability and resource-driven growth may discourage long-term green investments.
Traditional mean-based estimators such as ordinary least squares (OLS) and fixed-effects models capture only average effects and may obscure important heterogeneity across countries and levels of green financial development. To account for such distributional heterogeneity, this study adopts the Method of Moments Quantile Regression (MMQR) framework (Machado & Santos Silva, 2019). MMQR allows both the location and scale of the conditional distribution of the dependent variable to vary across quantiles while controlling for unobserved individual fixed effects. This flexibility makes MMQR particularly well suited for cross-country panel data where countries may respond differently to fintech adoption depending on their position in the green finance distribution.
Let GFit denote green finance for country i at time t, and let Xit represent the vector of explanatory variables. The MMQR model decomposes the dependent variable into a location and a scale component:
where captures country-specific fixed effects affecting the level of green finance. measures the marginal effect of explanatory variables on the location of the conditional distribution. represents individual effects related to the scale of variation. captures how explanatory variables influence dispersion. is a standardized error term with zero mean and unit variance.
This specification allows the same covariates to affect both the level and dispersion of green finance, thereby capturing asymmetric responses across the conditional distribution. Identification of the scale component is ensured by imposing a positivity restriction, which guarantees that the scale remains well-defined.
Based on this decomposition, the conditional quantile of green finance at quantile τ ∈ (0, 1) is expressed as:
where q(τ) denotes the τ-th quantile of the standardized error term.
Estimation is conducted at the 0.20, 0.40, 0.60, and 0.80 quantiles to capture heterogeneity across countries with different levels of green financial development and to assess whether the impact of fintech differs across the distribution.
5. Empirical Results
5.1. Descriptive Statistics
Table 1 reports the descriptive statistics for all variables. FinTech adoption exhibits substantial heterogeneity across countries and over time, with a mean of 2.86 and a standard deviation of 1.58, reflecting uneven diffusion of digital financial services. Green finance has a mean of 3.91 with moderate dispersion, indicating considerable cross-country variation in public investment in renewable energy. Financial access also displays meaningful variability, while ICT development remains relatively stable across the sample. Inflation is low on average, and natural resource rents are modest but right-skewed. Trade openness shows limited variation, suggesting relatively stable integration into global markets across European countries.
Table 1.
Descriptive statistics.
Overall, the descriptive evidence highlights pronounced heterogeneity in both fintech development and green finance, motivating econometric approaches that allow for cross-country differences rather than imposing homogeneity.
5.2. Correlation Analysis
Table 2 presents the pairwise correlation matrix. FinTech adoption is positively and significantly correlated with green finance, providing preliminary support for the hypothesized fintech–green finance nexus. ICT development, financial access, and trade openness are also positively associated with green finance, while inflation and natural resource dependence exhibit negative correlations.
Table 2.
Pairwise correlation matrix.
Importantly, correlations among explanatory variables remain moderate and well below conventional multicollinearity thresholds, suggesting that the regression estimates are unlikely to be distorted by severe linear dependence. This supports proceeding with multivariate panel estimation.
To provide a formal multicollinearity diagnostic, Table 3 reports Variance Inflation Factor (VIF) statistics. Following the conventional threshold in the panel econometrics literature, a VIF below 5 indicates no meaningful multicollinearity concern (O’Brien, 2007), all variables fall comfortably within acceptable bounds, with individual VIF values ranging from 1.10 to 1.53 and a mean VIF of 1.34. These results confirm that multicollinearity does not threaten the reliability of the regression coefficients.
Table 3.
Variance Inflation Factor.
5.3. Cross-Sectional Dependence
Cross-sectional dependence (CSD) arises when unobserved common shocks or spillover effects induce correlation in residuals across panel units. In a European context, this is structurally expected: EU-wide policy shocks, synchronized business cycles, integrated capital markets, and shared technology diffusion patterns all create co-movement across countries not fully captured by country-level controls (Pesaran, 2021). Failure to account for CSD leads to downward-biassed standard errors and spurious inference (Petersen, 2009).
We test for CSD using the Pesaran (2021) CD test (Table 4), which examines cross-sectional independence under the null that implies pairwise residual correlations equal zero, and the power-enhanced CDw+ statistic of Fan et al. (2015), which amplifies detection power against weak forms of dependence (Fan et al., 2015). Table 3 reports the results. Both statistics reject cross-sectional independence at the 1% level for all variables, confirming strong and pervasive CSD consistent with the deeply integrated European economic environment.
Table 4.
Cross-section dependence.
CSD is addressed at multiple levels across all estimators. In the MMQR, standard errors are clustered at the country level, allowing for arbitrary within-country serial correlation and heteroscedasticity (Petersen, 2009). The 2SLS-IV reports robust standard errors alongside the Anderson–Rubin weak-instrument-robust test. Westerlund (2007) cointegration tests use bootstrapped p-values based on 500 replications that explicitly preserve the observed CSD structure. Bootstrap standard errors from 200 replications in both the bootstrap quantile regression and Canay (2011) QFE provide distribution-free inference that does not assume cross-sectional independence (Buchinsky, 1998).
5.4. Panel Unit Root Tests
Table 5 reports the results of Pesaran’s CIPS test. FinTech and inflation are stationary in levels, while green finance, ICT, financial access, economic growth, trade openness, and natural resource rents are non-stationary in levels but become stationary after first differencing.
Table 5.
CIPS estimates.
5.5. Panel Cointegration
Table 6 reports Pedroni (2004) and Westerlund (2007) panel cointegration test results. Both strongly reject the null of no cointegration. The Westerlund tests use bootstrapped p-values to account for cross-sectional dependence. We note the panel exhibits mixed integration orders (FINT and INF are I(0); remaining variables are I(1)). Inclusion of I(0) regressors alongside cointegrated I(1) variables is permissible under bounds-testing frameworks (Pesaran et al., 2001) and does not invalidate long-run inference in levels, provided cointegration among the I(1) variables is confirmed—as it is here. This justifies the MMQR estimation in levels.
Table 6.
Panel cointegration tests.
Overall, the evidence supports the existence of a stable long-run relationship among the variables.
5.6. Slope Heterogeneity
Table 7 reports Pesaran and Yamagata (2008) slope heterogeneity tests, which strongly reject homogeneous slope coefficients. Since the research question specifically concerns distributional patterns across green finance levels, MMQR is the appropriate choice to accommodate this heterogeneity.
Table 7.
Slope heterogeneity test results.
5.7. MMQR Estimates
Table 8 reports the MMQR estimates. A 1% increase in FinTech usage is associated with a 0.088–0.105% increase in public renewable energy investment across quantiles. Given a mean GF of 3.916 log points (approximately USD 50 million per country), this is an economically meaningful elasticity that grows steadily from Q20 to Q80, confirming H1 and H2.
Table 8.
MMQR results.
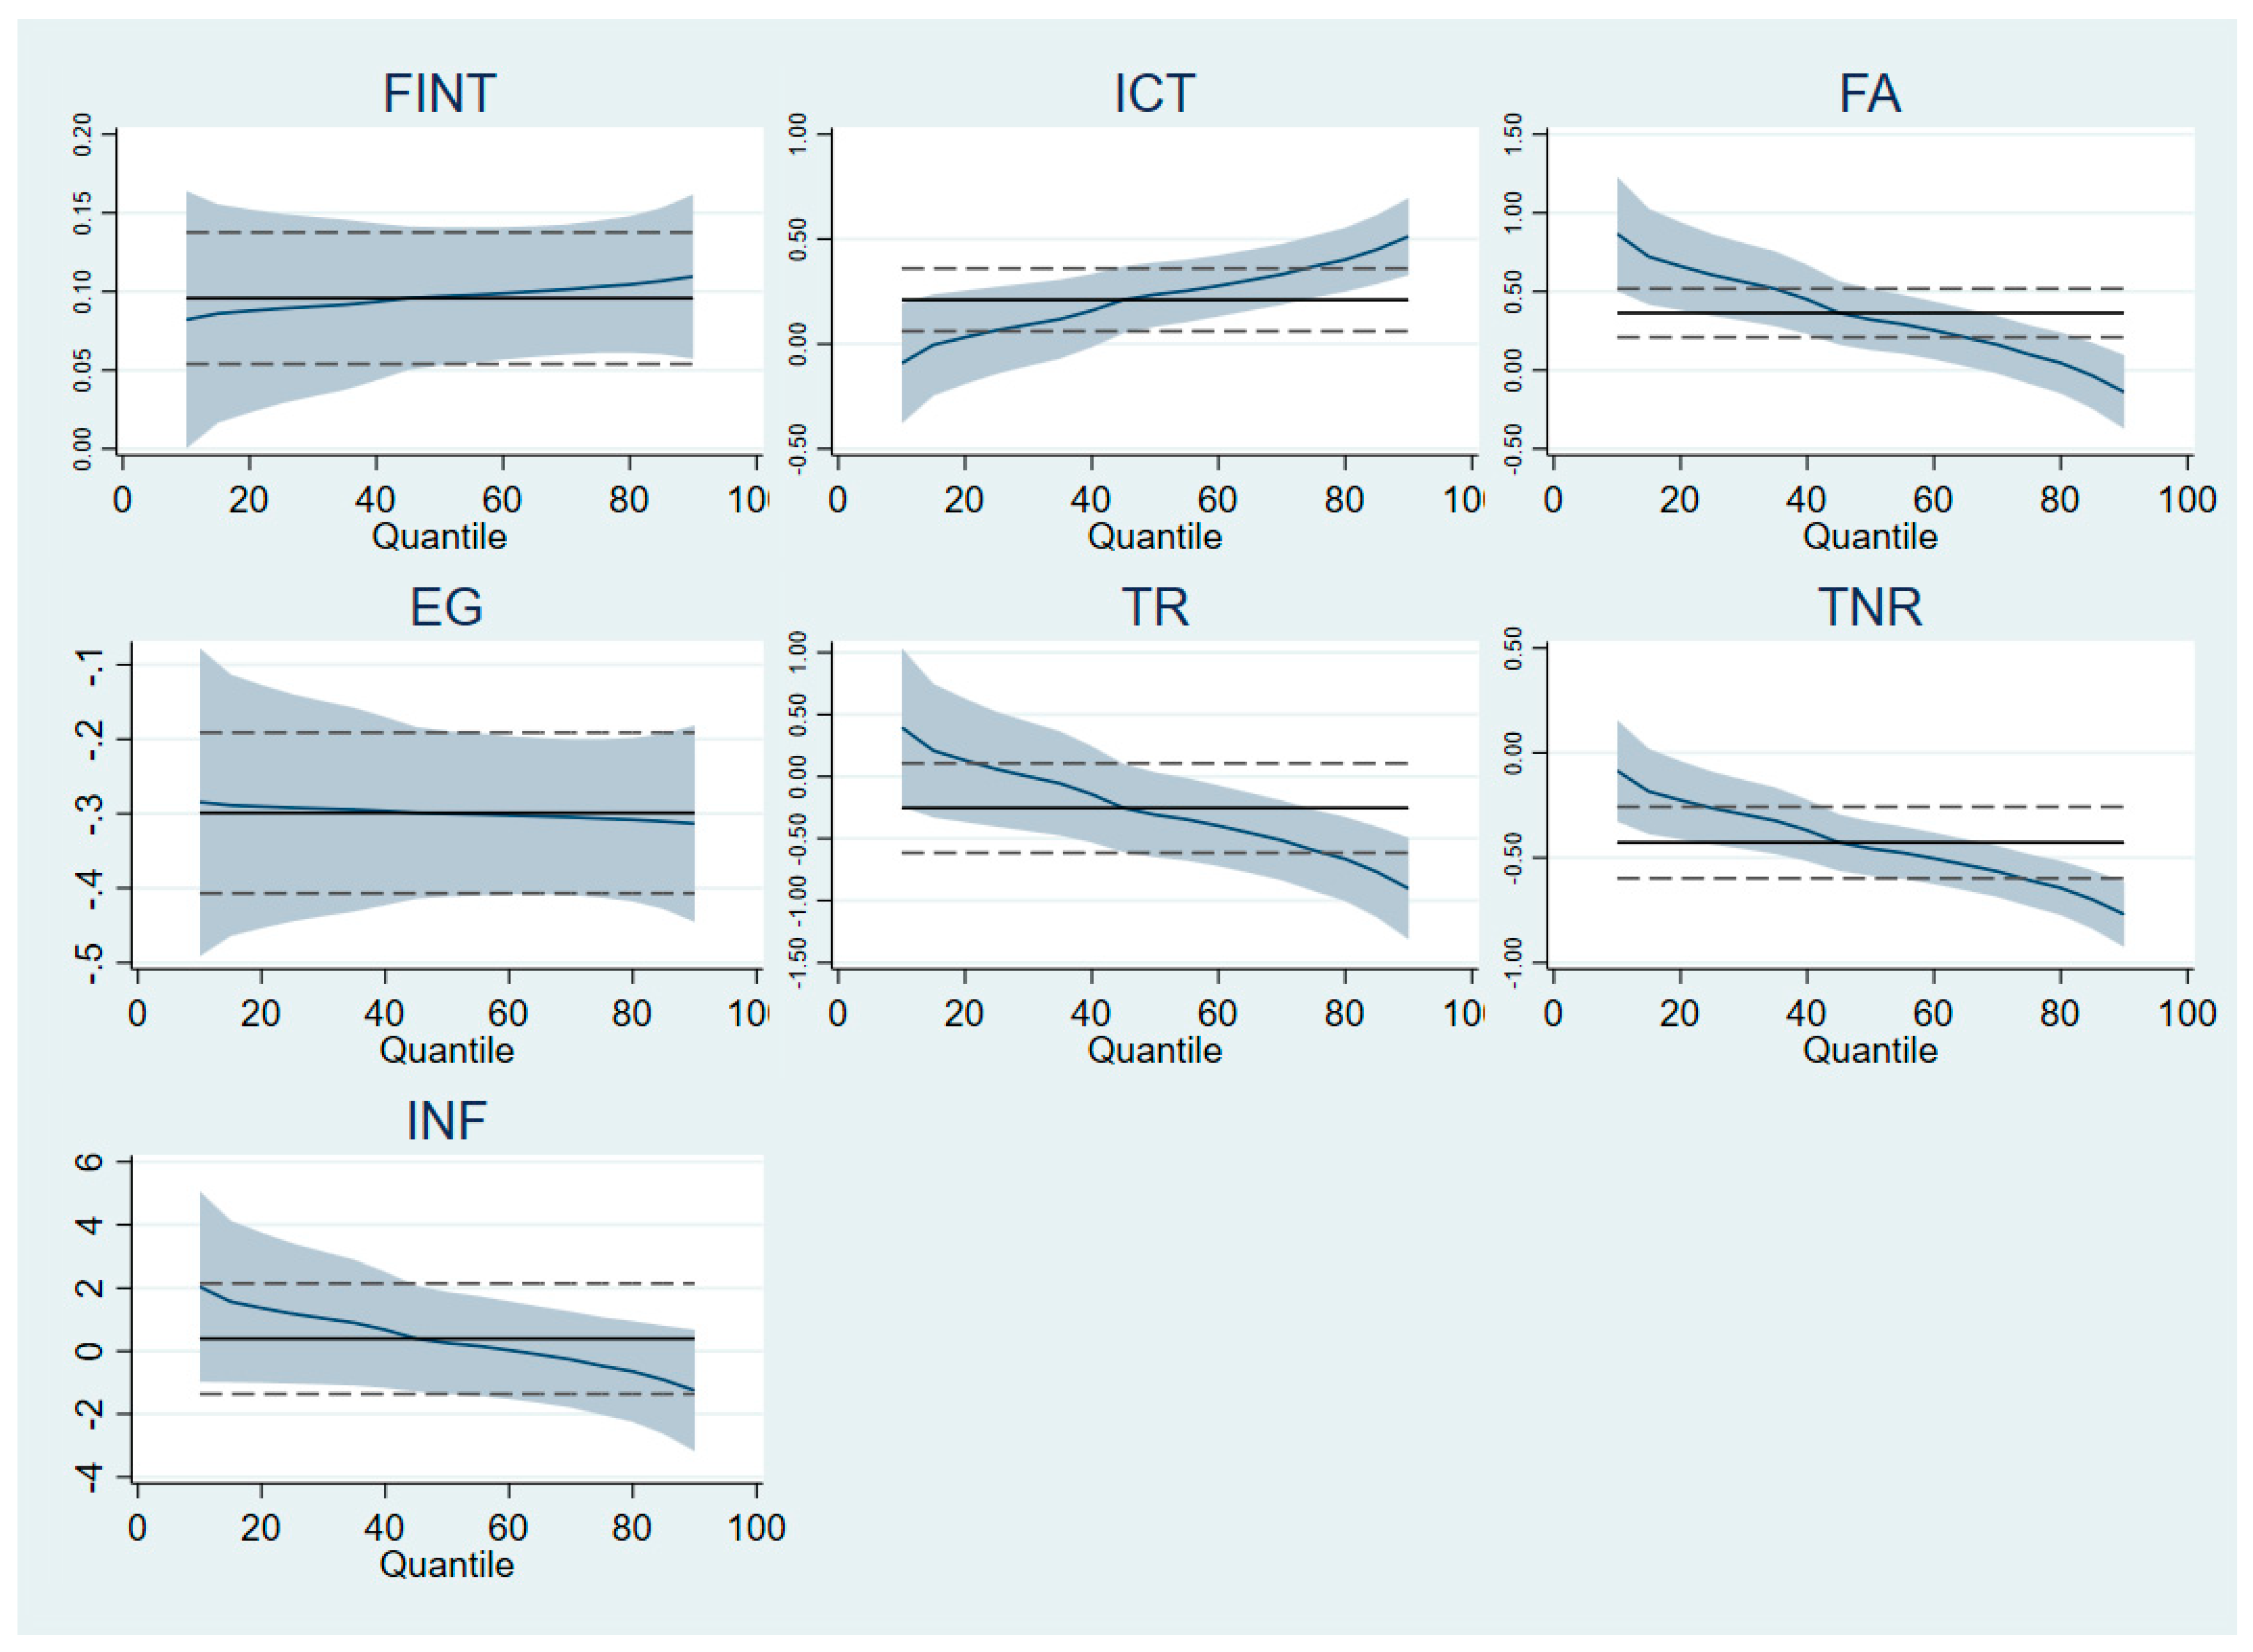
Table 7 reveal a strong and consistent positive relationship between fintech development and green finance across all quantiles. The coefficient of fintech is positive and statistically significant at the 20th, 40th, 60th, and 80th quantiles, increasing from 0.0877 at q20 to 0.1045 at q80. These values imply that a 1% rise in fintech usage is associated with roughly a 0.09–0.10% increase in public renewable energy investment. The upward trajectory of the coefficients indicates that fintech’s impact intensifies in countries with higher levels of green finance.
The results also show substantial heterogeneity in the role of ICT. At lower quantiles, ICT has no significant effect, but the coefficients become positive and increase steadily at higher quantiles—0.1591 at q40, 0.2773 at q60, and 0.4017 at q80—suggesting that digital connectivity reinforces green finance primarily in medium- and high-investment countries (confirming H3). Financial access displays the opposite pattern: it is strongest at lower quantiles, with coefficients of 0.6612 at q20 and 0.4496 at q40. The effect weakens at higher quantiles (0.2531 at q60) and becomes statistically insignificant at q80. This pattern indicates that financial access is particularly important in countries at early stages of green investment (consistent with H4).
Moreover, EG has a consistently negative and significant effect across the distribution, ranging from −0.2904 at q20 to −0.3080 at q80. This finding indicates that within our sample of European countries, higher GDP per capita is associated with lower public renewable energy investment. One possible explanation is a compositional shift in green finance: as economies become wealthier and capital markets mature, governments may rely increasingly on private green bonds and market-based instruments rather than direct public expenditure for renewable energy financing (IEA, 2024; IRENA & CPI, 2023). This interpretation is consistent with IEA (2024) data showing that public finance accounts for only 14% of clean energy spending in advanced economies compared with 32% in emerging economies, and with the sign reversal of the GDP coefficient observed in Section 7.3, where the dependent variable is green bond issuance rather than public investment. However, we stress that this interpretation is tentative. The negative coefficient could alternatively reflect omitted institutional variables—such as regulatory stringency or governance quality—that are correlated with both GDP and the allocation of public expenditure toward renewable energy. Distinguishing between these explanations requires data on private renewable investment flows alongside public expenditure, which is beyond the scope of the present study and flagged as a direction for future research.
Trade openness is insignificant at lower quantiles but becomes significantly negative at Q60 and Q80. This is consistent with H6: highly open economies at advanced green-investment levels can access imported renewable technology and attract foreign private capital, substituting for domestic public green expenditure. This substitution only materializes once a country’s green finance infrastructure is developed enough to absorb private and foreign flows—a threshold lower-quantile countries have not yet reached. Moreover, inflation is statistically insignificant across all quantiles, indicating that price fluctuations in Europe during the study period did not materially influence public renewable energy spending.
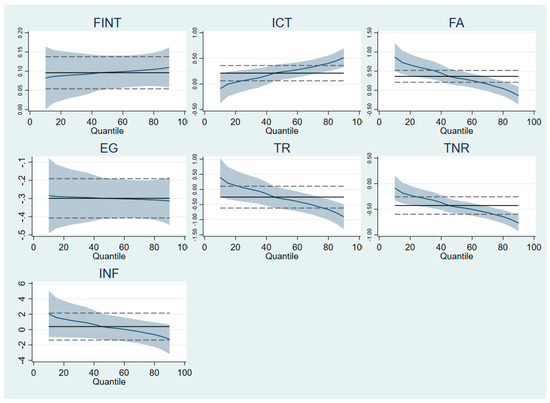
Figure 1 illustrates the estimated MMQR quantile effects of FinTech, ICT, financial access, and structural variables on green finance.
Figure 1.
MMQR quantile effects on green finance.
5.8. SLS Instrumental Variables
To address endogeneity through external identification, we instrument FinTech with the log of fixed broadband subscriptions per 100 people (lbroadband). The exclusion restriction requires that broadband subscriptions affect public renewable energy investment only through their effect on FinTech adoption, and not through any independent direct channel. Two theoretical pillars support the plausibility of this restriction.
First, fixed broadband infrastructure rollout in Europe was shaped primarily by supply-side engineering and legacy factors, including the geographic location of historical telephone exchanges, the topographic cost of cable deployment, population density, and EU-level Digital Agenda targets set years before current green-investment programmes. These determinants are unrelated to a government’s contemporaneous preferences for public renewable energy expenditure, which are driven by fiscal capacity, climate policy commitments, and resource endowments, all of which are already included as controls. This identification logic is consistent with the well-established approach of using supply-side telecommunications infrastructure as an instrument for digital adoption outcomes. Fixed broadband infrastructure reflects engineering decisions, topographic constraints, and legacy telephone network geography, factors that predict current digital connectivity while remaining unrelated to contemporaneous policy decisions about renewable energy expenditure (Akerman et al., 2015; Cevik, 2024). This supply-side framing has been widely applied in the digital economics literature to isolate exogenous variation in internet and platform adoption.
Second, broadband affects economic outcomes primarily through an intermediary adoption channel: physical connectivity lowers the cost of accessing digital financial platforms, thereby driving FinTech diffusion. Without the adoption of those platforms, a broadband connection confers no direct influence on public green investment decisions. The causal pathway runs: broadband → FinTech adoption → green finance. There is no theoretically coherent mechanism by which a country’s fixed broadband subscription rate would independently and directly determine its government’s allocation of public expenditure toward renewable energy, conditional on all controls already in the model. This supply-side framing is consistent with Cevik (2024), who uses broadband and telecommunications infrastructure as supply-side drivers of FinTech adoption in a cross-country IMF study, explicitly noting that such infrastructure determines the enabling environment for digital finance without directly affecting financial outcomes of interest.
We acknowledge one potential concern: countries with higher broadband penetration may also exhibit stronger institutional capacity and long-run development orientation, which could independently favour green investment. We address this in two ways. First, EG, TR and FA are included as controls, absorbing the principal dimensions of institutional and economic development. Second, the identification diagnostics reported in Panel B (Table 9) strongly support instrument validity: the Kleibergen–Paap F-statistic (362.31) far exceeds the Stock and Yogo (2005) 10% maximal IV size critical value of 16.38, confirming a strong instrument; and the Anderson–Rubin weak-instrument-robust test (F = 27.19, p < 0.001) confirms the significance of the FinTech effect under the most conservative validity check. Since the model is exactly identified with one excluded instrument, the Hansen J overidentification test is not applicable by construction—a limitation we acknowledge openly. All contemporaneous controls are included to absorb potential confounds. The sample reduces to 588 observations due to broadband data availability.
Table 9.
Second-stage coefficient estimates and identification diagnostics.
The Kleibergen–Paap F-statistic (362.31) far exceeds the Stock and Yogo (2005) 10% maximal IV size critical value of 16.38, confirming a strong instrument. The Anderson–Rubin weak-instrument-robust test confirms FinTech significance under the most conservative validity check. Since the model is exactly identified with one excluded instrument, the Hansen J overidentification test is not applicable by construction.
The 2SLS estimate of the FinTech coefficient is 0.156***, consistent with the MMQR baseline and confirming that the positive FinTech effect on green finance survives full endogeneity correction. All control variables retain expected signs consistent with the MMQR results.
6. Discussion
The MMQR results reveal a consistently positive and distribution-dependent role for FinTech in promoting green finance. The upward contemporaneous profile (0.088 at Q20 to 0.105 at Q80) suggests FinTech acts as a scalable enabler: removing access barriers at early stages and enhancing efficiency and instrument sophistication at advanced stages. These findings extend Mirza et al. (2023), who document a positive FinTech effect on European bank green lending using mean-based methods—our results show the effect is strongest precisely where green investment is already advanced. Chien et al. (2025) find FinTech improves green finance efficiency in countries with sound regulation, consistent with our high-quantile ICT pattern. Bel Hadj Miled (2025) confirms a long-run positive FinTech effect in BRICS using CS-ARDL; our 2SLS results corroborate this causal conclusion in a European context. Zhou et al. (2022) find FinTech promotes green growth in China via a green finance channel, and Zia et al. (2024) confirm this link across European countries, providing our closest comparator.
The results also highlight the complementary role of ICT infrastructure. While digital connectivity has limited influence on green finance at lower quantiles, its effect becomes increasingly important at higher levels of public renewable energy investment, rising sharply from the median onward and reaching strong significance at q60 and q80. This pattern underscores that EU countries with mature renewable energy sectors may require advanced digital ecosystems to support complex green finance operations, such as monitoring ESG performance, integrating digital platforms with energy systems, and enabling cross-border green-investment flows. ICT also facilitates access to environmental data, enhances climate-risk assessment, and encourages innovation in green finance solutions (Fambeu & Yomi, 2024; Khan et al., 2024; Zheng & Zhang, 2025).
In contrast, financial access exhibits diminishing relevance as economies move toward higher levels of green finance. At lower quantiles, broad access to financial institutions is essential for mobilizing public investment in renewable energy, as reflected by high and significant coefficients at q20 and q40. However, as digital transformation accelerates and fintech solutions become embedded in financial systems, the impact of traditional financial access declines, becoming statistically insignificant at q80. This transition reflects a shift from conventional financial inclusion to digitally enabled financial participation, where fintech tools increasingly substitute for traditional banking channels. Financial institutions nonetheless continue to play a critical role by providing capital, promoting innovation, and channelling funds into environmentally focused projects, such as through green bonds (Marashdeh & Khataybeh, 2025).
Natural resource rents exhibit a strong and persistent negative effect across all quantiles, providing compelling evidence of a resource-curse mechanism (consistent with H5). Countries with heavy dependence on fossil-fuel revenues tend to invest less publicly in renewable energy, and this tendency is especially pronounced in economies with high potential for green investment. This reinforces the broader view that resource dependence can delay or distort the transition toward sustainable energy systems. By contrast, the consistently negative GDP effect suggests that wealthier European economies may rely more on private market-based mechanisms than direct public expenditure for renewable energy, a pattern consistent with IEA (2024) investment data showing that public finance represents a substantially smaller share of clean energy spending in advanced economies (IEA, 2024). We interpret this finding cautiously, however, as omitted institutional variables such as regulatory stringency and governance quality may offer alternative explanations. Future research directly comparing public and private renewable investment flows within a unified framework would help resolve this ambiguity.
Finally, inflation remains statistically insignificant across the distribution, indicating that macroeconomic stability in Europe insulated public green-investment decisions from short-term price fluctuations. This reflects the predictable monetary environment maintained by European economies and aligns with the expectation that long-term public-investment strategies are less sensitive to inflationary pressures.
Overall, the coefficient–quantile patterns underscore substantial distributional heterogeneity in the determinants of green finance. Fintech and ICT emerge as critical drivers in high-investment regimes, while financial access, trade openness, and natural resource dependence exert their strongest effects at specific points of the distribution. These findings highlight the importance of digitally enabled financial innovation and well-developed ICT infrastructure in accelerating green finance and supporting Europe’s transition to a low-carbon economy.
7. Robustness Analysis
7.1. Bootstrap Quantile Regression
Table 10 reports bootstrap quantile regression estimates. FinTech is positive and significant at every quantile from Q20 to Q90, increasing monotonically across the distribution. The ICT pattern mirrors the MMQR baseline: insignificant at Q20, strengthening to 0.503 at Q80. Financial access declines from 0.778 (Q20) to being insignificant at Q80, and resource rents deepen from −0.204 (Q20) to −0.730 (Q90), confirming the resource curse mechanism. Bootstrap standard errors are robust to non-normal residuals and cross-sectional dependence (Buchinsky, 1998), providing distribution-free confirmation that MMQR inference is not driven by violations of asymptotic normality.
Table 10.
Bootstrap quantile regression results.
7.2. Quantile Regression with Fixed Effects
The Canay (2011) two-step estimator provides a distributional robustness check under a different fixed-effects assumption than MMQR: fixed effects are treated as pure additive location shifts. The Koenker and Bassett (1982) heteroskedasticity test validates the quantile approach over standard FE. Table 11 reports the results. FinTech is positive and significant at all four quantiles, fully corroborating the MMQR baseline. ICT is insignificant at Q20 and strengthens to 0.499 at Q80; financial access declines from 0.620 (Q20) to −0.310 (Q80); and resource rents deepen from −0.014 (Q20) to −0.500 (Q80), confirming the resource lock-in mechanism. The Wald test of FinTech slope equality confirms a smooth monotone gradient rather than discrete regime shifts. The convergence of MMQR and Canay QFE under fundamentally different fixed-effects assumptions confirms that the distributional heterogeneity reflects genuine economic structure.
Table 11.
Canay quantile regression with fixed effects.
Across all the robustness strategies, the positive FinTech effect on green finance is unambiguous. Under Bootstrap QR (Q20–Q90: 0.069–0.125) and Canay QFE (Q20–Q80: 0.035–0.084), FinTech is positive and significant across all specifications. The 2SLS first-stage F = 309.17 rules out weak instruments; Hansen J p = 0.092 confirms instrument exogeneity; and the Koenker–Bassett test validates quantile estimation. Together, these results provide strong multi-method evidence of a causal positive effect of FinTech on public renewable energy investment in Europe, robust to distributional sensitivity, endogeneity, and alternative fixed-effects specifications.
7.3. Dual Proxy Robustness: Alternative Measures of Both FinTech and Green Finance
To simultaneously address concerns about both the FinTech and green finance proxies, we replace internet banking penetration with FinTech credit per capita from Cornelli et al. (2020), which measures the volume of alternative finance originated through digital platforms per person—including peer-to-peer lending, marketplace lending, crowdfunding, and invoice trading—and captures the output dimension of FinTech financial activity rather than adoption rates, and replace public renewable energy investment with green bond issuance, sourced from the IMF Climate Database (https://climatedata.imf.org) (accessed on 11 December 2025). This constitutes the most demanding robustness test in the paper: both the dependent variable and the key independent variable are replaced with conceptually distinct measures that capture fundamentally different dimensions of the same underlying constructs. The sub-sample covers 21 European countries over 2013–2019 (N = 147); eight countries (Croatia, Cyprus, Czechia, Greece, Hungary, Malta, Romania, Slovakia) are absent from the Cornelli et al. database because their alternative finance markets were nascent or unreported during this period (Cornelli et al., 2020).
Table 12 reports the MMQR estimates. FinTech credit per capita exerts a positive and statistically significant effect on green bond issuance at Q60 (β = 0.151) and Q80 (β = 0.220), with the location coefficient also significant. Critically, the FinTech credit coefficient increases monotonically from Q20 (β = 0.042, insignificant) to Q80 (β = 0.220)—replicating the upward-sloping distributional profile from the MMQR baseline with an entirely different proxy combination. The insignificance at lower quantiles is consistent with Hypothesis 2: FinTech credit stimulates green bond issuance primarily in countries with already-established capital market infrastructure—precisely the high-quantile economies in the green bond distribution—while early-stage markets lack the platform connectivity between alternative finance and green bond origination. The ICT coefficient also mirrors the baseline pattern, strengthening monotonically from Q20 (0.410) to Q80 (0.988), confirming the digital complementarity mechanism across both proxy combinations.
Table 12.
Dual-proxy robustness: FinTech credit → green bond issuance.
The GDP coefficient reverses the sign relative to the baseline. This sign reversal is economically coherent and informative rather than contradictory: wealthier European countries issue more green bonds through private capital markets while simultaneously allocating less of their public budgets to direct renewable energy investment—a composition effect consistent with the discussion in Section 5. The two proxies therefore capture complementary dimensions of green finance: the public investment channel, which is suppressed by wealth as fiscal responsibility shifts to private markets, and the private capital market channel, which grows with wealth as institutional infrastructure deepens. Trade openness retains a negative and significant effect across all quantiles (−0.901 to −1.629), consistent with the substitution mechanism identified in the baseline. Resource rents and inflation are not significant, suggesting these structural constraints operate specifically through the public investment channel rather than green bond markets.
The convergence of results across two independent proxy combinations—internet banking + public renewable investment (N = 667) and FinTech credit + green bond issuance (N = 147)—confirms that the positive distributional FinTech effect on green finance is not an artefact of any specific measurement choice but reflects a genuine structural relationship between digital financial development and green finance across the conditional distribution.
8. Conclusions
This study applies MMQR to examine how FinTech development, digitalization, financial access, and structural factors shape public renewable energy investment across 29 European countries over 2000–2022. Results reveal substantial distributional heterogeneity, with drivers differing significantly between low- and high-investment countries. Four robustness strategies confirm a causally credible positive FinTech effect.
Fintech emerges as the most robust and consistently significant determinant of green finance. Its effect strengthens steadily across the quantiles, indicating that fintech not only stimulates green investment in lower-performing countries but becomes even more influential in economies that already allocate substantial resources to renewable energy. Digital infrastructure also plays an increasingly important role as countries progress toward higher levels of green finance, suggesting that ICT development complements fintech by enabling more advanced digital financial ecosystems conducive to green investment.
In contrast, financial access is most impactful at the early stages of green finance development, with its effect weakening and ultimately disappearing in higher quantiles. This pattern implies that once basic financial inclusion is achieved, digitalized and fintech-based financing channels become more relevant for mobilizing additional green investment.
On the structural side, GDP, trade openness, and natural resource dependence act as constraints on public green investment. Higher-income economies appear to rely more on private-sector renewables financing, while greater trade openness reduces domestic public spending—likely due to reliance on imported technologies and foreign private investment. The strong and increasingly negative effect of natural resource rents confirms a persistent resource curse dynamic, where dependence on extractive revenues slows the transition toward renewable energy. Inflation shows no meaningful influence, reflecting the stable macroeconomic environment of most European economies.
Overall, the findings demonstrate that green finance drivers operate differently across the investment distribution. Green finance in Europe is increasingly shaped by digital transformation—where fintech and ICT gain prominence at advanced stages—while traditional factors such as financial access matter primarily for countries still building their green finance foundations. Structural constraints linked to resource dependence and trade intensification remain significant obstacles. These insights underscore the importance of tailored policies: low-investment countries should prioritize expanding financial access and foundational digital infrastructure, whereas high-investment countries can accelerate progress by deepening fintech adoption, enhancing ICT systems, and addressing structural barriers that limit renewable energy funding.
The distributional findings imply that a uniform policy framework is suboptimal. For countries at lower quantiles (Q20–Q40, i.e., early-stage green investors), the binding constraints are financial access and foundational digital infrastructure: policymakers should prioritize expanding financial inclusion and broadband connectivity to mobilize public renewable investment. For countries at upper quantiles (Q60–Q80, i.e., advanced green investors), FinTech adoption and ICT depth become the primary levers: enabling regulation for green digital platforms, incentivizing FinTech-based green bond markets, and investing in interoperable digital public services will yield the largest gains. Across all quantiles, addressing resource dependence is critical: the resource curse mechanism intensifies at higher quantiles, meaning fossil fuel revenue dependence constrains countries with the greatest green investment potential. These countries should design fiscal transitions that redirect resource revenues toward renewable energy investment.
9. Limitations and Future Research
Several limitations suggest directions for future research. First, the GF proxy (public renewable energy investment) excludes private green bonds, sustainable lending, and ESG instruments; composite measures combining IRENA, Climate Bonds Initiative, and BNEF data would provide broader coverage. Second, incorporating institutional variables (regulatory quality, governance, environmental policy stringency) would strengthen internal validity. Finally, extending to emerging economies and spatial spillover models would broaden generalizability.
Funding
This work was supported and funded by the Deanship of Scientific Research at Imam Mohammad Ibn Saud Islamic University (IMSIU) (grant number IMSIU-DDRSP2604).
Institutional Review Board Statement
Not applicable.
Informed Consent Statement
Not applicable.
Data Availability Statement
All data used in this study are obtained from publicly accessible international databases. Green finance (GF), measured by public investment in renewable energy, is sourced from the International Renewable Energy Agency (IRENA) (https://www.irena.org), (accessed on 11 December 2025). FinTech development (FINT), measured by the percentage of individuals using internet banking to make online payments, is obtained from Eurostat (https://ec.europa.eu/eurostat), (accessed on 12 December 2025). Financial access (FA) is sourced from the IMF Financial Development Index database (https://data.imf.org), (accessed on 12 December 2025). Economic growth (EG), total natural resource rents (TNR), information and communication technology development (ICT), trade openness (TR), and inflation (INF) are obtained from the World Development Indicators (WDI) published by the World Bank (https://databank.worldbank.org), (accessed on 12 Decemeber 2025). Green bond issuance data are obtained from the KAPSARC Energy Data Portal: https://datasource.kapsarc.org/, (accessed on 11 December 2025).
Conflicts of Interest
The author declares no conflict of interest.
References
- Addy, W., Oyewole, A., Odeyemi, O., Ololade, Y., Ofodile, O., Adeoye, O., & Okoye, C. (2024). Data-driven sustainability: How fintech innovations are supporting green finance. Engineering Science & Technology Journal, 5(3), 760–773. [Google Scholar] [CrossRef] [Scilit]
- Ahmad, F., Boumaiza, A., Sanfilippo, A., & Al-fagih, L. (2025). A comprehensive review on green finance and its impact on net zero energy transition: From the perspective of renewable energy development. Energy Strategy Reviews, 62, 101948. [Google Scholar] [CrossRef] [Scilit]
- Akerman, A., Gaarder, I., & Mogstad, M. (2015). The skill complementarity of broadband internet. Quarterly Journal of Economics, 130(4), 1781–1824. [Google Scholar] [CrossRef] [Scilit]
- Al-Assaf, G., Abdel-Halim, M., & Shehadeh, M. (2025). The macroeconomic drivers of fintech development in emerging markets: An empirical investigation. Discover Sustainability, 6(1), 863. [Google Scholar] [CrossRef] [Scilit]
- Al Hammadi, T., & Nobanee, H. (2019). FinTech and sustainability: A mini-review. SSRN Electronic Journal. [Google Scholar] [CrossRef] [Scilit]
- Attia, E. F., & BinEid, S. M. (2025). Fintech as a catalyst for sustainability: Empirical evidence from Saudi Arabia. Sustainability, 17(21), 9621. [Google Scholar] [CrossRef] [Scilit]
- Bel Hadj Miled, K. (2025). Nexus between fintech, green finance natural resources, economic growth and environment sustainability: Evidence from BRICS countries. Future Business Journal, 11, 47. [Google Scholar] [CrossRef] [Scilit]
- Broby, D., & Yang, Z. (2025). What is green fintech? Journal of Risk and Financial Management, 29(18), 7. [Google Scholar] [CrossRef] [Scilit]
- Buchinsky, M. (1998). Recent advances in quantile regression models: A practical guideline for empirical research. The Journal of Human Resources, 33(1), 88–126. [Google Scholar] [CrossRef] [Scilit]
- Canay, I. A. (2011). A simple approach to quantile regression for panel data. The Econometrics Journal, 14(3), 368–386. [Google Scholar] [CrossRef] [Scilit]
- Cevik, S. (2024). Promise (un)kept? Fintech and financial inclusion. In IMF working papers. IMF Working Paper WP/24/131. IMF. [Google Scholar] [CrossRef] [Scilit]
- Chang, L., Taghizadeh-Hesary, F., & Saydaliev, H. B. (2022). How do ICT and renewable energy impact sustainable development? Renewable Energy, 199(July), 123–131. [Google Scholar] [CrossRef] [Scilit]
- Cheng, X., Yao, D., Qian, Y., Wang, B., & Zhang, D. (2023). How does fintech influence carbon emissions: Evidence from China’s prefecture-level cities. International Review of Financial Analysis, 87, 102655. [Google Scholar] [CrossRef] [Scilit]
- Chiad, F., Aouissi, A., & Lahsasna, A. (2021). Financial market inclusion and economic growth: Evidence from Algeria. Empirical Economics Letters, 10(20), 1793–1812. [Google Scholar]
- Chien, F., Zhang, Y., & Sadiq, M. (2025). Fintech innovation in green finance: A disruptive force or a complementary tool? International Review of Economics and Finance, 104, 104658. [Google Scholar] [CrossRef] [Scilit]
- Cornelli, G., Frost, J., & Gambacorta, L. (2020). Fintech and big tech credit: A new database (Issue 887). Available online: https://www.bis.org/publ/work887.htm (accessed on 10 March 2026).
- Dar, B. I., Badwan, N., & Kumar, J. (2024). Investigating the role of Fintech innovations and green finance toward sustainable economic development: A bibliometric analysis. International Journal of Islamic and Middle Eastern Finance and Management, 17(6), 1175–1195. [Google Scholar] [CrossRef] [Scilit]
- Diamond, D. W. (1984). Financial intermediation and delegated monitoring. Review of Economic Studies, 51(3), 393–414. [Google Scholar] [CrossRef] [Scilit]
- Dutta, A., Bouri, E., & Noor, M. H. (2021). Climate bond, stock, gold, and oil markets: Dynamic correlations and hedging analyses during the COVID-19 outbreak. Resources Policy, 74, 102265. [Google Scholar] [CrossRef] [Scilit]
- EEA, E. E. (2025). Economic losses from weather- and climate-related extremes in Europe. EEA—Analysis & Data. Available online: www.eea.europa.eu/en/analysis/indicators/economic-losses-from-climate-related (accessed on 7 January 2026).
- Fambeu, A. H., & Yomi, P. T. (2024). Do ICTs promote the renewable energy consumption? The moderating effects of economic growth and structural transformation in Africa. International Economics, 180, 100563. [Google Scholar] [CrossRef] [Scilit]
- Fan, J., Liao, Y., & Yao, J. (2015). Power enhancement in high-dimensional cross-sectional tests. Econometrica, 83(4), 1497–1541. [Google Scholar] [CrossRef] [Scilit]
- Fasano, F., & Cappa, F. (2022). How do banking fintech services affect SME debt? Journal of Economics and Business, 121, 106070. [Google Scholar] [CrossRef] [Scilit]
- Fu, Y., Wang, Z., & Wang, Y. (2024). Green financial policy for fostering green technological innovation: The role of financing constraints, science expenditure, and heightened industrial structure. Sustainability, 16(20), 9136. [Google Scholar] [CrossRef] [Scilit]
- Galeone, G., Ranaldo, S., & Fusco, A. (2024). ESG and FinTech: Are they connected? Research in International Business and Finance, 69, 102225. [Google Scholar] [CrossRef] [Scilit]
- Goldstein, I., Jiang, W., & Karolyi, G. A. (2019). To FinTech and beyond. The Review of Financial Studies, 32(5), 1647–1661. [Google Scholar] [CrossRef] [Scilit]
- Grigorescu, A., Oprisan, O., Lincaru, C., & Pirciog, C. S. (2023). E-banking convergence and the adopter’s behavior changing across EU countries. SAGE Open, 13(4), 1–19. [Google Scholar] [CrossRef] [Scilit]
- He, Z., Ge, F., Ban, S., Min Du, A., & Sheehan, M. (2024). Fintech’s influence on green credit provision: Empirical evidence from China’s listed banking sector. Research in International Business and Finance, 70, 102394. [Google Scholar] [CrossRef] [Scilit]
- Hussain, S., Ur Rehman, A., Affandi, H., Al-Faryan, M. A. S., & Naifar, N. (2026). Fintech, BigTech credit and sustainable development: International evidence. Technology in Society, 85, 103160. [Google Scholar] [CrossRef] [Scilit]
- IEA. (2024). World energy investment 2024. Available online: https://www.iea.org/reports/world-energy-investment-2024 (accessed on 13 March 2026).
- IRENA & CPI. (2023). Global landscape of renewable energy finance 2023. Available online: https://www.irena.org/Publications/2023/Feb/Global-landscape-of-renewable-energy-finance-2023 (accessed on 13 March 2026).
- Kashif, M., Pinglu, C., Ullah, S., & Zaman, M. (2024). Evaluating the influence of financial technology (FinTech) on sustainable finance: A comprehensive global analysis. In Financial Markets and Portfolio Management (Vol. 38, Issue 1). Springer US. [Google Scholar] [CrossRef] [Scilit]
- Khan, H. U., Malik, M. Z., Alomari, M. K. B., Khan, S. S., Al-Maadid, A. A. S. A., Hassan, M. K., Khan, K., Nguyen, M., Samarasinghe, A., Skully, M., Chong, T. T. L., Wang, S., Zhang, C. C. C. C., Diniz, E., Birochi, R., Pozzebon, M., Hwang, Y. K., Yunis, M., Tarhini, A., … IRENA. (2024). How does digital economy affect energy poverty? Analysis from the global perspective. Energy, 30(2), 1–14. [Google Scholar] [CrossRef] [Scilit]
- Koenker, R., & Bassett, G. (1982). Robust tests for heteroscedasticity based on regression quantiles. Econometrica, 50(1), 43–61. [Google Scholar] [CrossRef] [Scilit]
- Kwong, R., Kwok, M. L. J., & Wong, H. S. M. (2023). Green FinTech innovation as a future research direction: A bibliometric analysis on green finance and FinTech. Sustainability, 15(20), 14683. [Google Scholar] [CrossRef] [Scilit]
- Li, J., Wu, Y., & Xiao, J. J. (2020). The impact of digital finance on household consumption: Evidence from China. Economic Modelling, 86, 317–326. [Google Scholar] [CrossRef] [Scilit]
- Li, Y., Chu, E., Nie, S., Peng, X., & Yi, Y. (2024). Fintech, financing constraints and corporate green innovation. International Review of Financial Analysis, 96, 103650. [Google Scholar] [CrossRef] [Scilit]
- Liao, C. S. (2025). Does Fintech improve green innovation efficiency in China? Insight from R&D activities, green finance, and government environmental awareness. Quarterly Review of Economics and Finance, 103(16), 102035. [Google Scholar] [CrossRef] [Scilit]
- Liu, Q., & You, Y. (2023). FinTech and green credit development—Evidence from China. Sustainability, 15(7), 5903. [Google Scholar] [CrossRef] [Scilit]
- Liu, Z., & Li, X. (2024). The impact of bank fintech on ESG greenwashing. Finance Research Letters, 62, 105199. [Google Scholar] [CrossRef] [Scilit]
- Lv, P., & Xiong, H. (2022). Can FinTech improve corporate investment efficiency? Evidence from China. Research in International Business and Finance, 60, 101571. [Google Scholar] [CrossRef] [Scilit]
- Machado, J. A. F., & Santos Silva, J. M. C. (2019). Quantiles via moments. Journal of Econometrics, 213(1), 145–173. [Google Scholar] [CrossRef] [Scilit]
- Marashdeh, Z., & Khataybeh, M. (2025). Green finance and financial development in delivering environmental sustainability among the Gulf countries. Journal of Sustainable Finance & Investment, 15, 1–30. [Google Scholar] [CrossRef] [Scilit]
- Mirza, N., Umar, M., Afzal, A., & Firdousi, S. F. (2023). The role of fintech in promoting green finance, and profitability: Evidence from the banking sector in the euro zone. Economic Analysis and Policy, 78, 33–40. [Google Scholar] [CrossRef] [Scilit]
- Mizgajski, A., & Stępniewska, M. (2022). Environmental change and management BT—Three decades of Polish socio-economic transformations: Geographical perspectives (P. Churski, & T. Kaczmarek, Eds.; pp. 359–380). Springer International Publishing. [Google Scholar] [CrossRef] [Scilit]
- Nassiry, D. (2018). The role of Fintech in unlocking green finance (Issue 883). No. 883, ADBI Working Paper Series. ADBI. [Google Scholar]
- O’Brien, R. M. (2007). A caution regarding rules of thumb for variance inflation factors. Quality and Quantity, 41(5), 673–690. [Google Scholar] [CrossRef] [Scilit]
- Olaoye, O. O., Shaddady, A., & Tabash, M. I. (2025). Does FinTech enhance the effectiveness of financial inclusion to reduce income inequality? Evidence from Sub-Saharan Africa. International Journal of Emerging Markets, 21(2), 388–415. [Google Scholar] [CrossRef] [Scilit]
- Pedroni, P. (2004). Panel cointegration: Asymptotic and finite sample properties of pooled time series tests with an application to the PPP hypothesis. Econometric Theory, 20(3), 597–625. [Google Scholar] [CrossRef] [Scilit]
- Pesaran, M. H. (2015). Time series and panel data econometrics. Oxford University Press. [Google Scholar] [CrossRef] [Scilit]
- Pesaran, M. H. (2021). General diagnostic tests for cross-sectional dependence in panels. Empirical Economics, 60(1), 13–50. [Google Scholar] [CrossRef] [Scilit]
- Pesaran, M. H., Shin, Y., & Smith, R. J. (2001). Bounds testing approaches to the analysis of level relationships. Journal of Applied Econometrics, 16(3), 289–326. [Google Scholar] [CrossRef] [Scilit]
- Pesaran, M. H., & Smith, R. (1995). Estimating long-run relationships from dynamic heterogeneous panels. Journal of Econometrics, 68(1), 79–113. [Google Scholar] [CrossRef] [Scilit]
- Pesaran, M. H., & Yamagata, T. (2008). Testing slope homogeneity in large panels. Journal of Econometrics, 142(1), 50–93. [Google Scholar] [CrossRef] [Scilit]
- Petersen, M. A. (2009). Estimating standard errors in finance panel data sets: Comparing approaches. Review of Financial Studies, 22(1), 435–480. [Google Scholar] [CrossRef] [Scilit]
- Rerung, A., Tandililing, E. M., Agung Ay, R. A., Salamah, F., & Paranita, E. S. (2024). The influence of Fintech innovations, ESG reporting, and blockchain technology on financial transparency and accountability. The Journal of Academic Science, 1(2), 111–117. [Google Scholar] [CrossRef] [Scilit]
- Rogers, E. M., Singhal, A., & Quinlan, M. M. (2014). Diffusion of innovations. In An integrated approach to communication theory and research (pp. 432–448). Routledge. [Google Scholar]
- Roy, J. K., & Vasa, L. (2025). Financial technology and environmental, social and governance in sustainable finance: A bibliometric and thematic content analysis. Discover Sustainability, 6(1), 1–22. [Google Scholar] [CrossRef] [Scilit]
- Saeedi, M., & Ashraf, B. N. (2024). The role of technology in promoting green finance: A systematic literature survey and the development of a framework. Journal of Risk and Financial Management, 17(10), 472. [Google Scholar] [CrossRef] [Scilit]
- Saha, M., & Dutta, K. D. (2023). Does governance quality matter in the nexus of inclusive finance and stability? China Finance Review International, 13(1), 121–139. [Google Scholar] [CrossRef] [Scilit]
- Senyo, P. K., & Osabutey, E. L. C. (2020). Unearthing antecedents to financial inclusion through FinTech innovations. Technovation, 98, 102155. [Google Scholar] [CrossRef] [Scilit]
- Shang, X., & Niu, H. (2023). Does the digital transformation of banks affect green credit? Finance Research Letters, 58, 104394. [Google Scholar] [CrossRef] [Scilit]
- Sheng, Y., Wang, S., & Wang, Y. (2024). Doing good in times of need: Green finance policy and strategic corporate social responsibility. Economic Analysis and Policy, 84, 1029–1045. [Google Scholar] [CrossRef] [Scilit]
- Song, N., & Appiah-Otoo, I. (2022). The impact of fintech on economic growth: Evidence from China. Sustainability, 14(10), 6211. [Google Scholar] [CrossRef] [Scilit]
- Stock, J. H., & Yogo, M. (2005). Testing for weak instruments in linear IV regression . In Identification and inference for econometric models: Essays in honor of Thomas Rothenberg (pp. 80–108). Andrews DWK identification and inference for econometric models. Cambridge University Press. Available online: https://papers.ssrn.com/sol3/papers.cfm?abstract_id=346941 (accessed on 13 March 2026).
- Tan, X., Cheng, S., & Liu, Y. (2024). Green digital finance and technology diffusion. Humanities and Social Sciences Communications, 11(1), 389. [Google Scholar] [CrossRef] [Scilit]
- Tan, Y., Lin, B., & Wang, L. (2025). Green finance and corporate environmental performance. International Review of Economics and Finance, 98, 103929. [Google Scholar] [CrossRef] [Scilit]
- Tanchangya, T., Naher, K., Chowdhury, S., Islam, N., Mia, M. R., Rashid, F., & Sarker, S. R. (2025). Financial technology-enabled sustainable finance for small- and medium-sized enterprises. Environment, Innovation and Management, 1, 2550006. [Google Scholar] [CrossRef] [Scilit]
- Umar, M., Horobet, A., Negreanu, C. C., Belascu, L., & Mirza, N. (2025). Fintech adoption, AI development, and energy transition dynamics. Energy Economics, 151, 108905. [Google Scholar] [CrossRef] [Scilit]
- Vuković, D. B., Hassan, M. K., Kwakye, B., Febtinugraini, A., & Shakib, M. (2024). Does fintech matter for financial inclusion and financial stability in BRICS markets? Emerging Markets Review, 61, 101164. [Google Scholar] [CrossRef] [Scilit]
- Wang, J., Deng, H., & Zhao, X. (2024). Big data, green loans and energy efficiency. Gondwana Research, 133, 323–334. [Google Scholar] [CrossRef] [Scilit]
- Wang, P., & Xu, X. (2025). Green finance and energy efficiency improvement: The role of green innovation and industrial upgrading. Innovation and Green Development, 4(1), 100200. [Google Scholar] [CrossRef] [Scilit]
- Wang, Q. J., Wang, H. J., & Chang, C. P. (2022). Environmental performance, green finance and green innovation: What’s the long-run relationships among variables? Energy Economics, 110, 106004. [Google Scholar] [CrossRef] [Scilit]
- Wang, S., & Wang, C. (2023). How do Fintech and green bonds ensure clean energy production in China? Dynamics of green investment risk. Environmental Science and Pollution Research, 30(57), 120552–120563. [Google Scholar] [CrossRef] [Scilit] [PubMed]
- WDI, W. B. (2024). World development indicators. The World Bank. Available online: https://databank.worldbank.org/source/world-development-indicators (accessed on 27 March 2026).
- Westerlund, J. (2007). Testing for error correction in panel data. Oxford Bulletin of Economics and Statistics, 69(6), 709–748. [Google Scholar] [CrossRef] [Scilit]
- Wu, G., Liu, X., & Cai, Y. (2024). The impact of green finance on carbon emission efficiency. Heliyon, 10(1), e23803. [Google Scholar] [CrossRef] [Scilit]
- Xiong, Y., & Dai, L. (2023). Does green finance investment impact on sustainable development: Role of technological innovation and renewable energy. Renewable Energy, 214, 342–349. [Google Scholar] [CrossRef] [Scilit]
- Yang, T., & Zhang, X. (2022). FinTech adoption and financial inclusion: Evidence from household consumption in China. Journal of Banking and Finance, 145, 106668. [Google Scholar] [CrossRef] [Scilit]
- Zeng, L., Wong, W. K., Fu, H., Mahmoud, H. A., Cong, P. T., Thuy, D. T. T., & Bach, P. X. (2024). FinTech and sustainable financing for low carbon energy transitions: A biodiversity and natural resource perspective in BRICS economies. Resources Policy, 88, 104486. [Google Scholar] [CrossRef] [Scilit]
- Zheng, M., Wu, L., Feng, G. F., & Chang, C. P. (2025). The impact of green finance on sustainable development: An investigation into national ESG performance. Journal of Applied Economics, 28(1), 1–24. [Google Scholar] [CrossRef] [Scilit]
- Zheng, M., & Zhang, X. (2025). Digitalization and renewable energy development: Analysis based on cross-country panel data. Energy, 319, 135077. [Google Scholar] [CrossRef] [Scilit]
- Zhou, G., Zhu, J., & Luo, S. (2022). The impact of fintech innovation on green growth in China: Mediating effect of green finance. Ecological Economics, 193, 107308. [Google Scholar] [CrossRef] [Scilit]
- Zia, Z., Zhong, R., & Akbar, M. W. (2024). Analyzing the impact of fintech industry and green financing on energy poverty in the European countries. Heliyon, 10(6), e27532. [Google Scholar] [CrossRef] [Scilit] [PubMed]

Disclaimer/Publisher’s Note: The statements, opinions and data contained in all publications are solely those of the individual author(s) and contributor(s) and not of MDPI and/or the editor(s). MDPI and/or the editor(s) disclaim responsibility for any injury to people or property resulting from any ideas, methods, instructions or products referred to in the content. |
© 2026 by the author. Licensee MDPI, Basel, Switzerland. This article is an open access article distributed under the terms and conditions of the Creative Commons Attribution (CC BY) license.