


Abstract
The stability of Indonesia’s banking sector is closely linked to the effectiveness of capital regulations, particularly as a country that aligns its policies with Basel III standards. Ensuring that banks have adequate capital buffers is crucial for mitigating systemic risk. However, the interaction between regulatory requirements and actual banking behavior in developing countries remains poorly understood. This study aims to evaluate the impact of Indonesia’s capital requirement instruments, including the countercyclical capital buffer (CCyB), the capital conservation buffer (CCB), and the capital surcharge, on credit performance and financial stability across various bank categories. Using a quantitative approach, the analysis utilizes panel data from commercial banks, state-owned banks and regional development banks over several periods, using the panel regression method and Difference-in-Differences (DID) to assess how changes in buffer levels affect credit growth, Non-Performing Loans (NPLs), and the Capital Adequacy Ratio (CAR). The results show that capital buffers have a statistically significant effect on lending behavior: a 1% increase in buffer levels is associated with a measurable decrease in credit expansion across several bank groups, while CCBs exhibit a stronger stabilizing effect than CCyBs. Although these instruments do not eliminate financial uncertainty, they contribute to more prudent risk-taking. This study also revealed that the CCyB rate increases when the financial cycle is in an expansionary phase. Conversely, if the economy slows (as during the pandemic), the CCyB rate can be lowered back to 0% to encourage bank intermediation, thus shaping the bank’s responses to regulation. Several implications of implementing a capital buffer in Indonesia include the benefits of resilience and bank behavior during credit expansion. Overall, this study concludes that aligning regulatory frameworks with real-world banking behavior is crucial for enhancing financial stability in developing countries, such as Indonesia.
1. Introduction
The 2008 global financial crisis exposed fundamental weaknesses in banking systems worldwide, particularly the inability of existing capital regulations to prevent excessive risk-taking and systemic contagion. Research in developed countries, such as the United States and Europe, shows that capital requirement implementation significantly reduces the likelihood of a crisis by increasing the resilience of banking capital (Berger & Bouwman, 2013; Gropp et al., 2019). Corbae and D’Erasmo (2021) and Dietsch et al. (2020) show that capital regulation can also reduce the transmission of risk to the real sector, which ultimately plays a role in maintaining long-term economic stability. The failure of many institutions to maintain adequate levels of high-quality capital highlighted the need for a stronger regulatory framework capable of strengthening bank resilience and mitigating the amplification of shocks to the real economy. Research in developing countries, such as India (Swamy, 2018) and Zimbabwe (Chinoda et al., 2015), revealed that capital regulations can affect bank liquidity and hinder the ability to channel credit needed to drive economic growth in countries with lower economic resilience. Polizzi et al.’s (2020) study suggests that the impact of capital policy varies depending on each country’s legal and institutional environment characteristics. Gassouma (2019) examined the effect of credit risk and its regulatory measures on accounting manipulation in 202 banks in the 10 MENA countries. In the case of banking undercapitalization, MENA banks overcapitalized to reach the required regulatory capital (8% for banks that practice Basel I and Basel II; and 10.5% for banks that apply Basel III) before the Arab Spring. Using difference in difference, this study shows that the abnormal accruals have significantly decreased after the Arab Spring, indicating a reduction in accounting manipulation. After the revolution, MENA banks changed their behavior toward manipulation. Banking undercapitalization reduces the credit supply to recapitalize and does not encourage managers to manipulate the accounting result to fulfill the capital regulation. Banking prudence limits banking overcapitalization through legal restructuring and informational transparency against credit risk taking.
This study renewed its focus on capital regulation, which is particularly relevant for emerging markets, where structural vulnerabilities, concentrated banking sectors, and uneven institutional capacity can intensify financial instability. In this context, Indonesia presents a compelling case. Its banking sector is characterized by significant heterogeneity in terms of bank size, capital strength, and market power, operating in an environment of monopolistic competition. These structural features create potential asymmetries in the manner in which institutional regulatory capital requirements are absorbed. Although global standards, such as Basel III, introduce instruments aimed at improving banks’ capacity to withstand cyclical and systemic disruptions, the uniform application of these requirements assumes a degree of homogeneity that may not exist in developing countries. Basel III is an enhancement of Basel II, designed after the 2008 financial crisis to strengthen bank resilience. The main differences lie in improving the quality/quantity of capital (tier 1), capital buffers (conservation and countercyclical), leverage ratio, and new liquidity standards (LCR and NSFR) to address systemic risk. The following text outlines the main differences between Basel II and Basel III. First, the capital structure in Basel II focuses on credit, market, and operational risks with minimum capital requirements. Basel III significantly increases the quality and quantity of capital, particularly Common Equity Tier 1 (CET1), to ensure that banks have strong core capital to absorb losses. Second, Basel II does not regulate specific capital buffers. Basel III introduces two main buffers: the capital conservation buffer to ensure banks build capital during good times for use in times of crisis and the countercyclical capital buffer that requires additional capital when credit growth is too rapid to reduce systemic risk. Third, the leverage ratio in Basel II relies on risk-weighted assets (RWA), which can sometimes be manipulated. The leverage ratio is introduced as a non-risk limit to prevent banks from overleveraging (taking on too much debt). Fourth, Basel II does not have strict international liquidity standards. In contrast, Basel III introduces two minimum liquidity standards: the Liquidity Coverage Ratio (LCR) and the Net Stable Funding Ratio (NSFR). Fifth, Basel II focuses more on individual bank risk (risk sensitivity) and Basel III focuses more on systemic risk (the entire banking sector) and resilience to liquidity crises. This study indicates that capital regulation largely benefits the large banks in Indonesia by giving them greater capacity to build additional capital and increase lending, particularly during good economic times. A visible positive impact after the policy was implemented was an increase in credit relative to assets across the banking sector. This raises an important scientific question: do standardized capital buffers function effectively in banking systems with institutional characteristics that differ significantly from those of developed countries for which these frameworks were originally intended?
This study fills a gap in the literature on capital buffers in the form of CCyB, CCB, and CS, based on banking characteristics and economic conditions in developing countries. This study provides the first comprehensive causal evidence on the differential impact of the three Basel III buffers (CCyB, CCB, and CS) across Indonesia’s heterogeneous banking landscape, which are classified by size, capital, and risk profile. In the context of Indonesia, which has higher economic fluctuations, a more fragmented market, and more limited access to capital, these factors may influence the implementation of Basell III. Furthermore, this research gap highlights the contrast between banks with high assets, profitability, and liquidity. The stages of additional capital formation have been gradually implemented in Indonesia since 2016. Minimum capital requirement had to be met from 2 February 2016, with tier 1 requiring 6% RWA and common tier 1 requiring 4.5%. Banks are required to provide additional capital as buffers, such as capital conservation buffer (CCB), countercyclical buffer (CoB), and capital surcharge (CS) (Otoritas Jasa Keuangan, 2016).
A core issue arises from this tension. If banks’ ability to accumulate and maintain capital varies significantly, then identical regulatory requirements can produce different outcomes in terms of credit allocation, risk-taking behavior, and overall financial stability. This dynamic is particularly pronounced in Indonesia, where the distribution of market power and capital resources is uneven, potentially affecting banks’ responses to Basel III capital buffer implementation. Understanding whether these instruments are operating as intended or creating unintended frictions in the financial system is crucial for evaluating the appropriateness of current macroprudential strategies in an EM environment.
Based on the literature review and theoretical framework, this study assesses the impact of CCyB, CCB, and CS on credit performance. This study also examines the impact of capital regulation on the treated group after 2016 in terms of banking risk (allowance for impairment losses, gross NPL, net NPL, market risk RWA/total assets, credit risk RWA/total assets, and Z-score).
The implementation of capital buffers, particularly the countercyclical capital buffer (CCyB), capital conservation buffer (CCB), and capital surcharge (CS), gained significant momentum following the adoption of Basel III standards. Previous studies (Bui et al., 2017; Jiménez et al., 2017; Jokipii & Milne, 2011) have shown that capital buffers play a crucial role in maintaining financial system stability by allowing banks to absorb shocks during periods of economic stress. However, most of these studies focused on developed countries, and empirical evidence from developing countries, such as Indonesia, remains limited.
The CCyB is designed to address extreme credit cycles by requiring banks to accumulate and release additional capital during periods of economic expansion and recession. Auer et al. (2022) and Basten (2019) suggested that CCyB can effectively curb excessive credit growth. However, Behn et al. (2016) argued that the effectiveness of the CCyB may be compromised in emerging markets, where economic volatility is higher and smaller banks have limited capacity to build reserves. Consequently, smaller banks may face greater financial vulnerability than larger institutions during economic downturns. Similarly, CCBs encourage banks to maintain adequate capital buffers during normal periods, thereby strengthening their resilience to economic shocks. Empirical evidence (Dadashova et al., 2018; Korein et al., 2021) supports this view. In Indonesia, where liquidity constraints and economic fluctuations are significant, CCBs are even more vital. However, uneven capital strength among banks, particularly among smaller institutions, remains a major challenge to consistent compliance (International Monetary Fund, 2024).
Meanwhile, CS applies to systemically important banks (G-SIBs or D-SIBs) to mitigate systemic risk. Behn and Schramm (2021) and Cappelletti et al. (2024) demonstrated that higher surcharges for large banks can effectively mitigate systemic vulnerabilities. However, in a highly fragmented banking system such as Indonesia, Dautovic (2020) warns that CS can inadvertently create competitive distortions, giving large banks greater market power while smaller banks struggle to maintain competitiveness.
The user of capital buffers has grown rapidly in recent years, especially after Basel III implementation. However, studies on the specific implementation of capital buffers in developing countries, such as Indonesia, are still limited. Previous research by Bui et al. (2017), Jiménez et al. (2017), and Jokipii and Milne (2011) has shown that a capital buffer plays a crucial role in maintaining financial system stability by providing capital reserves that banks can use to absorb losses during periods of economic instability. The impact of capital regulations on banking risk also depends on the bank’s ability to balance risk and profitability. Bridges et al. (2014) notes that increased capital requirements often encourage banks to reduce their high-risk loan portfolios, which directly reduces systemic risk. However, this can also reduce the capacity of banks to support economic growth through credit financing. Juelsrud and Wold (2020) demonstrate that capital regulations can lead to a rebalancing of bank portfolios, with more investment in lower-risk assets.
Recent research has also yielded mixed results regarding the effectiveness of capital buffers in promoting financial stability. Aikman et al. (2018) argue that higher capital requirements enhance financial resilience, whereas Behn et al. (2016) warn that, during recessions, tighter capital rules can exacerbate credit contraction. Evidence from Bahaj and Malherbe (2020) further suggests that higher capital requirements can sometimes encourage banks to expand lending during stable periods due to the “forced safety” effect. Previous research has shown that increasing core capital (tier 1) can reduce the risk of bankruptcy and increase market confidence in the banking system (Anginer et al., 2024; Bitar et al., 2016). This effect is not always uniform across banking contexts, especially in banks with high credit and operational risk exposure. For example, Bostandzic et al. (2022) found that banks with higher capital ratios had greater stability during the crisis, but this effect may depend on market conditions and the bank’s capital strategy.
Cummings and Wright (2016) found evidence that banks in Australia use provisions for loans that are predicted to be loss-making (loan-loss provisions) as a buffer against the capital cycle. Gropp et al. (2019) concluded that banks reduce their credit exposure to corporate and retail borrowers by depreciating assets rather than reducing risk. Bichsel et al. (2022) demonstrated the implementation of the buffer. While this policy can reduce credit growth in the short term, it improves credit portfolio quality and long-term sustainability, especially for banks facing capital pressures. Degryse et al. (2021) and Dietsch et al. (2020) revealed that capital buffers play a role in reducing the negative impact of the economic cycle on credit performance, especially by strengthening banks’ ability to absorb credit risk. While the Indonesian literature emphasizes regulatory compliance, the behavioral mechanisms that shape bank decision-making under capital constraints receive less attention. In this context, financial literacy becomes relevant not as a separate research topic but as a behavioral factor influencing bank managers, borrowers, and market participants’ responses to capital regulations. Lower financial literacy, particularly among MSME borrowers, can increase credit risk, leading banks to become more conservative in their lending behavior when capital buffers tighten. This behavioral dimension may help explain why the impact of CCyB, CCB, and CS in Indonesia may differ from that in developed countries, where financial literacy and risk management capabilities are generally higher for capital policy buffer. This is relevant in the context of Indonesia’s higher economic fluctuations compared to developed countries, as well as small banks’ more limited access to capital. This study also highlights how Indonesia’s small banks face competitive challenges against larger banks with greater access to capital and economies of scale, despite the economic crisis.
Given Indonesia’s fragmented banking market, unequal access to capital, and varying levels of borrower financial capacity, the effectiveness of the Basel III capital buffer remains uncertain. The previous literature focused more on capital buffers in general (Bichsel et al., 2022; Cummings & Wright, 2016; Fang et al., 2022; Ismail & Ahmed, 2022; Le et al., 2023) but was still limited to capital buffers (Bui et al., 2017; Jiménez et al., 2017; Jokipii & Milne, 2011), specifically countercyclical capital buffers (Auer et al., 2022; Basten, 2019; Behn et al., 2016; Behncke, 2023), capital conservation buffers (Dadashova et al., 2018; Korein et al., 2021), and capital surcharge (Behn & Schramm, 2021; Cappelletti et al., 2024; Dautovic, 2020). The implementation of Basel III pays considerable attention to strengthening capital quality by prioritizing common equity tier 1 (CET1) as the main component. CET1 includes ordinary shares, retained earnings, and other reserves, with the minimum standard of risk-weighted assets increased to 4.5% (Bank for International Settlements, 2017).
Behn and Schramm (2021) and Cappelletti et al. (2024) found that by encouraging large banks to hold higher capital, CS implementation can reduce systemic risk. Therefore, this study seeks to address this gap by examining how CCyB, CCB, and CS influence lending and banking stability in Indonesia, while also considering behavioral contexts, such as credit distribution behavior, capital strengthening strategies, consolidation and cost efficiency, that shape banks’ risk-taking and credit allocation decisions. A deeper understanding of these interactions is crucial for designing a buffer framework that supports financial stability without restricting credit, particularly for MSMEs that rely heavily on smaller banks. This study fills the gap in the literature on capital buffers in the form of CCyB, CCB, and CS, assessing their impact on banking characteristics and economic conditions in Indonesia as a developing country with higher economic fluctuations, a more fragmented market, and more limited access to capital; these factors can affect the impact of Bassell III implementation regulations. This research gap also highlights the contrasting differences between banks with high assets, high profitability, and high liquidity. It fills a gap in a context in which large banks benefit from economies of scale and greater access to capital.
Mateev et al. (2024) studied bank stability during the COVID-19 pandemic in MENA countries and found that bank stability strongly depended on the level of market concentration and not on bank efficiency. Saeed and Donkoh (2026) examine how credit risk management and bank-specific factors influence commercial banks’ financial performance in Ghana. This research also contributes to an in-depth examination of Indonesian banks’ implementation of the global CAR standards of Basel III in general and during the COVID-19 crisis. Indonesian banks have segmentation, based on ownership and core capital to be diversified, and have the characteristics of monopolistic competition.
2. Materials and Methods
This study uses a quantitative, data-driven approach to examine the interaction of key financial variables in the Indonesian banking industry. This study focuses on how capital regulations and external factors affect bank performance, credit growth, and risk. The analysis is based on a comprehensive panel dataset covering many banks over a long observation period, ensuring that the results are robust and consistent. Regression models and econometric techniques are used to test hypotheses derived from finance and banking theory (Greene, 2018). To better understand how regulatory changes affect credit risk and overall bank performance, the empirical framework incorporates bank-specific characteristics, such as bank size, financial structure, and revenue diversification, as well as macroeconomic conditions. Panel data techniques and the DID approach are applied to enhance causal identification (Greene, 2018; Reichardt, 2019). Applying the DID approach to examine the causal effect before and after the capital regulation, in this study, we divided the period into two events: before the capital regulation in 2016 and after the capital regulation, required to be fulfilled by the banks in Indonesia in 2016. In effect, this meant division into before the regulation (years 2010–2016) and after the regulation (years 2016–2024). The countercyclical capital buffer and capital conservation buffer implemented in Indonesia with regulatory support from the financial services authority (OJK Regulation No. 11 of 2016) aims to help Indonesian banks adapt more easily to changing economic conditions by requiring them to maintain additional capital requirements during periods of growth. This study also measures financial stability using the Z-score, a widely adopted indicator, to determine financial stability, where lower values indicate a higher probability of financial distress.
2.1. Data
This study uses secondary data from Indonesian banks’ financial reports. The source of data is the Financial Services Authority in Indonesia (OJK), covering 97 of 105 banks in Indonesia from Q1 2010 to Q1 2024. The bank sample includes conventional commercial banks, state-owned banks, and regional development banks. Quarterly data on credit, capitalization, and risk indicators are used to align our analysis with the research objectives. For analytical consistency, banks are categorized based on ownership type and the Core Capital-Based Bank Group (KBMI), a regulatory classification introduced in 2021 to replace the previous BUKU system. Based on core capital, a bank regulator in Indonesia divides the banks based on their core capital. In Indonesia, it is called a bank group based on the core capitular KBMI. The classification of banks using the KBMI framework in Indonesia divides banks into four groups: KBMI 1 (banks with core capital under Rp 6 trillion), KBMI 2 (banks with core capital between Rp 6 trillion and Rp 14 trillion), KBMI 3 (banks with core capital between Rp 14 trillion and Rp 70 trillion), and KBMI 4 (banks with core capital more than Rp 70 trillion). This classification reflects each bank’s systemic relevance and capital capacity, allowing for a more accurate assessment of the regulatory impact across various bank segments.
The next step in the data collection process is to complete the data structure for each bank every quarter from 2010 to 2024. Incomplete data can lead to bias in the results of analysis; therefore, this step ensures data structure consistency. Furthermore, the first approach is the carry-forward method using the t − 1 value to address the issue of missing values, which fills in missing values based on data from the previous period. This step is often used for time series data because it considers continuity between periods (Little & Rubin, 2020). Error checking is performed on the data source to ensure that the collected data are free from duplication, coding errors, or formatting inconsistencies.
The next step is to handle outliers, which can damage the accuracy of statistical models if they are not handled properly. Winsorizing is applied by trimming extreme values at the 97.5th percentile for upper outliers and the 2.5th percentile for outlier bottom to obtain the data distribution (Maronna et al., 2019). This step is useful for maintaining the integrity of the analysis without removing potentially significant data. After handling the outlier, the remaining missing values are then re-imputed using the mean value to ensure data completeness. This approach simplifies data while maintaining relevant statistical relationships (Van Buuren, 2018). This stage builds a robust and trustworthy foundation for further analysis. In this study, data processing was performed using the pooled least squares (PLS) and panel data methods involving econometric techniques designed for various research scenarios. PLS is the simplest method that assumes a linear relationship and unbiased estimation under Gauss–Markov conditions (Greene, 2018).
We applied the DID approach to examine the impact of capital regulation on the treated group’s banking risk (allowance for impairment losses, gross NPL, net NPL, market risk RWA/total assets, credit risk RWA/total assets) after the year 2016 and used Z-score to examine bank stability. DID can identify the causal impact of regulation implementation on credit risk and bank credit behavior. To examine the CCyB regulation, the control group banks are in KBMI IV, which have a core capital of more than IDR 70 trillion, and the treatment group banks are in KBMI 1, II, and III. For CCB regulation, we state the control group banks are in KBMI I; KBMI I is not required to form a CCB. The treatment groups for CCB are banks in KBMI III and KBMI IV. In terms of CS regulation, the control group banks are KBMI 1 and the treatment group is KMBI IV. The implementation of the CS regulation since 2016 in Indonesia (POJK No. 11/2016) has ensured that systemically important banks have additional capital to address systemic risks that could impact national financial stability. The systemically important banks are classified by the regulator in Indonesia as the large banks with a core capital of more than IDR 70 trillion (KBMI IV) (see Table 1).
Table 1.
Bank classification based on core capital.
2.2. Model and Equations
This study used the DID method. DID is an econometric approach commonly used to evaluate a policy or intervention’s causal impact. The DID used panel data or repeated cross-sectional data that included treatment (treatment) and control groups before and after the intervention (Reichardt, 2019). This study examines the effect of capital regulation and capital buffer on credit risk management and financial stability. Applying the DID approach, this study divides two events: the period before the capital buffer requirement (2010–2015) and the period after the capital buffer requirement’s implementation (2016–2024).
The capital buffer, implemented in Indonesia through OJK Regulation No. 11 of 2016, aims to improve banking stability by encouraging banks to maintain extra capital reserves to address unexpected financial and economic risks. This study examines the impact of the capital buffer policy that has effectively strengthened the banking sector’s capacity to channel credit, including to the SME sector, by large banks (KBMI III/IV) and small banks (KBMI I & II) before and after the event.
This study also examines the comparison between conditions before and during the COVID-19 pandemic, which shows a shift in the focus of banking strategies in credit performance. Prior to the pandemic, capital adequacy, especially core capital and total capital to risk-weighted assets, was more significant in maintaining equitable credit distribution. This contribution becomes weakened, reflecting a change in bank priorities to maintain internal stability rather than managing credit distribution competitively.
This study has significant advantages over PLS and panel analysis in studying regulatory changes by applying the DID approach because of its ability to better identify causal effects in the context of policies or interventions that affect specific subsets of the population. DID relies on the parallel trend assumption. For CCyB, the control group (KBMI IV) and treatment groups (KBMI II, III, and IV) have the same trend before the intervention, making it possible to isolate the policy effect without requiring stricter assumptions about endogeneity (pre-regulation: 2010–2015 = 0; post-regulation: 2016–2024 = 1). As stated, 1 designated the period after the implementation of POJK No. 11 of 2016 and 0 designated the years before the policy was adopted. The DID method can provide insight into regulations that can drive changes in risk management strategies, including portfolio rebalancing to lower-risk assets.
In this study, we divided the control group into the treatment group based on the classification of banks in terms of regulation. First, in efforts to examine the capital buffer CCyB, the control bank is KBMI IV (Bank BCA, BNI, Mandiri, and BRI) and the treated groups are KBMI I, II, and III post-regulation in 2016.
Second, to examine the CCB regulation, we set the control group banks as KBMI I and the treated groups are KBMI III and IV. This is based on the segmented regulation in Indonesia for classified bank groups. Namely, the capital conservation buffer (CCB) must be applied by primarily KBMI 3 and KBMI 4 (formerly BUKU 3 and 4) bank groups.
Third, to examine the CS regulation, we use the control group banks of the KBMI I classification, which have a core capital under IDR 6 trillion. The OJK regulates the capital surcharge (additional capital) for SIBs or KBMI IV to increase loss-absorbing capacity and mitigate systemic risk. Systemic banks are required to provide additional capital (capital surcharge) as part of their core capital (tier 1), with the surcharge ranging from 1% to over 3.5% of RWA. Therefore, the treatment group banks for CS regulation are large banks in the classification of KBMI IV.
The results of the analysis using DID are expected to provide a clear causal picture of whether the increase in capital through CCyB, CCB, and CS has an impact on the bank’s credit portfolio’s restructuring or only creates temporary obstacles to credit growth. This provides important insights for regulators in balancing policies that promote stability while maintaining the banking intermediation function.
Following the previous banking literature (Admati & Hellwig, 2019b; Afonso et al., 2014), the control variables include the logarithm of bank size (a proxy for economies of scale), income diversity (the degree of income diversification), and loan-to-total asset ratio (the degree of lending activity).
We examine the following hypotheses:
H1.
The impact of CCyB on credit performance will be more pronounced for large banks (KBMI III/IV) than for small banks (KBMI I & II) (total credit/TA, loans to MSMEs/TA, and non-MSME loans/TA).
H2.
The impact of CCB on credit performance is significant for large banks (KBMI III and IV) (total credit/TA, loan to MSME/TA, and non-MSME loan/TA).
H3.
CS capital buffer regulations impact credit performance for large banks (IV) (total credit/TA, loan to MSMEs/TA, and non-MSME loans/TA).
H4.
Capital regulation) impact on the treated group after the year 2016 on banking risk (allowance for impairment losses, gross NPL, net NPL, market risk RWA/total assets, credit risk RWA/total assets, and Z-score).
H5.
Capital regulation) impact on the treated group after the year 2016 on banking stability (ROA, E + A, and Z-score).
The model equation using the DID method is as follows and a detailed definition of all variables included in the DID model is provided in Table 2:
Table 2.
Definition of variable for equation.
Capital buffer is an independent variable. The credit performance variables include total credit/TA, loan to MSME/TA, and loan non-MSME/TA for bank i at time t. β0 is the intercept, meaning the initial value without the influence of credit performance variables. Post Regt is a dummy variable with a value of 1 after the implementation of POJK No. 11 of 2016 and 0 for previous years. CCyB treatmenti is a dummy variable indicating that bank i belongs to the CCyB category. CCB treatmenti is a dummy variable indicating that bank i belongs to the CCB category. CS treatmenti is a dummy variable indicating that bank i belongs to the CS category (one if CS, 0 otherwise). The definitions and measurements of banking risk variables used in this study are presented in Table 3.
Table 3.
Definition and measurement of banking risk variable.
The control variables include log bank size, income diversity, TA growth, and loan-to-total assets for bank i at time t − 1 as bank control. The dependent variables of bank risk include allowance impairment losses, gross NPL, net NPL, RWA/total assets, RWA/total assets, and bank i’s Z-score at time t, the definition and calculation of which are presented in Table 4.
Table 4.
Variable for bank stability.
This analysis also incorporates regulatory capital buffers under Basel III, namely, CCyB, CCB, and capital surcharge for systemic banks. This study uses the DID method to evaluate the impact of Indonesia’s capital buffer policy on banking. The Financial Services Authority (OJK) in Indonesia requires all banks to fulfill the capital regulations of Basel III. To strengthen banking resilience based on Basel III standards, banks must add the additional capital requirements of capital conservation buffer (CB), countercyclical buffer (CCyB), and capital surcharge (CS). These requirements are classified primarily by bank type, systemic importance, and core capital size (Kelompok Bank berdasarkan Modal Inti, KBMI). Capital conservation buffer (CB) must be applied by primarily KBMI 3 and KBMI 4 banks (formerly BUKU 3 and 4). Countercyclical buffer (CCyB) must be applied to all commercial banks (conventional and Sharia banks). Capital surcharge (CS) for D-SIB must be applied by D-SIB in Indonesia. D-SIB banks are typically KBMI 4 banks (e.g., Bank Mandiri, BRI, BCA, and BNI), as determined based on the regulation in Indonesia.
The determination of groups is based on exposure to the mandatory CCyB, CCB, and CS policies in Indonesia since 2016. The adjustment of the treatment group and control group refers to the classification of the regulation on banks in Indonesia based on their core capital, which impacts the regulation that must be fulfilled by the KBMI bank. The group subjected CCyB treatment consists of banks KBMI I, KBMI II, and KBMI III. These banks were directly impacted or required to adjust their capital due to the CCyB rate increase, as were banks that had a CCyB greater than 0 with post-regulation in 2016. Banks with significant credit exposure in sectors or regions experiencing excessive credit growth must increase capital. In the CCyB treatment, the control bank is the one with CCyB equal to 0 after the 2016 regulation.
This analysis defines the CCB treatment group as banks KBMI III and KBMI IV, which are directly impacted or required to adjust their capital due to the CCB rate increase. Banks with significant credit exposure in sectors or regions experiencing excessive credit growth must increase capital. In the CCB treatment, the control bank is KBMI I = 0 with post-regulation assessment in 2016.
In CS treatment, the implementation of the CS buffer based on the regulation since 2016 in Indonesia (POJK No. 11/2016) has ensured that systemically important banks have additional capital to address systemic risks that could impact national financial stability. The CS treatment group of banks is KBMI IV (Bank BCA, BNI, Mandiri, and BRI) with post-regulation in 2016, whereas the control group is banks other than non-CS banks or banks in KBMI 1 = 0.
The incorporation of the CCyB variable into the model allows this study to capture the formal adoption of the CCyB framework, compare its regulatory intent with capital adequacy outcomes, and assess its interaction with the CCyB and capital burden requirements, even when the buffer level is set to zero. The CCyB interest rate was officially adopted in 2016, and it might have changed banks’ expectations and behavior, which we captured with our DID framework. The capital buffer aspect is also explained in comparison with the capital adequacy aspect. CCyB refers to an additional capital buffer applied during periods of high credit growth to prevent systemic risk (Bahaj & Malherbe, 2020), CCB refers to a mandatory buffer to prevent violations of minimum capital requirements, and capital surcharge refers to additional capital required for systemic banks to reduce global systemic risk (Admati & Hellwig, 2019a).
This study uses control variables, such as bank size, capital structure, and economic environment, to allow for in-depth testing of how regulatory changes can affect credit risk. Capital adequacy ratio and capital buffer are the independent variables, and credit performance, gross NPL, and net NPL are the dependent variables. The risk variables are designed to provide a comprehensive understanding of the risk exposure and mitigation capabilities of banks. The reserve for impairment losses (allowance in impairment losses) indicator, calculated as the ratio of reserves to total gross credit, reflects the bank’s readiness to cover potential losses due to NPLs (Auer et al., 2022; Bahaj & Malherbe, 2020). NPL Indicator Gross and NPL Net provide a perspective on the level of NPL risk before and after the reduction in loss reserves, with a focus on the bank’s credit portfolio’s health (Admati & Hellwig, 2019b; Berger & Bouwman, 2013). RWA market risk/total asset and RWA credit risk/total asset assess the contribution of market and credit risk to a bank’s total assets, identifying key risk areas in banking operations (Acharya & Mora, 2015). Credit performance reflects the contribution of credit to total assets, both in the context of the non-MSME and MSME sectors. This indicator is important in assessing the focus and diversification of bank credit (Acharya & Mora, 2015; Afonso et al., 2014; Bitar et al., 2016; Admati & Hellwig, 2019b).
Tier 1/Total RWA refers to the ratio of core capital to risk-weighted assets (RWA). This measures the strength of core capital in covering credit, market, and operational risks (Acharya & Mora, 2015; Admati & Hellwig, 2019a, 2019b).
Tier 2/Total RWA refers to the ratio of additional capital to RWA, which reflects additional capital reserves used to support financial stability (Berger & Bouwman, 2013; Afonso et al., 2014).
(Tier 1 + Tier 2)/Total RWA is the ratio of additional capital to RWA, reflecting additional capital reserves to support financial stability (Bitar et al., 2016).
Tier 2/Total Assets refers to the ratio of core capital to total assets, which measures a bank’s capital strength in supporting its assets (Bahaj & Malherbe, 2020; Admati & Hellwig, 2019a, 2019b).
Level 2/Total Assets refers to the ratio of additional capital to total assets (Auer et al., 2022).
(Level 1 + Level 2)/Total Assets denotes the ratio of total capital to total assets, which represents the bank’s overall capital reserves (Admati & Hellwig, 2019a; Aikman et al., 2018).
2.3. Parallel Trend and Placebo Use Test
This study also conducted a parallel trend test to validate the DID results, demonstrating parallel trends in the treatment and control groups using the following steps. First, visualization is conducted by plotting the trendline of the dependent variable for both treatment and control groups over several periods before the policy, as shown in Figure 1. If the lines are parallel (even at different levels), the parallel trend assumption is satisfied. The lines are parallel (even at different levels), and the following assumption is met. Second, statistical testing is performed (event study using dummy variables for the periods before the policy into the regression model). If the coefficient before the policy is insignificant (close to zero), then the parallel trend assumption is valid. Third is the placebo test (optional). The DID approach in this study shows no “effect”, even though the policy has not been implemented.
Figure 1.
Visualization of the parallel test.
- a.
- Pre-intervention period analysis (before early 2016)
The treatment line (blue) is consistently well above the control line (red). The treatment group had a significantly higher capital ratio (tier 1) than the control group. Regarding the trend (2010–2016), both lines show relatively parallel movement for most of the study period. The control line is stable around 20, and the treatment line is stable around 29. Although a small, similar decline was observed in both groups in late 2015, the main pattern is flat and parallel. Parallel trend inclusion shows the parallel trend assumption is robustly met. Both groups maintained a similar (stable) movement pattern in the pre-intervention period, providing a strong basis for a causal DID interpretation.
- b.
- Analysis of the Post-Intervention Period (After Early 2016)
Indicating clear divergence after the actual intervention (early 2016), a sharp and consistent divergence occurred for the treatment group (blue): the tier 1 ratio increased substantially and continuously. The treatment experienced several spikes, reaching a high of ≈50 by the end of the study period. Control group (red): The tier 1 ratio remained relatively stable at a low level (≈17–22), indicating only a minimal increase. DID effect (intervention impact): The intervention effect is measured by the difference in post-intervention changes. Interpretation of the impact of DID occurs. Causal Effect: Due to the strong parallel pre-intervention trends, the spike and subsequent stabilization of the tier 1 ratio at a high level in the treatment group post-intervention can be attributed to the intervention with high confidence; the intervention appears to have had a significant positive effect on the treatment group’s capital position. The intervention drove the treatment groups’ tier 1 ratio to increase sharply and maintain a much stronger capital position, enhancing the bank’s stability and safety relative to the control group.
2.4. Descriptive Analysis
Banks in Indonesia are highly segmented, with several large banks dominating total assets, credit, and DPK, whereas most other banks operate on a much smaller scale. When compared to descriptive statistics based on KBMI, the results show an increase in the size of banks, with a larger operational scale along with the increase in the KBMI level, as shown in Table 5. This is reflected in the difference in average total assets, total credit, and TPF, which show exponential growth in each KBMI group. In the total asset indicator, KBMI IV recorded the highest average of IDR 813.68 trillion, far above the KBMI 3 average of IDR 143.59 trillion, the KBMI 2 average of IDR 37.10 trillion, and the KBMI 1 average of IDR 13.57 trillion. The range of total asset values of KBMI IV is also the largest, from IDR 213.07 trillion to IDR 1850.48 trillion, reflecting significant variations in bank size in this group. In contrast, KBMI 1 has a smaller scale with a range of IDR 91.36 billion to IDR 184.95 trillion, reflecting higher homogeneity among small banks.
Table 5.
Descriptive Statistics Based on KBMI Period 2010–2024.
The dominance of KBMI IV banks agrees with Bahaj and Malherbe’s (2020) research, which states that large core capital allows operational expansion but also increases systemic risk exposure. The high standard deviation in KBMI 4 data shows significant variation across large banks, indicating differences in strategy and OE. In contrast, KBMI 1 banks show a more stable distribution, as shown by the lower standard deviation. Auer et al. (2022) showed that implementing a countercyclical capital policy can help stabilize small banks, increasing their ability to compete with large banks.
In the total credit indicator, KBMI IV recorded the highest average of IDR 512.32 trillion, followed by KBMI III (IDR 89.10 trillion), KBMI II at IDR 21.08 trillion, and KBMI 1 at IDR 8.15 trillion. The range of total credit values in KBMI IV ranges from IDR7.27 trillion to IDR 1181.61 trillion, indicating the ability of large banks to distribute credit on a much larger scale than other groups. In contrast, KBMI 1 has a smaller range, from IDR 4.60 billion to IDR 147.85 trillion, reflecting the limitations of small banks in distributing credit.
3. Results
3.1. Results in the Capital Buffer
The results of the DID estimation for the countercyclical capital buffer (CCyB) are presented in Table 6. For SME (MSME) credit, the results show a worrying trend, where the overall CCyB policy led to a decline in SME financing relative to total assets, as reflected by the PostReg variable with a significant negative coefficient (−0.030, p < 0.001). However, larger banks (KBMI III and IV) still showed the ability to increase SME financing compared with smaller banks, as indicated by the positive and significant coefficient for the CC × Treat variable (coefficient 0.021, p < 0.05). However, the combined effect of regulation and CCyB was not strong enough to reverse this downward trend, as indicated by the insignificant PostReg × CC × Treat variable. Conversely, the CCyB policy had a significant positive impact on non-SME (non-MSME) credit, both overall and within larger banks. The PostReg coefficient shows an increase in non-SME financing after regulation (coefficient 0.028, p < 0.001), which is further strengthened by the CC × Treat coefficient (coefficient 0.033, p < 0.01) and the PostReg × CC × Treat coefficient (coefficient 0.064, p < 0.001), indicating that the policy is very effective in supporting large banks’ corporate financing.
Table 6.
DID output countercylical capital buffer (in the additional document).
The CCB, implemented through OJK Regulation No. 11 of 2016, aims to improve banking stability by encouraging banks to maintain extra capital reserves to address unexpected financial and economic risks. This study uses DID analysis to examine credit performance as measured by the ratios of total credit to total assets (TA), MSME credit to TA, and non-MSME credit to TA. The results show that the regulation affects different types of financing in different ways.
In general, as presented in Table 7, CCB showed a decrease in total credit relative to total assets, as reflected by the negative coefficient of PostReg (−4.820 ***, p < 0.01), indicating that the policy decreases the capacity of the banking sector to support credit expansion. However, this effect was more pronounced in large banks (KBMI III & IV), which experienced a larger increase in MSME credit than small banks (KBMI I), as indicated by the positive coefficient of Post Reg × CCB × Treat (2.216 *, p < 0.1). Banks in KBMI III & IV significantly increase MSME credit after the implementation of CCB, reflecting that large banks have a better capacity to adjust their strategies to this regulation. However, the combined effect of regulation and CCB on total credit was insignificant, as demonstrated by the coefficient of PostReg × CC × Treat, indicating that the additional benefits of this policy were limited.
Table 7.
DID output of CCB on Credit Performance.
As shown in Table 8, the impact of this policy on SME financing exhibits different dynamics. Overall, the systemic buffer (CS buffer) policy is detrimental to SME financing, as indicated by the coefficient on PostReg (−0.027, p < 0.001), indicating that the additional capital requirements have a greater impact on nonsystemic banks, thereby hampering their ability to support the SME sector. Systemically important banks can maintain or even increase SME financing, as reflected in the positive coefficient on CSTreat (0.080, p < 0.001) and the significant positive interaction effect between PostReg × CSTreat (0.034, p < 0.05). These results suggest that capital flexibility in systemically important banks allows them to continue supporting SME financing despite the additional burden of the systemic buffer policy.
Table 8.
DID output for additional capital buffer.
3.2. Result in Credit Risk
Table 9 shows the DID analysis results, which indicate the impact of minimum banking capital on NPL. The analysis results show a significant impact on credit risk management, as measured by net NPL. This regulation increases the overall net NPL by 0.277 points (p < 0.1), indicating that additional pressure was placed on banks to manage net credit risk after the regulation was implemented. Although the impact is relatively small, this result indicates that implementing new capital regulations can increase the banking sector’s net credit risk exposure. However, the interaction of regulation with the Non-KBMI IV group (PostReg × Treat) results in an increase in net NPL of 0.137 points, but this is not significant, indicating that the impact of regulation on net credit risk is relatively uniform between large banks (KBMI IV) and small and medium banks (Non-KBMI IV). Before the regulation’s implementation, the Non-KBMI IV group had a higher net NPL than KBMI IV, as reflected in the Treat value of 0.284 (p < 0.05). This indicates that small and medium-sized banks face greater challenges in managing net credit risk than large banks.
Table 9.
Output Difference in Impact of Capital Strengthening on net NPL.
The analysis of the control variables provides additional information on the net NPL determinants. Bank size (lag size) has a significant negative effect (−0.110, p < 0.001), indicating that large banks tend to have lower net credit risk, possibly due to better risk management and portfolio diversification capacity. Conversely, the ratio of loans to total assets (lag loan to total asset) has a significant positive effect on net NPL (0.004, p < 0.001), indicating that focusing on the loan portfolio can increase net credit risk due to greater exposure to risky assets. The variables of total asset growth (lag growth total assets) and income diversification (lag income diversity) do not show significant effects, indicating that asset growth and diverse income do not directly affect net credit risk management.
Statistically, this model has an R2 of 0.055, indicating that only 5.5% of the variation in net NPL can be explained by the variables in the model, while most of the variation is still influenced by external factors. The prediction error level (RMSE of 1.11) indicates that this model has good accuracy, although further development is required. In general, the implementation of POJK No. 11 of 2016 has a small but significant impact on increasing net credit risk in the banking sector, reflecting additional pressure on credit management due to new capital regulations. The impact of this regulation is relatively uniform between the Non-KBMI IV and KBMI IV groups (Figure 2). This demonstrates that credit risk management challenges occur across the banking spectrum.
Figure 2.
Changes in net NPL before and after regulation across bank groups.
Referring to Gassouma (2019), who indicated a positive impact after the Arab Spring, which showed a lowering of accounting manipulation, this study also assessed the positive impact on credit risk performance after the implementation of capital regulation. Results obtained after capital regulation show the significant impact on increasing net credit risk in the banking sector, reflecting additional pressure on credit management due to new capital regulations.
3.3. Financial Stability Results
Table 10 shows the results of the DID analysis on the impact of implementing POJK No. 11 in 2016. The results show a positive impact on Indonesia’s banking sector’s financial stability as measured by the Z-score. This regulation significantly increased the Z-score by 0.053 points (p < 0.001), reflecting the strengthening of banks’ resilience to financial risks and potential bankruptcy. This impact indicates that the capital strengthening policy has succeeded in improving the banking sector’s overall financial stability. However, the interaction between regulation and the Non-KBMI IV group (PostReg × Treat) showed an insignificant coefficient of −0.014, meaning that the impact of regulation on the stability of small and medium-sized banks was not substantially different from that of large banks in the KBMI IV group. Before the regulation, small and medium-sized banks had a lower Z-score level than large banks, as indicated by the Treat variable with a coefficient of −0.069 (p < 0.001). This indicates that small and medium-sized banks face greater challenges in maintaining financial stability.
Table 10.
Output difference in the impact of strengthening capital on the Z-score.
The control variables provide additional information on the factors influencing financial stability. Bank size (lag size) has a significant negative effect on the Z-score (−0.026, p < 0.001), indicating that larger banks tend to have lower levels of stability due to their exposure to systemic risk, despite having greater capacity. The ratio of loans to total assets (lag loan to total asset) also shows a significant negative effect (−0.003, p < 0.001), indicating that increasing credit exposure can weaken a bank’s financial stability. Conversely, total asset growth (lag growth total assets) has a significant positive effect (0.003, p < 0.01), indicating that asset expansion can support stability through portfolio diversification and increased economies of scale. Income diversity (lag income diversity) has a weak negative effect (−0.007, p < 0.1), indicating that income diversification can increase risk management complexity, thereby affecting financial stability.
The statistical model performed well, with an R2 of 0.303, indicating that the model could explain 30.3% of the variation in the Z-score. The prediction error rate (RMSE of 0.10) was very low, indicating the high accuracy of the model in predicting financial stability. In conclusion, the implementation of POJK No. 11 of 2016 significantly improved the banking sector’s financial stability, but its impact on small and medium-sized banks was not significant enough to reduce the stability gap compared to large banks, as shown in Figure 3.
Figure 3.
Changes in Z-score before and after regulation across bank groups.
3.4. COVID-19 Condition
As shown in Table 11, during the pandemic, the interaction of capital adequacy with COVID-19 generally did not have a significant impact on HHI credit. Tier 1/RWA × COVID (0.000, not significant) did not have a direct effect on credit market concentration, indicating that the ratio of core capital to RWA did not significantly change the structure of credit distribution between banks during the crisis. Tier 2/RWA × COVID (0.000, not significant) also did not have a significant impact, although RWA is usually used to support credit growth. The same applies to Total Capital/RWA × COVID (0.000, not significant), which shows that the ratio of total capital to RWA did not affect the credit distribution pattern during the pandemic.
Table 11.
COVID interaction with capital on credit variable.
In the total assets dimension, Tier 1/TA × COVID (0.000, insignificant) indicates that the ratio of core capital to total assets does not significantly contribute to changes in credit performance during the pandemic. Tier 2/TA × COVID (−0.002, insignificant) shows a small but insignificant negative effect, reflecting that additional capital to total assets slightly helps to achieve a more equitable credit distribution, although the impact is limited. Total Capital/TA × COVID (0.000, insignificant) also does not have a significant impact on credit distribution, confirming that total capital to total assets is not a major factor in determining the credit market structure during the pandemic.
A comparison between the conditions before and during the pandemic shows a shift in the focus of banking strategies. Condition capital adequacy, especially core capital and total capital to risk-weighted assets, was more significant in maintaining equitable credit distribution before the COVID-19 pandemic. This contribution weakened during the pandemic, reflecting a change in bank priorities to maintain internal stability rather than manage credit distribution competitively. Possessing a larger ration of capital to total assets can support a more equitable credit distribution, but its impact during the pandemic remained limited.
This study has several strategic implications. First, banks must ensure that capital management not only supports financial stability but also maintains healthy credit market competition. Second, regulators must monitor the implementation of capital regulation to prevent the dominance of large banks, which can reduce competition in the banking sector. Policies that encourage equitable credit distribution can help create a more competitive market.
4. Discussion
Capital Buffer
Capital adequacy is evaluated under the Basel III framework using tier 1 and tier 2 capital ratios relative to RWA. These ratios measure a bank’s ability to absorb losses from credit, market, and operational risks (Naoaj, 2023). The analytical approach used includes panel data and DID with a policy basis from banking regulators in Indonesia based on capital requirement implementation rules in Indonesia, namely POJK No. 11 of 2016 concerning Minimum Capital Provision Obligations.
Descriptive statistical analysis of commercial bank size reveals significant differences in total assets, total credit, and TPF among the 97 banks observed from 2010 to 2024. This reflects the level of inequality within the banking sector, which is also a major concern in the literature on financial stability and systemic risk (Acharya & Mora, 2015; Admati & Hellwig, 2024). The average total assets of IDR 65,919,431.24 million, with a much lower median of IDR 14,159,755 million, indicate an uneven distribution. A skewness value of 5.40 and a kurtosis value of 33.20 indicate that large banks were outliers. This inequality is reinforced by a very high standard deviation (IDR 184,280,457.79 million). Admati and Hellwig (2019b) highlighted that asset concentration in a few large banks is often associated with HL strategies that can amplify systemic risk. Large banks, such as the outliers in this data, tend to be more stable during crises because of government support (Afonso et al., 2014). However, their dominance can also reduce market efficiency by stifling the competitiveness of smaller banks.
The total credit variable has an average of IDR 40,655,310.67 million and a median of IDR 7,328,724 million, indicating that most banks operate with relatively small credit volumes. The skewness value of 5.35 and kurtosis value of 32.50 again indicate that only some banks dominate the credit distribution. Bahaj and Malherbe (2020) stated that large banks tend to use their large capital for credit expansion; however, if strict supervision is not in place, this increases the risk of moral hazard. The range of credit values from IDR 4603 million to IDR 1,181,606,235 million also reflects a large gap between banks. Behn et al. (2016) emphasized that the dependence of large banks on credit can amplify financial market volatility, especially in developing countries. The range of credit values from IDR 4603 million to IDR 1,181,606,235 million also reflects a large gap between banks. Behn et al. (2016) emphasized that the dependence of large banks on credit can amplify financial market volatility, especially in developing countries.
Regulation capital buffers, such as countercyclical capital buffer (CCyB), capital conservation buffer (CCB), and capital surcharge (CS), have a significant impact on banking credit performance, and the DID method is an effective approach used to measure this impact. Previous studies have shown that capital buffer implementation can increase banking resilience by encouraging banks to increase capital reserves during periods of economic expansion (Bahaj & Malherbe, 2020; Bridges et al., 2014).
Data from the analysis of the CCyB policy using the DID method are summarized below. This study examines how CCyB impacts credit performance by examining TA, SME loans to TA, and non-SME loans to TA ratios. Overall, the results indicate that the policy helped increase total loans relative to assets, with a clear positive effect after implementation (PostReg variable, coefficient 2.096, p < 0.01). The impact is even stronger for large banks (KBMI 3 & 4), as seen in the CC × Treat variable (coefficient 2.581, p < 0.1). However, the combined effect of regulation and CCyB on total credit showed no significant change (PostReg × CC × Treat variable).
This suggests that the CCyB policy largely benefits large banks by giving them greater capacity to build additional capital and increase lending, particularly during good economic times. A visible positive impact after the policy was implemented was an increase in credit relative to assets across the banking sector. However, the combined effect is not significant, suggesting that regulation alone is insufficient. Banks must be able to use these additional capital reserves to increase credit growth.
Unlike previous research, this study shows that a bank’s size is a key factor in regulatory effectiveness. Small banks often struggle to fully utilize these additional capital buffers due to limited capital reserves. In comparison, larger banks are better able to absorb the impact of regulation. This result is consistent with our observations. Atikah et al. (2023) and Pramono et al. (2015) found that economic policies do not equally affect all banks, suggesting that regulations may need to be tailored to suit banks of different sizes for the best results.
Analysis of the control variables provides additional insights into the study. Bank size (lag size) has a significant negative impact on total loans and SME loans but a positive impact on non-SME loans, reflecting the focus of large banks on corporate financing. The loan-to-total asset ratio (lag loan–total asset) significantly impacts all loan types, indicating that banks that are more active in lending tend to expand their financing across all sectors. However, asset growth (lag growth total assets) is insignificant for total and SME loans. However, it has a significant negative impact on non-SMEs’ loans, indicating that asset growth is not always associated with increased corporate financing.
Lagged income diversity has a significant negative impact on total and SME loans but a positive impact on non-SME loans. This indicates that banks’ revenue diversification strategies favor corporate financing over SME financing. Previous studies have shown that revenue diversification does not significantly impact the stability of banks. However, market structure and competition significantly influence stability through NPL risk (Ganefi et al., 2021).
These findings have important policy implications. The CCyB policy has strengthened banks’ ability to channel credit, particularly to the non-SMEs. However, this policy appears to be less effective in financing small and medium-sized enterprises, particularly small banks (KBMI I). Therefore, to ensure credit availability for all, policymakers may need to consider additional measures, such as offering incentives for SME lending or lowering capital requirements for small banks. This could improve banking system stability while promoting more equitable and sustainable economic growth.
Regarding SME financing, the CCB policy had a less favorable impact, especially for small banks. The analysis shows that the ratio of SME loans to total assets de-clines after policy implementation, as indicated by the negative PostReg coefficient (−4.114 ***, p < 0.001). This decline confirms that the additional capital requirements imposed by the CCB burden small banks, thus limiting their capacity to support SME financing. Large banks (KBMI 3 and 4) show a better ability to maintain SME financing, as indicated by the positive CCB × Treat coefficient (2.920 **, p < 0.05). However, the combined impact of regulation and policy on SME financing is significant, indicating that the policy has been fully optimal for large banks (KBMI 3 and 4) in supporting the SME sector, especially nationally. Wibowo and Aumenboonsuke (2020) also analyzed the banking sector’s ability to channel credit to SMEs during economic changes and fintech companies’ growth in Indonesia.
Banks face challenges in disbursing credit to SMEs, especially in the midst of fintech competition. For non-SME loans, the CCB policy had a negative impact. The ratio of non-SME loans to total assets decreased after the regulation, as indicated by the negative coefficient of PostReg (−0.006, p < 0.001). Large banks showed a negative response to this policy, with a CC × Treat coefficient of (−13.012 *** p < 0.01) and a significant combined effect of regulation and policy on the PostReg × CC × Treat variable (1.377, p < 0.001). These results indicate that the CCB policy is more effective than SME financing in encouraging corporate and large business sector financing.
Additional insights are provided by analyzing control variables, such as lag size, loan-to-total asset ratio, total asset growth ratio, and revenue diversification. Lagged size has a significant negative impact on total and SME loans but a positive impact on non-SME loans. This suggests that large banks tend to focus more on financing the corporate sector than SMEs (Ismanto et al., 2024). Meanwhile, the loan-to-total assets ratio in the previous period showed a strong positive correlation with all types of credit, indicating that banks that have disbursed more credit tend to be more aggressive in expanding their loan portfolios. However, note that Bella (2022) found that a high LAR can reduce bank profitability. This suggests that increased credit distribution can stimulate credit growth but does not necessarily improve financial performance. Although this study focuses on profitability, the proportion of loans to total assets affects a bank’s overall financial performance.
Conversely, the lag in total asset growth was insignificant for total and SME credit. However, it showed a significant negative impact on non-SMEs credit, indicating that asset growth is not always positively correlated with corporate credit expansion. The lag in revenue diversification had a significant negative impact on total and SME credit but a positive impact on non-SME credit, indicating that a revenue diversification strategy favors corporate financing. The CCB policy had a positive impact on total credit and financing for non-SMEs, particularly for large banks. However, its impact on SME financing tended to be negative, particularly for smaller banks that face capacity constraints in meeting additional capital requirements. Therefore, policymakers must take additional actions or measures, such as providing support or incentives for smaller banks and easing capital requirements for SME lending. These measures are intended to ensure that regulations not only maintain the stability of the banking system but also help ensure that small businesses can continue to obtain the necessary credit. Thus, supporting SMEs is key to building an inclusive and sustainable economy.
The implementation of the CS buffer based on POJK No. 11/2016 ensures that systemically important banks have additional capital to address systemic risks that could impact national financial stability. Based on the DID analysis of credit performance, the CS buffer policy significantly affected total credit and SME financing, as measured by the ratios of total credit/total assets (TA), SME credit/TA, and non-SME credit/TA. However, its impact on non-SME credit in systemically important banks varied. Overall, the regulation led to an increase in the amount of credit provided by banks compared to their total assets, as indicated by the significant positive result for the PostReg variable (2.540, p < 0.001). This means that the implementation of the CS buffer helped increase the national banking system’s credit distribution capacity. Systemically important banks (such as Mandiri, BNI, BCA, and BTN) showed a stronger response to this policy, as evidenced by the significant CSTreat coefficient (11.271, p < 0.001), which reflects that additional capital allowed these banks to expand their financing significantly compared with non-systemic banks.
In contrast, the impact tends to be more varied for non-SMEs. Overall, the CS buffer policy has a positive impact on non-SME financing, as indicated by the PostReg coefficient (0.019, p < 0.001). However, compared with non-systemic banks, systemically essential banks experienced a decline in non-SME financing, as indicated by the CSTreat coefficient (−0.200, p < 0.001). This may be due to systemic bank reallocation of capital to other sectors, such as total credit or SME financing. The combined effect of regulation and treatment on non-SMEs credit is insignificant, indicating that financing in this sector is influenced by factors other than the systemic buffer policy.
The analysis of the control variables provides further insights into the aforementioned lagged size has a significant negative impact on total and SME loans but a positive impact on non-SME loans, indicating that large banks prioritize corporate sector financing over SME financing. The ratios of lagged loans to total assets significantly impacts all types of loans, indicating that banks with higher loan-to-asset ratios are more likely to expand their financing. Conversely, lagged growth in total assets is insignificant for total and SME loans. However, it has a significant negative impact on non-SME loans, indicating that asset growth is not always correlated with corporate loan expansion. Meanwhile, lagged income diversification has a significant negative impact on total loans and SME loans but a positive impact on non-SME loans, indicating that income diversification tends to favor corporate sector financing over SME financing.
Overall, the CS policy has had a clear impact on total MSME lending and financing at systemic banks. This suggests that the additional capital required by this policy has been well utilized, enabling banks to further support key sectors that need it the most. However, the observed decline in non-MSME lending at systemic banks highlights the need to rebalance capital allocation to ensure that the corporate sector continues to receive adequate support. Therefore, policymakers should consider providing non-systemic banks with incentives to maintain stable MSME financing. Simultaneously, the number of systemic banks should be increased to adopt a more balanced approach that supports both large corporations and MSMEs. This combination ensures that the CS maintains financial system stability and supports economic growth that is inclusive and sustainable. Future research is needed to gain a clearer picture of how this regulation will shape financial stability and credit access in Indonesia over time (Mawardi et al., 2024; Pramono et al., 2015).
The implementation of the countercyclical capital buffer in Indonesia through capital regulation (POJK No. 11 of 2016) aims to increase banking resilience despite economic fluctuations by supporting banks in increasing their capital reserves during prosperous times. The capital buffer policy has effectively strengthened the banking sector’s capacity to channel credit, especially to the non-MSME sector. However, this policy is less supportive of MSME financing, especially for small banks (KBMI I). The results of the study show a worrying trend for MSME credit, where the KKPKB policy has overall reduced the distribution of MSME credit. This study is also supported by a study (Akbar & Wibowo, 2021), which shows that CCyB is detrimental to credit growth in conventional banks but has a positive effect in Islamic banks.
Overall, the CS regulation has clearly impacted total lending and MSME financing at systemic banks, indicating that the policy’s additional capital is being effectively used to support priority sectors. However, the decline in non-MSME lending at systemic banks highlights the need for a more balanced capital distribution to ensure that the corporate sector continues to receive adequate support. Therefore, policymakers should consider offering incentives to non-systemic banks to ensure stable and reliable MSME financing. Simultaneously, systemic banks should encourage the adoption of a more inclusive approach that supports both large corporations and MSMEs. This combined effort is crucial to ensuring that the CS buffer not only strengthens financial system stability but also promotes inclusive and sustainable economic growth. Further research is needed to understand the long-term impact of this policy on the stability and credit accessibility of the Indonesian banking sector (Mawardi et al., 2024; Pramono et al., 2015).
The countercyclical capital buffer implemented in Indonesia with regulatory support from OJK Regulation No. 11 of 2016 aims to help Indonesian banks adapt more easily to changing economic conditions by requiring them to maintain additional financial reserves during periods of growth. So far, this regulation has proven effective in increasing banks’ capacity to disburse credit, particularly to the non-MSME sector.
However, this policy is less supportive of MSME financing, particularly for small banks (KBMI I). Research results show a worrying trend for MSME credit, where the capital buffer policy has reduced MSME credit disbursement overall. This finding is also supported by studies (Akbar & Wibowo, 2021), which show that CCyB is detrimental to credit growth in conventional banks but has a positive effect on Islamic banks.
The CBC, introduced through OJK Regulation No. 11 of 2016, is intended to help banks maintain stability by encouraging them to set aside additional capital to weather unexpected financial or economic shocks. In practice, the CBC has been associated with an increase in total loans relative to total assets, suggesting that it has strengthened banks’ ability to expand credit. This impact is more pronounced for larger banks (KBMI III and IV), which have experienced a greater increase in total credit than smaller banks (KBMI I). However, the combined effect of the CBC regulation and policy on total credit is statistically insignificant. According to Bank Indonesia data, banks with larger core capital (KBMI IV), including large institutions such as PT Bank Rakyat Indonesia Tbk, PT Bank Mandiri Tbk, PT Bank Negara Indonesia Tbk, and PT Bank Central Asia Tbk, have enhanced capabilities. These capabilities include greater opportunities for credit distribution, fund mobilization, and the capacity to offer a wider range of banking services, thereby expanding their market share. According to Bank Indonesia data, financial institutions with substantial core capital have stronger credit intermediation and deposit mobilization capacity. Furthermore, these institutions are able to offer a broader range of banking services, contributing to the expansion of their market shareIn Indonesia, the CCyB policy strengthens the capital cushion so that when the economy is sluggish, banks are still able to distribute credit without being disturbed by the increasing risk of default.
Based on the classification, state-owned banks performed best in terms of credit management stability and efficiency, with the highest proportion of total credit to assets (67.19%) and the lowest level of variation. BPD dominated in non-MSME loans, although the high variation indicates that concentration risk needs to be better managed. Private banks had a greater focus on MSME loans (18.62%), but the uneven distribution indicates a lack of uniformity in credit management strategies across banks. Overall, state-owned banks demonstrated more consistent credit management than other bank groups. Most banks in Indonesia maintain adequate core capital that exceeds the minimum requirements. However, there is high variation across banks, particularly in KBMI 1 and private banks, indicating a lack of uniformity in capital management. KBMI 4 and state-owned banks excelled in stability and consistency, whereas private banks recorded the highest capital levels but with high variation. Small banks require increased capital management efficiency and consistency to enhance stability. Capital buffers are applied selectively on a risk-based basis, with most banks having low or no buffer obligations. However, banks with systemic influence must maintain significant additional capital, such as up to a 4.00% capital surcharge. This risk-based policy effectively maintains financial stability without burdening low-risk banks, but ongoing oversight must ensure implementation fairness and effectiveness.
5. Robustness Test
5.1. Robustness Test on Credit Risk
The results show that the effect of the additional capital on net NPL varies among KBMI groups, reflecting differences in capital management strategies and their impact on credit risk. In KBMI 1, the ratio of core capital to RWA and total assets (Tier 1/RWA, 0.016, p < 0.001; Tier 1/TA, 0.022, p < 0.001) has a significant positive effect on net NPL, indicating that core capital in this KBMI tends to increase net credit risk, possibly due to its less efficient allocation. In contrast, additional capital to RWA and total assets (Tier 2/RWA, −0.178, p < 0.001; Tier 2/TA, −0.056, p < 0.1) has a significant negative effect, confirming that additional capital effectively reduces net credit risk. Total capital on RWA and total assets shows a significant positive effect (Total Capital/RWWA, 0.010, p < 0.001; Total Capital/TA, 0.022, p < 0.001), indicating that total capital tends to increase net NPL, possibly because its allocation is not optimal. The analysis evaluates the impact of interaction in the four KBMIs, as shown in Table 12.
Table 12.
Robustness test of KBMI interaction with capital on the NPL Net variable.
In KBMI 2, the ratio of core capital to RWA and total assets (Tier 1/RWA, −0.016, p < 0.001; Tier 1/TA, −0.021, p < 0.001) has a significant negative effect on net NPL, indicating that core capital efficiently reduces net credit risk. Conversely, additional capital to RWA and total assets (Tier 2/RWA, 0.131, p < 0.001; Tier 2/TA, 0.117, p < 0.01) has a significant positive effect on net NPL, indicating that additional capital increases net credit risk, possibly because it is allocated to high-risk credit portfolios. Total capital to ATMR and total assets (Total Capital/ATMR, −0.011, p < 0.001; Total Capital/TA, −0.020, p < 0.001) have a significant negative effect, confirming that total capital supports the reduction in net credit risk in KBMI 2.
In KBMI 3, core capital to RWA and total assets (Tier 1/RWA, −0.019, p < 0.05; Tier 1/TA, −0.057, p < 0.001) had a significant negative effect on net NPL, indicating that core capital consistently reduces net credit risk. However, additional capital to RWA (Tier 2/RWA, 0.169, p < 0.01) had a significant positive effect, indicating that additional capital increased net credit risk. The ratios of total capital to RWA and total assets (Total Capital/RWA, −0.026, p < 0.01; Total Capital/TA, −0.071, p < 0.001) showed a significant negative effect, confirming that total capital effectively reduced net credit risk in KBMI 3.
In KBMI 4, all capital components have a weak effect on net NPL. Core capital to RWA and total assets (Tier 1/RWA, 0.029; Tier 1/TA, 0.036) has a positive but insignificant coefficient, indicating that its contribution to increasing net credit risk is insignificant. Additional capital to RWA and total assets (Tier 2/RWA, −0.064; Tier 2/TA, −0.088) has a negative but insignificant coefficient, indicating that additional capital has the potential to reduce net credit risk, but its effect is insufficiently strong. The ratios of total capital to RWA and total assets show a weak positive effect (Total Capital/RWA, 0.040, p < 0.1), indicating that total capital in KBMI 4 is not yet effective in supporting a decrease in net credit risk.
Overall, KBMI 1 and KBMI 2 show efficiency in the use of additional capital and total capital to reduce net credit risk, whereas core capital tends to increase net credit risk. KBMI 3 excels in managing core and total capital to reduce net credit risk, but additional capital increases risk. KBMI 4 shows a weak contribution of capital to net NPL, indicating the need for capital management optimization.
5.2. Robustness Test on Bank Stability
The results of this study underline that core capital (Tier 1) is the most effective component in improving financial stability in the banking sector, weighting against both RWA and total assets. Although supplementary capital (Tier 2) can increase capital capacity, it has limitations in supporting stability due to the associated risks and costs. Total capital makes a positive contribution, but its role is smaller than that of the core capital. The analysis also shows that weighting against RWA yields more significant results than weighting against total assets because RWA reflects the level of risk in the bank’s asset portfolio.
Table 13 presents further analysis, evaluating the impact of capital adequacy on KBMI on banking stability Z-score. The Z-score reflects the bank’s capacity to face financial risks, with higher values indicating better stability. The results show that the impact of capital adequacy on Z-score varies among the four KBMIs and reflects differences in each KBMI’s capital management strategies and stability levels.
Table 13.
Robustness test KBMI interaction with capital on the z-score variable.
In KBMI 1, core capital against RWA (Tier 1/RWA, 0.001, p < 0.001) significantly positively affects the Z-score, indicating that core capital effectively supports financial stability. However, other capital components, such as Tier 2/RWA, Total Capital/RWA, Tier 1/TA, Tier 2/TA, and Total Capital/TA, show insignificant effects, indicating that the contribution of additional capital and total capital to financial stability is relatively limited. These results indicate that the stability of KBMI 1 is mainly supported by the efficiency of core capital management against RWA. In contrast, no capital components significantly affected the Z-score in KBMI 2. Although Tier 2/RWA (−0.002) has a negative coefficient, its impact is not significant. Other capital components, such as Total Capital/RWA, Tier 1/TA, and Total Capital/TA, also do not significantly contribute to financial stability. These results underline that KBMI 2 requires a more effective capital management strategy to improve banking stability.
In KBMI 3, different dynamics were observed. Core capital to RWA (Tier 1/RWA, −0.006, p < 0.001) had a significant negative effect on the Z-score, indicating that core capital in this KBMI actually reduces financial stability. Conversely, the addition of capital to RWA (Tier 2/RWA, 0.011, p < 0.05) had a significant positive effect, indicating that additional capital supports financial stability. Total Capital/RWA (0.000, p < 0.01) also showed a positive effect, whereas Total Capital/TA (−0.002, p < 0.01) had a significant negative effect on stability. In addition, the ratio of core capital to total assets (Tier 1/TA, −0.002, p < 0.001) significantly and negatively affected the Z-score. These results indicate that KBMI 3 needs to re-evaluate the management of core capital, while additional capital makes a positive contribution to stability.
In KBMI 4, all capital components have insignificant effects on the Z-score. The effects of Tier 1/RWA, Tier 2/RWA, Total Capital/RWA, Tier 1/TA, Tier 2/TA, and Total Capital/TA on financial stability are weak. These results indicate that the CM strategy in KBMI 4 has not been effective in supporting financial stability. Therefore, capital management optimization in all components is required. KBMI 1 shows that financial stability is mainly supported by the contribution of core capital to RWA, whereas the contribution of other capital components is relatively weak. KBMI 2 shows weakness in supporting stability in all capital components, indicating the need for more efficient capital management. KBMI 3 shows that additional capital to RWA supports stability, but core capital to total assets decreases stability. KBMI 4 demonstrates a weak influence of capital on stability, indicating the need to increase capital management effectiveness.
The results of this study provide strategic implications for capital management in the banking sector. KBMI 1 can maintain the efficiency of core capital management to support financial stability, whereas KBMI 2 requires improvement in managing all capital components. KBMI 3 is advised to more effectively utilize additional capital to support stability, and KBMI 4 needs to improve the effectiveness of capital management to strengthen stability.
5.3. Robustness Test in the COVID-19 Condition
The following analysis evaluates the impact of capital adequacy on net NPL credit risk by considering the interaction of the COVID-19 pandemic conditions as shown in Table 14 below. Net NPL is a measure of net credit risk after taking into account loss reserves, thus providing a more accurate picture of the effectiveness of credit risk management by banks. The results of the study indicate that no dimensions of capital adequacy have a significant effect on net NPL during the pandemic. Tier 1/RWA × COVID (0.003, not significant), Tier 2/RWA × COVID (−0.015, not significant), and Total Capital/RWA × COVID (−0.002, not significant) indicate that neither core capital, additional capital, nor total capital to risk-weighted assets contributed significantly to suppressing net NPL during the pandemic. The same thing was also found in the capital dimension to total assets, where Tier 1/TA × COVID (−0.002, not significant), Tier 2/TA × COVID (0.003, not significant), and Total Capital/TA × COVID (−0.003, not significant) indicate that core capital, additional capital, and total capital to total assets do not play a significant role in managing net credit risk.
Table 14.
Robustness test of COVID interaction with capital on net NPL variable.
Comparison between before and during the pandemic shows a shift in focus in utilizing capital adequacy. Before the pandemic, capital adequacy, especially the ratio of total capital core capital and total capital to RWA, was more effective in suppressing net NPL. However, during the pandemic, the effect of capital adequacy on net NPL weakened. This shows that pandemic pressures, such as increased credit risk due to economic slowdown and liquidity challenges, encouraged banks to prioritize operational stability and liquidity rather than proactively managing net credit risk.
These findings have important implications for banking strategy and regulatory policy. First, banks need to improve the effectiveness of capital adequacy utilization in managing credit risk, especially in crisis conditions. Banks can develop strategies that focus more on credit portfolio management and strengthening credit loss reserves to reduce net NPL. Second, regulators need to consider policies that encourage more strategic use of capital adequacy for net credit risk management. This can include incentives for banks that actively reduce net NPL through capital adequacy-based strategies. In conclusion, this study reveals that during the COVID-19 pandemic, capital adequacy, both against RWA and total assets, did not show a significant effect on net NPL. This suggests that banks tend to focus more on operational stability than on net credit risk management.
The impact of capital adequacy on allowance in impairment is examined in depth by considering the interaction of the COVID-19 pandemic conditions, as seen in Table 15 below. allowance in impairment losses is the main indicator that reflects the level of bank alertness to potential credit losses and the quality of the bank’s credit portfolio. The results of the study show that during the pandemic, Tier 1/RWA × COVID (−0.009 **, significant) had a significant negative effect on allowance in impairment. This indicates that banks with larger core capital to risk-weighted assets are better able to reduce credit risk, as reflected in the decrease in impairment allowance. Larger core capital provides banks with the flexibility to manage credit risk and strengthen financial stability. Total Capital/RWA × COVID (−0.004 +, significant at the 10% level) also shows a negative effect on allowance in impairment, indicating that, although its effect is weaker than core capital, the ratio of total capital to RWA can support better credit risk management.
Table 15.
Robustness test of COVID interaction with capital on allowance in impairment variables.
On the other hand, other dimensions, such as Tier 2/RWA × COVID (0.032, not significant) and Tier 2/TA × COVID (0.050, not significant), indicate that additional capital, relative to both RWA and total assets, does not significantly contribute to credit risk management during the pandemic. This result reflects that banks have not optimally utilized additional capital to reduce credit risk during the crisis. In addition, Tier 1/TA × COVID (−0.006, not significant) and Total Capital/TA × COVID (−0.006, not significant) indicate that core capital and total capital to total assets do not significantly affect the allowance in impairment, confirming that banks are more focused on overall liquidity stability than capital utilization to reduce credit risk.
Comparison between the pre- and post-pandemic conditions shows significant differences. Before the pandemic, core capital and total capital, especially against RWA, were more effective in suppressing the impairment allowance. However, this contribution weakened during the pandemic, possibly because banks focused more on managing liquidity and maintaining operational stability than strengthening loan-loss reserves. Additional capital, both against RWA and total assets, did not play a significant role, which may reflect the priority of banks to maintain capital efficiency during the crisis.
The strategic implication of this finding is that banks need to continue to improve core capital adequacy to mitigate credit risk, especially during times of crisis. Regulations that encourage the use of core capital as the main buffer in credit risk management must be strengthened. Regulators can develop policies that encourage banks to make greater use of additional capital to support credit risk management. This study shows that during the pandemic, core capital, especially against RWA, has a significant role in reducing allowance in impairment losses, reflecting the bank’s ability to better manage credit risk. However, additional capital and total capital have not significantly contributed to credit risk management. This finding highlights the importance of SCM to ensuring financial stability and effective risk management in normal and crisis conditions.
6. Conclusions
This study examines how Basel III capital requirements, specifically the CCyB, CCB regulation, and capital surcharge, shape credit behavior, competitive dynamics, and financial stability in the Indonesian banking sector. The findings indicate that these capital buffers have a significant but uneven impact across banks of varying sizes. Larger banks appear to be better positioned to absorb capital buffer requirements because of their broader capital base and operational capacity, whereas smaller banks face greater constraints that may impact their lending decisions and risk strategies. This is in line with previous research conducted by Aiyar et al. (2016) and Gropp et al. (2019), who showed that CAR regulations can increase entry barriers for small banks, thereby strengthening the dominant position of large banks in the market. This research supports the findings of Bahaj and Malherbe (2020), who showed that additional capital buffer regulations can encourage operational efficiency and quality-based competition among well-capitalized banks.
These results suggest that uniform capital regulations do not produce proportional results in a banking system characterized by structural asymmetry and monopolistic competition. This study demonstrates that capital strengthening policies have successfully improved financial stability in the banking sector as a whole. However, the interaction between regulation and the Non-KBMI IV group (PostReg × Treat) showed an insignificant coefficient of −0.014, indicating that the impact of regulation on the stability of small and medium-sized banks in Indonesia is not substantially different from that of large banks in the KBMI IV group. This study is in line with Behn et al. (2016) who argue that in emerging markets, where economic volatility is higher and small banks have limited capacity to build reserves, the effectiveness of CCyB may be impaired because small banks may face higher financial vulnerabilities during economic recessions.
The implications of implementing a capital buffer in Indonesia include the benefits of resilience for KBMI 3 and 4. CCyB implementation can strengthen the capital buffer so that banks can continue to disburse credit without being affected by increased default risk during economic downturns. Meanwhile, the impact on capital efficiency is felt for KBMI 1 and 2 banks. The CCyB obligation can depress profitability because capital that should be used for credit must be held as reserves.
A more calibrated regulatory design that considers bank size and risk profile could improve the effectiveness of macroprudential measures and support healthy credit distribution without compromising stability. The CCyB ratio needs to be implemented gradually to ensure that banks, especially KBMI 1 and 2, have sufficient room to channel credit to support economic recovery and encourage the optimal implementation of bank intermediation functions in Indonesia as a developing country. Furthermore, specific regulations regarding bank obligations are needed for the implementation of KBMI 1 banks’ CCB to align with the risk profile and the latest consolidation policies of banking regulators in Indonesia. Small banks often struggle to fully utilize these additional capital buffers due to limited capital reserves. In comparison, larger banks are better able to absorb the impact of regulation. This result is consistent with our observations. Atikah et al. (2023) and Pramono et al. (2015) found that economic policies do not affect all banks equally, suggesting that regulations may need to be tailored to suit banks of different sizes for the best results.
The implementation of the CCyB and CCB regulation has implications for bank behavior in Indonesia by reducing procyclicality, which is the tendency of banks to overleverage during economic good times and drastically curb lending during economic downturns. In addition, the implementation of capital buffers is expected to be based on periodic evaluations by Bank Indonesia (for example, at least every 6 months) by considering the credit-to-GDP gap as the main indicator ratio to detect excessive credit growth compared to economic growth. Applying the DID approach to analyze the impact of the implementation of capital regulation in Indonesia (POJK No. 11 of 2016) since 2016 shows a positive impact on Indonesia’s banking sector’s financial stability.
More incentives are needed for KBMI 1 and KBMI 2 banks to expand their lending to the SME sector. More measurable regulations are needed to ensure that banks continue to prudently disburse credit to the MSME sector for economic growth. These incentives include the KLM Policy (BI) by Bank Indonesia, which provides incentives to banks in KBMI 1 and KBMI 2 that successfully achieve specific lending targets to the MSME sector, including ultra-micro and green banks, to reduce the Minimum Reserve Requirement (GWM) in rupiah to support priority sectors. Macroprudential Inclusive Financing Ratio (RPIM): Commercial banks in KBMI 1, 2, 3, and 4 are required to meet a certain proportion of MSME financing but are granted flexibility through the 5% RPIM scheme. Banks that meet this target receive incentives that encourage measurable lending special incentives for KBMI Bank 1 and KBMI Bank 2 that run the Government’s People’s Business Credit program for MSMEs (Kredit Usaha Rakyat), which provides interest subsidies and risk guarantees through guarantee institutions for micro-, small, and medium-sized credit, so that KBMI Bank 1 and 2 can distribute credit with a more controlled risk of NPL.
Based on this analysis, future research should examine cross-country experiences with different capital frameworks in developing countries and evaluate the effect of long-term buffer implementation on financial stability, credit accessibility, and market resilience. Such comparative and longitudinal research would deepen the understanding of how Basel III instruments function under diverse institutional conditions and help refine macroprudential policy to better align stability objectives with the economic realities of developing countries.
Author Contributions
Conceptualization, T.K., R.R. and B.W.; methodology, T.K.; software, T.K.; validation, T.K., R.R. and B.W.; formal analysis, T.K.; investigation, T.K.; resources, T.K., R.R. and B.W.; data curation, T.K., R.R. and B.W.; writing—original draft preparation, T.K.; writing—review and editing, T.K., R.R. and B.W.; visualization, T.K.; supervision, R.R. and B.W.; project administration, R.R. and B.W.; funding acquisition, T.K., R.R. and B.W. All authors have read and agreed to the published version of the manuscript.
Funding
This research received no external funding.
Institutional Review Board Statement
Not applicable.
Informed Consent Statement
Not applicable.
Data Availability Statement
The data supporting the findings of this study are available from the first or corresponding author upon reasonable request.
Acknowledgments
Thank you to Institute for Advanced Social, Science, and Sustainable Future (IASSSF) and Vallentia Nisrina Qurratuain Annida who has helped with the proofreading process and provided technical input during the writing process. The authors have reviewed and edited the output and take full responsibility for the content of this publication.
Conflicts of Interest
The authors declare no conflicts of interest.
References
- Acharya, V. V., & Mora, N. (2015). A crisis of banks as liquidity providers. The Journal of Finance, 70(1), 1–43. [Google Scholar] [CrossRef] [Scilit]
- Admati, A. R., & Hellwig, M. (2024). The bankers’ new clothes: What’s wrong with banking and what to do about it (New and Ex). Princeton University Press. [Google Scholar]
- Admati, A. R., & Hellwig, M. F. (2019a). Bank leverage, welfare and regulations (Vol. 235). Working paper of the rock center for corporate governance at Stanford University. Stanford University. [Google Scholar]
- Admati, A. R., & Hellwig, M. F. (2019b). The parade of bankers’ new clothes continues: 34 flawed claims debunked (Vol. 143, pp. 15–58). Working paper of the rock center for corporate governance at Stanford University. Stanford University. [Google Scholar]
- Afonso, G., Santos, J. A. C., & Traina, J. (2014). Do’Too-Big-To-Fail’Banks take on more risk? Economic Policy Review, 20(2), 41–58. [Google Scholar]
- Aikman, D., Haldane, A. G., Hinterschweiger, M., & Kapadia, S. (2018, February 23). Rethinking financial stability (Bank of England working paper No. 712). Available online: https://ssrn.com/abstract=3130053 (accessed on 16 June 2025). [CrossRef] [Scilit]
- Aiyar, S., Calomiris, C. W., & Wieladek, T. (2016). How does credit supply respond to monetary policy and bank minimum capital requirements? European Economic Review, 82, 142–165. [Google Scholar] [CrossRef] [Scilit]
- Akbar, M. I., & Wibowo, M. G. (2021). The effectiveness of macroprudential policies in mitigating the systemic risk in Indonesia. Airlangga International Journal of Islamic Economics and Finance, 4(2), 91. [Google Scholar] [CrossRef] [Scilit]
- Anginer, D., Bertay, A. C., Cull, R., Demirgüç-Kunt, A., & Mare, D. S. (2024). Bank capital regulation and risk after the global financial crisis. Journal of Financial Stability, 74, 100891. [Google Scholar] [CrossRef] [Scilit]
- Atikah, N., Susamto, A. A., Saleh, S., & Abdic, F. (2023). The cyclical behavior of capital buffer of Indonesian Islamic and conventional banks. International Journal of Islamic Economics and Finance (IJIEF), 6(1), 1–20. [Google Scholar] [CrossRef] [Scilit]
- Auer, R., Matyunina, A., & Ongena, S. (2022). The countercyclical capital buffer and the composition of bank lending. Journal of Financial Intermediation, 52, 100965. [Google Scholar] [CrossRef] [Scilit]
- Bahaj, S., & Malherbe, F. (2020). The forced safety effect: How higher capital requirements can increase bank lending. The Journal of Finance, 75(6), 3013–3053. [Google Scholar] [CrossRef] [Scilit]
- Bank for International Settlements. (2010). Basel III: International framework for liquidity risk measurement, standards and monitoring. Available online: http://www.bis.org/publ/bcbs238.htm (accessed on 16 June 2025).
- Bank for International Settlements. (2017). Basel III: Finalising post-crisis reforms. Available online: https://www.bis.org/basel_framework/ (accessed on 16 June 2025).
- Bank for International Settlements. (2024). Basel III monitoring report. Available online: https://www.bis.org/bcbs/publ/d570.htm (accessed on 16 June 2025).
- Basten, C. (2019). Higher bank capital requirements and mortgage pricing: Evidence from the counter-cyclical capital buffer. Review of Finance, 24(2), 453–495. [Google Scholar] [CrossRef] [Scilit]
- Behn, M., Haselmann, R., & Wachtel, P. (2016). Procyclical capital regulation and lending. The Journal of Finance, 71(2), 919–956. [Google Scholar] [CrossRef] [Scilit]
- Behn, M., & Schramm, A. (2021). The impact of G-SIB identification on bank lending: Evidence from syndicated loans. Journal of Financial Stability, 57, 100930. [Google Scholar] [CrossRef] [Scilit]
- Behncke, S. (2023). Effects of macroprudential policies on bank lending and credit risks. Journal of Financial Services Research, 63(2), 175–199. [Google Scholar] [CrossRef] [Scilit]
- Bella, B. (2022). The influence of loan to deposit ratio, non-performing loan, capital adequacy ratio and return on assets of credit distribution at commercial banks in Indonesia 2017–2020. Journal of Social Sciences and Humanities, 1, 1–23. [Google Scholar] [CrossRef] [Scilit]
- Berger, A. N., & Bouwman, C. H. S. (2013). How does capital affect bank performance during financial crises? Journal of Financial Economics, 109(1), 146–176. [Google Scholar] [CrossRef] [Scilit]
- Bichsel, R., Lambertini, L., Mukherjee, A., & Wunderli, D. (2022). The pass-through of bank capital requirements to corporate lending spreads. Journal of Financial Stability, 58, 100910. [Google Scholar] [CrossRef] [Scilit]
- Bitar, M., Saad, W., & Benlemlih, M. (2016). Bank risk and performance in the MENA region: The importance of capital requirements. Economic Systems, 40(3), 398–421. [Google Scholar] [CrossRef] [Scilit]
- Bostandzic, D., Irresberger, F., Juelsrud, R. E., & Weiß, G. (2022). Do capital requirements make banks safer? Evidence from a quasinatural experiment. Journal of Financial and Quantitative Analysis, 57(5), 1805–1833. [Google Scholar] [CrossRef] [Scilit]
- Bridges, J., Gregory, D., Nielsen, M., Pezzini, S., Radia, A., & Spaltro, M. (2014). The impact of capital requirements on bank lending (Vol. 486). Bank of England. [Google Scholar] [CrossRef] [Scilit]
- Bui, C., Scheule, H., & Wu, E. (2017). The value of bank capital buffers in maintaining financial system resilience. Journal of Financial Stability, 33, 23–40. [Google Scholar] [CrossRef] [Scilit]
- Cappelletti, G., Ponte Marques, A., & Varraso, P. (2024). Impact of higher capital buffers on banks’ lending and risk-taking in the short- and medium-term: Evidence from the euro area experiments. Journal of Financial Stability, 72, 101250. [Google Scholar] [CrossRef] [Scilit]
- Chinoda, T., Chingombe, C., & Chawuruka, P. (2015). The impact of minimum capital requirements on performance of commercial banks in Zimbabwe. Journal of Economics and Finance, 6(5), 60–68. [Google Scholar]
- Corbae, D., & D’Erasmo, P. (2021). Capital buffers in a quantitative model of banking industry dynamics. Econometrica, 89(6), 2975–3023. [Google Scholar] [CrossRef] [Scilit]
- Cummings, J. R., & Wright, S. (2016). Effect of higher capital requirements on the funding costs of Australian banks. Australian Economic Review, 49(1), 44–53. [Google Scholar] [CrossRef] [Scilit]
- Dadashova, P., Jonsson, M., & Onyshchenko, H. (2018). Macroeconomic effects of introducing a capital conservation buffer in the ukrainian banking sector. Visnyk of the National Bank of Ukraine, 243, 33. [Google Scholar] [CrossRef] [Scilit]
- Dautovic, E. (2020). Has regulatory capital made banks safer? Skin in the game vs moral hazard (No. 2449; Issue 2449). ECB Working Paper. [Google Scholar] [CrossRef]
- Degryse, H., Karapetyan, A., & Karmakar, S. (2021). To ask or not to ask? Bank capital requirements and loan collateralization. Journal of Financial Economics, 142(1), 239–260. [Google Scholar] [CrossRef] [Scilit]
- Dietsch, M., Fraisse, H., Lé, M., & Lecarpentier, S. (2020). Lower bank capital requirements as a policy tool to support credit to SMES: Evidence from a policy experiment? Banque de France working paper no. 789. Banque de France. [Google Scholar] [CrossRef] [Scilit]
- Fang, X., Jutrsa, D., Peria, S. M., Presbitero, A. F., & Ratnovski, L. (2022). Bank capital requirements and lending in emerging markets: The role of bank characteristics and economic conditions. Journal of Banking & Finance, 135, 105806. [Google Scholar] [CrossRef] [Scilit]
- Ganefi, H. S., Ermawati, W. J., & Hakim, D. B. (2021). Market structure, income diversity, and stability: Empirical study of banking industry Indonesia. Jurnal Keuangan Dan Perbankan, 25(3), 701–716. [Google Scholar] [CrossRef] [Scilit]
- Gassouma, M. S. (2019). Management of abnormal accounting accruals through the regulatory approach of credit risk: Evidence in the MENA countries’ banks before and after the Arab Spring Revolution. Journal of Applied Finance & Banking, 9(3), 65–78. [Google Scholar]
- Greene, W. H. (2018). Econometric analysis (8th ed.). Pearson. [Google Scholar]
- Gropp, R., Mosk, T., Ongena, S., & Wix, C. (2019). Banks response to higher capital requirements: Evidence from a quasi-natural experiment. The Review of Financial Studies, 32(1), 266–299. [Google Scholar] [CrossRef] [Scilit]
- International Monetary Fund. (2024). Indonesia: Financial sector assessment program-financial system stability assessment. IMF staff country reports. International Monetary Fund. [Google Scholar] [CrossRef] [Scilit]
- Ismail, T. H., & Ahmed, E. A. (2022). Impact of risk governance on performance and capital requirements: Evidence from Egyptian banks. Corporate Ownership and Control, 19(2), 179–193. [Google Scholar] [CrossRef] [Scilit]
- Ismanto, H., Atmaji, & Suhari, E. (2024). Determinants of MSMES’ credit access: Evidence from Indonesian banks. Banks and Bank Systems, 19(3), 230–241. [Google Scholar] [CrossRef] [Scilit]
- Jiménez, G., Ongena, S., Peydró, J.-L., & Saurina, J. (2017). Evidence from the Spanish dynamic provisioning experiments. Journal of Political Economy, 125(6), 2126–2177. [Google Scholar] [CrossRef] [Scilit]
- Jokipii, T., & Milne, A. (2011). Bank capital buffer and risk adjustment decisions. Journal of Financial Stability, 7(3), 165–178. [Google Scholar] [CrossRef] [Scilit]
- Juelsrud, R. E., & Wold, E. G. (2020). Risk-weighted capital requirements and portfolio rebalancing. Journal of Financial Intermediation, 41, 100806. [Google Scholar] [CrossRef] [Scilit]
- Korein, S., Abotalib, A., Trojak, M., & Abou-El-Sood, H. (2021). Is capital conservation buffer or regulatory leverage better at improving bank efficiency? The case of an emerging market. Journal of Humanities and Applied Social Sciences, 4(4), 292–309. [Google Scholar] [CrossRef] [Scilit]
- Le, T. N. L., Nasir, M. A., & Huynh, T. L. D. (2023). Capital requirements and banks performance under Basel-III: A comparative analysis of Australian and British banks. The Quarterly Review of Economics and Finance, 87, 146–157. [Google Scholar] [CrossRef] [Scilit]
- Little, R. J. A., & Rubin, D. B. (2020). Statistical analysis with missing data (1st ed., Vol. 793). John Wiley & Sons. [Google Scholar]
- Maronna, R. A., Martin, R. D., Yohai, V. J., & Salibián-Barrera, M. (2019). Robust statistics: Theory and methods (with R) (1st ed.). John Wiley & Sons. [Google Scholar]
- Mateev, M., Sahyouni, A., Moudud-Ul-Huq, S., & Nair, K. (2024). Bank performance and financial stability during the COVID-19 pandemic: Lessons from the MENA region. EuroMed Journal of Business, 20(3), 756–799. [Google Scholar] [CrossRef] [Scilit]
- Mawardi, W., Mahfudz, M., Arfinto, E. D., & Laksana, R. D. (2024). Countercyclical banking policy as a public welfare effort in Indonesia. Journal of Hunan University Natural Sciences, 51(3), 25–37. [Google Scholar] [CrossRef] [Scilit]
- Naoaj, M. S. (2023). Exploring the determinants of capital adequacy in commercial banks: A study of Bangladesh’s banking sector. European Journal of Business and Management Research, 8(2), 108–112. [Google Scholar] [CrossRef] [Scilit]
- Otoritas Jasa Keuangan. (2016). Indonesian banking booklet 20216. Financial Services Authority. [Google Scholar]
- Polizzi, S., Scannella, E., & Suárez, N. (2020). The role of capital and liquidity in bank lending: Are banks safer? Global Policy, 11(S1), 28–38. [Google Scholar] [CrossRef] [Scilit]
- Pramono, B., Hafidz, J., Adamanti, J., Harris, M., Muhammad, M., & Alim, S. (2015). The impact of countercyclical capital buffer policies on credit growth in Indonesia. Bank Indonesia. [Google Scholar]
- Reichardt, C. S. (2019). Quasi-experiments: A guide to design and analysis. Guilford Press. [Google Scholar]
- Saeed, M. M., & Donkoh, E. (2026). Credit risk management, Bank specific factors, and financial performance of banks: Insight an emerging economy. University of Science and Technology, Ghana. [Google Scholar]
- Swamy, V. (2018). Basel III capital regulations and bank profitability. Review of Financial Economics, 36(4), 307–320. [Google Scholar] [CrossRef] [Scilit]
- Van Buuren, S. (2018). Flexible imputation of missing data (2nd ed.). CRC Press. [Google Scholar]
- Wibowo, M., & Aumenboonsuke, V. (2020). Bank financial capability on MSME lending amid economic change and the growth of fin-tech companies in Indonesia. Thailand and the World Economy, 38(1), 63–87. [Google Scholar]
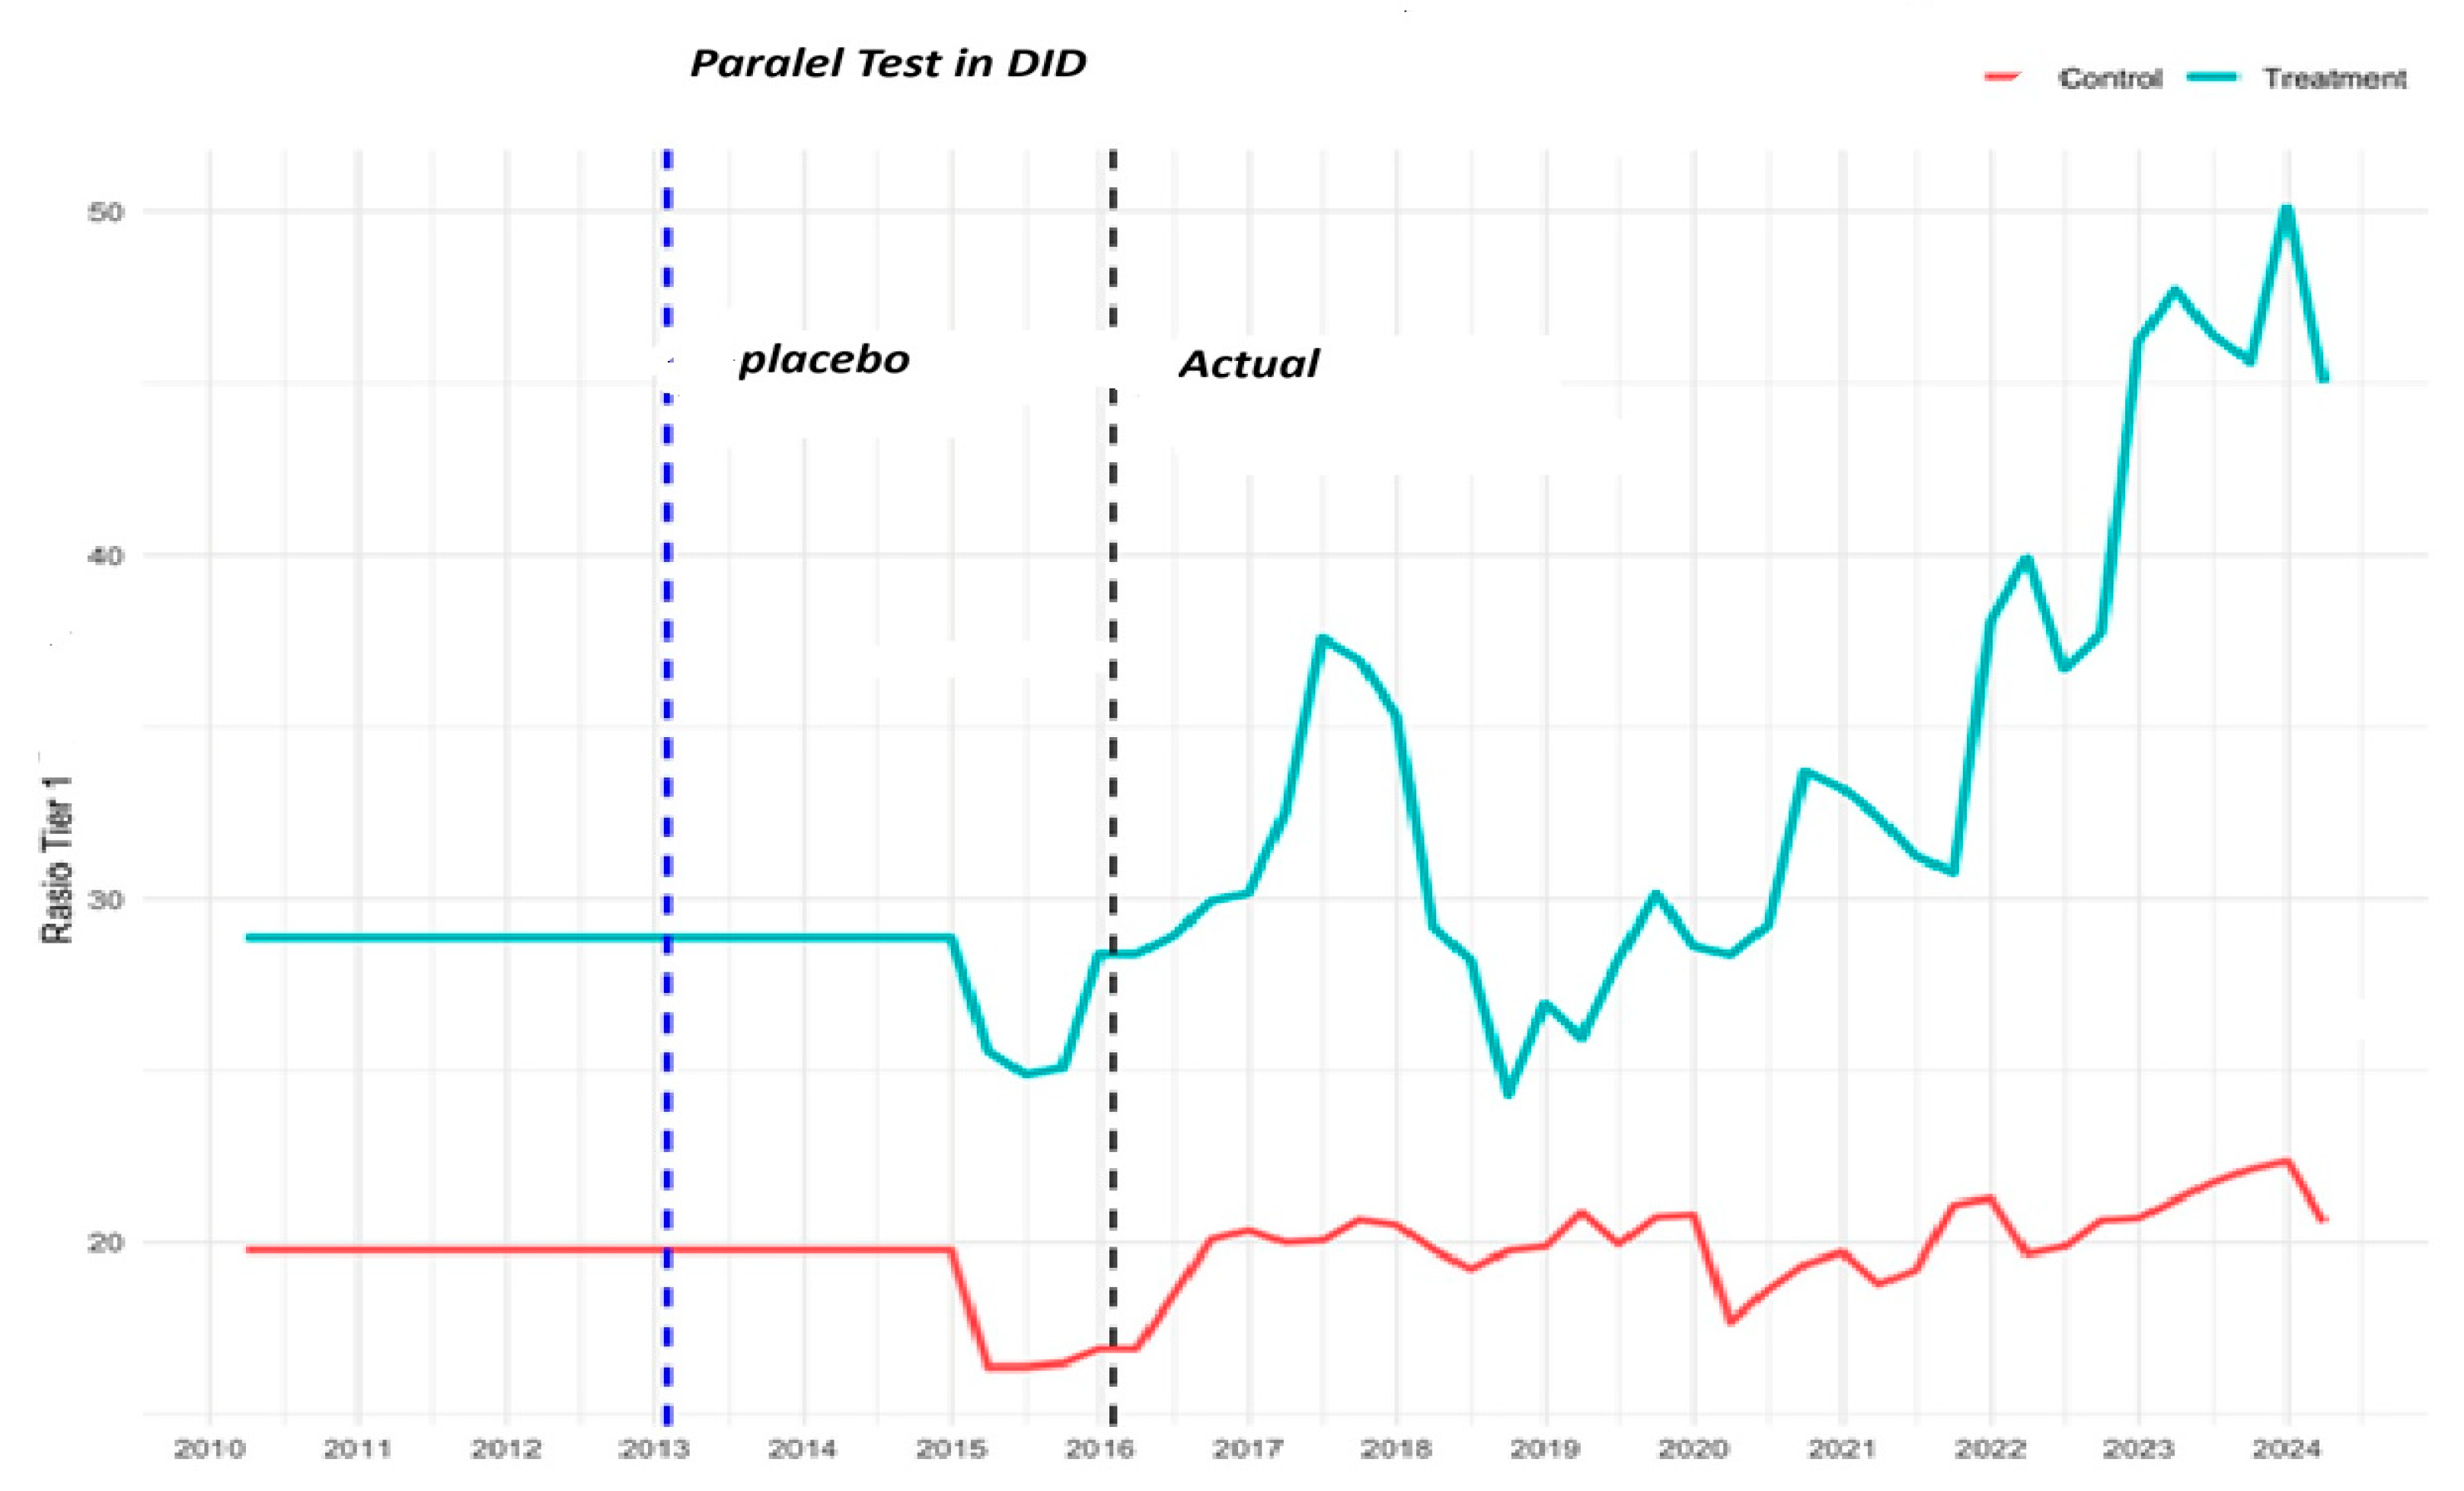
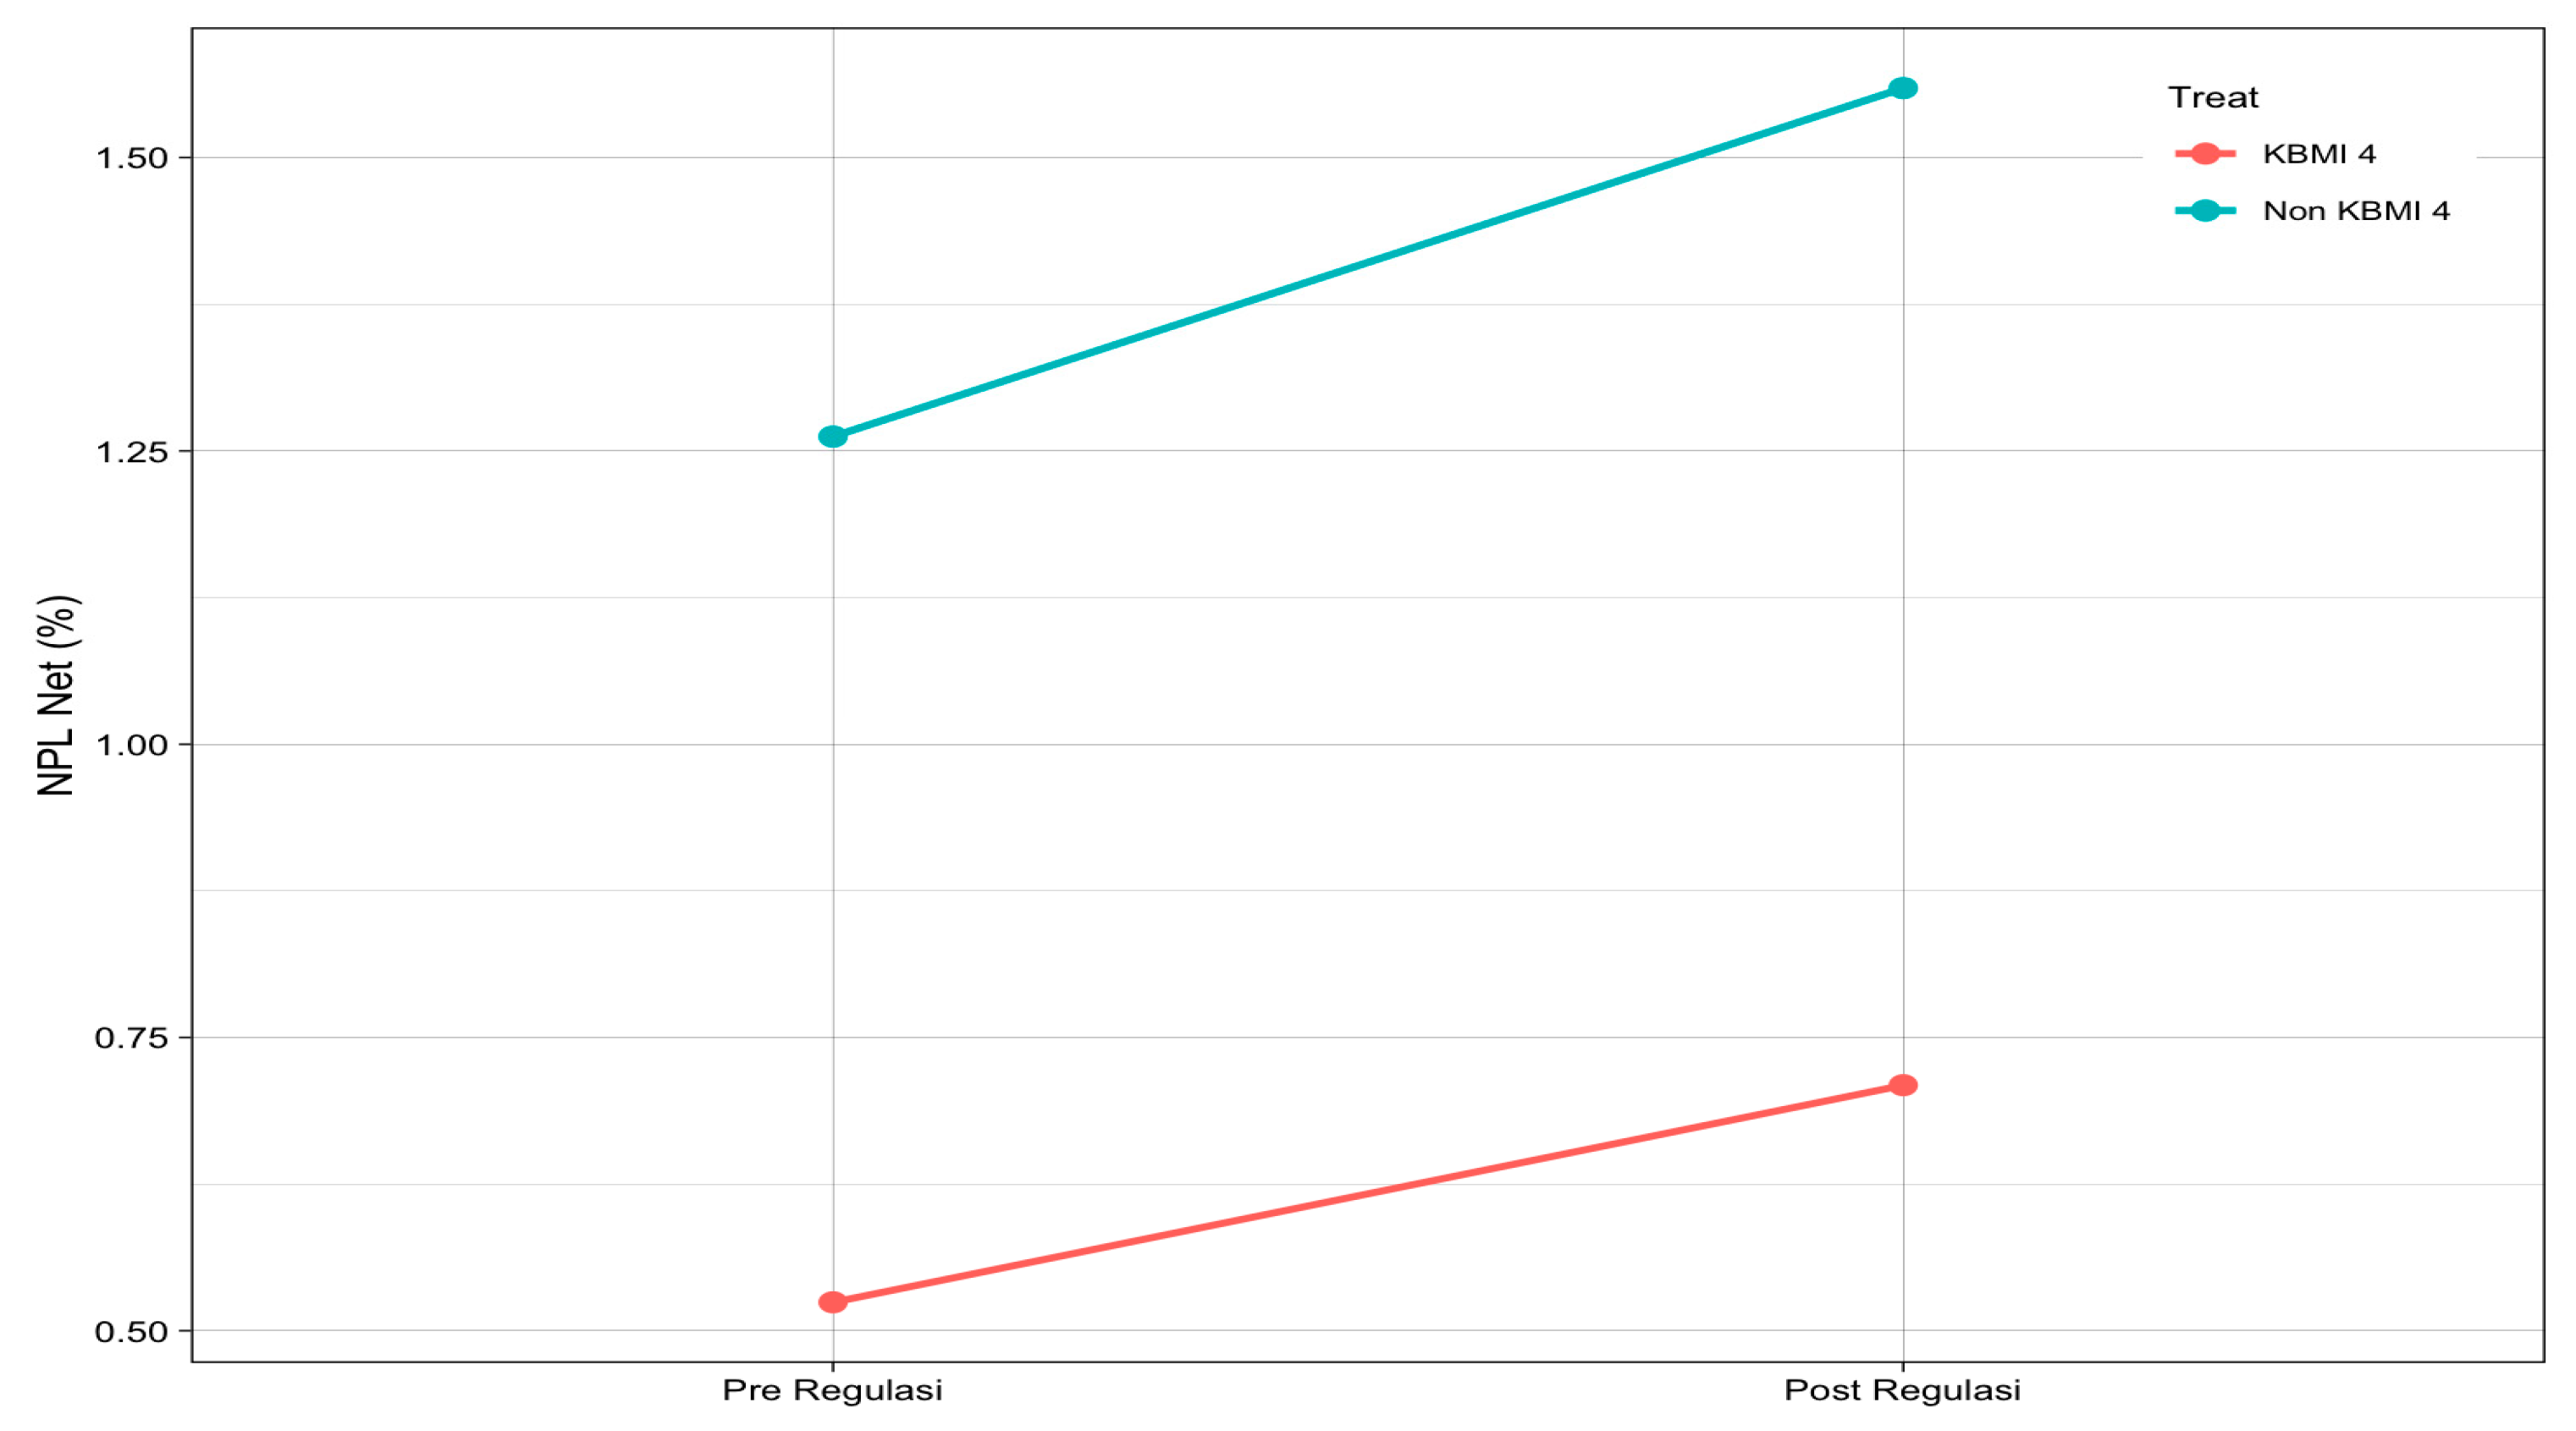
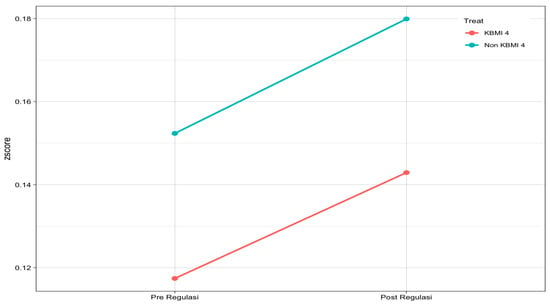
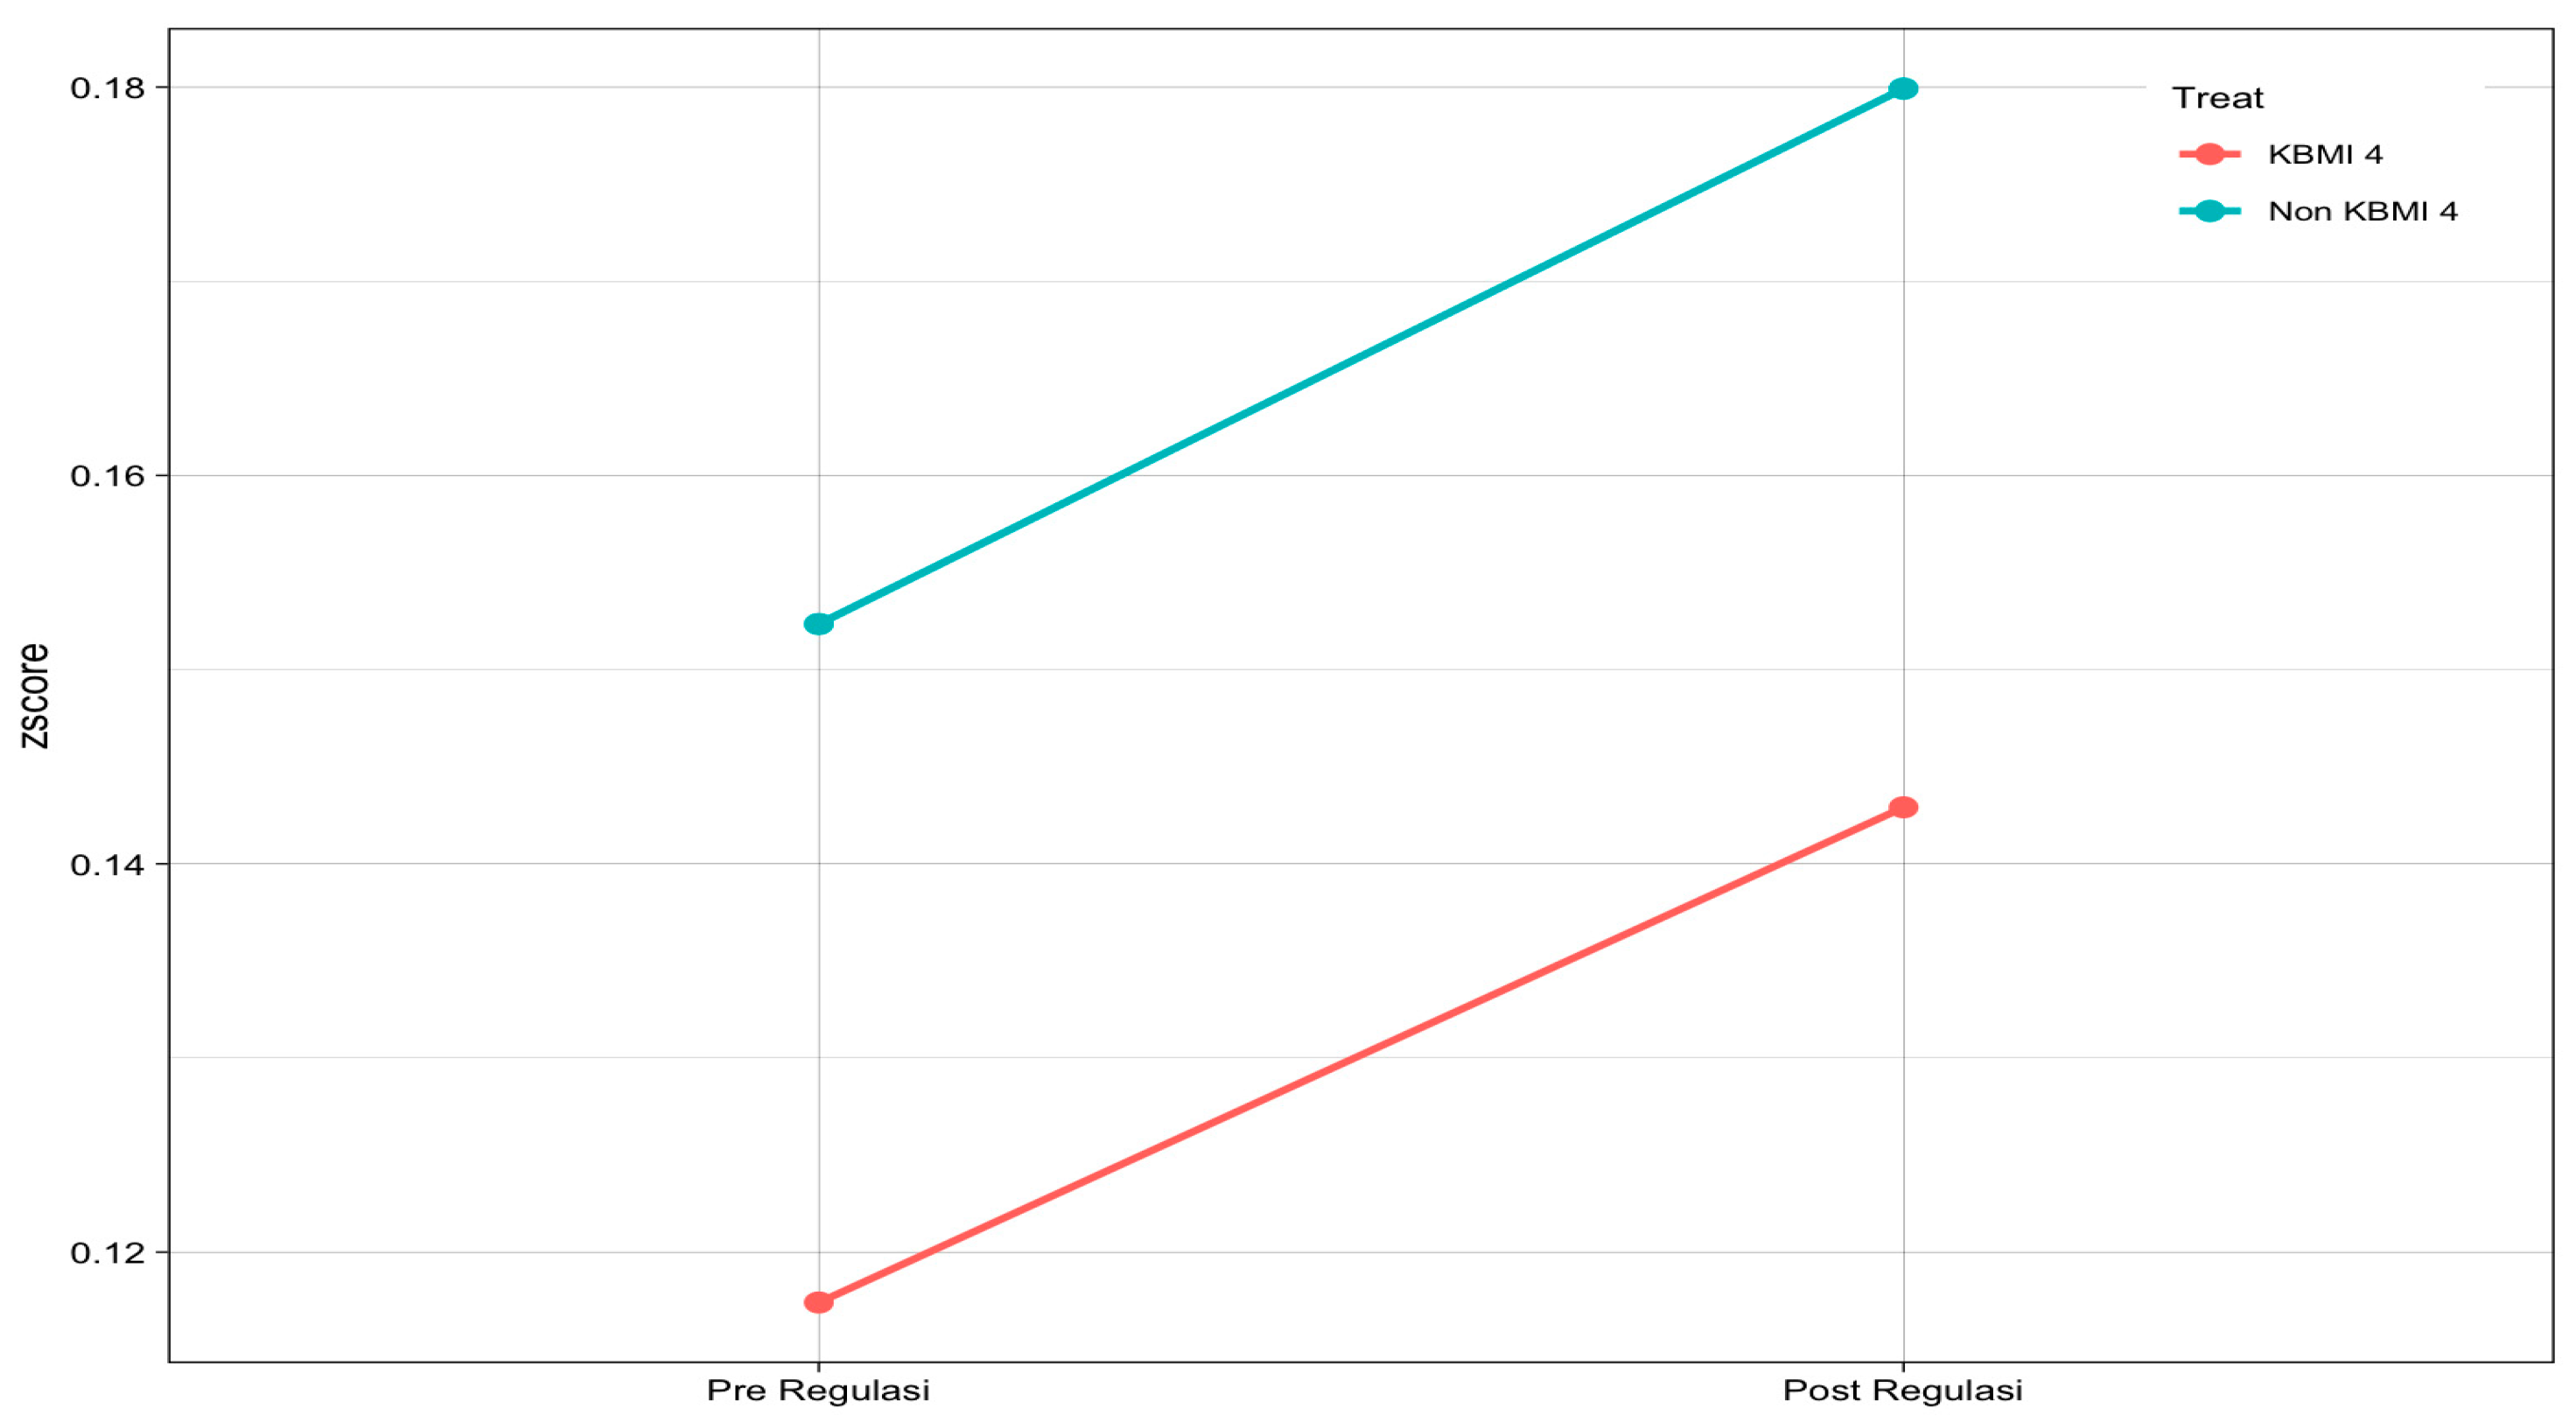

Disclaimer/Publisher’s Note: The statements, opinions and data contained in all publications are solely those of the individual author(s) and contributor(s) and not of MDPI and/or the editor(s). MDPI and/or the editor(s) disclaim responsibility for any injury to people or property resulting from any ideas, methods, instructions or products referred to in the content. |
© 2026 by the authors. Licensee MDPI, Basel, Switzerland. This article is an open access article distributed under the terms and conditions of the Creative Commons Attribution (CC BY) license.