


Abstract
We investigate the speed and permanence of geopolitical shock pricing in a frontier market by examining the 2025 Thai–Cambodian border conflict on the Cambodia Securities Exchange (CSX). To capture both the immediate onset and subsequent medium-horizon stabilization of geopolitical risk, we deploy a dual-horizon econometric architecture. Short-term, to account for the informational inefficiency inherent to nascent exchanges, we utilize an event-conditioned state-space AR(1) model via a Kalman filter. We find that high-visibility physical conflicts trigger immediate, statistically significant downward price adjustments, whereas low-visibility informational shocks exhibit gradual price incorporation. Medium-term, we evaluate post-conflict valuation recovery across an eight-month horizon in 2026 (January–August, T = 164 trading sessions) by constructing a within-market constant-mean counterfactual evaluated against an empirical distribution of historical placebo windows (2021–2024). We document a distinct behavioral contrast: despite acute short-term adjustments during the conflict, the aggregate CSX Index generated a substantially positive +34.93% Buy-and-Hold Abnormal Return (BHAR) during the 2026 recovery horizon, ranking at the 100th percentile of comparable pre-conflict historical horizons with zero observed exceedances across both rolling windows (fupper = 0/824 = 0.00%) and strictly non-overlapping 164-day blocks (0/6). This descriptive benchmark outperformance is preserved (+30.85%, 100th percentile, fupper = 0/583 = 0.00% rolling windows and 0/4 non-overlapping blocks) under a restricted 2022–2024 baseline. While our three-episode short-run comparison is necessarily exploratory and our aggregate medium-horizon design does not econometrically isolate specific causal mechanisms from contemporaneous macroeconomic covariates (such as monetary conditions or bilateral negotiations), we note that this rapid equity recovery is congruent with independent evidence from spatial development economics, trade analyses, and macroeconomic reporting documenting Cambodia’s swift post-conflict economic adaptation and the realization of a ‘peace dividend’ across formal economic pillars.
Keywords:
frontier market; geopolitical risk; event study; Kalman filter; buy-and-hold abnormal return; Cambodia Securities Exchange; peace dividend; informational efficiency JEL Classification:
G14; G15; F52; D74
1. Introduction
The Efficient Market Hypothesis (EMH) posits that security prices in frictionless capital markets rapidly and unbiasedly incorporate all available information (Fama, 1970). In mature, developed equity markets, deep order books and broad institutional participation typically enable asset prices to adjust nearly instantaneously to exogenous public news. However, as the market microstructure literature demonstrates, price discovery is neither instantaneous nor frictionless; rather, it operates through concrete trading mechanisms, order-flow dynamics, and informational asymmetries among market participants (O’Hara, 2000). Recent empirical work further underscores that microstructural frictions—such as transaction costs, price discreteness, and information processing barriers—directly govern the degree and speed of informational efficiency across trading venues (Said et al., 2024).
When moving from developed exchanges to emerging and frontier capital markets, these microstructural frictions become binding structural constraints. Young frontier exchanges—such as the Cambodia Securities Exchange (CSX)—tend to be informationally inefficient, meaning it frequently takes longer for stock prices to fully reveal new information (Lim & Brooks, 2011; Amihud, 2002; Bekaert et al., 2007). In such nascent environments, elevated information verification costs and autocorrelated return dynamics slow the transmission of news into observed prices. Consequently, the theoretical link between market microstructure, investor reaction, and market efficiency becomes critical: when a nascent market is informationally inefficient and signal quality varies, the speed of price discovery depends heavily on whether an exogenous shock is sufficiently salient to overcome baseline informational friction.
A substantial body of literature has examined how financial markets price exogenous geopolitical shocks, including armed conflicts, terrorist attacks, and diplomatic crises (e.g., Guidolin & La Ferrara, 2007; Lee & Yoo, 2020). More recently, scholars have documented pronounced equity price contractions, volatility spillovers, and trade-network disruptions following major geopolitical events such as the 2022 Russian invasion of Ukraine (Boungou & Yatié, 2022; Federle et al., 2022) and recurring military escalations in the Middle East (Zaremba et al., 2022). However, existing empirical investigations predominantly focus on mature developed or large emerging markets where informational efficiency is comparatively high and standard Ordinary Least Squares (OLS) market models or cross-sectional event studies can be readily applied. Considerably less is known about how a nascent frontier equity market absorbs localized military and diplomatic shocks across both short- and medium-term horizons. Because young markets exhibit autocorrelated “inefficient returns” and often experience concurrent structural shifts, standard OLS event-study models are frequently mis-specified under these conditions and risk misestimating the true impact of exogenous shocks (Khanthavit, 2021, 2022). Furthermore, evaluating a geopolitical crisis through a single timeframe creates a severe analytical bias: a purely short-term analysis cannot evaluate subsequent post-conflict valuation recovery and medium-horizon resilience, while a purely medium-horizon analysis may mask the acute microstructural price adjustments of investors.
To bridge this gap, this paper investigates the asset pricing impacts of the 2025 Thai–Cambodian border crisis—a structural event that evolved through an initial physical skirmish in May, a leaked diplomatic breakdown in June, and severe border closures in July—on the Cambodia Securities Exchange (CSX). The CSX serves as an informative setting for testing this intersection of political economy, market microstructure, and asset pricing: it features highly formalized, internationally scrutinized firms operating in a macro-environment vulnerable to localized border friction. To capture both the immediate onset and subsequent medium-horizon stabilization of the crisis while accounting for the informational inefficiency of a young market, we deploy a dual-horizon architecture. First, to evaluate our short-run research hypotheses regarding how signal visibility interacts with microstructural friction, we isolate the acute speed of the market reaction using an event-conditioned state-space AR(1) model estimated via a Kalman filter. As demonstrated by Khanthavit (2021, 2022), this specification explicitly controls for the price inefficiency inherent to young markets; furthermore, by allowing the expected normal return to evolve stochastically rather than remaining static, the Kalman filter accommodates parameter instability and helps mitigate non-stationarity issues caused by concurrent exogenous structural shocks (Khanthavit, 2021). Second, to determine if this transient reaction resulted in permanent capital impairment, we measure the medium-horizon capital-price recovery of the investor using a within-market constant-mean counterfactual (Brown & Warner, 1980, 1985; Fama, 1998; MacKinlay, 1997) evaluated against an empirical distribution of historical placebo windows (Lyon et al., 1999; Gelbach et al., 2013).
By examining the crisis through this integrated, two-tiered lens, we observe a distinct contrast across these events and time horizons: in the short term, investors react to high-visibility physical violence with immediate Day-0 downward price adjustments, whereas low-visibility informational shocks induce more gradual, multi-day price incorporation. Yet this short-term reaction does not dictate medium-horizon performance. Once the conflict de-escalated, the aggregate CSX Index exhibited a strong upward valuation adjustment, generating a +34.93% Buy-and-Hold Abnormal Return (BHAR) across the eight-month post-conflict recovery horizon in 2026 (ranking at the 100th percentile of comparable pre-conflict historical windows with zero observed exceedances). Crucially, this rapid post-conflict recovery on the CSX is not an isolated empirical anomaly; rather, it is congruent with independent, multi-disciplinary evidence from spatial development economics (Borbely et al., 2026), international trade and macroeconomic analyses (Yarrow & Kenh, 2026; World Bank, 2026), and contemporary economic reporting (Khmer Times, 2026b, 2026c, 2026d) demonstrating that Cambodia’s formal economic pillars adjust and recover rapidly once geopolitical friction stabilizes and institutional accountability constrains elite capture. While an aggregate index analysis cannot econometrically disentangle institutional governance and demining channels from concurrent macroeconomic covariates—such as supply-chain re-routing, foreign direct investment inflows, monetary policy conditions, and ongoing bilateral negotiations—this cross-disciplinary convergence frames our financial market findings as a plausible conceptual interpretation and motivates future micro-level inquiry.
In doing so, this paper makes three contributions to the literature: (1) It serves as the first formal geopolitical event study conducted on the CSX to our knowledge. Indeed, prior scholarship has focused exclusively on cartographic politics, security, and trade flows rather than the financial markets (see Section 2 for further literature review). (2) Within the scholarship on the long-standing border conflict between Thailand and Cambodia, it is the first to examine the relation between this geopolitical conflict and financial markets, demonstrating how signal tangibility governs the speed of price incorporation in nascent frontier markets that tend to be informationally inefficient. (3) It provides an integrated empirical framework for dual-horizon studies in nascent markets by combining state-space AR(1) Kalman filtering with historical placebo benchmarking for the analysis of medium-horizon recovery while connecting financial asset recovery to broader multi-disciplinary evidence of post-conflict economic adjustment.
Timeline and Event Classification
To properly contextualize the empirical design and test our research hypotheses, we partition the 2025 border crisis into three strictly sequential events. While causally linked by the same underlying geopolitical friction, their structural manifestations differ fundamentally in tangibility, allowing us to test how varying degrees of threat visibility are associated with distinct differences in the speed of market price adjustment. Crucially, because our research hypotheses specifically concern the microstructural speed of price incorporation, we must explicitly distinguish the calendar date of the information shock from the first available trading session. The actual event day (D0) is strictly defined as the first session capable of incorporating the information. Because our short-run sample comprises three sequential crisis episodes (two physical and one informational), we emphasize that this comparative design serves as an exploratory investigation of signal visibility in a nascent frontier market rather than a definitive test of universal asset-pricing laws.
The first phase, the May Initial Shock, occurred when a fatal firefight in the Chong Bok sector erupted at approximately 5:30 AM on 28 May 2025. Because this information became public before the CSX opened, the corresponding first trading session is D0 = 28 May 2025, representing a high-visibility, tangible military shock. The second phase, the June Phone Leak, originated when an audio recording of a bilateral diplomatic call leaked to the press on 18 June 2025. However, because 18 June was a national holiday (the Queen Mother’s Birthday) and the CSX was closed, the first opportunity for the market to react was the following trading day; therefore, the calendar Information Date is 18 June 2025, while the effective trading event day is D0 = 19 June 2025, representing a low-visibility, ambiguous informational shock. The third phase, the July Escalation, took place on 24 July 2025, when hostilities and border closures escalated during active trading hours, making D0 = 24 July 2025 the immediate trading event day for this second high-visibility physical shock. We formalize these chronologies, event typologies, and exact trading dates (D0) in Table 1.
Table 1.
Timeline and characteristics of the 2025 border crisis.
2. Literature and Theoretical Framework
Our integrated dual-horizon framework is grounded in a multi-disciplinary literature base bridging daily microstructural finance, medium-horizon macro-econometrics, and the regional political economy of the Thai–Cambodian frontier.
2.1. Microstructural and Econometric Foundations
Informational Inefficiency and the State-Space Solution: Lim and Brooks (2011) establish that young stock markets tend to be informationally inefficient. In frontier markets, this friction causes prices to drift and returns to become highly autocorrelated as it takes longer for stock prices to fully reveal new information. Standard OLS regressions often perform poorly under these conditions because they assume constant parameters and strictly stationary performance variables. To resolve this, we integrate the event-study methodologies of Khanthavit (2021, 2022). Khanthavit (2021) demonstrates that standard event-parameter regressions often fail during geopolitical crises; he shows that utilizing a Kalman filter allows the baseline expected return to move stochastically as a latent state variable, accommodating changing expected returns and helping to mitigate the influence of concurrent structural shocks. Building upon this mathematical foundation, Khanthavit (2022) utilized an event-conditioning state-space AR(1) model via a Kalman Filter to capture informational inefficiency during the Myanmar military coup. While Khanthavit successfully contrasts the market’s digestion of an anticipated event against a high-visibility, unanticipated shock, our paper extends this paradigm. We specifically contrast high-visibility physical conflict against informational/ambiguous shocks (the June phone leak), observing how varying degrees of threat visibility are associated with distinct differences in the speed of market price adjustment.
The Econometrics of Long-Run Returns (BHAR): When transitioning to extended holding horizons, traditional event studies relying on Cumulative Average Abnormal Returns (CAAR) face mathematical limitations. Fama (1998) demonstrates that evaluating extended horizons necessitates geometric compounding to properly evaluate investor wealth, while Kothari and Warner (1997) highlight that additive metrics can be sensitive to compounding biases, severe positive skewness, and non-normality. Recent empirical applications in emerging markets validate this shift; for example, Al Shawawreh (2023) demonstrates that BHAR is the necessary geometric framework for assessing true wealth over extended horizons in structural settings akin to frontier exchanges. To establish a counterfactual in the absence of a comprehensive regional benchmark, we rely on the constant-mean return model (MacKinlay, 1997; Brown & Warner, 1980, 1985). Finally, to provide more robust statistical inference and avoid the size distortions inherent in standard parametric tests, we evaluate our event statistic against an empirical distribution of historical placebo windows (Lyon et al., 1999; Gelbach et al., 2013).
Post-Conflict Recoveries, Accountability, and the “Peace Dividend”: We ground our post-conflict recovery hypotheses in the institutional literature of Cambodia. Borbely et al. (2026) define the peace dividend as the latent economic opportunities arising from post-conflict stabilization. They argue that political accountability determines whether post-conflict societies realize this surplus, demonstrating that economic gains only materialize when local elites are prevented from capturing them. Guided by this paradigm, we propose that the formal regulatory framework of Cambodia’s public equities potentially offers a higher-accountability institutional environment compared to uncertified rural assets, a condition theoretically necessary to constrain elite capture and capitalize on the returns to peace.
2.2. Regional Border Conflict and Geoeconomic Literature
The academic scholarship on the Thai–Cambodian frontier is highly multi-disciplinary and can be broadly classified into three primary thematic categories: sovereignty disputes and nationalistic mobilization over the cartographic “geo-body” (Winichakul, 1994; Chachavalpongpun, 2010; Bong, 2026; Sithirith & Bunthorn, 2026); non-traditional security challenges such as disruptions to sub-regional integration (Xu, 2026; Co et al., 2025; Deth, 2025; Wisaijorn, 2026); and small-state strategic communication to preserve supply chain legitimacy (Setthikun, 2026). This political architecture connects to a geoeconomic dimension where localized border hostilities disrupt bilateral trade corridors (Kohpaiboon, 2026), but are ultimately absorbed by Cambodia’s strategic pivot toward alternative regional partners (Yarrow & Kenh, 2026).
Despite these rich macroeconomic perspectives, there is little to no existing literature investigating the direct impact of border conflicts on financial markets, particularly within nascent frontier exchanges. This study represents the first empirical attempt to model such asset-pricing dynamics on the CSX. By bridging this gap, we offer a dual-horizon empirical framework that maps how daily microstructural adjustments and medium-horizon compounded returns (BHAR) are shaped by regional border tensions.
2.3. Hypothesis Development
Drawing from microstructural theories of information processing, we propose that the speed of market efficiency in a frontier exchange is contingent upon signal ambiguity and processing costs.
When geopolitical shocks are physical and highly salient (e.g., military skirmishes), the signal is unambiguous and quantitatively “hard” (Petersen, 2004). Because extreme visibility acts as an attention shock (Barber & Odean, 2008), its interpretation requires low cognitive effort. We expect this to trigger an immediate market reaction, overriding the typical informational inefficiency of a nascent market.
Conversely, when shocks are informational (e.g., a leaked diplomatic rumor), the signal is inherently “soft” and qualitative. Engelberg (2008) establishes that soft information carries significantly higher processing costs. Furthermore, Epstein and Schneider (2008) demonstrate that when investors receive ambiguous signals, ambiguity aversion dictates that they demand higher risk premia or take a worst-case assessment. Combining this ambiguity with the theory of gradual information diffusion (Hong & Stein, 1999), we argue that soft geopolitical intelligence diffuses gradually, requiring a multi-day verification period before it is fully incorporated into asset prices.
Grounded in this framework, we propose three primary hypotheses:
Hypothesis 1 (H1).
Immediate Efficiency to Physical Shocks (Unambiguous Signals). Under high-visibility, physical threats, frontier market inefficiency is overridden, resulting in significant negative abnormal returns on the exact event day (D0).
Hypothesis 2 (H2).
Gradual Price Incorporation for Informational Shocks (Ambiguous Signals). Ambiguous informational shocks produce more gradual price incorporation across subsequent trading sessions, resulting in delayed negative abnormal returns on subsequent days.
Hypothesis 3 (H3).
Post-Conflict Valuation Recovery and Medium-Horizon Resilience. Following the formal cessation of hostilities (the 27 December 2025 bilateral ceasefire), the aggregate index will generate positive medium-horizon buy-and-hold abnormal returns (BHAR2026 > 0) relative to historical normal-return benchmarks, indicating that acute geopolitical shocks do not induce permanent valuation impairment and are followed by post-resolution capital-price recovery.
3. Data and Return Conventions
To investigate both the short-run microstructural dynamics and the medium-horizon structural recovery of the Cambodian equity market, we utilize daily trading data extracted directly from the historical database of the Cambodia Securities Exchange spanning from January 2021 through August 2026. Because this study explicitly targets the aggregate market response, our primary unit of analysis is the continuously observed CSX Index.
3.1. Sample Horizons and the Estimation Window
To avoid structural breaks and imprecise estimates in volatile nascent exchanges, we explicitly define and structurally partition the data parameters. The medium-horizon partitioning separating the 2021–2024 historical baseline from the 2026 recovery period is formally detailed in Section 5.1.
For the short-term state-space model, the Maximum Likelihood Estimation (MLE) does not utilize a continuous full-year sample. Instead, to ensure that our baseline variance is unconfounded by the shocks themselves, the model for each specific geopolitical event is estimated on a restricted sub-sample of exactly 110 trading observations. This 110-day sample combines two specific periods:
- The Estimation Window (99 Days): A strict pre-conflict baseline ending on 31 March 2025. This cutoff prevents confounding global macroeconomic variables—specifically the severe market volatility following the 3 April 2025, U.S. tariff announcements—from artificially inflating our baseline variance. By isolating the baseline from Q2 shifts, we ensure that our normal expected returns reflect baseline market conditions unconfounded by the immediate Q2 shocks.
- The Event Window (11 Days): The specific 11-day event window (±5 trading days) surrounding each geopolitical shock.
By feeding the MLE exactly 110 observations per event, we enhance reproducibility and strictly limit arbitrary sample-selection variations.
3.2. Mathematical Return Conventions and Trading Continuity Diagnostics
Because our architecture relies on isolating the baseline trend from the acute shock, we explicitly distinguish our return notations. For the short-term state-space AR(1) analysis (Section 4), we utilize continuously compounded (logarithmic) returns to satisfy the assumption of time-series additivity. The daily log return for the CSX Index on trading day t is defined as , where Pt denotes the closing value of the CSX Index on active exchange trading session t. For the medium-term analysis (Section 5), we rely on geometric compounding to generate the Buy-and-Hold Return (BHR).
Over the full sample period from 4 January 2021 to 31 August 2026, the dataset comprises 1395 active exchange trading sessions (1394 daily log-return observations). Non-trading calendar days—specifically weekends and official Cambodian public holidays—are excluded from the time series rather than forward-filled. Because active trading occurs at the aggregate market level in every open exchange session, the CSX Index records zero non-trading days (Vt = 0) across the entire sample period (0% zero-volume sessions in both the estimation and event windows). Across all 1394 daily return observations, the CSX Index closed at an unchanged two-decimal level (rt = 0) on only three active sessions (0.22% of the sample: 7 February 2025; 21 March 2025; and 21 May 2025), reflecting offsetting constituent price movements rather than exchange-wide non-trading. Moreover, the unconditional sample first-order autocorrelation of daily index returns is strictly positive (ACF(1) = +0.2535). In a robustness check excluding the three flat-index sessions (N = 1391), the sample daily return standard deviation (0.8126% versus 0.8135%), unconditional lag-1 autocorrelation (ACF(1) = +0.25354 versus +0.25347), and state-space estimates remain virtually unchanged. We note that this diagnostic is conducted on the aggregate index rather than as a trade-to-trade correction on individual constituents: the index may still move even on sessions when one or more underlying stocks do not trade and retain stale prices, and the positive first-order index autocorrelation (ACF(1) = +0.2535) does not, by itself, demonstrate the absence of nonsynchronous trading (which our state-space AR(1) transition equation explicitly accommodates). Rather, these checks indicate that the problem of artificial zero returns at the aggregate-index level appears negligible, even though constituent-level stale pricing effects cannot be completely excluded.
4. Short-Term Analysis: The Kalman Filter Model
4.1. State-Space Formulation and Methodological Justification
To calculate the short-term daily abnormal returns while controlling for the informational inefficiency of the Cambodian market, we adapt the event-conditioning state-space AR(1) framework pioneered by Khanthavit (2022). We construct our empirical framework by proceeding in five sequential steps for each distinct geopolitical event.
1. The Return Decomposition: We first decompose the observed daily index return rt into three distinct components: the unobserved normal return (μt), the abnormal return (ut), and the unexpected error term (ϵt):
2. The Normal Return (Transition Equation): Standard OLS regressions assume daily returns are independent. However, empirical diagnostics of the aggregate CSX Index reveal statistically meaningful serial dependence. To mathematically filter out this serial correlation, we model the unobserved normal return μt as a stochastic state variable following an AR(1) process:
This autocorrelated specification is necessary to accurately control for the inefficient return dynamics of a nascent aggregate index.
3. The Abnormal Return (Pooled Block Windows and Post-Event Daily Disaggregation): To avoid direct mechanical overlap between the event windows and ensure strict temporal separation in our estimations, we strictly limit our total event window to 11 trading days: 5 days before the event, the event day (D0), and 5 days after. In our baseline specification, following the multivariate regression framework of Binder (1985) and Khanthavit (2022), we first parameterize the abnormal return (ut) using three distinct event block dummy variables:
where Dpre,1,t takes a value of 1 over the anticipatory window (Days −5 to −1), D0,t equals 1 exactly on the event day, and Dpost,1,t equals 1 during the delayed reaction window (Days +1 to +5). The estimated block coefficients (ϕpre,1,ϕ0,ϕpost,1) measure the daily average abnormal return associated with the shock during those specific intervals.
However, because a single multi-day block indicator (Dpost,1,t) imposes a constant average effect across Days +1 through +5 (ϕ+1 =⋯= ϕ+5 = ϕpost,1; Binder, 1985), it cannot distinguish between an isolated, front-loaded delayed crash on D + 1 and gradual price incorporation unfolding progressively across the post-event trading week. To formally identify the day-by-day speed of post-event price discovery, we draw on the dummy-variable disaggregation of Karafiath (1988) and the pulse intervention framework of Box and Tiao (1975) and Harvey (1990), replacing the pooled post-event block indicator Dpost,1,t with five individual daily pulse dummy variables (D+1,t,⋯,D+5,t):
where D+k,t = 1 exclusively on the k-th trading session following the event (t = D0 + k for k ∈ {1,2,3,4,5}) and 0 otherwise. Under this disaggregated specification, each parameter ϕ+k directly isolates the individual daily abnormal return AR(D + k) on post-event trading day D + k (Karafiath, 1988).
4. The Empirical Model (Measurement Equations): Substituting the pooled and disaggregated abnormal return parameterizations into the base return decomposition yields our baseline measurement equation:
and our disaggregated post-event measurement equation:
5. Cumulative Post-Event Trajectories (CAR(D + 1, D + k)) and Covariance-Adjusted Inference: To trace the cumulative path of price adjustment over the post-event horizon, we aggregate the estimated daily post-event parameters from the disaggregated state-space model into expanding Cumulative Abnormal Returns CAR(D + 1, D + k) for each horizon k ∈ {1,2,3,4,5} (MacKinlay, 1997; Campbell et al., 1997):
where and wk = (1,…,1)⊤ is a k × 1 unit summation vector. As demonstrated by Salinger (1992) and Karafiath (1988), because the daily post-event abnormal return parameters are estimated jointly against a common baseline and an autocorrelated AR(1) latent state, their estimation errors are intertemporally correlated ( for i ≠ j). Consequently, we evaluate the statistical significance of CAR(D + 1, D + k) at each horizon k using exact Wald/delta-method standard errors extracted from the quasi-maximum likelihood robust variance-covariance submatrix :
Estimation, Temporal Continuity, and h-Period State Propagation: The error terms ϵt and wt are strictly assumed to be normally distributed with a mean of zero, and are completely independent of each other. The complete state-space model is estimated using the Kalman filter (Harvey, 1990; Hamilton, 1994), with parameters optimized via Quasi-Maximum Likelihood Estimation (QMLE) using Harvey (1989) robust standard errors. Because our clean 99-day estimation baseline terminates on 31 March 2025—prior to the April 2025 global tariff announcements—an interval of h trading days elapses between the end of the baseline window and the start of each 11-day event window (h = 29, 44, and 68 trading days for the May, June, and July events, respectively). Simply concatenating the 99 baseline observations with the 11 event-window observations would artificially impose a single-period transition across a multi-week chronological gap. To preserve strict temporal continuity, we construct each event’s time series over the complete contiguous trading-day calendar spanning from the start of the 99-day baseline through D+5 (139, 154, and 178 total trading days for May, June, and July, respectively) and mask the h intervening exclusion-period returns as missing observations (NaN), so that exactly 110 observed trading days (99 + 11) enter the log-likelihood evaluation for each event. Following standard state-space procedures for missing data (Harvey, 1990; Hamilton, 1994), the Kalman filter omits the measurement-update step during the h-day buffer and recursively iterates the state-prediction step h times, thereby propagating the latent normal return via , accumulating the drift intercept (), and expanding the state innovation variance by prior to the start of each event window:
Furthermore, standard event studies mathematically require stationary baseline variables, an assumption that frequently fails during crises. The state-space model is highly generalized, allowing for random and autocorrelated normal returns. This dynamic normal return accommodates parameter instability and helps mitigate the effects of concurrent exogenous shocks (Khanthavit, 2021).
4.2. Baseline Empirical Results and Disaggregated Post-Event Trajectories (General Index)
Table 2 summarizes the results of the baseline Kalman-filter regression utilizing the pooled block-window parameters across the three distinct crisis phases for the aggregate CSX Index under exact h-period state propagation.
Table 2.
Daily abnormal return coefficients across crisis phases (General Index).
We observe from Table 2 a distinct behavioral contrast dependent on the nature of the event. During the May Initial Shock and the July Escalation—both characterized by highly visible military action—the market exhibited statistically significant, immediate downward price adjustments concentrated on D0. The May skirmish was associated with a −0.076% adjustment (p = 0.015), and the July escalation triggered a sharp −0.238% downward adjustment (p = 0.000). The subsequent 5-day recovery windows (Dpost,1) yield no statistically detectable abnormal returns (−0.005%, p = 0.977 for May; +0.043%, p = 0.662 for July). These findings are consistent with the hypothesis that physical conflict acts as an unambiguous signal capable of overcoming institutional price inefficiency, resulting in immediate Day-0 pricing.
Conversely, the June Phone Leak represents an information-based rumor shock. Interestingly, D0 yielded a statistically significant positive reaction (+0.276%, p = 0.000), suggesting initial market uncertainty or potential misinterpretation of the unverified diplomatic leak. However, we observe a statistically significant negative correction taking hold in the subsequent 5-day window (Dpost,1 = −0.151%, p = 0.031). This is consistent with the hypothesis of gradual price incorporation; the market exhibited a delayed negative reaction over subsequent days as it absorbed the ambiguous soft news before pricing in the negative diplomatic reality.
Finally, across all three events, the strict 5-day anticipation windows (Dpre,1) yielded statistically insignificant results (p = 0.876, p = 0.297, and p = 0.414, respectively), indicating no statistically detectable anticipatory price movement preempting the crises.
Disaggregating Post-Event Dynamics: Gradual Price Incorporation vs. Single-Day Delayed Adjustment
To verify whether the negative post-event adjustment following the June diplomatic leak reflects genuine multi-day price discovery rather than an isolated one-day delayed crash on D + 1, we estimate the disaggregated post-event state-space specification defined in Section 4.1 (Steps 3–5). Table 3 reports the individual daily abnormal return estimates (AR(D + k) = ϕ+k) and the expanding cumulative abnormal return trajectories () for k ∈ {1,…,5} across all three crisis phases, while Figure 1, Figure 2 and Figure 3 visually map these post-event paths.
Table 3.
Disaggregated post-event daily abnormal returns (AR(D + k)) and cumulative trajectories (CAR(D + 1, D + k)) across crisis phases.
Figure 1.
Disaggregated post-event trajectory for the May Initial Shock (event date: 28 May 2025). Panel A plots the daily abnormal returns AR(D + k) for k∈{1,…,5} with 95% confidence intervals (red and blue bars denote negative and positive daily abnormal returns, respectively) Panel B traces the expanding cumulative abnormal return trajectory CAR(D + 1,D + k) and its 95% confidence band computed via covariance-adjusted delta-method standard errors.
Figure 2.
Disaggregated post-event trajectory for the June Phone Leakage (Event Date: 18 June 2025). Panel A illustrates the four consecutive sessions of negative daily abnormal returns AR(D + k) across D + 1 through D + 4 (red bars) followed by a modest positive return on D + 5 (blue bar), with 95% confidence intervals. Panel B demonstrates the smooth, monotonic downward progression of the cumulative trajectory CAR(D + 1, D + k) from −0.1233% on D + 1 to −0.8413% on D + 4 (−0.7571% at D + 5).
Figure 3.
Disaggregated post-event trajectory for the July Border Crisis Escalation (Event Date: 24 July 2025). Panel A plots the daily abnormal returns AR(D + k) across D + 1 through D + 5 (red and blue bars denote negative and positive daily abnormal returns, respectively). Panel B shows the rapid post-event mean reversion of the cumulative trajectory CAR(D + 1,D + k) back toward zero following the July 28 ceasefire negotiations (D + 5).
For the June Phone Leakage (Table 3, Panel B, and Figure 2), the disaggregated trajectory decisively refutes the hypothesis of a front-loaded, single-day crash on D + 1. Instead, the CSX Index exhibits four consecutive sessions of statistically significant negative abnormal returns: AR(D + 1) = −0.1233% (p = 0.0001), AR(D + 2) = −0.1819% (p < 0.0001), AR(D + 3) = −0.1797% (p < 0.0001), and AR(D + 4) = −0.3563% (p < 0.0001), followed by a modest stabilization on D + 5 (+0.0843%, p = 0.0076). Rather than being front-loaded on D + 1—which accounts for only 16.3% of the five-day cumulative decline—the daily sell-off intensifies mid-week and reaches its largest single-day magnitude on D + 4 (Figure 2, Panel A). Consequently, as visually illustrated in Panel B of Figure 2, the cumulative trajectory CAR(D + 1, D + k) declines monotonically from −0.1233% on D + 1 to −0.3053% on D + 2, −0.4850% on D + 3, and −0.8413% (SE = 0.1263, p < 0.0001) on D + 4, concluding the five-day window at CAR(D + 1, D + 5) = −0.7571% (SE = 0.1579, p < 0.0001; implying a five-day average of −0.1514% per day that closely reconciles with our pooled benchmark of ϕpost,1 = −0.151% in Table 2).
By contrast, the disaggregated trajectories for the two physical military shocks—the May Initial Shock (Table 3, Panel A, and Figure 1) and the July Border Crisis Escalation (Table 3, Panel C, and Figure 3)—confirm that unambiguous military events are priced immediately on D0 without sustained post-event downward drift. In May (Figure 1), following the event-day contraction, post-event daily returns oscillate between positive and negative values (Panel A), yielding an insignificant five-day cumulative trajectory of CAR(D + 1, D + 5) = −0.0315% (SE = 0.1541, p = 0.8381; Panel B). Similarly, in July (Figure 3), the market prices the border closure immediately on Day 0 with a brief one-day continuation on D + 1 (AR(D + 1) = −0.2536%, p < 0.0001) that rapidly reverses on D + 2 (+0.1374%, p < 0.0001) and D + 5 (+0.3665%, p < 0.0001, coinciding with the July 28 ceasefire), rendering the cumulative post-event trajectory statistically indistinguishable from zero from D + 3 onward (CAR(D + 1, D + 3) = −0.0729%, p = 0.4369; CAR(D + 1, D + 5) = +0.2157%, SE = 0.1564, p = 0.1679). Together, within the exploratory scope of our three-episode sample, these trajectories provide visual and econometric support for Hypotheses 1 and 2: in this frontier setting, high-visibility physical shocks triggered immediate Day-0 price adjustments, whereas the opaque political-informational shock induced multi-day gradual price incorporation.
4.3. Methodological Robustness and Lag Specification
To ensure that the market reactions are structural realities of the raw data rather than mathematical artifacts of the Kalman filter, we stress-test our parameters against alternative model specifications within the restricted 11-day event windows. Table 4 summarizes the Day 0 (D0) abnormal return coefficients alongside formal lag-selection and residual autocorrelation diagnostics—specifically the Log-Likelihood, Akaike Information Criterion (AIC), Bayesian Information Criterion (BIC), and Ljung–Box Q(1) p-values—across the standard OLS/AR(0) (HAC) regression and the State-Space AR(1), AR(2), and AR(3) variations.
Table 4.
Robustness of day 0 (D0) abnormal returns and formal lag-selection diagnostics across model specifications.
Across all three events, degrading the state-space model to a standard OLS/AR(0) framework with HAC standard errors yields coefficients and p-values that are virtually identical to our AR(1) estimates. For instance, during the July Escalation, the downward adjustment remains highly significant and economically stable between the OLS (−0.2383%, p = 0.0000) and AR(1) (−0.2395%, p = 0.0000) frameworks. This OLS confirmation provides strong supporting evidence that the acute market pricing adjustments are genuine structural features of the CSX rather than algorithmic illusions.
To formally evaluate lag-length sensitivity across the AR(0)/OLS through AR(3) specifications, Table 4 reports the Log-Likelihood, AIC, BIC, and Ljung–Box Q(1) residual autocorrelation diagnostics. Across all three geopolitical events, the baseline state-space AR(1) specification completely eliminates first-order residual serial correlation, elevating the Ljung–Box Q(1) p-value from 0.7234 under static OLS/AR(0) to 0.9770 in May, and exceeding 0.99 in both June (p = 0.9972) and July (p = 0.9936). During the May Initial Shock, where the immediate abnormal return is statistically significant under both OLS (−0.0752%, p = 0.0176) and AR(1) (−0.0805%, p = 0.0121), extending the state transition to AR(2) (p = 0.4509) and AR(3) (p = 0.6395) yields negligible log-likelihood gains (ΔLL = +0.271 and +0.693, respectively, well below the likelihood-ratio critical threshold) while incurring monotonic information-criteria penalties, with AIC rising from 67.289 to 68.747 (AR(2)) and 69.902 (AR(3)), and BIC rising from 83.491 to 87.650 and 91.506. Whereas the larger-magnitude June (+0.2761%) and July (−0.2395%) shocks remain highly significant at the 1% level across all lag orders (p < 0.0001), these formal diagnostics confirm that higher-order autoregressive structures in the May window introduce uninformative parameter inflation that dilutes degrees of freedom without improving model fit. We note that in the May window, where the static OLS/AR(0) specification already shows no statistically significant residual autocorrelation (Ljung–Box Q(1) p = 0.7234), OLS/AR(0) achieves lower AIC (63.419) and BIC (74.221) values than the state-space AR(1) specification (AIC = 67.289, BIC = 83.491) due to the parameter penalty associated with the latent state transition, while yielding virtually identical Day-0 abnormal return estimates (−0.0752% versus −0.0805%). Within the state-space framework, however, whereas the larger-magnitude June (+0.2761%) and July (−0.2395%) shocks remain highly significant at the 1% level across all lag orders (p < 0.0001), these formal diagnostics confirm that higher-order autoregressive structures in the May window introduce uninformative parameter inflation that dilutes degrees of freedom without improving model fit, supporting the AR(1) specification relative to the state-space AR(2) and AR(3) specifications.
Finally, we address the sensitivity of our findings to the 31 March 2025 estimation window cutoff. This cutoff was explicitly selected to prevent the global market volatility following the April 3 U.S. tariff announcements from inflating our baseline variance. To ensure our findings are not purely an artifact of this selection, we conduct a robustness test by allowing the 99-day estimation window to roll forward immediately prior to each event, forcing the baseline to absorb the April macroeconomic turbulence. Under this highly volatile baseline, the standard errors naturally inflate; however, the May Day-0 adjustment remains marginally significant (p = 0.0549) under the AR(1) specification, while the sharp June and July shocks remain highly significant (p = 0.000 and p = 0.0205 respectively). This confirms that while the March 31 cutoff is methodologically appropriate to establish a baseline unconfounded by major exogenous macro-shifts, the distinct price adjustment pattern observed across the crisis remains a robust empirical pattern.
5. Medium-Term Analysis: The BHAR Framework
5.1. The BHAR Framework and Methodological Justification
To rigorously evaluate post-conflict valuation recovery and medium-horizon resilience without benchmark contamination, we structurally partition the dataset into strict temporal windows and define the Cambodia Securities Exchange (CSX) Index as its own empirical counterfactual (MacKinlay, 1997). The framework relies on four sequential steps.
5.1.1. Timeline, Historical Baseline, and Robustness
The methodology relies on strict temporal separation to prevent event contamination between the initial shock and the subsequent recovery phase:
- Historical Reference Baseline: January 2021–December 2024.
- Conflict Year: 2025 (excluded from normal baseline and recovery calculations).
- Post-Conflict Recovery Horizon: 2 January 2026, through 31 August 2026 (T = 164 trading sessions). The 2025 border conflict culminated in a formal bilateral ceasefire signed on 27 December 2025 (Reuters, 2025). Therefore, designating 2 January 2026—the first trading session of the new year (t = 1)—as the start of our recovery horizon creates a strict temporal boundary between active wartime pricing and post-resolution recovery. To capture the full T = 164 trading sessions of the 2026 recovery window—including the Day 1 return realized on 2 January 2026—the cumulative return calculation is anchored against the final pre-recovery closing index level of 2025 (P0 = 423.06 on 31 December 2025). The CSX Index subsequently closed at P1 = 425.10 on 2 January 2026 (+0.4822% on t = 1) and reached P164 = 541.02 on 31 August 2026, generating a cumulative compounded capital-price return of +27.8826% (≈+27.88%). (Note: measuring strictly from the first 2026 closing price of P1 = 425.10 to P164 = 541.02 over the remaining 163 sessions yields a sub-period return of +27.2689%, or +27.27%.)
To visually map this structural partitioning and anchor the timeline to the index’s exact starting and ending performance, Figure 4 illustrates the time-series trajectory of the CSX Index across all three distinct phases.
Figure 4.
CSX Index Trajectory: Pre-Conflict Baseline to Post-Conflict Recovery (2021–2026). The graph illustrates the raw closing price of the aggregate index. The shaded regions denote the 2021–2024 primary historical baseline used to estimate the normal return, the excluded 2025 conflict window, and the 2026 post-conflict recovery horizon (highlighting the exact starting and ending index points).
Let Pt denote the closing price level of the aggregate CSX Index on trading session t. The daily simple return (Rt) and continuously compounded (logarithmic) return (rt) are formally defined as
Daily logarithmic returns rt of the aggregate CSX price index serve as the primary input, converting to geometric Buy-and-Hold Returns (BHR) via exponentiation where appropriate. Official exchange holidays and weekends are excluded rather than forward-filled to maintain strict trading-time continuity across active sessions, and zero exchange-wide trading halts occurred across the 2021–2026 sample period. Because dividends are not incorporated into the index, all outcomes represent capital-price recovery rather than total investor wealth accumulation.
Rather than artificially selecting a tranquil benchmark, we utilize a pre-conflict historical reference period that encompasses the macroeconomic and political fluctuations the CSX ordinarily experiences.
- Primary Baseline (2021–2024): Provides four full years of trading history (N = 987 sessions), completely excluding the extraordinary initial 2020 COVID-19 shock while reflecting the modern structure of the exchange.
- Robustness Baseline (2022–2024): A stricter reference period (N = 746 sessions) utilized to evaluate whether empirical findings are sensitive to Cambodia’s severe domestic COVID-19 outbreak in February 2021.
- Strict 9-Stock Constant-Composition Baseline (1 July 2023–31 December 2024): Because CAMGSM Plc (CGSM) and Mengly J. Quach Education Plc (MJQE) listed on the CSX Main Board in late June 2023 (June 27 and 28 June 2023, respectively), restricting the baseline to 1 July 2023–31 December 2024 (N = 371 sessions; K = 208 rolling windows) guarantees that every historical placebo window shares the exact same nine-firm index composition as the 2026 recovery horizon.
- Strict 7-Stock Pre-Expansion Baseline (1 January 2021–31 May 2023): Conversely, isolating the pre-IPO regime (N = 594 sessions; K = 431 rolling windows) evaluates the historical distribution under a strictly constant seven-stock Main Board composition (PWSA, GTI, PPAP, PPSP, PAS, ABC, PEPC) prior to the June 2023 index expansion.
As reported in Table 5, the integration of both daily return drift and multi-month compounding illustrates the compositional and volatility stability of the CSX counterfactual. Notably, while the mid-2023 IPOs of CAMGSM Plc (CGSM) and Mengly J. Quach Education Plc (MJQE) expanded the Main Board to nine firms and introduced substantial new telecommunications market capitalization, this expansion did not appear to substantially disrupt the index’s return behavior. Because these two newly added stocks exhibit exceptionally low daily turnover relative to their total market valuation (e.g., CGSM’s daily turnover averages approximately 0.0053% of its market capitalization and MJQE’s daily turnover averages approximately 0.0101% of its market capitalization), these additions organically matured the index without artificially inflating its baseline variance. Consequently, daily volatility in 2026 (0.8334%) aligns firmly within the historical parameters established from 2021 to 2024, supporting the validity of treating this period as a unified historical baseline. Furthermore, to formally verify that the mid-2023 shift from seven to nine constituents does not distort long-term benchmark comparability, we supplement our primary (2021–2024) and COVID-restricted (2022–2024) baselines with strict constant-composition sub-period tests across both the post-expansion nine-stock regime (July 2023–December 2024) and the pre-expansion seven-stock regime (January 2021–May 2023).
Table 5.
Structural comparability of the counterfactual.
5.1.2. The Time-Series BHAR Procedure
1. The Misspecification of CAAR and the Geometric Framework: Traditional event studies rely on Cumulative Average Abnormal Returns (CAAR) computed via arithmetic addition. However, as demonstrated by Ledwani et al. (2021) during the exogenous shocks of the COVID-19 pandemic, CAAR suffers from a mathematical inaccuracy by adding returns akin to “simple interest”, which can capture an illusion of “additional loss and additional recovery” during periods of extreme market turbulence. Therefore, relying on geometric compounding is appropriate for evaluating long-horizon investor returns (Fama, 1998; Al Shawawreh, 2023). We utilize the geometric Buy-and-Hold Return (BHR), which multiplies simple daily returns sequentially—or equivalently exponentiates the sum of daily logarithmic returns—to capture the compounded economic reality over the T = 164 trading day recovery horizon (Barber & Lyon, 1997; Kothari & Warner, 1997; Lyon et al., 1999). According to the telescoping property of logarithmic returns, the actual compounded return over the T-day window is identically given by
where P0 = 423.06 is the baseline index close immediately preceding t = 1 and PT = P164 = 541.02 is the terminal closing price on 31 August 2026.
2. The Constant-Mean Counterfactual and Index BHAR: The absence of a credible external market benchmark motivates the use of a within-market statistical normal-return model (MacKinlay, 1997; Brown & Warner, 1980, 1985). Despite its parsimony, the constant-mean return model is an established, robust specification that frequently performs as well as, or outperforms, more complex multifactor or risk-adjusted models in detecting abnormal performance, while avoiding the “bad-model problem” in which multi-parameter estimation errors compound over long horizons (Fama, 1998). We transition the unit of analysis exclusively to the aggregate CSX Index and estimate the expected counterfactual return based solely on the CSX’s own normal pre-conflict historical mean daily logarithmic return ():
Because the constant-mean model assumes the daily expectation is a constant across all h = 1,…,T sessions (requiring no autoregressive specification, Kalman filtering, or recursive path forecasting), the expected compounded return over the T-day window is constant across all historical windows:
The 2026 Buy-and-Hold Abnormal Return is thus formally defined as:
Scope of the Medium-Horizon Test: Econometrically, testing BHAR2026 > 0 evaluates whether the market experienced sustained cumulative abnormal price appreciation relative to its pre-conflict constant-mean historical benchmark (BHRexpected,T). We emphasize that a positive BHAR identifies relative post-conflict valuation recovery and benchmark outperformance rather than a mechanical mean-reverting stochastic process or exact convergence to a pre-conflict equilibrium price level. Furthermore, while an extreme positive BHAR in the upper tail of the historical placebo distribution () is consistent with post-ceasefire repricing, it captures aggregate medium-horizon recovery that may simultaneously reflect post-resolution relief, macroeconomic normalization, and broader 2026 valuation adjustments.
3. Constructing the Historical Equal-Horizon BHAR Distribution: Parametric tests of long-horizon abnormal returns are systematically mis-specified due to compounding effects, severe positive skewness, and non-normality (Barber & Lyon, 1997; Kothari & Warner, 1997). To provide a transparent historical benchmark and avoid the severe size distortions inherent in standard parametric tests, we evaluate our 2026 event statistic against sample quantiles of the empirical distribution of historical excess returns (Lyon et al., 1999; Gelbach et al., 2013). For every eligible historical start date (s), where the entire window fits within the reference period (s + T − 1 ≤ 31 December 2024), we calculate the actual historical T-day return:
Subtracting the constant expected return generates the model-adjusted abnormal return for every eligible historical window:
Crucially, because we subtract an identical constant scalar from every observation, the percentile ranking based on BHAR is mathematically identical to the percentile ranking based on raw BHR (BHARi > BHARj ⇔ BHRi > BHRj), fully preserving the abnormal-return interpretation without artificially altering the historical ordering. This generates our exact empirical placebo distribution across all K = N − T + 1 eligible windows:
4. Historical Placebo Benchmarking and Descriptive Rank: To evaluate the magnitude of the 2026 recovery without relying on mis-specified parametric long-horizon tests (Barber & Lyon, 1997; Kothari & Warner, 1997), we benchmark BHAR2026 directly against the empirical historical distribution (Lyon et al., 1999; Gelbach et al., 2013). Because consecutive rolling T-day windows share T − 1 = 163 trading days, the resulting BHARs observations exhibit strong moving-average dependence by construction. As established in the dependent time-series resampling and subsampling literature (Politis & Romano, 1994; Politis et al., 1999), simple finite-sample permutation adjustments—such as —do not correct for serial overlap in the absence of formal block-length calibration. Consequently, we refrain from interpreting the rolling-window comparison as a formal inferential hypothesis test or reporting an inferential p-value. Instead, we evaluate BHAR2026 strictly as a descriptive historical benchmark, locating our 2026 event statistic within the empirical distribution via its historical percentile rank (Percentile2026) and reporting its empirical upper-tail exceedance frequency (fupper):
To complement the rolling-window distribution without serial overlap, we also partition the historical reference period into ⌊N/T⌋ strictly contiguous, non-overlapping T-day blocks and verify whether any non-overlapping block equals or exceeds BHAR2026. Together, these descriptive historical benchmarks establish the empirical frequency with which the CSX generated an equivalent compounded recovery under pre-conflict market conditions.
5.2. Empirical Results and Historical Placebo Benchmarking
Having established the structural comparability of the pre-conflict CSX baselines, we now estimate the normal-return counterfactual and evaluate the 2026 post-conflict Buy-and-Hold Abnormal Return (BHAR) against its own empirical historical distribution.
5.2.1. Constant-Mean Counterfactual and Actual BHAR
Following the parsimonious normal-return methodology established by MacKinlay (1997) and Brown and Warner (1980, 1985), we estimate the expected 164-day performance of the CSX. During the primary pre-conflict baseline (January 2021–December 2024, N = 987), the CSX Index exhibited a slight negative drift, yielding an estimated normal daily logarithmic return of (−0.0445% per trading day; unrounded full-precision value −0.0004454513). Compounding this constant mean over the T = 164 trading days of the 2026 recovery horizon yields an expected normal return of
In contrast to this historical expectation, the actual compounded return of the CSX during the 2026 post-conflict horizon was notably strong. Anchored against the final 2025 pre-recovery close of P0 = 423.06 (31 December 2025), the index closed the first trading session of the recovery window at P1 = 425.10 (2 January 2026) and rose to P164 = 541.02 on 31 August 2026 (). This generated an actual compounded return of:
Subtracting the model-adjusted expected return from the actual observed return isolates the abnormal performance:
We note transparently that this +34.93% model-adjusted BHAR reflects both the substantial unadjusted 2026 capital-price appreciation (BHR2026,actual = +27.88%) and the subtraction of the negative pre-conflict historical baseline drift (BHRexpected,164 = −7.04%); crucially, however, even the unadjusted +27.88% raw return exceeds the maximum historical return observed across all reference periods.
To evaluate whether this +34.9275% (+34.93%) abnormal return is sensitive to the 2021 domestic COVID-19 shock, we repeat the estimation using the restricted 2022–2024 robustness baseline (N = 746). Under this restricted sample, the normal daily logarithmic return is (−0.0184% per trading day), and the expected 164-day return adjusts upward to BHRexpected,164 = −2.9685% (≈−2.97%). Consequently, the robustness abnormal return remains strongly positive:
Finally, partitioning the sample into strict constant-composition regimes confirms that our counterfactual estimate is invariant to the June 2023 index expansion. Under the Strict 9-Stock Constant-Composition Baseline (July 2023–December 2024; N = 371), the normal daily logarithmic return is (−0.0297% per trading day), yielding an expected 164-day return of BHRexpected,164 = −4.7559% (≈−4.76%) and a 2026 abnormal return of (≈+32.64%). Similarly, under the Strict 7-Stock Pre-Expansion Baseline (January 2021–May 2023; N = 594), the normal daily logarithmic return is (−0.0533% per trading day), yielding BHRexpected,164 = −8.3710% (≈−8.37%) and (≈+36.25%).
5.2.2. Historical Placebo Benchmarking and Descriptive Rank
While a positive BHAR is economically meaningful, ordinary parametric tests of long-horizon abnormal returns are frequently mis-specified due to compounding biases (Kothari & Warner, 1997). To contextualize the magnitude of the 2026 recovery, we benchmark the 2026 event statistic against the empirically generated distributions of historical abnormal-return observations (Lyon et al., 1999). Table 6 summarizes the complete counterfactual parameters and empirical distribution quantiles across all four baseline specifications, reconciled to the fourth decimal place.
Table 6.
2026 post-conflict BHAR estimation and empirical historical placebo distributions (T = 164 trading days).
Rolling a 164-day window across the 2021–2024 primary baseline generates K = 824 historical placebo windows. As shown in Panel B of Table 6, the resulting empirical distribution () is characterized by a mean BHAR of +0.0332% (+0.03%), a median of +0.7632% (+0.76%), a 5th percentile of −19.3328% (−19.33%), and a 95th percentile of +12.3563% (+12.36%).
When locating the 2026 recovery within this established distribution, we find that the observed BHAR2026 of +34.9275% (+34.93%) lies entirely above the historical range observed during the reference period. The maximum historical placebo return recorded in the primary baseline was +23.0548% (+23.05%).
Figure 5 visually plots this empirical comparison, contrasting the density of pre-conflict rolling windows against the observed 2026 recovery.
Figure 5.
Empirical Distribution of Historical Placebo BHARs vs. 2026 Recovery. The figure presents the density histogram and Kernel Density Estimate (KDE) of the K = 824 historical 164-day abnormal returns generated from the 2021–2024 primary baseline. The actual 2026 BHAR (+34.93%) is situated in the extreme right tail, lying above the maximum observed historical window (+23.05%) and the 95th percentile benchmark (+12.36%).
Accordingly, the empirical upper-tail exceedance frequency in our primary sample is:
As a descriptive historical benchmark, the 2026 post-conflict BHAR lies at the 100.00th percentile of all rolling 164-day intervals observed during 2021–2024, with zero historical windows equaling or exceeding the 2026 recovery. Because overlapping windows share up to 163 trading days, we do not interpret fupper as an inferential permutation p-value (Politis & Romano, 1994; Politis et al., 1999). However, as an additional descriptive check that eliminates serial overlap entirely, partitioning the 987-day baseline into ⌊987/164⌋ = 6 strictly contiguous, non-overlapping 164-day blocks yields the same qualitative benchmark (0/6 non-overlapping blocks exceed BHAR2026).
This descriptive upper-tail positioning is preserved across all three robustness baselines. Under the restricted 2022–2024 baseline (K = 583 windows; 95th percentile of +8.1603% and maximum of +18.9785%), the robustness of +30.8511% (+30.85%) ranks at the 100.00th percentile with zero exceedances across both rolling windows (0/583) and non-overlapping blocks (0/4). Crucially, isolating the Strict 9-Stock Constant-Composition Baseline (1 July 2023–31 December 2024; N = 371, K = 208)—where every historical window shares the exact same nine constituents as the 2026 recovery period—yields a maximum historical placebo BHAR of +5.8408% (+5.84%); the corresponding of +32.6385% (+32.64%) lies at the 100.00th percentile with zero exceedances (0/208 rolling windows; 0/2 non-overlapping blocks). Likewise, under the Strict 7-Stock Pre-Expansion Baseline (1 January 2021–31 May 2023; N = 594, K = 431), the maximum historical placebo BHAR is +18.0003% (+18.00%), and (+36.2536%) again stands at the 100.00th percentile (0/431 rolling windows; 0/3 non-overlapping blocks). Together, these sub-period checks confirm that our core qualitative finding—exceptionally strong 2026 post-conflict performance relative to the historical benchmark—is robust to the mid-2023 change in index composition.
5.2.3. Conclusion on Crisis Resilience and Shock Absorption
The CSX generated a substantially positive model-adjusted buy-and-hold abnormal return during the 2026 recovery period, with the observed BHAR lying above all comparable historical CSX horizons across our full, COVID-restricted, and constant-composition reference periods. Because the actual return exceeded the maximum observed return across every empirical placebo distribution, the result provides descriptive evidence of unusually strong price performance and benchmark outperformance relative to historical CSX windows.
While this establishes descriptive evidence of medium-horizon market resilience and post-resolution valuation recovery rather than mechanical mean reversion, aggregate index data alone cannot isolate a single causal mechanism from concurrent macroeconomic covariates (such as monetary conditions, bilateral negotiations, or foreign investment shifts). Crucially, however, this strong equity rebound does not occur in a vacuum: it is congruent with both institutional theories of post-conflict ‘peace dividends’ under accountability constraints (Borbely et al., 2026) and contemporary macroeconomic and trade evidence documenting Cambodia’s rapid post-2025 supply-chain adaptation, maritime trade re-routing, and export recovery (Yarrow & Kenh, 2026; World Bank, 2026; Khmer Times, 2026b, 2026c, 2026d).
5.3. Summary of Hypothesis Testing
To synthesize our dual-horizon empirical findings, Table 7 provides a structured mapping of our initial hypotheses to their corresponding methodological tests and final outcomes.
Table 7.
Summary of empirical hypothesis testing.
6. Conclusions and Discussion
6.1. Summary of Empirical Findings
This study provides an empirical investigation into how frontier capital markets process exogenous geopolitical crises across both short- and medium-term horizons, focusing on the 2025 Thai–Cambodian border conflict on the Cambodia Securities Exchange (CSX). Utilizing a dual-horizon econometric framework—combining an event-conditioned state-space AR(1) Kalman filter with a within-market constant-mean counterfactual evaluated against an empirical placebo distribution—we document distinct structural price adjustment patterns across different types of geopolitical events and time horizons.
In the short term, rather than exhibiting uniform informational inefficiency, the speed of price discovery on the CSX varies systematically with signal visibility. High-visibility physical military conflicts (the May 2025 initial skirmish and July escalation) triggered immediate, statistically significant Day-0 downward price adjustments followed by rapid post-event stabilization. Conversely, low-visibility informational shocks (the June 2025 diplomatic communication leak) induced gradual price incorporation characterized by four consecutive post-event trading sessions of negative abnormal returns and a monotonic downward cumulative trajectory. This behavioral contrast indicates that while frontier exchange infrastructure can rapidly incorporate tangible physical events, informational opacity and verification friction delay price discovery when geopolitical shocks arrive as soft, ambiguous signals.
In the medium term, despite acute short-term market contractions during active hostilities, the aggregate CSX Index generated a substantially positive +34.93% Buy-and-Hold Abnormal Return (BHAR) outperformance over the eight-month 2026 post-resolution window (T = 164 trading sessions), ranking at the 100th percentile of comparable pre-conflict historical horizons with zero observed exceedances across both rolling windows (fupper = 0/824 = 0.00%) and strictly non-overlapping 164-day blocks (0/6). This benchmark outperformance holds across COVID-restricted (+30.85%), strict nine-stock constant-composition (+32.64%), and strict seven-stock pre-expansion (+36.25%) reference baselines. Broadly, this medium-horizon valuation recovery is congruent with a converging body of multi-disciplinary research and contemporary economic evidence on post-conflict recovery in Cambodia—spanning spatial development economics (Borbely et al., 2026), international trade adaptation (Yarrow & Kenh, 2026), and macroeconomic reporting (World Bank, 2026; Khmer Times, 2026b, 2026c, 2026d)—which documents that Cambodia’s formal economic pillars rapidly adapt and unlock latent economic potential once acute geopolitical friction subsides.
6.2. Theoretical Synthesis: Signal Visibility and Microstructural Frictions in Nascent Markets
Beyond its empirical documentation of the 2025 border crisis, this study offers a theoretical synthesis of how information visibility interacts with microstructural frictions in nascent capital markets. Standard market microstructure theory posits that thin order books, high verification costs, and autocorrelated return dynamics impede the rapid incorporation of public news in frontier exchanges (O’Hara, 2000; Lim & Brooks, 2011; Said et al., 2024). By integrating the theoretical distinction between hard and soft information (Petersen, 2004; Engelberg, 2008) with behavioral models of investor attention and ambiguity aversion (Barber & Odean, 2008; Epstein & Schneider, 2008; Hong & Stein, 1999), our findings suggest that informational efficiency in a nascent market is not a static structural constant, but rather a state-contingent outcome governed by signal tangibility. When an exogenous geopolitical shock is physical and unambiguous, extreme salience acts as a market-wide attention shock that compresses cognitive processing costs and temporarily overrides baseline microstructural inertia, forcing immediate Day-0 price discovery. Conversely, when a geopolitical shock arrives as soft, ambiguous intelligence, high qualitative verification costs interact with baseline illiquidity and investor ambiguity aversion, shifting the market into a gradual multi-day information diffusion regime.
This theoretical mechanism is further illuminated by comparing our results with Khanthavit (2022) regarding the Yangon Stock Exchange (YSX). Khanthavit observes that the 2021 Myanmar Military Coup triggered a sharp Day 0 downward adjustment (−7.11%), characterized by strictly zero anticipatory leakage and zero delayed reaction. Our findings for the May Initial Shock and July Escalation exhibit a structurally similar Day-0 negative price adjustment. This cross-market consistency supports the theoretical premise that when a geopolitical threat is unambiguously physical (e.g., a military coup or a kinetic border skirmish), the typical illiquidity friction of a nascent market is largely circumvented by immediate downward price adjustments.
Conversely, we document a notable divergence in how informational shocks are digested on the CSX. Khanthavit finds significant abnormal returns strictly before the 2020 General Election, but none on or after the event. For the June Phone Leak, however, we observe zero anticipation followed by a significant, multi-day delayed reaction (CAR(D + 1, D + 5) = −0.7571%). This divergence reflects the contrasting informational structure of the shocks: whereas Khanthavit studies a scheduled, institutional event that allowed investors to form priors in advance, we examine an unanticipated, unscheduled diplomatic leak. Lacking prior consensus or verified institutional disclosures, market participants required multiple trading sessions to cross-verify the soft intelligence and assess its diplomatic fallout, demonstrating how informational opacity compounds microstructural friction in thinly traded frontier settings.
6.3. The Financial Peace Dividend: Governance and Political Constraints
Our empirical documentation of a substantially positive Buy-and-Hold Abnormal Return (+34.93% BHAR, ranking at the 100th historical percentile with fupper = 0/824 = 0.00% rolling-window exceedances and 0/6 non-overlapping block exceedances) over the 2026 post-resolution window following the 2025 Thai–Cambodian border conflict indicates that frontier equity markets can exhibit strong medium-term valuation recovery and benchmark outperformance following geopolitical shocks. Evaluating this medium-horizon financial shock absorption helps situate financial price movements within broader institutional contexts. Our findings resonate with the institutional framework of Borbely et al. (2026), who suggest that post-conflict economic recovery depends not only on the structural presence of a ‘peace dividend’ but also on political constraints and institutional accountability that help protect value creation.
In their evaluation of nationwide landmine clearance in Cambodia across 1994–2022, Borbely et al. (2026) show that demining frees arable land and reduces victimization by 48%, creating a latent economic surplus. Crucially, whether this potential surplus translates into observable economic gains depends on local accountability structures. Where commune-level demand for checks and balances is strong, clearance is associated with a 7.3 percentage-point increase in nightlight probability and a 22% expansion in household consumption. Conversely, in low-accountability communes with weaker institutional constraints, the economic gains from clearance are substantially diminished, as local elites are more able to reallocate cleared land toward Economic Land Concessions (ELCs) and large-scale extraction.
Extending this political economy perspective to financial markets, we hypothesize that the realization of a financial peace dividend may depend on analogous market governance structures. Listed equities on the CSX—predominantly commercial banks, telecommunication operators, and port infrastructure—operate within formal regulatory frameworks overseen by the Securities and Exchange Regulator of Cambodia (SERC). We hypothesize that, compared to uncertified rural real assets, the formal regulatory framework of Cambodia’s public equities potentially offers a higher-accountability institutional environment, a condition theoretically necessary to constrain elite capture and cushion listed firms from arbitrary asset reallocation during post-conflict recovery.
This highly regulated corporate environment operated alongside a broader post-conflict landscape characterized by strict international oversight. For example, Cambodia’s commitments under the Ottawa Convention forced authorities to submit to transparent verification regarding border demining (Phnom Penh Post, 2025). Furthermore, recovery funding was heavily tied to international donor standards, such as the AUD 1.5 million border-recovery pact governed by the Australian Government and the UNDP (UNDP, 2026; Khmer Times, 2026a). While our aggregate index data cannot isolate the direct causal impact of these specific programs on equity prices, they effectively illustrate the presence of the international accountability structures that Borbely et al. (2026) identify as necessary for safeguarding post-conflict economic surpluses from elite capture.
Furthermore, our finding of a rapid +34.93% medium-horizon BHAR rebound on the CSX between January and August 2026 is highly congruent with multi-disciplinary empirical evidence and contemporary economic reporting showing that Cambodia adjusts swiftly to external geopolitical disruptions. In the international trade domain, Yarrow and Kenh (2026) document that when the 2025 border conflict disrupted overland Thai supply chains, Cambodian industries rapidly substituted toward Chinese and Vietnamese intermediate inputs—with electrical equipment imports from China rising 66% year-on-year—while commercial banks maintained profitability and credit stability. Similarly, macroeconomic records from the first eight months of 2026 confirm a 19.2% year-on-year surge in Cambodian merchandise exports and a 15% expansion in foreign direct investment inflows, pushing total trade volume past $44 billion by July 2026 (World Bank, 2026; Khmer Times, 2026b). Crucially, contemporary business reports highlight that land border closures prompted a rapid logistics pivot toward maritime and river corridors handled directly by CSX-listed port operators—Sihanoukville Autonomous Port (PAS) and Phnom Penh Autonomous Port (PPAP), the latter achieving 54% of its annual revenue target in the first half of 2026—contributing alongside commercial banking (ABC) and telecommunications (CGSM) to a rebound in total CSX market capitalization to $3.1 billion by August 2026 (Khmer Times, 2026c, 2026d). Thus, while aggregate equity returns do not directly isolate rural governance mechanisms, the rapid recovery observed on the CSX aligns closely with independent evidence of post-shock resilience across Cambodia’s real economy.
Crucially, we decouple our core empirical finding—robust medium-horizon abnormal equity performance (+34.93% BHAR, or +27.88% unadjusted BHR relative to a −7.04% historical baseline expectation)—from a definitive causal test of institutional governance. Because an aggregate single-index event study cannot econometrically separate the valuation effects of SERC regulatory oversight or international demining verification from concurrent macroeconomic covariates—including supply-chain re-routing toward maritime ports (Yarrow & Kenh, 2026), surging export and foreign direct investment inflows (World Bank, 2026; Khmer Times, 2026b, 2026c, 2026d), domestic monetary conditions, and ongoing bilateral diplomatic negotiations—we advance the ‘peace dividend’ and Borbely et al. (2026) accountability framework strictly as a plausible conceptual interpretation that complements real-economy adaptation and motivates future micro-level research.
6.4. Practical Policy Implications for Frontier Regulators
These empirical and microstructural insights offer several grounded, actionable policy considerations for financial regulators (such as the Securities and Exchange Regulator of Cambodia, SERC), exchange operators, and economic policymakers in frontier and emerging markets:
- Structured Disclosure Protocols During Security Crises: Regulators and listed companies should recognize that unverified diplomatic leaks or opaque geopolitical rumors exacerbate informational asymmetries and induce multi-day downward price drift, as evidenced by the four-day consecutive sell-off following the June 2025 phone leak. Frontier exchanges should institutionalize structured crisis-disclosure protocols—such as mandatory, time-sensitive operational and supply-chain status updates from listed infrastructure, banking, and telecommunications issuers (PAS, PPAP, ABC, and CGSM), alongside rapid regulatory fact-checking bulletins—to convert ambiguous “soft” rumors into verified public information and curb uncertainty-driven sell-offs.
- Liquidity Provision and Designated Market Makers: Because high-visibility physical shocks trigger abrupt, concentrated Day-0 sell orders whereas ambiguous shocks generate prolonged multi-day order imbalances, nascent exchanges with thin, retail-dominated order books are vulnerable to acute liquidity evaporation. Frontier regulators and exchange operators should strengthen institutional liquidity provision mechanisms—specifically by licensing and incentivizing designated market makers (liquidity providers) with calibrated bid–ask spread obligations, fee rebates, and temporary crisis-period capital buffers—to absorb transitory panic-selling on Day 0 and stabilize order-book depth without resorting to counterproductive exchange-wide trading halts.
- Multi-Day Market Monitoring and Return Persistence: Our empirical diagnostics clarify how aggregate return dynamics on the Cambodia Securities Exchange should be interpreted in policy and risk assessments. The summary statistics confirm that the aggregate CSX Index is not subject to exchange-wide non-trading sessions (0% zero-volume days and 0.22% flat-index closes), indicating that artificial zero returns at the aggregate-index level are negligible. At the same time, because individual constituents may still experience nonsynchronous trading and retain stale prices on sessions when the broader index moves, daily CSX Index returns exhibit moderate positive first-order autocorrelation (ACF(1) = +0.2535), which is accounted for by the autoregressive parameter ρ1 in our state-space specification. From a practical standpoint, this positive return persistence implies that aggregate market adjustments on the CSX unfold across multiple consecutive trading sessions rather than entirely within a single day. Accordingly, regulatory market monitoring, circuit-breaker calibration, and event-impact assessments on the CSX benefit from evaluating multi-day cumulative abnormal return (CAR) windows while controlling for baseline serial persistence (ρ1), rather than relying solely on single-day index movements.
- Institutional Infrastructure for Long-Term Growth: Policymakers aiming to leverage capital markets for economic resilience should prioritize formal institutional governance. Transparent financial reporting, secure property rights, and regulatory enforcement are essential to ensuring that macro-level peace stabilization translates into sustained investor confidence and capital accumulation.
6.5. Limitations and Avenues for Future Research
- Several methodological and structural limitations must be candidly acknowledged when interpreting our findings. First, our empirical analysis is constrained by the small cross-section of listed firms and the severe informational inefficiency characteristic of nascent stock exchanges, where it frequently takes longer for asset prices to fully reveal new information (Lim & Brooks, 2011; Khanthavit, 2022). With only nine equities listed on the CSX Main Board during the conflict and recovery horizons, the aggregate index is heavily concentrated in banking, telecommunications, and port infrastructure, and cross-sectional firm-level regressions lack statistical power. While state-space AR(1) filtering (Section 4.1) accommodates parameter instability and helps control for autocorrelated price drift, caution should be exercised when generalizing these findings to larger, more diversified emerging or developed financial markets.
- Second, we emphasize the exploratory nature of our three-event typology and the overlapping event windows inherent to multi-horizon time-series designs in a single market. In our short-run analysis, although our 11-day (±5 trading days) event windows are strictly non-overlapping on the trading calendar and anchored to a clean pre-crisis estimation baseline ending 31 March 2025 via h-step state propagation, our empirical comparison is based on three sequential episodes within a single evolving geopolitical conflict (two physical skirmishes in May and July and one diplomatic leak in June). Because investor learning across sequential phases cannot be entirely ruled out, our short-horizon findings represent an exploratory case investigation of signal visibility rather than a definitive, large-sample test of universal asset-pricing laws. In our medium-run analysis, constructing the historical empirical placebo distribution () over a four-year baseline requires rolling 164-day windows that exhibit substantial serial overlap (sharing up to 163 trading days). Although we mitigate this overlap by refraining from parametric or permutation p-value claims and verifying our findings against strictly non-overlapping 164-day historical blocks (0/6 exceedances) and constant-composition sub-periods, rolling-window benchmarks remain descriptive historical comparisons rather than independent statistical draws.
- Third, while our BHAR results document substantial medium-horizon benchmark outperformance post-resolution (+34.93% model-adjusted BHAR, reflecting a +27.88% raw return against a −7.04% historical baseline drift), this study evaluates aggregate stock market returns in the presence of unobserved macroeconomic variables rather than firm-level accounting performance or micro-level real economic panel data. Because our empirical design does not explicitly control for contemporaneous 2026 macroeconomic covariates—such as monetary policy and interest rate shifts, foreign direct investment inflows, bilateral trade re-routing, or ongoing diplomatic negotiations—nor directly measure elite capture, commune-level demining, or regulatory enforcement quality, we decouple the empirical finding of medium-horizon valuation recovery from causal institutional claims. Accordingly, the “peace dividend” and “elite capture” paradigms (Borbely et al., 2026), alongside trade-diversion channels (Yarrow & Kenh, 2026), serve as plausible conceptual interpretations and motivating frameworks for future empirical inquiry rather than isolated causal mechanisms.
- Crucially, however, our finding that the CSX experienced a rapid, substantial valuation recovery (+34.93% BHAR) over the eight-month post-conflict window in 2026 is not an isolated empirical anomaly; rather, it is congruent with a growing body of multi-disciplinary evidence documenting Cambodia’s capacity to rapidly adjust and recover from geopolitical and conflict shocks. In spatial development economics, Borbely et al. (2026) demonstrate that when institutional accountability constrains elite capture, post-conflict landmine clearance in Cambodia generates rapid local economic gains, including a 7.3 percentage point rise in nightlight luminosity and a 22% expansion in household consumption. Similarly, in international trade and macroeconomic policy, Yarrow and Kenh (2026) and contemporary trade reports (Khmer Times, 2026b, 2026c, 2026d; World Bank, 2026) document that following the 2025 Thai border closures, Cambodian industries rapidly pivoted supply chains toward alternative regional partners (such as Vietnam and China) and re-routed cargo through maritime and river ports—directly supporting the operational recovery of key CSX-listed logistics, banking, and telecommunications pillars (such as Sihanoukville Autonomous Port, Phnom Penh Autonomous Port, ACLEDA Bank, and CAMGSM).
- Because independent evidence from spatial development economics, international trade, and financial econometrics converges on this pattern of rapid post-shock adjustment, a major contribution for future research lies in formally modeling and testing the empirical transmission channels connecting these domains. Specifically, we highlight five promising avenues for future interdisciplinary inquiry:
- Spatial Credit Transmission and Commune-Level Accountability: Researchers could merge Borbely et al.’s (2026) commune-level accountability and land-titling indicators with geocoded branch-level loan disbursement, non-performing loan (NPL) ratios, and deposit data from CSX-listed commercial banks (such as ACLEDA Bank, ABC). Such analysis could test whether post-conflict credit expansion and loan repayment recover more rapidly in high-accountability border communes insulated from elite capture and how regional credit stabilization feeds into bank equity valuations.
- Trade-Corridor Diversion and Listed Infrastructure Performance: Building on Yarrow and Kenh (2026), future studies could link high-frequency customs manifest data and container throughput at CSX-listed maritime and river ports (PAS and PPAP) and special economic zones (PPSEZ) with quarterly corporate earnings and daily stock returns. This would quantify how physical supply-chain re-routing away from closed land borders translates into abnormal equity returns and fundamental cash-flow recovery.
- International Donor Oversight and Sub-National Corporate Activity: Scholars could evaluate the spatial rollout of post-2025 border recovery and demining initiatives—such as the AUD 1.5 million Australia–UNDP border recovery agreement (UNDP, 2026; Khmer Times, 2026a)—by combining satellite nightlights with localized telecommunications traffic (e.g., CGSM) and formal business registrations to test whether international verification standards curb extractive land concessions and stimulate formal corporate revenue in border provinces.
- Comparative Corporate Governance Across Frontier Exchanges: Extending this dual-horizon methodology and Borbely et al.’s (2026) accountability framework to comparative corporate finance, future work could construct firm-level governance, ownership concentration, and disclosure transparency indices across ASEAN frontier markets (including the CSX, the Lao Securities Exchange, and the Yangon Stock Exchange in Myanmar) to test whether stronger regulatory enforcement systematically dampens geopolitical crash severity and accelerates post-conflict valuation recovery.
- Microstructural Order Flow and Geopolitical Text Analytics: Finally, future studies could pair natural language processing (NLP) measures of news ambiguity in local Khmer and Thai media with high-frequency, account-level CSX order-flow data (distinguishing between domestic retail, domestic institutional, and foreign investors) to trace the micro-level behavioral dynamics during information leaks and illuminate how specific investor clienteles process soft diplomatic rumors versus hard military shocks.
Author Contributions
Conceptualization, B.C. and L.T.; methodology, L.T.; software, L.T.; validation, B.C., L.T. and S.O.Y.; formal analysis, L.T.; investigation, B.C. and S.O.Y.; data curation, L.T.; writing—original draft preparation, L.T.; writing—review and editing, B.C. and S.O.Y.; supervision, B.C. All authors have read and agreed to the published version of the manuscript.
Funding
This research received no external funding.
Institutional Review Board Statement
Not applicable.
Informed Consent Statement
Not applicable.
Data Availability Statement
The data supporting the reported results are available from the official Cambodia Securities Exchange (CSX) website at https://csx.com.kh and from public sources cited in this manuscript. Accessed on 1 September 2026.
Conflicts of Interest
The authors declare no conflicts of interest.
References
- Al Shawawreh, F. K. (2023). Reassessing the long-run abnormal performance of Jordanian IPOs: An event study approach. Foundations of Management, 15(1), 141–160. [Google Scholar] [CrossRef] [Scilit]
- Amihud, Y. (2002). Illiquidity and stock returns: Cross-section and time-series effects. Journal of Financial Markets, 5(1), 31–56. [Google Scholar] [CrossRef] [Scilit]
- Barber, B. M., & Lyon, J. D. (1997). Detecting long-run abnormal stock returns: The empirical power and specification of test statistics. Journal of Financial Economics, 43(3), 341–372. [Google Scholar] [CrossRef] [Scilit]
- Barber, B. M., & Odean, T. (2008). All that glitters: The effect of attention and news on the buying behavior of individual and institutional investors. The Review of Financial Studies, 21(2), 785–818. [Google Scholar] [CrossRef] [Scilit]
- Bekaert, G., Harvey, C. R., & Lundblad, C. (2007). Liquidity and expected returns: Lessons from emerging markets. The Review of Financial Studies, 20(6), 1783–1831. [Google Scholar] [CrossRef] [Scilit]
- Binder, J. J. (1985). On the use of the multivariate regression model in event studies. Journal of Accounting Research, 23(1), 370–383. [Google Scholar] [CrossRef] [Scilit]
- Bong, C. (2026). The 2025 Cambodia-Thailand border conflict: A Cambodian perspective. Asia Policy, 21(2), 24–37. [Google Scholar] [CrossRef] [Scilit]
- Borbely, D., Bühler, M., Mueller, J., & Norris, J. (2026). Political accountability and the returns to peace [Unpublished manuscript]. Department of Economics, Queen’s University Belfast and University of Strathclyde. Available online: https://www.jorismueller.com/files/cambodia_latest_draft.pdf (accessed on 21 October 2026).
- Boungou, W., & Yatié, A. (2022). The impact of the Ukraine–Russia war on world stock market returns. Economics Letters, 215, 110516. [Google Scholar] [CrossRef] [Scilit]
- Box, G. E. P., & Tiao, G. C. (1975). Intervention analysis with applications to economic and environmental problems. Journal of the American Statistical Association, 70(349), 70–79. [Google Scholar] [CrossRef]
- Brown, S. J., & Warner, J. B. (1980). Measuring security price performance. Journal of Financial Economics, 8(3), 205–258. [Google Scholar] [CrossRef] [Scilit]
- Brown, S. J., & Warner, J. B. (1985). Using daily stock returns: The case of event studies. Journal of Financial Economics, 14(1), 3–31. [Google Scholar] [CrossRef] [Scilit]
- Campbell, J. Y., Lo, A. W., & MacKinlay, A. C. (1997). The econometrics of financial markets. Princeton University Press. [Google Scholar]
- Chachavalpongpun, P. (2010). Temple of doom: Hysteria on the Thai-Cambodian border. Institute of Southeast Asian Studies. [Google Scholar]
- Co, N. D., Vuong, L. B., Tan, T. T., & Binh, N. T. (2025). Cooperation in border areas among some Southeast Asian mainland countries: A case study of the Cambodia-Laos-Vietnam development triangle. Cogent Arts & Humanities, 12(1), 2463203. [Google Scholar] [CrossRef] [Scilit]
- Deth, S. U. (Ed.). (2025). Cambodia’s foreign relations in regional and global contexts (2nd ed.). Konrad-Adenauer-Stiftung Cambodia. [Google Scholar]
- Engelberg, J. (2008). Costly information processing: Evidence from earnings announcements [Unpublished manuscript]. Kellogg School of Management, Northwestern University. [Google Scholar] [CrossRef] [Scilit]
- Epstein, L. G., & Schneider, M. (2008). Ambiguity, information quality, and asset pricing. The Journal of Finance, 63(1), 197–228. [Google Scholar] [CrossRef] [Scilit]
- Fama, E. F. (1970). Efficient capital markets: A review of theory and empirical work. The Journal of Finance, 25(2), 383–417. [Google Scholar] [CrossRef] [Scilit]
- Fama, E. F. (1998). Market efficiency, long-term returns, and behavioral finance. Journal of Financial Economics, 49(3), 283–306. [Google Scholar] [CrossRef] [Scilit]
- Federle, J., Meier, A., Müller, G. J., & Sehn, V. (2022). Proximity to war: The stock market response to the Russian invasion of Ukraine (CEPR Discussion Paper No. DP17185). Centre for Economic Policy Research. Available online: https://ideas.repec.org/p/cpr/ceprdp/17185.html (accessed on 21 October 2026).
- Gelbach, J. B., Helland, E., & Klick, J. (2013). Valid inference in single-firm, single-event studies. American Law and Economics Review, 15(2), 495–541. [Google Scholar] [CrossRef] [Scilit]
- Guidolin, M., & La Ferrara, E. (2007). Diamonds are forever, wars are not: Is conflict bad for private firms? American Economic Review, 97(5), 1978–1993. [Google Scholar] [CrossRef] [Scilit]
- Hamilton, J. D. (1994). Time series analysis. Princeton University Press. [Google Scholar]
- Harvey, A. C. (1989). Forecasting, structural time series models and the Kalman filter. Cambridge University Press. [Google Scholar]
- Harvey, A. C. (1990). The econometric analysis of time series (2nd ed.). MIT Press. [Google Scholar]
- Hong, H., & Stein, J. C. (1999). A unified theory of underreaction, momentum trading, and overreaction in asset markets. The Journal of Finance, 54(6), 2143–2184. [Google Scholar] [CrossRef] [Scilit]
- Karafiath, I. (1988). Using dummy variables in the event methodology. The Financial Review, 23(3), 351–357. [Google Scholar] [CrossRef] [Scilit]
- Khanthavit, A. (2021). A Kalman filtering approach to event study analysis when performance variables are nonstationary. Thailand Statistician, 19(1), 178–194. [Google Scholar]
- Khanthavit, A. (2022). The effects of Myanmar’s 2020 general election and 2021 military coup on stock market returns. Thailand and The World Economy, 40(3), 1–14. [Google Scholar]
- Khmer Times. (2026a, June 9). Australia and UNDP pledge AUD 1.5 million for border mine clearance and recovery. The Khmer Times. Available online: https://www.khmertimeskh.com/ (accessed on 21 October 2026).
- Khmer Times. (2026b, August 11). Kingdom’s trade reaches $44B in 7 months. The Khmer Times. Available online: https://www.khmertimeskh.com/501995152/kingdoms-trade-reaches-44b-in-7-months/ (accessed on 21 October 2026).
- Khmer Times. (2026c, August 25). CSX market capitalisation rises to $3.1B as index rebounds. The Khmer Times. Available online: https://www.khmertimeskh.com/502011415/csx-market-capitalisation-rises-to-3-1b-as-index-rebounds/ (accessed on 21 October 2026).
- Khmer Times. (2026d, August 31). PPAP hits 54% of 2026 revenue target in H1. The Khmer Times. Available online: https://www.khmertimeskh.com/502014893/ppap-hits-54-of-2026-revenue-target-in-h1/ (accessed on 21 October 2026).
- Kohpaiboon, A. (2026). The economic fallout from the Thailand-Cambodia border conflict. Fulcrum (ISEAS—Yusof Ishak Institute). Available online: https://fulcrum.sg/article/commentaries/the-economic-fallout-from-the-thailand-cambodia-border-conflict/ (accessed on 21 October 2026).
- Kothari, S. P., & Warner, J. B. (1997). Measuring long-horizon security price performance. Journal of Financial Economics, 43(3), 301–339. [Google Scholar] [CrossRef] [Scilit]
- Ledwani, S., Chakraborty, S., & Shenoy, S. S. (2021). Spatial tale of G-7 and BRICS stock markets during COVID-19: An event study. Investment Management and Financial Innovations, 18(2), 20–36. [Google Scholar] [CrossRef] [Scilit] [PubMed]
- Lee, Y., & Yoo, J. (2020). Does peace boost stock prices? Evidence from the Korean stock market. Finance Research Letters, 34, 101262. [Google Scholar] [CrossRef] [Scilit]
- Lim, K. P., & Brooks, R. (2011). The evolution of stock market efficiency over time: A survey of the empirical literature. Journal of Economic Surveys, 25(1), 69–108. [Google Scholar] [CrossRef] [Scilit]
- Lyon, J. D., Barber, B. M., & Tsai, C.-L. (1999). Improved methods for tests of long-run abnormal stock returns. The Journal of Finance, 54(1), 165–201. [Google Scholar] [CrossRef] [Scilit]
- MacKinlay, A. C. (1997). Event studies in economics and finance. Journal of Economic Literature, 35(1), 13–39. [Google Scholar]
- O’Hara, M. (2000). Overview: Market structure issues in market liquidity. Bank for International Settlements (BIS) Papers, 2, 1–8. [Google Scholar]
- Petersen, M. A. (2004). Information: Hard and soft [Unpublished manuscript]. Kellogg School of Management, Northwestern University. Available online: https://www.researchgate.net/profile/Mitchell-Petersen-3/publication/314679167_Hard_and_Soft_Information/data/58c46aca92851c0ccbf7f0d5/Hard-and-Soft-Information.pdf (accessed on 21 October 2026).
- Phnom Penh Post. (2025, December 15). CMAA defends Cambodia’s mine clearance record at Geneva convention. The Phnom Penh Post. Available online: https://www.phnompenhpost.com/ (accessed on 21 October 2026).
- Politis, D. N., & Romano, J. P. (1994). The stationary bootstrap. Journal of the American Statistical Association, 89(428), 1303–1313. [Google Scholar] [CrossRef]
- Politis, D. N., Romano, J. P., & Wolf, M. (1999). Subsampling. Springer. [Google Scholar] [CrossRef] [Scilit]
- Reuters. (2025, December 27). Cambodia and Thailand agree to new ceasefire following border clashes. Reuters. Available online: https://www.reuters.com/ (accessed on 21 October 2026).
- Said, B., Raza, M. W., & Elshahat, A. (2024). Does market microstructure affect time-varying efficiency? Evidence from emerging markets. Research in International Business and Finance, 70, 102347. [Google Scholar] [CrossRef] [Scilit]
- Salinger, M. (1992). Standard errors in event studies. Journal of Financial and Quantitative Analysis, 27(1), 39–53. [Google Scholar] [CrossRef] [Scilit]
- Setthikun, S. (2026). Small-state nation branding under crisis: Cambodia’s legitimacy narratives during the Cambodia-Thailand border conflict [Master’s thesis, Lund University]. Available online: https://lup.lub.lu.se/student-papers/record/9242618 (accessed on 21 October 2026).
- Sithirith, M., & Bunthorn, K. (2026). The transnational geo-body of the Cambodian–Thai border conflicts: Symbolic geopolitics, nationalism and externalisation of domestic securities. CDRI Working Paper Series No. 157. Cambodia Development Resource Institute. [Google Scholar] [CrossRef] [Scilit]
- UNDP (United Nations Development Programme). (2026, June 8). Joint press release: Australia and UNDP sign contribution agreement to support recovery and mine action in Cambodia’s border-affected communities. UNDP Cambodia. Available online: https://www.undp.org/cambodia (accessed on 21 October 2026).
- Winichakul, T. (1994). Siam mapped: A history of the geo-body of a nation. University of Hawaii Press. [Google Scholar]
- Wisaijorn, T. (2026). The Thai–Cambodian border in international relations: Constructing a third space in geopolitics. Journal of Current Southeast Asian Affairs, 45(1), 78–99. [Google Scholar] [CrossRef] [Scilit]
- World Bank. (2026). Cambodia economic update: Resilience amid external uncertainty. World Bank Group. Available online: https://www.worldbank.org/en/country/cambodia (accessed on 21 October 2026).
- Xu, Z. (2026). Border tension and online fraud cooperation in Thai-Cambodia relations (2021–2026): A security dilemma spillover perspective [Master’s thesis, Lund University]. Available online: https://lup.lub.lu.se/student-papers/record/9243497 (accessed on 21 October 2026).
- Yarrow, R., & Kenh, S. (2026). Cambodia’s economy before and after the 2025 border conflict. ISEAS Perspective, 2026(35), 1–14. [Google Scholar]
- Zaremba, A., Cakici, N., Demir, E., & Long, H. (2022). When bad news is good news: Geopolitical risk and the cross-section of emerging market stock returns. Journal of Financial Stability, 58, 100964. [Google Scholar] [CrossRef] [Scilit]
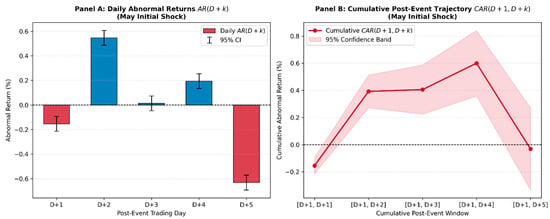
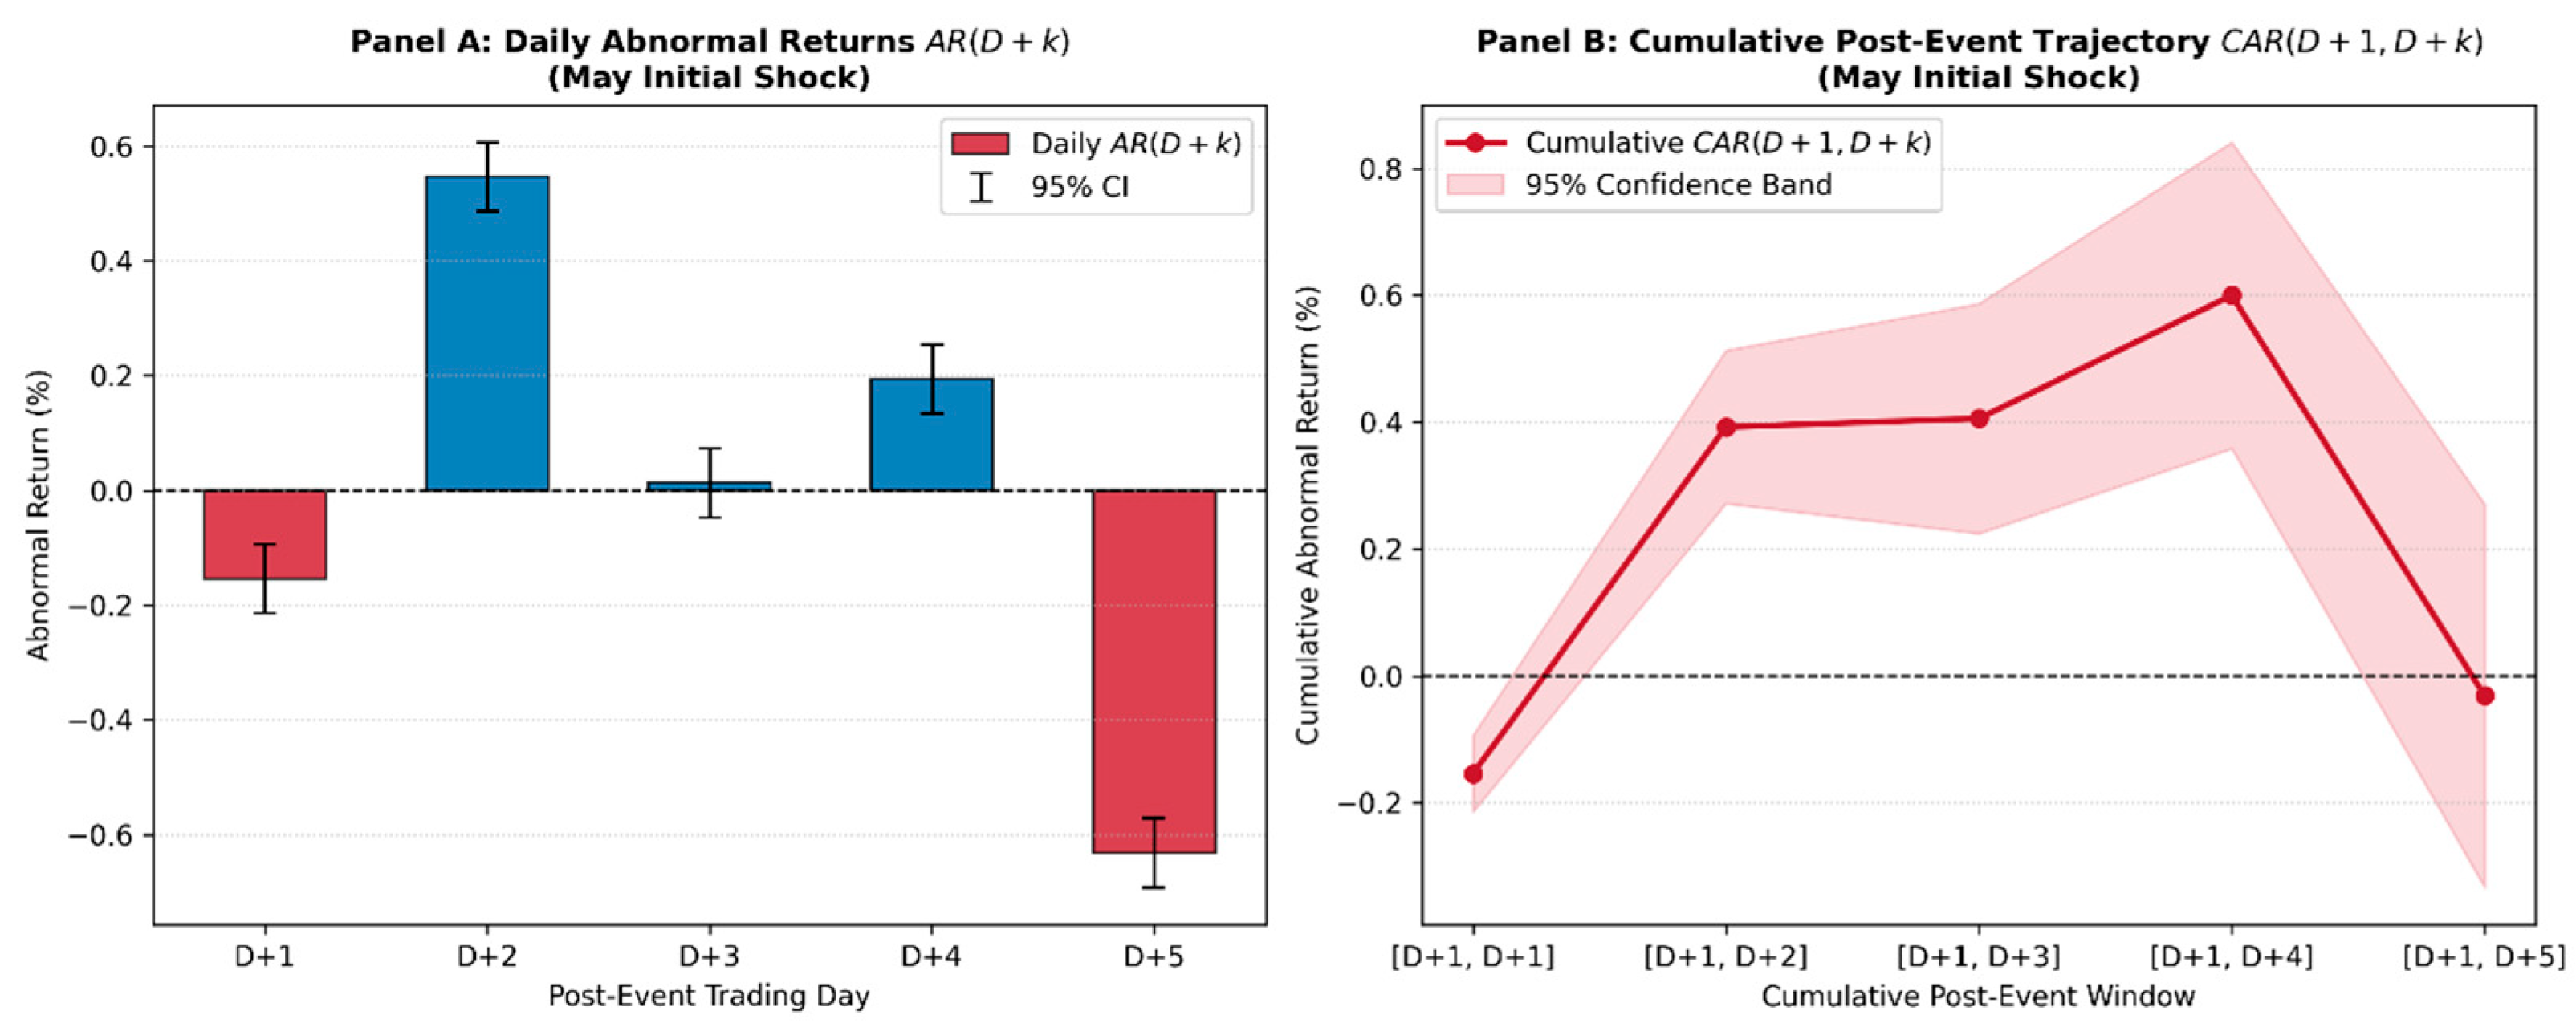
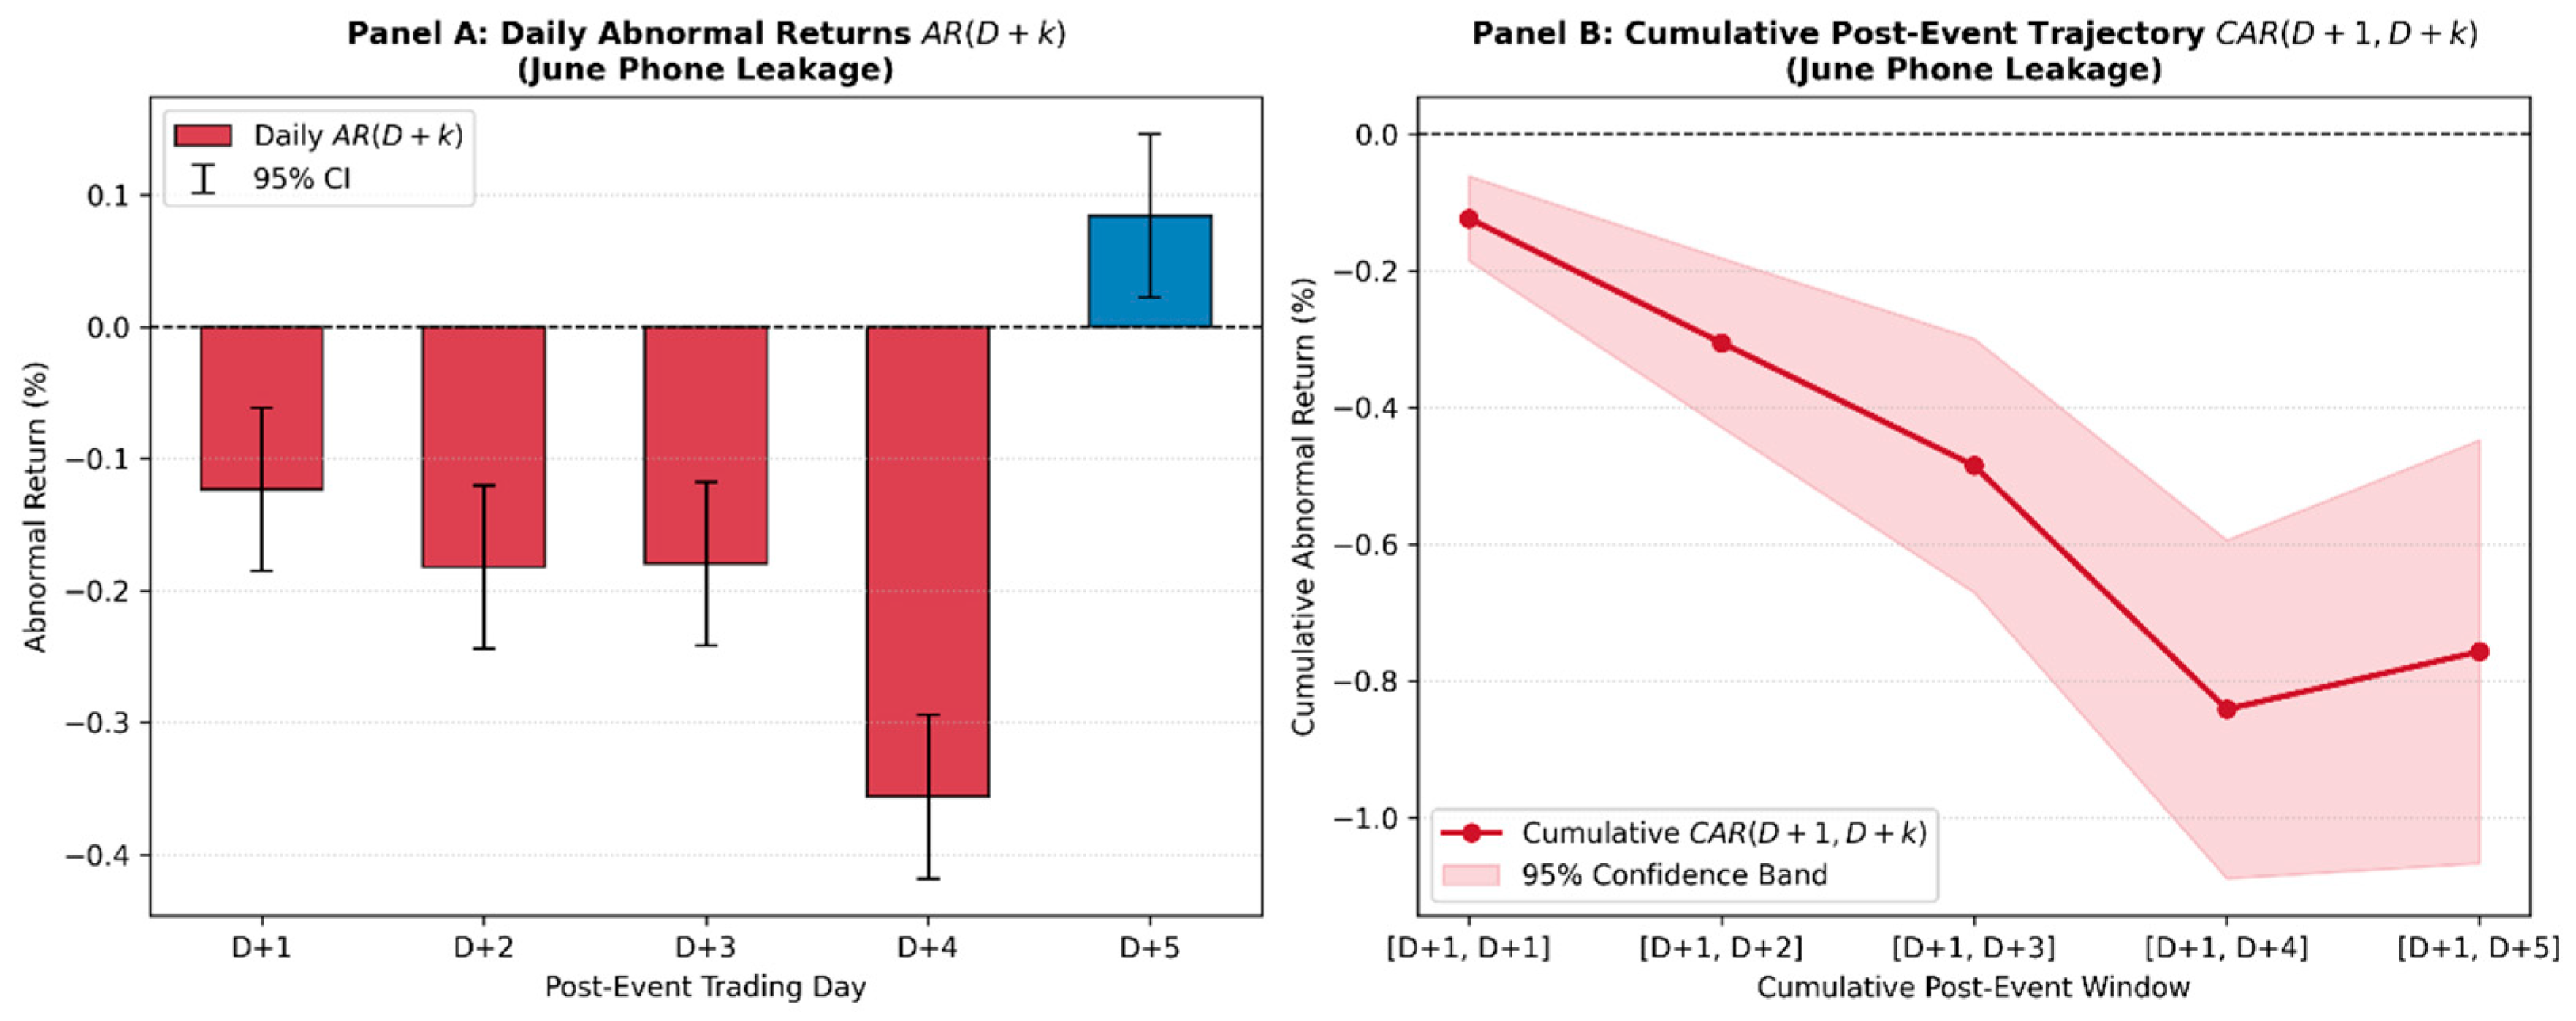
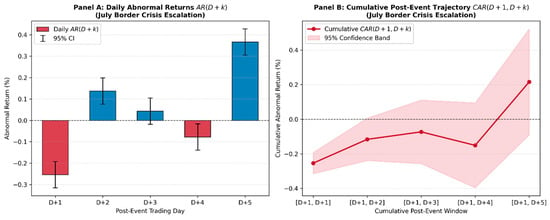
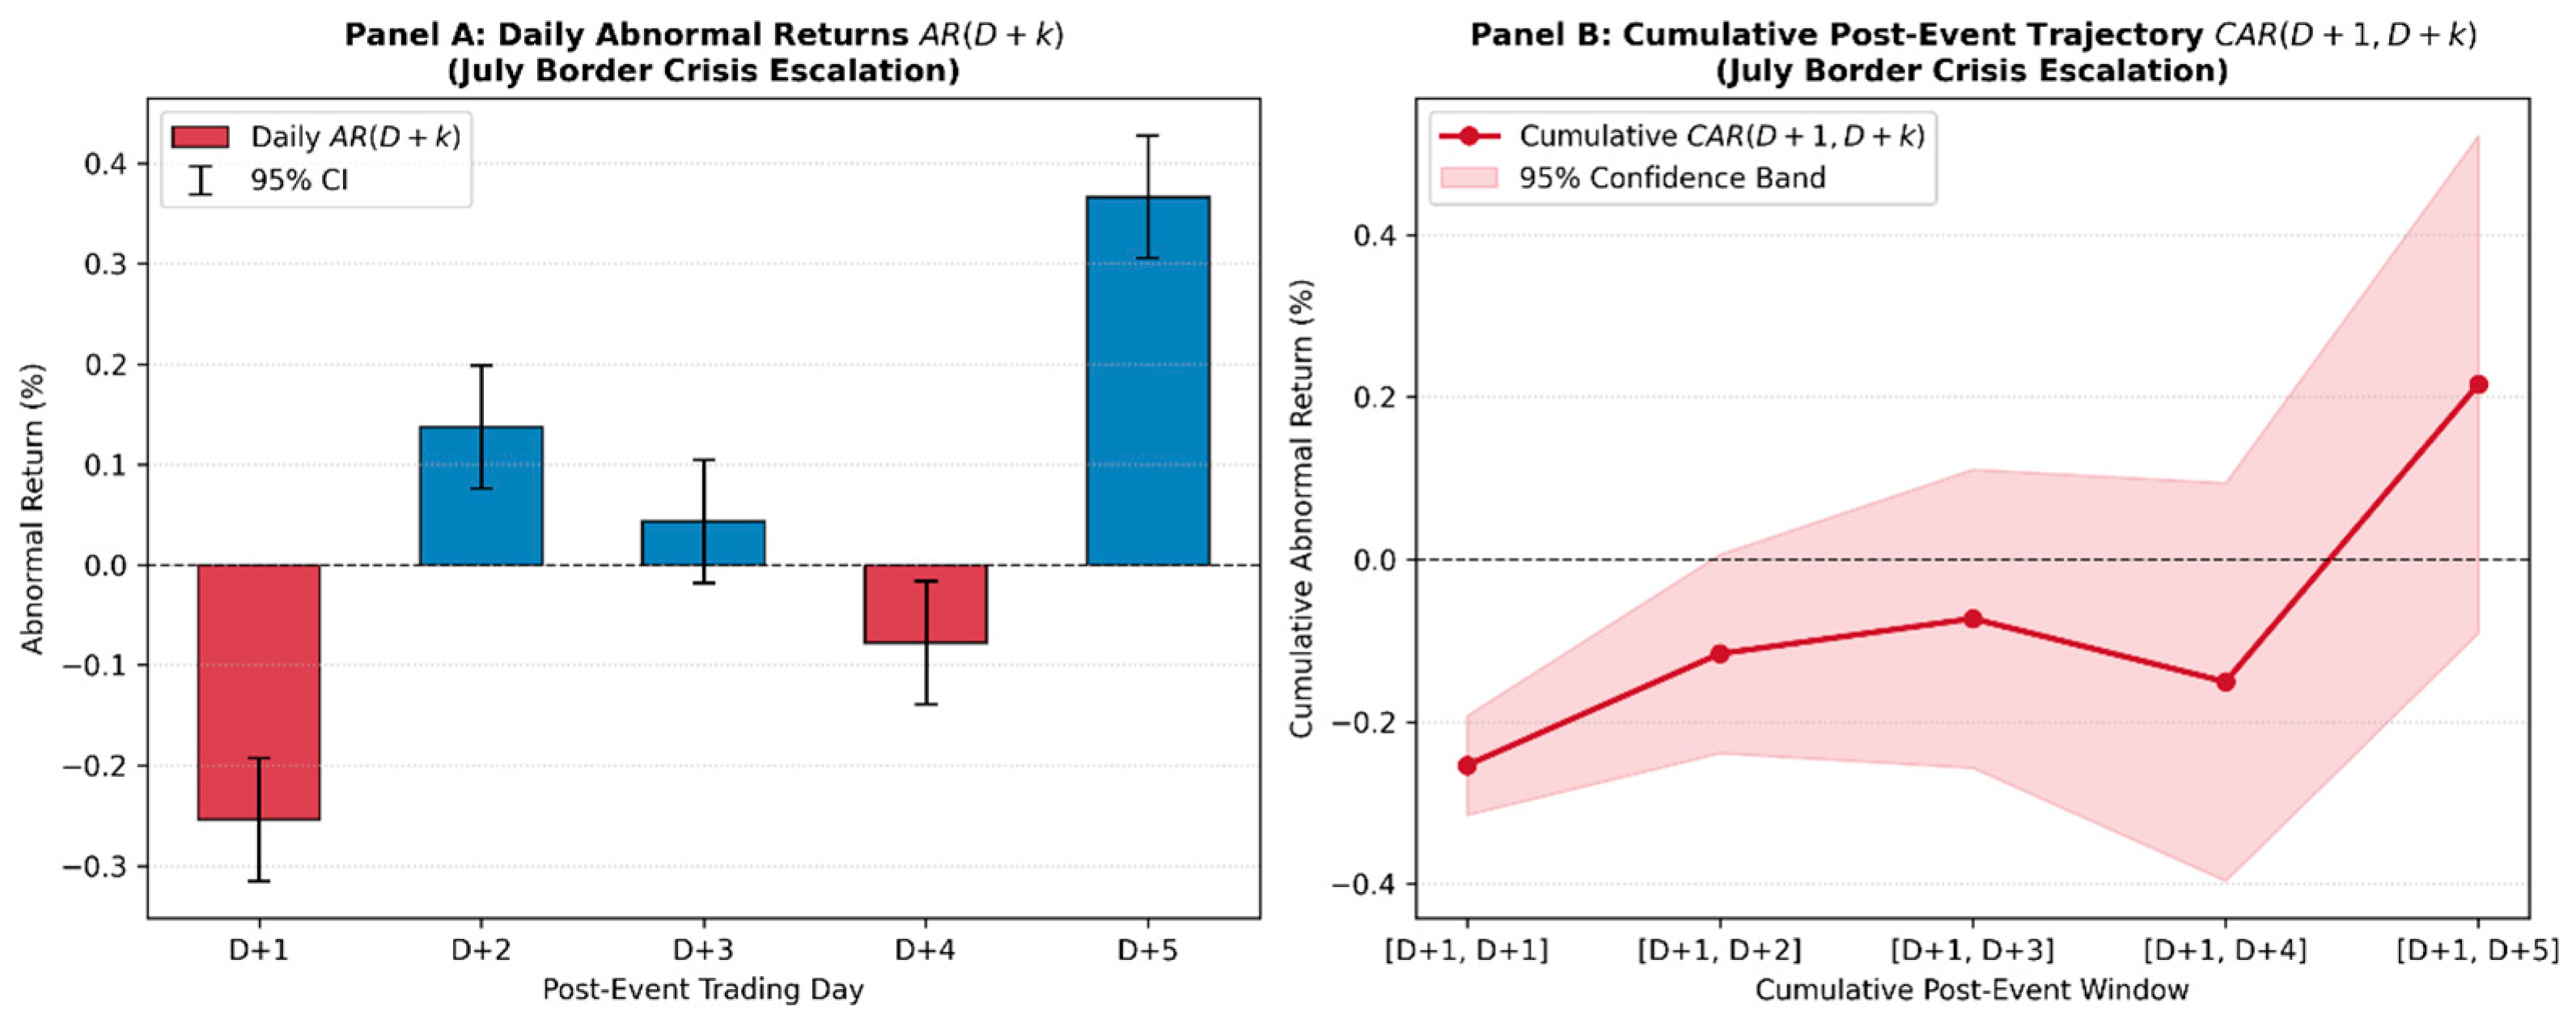
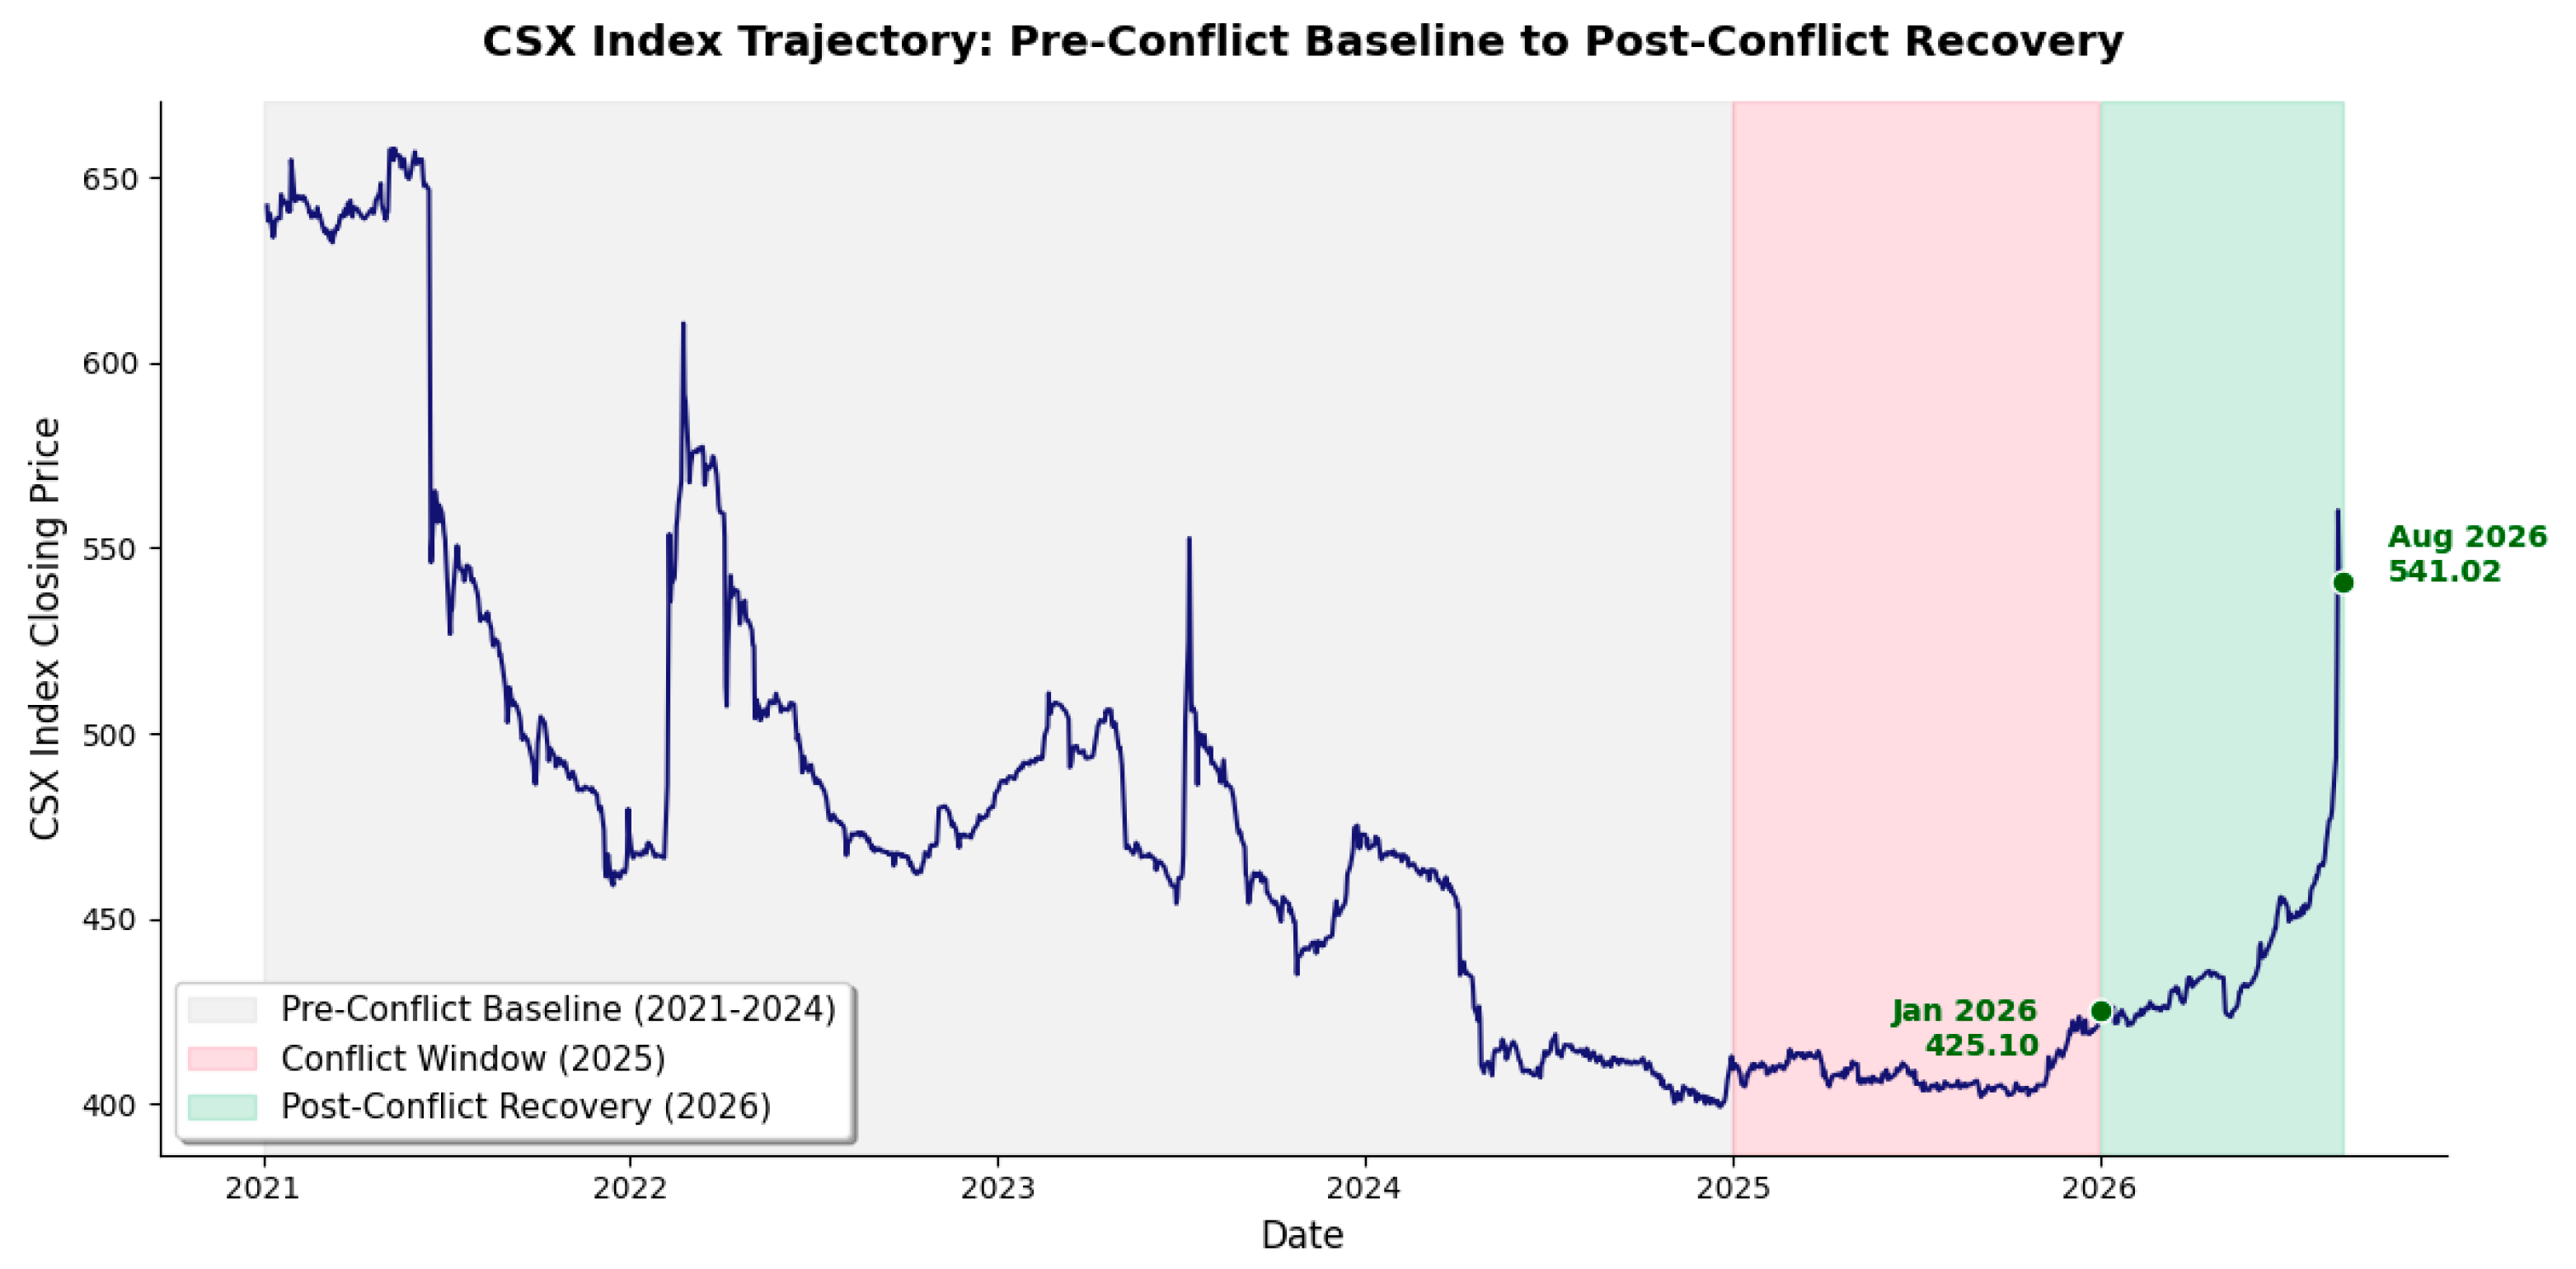
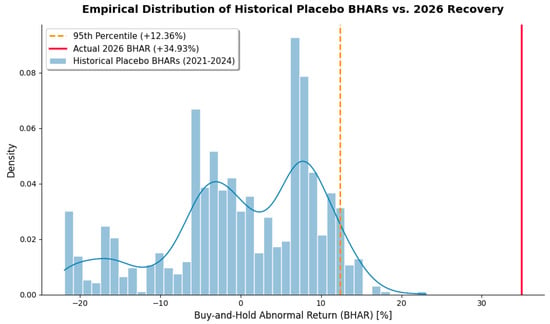
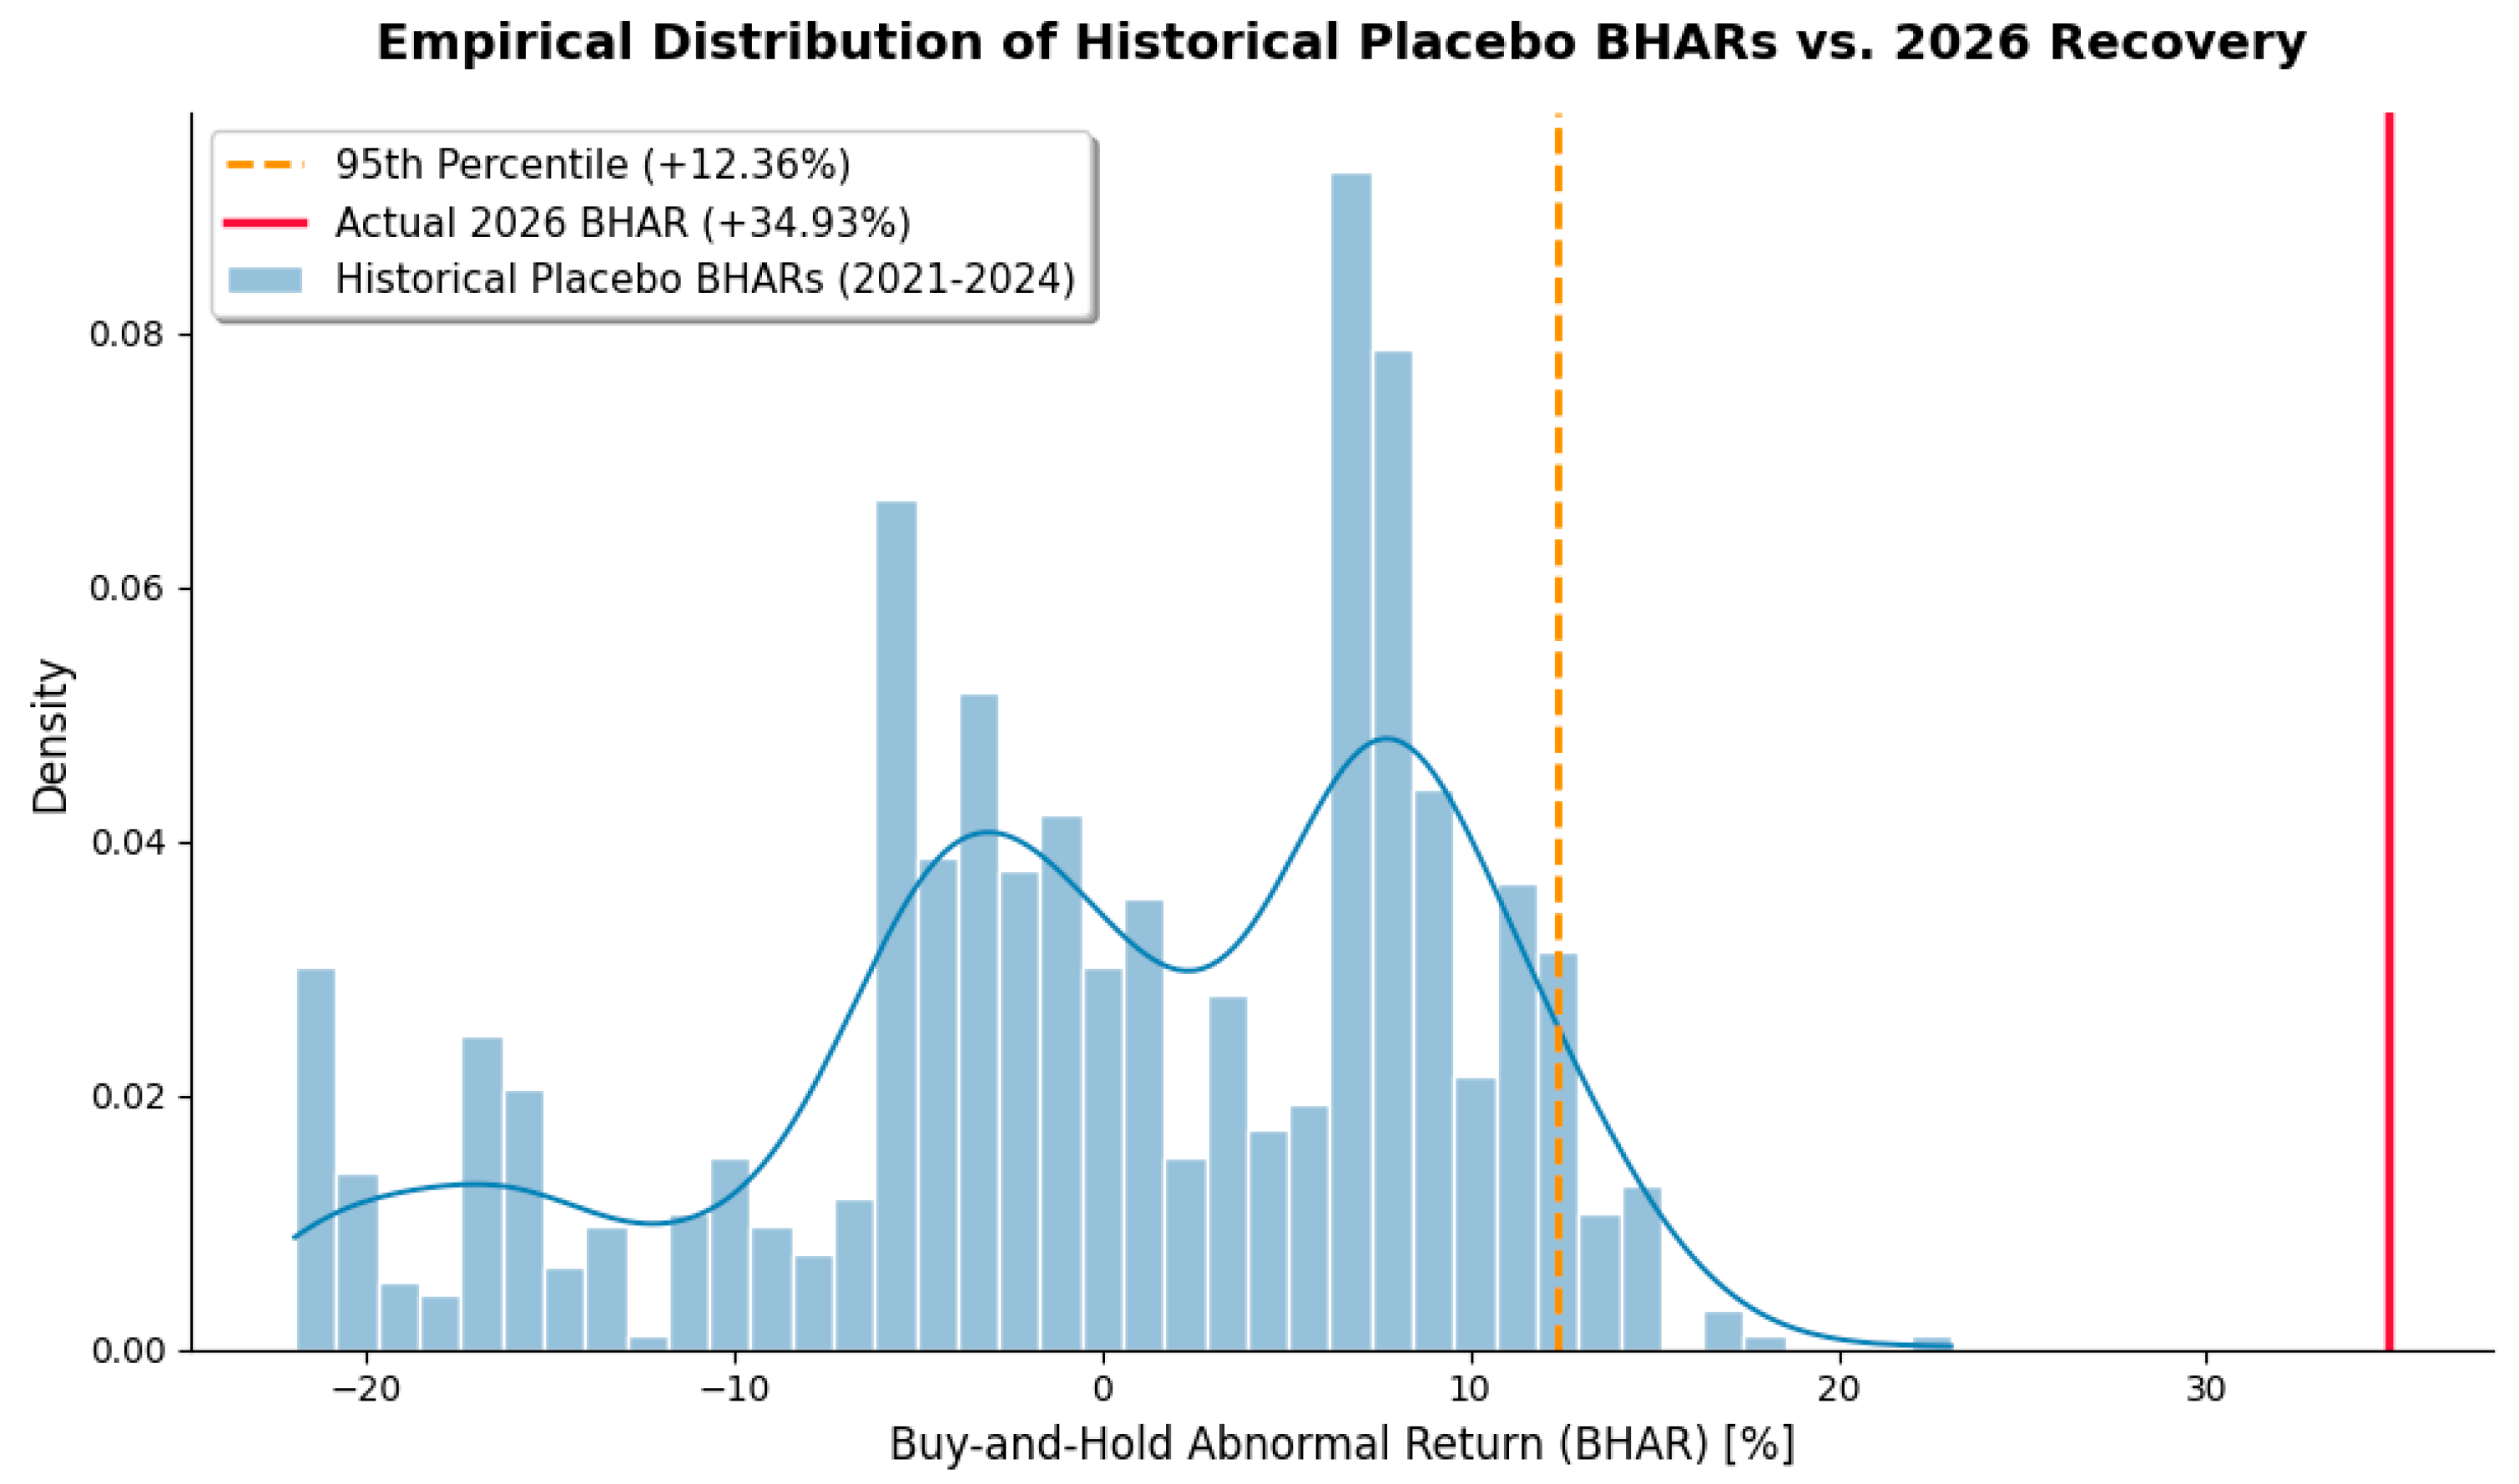

Disclaimer/Publisher’s Note: The statements, opinions and data contained in all publications are solely those of the individual author(s) and contributor(s) and not of MDPI and/or the editor(s). MDPI and/or the editor(s) disclaim responsibility for any injury to people or property resulting from any ideas, methods, instructions or products referred to in the content. |
© 2026 by the authors. Licensee MDPI, Basel, Switzerland. This article is an open access article distributed under the terms and conditions of the Creative Commons Attribution (CC BY) license.