


Abstract
Computer-assisted audit tools and techniques (CAATs) are central to audit digitalization, yet it remains unclear which system-quality attributes make their use successful, particularly in audit markets where spreadsheets still dominate. Drawing on the DeLone and McLean information systems (IS) success model and operationalizing system quality through the ISO/IEC 25010 standard, this study examines how usability, compatibility, reliability, and security shape successful CAATs use (auditors’ use of and satisfaction with CAATs) and, through it, audit benefits. Survey data from 289 auditors in Vietnamese audit firms were analyzed using partial least squares structural equation modeling. Usability and reliability are the only attributes with unique effects on successful use, whereas compatibility and security add no explanatory power beyond them. Successful use strongly increases audit benefits and transmits the effects of usability and reliability; usability also improves benefits directly. Theoretically, the findings show that system-quality attributes are not equally consequential: in a spreadsheet-dominated audit setting, some act as differentiating drivers of IS success, whereas others function as baseline requirements. Practically, audit firms, especially small firms staffed largely by junior auditors, should select easy-to-learn, dependable tools and pair technology investment with hands-on training and standardized CAAT procedures.
1. Introduction
The rapid spread of enterprise resource planning systems, cloud computing, big data, and artificial intelligence has changed how client entities generate and store financial information and, consequently, how auditors gather and evaluate evidence (Alles, 2015; Salijeni et al., 2019). As transaction volumes and data complexity grow, auditing technology has shifted from an option to a necessity (Braun & Davis, 2003; Tiberius & Hirth, 2019). Digital transformation is also reshaping the external audit’s role in corporate governance, as auditors increasingly rely on full-population testing and data analytics rather than on manual sampling alone (Manita et al., 2020).
Computer-assisted audit tools and techniques (CAATs) are central to this shift. They help auditors extract and analyze client data, assess risks, detect anomalies, and document audit evidence, improving productivity, the quality of professional judgment, and evidence reliability (Cao et al., 2015; Eilifsen et al., 2020; Lowe et al., 2018). Despite these benefits, adoption remains uneven. Auditors often use only the basic functions of generalized audit software, while advanced analytical features remain underutilized (Ahmi & Kent, 2013; H.-J. Kim et al., 2016; Mahzan & Lymer, 2014). In many developing economies, spreadsheets remain the dominant audit tool (Tarek et al., 2017; Widuri et al., 2016). This suggests that investment in technology does not automatically translate into successful use.
A large body of research explains CAATs adoption through behavioral acceptance models, notably the unified theory of acceptance and use of technology (UTAUT), emphasizing performance expectancy, effort expectancy, social influence, and facilitating conditions (Almagrashi et al., 2023; Alsarayrah & Ali, 2025; Atta et al., 2024; Fülöp et al., 2024). Other studies consider technological factors, but typically as broad or aggregated constructs (Al-Okaily et al., 2022; Lutfi & Alqudah, 2023).
Three limitations of this literature motivate the present study. First, studies grounded in TAM and UTAUT explain adoption through users’ expectations, how useful and how effortful a tool is expected to be, rather than through the properties of the tool itself; they therefore say little about which features vendors and audit firms should prioritize (Almagrashi et al., 2023; Alsarayrah & Ali, 2025). Second, studies that do consider technology typically measure it as a single “technological factor” or borrow innovation attributes such as relative advantage and complexity from diffusion theory (Lutfi & Alqudah, 2023; Pedrosa et al., 2020; Siew et al., 2020), which conflates distinct software properties and cannot reveal whether some attributes matter more than others. Third, most studies stop at intention or adoption and do not test whether use actually yields audit benefits, even though the IS success literature shows that the link from use to net benefits cannot be assumed (Petter et al., 2008). Findings are also inconsistent: ease of use drives CAATs use in some studies (Atta et al., 2024; H.-J. Kim et al., 2016) but not in others (Alsarayrah & Ali, 2025; Bin-Nashwan et al., 2025), suggesting that the importance of software attributes depends on who uses the tools and in what setting.
Two questions therefore remain insufficiently answered. First, when the quality of CAATs is decomposed into standardized system-quality attributes, which attributes carry unique explanatory weight for successful use, and which merely overlap with others? Second, does successful use actually translate into audit benefits, and does it transmit the effects of system quality to those benefits?
We address these questions in Vietnam, which offers an informative setting for three reasons. First, its audit market is structurally fragmented: audit firms operate under the Vietnamese Standards on Auditing and the Law on Independent Audit (National Assembly of Vietnam, 2011), and as of 29 February 2024, 221 firms were licensed to provide independent audit services, employing 2343 practicing auditors (Thoi bao Tai chinh Viet Nam, 2024). The upper segment of the market is concentrated: only 35 firms were approved to audit public-interest entities for 2026 (Ministry of Finance, 2025), and the four Big 4 member firms alone generated combined revenue of about VND 3.5 trillion in fiscal year 2025 (Vietstock, 2026). Most of the remaining firms are small and medium-sized domestic practices, consistent with the composition of our sample, in which 70.6% of respondents work in firms with 25 or fewer employees. Second, the demand side is changing quickly. The national digital transformation program (Prime Minister of Vietnam, 2020) and the roadmap for applying IFRS (Ministry of Finance, 2020) increase the volume and complexity of client data that auditors must process. Third, whereas Big 4 member firms deploy their networks’ proprietary audit platforms, domestic firms decide individually which tools to use and rely heavily on spreadsheets, so that variation in the perceived quality of CAATs is large and consequential. The combination of growing data demands, limited resources, and low technological maturity is shared by small audit firms in many emerging economies, but remains underrepresented in CAATs research, which has concentrated on internal auditors and on Middle Eastern settings. Evidence from Vietnam therefore speaks to this large population of small audit practices rather than to global audit networks.
This study addresses these gaps by integrating the DeLone and McLean (2003) information systems (IS) success model with the ISO/IEC 25010 software product quality model (International Organization for Standardization, 2011), which we use to operationalize system quality. Using survey data from 289 auditors in Vietnamese audit firms and partial least squares structural equation modeling (PLS-SEM), we test the effects of four system-quality characteristics—usability, compatibility, reliability, and security—on successful CAATs use, and the effect of successful use on audit benefits, including the mediating role of successful use.
The study makes three contributions. First, it shows that system-quality attributes are not equally consequential for IS success in auditing. Usability and reliability have unique effects on successful CAATs use, whereas compatibility and security, although positively correlated with it, add no unique explanatory power and behave as baseline requirements. This refines prior work that treats technological factors as uniformly important (Al-Okaily et al., 2022; Lutfi & Alqudah, 2023) and contrasts with recent evidence that effort-related perceptions do not drive CAATs use among experienced internal auditors (Alsarayrah & Ali, 2025). Second, it shows that successful use is the mechanism through which usability and reliability generate audit benefits, and that usability also improves benefits directly, a path not specified in the DeLone and McLean model. The study thereby extends the IS success chain from system quality to net benefits in auditing, and moves the CAATs literature beyond adoption towards the outcomes of use. Third, it provides evidence from a relatively low-technology audit setting, characterized by spreadsheet-based practice, small firms, and junior staff, which is underrepresented in CAATs research (Al-Okaily et al., 2022; Alsarayrah & Ali, 2025; Bierstaker et al., 2014). In this setting, the attributes that matter most are those that reduce the effort of using a tool and the risk of relying on its output, rather than those that extend its integration or protection capabilities. Because technological maturity is a feature of the setting rather than a variable in our model, we do not claim that it moderates these relationships; our results instead provide a benchmark against which studies in technologically more advanced settings, or studies that model maturity explicitly, can be compared. The remainder of the paper is organized as follows. Section 2 reviews the literature and develops the hypotheses; Section 3 describes the method; Section 4 reports the results; Section 5 discusses the findings; Section 6 presents the theoretical and practical implications; Section 7 concludes; and Section 8 sets out the limitations and directions for future research.
2. Literature Review and Hypotheses Development
2.1. CAATs in Audit Practice
CAATs refer to any computer-based tools and techniques that auditors use to perform audit procedures, ranging from spreadsheet functions used for recalculation, sampling, and analytical procedures, through generalized audit software such as ACL or IDEA, to audit data analytics, robotic process automation, and artificial intelligence applications (Braun & Davis, 2003; Eilifsen et al., 2020). Following this broad definition, this study treats spreadsheet-based techniques as CAATs when they are used to execute audit procedures on client data. This choice reflects audit practice in emerging markets, where spreadsheets remain the primary analytical tool and more advanced solutions are adopted incrementally (Tarek et al., 2017; Widuri et al., 2016). Prior research shows that CAATs improve audit efficiency and effectiveness (Banker et al., 2002; Lowe et al., 2018), support fraud detection and audit quality assessment (Qader & Cek, 2024), and enhance the timeliness and veracity of assurance (Castka et al., 2020). At the same time, the benefits materialize only when auditors actually use and value the tools (Li et al., 2018; Mahzan & Lymer, 2014). Studies of audit IT use further show that the extent of use varies considerably across applications and firms (Janvrin et al., 2008).
2.2. Theoretical Framework
The DeLone and McLean (2003) IS success model underpins the research model. It posits that system quality influences system use and user satisfaction, which in turn produce net benefits for individuals and organizations. Because all respondents had already used CAATs, the study does not examine the initial decision to adopt them. Adoption concerns the decision or process of accepting a technology, whereas use concerns its actual application in work activities and user satisfaction reflects users’ evaluation of that experience (Bhattacherjee, 2001; Jasperson et al., 2005). The dependent construct is therefore successful CAATs use, defined as the extent to which auditors use CAATs across audit engagements and stages and are satisfied with that use, after the tools have been made available to them. Audit benefits are the net benefits realized in terms of audit efficiency and audit quality.
We model use and user satisfaction as two facets of a single construct for three reasons. First, DeLone and McLean (2003) describe use and user satisfaction as closely interrelated, with satisfaction both following from and reinforcing use, and subsequent reviews note that the two are difficult to separate in post-adoption settings (Petter et al., 2008). Second, use alone does not indicate success: in audit firms CAATs are often prescribed by the firm’s methodology, so a tool may be used even when auditors find it unsatisfactory, whereas satisfaction without use does not show that the tool is embedded in audit procedures. Benefits arise only when both conditions hold, because tools that are used but not valued tend to be applied only to their basic functions (Ahmi & Kent, 2013), whereas tools that are valued but rarely used cannot change audit outcomes. Third, the four items load strongly on one construct (Section 4.3). The composite is a study-specific operationalization informed by the IS success model, not a claim that the model treats use and satisfaction as one dimension. Similarly, audit benefits capture the net benefits that DeLone and McLean (2003) define holistically for individuals and organizations (Gable et al., 2008); audit efficiency and audit quality are the two dimensions most widely documented in the CAATs literature (Banker et al., 2002; Lowe et al., 2018), and both reflect the value that auditors and firms derive from using CAATs.
Because system quality is a broad construct, we operationalize it using the ISO/IEC 25010 software product quality model (International Organization for Standardization, 2011), which provides a standardized vocabulary for software quality. We draw on four of its characteristics: usability (the degree to which specified users can use a product to achieve specified goals with effectiveness, efficiency, and satisfaction, including operability, learnability, and user interface quality), compatibility (co-existence and interoperability with other systems), reliability (maturity, fault tolerance, and correct operation under specified conditions), and security (the degree to which a product protects information and data so that persons or other systems have access appropriate to their authorization, covering confidentiality, integrity, and accountability). ISO/IEC 25010 defines eight product-quality characteristics. We excluded maintainability and portability because they concern developers and IT staff rather than end users. We also excluded functional suitability and performance efficiency. Functional suitability—the degree to which a tool provides functions that meet stated needs—overlaps conceptually with perceived usefulness and with the audit benefits outcome, so including it would risk near-tautological relationships; performance efficiency (response time and resource use) varies little across the spreadsheet-based tools used by most auditors in our setting. Each of the four retained characteristics corresponds to a distinct concern in audit work: usability to the effort of performing procedures under tight time budgets; compatibility to obtaining client data in usable form; reliability to the evidential risk of relying on erroneous output; and security to the professional duty to protect client confidentiality. These attributes need not contribute equally to successful use; testing the unique contribution of each while controlling for the others is therefore central to the study.
The three frameworks play distinct roles. The DeLone and McLean (2003) IS success model is the primary theoretical framework; it specifies the structural relationships tested, from system quality to use and user satisfaction and from these to net benefits. ISO/IEC 25010 is not a behavioral theory; it serves as the measurement framework that decomposes the broad system-quality construct into standardized attributes, allowing us to test whether these attributes contribute equally to IS success. Mechanism-level theories—cognitive load, task–technology fit, trust in technology, and perceived risk—explain why each attribute should affect use and satisfaction (Section 2.3). Finally, the technology–organization–environment (TOE) framework (Tornatzky & Fleischer, 1990) is used only to position the study: the four attributes belong to its technology context, whereas organizational and environmental factors, which operate at the firm level, are outside the scope of this individual-level study and are left for future research. By focusing on system attributes rather than users’ expectations, the design complements behavioral acceptance models such as UTAUT (Venkatesh et al., 2003).
2.3. Hypotheses Development
Usability. A usable tool is easy to learn and operate, has an intuitive interface, and allows auditors to complete procedures with less effort. Cognitive load theory holds that the mental effort required to operate a tool competes with the effort available for the task itself (Sweller, 1988). Audit engagements have fixed deadlines and tight time budgets, and much of the fieldwork is performed by junior staff; under these conditions, a tool that is demanding to operate diverts attention from audit judgment, and auditors readily revert to familiar manual procedures. Usability therefore lowers the cognitive and time cost of each use and allows auditors to build routines around the tool, increasing both the extent of use and satisfaction with it. In technology acceptance research, the closely related concepts of perceived ease of use and effort expectancy are established antecedents of system use (Davis, 1989; Venkatesh et al., 2003); in this study, we use the term usability for the ISO/IEC 25010 characteristic and refer to ease of use only when discussing these constructs in prior studies. In the CAATs literature, ease of use has been found to promote use, particularly for more complex software features (Atta et al., 2024; H.-J. Kim et al., 2016), although some studies report no significant effect among experienced auditors (Alsarayrah & Ali, 2025; Bin-Nashwan et al., 2025).
H1.
Usability positively affects successful CAATs use.
Compatibility. Compatibility refers to the degree to which CAATs can exchange data with client accounting software, ERP systems, and databases, and fit existing audit workflows. Task–technology fit theory holds that technology is used and yields performance gains when its functions match the requirements of the task (Goodhue & Thompson, 1995), and diffusion theory identifies compatibility with existing practices as a key attribute of innovations that are adopted (Rogers, 2003). When auditors can import client data without manual conversion, the technical cost of each use declines and the tool can be embedded in standard audit programs. Empirically, compatibility has been associated with technology use in accounting and auditing (Al-Okaily et al., 2022; Eilifsen et al., 2020; H.-J. Kim et al., 2016; Widuri et al., 2016). However, compatibility should matter less when the dominant tool is a spreadsheet that can read output from virtually any accounting system, because integration problems are then rare and vary little across users.
H2.
Compatibility positively affects successful CAATs use.
Reliability. Reliability is the degree to which CAATs perform their functions without failure and produce accurate, reproducible results. Theories of trust in technology argue that users rely on a system when they believe it will function consistently and correctly (McKnight et al., 2011). This belief is especially consequential in auditing, where auditors bear professional responsibility for the sufficiency and appropriateness of the evidence on which their opinions rest, and experimental evidence shows that auditors discount technology-generated evidence relative to equivalent human-generated evidence (Commerford et al., 2022). If outputs must be re-performed manually, the tool’s efficiency advantage disappears and use declines; if outputs can be relied on, auditors integrate the tool into more audit stages and are more satisfied with it (Banker et al., 2002; Castka et al., 2020; ISACA, 2009).
H3.
Reliability positively affects successful CAATs use.
Security. Following ISO/IEC 25010, security is the degree to which CAATs protect client and audit data so that only authorized persons can access or modify them (confidentiality and integrity) and every action on the data can be traced (accountability). In the context of CAATs, it reflects auditors’ perceptions of the ability of these tools to protect sensitive audit and client information against unauthorized access, disclosure, or modification. Perceived risk theory suggests that users avoid systems that expose them to potential losses (Featherman & Pavlou, 2003). Auditors bear legal and ethical liability for breaches of client confidentiality under the Law on Independent Audit and the Code of Ethics; a tool perceived as secure therefore lowers the risk of bringing client data into it and should encourage more extensive use (Li et al., 2018; Qader & Cek, 2024; Tarek et al., 2017; Thottoli et al., 2022). Dual-factor theory, however, suggests that some system attributes act mainly as inhibitors: their absence deters use, but their presence does not further encourage it (Cenfetelli, 2004). If auditors regard data protection as a minimum professional requirement, security may matter less for successful use than for the decision to permit a tool at all. We nevertheless follow the dominant view in the literature.
H4.
Security positively affects successful CAATs use.
Successful use and audit benefits. According to the IS success model, system use and user satisfaction generate net benefits (DeLone & McLean, 2003). When auditors routinely use and value CAATs, they can analyze entire populations, perform procedures faster, obtain more persuasive evidence, and detect errors and irregularities more effectively, while firms gain productivity and shorten engagement time (Bin-Nashwan et al., 2025; Fülöp et al., 2024; Lowe et al., 2018). Because successful use combines use and satisfaction, it captures the conditions under which these benefits materialize: auditors apply the tools across audit stages and value the results enough to rely on them.
H5.
Successful CAATs use positively affects audit benefits.
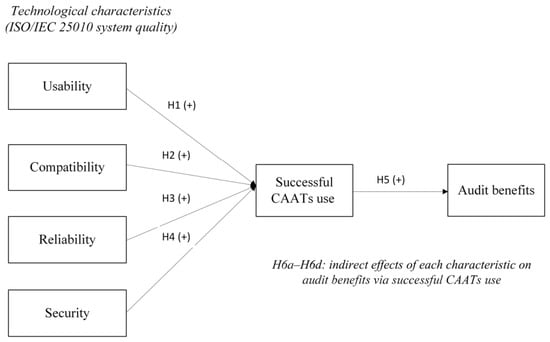
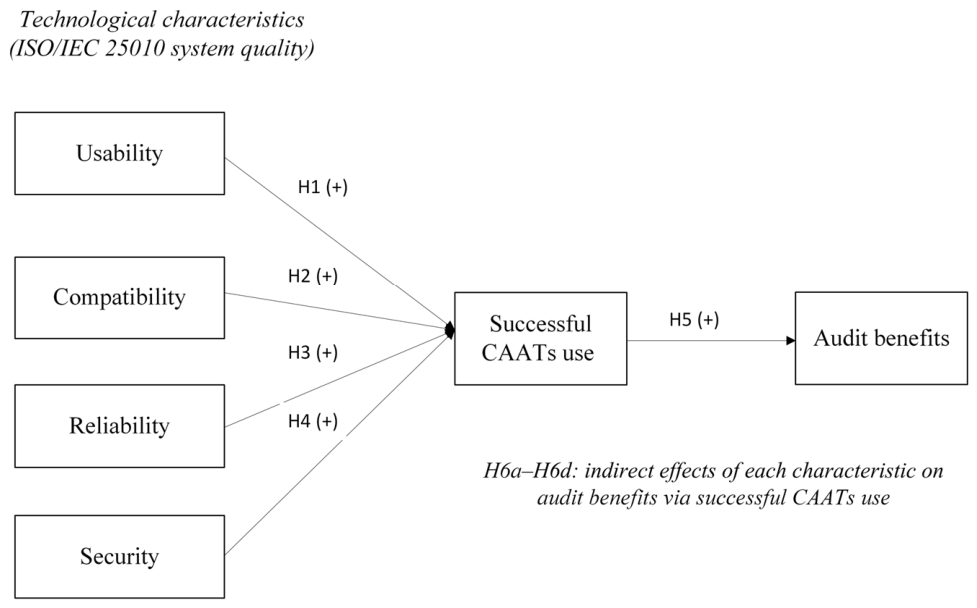
Mediating role of successful use. The IS success model implies that system quality affects net benefits primarily through use and satisfaction; high-quality tools create value only when they are successfully used. Successful use should therefore transmit the effects of the technological characteristics to audit benefits. Following Zhao et al. (2010), mediation is established by a significant indirect effect, whereas the significance of the direct effect determines whether mediation is complementary (partial) or indirect-only (full); we therefore report direct, indirect, and total effects. Figure 1 presents the research model and the hypothesized relationships.
Figure 1.
Research model.
H6a–H6d.
Successful CAATs use mediates the relationships between (a) usability, (b) compatibility, (c) reliability, and (d) security and audit benefits.
3. Materials and Methods
3.1. Research Design
The study adopts a quantitative, cross-sectional survey design. A survey is appropriate because the constructs—perceived system quality, use, satisfaction, and perceived benefits—are latent perceptions that cannot be observed in archival data, and because the study aims to test theory-derived relationships across a broad population of auditors rather than to describe a single firm. The unit of analysis is the individual auditor: system quality, use, satisfaction, and benefits are all assessed from the perspective of the auditor who operates CAATs. A cross-sectional design allows data to be collected with a consistent questionnaire from auditors with direct CAATs experience across many audit firms, and it is consistent with prior CAATs and IS success research (Al-Okaily et al., 2022; Lutfi & Alqudah, 2023; Siew et al., 2020). Because the explanatory and outcome variables were measured at the same time, the results are interpreted as associations consistent with the proposed theoretical relationships; the limitations for causal inference are discussed in Section 8.
3.2. Sample and Data Collection
The target population comprised auditors and audit staff working in independent audit firms in Vietnam who had used CAATs in their audit work and participated directly in performing audit procedures. A screening question at the beginning of the questionnaire excluded respondents without CAATs experience. We administered a structured questionnaire via Google Forms and distributed it through e-mail and the Zalo messaging application, using purposive sampling through professional networks, between December 2025 and February 2026. The questionnaire was sent to both Big 4 and non-Big 4 firms. Of the 550 questionnaires distributed, 314 were returned (57.1% response rate). After removing incomplete and invalid questionnaires, 289 usable responses (52.5% of those distributed) were retained for analysis. Most responses came from non-Big 4 firms; only four were received from Big 4 firms.
The sampling frame was the list of audit firms approved by the Ministry of Finance to provide audit services in 2025. We contacted 83 firms through heads of audit departments, alumni networks and VACPA training events; contact persons forwarded the questionnaire to auditors who met the screening criterion. The 314 returned questionnaires came from 41 firms (median of 8 respondents per firm); the 289 usable questionnaires retained for analysis came from 41 firms (median of 7 per firm). Big 4 member firms in Vietnam operate their networks’ proprietary audit platforms and generally restrict staff participation in external surveys; we therefore obtained only four responses from these firms. The findings should accordingly be interpreted as pertaining to non-Big 4 firms, which account for the large majority of audit firms in Vietnam (Section 1).
The sample size exceeds the minimum of 155 observations required by the inverse square root method to detect a path coefficient of 0.20 at the 5% significance level with 80% power (Kock & Hadaya, 2018). We assessed non-response bias by comparing early and late respondents (Armstrong & Overton, 1977), treating the first 144 responses as early and the last 145 as late, with the latter serving as a proxy for non-respondents. Independent-samples t-tests showed no significant differences for 16 of the 19 indicators (p > 0.05); for the remaining three, all of which belonged to the technological characteristics, the mean differences did not exceed 0.21 points on the five-point scale. Non-response bias is therefore unlikely to be a serious concern. Participation was voluntary and anonymous, and we collected no identifying information.
3.3. Measurement
We measured all constructs with multi-item reflective scales adapted from prior studies (see Appendix A). Because the original items were in English, we applied a forward–backward translation procedure (Brislin, 1980). The items were first translated into Vietnamese by a researcher with expertise in auditing who is proficient in both languages. An independent expert then translated the Vietnamese version back into English without reference to the original, and the two English versions were compared to identify differences in content, meaning, and wording; the two versions were discussed, and discrepancies were resolved. Experts in auditing and audit technology then reviewed the translated questionnaire and assessed each item’s clarity, terminology, and contextual appropriateness; we reworded several items to improve comprehensibility while preserving their theoretical meaning. Finally, we pilot-tested the questionnaire in 2025 with 50 participants (20 research experts in auditing, 15 auditors, and 15 audit assistants) from five audit firms, none of whom took part in the main survey. Feedback from the participants was used to refine the questionnaire, ensuring that the wording was clear, the questions were understandable, and the measurement items adequately reflected the intended research constructs. Pilot responses were excluded from the analysis.
We measured usability, compatibility, and reliability with three items each, and security with two items, all aligned with the corresponding ISO/IEC 25010 characteristics. We measured successful CAATs use with four items capturing two facets of the IS success model: use (two items) and user satisfaction (two items). We measured audit benefits with four items capturing audit efficiency (two items) and audit quality (two items). All items used a five-point Likert scale ranging from 1 (strongly disagree) to 5 (strongly agree).
3.4. Common Method Bias
Because all data came from a single self-reported survey, we applied procedural and statistical remedies (Podsakoff et al., 2003). Procedurally, we guaranteed anonymity, informed respondents that there were no right or wrong answers, and placed the predictor and outcome constructs in separate sections of the questionnaire. Statistically, we applied Harman’s single-factor test and the full collinearity assessment approach (Kock, 2015). In addition, because 51 respondents (17.6%) gave identical answers to all 19 indicators and a substantial number of response patterns were duplicated, we re-estimated the model on subsamples that excluded these cases (Section 4.7).
Identical responses across all items were treated as a potential indicator of low response effort rather than as automatic evidence of invalidity. We retained these respondents in the main analysis for three reasons. First, straight-lining does not necessarily indicate careless responding: when items are short, positively worded, and respondents hold uniformly favorable attitudes, identical answers can reflect genuine views (Y. Kim et al., 2019; Reuning & Plutzer, 2020). In our data, some of the 51 straight-liners selected “agree” (4) on all items, close to the sample means (3.65–4.22). Because such responses lie near the construct means, they contribute little to the covariances from which the path coefficients are estimated. Second, straight-liners did not differ from other respondents in position, firm size, and type of CAATs used, so excluding them could bias the sample composition. Third, the results are virtually unchanged when straight-liners and duplicated response patterns are excluded (Section 4.7). Because the questionnaire contained no attention-check items, we cannot fully distinguish valid from careless straight-lining; we acknowledge this as a limitation (Section 8).
3.5. Data Analysis
We estimated the model using PLS-SEM in SmartPLS 4 (Ringle et al., 2024) with the path weighting scheme. PLS-SEM is appropriate given the study’s explanatory–predictive orientation and its focus on explaining variance in the endogenous constructs (Hair et al., 2019, 2022). The analysis followed a two-stage procedure. First, the measurement model was assessed for indicator reliability, internal consistency reliability (Cronbach’s α and composite reliability ρA and ρC), convergent validity (average variance extracted, AVE), and discriminant validity using the heterotrait–monotrait ratio (HTMT) and its bootstrap confidence intervals (Franke & Sarstedt, 2019; Henseler et al., 2015). Second, we assessed the structural model for collinearity (VIF), path coefficients, coefficients of determination (R2), and effect sizes (f2). We evaluated significance using percentile bootstrap confidence intervals based on 5000 subsamples. We tested mediation following Zhao et al. (2010) and Nitzl et al. (2016) by estimating a model that includes both indirect and direct paths from each technological characteristic to audit benefits. Out-of-sample predictive power was assessed with PLSpredict (10 folds, 10 repetitions) and the cross-validated predictive ability test (CVPAT) (Liengaard et al., 2021; Shmueli et al., 2019). Reporting follows current guidelines for PLS-SEM (Hair et al., 2019; Sarstedt et al., 2022).
4. Results
4.1. Respondent Profile
Table 1 summarizes the respondent profile. Female respondents accounted for 63.3% of the sample. Nearly half of the respondents were audit assistants or interns (47.1%) and a quarter were audit staff (24.9%), while seniors, managers, and partners together made up 28.0%. Most respondents worked in small audit firms: 70.6% were in firms with 25 employees or fewer. Experience with CAATs varied: 46.0% had used them for five years or more, and 16.6% for less than one year. Microsoft Excel was the main tool for 72.0% of respondents; 26.0% combined Excel with specialized audit software, artificial intelligence, or robotic process automation; and only 2.1% relied exclusively on specialized audit software. Audit practice in Vietnam therefore remains largely spreadsheet-based, carried out mainly by junior staff in small firms, with more advanced technologies being adopted gradually.
Table 1.
Respondent profile (n = 289).
4.2. Common Method Bias Assessment
Harman’s single-factor test showed that the first unrotated factor accounted for 52.7% of the total variance, slightly above the conventional 50% threshold. Because this test is widely regarded as insensitive (Podsakoff et al., 2003), we also computed full collinearity VIFs by regressing each latent variable score on all others (Kock, 2015). The values ranged from 1.63 (security) to 3.47 (usability); five of six were below the 3.3 threshold, and all were well below 5. Taken together with the robustness checks reported in Section 4.7, which show that the results do not change when low-effort response patterns are excluded, these results suggest that common method bias is unlikely to drive the conclusions. However, it cannot be ruled out entirely.
4.3. Measurement Model
As shown in Table 2, all outer loadings exceeded 0.80 (range 0.810–0.973), indicating adequate indicator reliability. Cronbach’s α (0.839–0.937), ρA (0.838–0.943), and ρC (0.904–0.970) exceeded 0.70, confirming internal consistency reliability, and all AVEs (0.747–0.941) exceeded 0.50, confirming convergent validity (Hair et al., 2022). The very high reliability of the two-item security scale (ρC = 0.970; inter-item correlation = 0.88) indicates that its items are close to redundant, which we acknowledge as a limitation.
Table 2.
Measurement model: loadings, reliability, and convergent validity.
Table 3 reports the HTMT ratios. All point estimates were below 0.90, and the upper bounds of the bootstrap 95% confidence intervals were below 1, supporting discriminant validity under the HTMT inference criterion (Franke & Sarstedt, 2019; Henseler et al., 2015). However, the upper bounds for compatibility–reliability (0.979), usability–compatibility (0.946), and usability–successful use (0.902) exceed 0.90. This reflects the conceptual proximity of these system-quality attributes, which all describe the same software, and it is considered when interpreting the structural results. The Fornell–Larcker criterion was also satisfied, as the square root of each construct’s AVE exceeded its correlations with all other constructs (Fornell & Larcker, 1981).
Table 3.
Heterotrait–monotrait ratio (HTMT) with bootstrap upper confidence bounds.
4.4. Structural Model
The inner VIF values ranged from 1.00 to 3.10, below the 5 threshold (Hair et al., 2022), although the value for compatibility (3.10) exceeds 3, indicating that the technological characteristics share considerable variance. The four characteristics jointly explained 63.1% of the variance in successful CAATs use (adjusted R2 = 0.625), and successful use explained 45.0% of the variance in audit benefits (adjusted R2 = 0.448), representing moderate-to-substantial explanatory power. The standardized root mean square residual (SRMR = 0.078) was below 0.08.
Table 4 presents the hypothesis tests. Usability (β = 0.487, 95% CI [0.317, 0.644]) and reliability (β = 0.372, 95% CI [0.237, 0.496]) had positive and significant effects on successful use, supporting H1 and H3. Their effect sizes were medium (f2 = 0.253) and small to medium (f2 = 0.133), respectively. Compatibility (β = 0.001, 95% CI [−0.163, 0.188]) and security (β = −0.003, 95% CI [−0.089, 0.090]) had no significant effects (f2 = 0.000), so H2 and H4 are not supported. Importantly, both constructs are positively correlated with successful use (r = 0.637 and 0.370, respectively), but their path coefficients are close to zero once usability and reliability are controlled for. Their association with successful use therefore reflects variance shared with the other characteristics rather than a unique effect. Successful use had a strong positive effect on audit benefits (β = 0.671, 95% CI [0.606, 0.739], f2 = 0.818), supporting H5.
Table 4.
Structural model results (hypothesized model).
4.5. Mediation Analysis
In the hypothesized model, the indirect effects of usability (0.327, 95% CI [0.206, 0.449]) and reliability (0.249, 95% CI [0.155, 0.343]) on audit benefits through successful use were significant, whereas those of compatibility and security were not. To determine the type of mediation, we re-estimated the model with direct paths from all four characteristics to audit benefits (Table 5); this raised the explained variance in audit benefits to 54.1% (R2 adjusted = 0.533), and model fit remained acceptable (SRMR = 0.067). The indirect effects of usability (0.199, 95% CI [0.109, 0.307]) and reliability (0.152, 95% CI [0.075, 0.247]) remained significant. Usability also had a significant positive direct effect (0.375), indicating complementary partial mediation, whereas reliability’s direct effect was not significant, indicating indirect-only (full) mediation (Zhao et al., 2010). H6a and H6c are therefore supported, and H6b and H6d are not. Unexpectedly, security had a significant negative direct effect on audit benefits (−0.218, 95% CI [−0.307, −0.123]; f2 = 0.068) despite a weak positive bivariate correlation (r = 0.109). This pattern indicates a suppression effect that emerges only after controlling for the other characteristics, and we interpret it with caution as an exploratory finding.
Table 5.
Mediation analysis (model with direct paths).
4.6. Predictive Power
We assessed predictive power for the final model, including the direct paths. All Q2predict values were positive (0.288–0.538), indicating that the model outperforms the naïve mean benchmark (Shmueli et al., 2019). Comparing the PLS-SEM prediction errors with those of a linear regression benchmark (LM) at the indicator level (Table 6), PLS-SEM produced lower RMSE values for six of the eight indicators—all four indicators of successful use and two of the four indicators of audit benefits. According to Shmueli et al. (2019), a model for which the majority of indicators have lower prediction errors than the LM benchmark has medium predictive power. CVPAT results confirmed that PLS-SEM predicts significantly better than the indicator-average benchmark (overall average loss difference = −0.152, t = 8.678, p < 0.001). Compared with the LM benchmark, PLS-SEM predicted successful use significantly better (average loss difference = −0.009, p = 0.039), while overall performance did not differ significantly (p = 0.360).
Table 6.
PLSpredict results at the indicator level (final model).
4.7. Robustness Checks
To assess whether low-effort responding affected the results, the model was re-estimated on two subsamples: (i) excluding the 51 respondents who gave identical answers to all 19 indicators (n = 238) and (ii) retaining unique response patterns (n = 173). As Table 7 shows, the signs, magnitudes, and significance of all paths are virtually unchanged. Usability and reliability remain the only characteristics with significant effects on successful use, and the effect of successful use on audit benefits remains strong. The main conclusions are therefore not an artifact of straight-lining or duplicated responses.
Table 7.
Robustness of path coefficients across samples.
5. Discussion
5.1. Usability and Successful CAATs Use
Usability was the strongest determinant of successful use (β = 0.487), supporting H1. This is consistent with the IS success model, in which system quality is a precondition for use and satisfaction (DeLone & McLean, 2003), and with the technology acceptance literature on perceived ease of use and effort expectancy (Davis, 1989; Venkatesh et al., 2003). It also matches evidence that ease of use promotes CAATs use (Atta et al., 2024; H.-J. Kim et al., 2016), but contrasts with studies finding no effect of effort expectancy or ease of use among experienced internal auditors in Jordan or senior professionals in Chinese accounting and auditing firms (Alsarayrah & Ali, 2025; Bin-Nashwan et al., 2025). The sample profile helps explain this difference. In our sample, 72.0% of respondents were audit assistants or staff, 70.6% worked in firms with no more than 25 employees, and 72.0% relied mainly on Excel. For junior auditors working under deadline pressure in small firms with limited training resources, whether a tool is easy to learn and operate becomes the binding constraint on use. Among experienced users or in technologically mature firms, ease of use may be taken for granted; in emerging audit markets, it remains a differentiating attribute. The additional direct effect of usability on audit benefits (Table 5) suggests that easy-to-use tools also generate value beyond what use and satisfaction capture, for instance by directly reducing manual workload and the time needed to perform procedures.
5.2. Compatibility and Successful CAATs Use
Compatibility had no unique effect on successful use (β = 0.001), so H2 is not supported. This does not mean that compatibility is irrelevant. Its correlation with successful use is substantial (r = 0.637), but it shares most of its variance with reliability (HTMT = 0.892) and usability (HTMT = 0.856). Once these characteristics are controlled for, compatibility contributes no additional explanatory power. Two contextual explanations are plausible. First, because most auditors work with spreadsheets, which import data from virtually all accounting software used by Vietnamese entities, integration capability varies little across users and therefore does not differentiate successful use. Second, audit procedures in Vietnam are standardized under the Vietnamese Standards on Auditing, which limits differences in workflow fit across firms. Compatibility may become more important as firms move towards specialized audit software and data analytics that require direct connections to heterogeneous client ERP systems (Eilifsen et al., 2020; H.-J. Kim et al., 2016). This interpretation is consistent with task–technology fit theory (Goodhue & Thompson, 1995): when the dominant tool already fits the task of importing and analyzing exported client data, differences in compatibility have little consequence for use. This differs from findings for generalized audit software, where integration with client systems is a recurrent barrier (H.-J. Kim et al., 2016; Widuri et al., 2016), and from studies that model technological factors in aggregate, which cannot separate the contribution of compatibility from that of related attributes (Al-Okaily et al., 2022; Lutfi & Alqudah, 2023).
5.3. Reliability and Successful CAATs Use
Reliability had a significant positive effect on successful use (β = 0.372), supporting H3 and consistent with the view that stable and accurate processing builds user trust (Banker et al., 2002; Castka et al., 2020). Auditors are personally accountable for the sufficiency and appropriateness of audit evidence; if they cannot trust a tool’s outputs, they must re-perform the work manually, eliminating its efficiency advantage. Because more advanced technologies such as AI and RPA are still in early use (26.0% of respondents combine them with Excel), auditors appear to favor tools whose results are stable and easy to verify. Mediation results show that reliability affects audit benefits only through successful use, underscoring that reliable tools create value only when they are actually used. The importance of reliability is consistent with trust-in-technology theory, in which beliefs about a system’s consistent and correct functioning drive reliance on it (McKnight et al., 2011), and with experimental evidence that auditors discount technology-generated evidence relative to equivalent human-generated evidence (Commerford et al., 2022); unless auditors can trust a tool’s output, its use remains limited.
5.4. Security and Successful CAATs Use
Security did not affect successful use (β = −0.003), so H4 is not supported. This contrasts with studies associating security with trust in and use of audit technology (Li et al., 2018; Thottoli et al., 2022), but is consistent with dual-factor theory, in which some attributes act mainly as inhibitors whose absence deters use but whose presence does not further encourage it (Cenfetelli, 2004). Security also had the lowest mean score of the four characteristics (3.65). A plausible explanation is that data confidentiality is a mandatory professional requirement under the Law on Independent Audit and professional ethics standards, so auditors treat it as a baseline condition that a tool must meet rather than as a criterion that influences how intensively they use it. When security is perceived as a compliance matter handled by the firm, it is unlikely to influence individual usage decisions. The exploratory finding that security has a negative direct association with audit benefits after controlling for other characteristics deserves further investigation. One possible explanation is that stricter security controls, such as restricted access to client data, encryption, and approval procedures for data extraction, add procedural friction that reduces perceived efficiency gains. Because this effect arises only in the multivariate model and was not hypothesized, future research should test it before drawing firm conclusions.
5.5. Successful CAATs Use and Audit Benefits
Successful use strongly affected audit benefits (β = 0.671; f2 = 0.818), supporting H5 and aligning with the IS success model and prior evidence on the value of audit technology (Bin-Nashwan et al., 2025; Fülöp et al., 2024; Lowe et al., 2018). Together with the mediation results, this finding shows that benefits arise from how intensively and satisfactorily tools are used rather than from their mere presence in the firm. For small and medium-sized audit firms with limited budgets, improving the use of existing tools through training, standardized procedures, and technical support may therefore yield greater returns than acquiring new technologies.
These conclusions should be extended to advanced technologies with caution. Because 72.0% of respondents relied mainly on Excel, our measures of usability, compatibility, reliability, and security largely reflect auditors’ experience with spreadsheets. For generalized audit software, data analytics platforms, AI, and RPA, the balance among attributes may differ; compatibility is likely to matter more when tools must connect directly to heterogeneous client ERP systems, and security more when client data are processed on cloud platforms or by third-party algorithms. Our finding that compatibility and security function as baseline requirements should therefore be read as characteristic of spreadsheet-dominated audit practice rather than as a general property of audit technology.
6. Implications
6.1. Theoretical Implications
The findings have three implications for theory. First, they refine the DeLone and McLean (2003) model, which treats system quality as a single antecedent of use and satisfaction. When system quality is decomposed into ISO/IEC 25010 attributes, usability and reliability emerge as differentiating drivers, whereas compatibility and security, despite their positive correlations with use, behave as baseline requirements whose effects are absorbed by related attributes. This suggests that system quality should be modeled at the attribute level when the aim is to explain use or guide design and investment decisions, and it responds to calls to identify the specific independent variables that drive IS success (Petter et al., 2013). Second, usability has a direct effect on audit benefits in addition to its indirect effect through successful use, a path the model does not specify. In task-intensive professional work, a tool that is easy to operate may reduce effort and time directly, regardless of how intensively it is used. Third, the findings come from a relatively low-technology setting dominated by spreadsheets, junior staff, and small firms. In this setting, the attributes that lower the effort of using a tool and the risk of relying on its output matter most. Whether the relative importance of system-quality attributes differs in more technologically advanced settings cannot be determined from our data and remains a question for future research (Section 8). For the CAATs literature, the study shifts attention from users’ expectations, which dominate TAM- and UTAUT-based research, to the properties of the tools themselves, and it links tool use to audit benefits rather than stopping at adoption or intention.
6.2. Practical Implications
The findings have implications for several groups. For audit firms, particularly small and medium-sized firms, the priority should be tools that are easy to learn and operate and that produce stable, verifiable outputs, rather than the most sophisticated software available. Because benefits depend on successful use, technology investment should be complemented by hands-on training, standardized templates and scripts for common audit procedures, and technical support that turn available tools into routinely used ones. For individual auditors, especially junior staff, developing proficiency with the tools they already use is likely to yield greater efficiency and quality gains than acquiring new tools. For software vendors serving emerging audit markets, usability and output reliability should be the main design priorities and the main elements of service agreements; integration and security features remain necessary but are unlikely to differentiate products in spreadsheet-based practice. For professional bodies and regulators, such as the Vietnam Association of Certified Public Accountants and the Ministry of Finance, the results support guidance and continuing professional education on CAATs and data analytics targeted at small and medium-sized firms, for example through shared templates and practice aids. For universities and training providers, accounting and auditing curricula should include practical training in data-analysis tools so that new auditors enter the profession able to use them effectively.
7. Conclusions
This study set out to identify which system-quality attributes of CAATs make their use successful and whether successful use translates into audit benefits. Evidence from auditors in Vietnamese audit firms indicates that usability and reliability, rather than compatibility and security, distinguish more from less successful use, and that successful use is the channel through which these attributes generate efficiency and quality gains, with usability also contributing directly. In audit practice that still relies largely on spreadsheets, the value of audit technology therefore depends less on its sophistication than on whether auditors find it easy to operate and can trust its output. Making existing tools usable and dependable, and ensuring that they are routinely used, is a precondition for realizing the benefits that audit digitalization promises.
8. Limitations and Future Research
This study has several limitations. First, the cross-sectional, self-reported design limits causal inference; although procedural and statistical remedies were applied, common method bias cannot be fully excluded. Second, audit benefits were measured through auditors’ perceptions rather than objective indicators such as engagement hours, detected misstatements, or inspection results; future research could use multi-source or archival data. Third, the sample was drawn through professional networks and consists mainly of junior staff in small non-Big 4 firms; with only four Big 4 respondents, the findings cannot be generalized to Big 4 firms, whose auditors use global proprietary platforms. Fourth, several respondents came from the same firm (median of seven per firm in the analysis sample; Section 3.2), so observations may not be fully independent; multilevel designs could account for firm-level clustering and incorporate the organizational and environmental factors of the TOE framework. Fifth, 17.6% of respondents gave identical answers to all items and the questionnaire contained no attention-check or reverse-coded items, so valid and careless straight-lining cannot be fully separated, although the robustness checks show that the results are not driven by these responses. Sixth, the high HTMT upper bounds between compatibility and reliability suggest that respondents did not clearly distinguish these attributes; security was measured with only two highly correlated items; and one satisfaction item captures the evaluation of CAATs use by supervisors and colleagues rather than the respondent’s own satisfaction. Future studies should refine these scales and could model system quality as a higher-order construct (Sarstedt et al., 2019). Seventh, because most respondents relied mainly on spreadsheets, the findings may not extend to generalized audit software, data analytics, AI, or RPA. Eighth, technological maturity was not measured. Although the setting is clearly spreadsheet-dominated, we cannot test whether maturity moderates the effects of system-quality attributes. Future research could model maturity explicitly, for example through the type of CAATs used, firm size, or auditors’ CAATs experience, using multigroup analysis or interaction terms; compare junior and senior auditors; examine other emerging audit markets; and use longitudinal designs to trace how the importance of system-quality attributes changes as audit firms adopt more advanced tools.
Author Contributions
Conceptualization, T.T.T.D. and N.H.T.; methodology, T.T.T.D. and N.H.T.; formal analysis, T.T.T.D.; investigation, T.T.T.D.; data curation, T.T.T.D.; writing—original draft preparation, T.T.T.D.; writing—review and editing, N.H.T.; supervision, N.H.T. All authors have read and agreed to the published version of the manuscript.
Funding
This research received no external funding.
Institutional Review Board Statement
Ethical review and approval were waived for this study in accordance with the Regulations on Ethical Standards and Integrity in Scientific Activities of the Industrial University of Ho Chi Minh City (Decision No. 296/QĐ-ĐHCN, dated 24 February 2023), because it was an anonymous, voluntary, non-interventional questionnaire survey of adult audit professionals that collected no personally identifiable or sensitive information and posed no more than minimal risk to participants.
Informed Consent Statement
Informed consent was obtained from all subjects involved in the study.
Data Availability Statement
The data presented in this study are available on request from the corresponding author. The data are not publicly available due to confidentiality commitments to respondents.
Conflicts of Interest
The authors declare no conflicts of interest.
Appendix A. Measurement Items
Table A1.
Constructs, items, and sources.
References
- Ahmi, A., & Kent, S. (2013). The utilisation of generalized audit software (GAS) by external auditors. Managerial Auditing Journal, 28(2), 88–113. [Google Scholar] [CrossRef] [Scilit]
- Alles, M. G. (2015). Drivers of the use and facilitators and obstacles of the evolution of big data by the audit profession. Accounting Horizons, 29(2), 439–449. [Google Scholar] [CrossRef] [Scilit]
- Almagrashi, A., Mujalli, A., Khan, T., & Attia, O. (2023). Factors determining internal auditors’ behavioral intention to use computer-assisted auditing techniques: An extension of the UTAUT model and an empirical study. Future Business Journal, 9(1), 74. [Google Scholar] [CrossRef] [Scilit]
- Al-Okaily, M., Alqudah, H. M., Al-Qudah, A. A., & Alkhwaldi, A. F. (2022). Examining the critical factors of computer-assisted audit tools and techniques adoption in the post-COVID-19 period: Internal auditors perspective. Managerial Auditing Journal, 37(7), 858–879. [Google Scholar] [CrossRef] [Scilit]
- Alsarayrah, T., & Ali, B. J. A. (2025). The moderating role of auditor experience on determinants of computer-assisted auditing tools and techniques. Journal of Risk and Financial Management, 18(4), 206. [Google Scholar] [CrossRef] [Scilit]
- Armstrong, J. S., & Overton, T. S. (1977). Estimating nonresponse bias in mail surveys. Journal of Marketing Research, 14(3), 396–402. [Google Scholar] [CrossRef] [Scilit]
- Atta, A., Baniata, H., Othman, O., Ali, B., Abughaush, S., Aljundi, N., & Ahmad, A. (2024). The impact of computer assisted auditing techniques in the audit process: An assessment of performance and effort expectancy. International Journal of Data and Network Science, 8(2), 977–988. [Google Scholar] [CrossRef] [Scilit]
- Banker, R. D., Chang, H., & Kao, Y. (2002). Impact of information technology on public accounting firm productivity. Journal of Information Systems, 16(2), 209–222. [Google Scholar] [CrossRef] [Scilit]
- Bhattacherjee, A. (2001). Understanding information systems continuance: An expectation–confirmation model. MIS Quarterly, 25(3), 351–370. [Google Scholar] [CrossRef] [Scilit]
- Bierstaker, J., Janvrin, D., & Lowe, D. J. (2014). What factors influence auditors’ use of computer-assisted audit techniques? Advances in Accounting, 30(1), 67–74. [Google Scholar] [CrossRef] [Scilit]
- Bin-Nashwan, S. A., Li, J. Z., Jiang, H., Bajary, A. R., & Ma’aji, M. M. (2025). Does AI adoption redefine financial reporting accuracy, auditing efficiency, and information asymmetry? An integrated model of TOE–TAM–RDT and big data governance. Computers in Human Behavior Reports, 17, 100572. [Google Scholar] [CrossRef] [Scilit]
- Braun, R. L., & Davis, H. E. (2003). Computer-assisted audit tools and techniques: Analysis and perspectives. Managerial Auditing Journal, 18(9), 725–731. [Google Scholar] [CrossRef] [Scilit]
- Brislin, R. W. (1980). Translation and content analysis of oral and written materials. In H. C. Triandis, & J. W. Berry (Eds.), Handbook of cross-cultural psychology (Vol. 2, pp. 389–444). Allyn and Bacon. [Google Scholar]
- Cao, M., Chychyla, R., & Stewart, T. (2015). Big data analytics in financial statement audits. Accounting Horizons, 29(2), 423–429. [Google Scholar] [CrossRef] [Scilit]
- Castka, P., Searcy, C., & Mohr, J. (2020). Technology-enhanced auditing: Improving veracity and timeliness in social and environmental audits of supply chains. Journal of Cleaner Production, 258, 120773. [Google Scholar] [CrossRef] [Scilit]
- Cenfetelli, R. T. (2004). Inhibitors and enablers as dual factor concepts in technology usage. Journal of the Association for Information Systems, 5(11), 472–492. [Google Scholar] [CrossRef] [Scilit]
- Commerford, B. P., Dennis, S. A., Joe, J. R., & Ulla, J. W. (2022). Man versus machine: Complex estimates and auditor reliance on artificial intelligence. Journal of Accounting Research, 60(1), 171–201. [Google Scholar] [CrossRef] [Scilit]
- Davis, F. D. (1989). Perceived usefulness, perceived ease of use, and user acceptance of information technology. MIS Quarterly, 13(3), 319–340. [Google Scholar] [CrossRef] [Scilit] [PubMed]
- DeLone, W. H., & McLean, E. R. (2003). The DeLone and McLean model of information systems success: A ten-year update. Journal of Management Information Systems, 19(4), 9–30. [Google Scholar] [CrossRef] [Scilit]
- Eilifsen, A., Kinserdal, F., Messier, W. F., Jr., & McKee, T. E. (2020). An exploratory study into the use of audit data analytics on audit engagements. Accounting Horizons, 34(4), 75–103. [Google Scholar] [CrossRef] [Scilit]
- Featherman, M. S., & Pavlou, P. A. (2003). Predicting e-services adoption: A perceived risk facets perspective. International Journal of Human-Computer Studies, 59(4), 451–474. [Google Scholar] [CrossRef] [Scilit]
- Fornell, C., & Larcker, D. F. (1981). Evaluating structural equation models with unobservable variables and measurement error. Journal of Marketing Research, 18(1), 39–50. [Google Scholar] [CrossRef] [Scilit]
- Franke, G., & Sarstedt, M. (2019). Heuristics versus statistics in discriminant validity testing: A comparison of four procedures. Internet Research, 29(3), 430–447. [Google Scholar] [CrossRef] [Scilit]
- Fülöp, M. T., Ionescu, C. A., Măgdaș, N., & Topor, D. I. (2024). Factors influencing the use of computer-assisted audit techniques in the digital era. Journal of Business Economics and Management, 25(6), 1140–1160. [Google Scholar] [CrossRef] [Scilit]
- Gable, G. G., Sedera, D., & Chan, T. (2008). Re-conceptualizing information system success: The IS-Impact measurement model. Journal of the Association for Information Systems, 9(7), 377–408. [Google Scholar] [CrossRef] [Scilit]
- Goodhue, D. L., & Thompson, R. L. (1995). Task–technology fit and individual performance. MIS Quarterly, 19(2), 213–236. [Google Scholar] [CrossRef] [Scilit] [PubMed]
- Hair, J. F., Hult, G. T. M., Ringle, C. M., & Sarstedt, M. (2022). A primer on partial least squares structural equation modeling (PLS-SEM) (3rd ed.). Sage. [Google Scholar]
- Hair, J. F., Risher, J. J., Sarstedt, M., & Ringle, C. M. (2019). When to use and how to report the results of PLS-SEM. European Business Review, 31(1), 2–24. [Google Scholar] [CrossRef] [Scilit]
- Henseler, J., Ringle, C. M., & Sarstedt, M. (2015). A new criterion for assessing discriminant validity in variance-based structural equation modeling. Journal of the Academy of Marketing Science, 43(1), 115–135. [Google Scholar] [CrossRef] [Scilit]
- International Organization for Standardization. (2011). Systems and software engineering-systems and software quality requirements and evaluation (SQuaRE)-system and software quality models (ISO/IEC 25010:2011). ISO. [Google Scholar]
- ISACA. (2009). COBIT 4.1: Framework, control objectives, management guidelines, maturity models. ISACA. [Google Scholar]
- Janvrin, D., Bierstaker, J., & Lowe, D. J. (2008). An examination of audit information technology use and perceived importance. Accounting Horizons, 22(1), 1–21. [Google Scholar] [CrossRef] [Scilit]
- Jasperson, J. S., Carter, P. E., & Zmud, R. W. (2005). A comprehensive conceptualization of post-adoptive behaviors associated with information technology enabled work systems. MIS Quarterly, 29(3), 525–557. [Google Scholar] [CrossRef] [Scilit]
- Kim, H.-J., Kotb, A., & Eldaly, M. K. (2016). The use of generalized audit software by Egyptian external auditors: The effect of audit software features. Journal of Applied Accounting Research, 17(4), 456–478. [Google Scholar] [CrossRef] [Scilit]
- Kim, Y., Dykema, J., Stevenson, J., Black, P., & Moberg, D. P. (2019). Straightlining: Overview of measurement, comparison of indicators, and effects in mail–web mixed-mode surveys. Social Science Computer Review, 37(2), 214–233. [Google Scholar] [CrossRef] [Scilit]
- Kock, N. (2015). Common method bias in PLS-SEM: A full collinearity assessment approach. International Journal of e-Collaboration, 11(4), 1–10. [Google Scholar] [CrossRef] [Scilit]
- Kock, N., & Hadaya, P. (2018). Minimum sample size estimation in PLS-SEM: The inverse square root and gamma-exponential methods. Information Systems Journal, 28(1), 227–261. [Google Scholar] [CrossRef] [Scilit]
- Li, H., Dai, J., Gershberg, T., & Vasarhelyi, M. A. (2018). Understanding usage and value of audit analytics for internal auditors: An organizational approach. International Journal of Accounting Information Systems, 28, 59–76. [Google Scholar] [CrossRef] [Scilit]
- Liengaard, B. D., Sharma, P. N., Hult, G. T. M., Jensen, M. B., Sarstedt, M., Hair, J. F., & Ringle, C. M. (2021). Prediction: Coveted, yet forsaken? Introducing a cross-validated predictive ability test in partial least squares path modeling. Decision Sciences, 52(2), 362–392. [Google Scholar] [CrossRef] [Scilit]
- Lowe, D. J., Bierstaker, J. L., Janvrin, D. J., & Jenkins, J. G. (2018). Information technology in an audit context: Have the Big 4 lost their advantage? Journal of Information Systems, 32(1), 87–107. [Google Scholar] [CrossRef] [Scilit]
- Lutfi, A., & Alqudah, H. (2023). The influence of technological factors on the computer-assisted audit tools and techniques usage during COVID-19. Sustainability, 15(9), 7704. [Google Scholar] [CrossRef] [Scilit]
- Mahzan, N., & Lymer, A. (2014). Examining the adoption of computer-assisted audit tools and techniques: Cases of generalized audit software use by internal auditors. Managerial Auditing Journal, 29(4), 327–349. [Google Scholar]
- Manita, R., Elommal, N., Baudier, P., & Hikkerova, L. (2020). The digital transformation of external audit and its impact on corporate governance. Technological Forecasting and Social Change, 150, 119751. [Google Scholar] [CrossRef] [Scilit]
- McKnight, D. H., Carter, M., Thatcher, J. B., & Clay, P. F. (2011). Trust in a specific technology: An investigation of its components and measures. ACM Transactions on Management Information Systems, 2(2), 12. [Google Scholar] [CrossRef] [Scilit]
- Ministry of Finance. (2020). Decision No. 345/QĐ-BTC approving the scheme for applying financial reporting standards in Vietnam. Ministry of Finance of Vietnam.
- Ministry of Finance. (2025). Decision No. 3830/QĐ-BTC of 14 November 2025 approving audit firms and practicing auditors eligible to audit public-interest entities in 2026. Ministry of Finance of Vietnam.
- National Assembly of Vietnam. (2011). Law on independent audit (Law No. 67/2011/QH12). Available online: https://vanban.chinhphu.vn/default.aspx?pageid=27160&docid=100155 (accessed on 21 October 2026).
- Nitzl, C., Roldán, J. L., & Cepeda, G. (2016). Mediation analysis in partial least squares path modeling: Helping researchers discuss more sophisticated models. Industrial Management & Data Systems, 116(9), 1849–1864. [Google Scholar] [CrossRef] [Scilit]
- Pedrosa, I., Costa, C. J., & Aparicio, M. (2020). Determinants adoption of computer-assisted auditing tools (CAATs). Cognition, Technology & Work, 22, 565–583. [Google Scholar] [CrossRef] [Scilit]
- Petter, S., DeLone, W., & McLean, E. (2008). Measuring information systems success: Models, dimensions, measures, and interrelationships. European Journal of Information Systems, 17(3), 236–263. [Google Scholar] [CrossRef] [Scilit]
- Petter, S., DeLone, W., & McLean, E. R. (2013). Information systems success: The quest for the independent variables. Journal of Management Information Systems, 29(4), 7–62. [Google Scholar] [CrossRef] [Scilit]
- Podsakoff, P. M., MacKenzie, S. B., Lee, J.-Y., & Podsakoff, N. P. (2003). Common method biases in behavioral research: A critical review of the literature and recommended remedies. Journal of Applied Psychology, 88(5), 879–903. [Google Scholar] [CrossRef] [Scilit] [PubMed]
- Prime Minister of Vietnam. (2020). Decision No. 749/QĐ-TTg approving the national digital transformation program to 2025, with orientation to 2030. Government of Vietnam.
- Qader, K. S., & Cek, K. (2024). Influence of blockchain and artificial intelligence on audit quality: Evidence from Turkey. Heliyon, 10(9), e30166. [Google Scholar] [CrossRef] [Scilit] [PubMed]
- Reuning, K., & Plutzer, E. (2020). Valid vs. invalid straightlining: The complex relationship between straightlining and data quality. Survey Research Methods, 14(5), 439–459. [Google Scholar] [CrossRef]
- Ringle, C. M., Wende, S., & Becker, J.-M. (2024). SmartPLS 4. SmartPLS. Available online: https://www.smartpls.com (accessed on 15 March 2025).
- Rogers, E. M. (2003). Diffusion of innovations (5th ed.). Free Press. [Google Scholar]
- Salijeni, G., Samsonova-Taddei, A., & Turley, S. (2019). Big data and changes in audit technology: Contemplating a research agenda. Accounting and Business Research, 49(1), 95–119. [Google Scholar] [CrossRef] [Scilit]
- Sarstedt, M., Hair, J. F., Cheah, J.-H., Becker, J.-M., & Ringle, C. M. (2019). How to specify, estimate, and validate higher-order constructs in PLS-SEM. Australasian Marketing Journal, 27(3), 197–211. [Google Scholar] [CrossRef] [Scilit]
- Sarstedt, M., Hair, J. F., Pick, M., Liengaard, B. D., Radomir, L., & Ringle, C. M. (2022). Progress in partial least squares structural equation modeling use in marketing research in the last decade. Psychology & Marketing, 39(5), 1035–1064. [Google Scholar] [CrossRef] [Scilit]
- Shmueli, G., Sarstedt, M., Hair, J. F., Cheah, J.-H., Ting, H., Vaithilingam, S., & Ringle, C. M. (2019). Predictive model assessment in PLS-SEM: Guidelines for using PLSpredict. European Journal of Marketing, 53(11), 2322–2347. [Google Scholar] [CrossRef] [Scilit]
- Siew, E.-G., Rosli, K., & Yeow, P. H. P. (2020). Organizational and environmental influences in the adoption of computer-assisted audit tools and techniques (CAATTs) by audit firms in Malaysia. International Journal of Accounting Information Systems, 36, 100445. [Google Scholar] [CrossRef] [Scilit]
- Sweller, J. (1988). Cognitive load during problem solving: Effects on learning. Cognitive Science, 12(2), 257–285. [Google Scholar] [CrossRef] [PubMed]
- Tarek, M., Mohamed, E. K. A., Hussain, M. M., & Basuony, M. A. K. (2017). The implication of information technology on the audit profession in developing country: Extent of use and perceived importance. International Journal of Accounting & Information Management, 25(2), 237–255. [Google Scholar] [CrossRef] [Scilit]
- Thoi bao Tai chinh Viet Nam. (2024). Kiểm soát chặt chất lượng dịch vụ kiểm toán [Tightening control over the quality of audit services]. Available online: https://thoibaotaichinhvietnam.vn/kiem-soat-chat-chat-luong-dich-vu-kiem-toan-146954.html (accessed on 21 October 2026).
- Thottoli, M. M., Ahmed, E. R., & Thomas, K. V. (2022). Emerging technology and auditing practice: Analysis for future directions. European Journal of Management Studies, 27(2), 99–119. [Google Scholar] [CrossRef] [Scilit]
- Tiberius, V., & Hirth, S. (2019). Impacts of digitization on auditing: A Delphi study for Germany. Journal of International Accounting, Auditing and Taxation, 37, 100288. [Google Scholar] [CrossRef] [Scilit]
- Tornatzky, L. G., & Fleischer, M. (1990). The processes of technological innovation. Lexington Books. [Google Scholar]
- Venkatesh, V., Morris, M. G., Davis, G. B., & Davis, F. D. (2003). User acceptance of information technology: Toward a unified view. MIS Quarterly, 27(3), 425–478. [Google Scholar] [CrossRef] [Scilit]
- Vietstock. (2026). Lập đỉnh lợi nhuận 3 năm, Big4 kiểm toán chi hơn 1.9 ngàn tỷ lương thưởng cho nhân viên [Big 4 audit firms reach a three-year profit high]. Available online: https://vietstock.vn/2026/03/lap-dinh-loi-nhuan-3-nam-big4-kiem-toan-chi-hon-19-ngan-ty-luong-thuong-cho-nhan-vien-737-1411766.htm (accessed on 21 October 2026).
- Widuri, R., O’Connell, B., & Yapa, P. W. S. (2016). Adopting generalized audit software: An Indonesian perspective. Managerial Auditing Journal, 31(8/9), 821–841. [Google Scholar] [CrossRef] [Scilit]
- Zhao, X., Lynch, J. G., Jr., & Chen, Q. (2010). Reconsidering Baron and Kenny: Myths and truths about mediation analysis. Journal of Consumer Research, 37(2), 197–206. [Google Scholar] [CrossRef] [Scilit]

Disclaimer/Publisher’s Note: The statements, opinions and data contained in all publications are solely those of the individual author(s) and contributor(s) and not of MDPI and/or the editor(s). MDPI and/or the editor(s) disclaim responsibility for any injury to people or property resulting from any ideas, methods, instructions or products referred to in the content. |
© 2026 by the authors. Licensee MDPI, Basel, Switzerland. This article is an open access article distributed under the terms and conditions of the Creative Commons Attribution (CC BY) license.