


Abstract
Background: Metabolic syndrome (MetS) is a complex systemic disorder involving metabolic dysfunction, chronic low-grade inflammation, and increased cardiovascular risk. Hematological alterations may reflect these systemic disturbances and could provide easily accessible markers of disease progression and response to intervention. This study investigated the effects of a high-fat diet (HFD) and subsequent calorie restriction (CR) on hematological parameters and derived inflammatory indices while exploring the potential involvement of AMP-activated protein kinase (AMPK) signaling. Methods: Eight-week-old male Wistar-Kyoto rats were divided into four groups (n = 9–10/group): CTRL, standard diet for 10 weeks; HFD, 42% high-fat diet for 10 weeks; HFD-CR, 6 weeks of HFD followed by 4 weeks of CR (20% for 2 weeks and 35% for last 2 weeks); and HFD-CR-CC, the same HFD-CR protocol combined with Compound C (1.5 mg/kg, i.p., twice weekly during CR) to inhibit AMPK. Metabolic and biometric parameters, as well as complete blood count (CBC), were recorded. Derived inflammatory indices were calculated from CBC values. Results: HFD induced metabolic alterations accompanied by CBC changes including changes in leukocyte profiles, decreased erythrocyte parameters (erythrocyte count, hematocrit, and hemoglobin concentration), and altered platelet indices. CR reversed some of these changes. AMPK inhibition during CR decreased the proportion of lymphocytes, increased neutrophil counts, and elevated derived inflammatory indices. Conclusions: Results suggest that routine hematological indices may serve as accessible markers of metabolic dysfunction and response to dietary intervention. AMPK may contribute to CR-induced changes in leukocyte profiles. Further investigation of hematological markers might enable earlier diagnosis and more personalized management of MetS.
1. Introduction
Metabolic syndrome (MetS) represents a cluster of cardiometabolic abnormalities, including obesity, insulin resistance, dyslipidemia, hypertension, and impaired glucose metabolism. MetS is driven by excessive caloric intake, ectopic fat accumulation, chronic inflammation, and insulin resistance, resulting in metabolic and vascular dysfunction [1]. Despite advances in treatment, the burden of MetS continues to rise, emphasizing the need for effective preventive and therapeutic approaches [2,3,4,5,6].
Lifestyle modification remains the cornerstone of MetS management. Interventions targeting modifiable risk factors have demonstrated substantial benefits in reducing cardiometabolic risk. Among these approaches, calorie restriction (CR), defined as a reduction in energy intake without malnutrition, has attracted considerable attention due to its favorable effects on metabolic health. Both clinical and experimental studies have shown that CR can improve body weight, adiposity, blood pressure, lipid profile, glucose homeostasis, and insulin sensitivity in individuals with obesity and MetS [7,8,9,10]. Furthermore, prolonged fasting and calorie restriction protocols have been reported to be safe and well tolerated while also improving physical and psychological well-being [11].
One of the key candidates mediating the metabolic adaptations to CR is AMP-activated protein kinase (AMPK), a highly conserved cellular energy sensor that regulates energy homeostasis. AMPK is activated in response to energetic stress characterized by increased AMP/ATP and ADP/ATP ratios, such as during fasting, exercise, hypoxia, or ischemia [12]. AMPK activation promotes ATP-generating pathways and has been associated with improved glucose metabolism, enhanced fatty acid oxidation, reduced lipid accumulation, and lower blood pressure. Because impaired AMPK signaling is linked to several cardiometabolic disorders, AMPK is considered a promising therapeutic target [13]. However, although AMPK is widely regarded as a mediator of CR-induced metabolic benefits, the extent of its contribution remains incompletely understood, as some effects of CR may occur independently of AMPK signaling [14].
In addition to its well-established effects on metabolic and cardiovascular systems, MetS influences hematopoiesis and circulating blood elements. Alterations in complete blood count (CBC)-derived parameters have been associated with obesity, insulin resistance, systemic inflammation, and cardiometabolic risk [15]. Because CBC analysis is inexpensive, routinely available, and widely used in clinical practice, hematological parameters may represent useful biomarkers of disease progression and therapeutic response in MetS. Nevertheless, relatively little is known about the effects of CR on hematological alterations associated with MetS, and the role of AMPK signaling in these responses remains largely unexplored.
Therefore, the present study investigated the effects of a four-week CR intervention on metabolic and hematological parameters in a rat model of high-fat-diet-induced MetS. In addition, we examined the contribution of AMPK signaling by pharmacological inhibition with Compound C. We hypothesized that CR would ameliorate key manifestations of MetS and modify selected CBC parameters, and that these effects would be at least partly mediated by AMPK.
2. Materials and Methods
2.1. Study Design
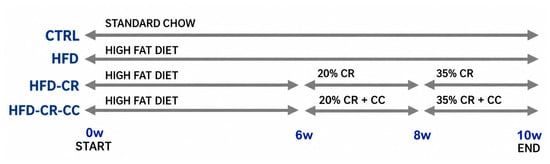
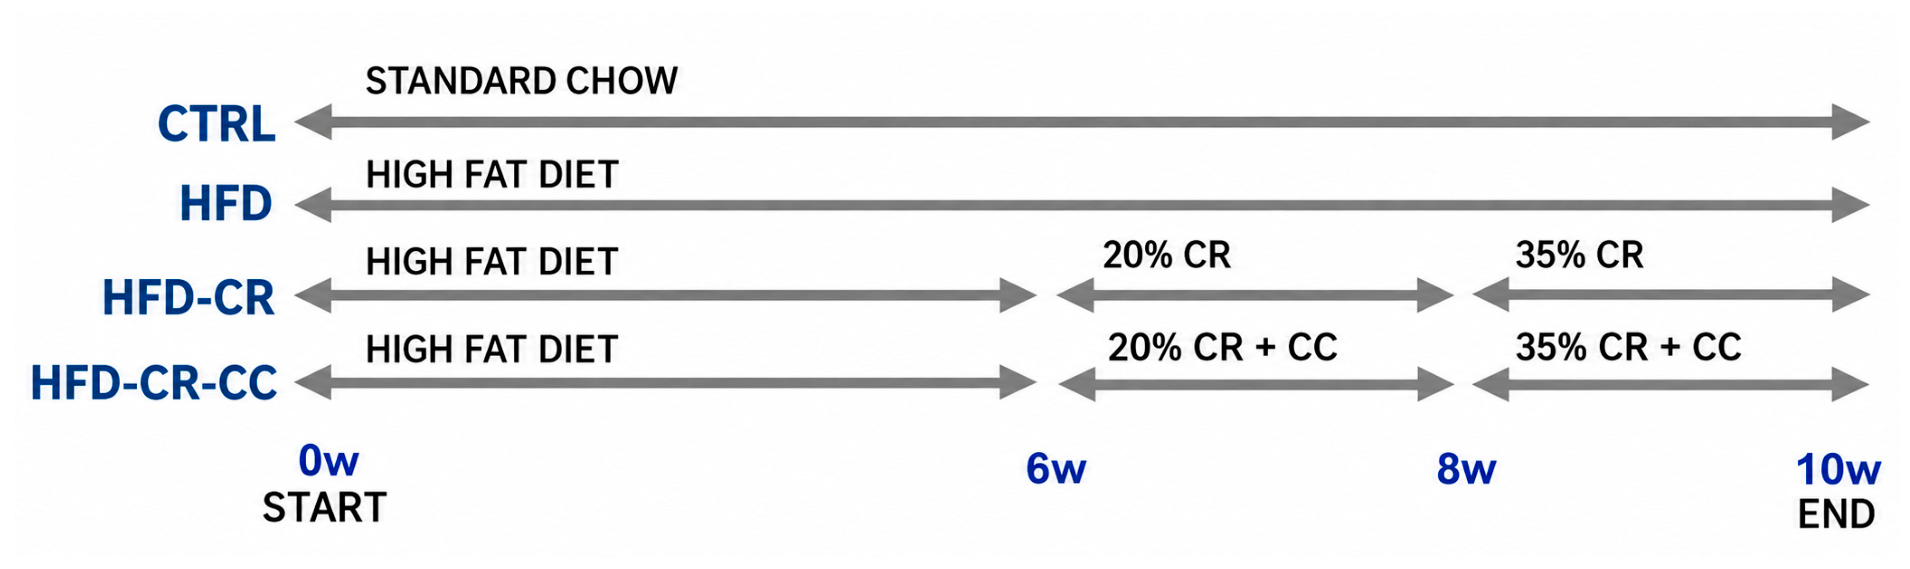
MetS was induced in 8-week-old male Wistar-Kyoto (WKY) rats by administering a high-fat diet (HFD; ssniff, Soest, Germany; #E15721-34) ad libitum for 6 weeks. The diet contained 42% of total energy derived from fat (21.1% of total composition) and 0.21% cholesterol (60.25 kcal/animal/day; 13.17 g/animal/day). Following this period, the animals were divided into three groups: HFD, HFD-CR and HFD-CR-CC. The HFD group (n = 10) continued receiving the HFD ad libitum for an additional 4 weeks. The HFD-CR group (n = 9) received a standard diet with a 20% calorie restriction for 2 weeks (49.39 kcal/animal/day; 13.17 g/animal/day), followed by a 35% reduction in daily calorie intake for the final 2 weeks (40.13 kcal/animal/day; 10.7 g/animal/day). This stepwise approach was used to introduce the restriction gradually and minimize stress to the animals. Food consumption was measured daily by weighing the food. Because the animals were housed two to three per cage, food consumption was measured at the cage level and expressed as a per-animal average. This protocol was adapted from a similar calorie-restriction model previously used in mice, which produced a robust response [16]. To assess the potential involvement of AMPK, the third group (HFD-CR-CC, n = 10) underwent the same dietary protocol as the HFD-CR group and was additionally treated with the AMPK inhibitor Compound C (CC) during the last 4 weeks (1.5 mg/kg in 10% DMSO, i.p., twice weekly). The control group (CTRL, n = 10) received a standard diet for 10 weeks (standard maintenance diet for mice and rats; Altromin, Lage, Germany; #1324P). Animals not treated with CC received the vehicle (10% DMSO, i.p., twice weekly). At the beginning, animals were randomly assigned to the experimental groups. No additional randomization was performed to control for treatment or measurement order or animal/cage location. The experimental design is available in Figure 1.
Figure 1.
Experimental design. Abbreviations: CTRL—control rats fed a standard diet for 10 weeks; HFD—rats fed a high-fat diet for 10 weeks; HFD-CR—rats fed a high-fat diet for 6 weeks followed by 4 weeks of calorie restriction (CR); HFD-CR-CC—rats fed a high-fat diet for 6 weeks followed by 4 weeks of calorie restriction and Compound C (CC) treatment. Calorie restriction was induced in two steps. First, from week 6, the diet was switched from HFD to standard laboratory chow, while food intake was not restricted, resulting in a 20% reduction in energy intake. Second, from week 8, calorie restriction was further intensified by providing a weighed amount of standard chow corresponding to a 35% reduction in energy intake.
At the end of the experiment, all animals were euthanized by isoflurane overdose followed by decapitation. Blood was collected from the right ventricle under deep anesthesia as a terminal procedure after administration of 1 mL of heparin diluted 1:5 in 0.9% saline (1000 IU per rat) and used for further analysis. Rats were born at the Centre of Experimental Medicine, Slovak Academy of Sciences, and housed in groups of 2–3 animals per cage under standard laboratory conditions (12 h light/dark cycle, 22 ± 2 °C, 50 ± 10% humidity) with ad libitum access to food and water, except during the calorie restriction period, which was performed as already described.
Body weight (BW) was monitored weekly throughout the experiment to assess potential deterioration of the animals’ health. At its conclusion, the weights of selected organs and tissues—including the retroperitoneal white adipose tissue (rWAT)—were measured. The relative rWAT content was expressed as the ratio of rWAT mass to total body weight.
All animal procedures complied with the European Guidelines on Laboratory Animal Care and adhered to the recommendations of the Federation of European Laboratory Animal Science Associations (FELASA). The experimental protocol was approved by the Ethics Committee of the Centre of Experimental Medicine, Slovak Academy of Sciences (EC/CEM/2022/4, September 2022; EC/CEM/2024/3, March 2024) and by the State Veterinary and Food Administration of the Slovak Republic (Record No. 8704/2022, File No. 6023/2022-220, approved 11 October 2022; Record No. 3380/2024, File No. 5634/2024-220, approved 18 April 2024).
2.2. Blood Pressure Measurement
Non-invasive systolic blood pressure (sBP) was measured using plethysmography with the CODA system (Kent Scientific Corporation, Torrington, CT, USA). To minimize stress-related variability, animals underwent repeated habituation sessions before data collection. Blood pressure was measured at three time points during the experiment: weeks 0, 6, and 10.
2.3. Determination of Plasma Glucose, Cholesterol and Triglyceride Levels and Oral Glucose Tolerance Test
Glucose and plasma triglyceride (TAG) levels were measured from tail-blood samples using an Accu-Chek glucometer (Roche Diabetes Care GmbH, Mannheim, Germany) and an Accutrend Plus analyzer (Roche Diagnostics, Mannheim, Germany), respectively, according to the manufacturers’ protocols. Measurements were performed at weeks 0, 6, and 10 of the experiment.
The oral glucose tolerance test (OGTT) was performed one day prior to the sacrifice day (week 10) in fasting animals. Glycemia was measured using a glucometer (Roche ACCU-CHECK Aviva, Indianapolis, IN, USA). A glucose solution (1.5 g/kg; Merck KGaA, Darmstadt, Germany) was administered via oral gavage (10 μL/g), and the blood was taken from the tail vein at 0, 15, 30, 60, 90, and 120 min after the glucose administration.
2.4. Complete Blood Count
Whole blood taken at the end of the experiment was analyzed using an automatic hematology analyzer, Abacus Vet 5 (DIATRON, Budapest, Hungary). This analyzer is designed for use with various animal species, including rats. The number of animals analyzed was as follows: CTRL (n = 5), HFD (n = 5), HFD-CR (n = 9), and HFD-CR-CC (n = 10).
To provide a comprehensive characterization of the observed differences, CBC parameters were analyzed separately across the three major components: white blood cell, red blood cell, and platelet parameters. White blood cell assessment comprised total leukocyte count (WBC) and absolute and relative counts of lymphocytes (LYM, LYM%, respectively), monocytes (MON, MON%, respectively), and neutrophils (NEU, NEU%, respectively). These values were further used to calculate the derived inflammatory indices, specifically: the neutrophil-to-lymphocyte ratio (NLR = NEU/LYM), monocyte-to-lymphocyte ratio (MLR = MON/LYM), systemic immune-inflammation index (SII = PLT × NEU/LYM), systemic inflammation response index (SIRI = NEU × MON/LYM), and pan-immune-inflammation value (PIV = NEU × MON × PLT/LYM). Red blood cell analysis included erythrocyte count (RBC), hemoglobin (HGB), hematocrit (HCT), mean cell volume (MCV), mean cell hemoglobin (MCH), mean cell hemoglobin concentration (MCHC), and red blood cell distribution width expressed as coefficient of variation (RDW-CV) and standard deviation (RDW-SD). For the assessment of platelets, platelet count (PLT), plateletcrit (PCT), mean platelet volume (MPV), and platelet distribution width expressed as coefficient of variation (PDW-CV) and standard deviation (PDW-SD) were analyzed.
2.5. Statistical Analysis
The data are presented as the mean ± standard deviation or median and interquartile range where appropriate. Statistical significance of differences between the groups was analyzed using one-way ANOVA or the Kruskal–Wallis test (based on data normality tested by the Shapiro–Wilk test). Sidak’s or Dunn’s post hoc tests were used to correct for multiple comparisons. Parameters measured repeatedly over time were analyzed using a mixed-effects model, followed by Sidak’s post hoc test. Post hoc analyses were performed to compare the following groups: CTRL vs. HFD, CTRL vs. HFD-CR, HFD vs. HFD-CR, and HFD-CR vs. HFD-CR-CC. Outliers were identified with the Grubbs test. The differences were considered to be significant at p < 0.05. GraphPad Prism 8.2.1 software was used for all statistical analyses.
3. Results
3.1. Biometric and Biochemical Parameters Relevant to MetS
Biometric and biochemical parameters associated with MetS and assessed at the end of the experiment (BW, rWAT%, OGTT, glycemia, cholesterol, TAG and sBP) are summarized in Table 1. All parameters were significantly affected by both HFD and the CR diet, whereas CC administration had no effect. In addition, the CR diet induced a statistically significant decrease in BW, the rWAT/BW ratio, and sBP in comparison with the CTRL group.
Table 1.
Biometric and biochemical parameters.
3.2. Longitudinal Changes in Selected Biometric and Metabolic Parameters
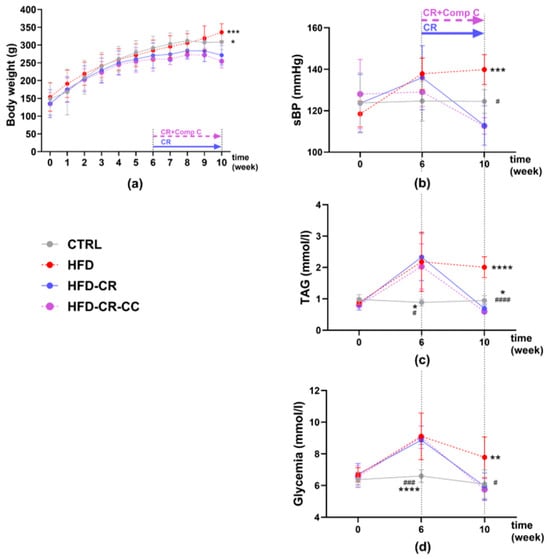
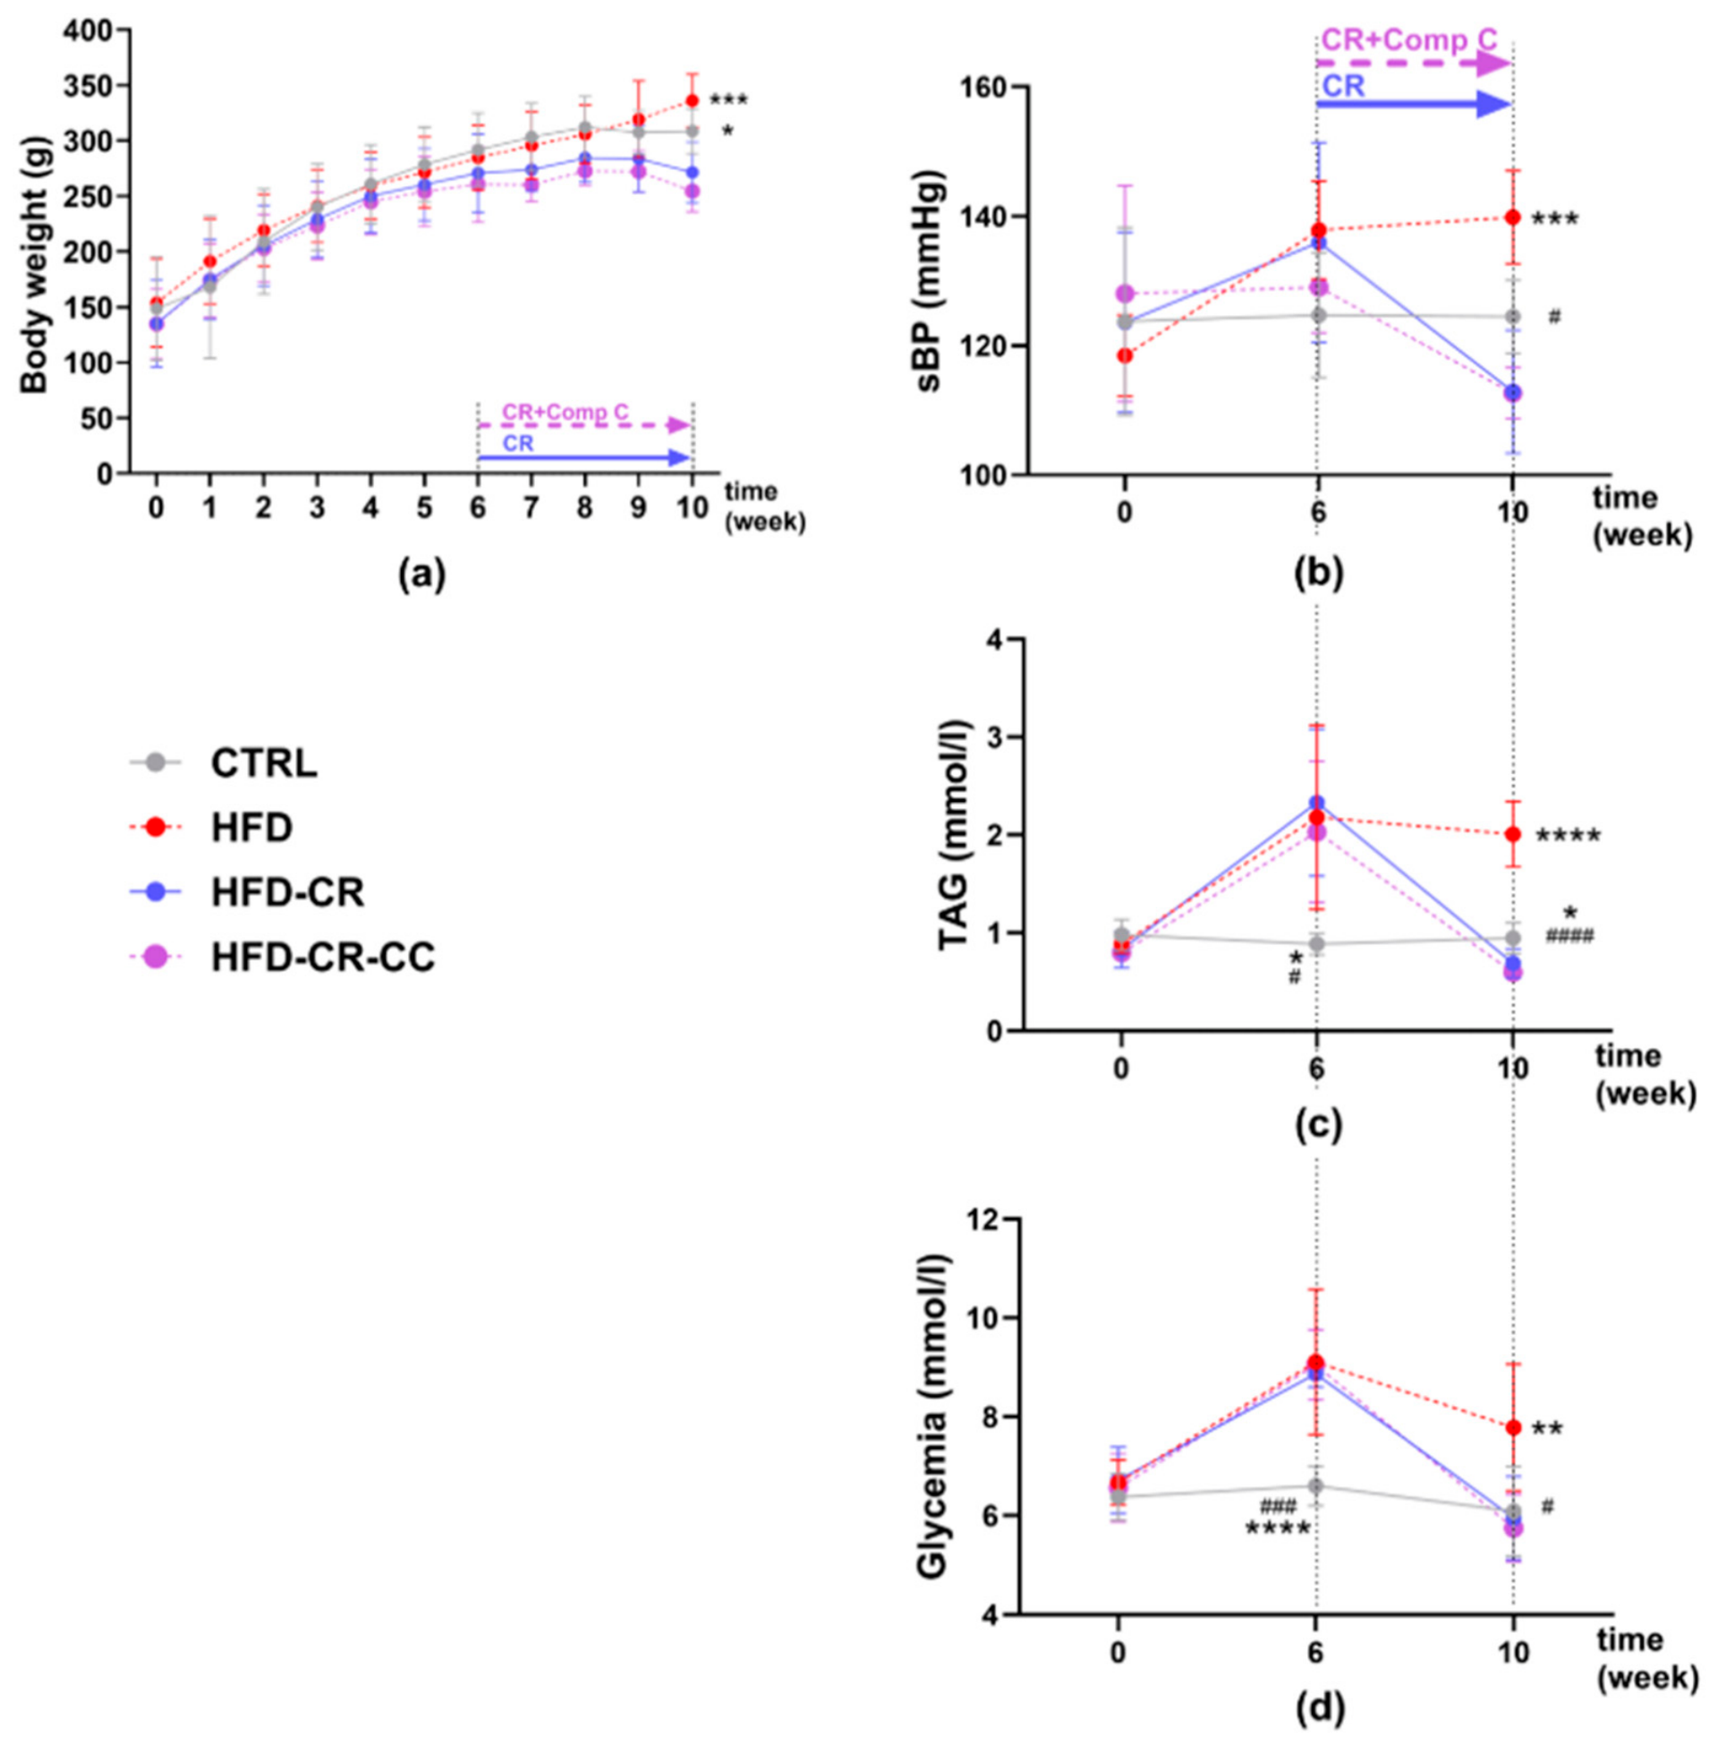
Mean values of BW, glycemia, TAG, and sBP over time are shown in Figure 2. In contrast to the other results presented, these data were analyzed using a mixed-effects model, which enabled the evaluation of differences between groups at individual time points as well as changes over time within each group.
Figure 2.
Changes in metabolic syndrome-related parameters over time—body weight (a), systolic blood pressure (b), plasma triacylglycerol levels (c), and glycemia (d). Body weight was assessed weekly from week 0 to week 10. Other parameters were measured at weeks 0, 6 (when the calorie restriction protocol and Compound C administration were initiated), and 10. Calorie restriction was induced in two steps. First, from week 6, the diet was switched from HFD to standard laboratory chow, while food intake was not restricted, resulting in a 20% reduction in energy intake. Second, from week 8, calorie restriction was further intensified by providing a weighed amount of standard chow corresponding to a 35% reduction in energy intake. Statistical significance was evaluated using a mixed-effects model, followed by Sidak’s multiple comparisons test to evaluate differences between groups at each time point. Significance: * p < 0.05, ** p < 0.01, *** p < 0.001, **** p < 0.0001 versus HFD-CR; # p < 0.05, ### p < 0.001, #### p < 0.0001 versus HFD (n = 5–10). Abbreviations: CTRL—control rats fed a standard diet for 10 weeks; HFD—rats fed a high-fat diet for 10 weeks; HFD-CR—rats fed a high-fat diet for 6 weeks followed by 4 weeks of calorie restriction; HFD-CR-CC—rats fed a high-fat diet for 6 weeks followed by 4 weeks of calorie restriction and Compound C treatment; sBP—systolic blood pressure; TAG—plasma triacylglycerol levels; CC—Compound C treatment; CR—calorie restriction.
None of the measured parameters differed significantly among the experimental groups at baseline (week 0). BW remained comparable between groups until week 9. At the end of the experiment (week 10), the HFD-CR group had significantly lower BW than both the HFD group (p = 0.0004) and the CTRL group (p = 0.019) (Figure 2a).
Similarly, no significant differences in sBP were observed among the groups at baseline or at the beginning of the treatment period (week 6). At the end of the experiment, sBP was significantly higher in the HFD group than in the CTRL group (p = 0.01). The HFD-CR group exhibited significantly lower sBP than the HFD group (p = 0.0004) (Figure 2b).
In contrast, TAG levels were already elevated at week 6 in all HFD-fed groups compared with the CTRL group (mmol/L: 2.18 ± 0.94 in HFD, 2.33 ± 0.75 in HFD-CR, 2.03 ± 0.72 in HFD-CR-CC, and 0.89 ± 0.11 in CTRL), with significant differences between CTRL and HFD (p = 0.011) and between CTRL and HFD-CR (p = 0.03) (Figure 2c). By the end of the experiment, TAG levels remained significantly higher in the HFD group than in all other groups (p < 0.0001). In addition, TAG levels in the HFD-CR group were significantly lower than those in the CTRL group (p = 0.034).
A similar pattern was observed for glycemia at week 6. HFD-fed groups exhibited higher glycemia than the CTRL group (mmol/L: 9.1 ± 1.5 in HFD, 8.9 ± 0.3 in HFD-CR, 9.1 ± 0.7 in HFD-CR-CC, and 6.6 ± 0.4 in CTRL), with significant differences between CTRL and HFD (p = 0.004) and between CTRL and HFD-CR (p < 0.0001). By the end of the experiment, CR reduced glycemia in the HFD-CR group to levels comparable to those in the CTRL group. At this time point, glycemia remained significantly higher in the HFD group than in both the CTRL group (p = 0.015) and the HFD-CR group (p = 0.01) (Figure 2d).
Regarding changes over time within each experimental group, BW increased in the CTRL group until week 8 (week 6 vs. week 8, p = 0.013), whereas in the HFD group the increase in BW continued and a significant increase was observed even between weeks 7 and 10 (p = 0.035). In both CR groups, BW increased until week 6 (HFD-CR: week 4 vs. week 6, p = 0.007; HFD-CR-CC: week 5 vs. week 6, p = 0.009). In the HFD-CR-CC group, BW increased again between weeks 7 and 9 (p = 0.0004), followed by a significant decrease during the final week of the experiment (p = 0.0006) (Figure 2a).
In the CTRL group, sBP remained unchanged throughout the experiment. In the HFD group, sBP increased by week 6 (p = 0.008) and remained significantly elevated at the end of the experiment (p = 0.024). In the HFD-CR group, neither the initial increase nor the subsequent decrease in sBP reached statistical significance (p = 0.23 and p = 0.065, respectively). In the HFD-CR-CC group, sBP did not change significantly at week 6 but decreased significantly by the end of the experiment (p = 0.016) (Figure 2b).
In the CTRL group, TAG levels remained unchanged throughout the experiment. TAG levels increased in all HFD-fed groups (p-values ranging from 0.011 to 0.041). In the HFD group, TAG levels remained elevated until the end of the experiment (week 0 vs. week 10, p = 0.001). In both CR groups, TAG levels decreased between weeks 6 and 10 (p = 0.01 for both groups). In the HFD-CR-CC group, TAG levels decreased even below baseline values (week 0 vs. week 10, p = 0.0003), whereas the corresponding decrease in the HFD-CR group did not reach statistical significance (p = 0.052) (Figure 2c).
Glycemia followed a similar pattern and remained unchanged throughout the experiment in the CTRL group. In all HFD-fed groups, glycemia increased by week 6 (p-values < 0.006). By the end of the experiment, glycemia remained elevated only in the HFD group (week 0 vs. week 10, p = 0.048). In both CR groups, glycemia decreased between weeks 6 and 10 (p < 0.0001 for both groups) to levels comparable to baseline values (Figure 2d).
3.3. Red Blood Cell Parameters
After 10 weeks of HFD feeding, RBC, HGB, and HCT were significantly reduced compared with the CTRL group, whereas the remaining parameters were unaffected. Calorie restriction significantly increased RBC, HCT, and HGB compared with the HFD group. Administration of CC did not significantly modify any red blood cell parameter. Complete data and statistical analyses are provided in Table 2.
Table 2.
Red blood cell parameters in experimental groups.
3.4. White Blood Cell Parameters
The HFD group exhibited significantly greater values of MON and SIRI. The other parameters did not differ significantly between groups, although WBC, MON%, and MLR showed a tendency toward higher values (p = 0.0645, p = 0.0676, and p = 0.0515, respectively).
In the HFD-CR group, lower levels of MON, MON%, MLR, SIRI, and PIV were observed, while LYM% showed an upward trend (p = 0.0788) compared with the HFD group. The HFD-CR group also exhibited lower values of NEU%, NLR, and SII and higher values of LYM% compared with the CTRL group.
In the HFD-CR-CC group, significantly higher values of NEU, NEU%, and all inflammatory indices (NLR, SII, MLR, SIRI, and PIV), as well as an upward trend in MON% (p = 0.0526), were observed compared with the HFD-CR group, whereas LYM% was lower. The other leukocyte parameters did not differ significantly. Full data and statistical analyses are presented in Table 3.
Table 3.
White blood cell parameters in experimental groups.
3.5. Platelet Parameters
In the HFD group, PDW-SD and PDW-CV were significantly lower than those observed in animals fed a standard diet. However, CR did not significantly affect PDW-SD or PDW-CV. Interestingly, MPV was not altered by the HFD, whereas CR resulted in lower MPV values compared with the CTRL group. The other platelet parameters were not significantly affected by CR. Moreover, treatment with the Compound C inhibitor did not significantly affect any platelet parameter in CR animals (Table 4).
Table 4.
Platelet parameters in experimental groups.
Data for all outcomes, including sample size per group, mean difference, confidence intervals, p-values, and effect sizes, are provided in the Supplementary Material.
4. Discussion
In this study, both HFD and 4-week-CR modified several CBC parameters, and CR was able to reverse or prevent some, although not all, of the HFD-induced changes. Furthermore, the findings support the involvement of AMPK in pathways that may contribute to at least some of the observed effects of CR. Although AMPK expression and activation were not directly assessed in the present study, the inhibitory effect of Compound C on AMPK was confirmed in our previous experiments, where the same treatment regimen resulted in a significant reduction in AMPK activity [17]. Therefore, the effects of Compound C observed in the present study can be interpreted in the context of experimentally validated AMPK inhibition.
4.1. Effectiveness of the Model to Induce MetS
HFD-induced obesity is a well-established model for studying MetS [18]. After 6 weeks, all HFD groups showed significantly increased TAG, fasting glycemia, and OGTT compared with CTRL, whereas BW and sBP remained unchanged, indicating that metabolic alterations may precede changes in body weight and blood pressure. Similarly, Maysami et al. reported increased glycemia after 2 months of HFD without elevated sBP after 3 or 6 months [19]. In humans, elevated TAG, fasting glycemia, or blood pressure may also precede abdominal obesity, highlighting the importance of early MetS screening [20]. After 10 weeks, all measured MetS-related parameters, including BW, rWAT%, and sBP, were significantly increased in HFD rats compared with CTRL. These findings are consistent with previous reports of altered lipid profiles following 6–12 w of HFD [21,22]. Overall, a 40% HFD effectively induced MetS in WKY rats after 10 weeks, with metabolic alterations already evident after 6 weeks.
4.2. Effectiveness of CR on Metabolic Syndrome or Prevention of MetS
Intermittent fasting, time-restricted eating, and CR are increasingly used long-term strategies for weight management and reducing the risk of diabetes and cardiovascular disease [23]. The used CR protocol consisted of 2 weeks of standard chow followed by 2 weeks of reduced caloric intake. This gradual dietary transition was intended to minimize stress that could interfere with measured parameters or the effectiveness of weight reduction. After 2 weeks of CR, BW did not differ significantly between HFD and HFD-CR groups; however, by the end of the experiment, BW in HFD-CR rats was significantly lower than in both HFD and CTRL groups. As BW is an indirect and potentially imprecise marker of metabolic risk [24], rWAT was used as a more direct indicator of visceral adiposity. Visceral fat is strongly associated with cardiometabolic disease, and its reduction improves blood pressure, lipid profiles, glycated hemoglobin, and insulin resistance [25]. Results of this study demonstrate that CR effectively reduced both BW and visceral fat, with rWAT falling even below CTRL levels. This was accompanied by normalization of all measured MetS components, with sBP decreasing below CTRL levels. As sBP was not elevated after 6 weeks of HFD, this finding may indicate relative resistance of blood pressure regulatory mechanisms to HFD-induced metabolic disturbances in WKY rats. The reduction in sBP observed in the HFD-CR group to levels below those of the control animals should be interpreted in the context of the marked reduction in BW and adiposity induced by CR. Decreased calorie intake can rapidly reduce blood pressure and attenuate metabolic disturbances in obesity. Obesity-related hypertension is characterized by increased activity of both the sympathetic nervous system and the renin–angiotensin–aldosterone system, whereas weight loss has been shown to attenuate sympathetic overactivity [26]. Therefore, the observed decrease in sBP likely reflects the metabolic and hemodynamic consequences of CR rather than a direct improvement in vascular function.
4.3. White Blood Cell Parameters
MetS is associated with chronic low-grade inflammation, which contributes to obesity-related metabolic dysfunction. Higher body mass index is associated with increased total WBC, neutrophil, and lymphocyte counts, potentially driven by proinflammatory mediators released from adipose tissue [27,28].
In this study, 10 weeks of 40% HFD did not significantly alter total WBC, although an upward trend was observed (p = 0.0645); however, an increase was observed in the count of monocytes. Given that macrophages, derived from monocytes, can constitute up to 50% of hypertrophic obese adipose tissue compared with 5–10% in healthy tissue [29], the increase in MON may reflect early HFD-induced inflammation. Previous studies have reported inconsistent effects of HFD on leukocytes, with increases in MON after 8 weeks but not 6 months in mice, and variable changes in WBC, LYM, and granulocytes in rats following 6–12 weeks of HFD [19,21,22,30]. These discrepancies may reflect differences in HFD duration, animal strain, and dietary macro- and micronutrient composition [31,32,33,34]. In this study, changes in leukocyte profile were further supported by increased SIRI and a trend toward higher MLR in HFD animals. SIRI, SII, and PIV have been associated with MetS, although their sensitivity appears to depend on population and disease context. SIRI has been associated with MetS severity in adults with severe obesity and may outperform SII in predicting mortality, whereas SII may be more discriminative for MetS in obese children [35,36,37,38]. Thus, CBC-derived inflammatory indices may have differential utility depending on the clinical context.
Weight loss and dietary modification are known to reduce systemic inflammation and leukocyte counts [29,39,40,41]. In this study, 4 weeks of CR significantly reduced MON and MON% compared with HFD, consistent with evidence that weight loss with a normal diet, but not HFD-based CR, can normalize inflammatory monocytes and attenuate hepatic inflammation [39]. Moreover, CR reduced SIRI, PIV, and MLR, supporting an anti-inflammatory effect and suggesting that dietary quality contributes to these effects beyond weight loss alone.
AMPK, being an important immunometabolic regulator, modulates leukocyte metabolism and inflammatory responses [42,43]. In this study, pharmacological AMPK inhibition with CC during CR increased NEU, NEU%, and all derived inflammatory indices (NLR, SII, MLR, SIRI, and PIV), with a strong trend toward increased MON%. These findings are consistent with reports that CR increases AMPK activity and reduces inflammatory stress [44], while AMPK activation suppresses neutrophilia and its inhibition reverses this effect [45]. AMPK also regulates hematopoietic stem and progenitor cells and limits excessive myelopoiesis and monocyte production under pathological conditions [46,47].
Overall, present findings suggest that CR exerts anti-inflammatory effects on the leukogram and inflammatory indices, potentially involving AMPK signaling. However, the AMPK dependence of these effects requires further investigation, as some leukocyte parameters were unaffected by CR alone but changed following AMPK inhibition.
4.4. Red Blood Cell Parameters
After 10 weeks of HFD, RBC, HCT, and HGB were significantly decreased compared with CTRL. Mean HGB in HFD rats was below the lower reference limit for age-matched male Wistar rats, while HCT was also below and RBC reached the lower limit, suggesting a tendency toward anemia [48]. MCV, MCH, and MCHC were unaffected, consistent with the predominantly normocytic, normochromic pattern of anemia associated with chronic inflammation, which may become microcytic and hypochromic at later stages [49].
Obesity-related anemia is strongly linked to chronic low-grade inflammation. Increased cytokines, particularly IL-6, stimulate hepatic hepcidin production, reducing intestinal iron absorption and trapping iron within the reticuloendothelial system [50]. Inflammation may additionally suppress erythropoiesis and shorten RBC lifespan [51], while HFD-induced eryptosis and subsequent clearance by Kupffer cells have also been reported [52]. Consistent with the anti-inflammatory effects of weight loss, CR increased RBC parameters in this study. Future studies should assess iron, transferrin, ferritin, and reticulocytes to clarify the underlying mechanism [53]. Vitamin B12 deficiency is less likely given the absence of macrocytosis, although altered hematopoiesis may also contribute. In addition, obesity-related activation of the sympathetic nervous system, renin–angiotensin–aldosterone system, and hyperinsulinemia may promote sodium retention, plasma expansion, and hemodilution, potentially contributing to reduced RBC parameters [54].
AMPK contributes to erythropoiesis and erythrocyte survival, with AMPK deficiency associated with anemia and increased erythrocyte turnover [55,56]. However, AMPK inhibition with CC did not decrease RBC in this study, suggesting that the effects of CR on erythrocytes may involve pathways other than AMPK. Alternatively, HFD may have already impaired AMPK signaling, the CC dose may have been insufficient, or its reversible inhibition may have limited the effect. Moreover, CC can inhibit bone morphogenetic protein signaling and suppress hepcidin expression, potentially increasing iron availability and counteracting inflammation-related effects on erythropoiesis [57]. More specific pharmacological and genetic approaches are therefore needed to clarify the contribution of AMPK and related pathways to CR-mediated protection against HFD-induced erythrocyte alterations.
4.5. Platelet Parameters
MetS is considered a prothrombotic state characterized by enhanced platelet aggregability and reduced fibrinolytic potential [58,59,60]. In this study, HFD significantly decreased PDW-SD and PDW-CV compared with CTRL, without altering other parameters. These findings are consistent with previous reports showing that HFD can impair platelet production and enhance platelet clearance and thrombotic reactivity. Increased dietary saturated fatty acids may alter megakaryocyte membrane composition and reduce platelet production [58], while obesity can increase megakaryocyte mass, impair platelet release, and enhance platelet clearance and thrombogenicity [61]. HFD has also been associated with increased platelet aggregation and pulmonary thrombus formation in rats [62]. It may contribute to the reduced PDW observed in HFD animals, indicating a more uniform platelet population [63]. MPV decreased after CR despite being unaffected by HFD, potentially reflecting increased production of smaller, less reactive platelets.
The role of AMPK in platelet function remains unclear. AMPK inhibition has been reported to both enhance and inhibit platelet activation depending on the experimental context, while AMPK activation can suppress aggregation through the NO-cGMP-PKG pathway [64,65,66,67]. In this study, CC did not alter PCT or other platelet parameters in HFD-CR rats, suggesting that AMPK may not be essential for the platelet effects of CR in this model. Alternatively, its role may depend on the pathological context, with AMPK-independent pathways also contributing. Future studies using more specific AMPK modulation are needed to clarify its role in platelet homeostasis during CR in MetS.
4.6. Considerations for Interpretation
The findings of the present study should be considered in light of several factors. First, the relatively small number of animals per group may have reduced statistical power. However, this was partly offset by the use of genetically homogeneous animals maintained under strictly controlled dietary and environmental conditions, minimizing confounding factors commonly present in human studies, such as age, medication, comorbidities, and nutritional or lifestyle habits. Second, the lack of longitudinal assessment prevented us from determining the temporal development of hematological changes during obesity progression and before the initiation of CR. Consequently, it remains unclear whether these changes were already present at week 6, when CR was initiated, and subsequently reversed by CR, or whether they had not yet developed despite the presence of metabolic alterations. Third, the use of young animals may limit the generalizability of the findings to older populations, in whom MetS is more prevalent and may be accompanied by age-related physiological changes. Fourth, the HFD-CR groups underwent both CR and a switch from an HFD to standard chow. Therefore, the observed improvements cannot be attributed solely to reduced calorie intake; they may also reflect differences in dietary fat content, energy density, macronutrient composition, and other characteristics of the diets. Previous studies have highlighted that high-fat diets and standard chow differ in more than their caloric content, which may confound the interpretation of metabolic outcomes. Future studies using isocaloric pair-feeding or diets matched for macronutrient composition would help distinguish the effects of CR from those of dietary composition. Another limitation is that only male rats were included in the present study. Because metabolic, inflammatory, and cardiovascular responses to high-fat diet feeding and calorie restriction may differ between sexes, the present findings should be interpreted with caution and may not be directly generalizable to female animals. Future studies including both sexes would be needed to assess potential sex-specific effects of HFD, CR, and Compound C treatment. Moreover, the study lacks an HFD + Compound C group without CR. Although this is beyond the scope of the present study, the absence of such a group makes it difficult to determine whether Compound C specifically interferes with the effects of CR or independently affects circulating leukocyte profiles and inflammatory indices. Including this group would allow a more direct assessment of the interaction between CR and Compound C treatment. Nevertheless, our previous study demonstrated that Compound C did not further aggravate most cardiometabolic comorbidities induced by metabolic dysbalance, oxidative stress, inflammation, and endothelial dysfunction, which were already present in male rats fed an HFD [17]. Finally, although Compound C is widely used as a pharmacological AMPK inhibitor, it lacks high selectivity and may affect signaling pathways beyond AMPK. Therefore, potential off-target effects should be considered when interpreting findings of this study. Future studies using more selective pharmacological or genetic approaches to modulate AMPK are needed to clarify its specific contribution to the observed effects.
5. Conclusions
In conclusion, HFD-induced metabolic and hematological alterations are characteristic of MetS, while CR effectively reversed/prevented most of these changes. Obesity was associated with impaired erythrocyte, leukocyte and platelet homeostasis, showing an increased propensity for anemia and thrombus formation, whereas CR improved several hematologic parameters. Results of this study suggest that AMPK may contribute to the leukocyte profile changes induced by CR, although circulating inflammatory cytokine levels were not directly measured. The main novelty of this study is the comprehensive assessment of CBC parameters, CBC-derived inflammatory indices, and platelet characteristics modified by HFD as well as dietary intervention in WKY rats. Furthermore, results suggest that the beneficial effects of CR in HFD-induced metabolic alterations are probably not solely mediated by AMPK signaling and might involve additional regulatory pathways. Given the known off-target effects of Compound C, further studies using more selective approaches are needed to clarify the contribution of AMPK signaling in hematological changes induced by HFD and CR. These findings highlight the potential value of routine hematological parameters as readily available markers of metabolic dysfunction and its improvement following dietary intervention, as well as their potential sensitivity to AMPK activators such as metformin—a drug used in the treatment of diabetes mellitus type 2. More comprehensive patient stratification according to age, obesity severity, metabolic status, inflammatory profile, therapy and associated comorbidities such as anemia or thrombophilia could help better define the mechanisms leading to metabolic and other systemic alterations in MetS, to improve treatment efficacy, and to support the translation of these findings into more personalized medicine.
Supplementary Materials
The following supporting information can be downloaded at https://www.mdpi.com/article/10.3390/pathophysiology33040094/s1, Supplementary material contains data for all outcomes, including sample size per group, mean difference, confidence intervals, p-values, and effect sizes.
Author Contributions
Conceptualization, M.T. and J.R.; validation, J.R.; formal analysis, T.J., J.R.; investigation, D.R., P.B., M.T. and J.R.; resources, M.T.; data curation, I.S., M.T. and J.R.; writing—original draft preparation, I.S.; writing—review and editing, T.J., D.R., and J.R.; visualization, I.S. and P.B.; supervision, J.R.; project administration, M.T.; funding acquisition, M.T. All authors have read and agreed to the published version of the manuscript.
Funding
This research was funded by the Slovak Research and Development Agency, grant numbers APVV-22-0154, VEGA 2/0123/24 and 09I03-03-V06-00060.
Institutional Review Board Statement
This study followed the European Guidelines on Laboratory Animal Care and aligned with the Federation of European Laboratory Animal Science Associations (FELASA) guidelines. This animal study protocol was approved by the Ethics Committee of the Centre of Experimental Medicine of the Slovak Academy of Sciences (EC/CEM/2022/4, dated September 2022; and EC/CEM/2024/3, dated March 2024) and by the State Veterinary and Food Administration of the Slovak Republic (Record No.: 8704/2022, File No.: 6023/2022-220, dated 11 October 2022; Record No.: 3380/2024, File No.: 5634/2024-220, dated 18 April 2024).
Informed Consent Statement
Not applicable.
Data Availability Statement
The data supporting the findings of this study are available within this manuscript and Supplementary Material. Detailed data are available from the corresponding author, J.R., upon reasonable request.
Acknowledgments
The authors gratefully acknowledge Angelika Puzserova for preparing the graphical abstract using BioRender (created in BioRender. Puzserova, A. (2026) https://BioRender.com/xgf5ljj, accessed on 11 November 2026).
Conflicts of Interest
The authors declare no conflicts of interest.
References
- Jankowska-Steifer, E.; Ratajska, A.; Flaht-Zabost, A.; Radomska-Leśniewska, D.M.; Badurek, I.; Kiernozek, E.; Moskalik, A.; Majchrzak, B.; Bartkowiak, M.; Bartkowiak, K.; et al. Metabolic Syndrome-Driven Changes in Cardiac Lymphatic Endothelium: MRNA Expression and Emerging Questions. Pathophysiology 2026, 33, 4. [Google Scholar] [CrossRef] [Scilit] [PubMed]
- Handelsman, Y.; Butler, J.; Bakris, G.L.; DeFronzo, R.A.; Fonarow, G.C.; Green, J.B.; Grunberger, G.; Januzzi, J.L.; Klein, S.; Kushner, P.R.; et al. Early intervention and intensive management of patients with diabetes, cardiorenal, and metabolic diseases. J. Diabetes Its Complicat. 2023, 37, 108389. [Google Scholar] [CrossRef] [Scilit] [PubMed]
- Zhang, B.; Shi, H.; Cai, W.; Yang, B.; Xiu, W. Metabolic syndrome in children and adolescents: Definitions, epidemiology, pathophysiology, interventions, and challenges. Front Endocrinol. 2025, 16, 1512642. [Google Scholar] [CrossRef] [Scilit] [PubMed]
- Rai, High-Fat Diet, Epigenetics, and Atherosclerosis: A Narrative Review. Nutrients 2024, 17, 127. [Google Scholar] [CrossRef] [Scilit] [PubMed]
- Janssen, J.A.M.J.L. The Causal Role of Ectopic Fat Deposition in the Pathogenesis of Metabolic Syndrome. Int. J. Mol. Sci. 2024, 25, 13238. [Google Scholar] [CrossRef] [Scilit] [PubMed]
- Peterseim, C.M.; Jabbour, K.; Mulki, A.K. Metabolic Syndrome: An Updated Review on Diagnosis and Treatment for Primary Care Clinicians. J. Prim. Care Community Health 2024, 15, 21501319241309168. [Google Scholar] [CrossRef] [Scilit] [PubMed]
- Kunduraci, Y.E.; Ozbek, H. Does the Energy Restriction Intermittent Fasting Diet Alleviate Metabolic Syndrome Biomarkers? A Randomized Controlled Trial. Nutrients 2020, 12, 3213. [Google Scholar] [CrossRef] [Scilit] [PubMed]
- Guevara-Cruz, M.; Flores-López, A.G.; Aguilar-López, M.; Sánchez-Tapia, M.; Medina-Vera, I.; Díaz, D.; Tovar, A.R.; Torres, N. Improvement of Lipoprotein Profile and Metabolic Endotoxemia by a Lifestyle Intervention That Modifies the Gut Microbiota in Subjects With Metabolic Syndrome. J. Am. Heart Assoc. 2019, 8, e012401. [Google Scholar] [CrossRef] [Scilit] [PubMed]
- Montefusco, L.; D’Addio, F.; Loretelli, C.; Ben Nasr, M.; Garziano, M.; Rossi, A.; Pastore, I.; Plebani, L.; Lunati, M.E.; Bolla, A.M.; et al. Anti-inflammatory effects of diet and caloric restriction in metabolic syndrome. J. Endocrinol. Investig. 2021, 44, 2407–2415. [Google Scholar] [CrossRef] [Scilit] [PubMed]
- Vidal, A.; Rios, R.; Pineda, C.; Lopez, I.; Rodriguez, M.; Aguilera-Tejero, E.; Raya, A.I. Effect of caloric restriction on phosphate metabolism and uremic vascular calcification. Am. J. Physiol.-Ren. Physiol. 2020, 318, F1188–F1198. [Google Scholar] [CrossRef] [Scilit] [PubMed]
- Wilhelmi de Toledo, F.; Grundler, F.; Sirtori, C.R.; Ruscica, M. Unravelling the health effects of fasting: A long road from obesity treatment to healthy life span increase and improved cognition. Ann. Med. 2020, 52, 147–161. [Google Scholar] [CrossRef] [Scilit] [PubMed]
- Yumoto, T.; Coopersmith, C.M. Targeting AMP-activated protein kinase in sepsis. Front Endocrinol. 2024, 15, 1452993. [Google Scholar] [CrossRef] [Scilit] [PubMed]
- Viollet, B.; Lantier, L.; Devin-Leclerc, J.; Hébrard, S.; Amouyal, C.; Mounier, R.; Foretz, M.; Andreelli, F. Targeting the AMPK pathway for the treatment of Type 2 diabetes. Front. Biosci. 2009, 14, 3380–3400. [Google Scholar] [CrossRef] [Scilit] [PubMed]
- Cantó, C.; Auwerx, J. Calorie Restriction: Is AMPK a Key Sensor and Effector? Physiology 2011, 26, 214–224. [Google Scholar] [CrossRef] [Scilit] [PubMed]
- Šebeková, K.; Gurecká, R.; Podracká, Ľ. Association of Leukocyte, Erythrocyte, and Platelet Counts with Metabolic Syndrome and Its Components in Young Individuals without Overt Signs of Inflammation: A Cross-Sectional Study. Children 2024, 11, 66. [Google Scholar] [CrossRef] [Scilit] [PubMed]
- Kvandová, M.; Rajlic, S.; Stamm, P.; Schmal, I.; Mihaliková, D.; Kuntic, M.; Bayo Jimenez, M.T.; Hahad, O.; Kollárová, M.; Ubbens, H.; et al. Mitigation of aircraft noise-induced vascular dysfunction and oxidative stress by exercise, fasting, and pharmacological α1AMPK activation: Molecular proof of a protective key role of endothelial α1AMPK against environmental noise exposure. Eur. J. Prev. Cardiol. 2023, 30, 1554–1568. [Google Scholar] [CrossRef] [Scilit] [PubMed]
- Kvandova, M.; Zemancikova, A.; Berenyiova, A.; Waczulikova, I.; Magyarova, S.; Micurova, A.; Torok, J.; Grman, M.; Tomasova, L.; Misak, A.; et al. Sex-Specific Cardiovascular Protection in Developing Metabolic Syndrome: The Role of AMPK. Antioxidants 2025, 14, 843. [Google Scholar] [CrossRef] [Scilit] [PubMed]
- Marques, C.; Meireles, M.; Norberto, S.; Leite, J.; Freitas, J.; Pestana, D.; Faria, A.; Calhau, C. High-fat diet-induced obesity Rat model: A comparison between Wistar and Sprague-Dawley Rat. Adipocyte 2016, 5, 11–21. [Google Scholar] [CrossRef] [Scilit] [PubMed]
- Maysami, S.; Haley, M.J.; Gorenkova, N.; Krishnan, S.; McColl, B.W.; Lawrence, C.B. Prolonged diet-induced obesity in mice modifies the inflammatory response and leads to worse outcome after stroke. J. Neuroinflamm. 2015, 12, 140. [Google Scholar] [CrossRef] [Scilit] [PubMed]
- Kim, H.S.; Yoo, J. Temporal Sequence of Metabolic Syndrome Components: Abdominal Obesity as the Primary Driver of Progression in a Korean Prospective Cohort Study. Medicina 2025, 61, 1498. [Google Scholar] [CrossRef] [Scilit] [PubMed]
- Shawky, S.M. Effect of Short-Term High Fat Diet Inducing Obesity on Hematological, Some Biochemical Parameters and Testicular Oxidative Stress in Male Rats. J. Adv. Vet. Res. 2015, 5, 151–156. Available online: https://advetresearch.com/index.php/AVR/article/view/59 (accessed on 13 March 2026).
- Nagamma, T.; Konuri, A.; Nayak, C.D.; Kamath, S.U.; Udupa, P.E.G.; Nayak, Y. Dose-dependent effects of fenugreek seed extract on the biochemical and haematological parameters in high-fat diet-fed rats. J. Taibah Univ. Med. Sci. 2019, 14, 383–389. [Google Scholar] [CrossRef] [Scilit] [PubMed]
- Reddy, B.L.; Reddy, V.S.; Saier, M.H. Review Article: Health Benefits of Intermittent Fasting. Microb. Physiol. 2024, 34, 142–152. [Google Scholar] [CrossRef] [Scilit] [PubMed]
- Mathew, H.; Farr, O.M.; Mantzoros, C.S. Metabolic Health and Weight: Understanding metabolically unhealthy normal weight or metabolically healthy obese patients. Metabolism 2016, 65, 73–80. [Google Scholar] [CrossRef] [Scilit] [PubMed]
- Abdullah, S.R.; Nur Zati Iwani, A.K.; Ahmad Zamri, L.; Wan Mohd Zin, R.M.; Abu Seman, N.; Zainal Abidin, N.A.; Hamzah, S.S.; Azizul, N.H.; Omar, A.; Seman, Z.; et al. Visceral adiposity loss is associated with improvement in cardiometabolic markers: Findings from a dietary intervention study. Front Endocrinol. 2025, 16, 1576599. [Google Scholar] [CrossRef] [Scilit] [PubMed]
- Hall, M.E.; Cohen, J.B.; Ard, J.D.; Egan, B.M.; Hall, J.E.; Lavie, C.J.; Ma, J.; Ndumele, C.E.; Schauer, P.R.; Shimbo, D.; et al. Weight-Loss Strategies for Prevention and Treatment of Hypertension: A Scientific Statement From the American Heart Association. Hypertension 2021, 78, e38–e50. [Google Scholar] [CrossRef] [Scilit] [PubMed]
- Dixon, J.B.; O’Brien, P.E. Obesity and the white blood cell count: Changes with sustained weight loss. Obes. Surg. 2006, 16, 251–257. [Google Scholar] [CrossRef] [Scilit] [PubMed]
- Gomez-Casado, G.; Jimenez-Gonzalez, A.; Rodriguez-Muñoz, A.; Tinahones, F.J.; González-Mesa, E.; Murri, M.; Ortega-Gomez, A. Neutrophils as indicators of obesity-associated inflammation: A systematic review and meta-analysis. Obes. Rev. 2025, 26, e13868. [Google Scholar] [CrossRef] [Scilit] [PubMed]
- Andersen, C.J.; Murphy, K.E.; Fernandez, M.L. Impact of Obesity and Metabolic Syndrome on Immunity12. Adv. Nutr. 2016, 7, 66–75. [Google Scholar] [CrossRef] [Scilit] [PubMed]
- Nyambuya, T.M.; Dludla, P.V.; Nkambule, B.B. Diet-Induced Obesity Promotes the Upregulation of Fas Expression on T-cells. Biology 2021, 10, 217. [Google Scholar] [CrossRef] [Scilit] [PubMed]
- Speakman, J.R. Use of high-fat diets to study rodent obesity as a model of human obesity. Int. J. Obes. 2019, 43, 1491–1492. [Google Scholar] [CrossRef] [Scilit] [PubMed]
- Edozien, J.C.; Switzer, B.R. Effects od dietary protein, fat and energy on blood hemoglobin and hematocrit in the rat. J. Nutr. 1977, 107, 1016–1021. [Google Scholar] [CrossRef] [Scilit] [PubMed]
- Tateishi, Y.; Ichikawa, R.; Suzuki, K.; Kitahara, Y.; Someya, Y.; Tamura, Y. Effect of imbalance in dietary macronutrients on blood hemoglobin levels: A cross-sectional study in young underweight Japanese women. Front. Nutr. 2023, 10, 1121717. [Google Scholar] [CrossRef] [Scilit] [PubMed]
- Dworzański, W.; Sembratowicz, I.; Cholewińska, E.; Tutaj, K.; Fotschki, B.; Juśkiewicz, J.; Ognik, K. Effects of Different Chromium Compounds on Hematology and Inflammatory Cytokines in Rats Fed High-Fat Diet. Front Immunol. 2021, 12, 614000. [Google Scholar] [CrossRef] [Scilit] [PubMed]
- Gayret, O.B.; Erol, M.; Buke, O.; Ozel, A.; Tenekecigil, A.; Altuntaş, M. Systemic Inflammation Response Index and Immune-Inflammation Index as Predictors of Metabolic Syndrome in Obese Children and Adolescents: A Prospective Cross-Sectional Study. IJ Pediatr. 2024, 35, e148712. [Google Scholar] [CrossRef] [Scilit]
- Marra, A.; Bondesan, A.; Caroli, D.; Sartorio, A. Complete Blood Count (CBC)-Derived Inflammation Indexes Are Useful in Predicting Metabolic Syndrome in Adults with Severe Obesity. J. Clin. Med. 2024, 13, 1353. [Google Scholar] [CrossRef] [Scilit] [PubMed]
- Jiang, P.; Chen, J.; Li, J. Association of the systemic immune-inflammatory index and systemic inflammatory response index with all-cause and cardiovascular mortality in individuals with metabolic inflammatory syndrome. Eur. J. Med. Res. 2025, 30, 444. [Google Scholar] [CrossRef] [Scilit] [PubMed]
- Ramasamy, J.; Murugiah, V.; Dhanapalan, A.; Balasubramaniam, G. Diagnostic Utility of Pan-Immune-Inflammation Value (PIV) in Predicting Insulin Resistance: Results from the National Health and Nutrition Examination Survey (NHANES) 2017–2020. eJIFCC 2024, 35, 100–110. [Google Scholar] [PubMed]
- Wang, Q.; Perrard, X.D.; Perrard, J.L.; Mansoori, A.; Raya, J.L.; Hoogeveen, R.; Smith, C.W.; Ballantyne, C.M.; Wu, H. Differential effect of weight loss with low-fat diet or high-fat diet restriction on inflammation in the liver and adipose tissue of mice with diet-induced obesity. Atherosclerosis 2011, 219, 100–108. [Google Scholar] [CrossRef] [Scilit] [PubMed]
- Sheu, W.H.-H.; Chang, T.-M.; Lee, W.-J.; Ou, H.-C.; Wu, C.-M.; Tseng, L.-N.; Lang, H.-F.; Wu, C.-S.; Wan, C.-J.; Lee, I.-T. Effect of weight loss on proinflammatory state of mononuclear cells in obese women. Obesity 2008, 16, 1033–1038. [Google Scholar] [CrossRef] [Scilit] [PubMed]
- Chae, J.S.; Paik, J.K.; Kang, R.; Kim, M.; Choi, Y.; Lee, S.-H.; Lee, J.H. Mild weight loss reduces inflammatory cytokines, leukocyte count, and oxidative stress in overweight and moderately obese participants treated for 3 years with dietary modification. Nutr. Res. 2013, 33, 195–203. [Google Scholar] [CrossRef] [Scilit] [PubMed]
- Mancini, S.J.; Salt, I.P. Investigating the Role of AMPK in Inflammation. Methods Mol. Biol. 2018, 1732, 307–319. [Google Scholar] [CrossRef] [Scilit] [PubMed]
- Wang, J.; Li, Z.; Gao, L.; Qi, Y.; Zhu, H.; Qin, X. The regulation effect of AMPK in immune related diseases. Sci. China Life Sci. 2018, 61, 523–533. [Google Scholar] [CrossRef] [Scilit] [PubMed]
- Vega-Martín, E.; González-Blázquez, R.; Manzano-Lista, F.J.; Martín-Ramos, M.; García-Prieto, C.F.; Viana, M.; Rubio, M.A.; Calle-Pascual, A.L.; Lionetti, L.; Somoza, B.; et al. Impact of caloric restriction on AMPK and endoplasmic reticulum stress in peripheral tissues and circulating peripheral blood mononuclear cells from Zucker rats. J. Nutr. Biochem. 2020, 78, 108342. [Google Scholar] [CrossRef] [Scilit] [PubMed]
- Rameshrad, M.; Maleki-Dizaji, N.; Soraya, H.; Toutounchi, N.S.; Barzegari, A.; Garjani, A. Effect of A-769662, a direct AMPK activator, on Tlr-4 expression and activity in mice heart tissue. Iran. J. Basic Med. Sci. 2016, 19, 1308–1317. [Google Scholar] [CrossRef] [Scilit] [PubMed]
- Lee, M.K.S.; Cooney, O.D.; Lin, X.; Nadarajah, S.; Dragoljevic, D.; Huynh, K.; Onda, D.-A.; Galic, S.; Meikle, P.J.; Edlund, T.; et al. Defective AMPK regulation of cholesterol metabolism accelerates atherosclerosis by promoting HSPC mobilization and myelopoiesis. Mol. Metab. 2022, 61, 101514. [Google Scholar] [CrossRef] [Scilit] [PubMed]
- Singh, A.K.; D’Alessandro, A.; Wellendorf, A.M.; Gonzalez-Nieto, D.; Kofron, M.; Dzieciatkowska, M.; Mejia, L.; Barrio, L.C.; Filippi, M.-D.; Cancelas, J.A. Metabolic adaptation of regenerative hematopoiesis depends on docking-independent mitochondrial connexin 43. Blood 2025, 146, 2306–2321. [Google Scholar] [CrossRef] [Scilit] [PubMed]
- Patel, S.; Patel, S.; Kotadiya, A.; Patel, S.; Shrimali, B.; Joshi, N.; Patel, T.; Trivedi, H.; Patel, J.; Joharapurkar, A.; et al. Age-related changes in hematological and biochemical profiles of Wistar rats. Lab Anim. Res. 2024, 40, 7. [Google Scholar] [CrossRef] [Scilit] [PubMed]
- Roy, C.N. Anemia of Inflammation. Hematol. Am. Soc. Hematol. Educ. Program 2010, 2010, 276–280. [Google Scholar] [CrossRef] [Scilit] [PubMed]
- Alshwaiyat, N.M.; Ahmad, A.; Wan Hassan, W.M.R.; Al-Jamal, H.A.N. Association between obesity and iron deficiency (Review). Exp. Ther. Med. 2021, 22, 1268. [Google Scholar] [CrossRef] [Scilit] [PubMed]
- Cui, F.; Sun, J.; Mi, H.; Li, B.; Tang, L.; Wang, R.; Du, Y.; Guo, B.; Li, Y.; Shi, M. Chronic intermittent hypobaric hypoxia improves iron metabolism disorders via the IL-6/JAK2/STAT3 and Epo/STAT5/ERFE signaling pathways in metabolic syndrome rats. J. Trace Elem. Med. Biol. 2023, 79, 127259. [Google Scholar] [CrossRef] [Scilit] [PubMed]
- Otogawa, K.; Kinoshita, K.; Fujii, H.; Sakabe, M.; Shiga, R.; Nakatani, K.; Ikeda, K.; Nakajima, Y.; Ikura, Y.; Ueda, M.; et al. Erythrophagocytosis by liver macrophages (Kupffer cells) promotes oxidative stress, inflammation, and fibrosis in a rabbit model of steatohepatitis: Implications for the pathogenesis of human nonalcoholic steatohepatitis. Am. J. Pathol. 2007, 170, 967–980. [Google Scholar] [CrossRef] [Scilit] [PubMed]
- Srivastav, S.K.; Mir, I.A.; Bansal, N.; Singh, P.K.; Kumari, R.; Deshmukh, A. Serum Ferritin in Metabolic Syndrome—Mechanisms and Clinical Applications. Pathophysiology 2022, 29, 319–325. [Google Scholar] [CrossRef] [Scilit] [PubMed]
- Cabandugama, P.K.; Gardner, M.J.; Sowers, J.R. The Renin Angiotensin Aldosterone System in Obesity and Hypertension: Roles in the Cardiorenal Metabolic Syndrome (CRS). Med. Clin. N. Am. 2017, 101, 129–137. [Google Scholar] [CrossRef] [Scilit] [PubMed]
- Ladli, M.; Richard, C.; Aguilar, L.C.; Ducamp, S.; Bondu, S.; Sujobert, P.; Tamburini, J.; Lacombe, C.; Azar, N.; Foretz, M.; et al. Finely-tuned regulation of AMP-activated protein kinase is crucial for human adult erythropoiesis. Haematologica 2019, 104, 907–918. [Google Scholar] [CrossRef] [Scilit] [PubMed]
- Cambridge, E.L.; McIntyre, Z.; Clare, S.; Arends, M.J.; Goulding, D.; Isherwood, C.; Caetano, S.S.; Reviriego, C.B.; Swiatkowska, A.; Kane, L.; et al. The AMP-activated protein kinase beta 1 subunit modulates erythrocyte integrity. Exp. Hematol. 2017, 45, 64–68.e5. [Google Scholar] [CrossRef] [Scilit] [PubMed]
- Steinbicker, A.U.; Sachidanandan, C.; Vonner, A.J.; Yusuf, R.Z.; Deng, D.Y.; Lai, C.S.; Rauwerdink, K.M.; Winn, J.C.; Saez, B.; Cook, C.M.; et al. Inhibition of bone morphogenetic protein signaling attenuates anemia associated with inflammation. Blood 2011, 117, 4915–4923. [Google Scholar] [CrossRef] [Scilit] [PubMed]
- Barrachina, M.N.; Pernes, G.; Becker, I.C.; Allaeys, I.; Hirsch, T.I.; Groeneveld, D.J.; Khan, A.O.; Freire, D.; Guo, K.; Carminita, E.; et al. Efficient megakaryopoiesis and platelet production require phospholipid remodeling and PUFA uptake through CD36. bioRxiv 2023, 2, 746–763. [Google Scholar] [CrossRef] [Scilit] [PubMed]
- Monteiro, P.F.; Morganti, R.P.; Delbin, M.A.; Calixto, M.C.; Lopes-Pires, M.E.; Marcondes, S.; Zanesco, A.; Antunes, E. Platelet hyperaggregability in high-fat fed rats: A role for intraplatelet reactive-oxygen species production. Cardiovasc. Diabetol. 2012, 11, 5. [Google Scholar] [CrossRef] [Scilit] [PubMed]
- Miszta, A.; Kopec, A.K.; Pant, A.; Holle, L.A.; Byrnes, J.R.; Lawrence, D.A.; Hansen, K.C.; Flick, M.J.; Luyendyk, J.P.; de Laat, B.; et al. A high-fat diet delays plasmin generation in a thrombomodulin-dependent manner in mice. Blood 2020, 135, 1704–1717. [Google Scholar] [CrossRef] [Scilit] [PubMed]
- Valet, C.; Batut, A.; Vauclard, A.; Dortignac, A.; Bellio, M.; Payrastre, B.; Valet, P.; Severin, S. Adipocyte Fatty Acid Transfer Supports Megakaryocyte Maturation. Cell Rep. 2020, 32, 107875. [Google Scholar] [CrossRef] [Scilit] [PubMed]
- Tawfik, M.K. Anti-aggregatory effect of boswellic acid in high-fat fed rats: Involvement of redox and inflammatory cascades. Arch. Med. Sci. 2016, 12, 1354–1361. [Google Scholar] [CrossRef] [Scilit] [PubMed]
- Li, J.; Zhou, L.; Li, B.; Tian, R.; Hu, G.; Liu, Z. Predictive value of platelet distribution width on organ damage in patients with metabolic syndrome: A retrospective case-control study. Am. J. Transl. Res. 2025, 17, 1803–1813. [Google Scholar] [CrossRef] [Scilit] [PubMed]
- Liu, Y.; Oh, S.-J.; Chang, K.-H.; Kim, Y.-G.; Lee, M.-Y. Antiplatelet effect of AMP-activated protein kinase activator and its potentiation by the phosphodiesterase inhibitor dipyridamole. Biochem. Pharmacol. 2013, 86, 914–925. [Google Scholar] [CrossRef] [Scilit] [PubMed]
- Liu, Y.; Park, J.-M.; Chang, K.-H.; Huh, H.J.; Lee, K.; Lee, M.-Y. AMP-Activated Protein Kinase Mediates the Antiplatelet Effects of the Thiazolidinediones Rosiglitazone and Pioglitazone. Mol. Pharmacol. 2016, 89, 313–321. [Google Scholar] [CrossRef] [Scilit] [PubMed]
- Lepropre, S.; Kautbally, S.; Octave, M.; Ginion, A.; Onselaer, M.-B.; Steinberg, G.R.; Kemp, B.E.; Hego, A.; Wéra, O.; Brouns, S.; et al. AMPK-ACC signaling modulates platelet phospholipids and potentiates thrombus formation. Blood 2018, 132, 1180–1192. [Google Scholar] [CrossRef] [Scilit] [PubMed]
- Lee, T.-Y.; Lu, W.-J.; Changou, C.A.; Hsiung, Y.-C.; Trang, N.T.T.; Lee, C.-Y.; Chang, T.-H.; Jayakumar, T.; Hsieh, C.-Y.; Yang, C.-H.; et al. Platelet autophagic machinery involved in thrombosis through a novel linkage of AMPK-MTOR to sphingolipid metabolism. Autophagy 2021, 17, 4141–4158. [Google Scholar] [CrossRef] [Scilit] [PubMed]

Disclaimer/Publisher’s Note: The statements, opinions and data contained in all publications are solely those of the individual author(s) and contributor(s) and not of MDPI and/or the editor(s). MDPI and/or the editor(s) disclaim responsibility for any injury to people or property resulting from any ideas, methods, instructions or products referred to in the content. |
© 2026 by the authors. Licensee MDPI, Basel, Switzerland. This article is an open access article distributed under the terms and conditions of the Creative Commons Attribution (CC BY) license.