


Abstract
Background: This study investigates the interplay between ferritin heavy chain (FHC), p53, and systemic oxidative stress in melanoma patients. Methods: Patients (57 enrolled, 49 analyzed for immunohistochemistry) and tumor samples were categorized into three groups: low metastasis risk (cutaneous melanoma, Breslow thickness < 2 mm), high metastasis risk (Breslow > 2 mm), and metastatic melanoma. Systemic oxidative stress was evaluated via erythrocyte lipid peroxidation, while serum ferritin heavy and light chain (FHC and FLC, respectively) levels were measured using ELISA. Tumor p53 expression and 3-nitrotyrosine (3-NT) occurrence were analyzed via immunohistochemistry. Results: Serum FHC levels and the FHC:FLC ratio were elevated in melanoma patients compared to controls, with the highest and significant FHC increases seen in the high-risk (>2 mm) and metastatic groups. This increase aligned with elevated systemic oxidative stress parameters. While FHC and 3-NT were expressed consistently across all tumor stages, p53 expression was significantly higher in the metastatic group than in the low-risk group. Conclusions: Patients with thick cutaneous melanomas (>2 mm) and metastatic disease share common biological processes, highlighting a significant interplay between FHC, systemic oxidative stress, and p53 expression in melanoma progression.
1. Introduction
Currently, the use of blood serum markers to predict the risk of recurrence and metastasis in patients with localized cutaneous melanoma remains inadequate. Ferritin, a crucial iron-binding protein, is composed of 24 subunits divided into heavy (FHC) and light (FLC) chains [1]. The ratio of these chains is tissue-dependent. Notably, increased levels of total ferritin in tumor tissues have been documented across various malignancies, including colon cancer, breast cancer, melanoma, and seminoma [2]. As a central protein in iron metabolism, ferritin can sequester substantial amounts of iron, playing a vital role in both iron storage and detoxification [3]. Intracellularly, FHC exhibits significant ferroxidase activity, facilitating rapid iron detoxification by oxidizing Fe(II) to Fe(III), whereas FLC is responsible for binding the oxidized Fe(III). By mitigating the Fenton reaction, these processes effectively suppress the generation of highly reactive hydroxyl radicals (·OH), thereby reducing cellular oxidative stress [4].
In contrast, extracellular (serum) total ferritin consists predominantly of FLC and is characteristically iron-poor [5]. Although the exact cellular sources and secretory pathways of total serum ferritin are not fully elucidated, it is known that hepatocytes, macrophages, and Kupffer cells are capable of secreting it [6]. Functioning as an acute-phase reactant, ferritin expression is upregulated during inflammation, infection, and malignant progression. Consequently, elevated total serum ferritin levels have been associated with a poor prognosis in several cancers, including melanoma, breast cancer, head and neck squamous cell carcinoma, and primary lung cancer [5].
Furthermore, patients with progressive metastatic melanoma exhibit significantly higher total serum ferritin levels compared to healthy volunteers [7]. A complex, bidirectional regulatory relationship exists between FHC and the tumor suppressor p53 [8]. In vitro studies have shown that reactive oxygen species (ROS)-induced overexpression of p53 can repress FHC at both the transcriptional and protein levels [9]. Conversely, the knockdown of FHC delays p53 expression in response to oxidative stress [10,11]. Interestingly, the p53-mediated regulation of cell cycle genes is notably diminished in melanoma cells [12]. Furthermore, unlike many other cancers, mutational inactivation of p53 is relatively rare in melanocytic tumors (occurring in only 5–25% of cases), with high expression levels of wild-type p53 being frequently observed [13].
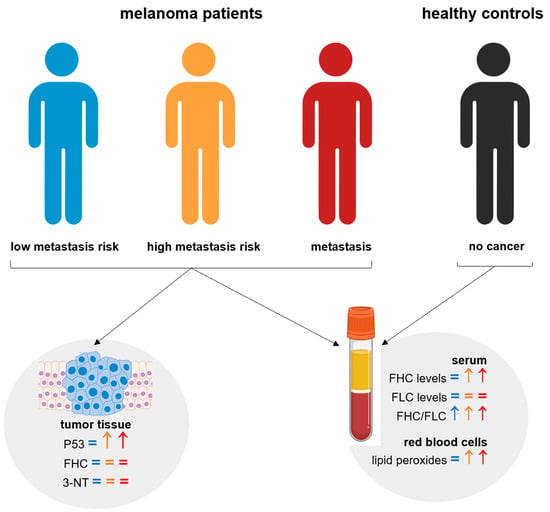
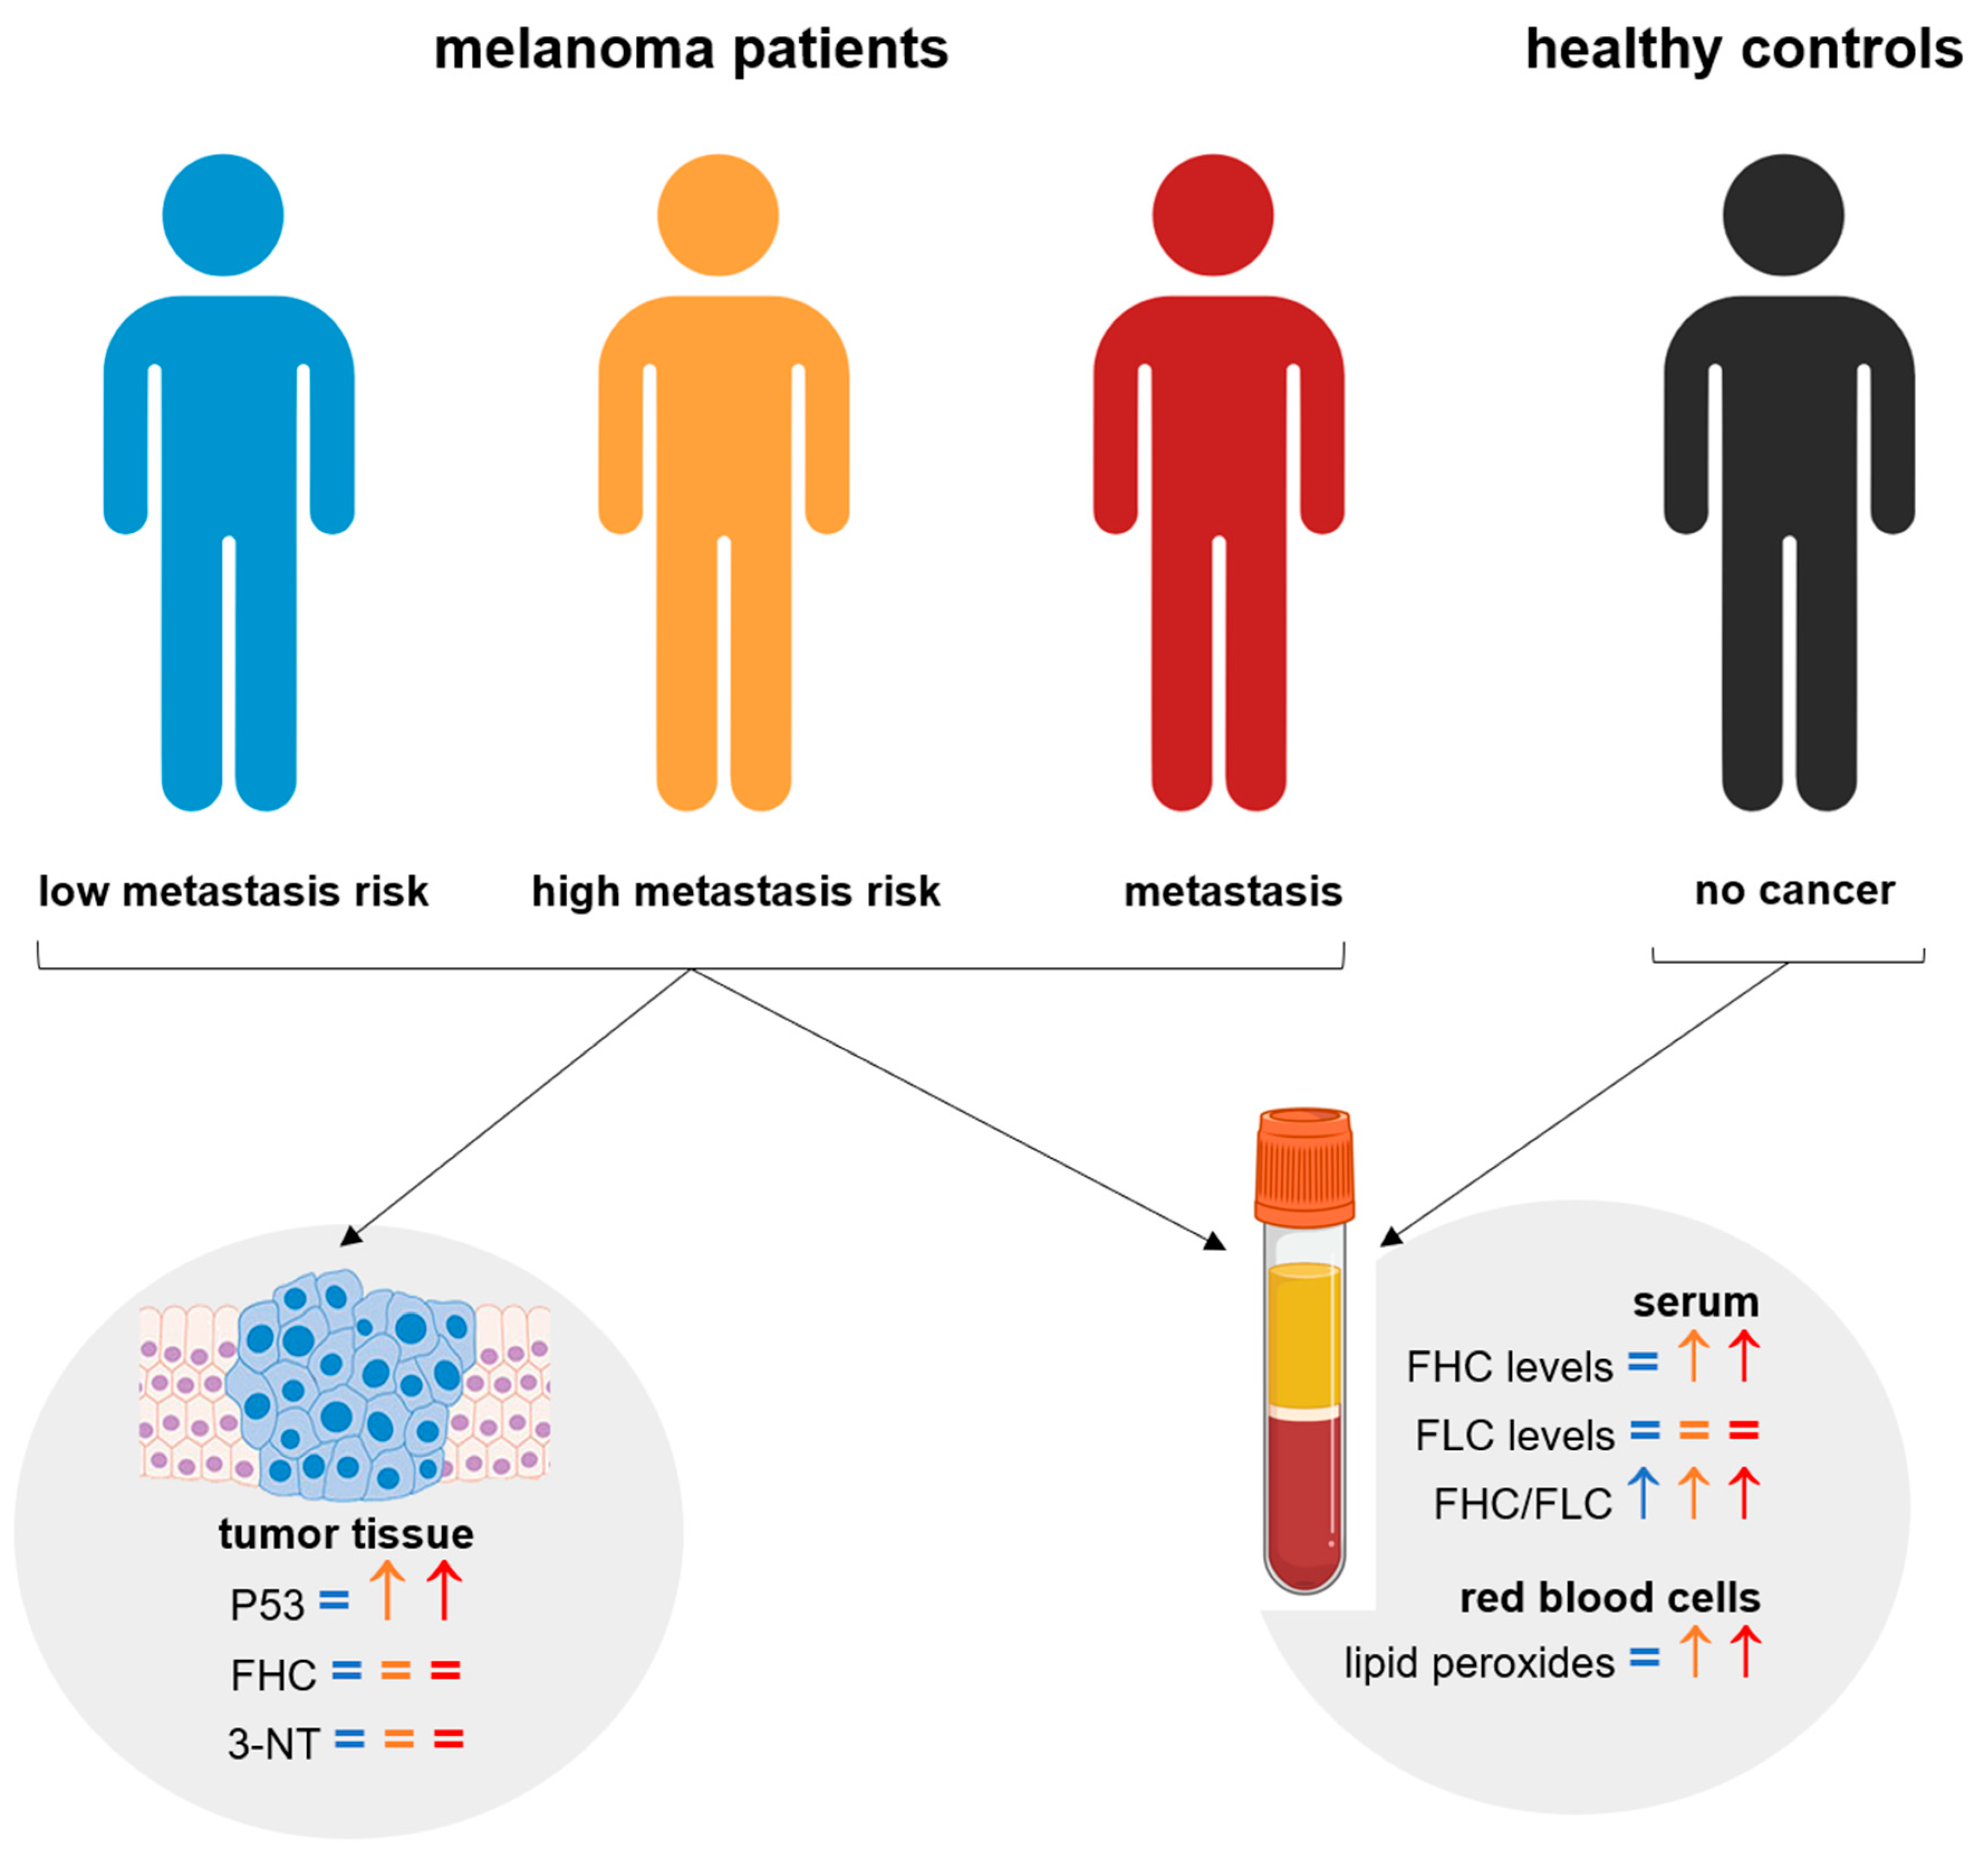
Together, these findings strongly suggest a critical interplay between ferritin levels, systemic oxidative stress, and p53 expression in determining melanoma progression and patient prognosis. Therefore, this study aims to investigate the relationship between serum FHC levels and systemic oxidative stress across different clinical stages of melanoma. Given that the TP53 gene regulates FHC and is intricately linked to oxidative pathways, we further sought to evaluate the expression of FHC, p53, and the oxidative stress marker 3-nitrotyrosine (3-NT) in both primary cutaneous and metastatic melanoma tissues using immunohistochemistry (Figure 1).
Figure 1.
Study scheme.
2. Materials and Methods
2.1. Study Design and Patient Sample Collection
This was an observational cross-sectional study involving 57 patients with melanoma, aged 28–71 years, recruited at the Londrina Cancer Hospital, and 30 healthy volunteers serving as controls. The cohort was stratified into three distinct groups: 24 patients had localized primary cutaneous melanoma considered to have a low metastasis risk according to the Breslow thickness (cutaneous < 2 mm); 19 patients had localized cutaneous melanoma considered to have a high metastasis risk according to the Breslow thickness (cutaneous > 2 mm), with surgical primary tumor removal between 6 months and 5 years prior to enrollment. In addition to Breslow thickness, the prognosis and staging of cutaneous melanoma (according to the guidelines of the AJCC—American Joint Committee on Cancer) depend on a combination of histopathological, clinical, and molecular factors. Nevertheless, Breslow thickness stands as the definitive prognostic parameter in melanoma, owing to its direct alignment with invasive depth rather than surface area. The third group comprised 14 patients with either surgical metastasis removal (n = 6) or active metastasis (n = 8), all of whom were not receiving chemotherapy or immunotherapy (metastasis group), with comprehensive cohort details summarized in Table 1. This study was approved by the Research and Ethics National Council (CAAE 5831.0.000.268.10); all procedures were approved by the institutional board, and all patients and controls signed written informed consent. To minimize confounding variables, patients and controls were nonsmokers, not on antioxidant therapy, and not obese. They did not present with hepatic, cardiac, or renal dysfunction, and control subjects additionally had no previous history of any cancer. Venous blood was collected with and without heparin and centrifuged at 1100 × g. The separated serum was immediately frozen at −80 °C until enzyme immunoassay (ELISA) analysis, and erythrocytes from the heparinized tubes were used fresh. Finally, to assess the presence of FHC, p53, and 3-nitrotyrosine (3-NT) in cutaneous and metastatic melanoma samples, 49 randomized paraffin-embedded tumor blocks were obtained from the biobank of the Department of Pathology of Londrina Cancer Hospital, with immunohistochemical comparisons performed specifically as follows: cutaneous < 2 mm versus metastasis, and cutaneous > 2 mm versus metastasis.
Table 1.
Characteristics of studied subjects. Quantitative data were evaluated by one-way ANOVA with Tukey’s post hoc test. Qualitative data were evaluated by the Chi-square (χ2) test. p < 0.05 was considered significant. χ2 values: Gender 4.540; Fitzpatrick skin classification 9.953; Primary tumor histogenetic type 30.04. Tukey’s post hoc test of primary tumor Breslow thickness was significant in Cutaneous < 2 mm × Metastatic melanoma and Cutaneous < 2 mm × Cutaneous > 2 mm statistical analysis. SSM: Superficial spreading melanoma; NM: nodular melanoma; ALM: acral lentiginous melanoma. Breslow thickness was measured in millimeters. * = significantly different.
2.2. Serum Ferritin Analysis
The serum levels of ferritin heavy chain and ferritin light chain were quantified using a sandwich enzyme-linked immunosorbent assay (ELISA) in accordance with the manufacturer’s protocols (Uscn Life Science, China; catalog numbers: SED021Hu and SED020Hu, respectively). Absorbance was measured at 450 nm utilizing a Multiskan GO microplate reader (Thermo Scientific, Waltham, MA, USA). To determine the respective concentrations, standard curves were generated employing a five-parameter regression model and plotted on a linear (log-log) scale. The lower limits of detection for these assays were 5.5 pg × mL−1 and 14.7 pg × mL−1, respectively, with all final results calculated and expressed in pg × mL−1.
2.3. Determination of Oxidative Stress in Erythrocytes by Chemiluminescence Induced by Tert-Butyl Hydroperoxide
Systemic lipoperoxidation in erythrocytes was assessed using chemiluminescence (CL). Erythrocytes isolated from heparinized blood were washed three times with a 0.9% saline solution at 4 °C, and an aliquot was taken to measure hemoglobin concentrations utilizing a Coulter STKS analyzer (Beckman Coulter, Brea, CA, USA). Erythrocyte lipoperoxidation was evaluated following the previously described protocols [14,15]. Briefly, 30 µL of packed erythrocytes were resuspended in 3 mL of phosphate buffer, after which 1 mL of this suspension was further diluted in 12.3 mL of the same buffer. The chemiluminescence reaction was initiated by adding 10 µL of tert-butyl to 1 mL of the erythrocyte sample, achieving a final concentration of 3 mM. Chemiluminescence curves were recorded utilizing a GloMax 20/20 luminometer (Promega, Madison, WI, USA), with the results expressed in relative light units (RLU) × g Hb−1 or as the area under the curve (AUC), presented as the median ± SEM. The obtained curves served as qualitative indicators of lipoperoxidation, while quantitative results were derived by integrating the area under the curve.
2.4. Immunohistochemistry
Paraffin-embedded tumor specimens were subjected to immunohistochemical analysis. Briefly, 3-μm-thick sections were mounted on silane-coated slides (Sigma-Aldrich, Burlington, MA, USA), deparaffinized, and rehydrated. The sections were then immersed in 10 mmol × L−1 citrate buffer (pH 6.0) and underwent heat-induced epitope retrieval using a vapor lock for 45 min. After rinsing with phosphate-buffered saline (PBS), endogenous peroxidase activity was quenched by immersion in 3% hydrogen peroxide for 20 min. Non-specific protein binding was blocked using normal serum (Vectastain Elite ABC Kit Universal, Vector Laboratories, Newark, CA, USA) for 30 min. Sections were subsequently incubated in a humidified chamber for 2 h at room temperature (25 °C) with primary monoclonal antibodies targeting FHC (1:200 dilution, clone H-53-Catalog Number: sc-25638), p53 (1:100 dilution, clone DO-7- Catalog Number: sc-126; this antibody detects total p53 protein and cannot distinguish between wild-type and mutant p53), and 3-NT (1:100 dilution, clone HM11- Catalog Number: sc-32757; all sourced from Santa Cruz Biotechnology, Dallas, TX, USA) according to the manufacturer’s protocol. Following PBS washes, a biotinylated pan-specific universal secondary antibody (Vectastain Elite ABC Kit Universal; Vector Laboratories, Newark, CA, USA) was applied for 30 min. The slides were then incubated with an avidin-biotin-peroxidase complex (Vectastain Elite ABC Kit Universal; Vector Laboratories, Newark, CA, USA) for 30 min and developed using the NovaRed kit (Vector Laboratories, Newark, CA, USA) for 5 min. Finally, the sections were counterstained with Giemsa, dehydrated, and mounted using Permount (Thermo Fisher Scientific, Waltham, MA, USA). For negative controls, specimens were incubated with an isotype-matched control antibody under identical experimental conditions. Immunolabeling was deemed positive upon the appearance of distinct, homogeneous fuchsia staining. The percentage of positively stained cells was evaluated blindly by two of the authors (LZR and SSB) across ten representative high-power fields (HPFs; ×400 magnification) captured from each case using an Olympus BX40 light microscope (Olympus, Tokyo, Japan) equipped with a high-resolution Moticam 2500 digital camera (5.0 megapixels; Motic China Group, Shanghai, China). For statistical evaluation, the samples were categorically scored as follows: -, non-stainer; +, non-majority stainer (<10% per field); ++, stainer (10–50% per field); and +++, majority stainer (>50% per field). Nuclear p53 expression was classified as positive when >10% of cell nuclei were stained and negative when 1% were stained, as previously described [16]. Finally, comparative analyses were strictly performed as follows: cutaneous < 2 mm versus metastasis, and cutaneous > 2 mm versus metastasis.
2.5. Statistical Analysis of Patient Data
Statistical comparisons were established between the control group and each of the three melanoma cohorts: the low-risk cutaneous group (<2 mm), the high-risk cutaneous group (>2 mm), and the metastasis group. All data are presented as the mean ± standard error of the mean (SEM). Data normality was evaluated using the Shapiro–Wilk W test (p < 0.05), confirming a normal distribution. For quantitative variables, normally distributed data were analyzed using a t-test, whereas non-normally distributed data were evaluated with the Mann–Whitney U test. Differences in mean age and Breslow thickness across patient cohorts were evaluated using a one-way analysis of variance (ANOVA) followed by Tukey’s post hoc test for pairwise comparisons. This approach was selected to test global group differences while controlling the family-wise Type I error rate across multiple comparisons. The chemiluminescence (CL) curves were assessed via a two-way ANOVA. Qualitative categorical data were analyzed using the Chi-square (χ2) test. Statistical significance was defined as p < 0.05, with specific thresholds denoted as follows: * p < 0.05, ** p < 0.01, and *** p < 0.001. All statistical analyses were conducted using GraphPad Prism version 6.0 (GraphPad Software, San Diego, CA, USA).
3. Results
3.1. Demographic Characteristics of the Cohorts of the Study
The demographic and clinical characteristics of the study cohort are summarized in Table 1. Statistical analysis revealed no significant differences among the groups concerning mean age, gender distribution, or Fitzpatrick skin classification (p > 0.05). Across the cohort, females generally comprised the majority, and skin type III was the most prevalent classification, particularly in the low-risk cutaneous group where it accounted for 79.2% of cases. The Fitzpatrick Skin Phototype Classification (FSPC), which evaluates complexion and sunlight tolerance, remains the most prevalent metric for skin typing; notably, self-rated FSPC is commonly utilized in questionnaire-based assessments to capture respondents’ phenotypes [17]. Conversely, the histologic type of the primary tumor varied significantly across the different melanoma groups (p < 0.0001). A marked predominance of the Superficial Spreading Melanoma (SSM) subtype was observed among patients with a Breslow thickness of less than 2 mm (83.3%). In contrast, Nodular Melanoma (NM) presented most frequently in the high-risk group (36.8%). Additionally, consistent with the initial cohort stratification, the mean primary tumor Breslow thickness was significantly lower in the low-risk cutaneous group (1.16 ± 0.092 mm) relative to both the high-risk cutaneous (4.14 ± 0.43 mm) and metastasis (4.29 ± 1.62 mm) groups (p < 0.0001). Furthermore, within the metastasis cohort, secondary spread occurred most frequently in the lymph nodes (57.2%), followed by the skin (21.4%), brain (14.3%), and liver (7.1%). All corresponding p-values and chi-square (χ2) statistics are detailed in Table 1.
3.2. Ferritin as Biological Indicator
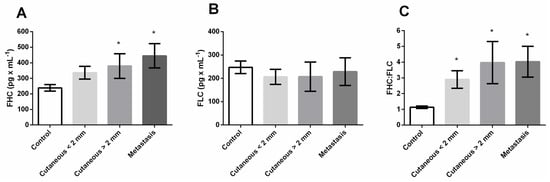
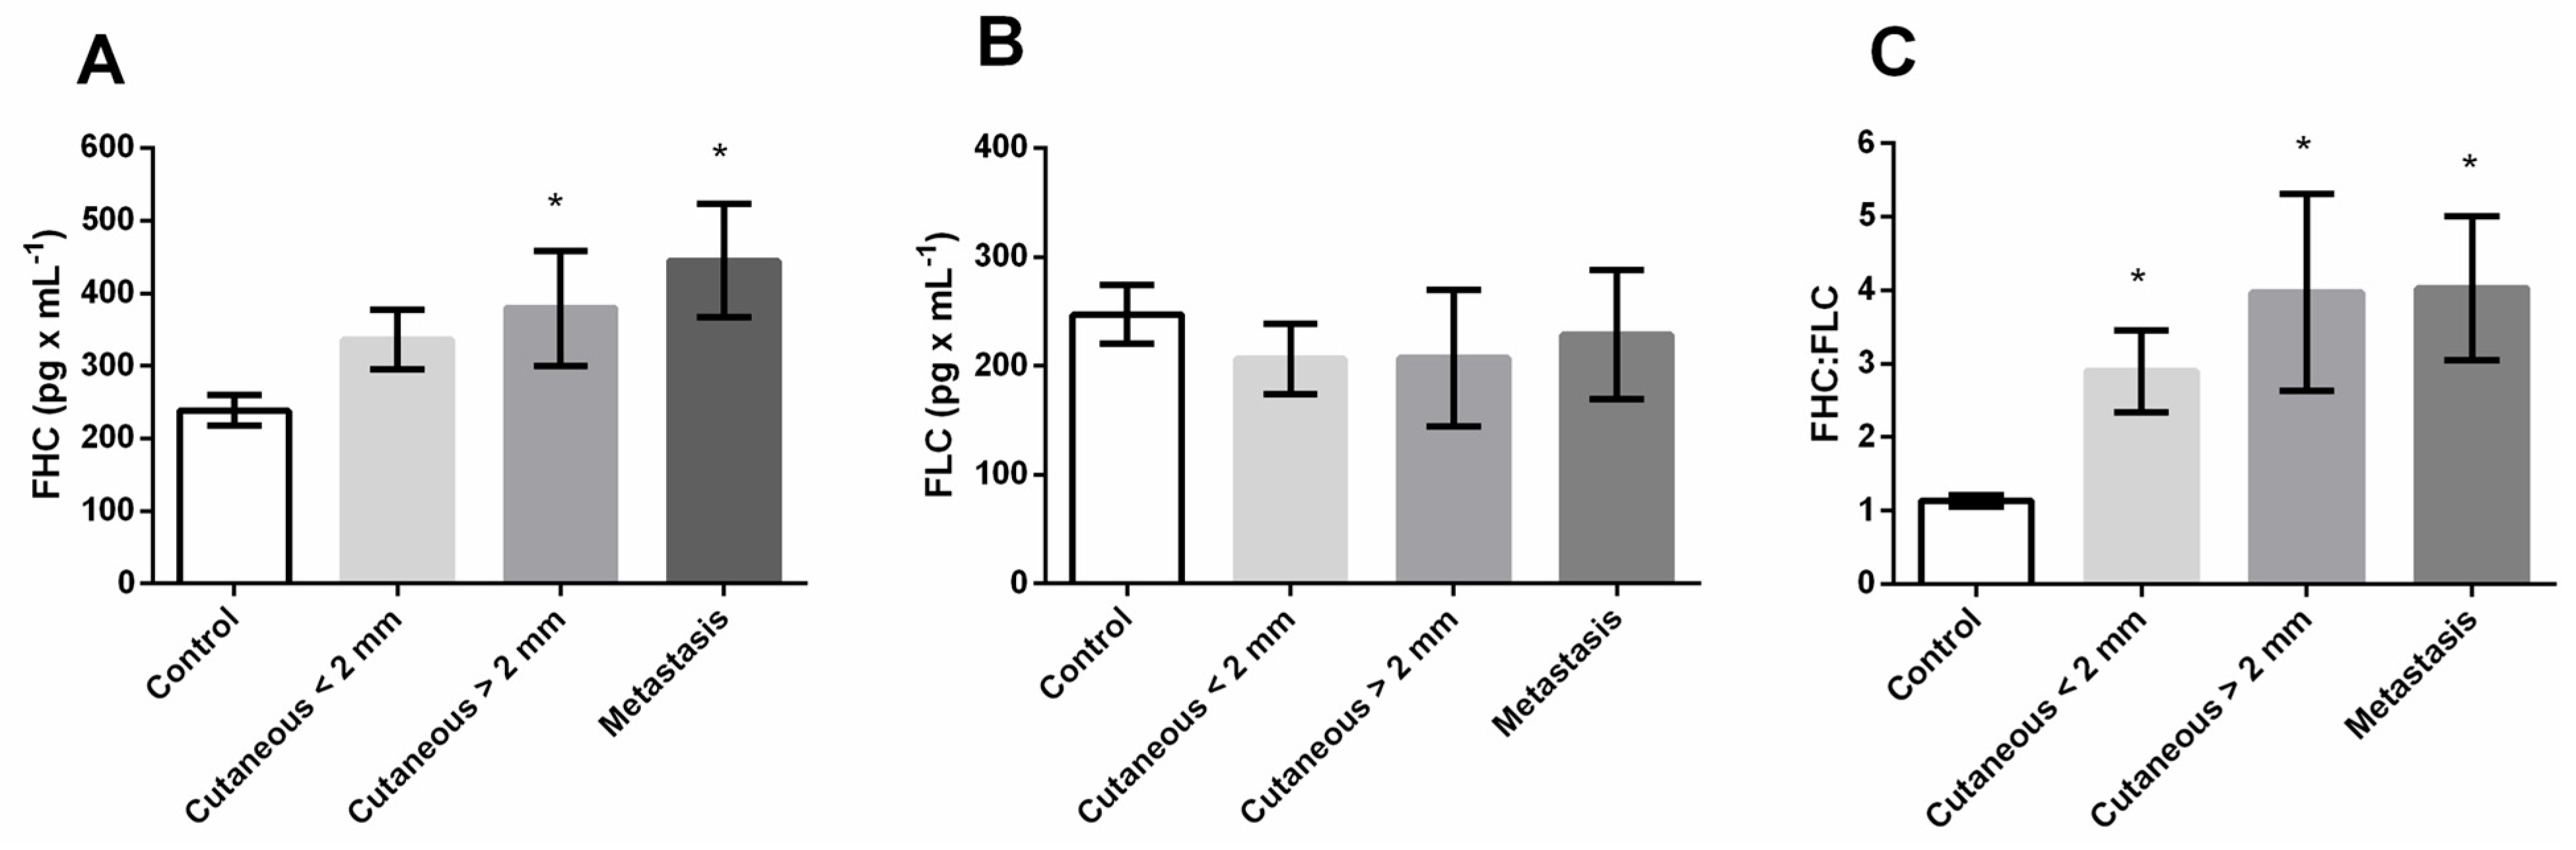
To investigate the potential of serum ferritin subunits as a biological indicator for melanoma progression and metastatic risk, circulating levels of ferritin heavy chain (FHC) and ferritin light chain (FLC) were evaluated across the patient cohorts. Analysis of the serum profiles revealed a significant elevation in FHC concentrations specifically within the high-risk cutaneous melanoma cohort (Breslow thickness > 2 mm) and the metastatic group compared to healthy controls (p = 0.04 and 0.002, respectively, whereas patients with thinner, low-risk tumors (<2 mm) did not exhibit this systemic increase (p = 0.12, Figure 2A). In contrast to the heavy chain dynamics, the systemic levels of FLC remained entirely stable, showing no significant quantitative variations across any of the clinical groups compared to the control group (Figure 2B). Despite the stable FLC baseline, the disproportionate increase in FHC expression led to a markedly enhanced FHC-to-FLC ratio across all melanoma patient groups relative to the control subjects (<2 mm, p = 0.03; >2 mm, p = 0.01; and metastasis, p = 0.009), indicating a distinct and persistent shift in systemic ferritin composition that fundamentally accompanies the presence of the malignancy (Figure 2C).
Figure 2.
(A) Serum ferritin heavy chain (FHC); (B) Serum ferritin light chain (FLC); (C) FHC:FLC ratio. Cutaneous (<2 mm): cutaneous melanoma patients with Breslow thickness <2.0 mm; Cutaneous (>2 mm): cutaneous melanoma patients with Breslow thickness >2.0 mm. Groups were compared with the control group by t-test or Mann–Whitney test, and p < 0.05 was considered significant (*).
3.3. Oxidative Stress
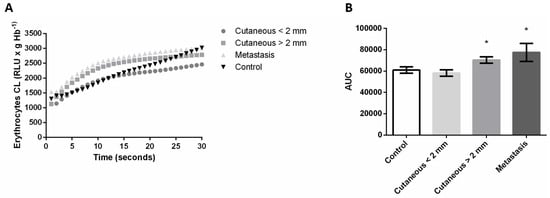
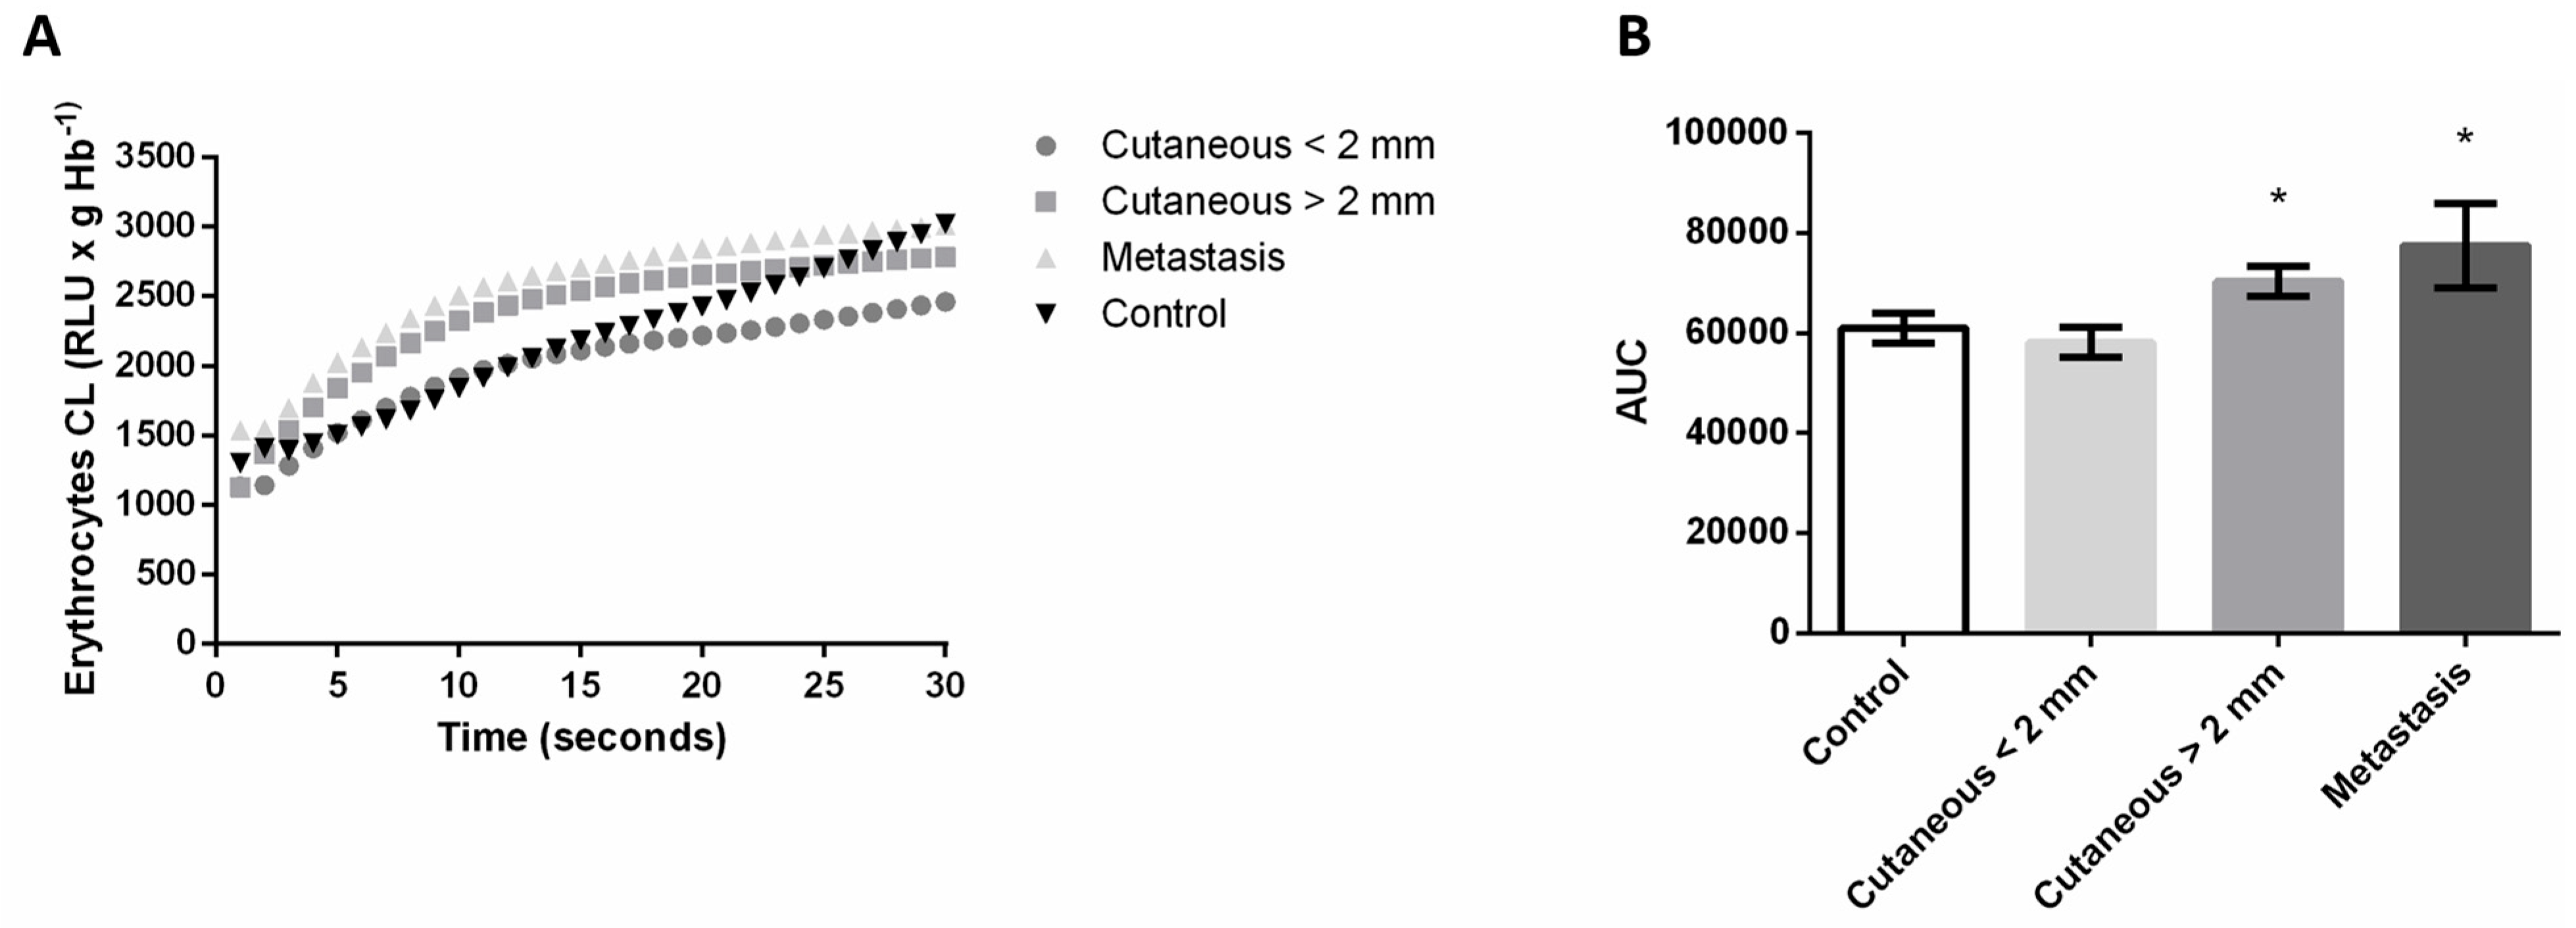
Given the established connections between iron-binding proteins and cellular oxidative environments during malignant progression, the study further assessed systemic oxidative stress by quantifying erythrocyte lipid peroxidation. Chemiluminescence (CL) kinetic profiling demonstrated pronounced qualitative shifts in the oxidative response, characterized by highly significant deviations in both the peak height and the rise time of the emission curves specifically for patients with thick cutaneous tumors (>2 mm) and those with metastatic disease (Figure 3A). This amplified oxidative burden was quantitatively confirmed through the evaluation of the area under the curve (AUC). Corresponding directly with the elevated FHC levels, the overall AUC values were substantially higher in the cutaneous >2 mm (p = 0.03) and metastasis (p = 0.03) groups compared to the baseline levels observed in the healthy control group, effectively highlighting a concurrent surge in systemic oxidative stress as the clinical risk of metastasis increases (Figure 3B).
Figure 3.
(A) Lipid peroxidation curve of erythrocytes measured via chemiluminescence (CL) intensity; (B) Analysis of area under the curve (AUC) of the lipid peroxidation assay. Cutaneous (<2 mm): cutaneous melanoma patients with Breslow thickness <2.0 mm; Cutaneous (>2 mm): cutaneous melanoma patients with Breslow thickness >2.0 mm. Lipid peroxidation curves were compared by a two-way ANOVA test, and all curves were different (p < 0.001). Groups were compared with the control group by t-test or Mann–Whitney test, and p < 0.05 was considered significant (*).
3.4. Tissue Analysis
To provide a comprehensive clinical baseline for the subsequent tissue analyses, the patient cohorts were first characterized according to their primary tumor histogenetic subtypes and corresponding Breslow thicknesses (Table 2).
Table 2.
Cutaneous and metastatic melanoma tumor characteristics. SSM: Superficial spreading melanoma; NM: nodular melanoma; ALM: acral lentiginous melanoma; ND: not determined. Breslow thickness was measured in millimeters. # = number.
3.5. Role of p53
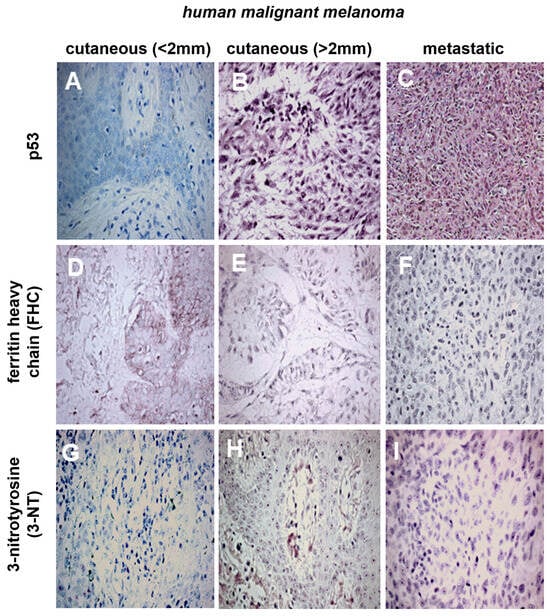
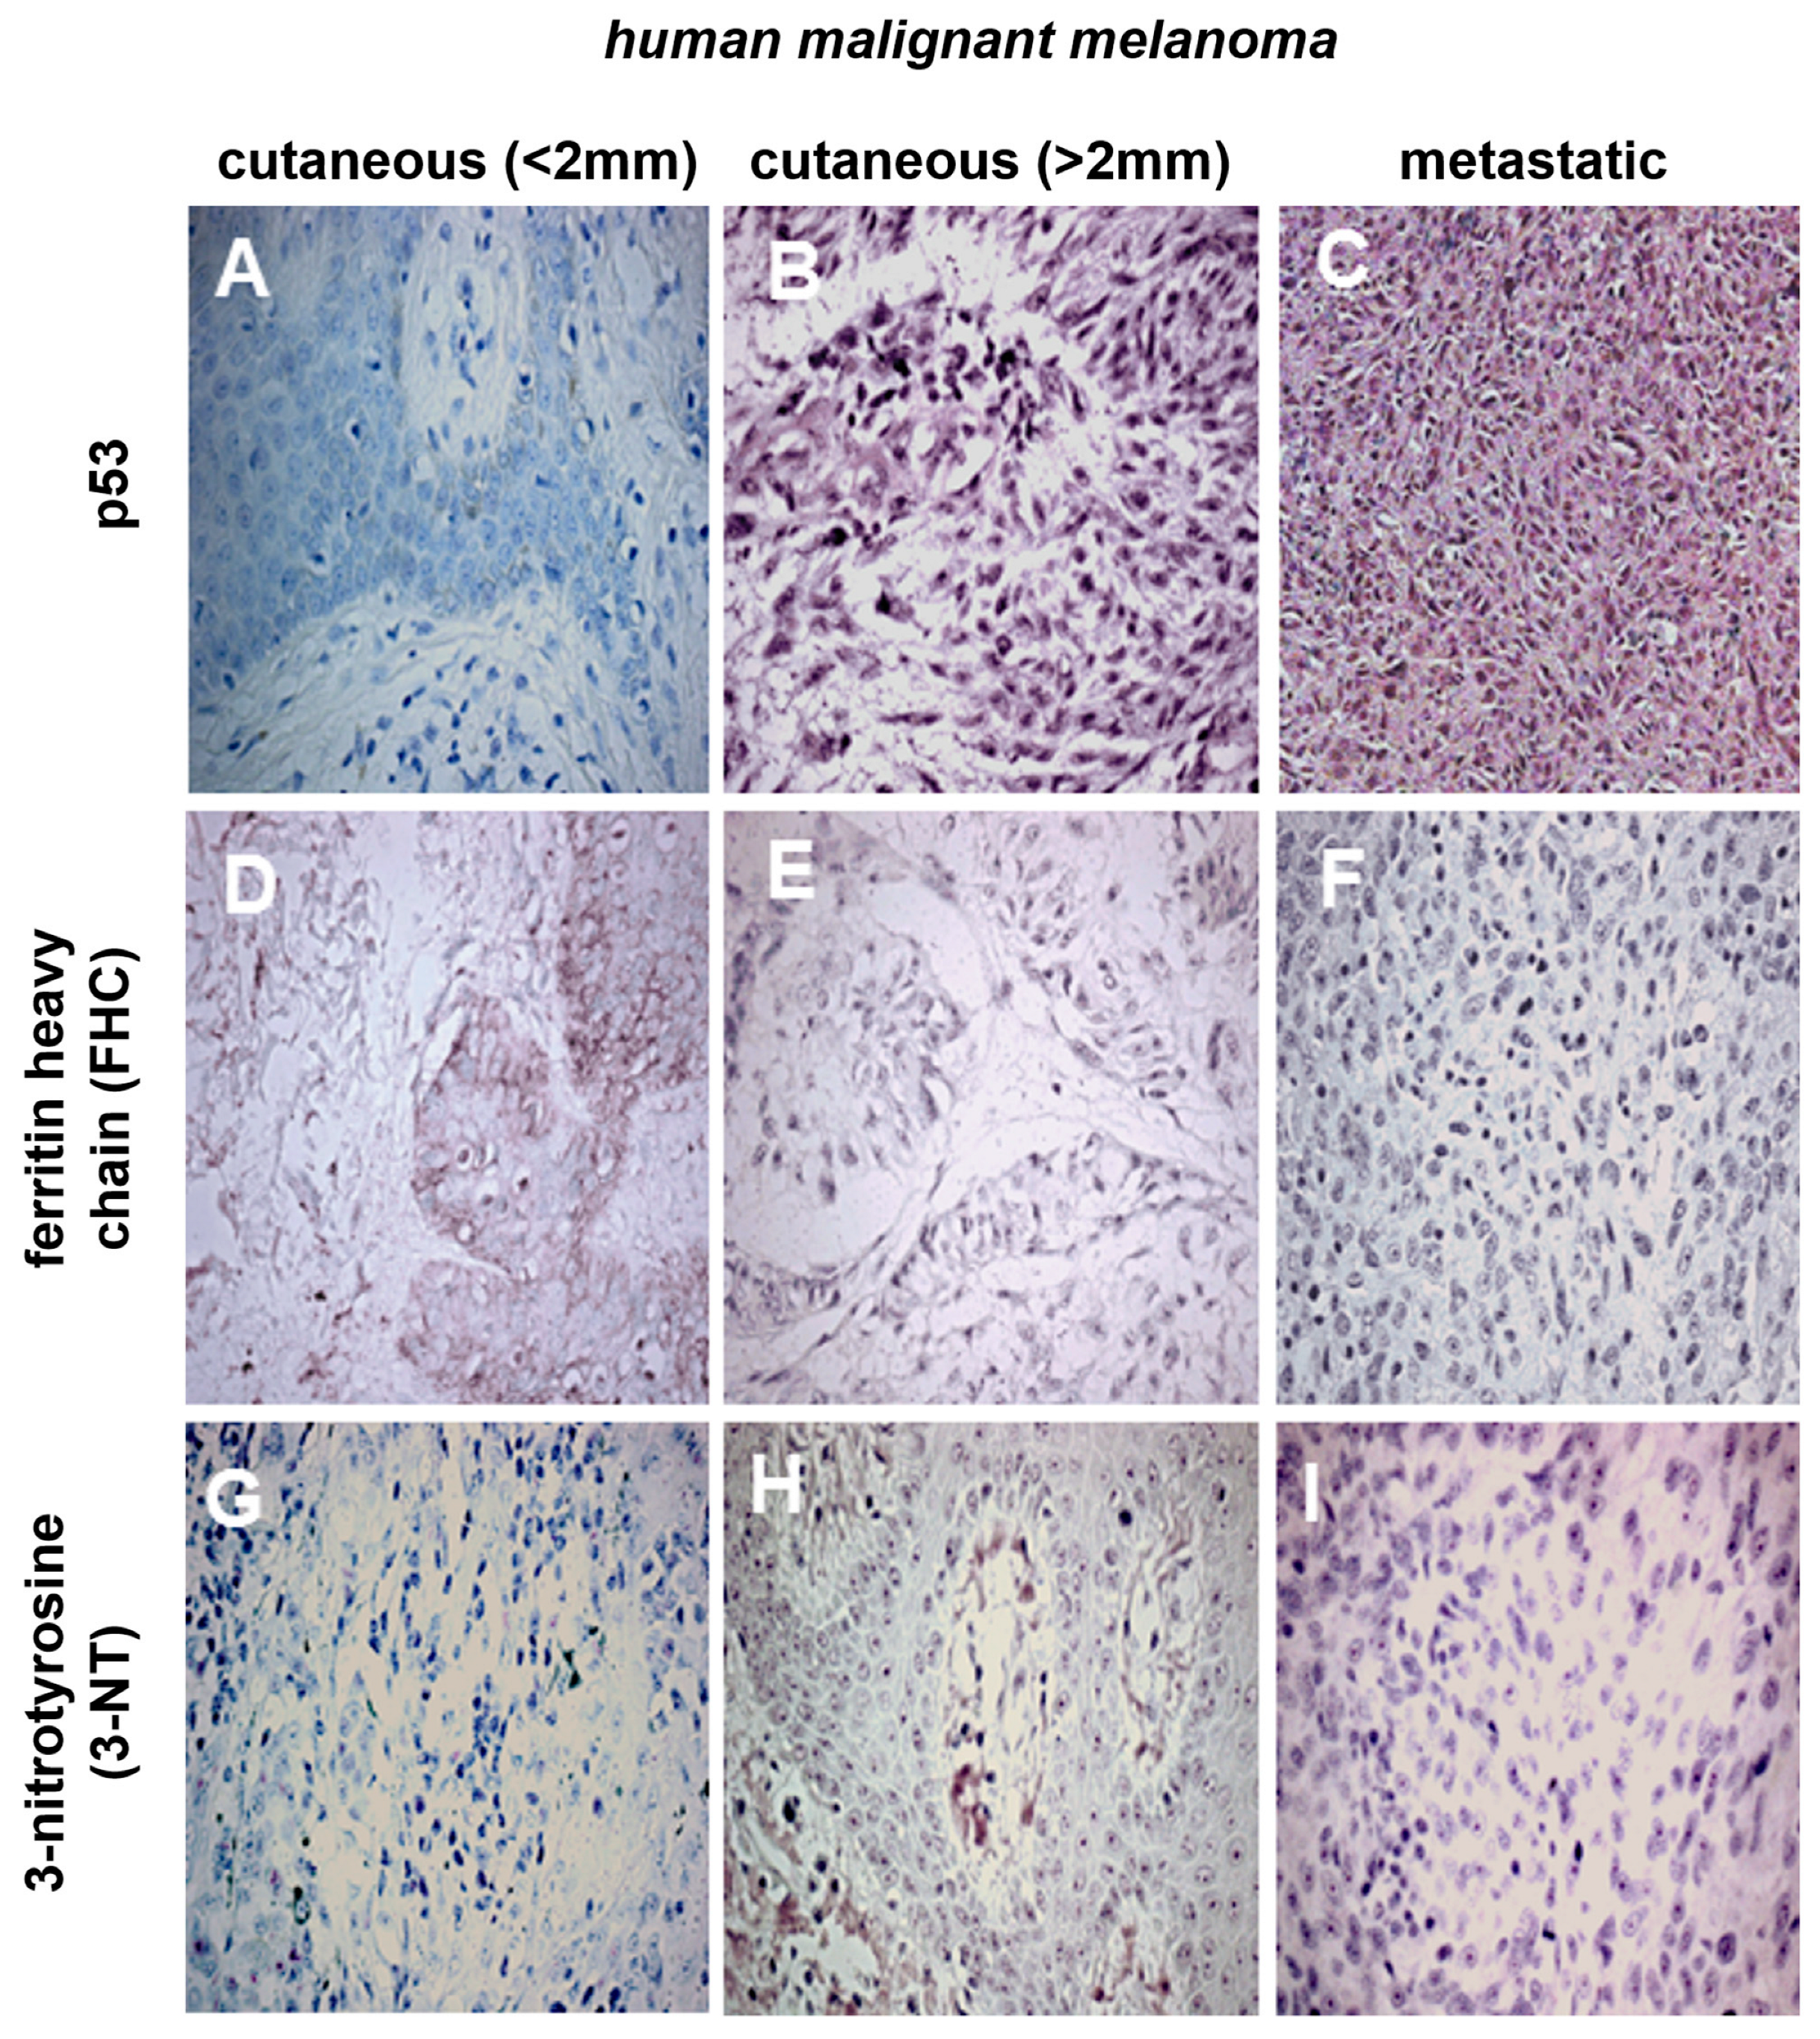
To investigate the dynamics of tumor suppression during malignant progression, p53 expression was evaluated within the local tumor microenvironment. This analysis revealed a significant upregulation of p53 in metastatic lesions when compared directly to low-risk, thin cutaneous tumors (Breslow < 2 mm), a finding supported by both overall cellular expression and the specific frequency of positive nuclei (Figure 4A,C). Nevertheless, the substantial increase in p53 expression did not statistically differentiate metastatic cohorts from high-risk, thick cutaneous melanomas (>2 mm), indicating that critical alterations in p53 dynamics are driven by primary tumor deepening prior to systemic dissemination (Figure 4B,C).
Figure 4.
Immunohistochemistry analysis of melanoma tumor. (A) p53 in cutaneous <2 mm, case 4; (B) p53 in cutaneous >2 mm, case 26; (C) p53 in melanoma metastasis, case 49; (D) FHC in cutaneous <2 mm, case 10; (E) FHC in cutaneous >2 mm, case 26; (F) FHC in melanoma metastasis, case 37; (G) 3-NT in cutaneous <2 mm, case 11; (H) 3-NT in cutaneous >2 mm, case 16; (I) 3-NT in melanoma metastasis, case 40. Data relative to p53 and FHC expression in cells were compared by the χ2 test. Positive and negative p53 in nuclei were compared by Fisher’s exact test. (A) and (C) had different p53 levels in cells (χ2 = 7.266; p= 0.0264), and in nuclei, p53 staining (χ2 = 10.710; p = 0.005). A 400× magnification was used.
An in-depth examination of the individual immunohistochemical scoring further illustrates this transition. While the vast majority of thin cutaneous tumors displayed negligible or absent p53 staining, typically falling below 1% nuclear positivity, a substantial proportion of both the thick cutaneous and metastatic samples exhibited robust, high-intensity (+++) cellular staining (χ2 = 7.266; p= 0.03) alongside greater than 10% nuclear positivity (χ2 = 10.710; p= 0.005) (Table 3).
Table 3.
p53, ferritin heavy chain, and 3-nitrotyrosine immunohistochemistry score in cutaneous and metastatic melanoma. FHC: Ferritin heavy chain; 3-NT: 3-nitrotyrosine; -, non-stainer; +, non-majority stainer (<10% per field); ++, stainer (10–50% per field); +++, majority-stainer (>50% per field). For statistical analyses of p53 expression in nuclei, tumors with >10% field nuclei staining were considered positive, and tumors with <1% field nuclei staining were considered negative. # = number.
In contrast to the distinct, stage-dependent shifts observed for p53, the local tissue expression of ferritin heavy chain (FHC) did not exhibit statistically significant alterations across the clinical cohorts. Both early-stage and advanced tumors demonstrated statistically comparable FHC profiles, indicating that the profound systemic FHC elevations observed in advanced disease are not mirrored by a proportional accumulation of the protein within the tumor parenchyma itself (Figure 4D–F). Similarly, the evaluation of 3-nitrotyrosine (3-NT), utilized as a direct proxy for local oxidative stress and peroxynitrite formation, revealed a persistent presence across all cohorts, with no statistically significant variance between primary and metastatic states (Figure 4G–I). Despite this lack of broad statistical significance at the group level, a detailed review of the individual patient scoring underscores a high degree of intratumoral heterogeneity. Tumor across all clinical stages displayed uniquely scattered, varying intensities of both FHC and 3-NT positivity, ranging from completely negative to moderately strong (++) focal expression. This heterogeneous patient-specific distribution suggests that although systemic oxidative stress and circulating ferritin strongly indicate advanced melanoma, local tissue iron dynamics and oxidative modifications operate via distinct individualized regulatory mechanisms that transcend strict stage-specific categorization (Table 3).
4. Discussion
Differences observed in the histologic types and Breslow thicknesses among the primary tumor groups were anticipated, given that heterogeneous melanoma subtypes, such as nodular and acral lentiginous melanomas, exhibit greater invasiveness. Furthermore, the observation that the cutaneous >2 mm group displayed Breslow values comparable to the primary tumor in the metastasis group underscores the elevated metastatic risk associated with greater Breslow thickness [18].
The precise function of ferritin in cancer remains largely unclear. However, during inflammatory conditions, macrophage stimulation by cytokines is known to trigger the release of serum FHC [19,20]. While serum ferritin is typically predominantly the FLC type, shifts in the ratio of FHC to FLC appear to exert immunosuppressive effects in malignancies. It was previously demonstrated that an elevated FHC:FLC ratio in the plasma of melanoma patients triggered immunosuppressive activity by promoting regulatory T-cell proliferation [21]. Notably, they found this elevated ratio across all disease stages. In our study, while the FHC:FLC ratio was elevated across all melanoma groups, we observed a significant increase in systemic FHC levels specifically within the cutaneous >2 mm and metastasis groups. It is well established that cancer patients frequently present with high total serum ferritin levels, which generally predict a poor clinical outcome [22,23]. This correlation holds for human melanoma, where elevated total serum ferritin is linked to advanced metastatic disease [24].
Alongside the elevated serum FHC levels, systemic lipid peroxidation, measured in erythrocytes via chemiluminescence (CL), was significantly higher in both the cutaneous >2 mm and metastasis groups relative to controls. We utilized tert-butyl hydroperoxide-initiated CL to assess both the initial formation of membrane lipid peroxides and the status of nonenzymatic antioxidant defenses. A depletion of antioxidants due to preceding oxidative stress causes a leftward shift and an upward increase in the CL curves, indicating a direct relationship between CL intensity and lipid peroxidation [25,26]. Our findings revealed qualitative differences in the lipid peroxidation curves across all groups, suggesting changes in both cell membrane integrity and antioxidant profiles that alter kinetic patterns through the depletion of oxidizable substrates [27]. Quantitative CL analysis corroborated these shifts, evidenced by higher area under the curve (AUC) values for the cutaneous >2 mm and metastasis groups compared to the control group. This aligns with our recent work demonstrating a positive correlation between serum malondialdehyde (MDA), a recognized biological indicator of lipid peroxidation, and Breslow thickness in cutaneous melanoma patients [28].
Although systemic oxidative stress remains relatively under-investigated in human melanoma, existing evidence highlights its critical impact on disease prognosis [14,28,29,30]. While data specifically linking serum FHC and oxidative stress in melanoma are sparse, elevated systemic MDA and total serum ferritin have been documented in breast cancer and multiple myeloma [31,32]. We have previously demonstrated that systemic oxidative stress persists in melanoma patients even following the surgical excision of the primary tumor [28]. Additionally, metastatic melanoma patients exhibit reduced TGF-β levels associated with heightened oxidative stress [14]. In the current study, we observed concurrent increases in systemic lipid peroxidation and serum FHC exclusively in patients with metastatic disease or a high risk of metastasis (cutaneous > 2 mm). Because total ferritin and FHC, in particular, are upregulated under pro-oxidant conditions, it is likely that the systemic oxidative stress characterizing advanced melanoma drives FHC production in inflammatory cells and the liver, potentially contributing to a poor clinical outcome. Ferritin light (FLC) and heavy (FHC) chains also act as pivotal immunomodulators in oncology [2]. This study helps to establish that ferritin dynamics are altered across all melanoma patients, and that FHC overexpression and systemic oxidative stress may be considered hallmarks of advanced disease stages.
While we detected elevated serum FHC levels in patients with high Breslow thickness or metastases, this systemic increase was not reflected within the tumor tissue itself. FHC labeling in tumor was observed in 5/15 of cutaneous <2 mm cases, 8/18 of cutaneous >2 mm cases, and 7/16 of metastatic tumor. Even though a direct prognostic role for FHC expression during melanoma progression could not be definitively established, our findings represent the first immunohistochemical confirmation of FHC presence within human melanoma tumor tissues. Previous studies on p53 protein expression reported inconsistent or limited independent prognostic value in melanoma [33,34]. In our analysis, only the cutaneous <2 mm group exhibited significantly lower expression of total p53 compared to the metastasis group, driven by differences in the proportion of p53-positive nuclei between the cohorts.
To indirectly assess oxidative stress, we utilized 3-NT labeling to detect the downstream products of NO• and O2•− in primary and metastatic melanomas, aiming to map the relationship between disease progression and oxidative environments. When nitric oxide (NO•) interacts with the superoxide anion radical (O2•−), it generates peroxynitrite (ONOO−), which subsequently nitrates protein tyrosine residues to form 3-NT; therefore, nitrotyrosine (NT) serves as a robust in vivo measurable parameter for ONOO− production [35,36,37]. Similar to the FHC immunohistochemistry results, 3-NT expression did not reach statistical significance between groups, despite being detected in a higher proportion of samples from the cutaneous >2 mm and metastasis cohorts (cutaneous < 2 mm: 5/15; cutaneous > 2 mm: 11/18; metastasis: 10/16). Some limitations are expected when the samples are from human subjects and should be addressed, such as the lack of established p53 mutation status and the absence of Ki67 quantification, which could help in establishing melanoma recurrence. However, this work provides new insights into the role of ferritin, oxidative stress, and p53 in a unique cohort of melanoma patients, considered a significant point, given the heterogeneity of the various melanoma subtypes included in the study, such as superficial spreading melanoma, nodular melanoma, and acral lentiginous melanoma, each of which may represent a distinct realm in terms of its oncogenic mechanisms.
5. Conclusions
Alterations in serum ferritin composition were evident across all melanoma patient groups, yet significant elevations in both FHC and systemic oxidative stress were strictly confined to advanced disease stages. Given that ferritin is heavily upregulated during inflammation and malignancy, this suggests that this circulating pool is likely secreted by macrophages and hepatic cells acting as an acute-phase reactant. While a biological correlation links FHC, p53, and oxidative stress, intratumoral FHC and 3-NT expression did not statistically differ across tumor stages, whereas p53 expression was significantly higher in metastatic lesions than in thin cutaneous melanomas (<2 mm). Nevertheless, 3-NT expression visibly intensified in cutaneous tumors >2 mm and in metastatic lesions. Ultimately, the mechanisms governing FHC and oxidative stress-mediated cell death in melanoma demand rigorous future investigation, as this axis holds substantial promise for the development of both robust clinical measurable parameters and novel therapeutic targets.
Author Contributions
Conceptualization, A.L.C.; methodology, S.S.B., G.P.-Z., F.P.d.S.-N., and L.N.Z.R.; validation, S.S.B.; formal analysis, S.S.B.; investigation, S.S.B., G.P.-Z., F.P.d.S.-N., and L.N.Z.R.; resources, A.L.C. and S.B.; data curation, S.S.B.; writing—original draft preparation, S.S.B., A.L.C., and S.B.; writing—review and editing, S.S.B., R.C., A.L.C., and S.B.; visualization, S.S.B. and S.B.; supervision, A.L.C.; project administration, A.L.C.; funding acquisition, A.L.C. and S.B. All authors have read and agreed to the published version of the manuscript.
Funding
The authors thank Fundação Araucária (Brazil) and the German Federal Ministry of Education and Research (BMBF, today BMFTR, grant number 03Z22DN11 to SB) for providing financial support.
Institutional Review Board Statement
The study was conducted in accordance with the Declaration of Helsinki and approved by the Research and Ethics National Council (CAAE, approval number 5831.0.000.268.10, approved on 28 February 2011).
Informed Consent Statement
Informed consent was obtained from all subjects involved in the study.
Data Availability Statement
The underlying data of this manuscript can be retrieved from the corresponding authors upon reasonable request.
Acknowledgments
The authors are grateful to J.A. Vargas and P. S. R. D. Filho, State University of Londrina, for excellent technical assistance, and E. C. B. Carmelo, Department of Clinical Research of Londrina Cancer Hospital, for their great help in patient recruitment and interviews. We thank the physicians M. A. Buges and C. Z. Campos for allowing their patients’ participation in the study.
Conflicts of Interest
The authors declare no conflicts of interest.
References
- Rowinska, K.; Baszuk, P.; Rogoza-Janiszewska, E.; Deptula, J.; Marciniak, W.; Derkacz, R.; Lener, M.; Cybulski, C.; Kiedrowicz, M.; Boer, M.; et al. Serum Iron Level and 10-Year Survival after Melanoma. Biomedicines 2022, 10, 3018. [Google Scholar] [CrossRef] [Scilit] [PubMed]
- Shi, X.; Zhang, A.; Lu, J.; Wang, X.; Yi, C.; Yang, F. An Overview of Heavy Chain Ferritin in Cancer. Front. Biosci. (Landmark Ed.) 2023, 28, 182. [Google Scholar] [CrossRef] [Scilit] [PubMed]
- Arosio, P.; Cairo, G.; Bou-Abdallah, F. A Brief History of Ferritin, an Ancient and Versatile Protein. Int. J. Mol. Sci. 2024, 26, 206. [Google Scholar] [CrossRef] [Scilit] [PubMed]
- Orino, K.; Lehman, L.; Tsuji, Y.; Ayaki, H.; Torti, S.V.; Torti, F.M. Ferritin and the response to oxidative stress. Biochem. J. 2001, 357, 241–247. [Google Scholar] [CrossRef]
- Chen, X.; Bu, N.; Lv, Q.; Zhao, J. Serum ferritin as a non-invasive prognostic biomarker in cancer: A systematic review and meta-analysis. Front. Oncol. 2026, 16, 1892172. [Google Scholar] [CrossRef] [Scilit] [PubMed]
- Recalcati, S.; Cairo, G. Macrophages and Iron: A Special Relationship. Biomedicines 2021, 9, 1585. [Google Scholar] [CrossRef] [Scilit] [PubMed]
- Luger, T.A.; Linkesch, W.; Knobler, R.; Kokoschka, E.M. Serial determination of serum ferritin levels in patients with malignant melanoma. Oncology 1983, 40, 263–267. [Google Scholar] [CrossRef] [Scilit] [PubMed]
- Xu, R.; Wang, W.; Zhang, W. Ferroptosis and the bidirectional regulatory factor p53. Cell Death Discov. 2023, 9, 197. [Google Scholar] [CrossRef] [Scilit] [PubMed]
- Faniello, M.C.; Di Sanzo, M.; Quaresima, B.; Baudi, F.; Di Caro, V.; Cuda, G.; Morrone, G.; Del Sal, G.; Spinelli, G.; Venuta, S.; et al. p53-mediated downregulation of H ferritin promoter transcriptional efficiency via NF-Y. Int. J. Biochem. Cell Biol. 2008, 40, 2110–2119. [Google Scholar] [CrossRef] [Scilit] [PubMed]
- Lee, J.H.; Jang, H.; Cho, E.J.; Youn, H.D. Ferritin binds and activates p53 under oxidative stress. Biochem. Biophys. Res. Commun. 2009, 389, 399–404. [Google Scholar] [CrossRef] [Scilit] [PubMed]
- Vlasic, I.; Horvat, A.; Tadijan, A.; Slade, N. p53 Family in Resistance to Targeted Therapy of Melanoma. Int. J. Mol. Sci. 2022, 24, 65. [Google Scholar] [CrossRef] [Scilit] [PubMed]
- Avery-Kiejda, K.A.; Bowden, N.A.; Croft, A.J.; Scurr, L.L.; Kairupan, C.F.; Ashton, K.A.; Talseth-Palmer, B.A.; Rizos, H.; Zhang, X.D.; Scott, R.J.; et al. P53 in human melanoma fails to regulate target genes associated with apoptosis and the cell cycle and may contribute to proliferation. BMC Cancer 2011, 11, 203. [Google Scholar] [CrossRef] [Scilit] [PubMed]
- Pandya, P.; Kublo, L.; Stewart-Ornstein, J. p53 Promotes Cytokine Expression in Melanoma to Regulate Drug Resistance and Migration. Cells 2022, 11, 405. [Google Scholar] [CrossRef] [Scilit] [PubMed]
- Bernardes, S.S.; de Souza-Neto, F.P.; Melo, G.P.; Guarnier, F.A.; Marinello, P.C.; Cecchini, R.; Cecchini, A.L. Correlation of TGF-β1 and oxidative stress in the blood of patients with melanoma: A clue to understanding melanoma progression? Tumor Biol. 2016, 37, 10753–10761. [Google Scholar] [CrossRef] [Scilit] [PubMed]
- Ferdous, Z.; Beegam, S.; Zaaba, N.E.; Nemmar, A. Exposure to Waterpipe Smoke Disrupts Erythrocyte Homeostasis of BALB/c Mice. Biology 2024, 13, 453. [Google Scholar] [CrossRef] [Scilit] [PubMed]
- Purdue, M.P.; From, L.; Kahn, H.J.; Armstrong, B.K.; Kricker, A.; Gallagher, R.P.; McLaughlin, J.R.; Klar, N.S.; Marrett, L.D. Etiologic factors associated with p53 immunostaining in cutaneousmalignant melanoma. Int. J. Cancer 2005, 117, 486–493. [Google Scholar] [CrossRef] [Scilit] [PubMed]
- Fitzpatrick, T.B. The Validity and Practicality of Sun-Reactive Skin Types I Through VI. Arch. Dermatol. 1988, 124, 869–871. [Google Scholar] [CrossRef] [Scilit]
- Soong, S.J.; Shaw, H.M.; Balch, C.M.; McCarthy, W.H.; Urist, M.M.; Lee, J.Y. Predicting survival and recurrence in localized melanoma: A multivariate approach. World J. Surg. 1992, 16, 191–195. [Google Scholar] [CrossRef] [Scilit] [PubMed]
- Chen, T.T.; Li, L.; Chung, D.H.; Allen, C.D.; Torti, S.V.; Torti, F.M.; Cyster, J.G.; Chen, C.Y.; Brodsky, F.M.; Niemi, E.C.; et al. TIM-2 is expressed on B cells and in liver and kidney and is a receptor for H-ferritin endocytosis. J. Exp. Med. 2005, 202, 955–965. [Google Scholar] [CrossRef] [Scilit] [PubMed]
- Tran, T.N.; Eubanks, S.K.; Schaffer, K.J.; Zhou, C.Y.J.; Linder, M.C. Secretion of Ferritin by Rat Hepatoma Cells and Its Regulation by Inflammatory Cytokines and Iron. Blood 1997, 90, 4979–4986. [Google Scholar] [CrossRef] [Scilit]
- Gray, C.P.; Arosio, P.; Hersey, P. Association of Increased Levels of Heavy-Chain Ferritin with Increased CD4+ CD25+ Regulatory T-Cell Levels in Patients with Melanoma. Clin. Cancer Res. 2003, 9, 2551–2559. [Google Scholar] [PubMed]
- Bomford, A.B.; Munro, H.N. Ferritin gene expression in health and malignancy. Pathobiology 1992, 60, 10–18. [Google Scholar] [CrossRef] [Scilit] [PubMed]
- Hazard, J.T.; Drysdale, J.W. Ferritinaemia in cancer. Nature 1977, 265, 755–756. [Google Scholar] [CrossRef] [Scilit] [PubMed]
- Wang, W.; Knovich, M.A.; Coffman, L.G.; Torti, F.M.; Torti, S.V. Serum ferritin: Past, present and future. Biochim. Biophys. Acta 2010, 1800, 760–769. [Google Scholar] [CrossRef] [Scilit] [PubMed]
- Oliveira, F.J.; Cecchini, R. Oxidative stress of liver in hamsters infected with Leishmania (L.) chagasi. J. Parasitol. 2000, 86, 1067–1072. [Google Scholar] [CrossRef] [Scilit]
- Llesuy, S.F.; Milei, J.; Gonzalez Flecha, B.S.; Boveris, A. Myocardial damage induced by doxorubicins: Hydroperoxide-initiated chemiluminescence and morphology. Free Radic. Biol. Med. 1990, 8, 259–264. [Google Scholar] [CrossRef] [Scilit] [PubMed]
- Azorin, I.; Bella, M.C.; Iborra, F.J.; Fornas, E.; Renau-Piqueras, J. Effect of tert-butyl hydroperoxide addition on spontaneous chemiluminescence in brain. Free Radic. Biol. Med. 1995, 19, 795–803. [Google Scholar] [CrossRef] [Scilit] [PubMed]
- Bernardes, S.S.; de Souza-Neto, F.P.; Ramalho, L.N.; Derossi, D.R.; Guarnier, F.A.; da Silva, C.F.; Melo, G.P.; Simao, A.N.; Cecchini, R.; Cecchini, A.L. Systemic oxidative profile after tumor removal and the tumor microenvironment in melanoma patients. Cancer Lett. 2015, 361, 226–232. [Google Scholar] [CrossRef] [Scilit] [PubMed]
- Gadjeva, V.; Dimov, A.; Georgieva, N. Influence of therapy on the antioxidant status in patients with melanoma. J. Clin. Pharm. Ther. 2008, 33, 179–185. [Google Scholar] [CrossRef] [Scilit] [PubMed]
- Joosse, A.; De Vries, E.; van Eijck, C.H.; Eggermont, A.M.; Nijsten, T.; Coebergh, J.W. Reactive oxygen species and melanoma: An explanation for gender differences in survival? Pigment Cell Melanoma Res. 2010, 23, 352–364. [Google Scholar] [CrossRef] [Scilit] [PubMed]
- Panis, C.; Herrera, A.C.; Victorino, V.J.; Campos, F.C.; Freitas, L.F.; De Rossi, T.; Colado Simao, A.N.; Cecchini, A.L.; Cecchini, R. Oxidative stress and hematological profiles of advanced breast cancer patients subjected to paclitaxel or doxorubicin chemotherapy. Breast Cancer Res. Treat. 2012, 133, 89–97. [Google Scholar] [CrossRef] [Scilit] [PubMed]
- Lodh, M.; Goswami, B.; Gupta, N.; Patra, S.K.; Saxena, A. Assessment of oxidative stress and inflammatory process in patients of multiple myeloma. Indian J. Clin. Biochem. 2012, 27, 410–413. [Google Scholar] [CrossRef] [Scilit] [PubMed]
- Hieken, T.J.; Ronan, S.G.; Farolan, M.; Shilkaitis, A.L.; Das Gupta, T.K. Molecular prognostic markers in intermediate-thickness cutaneous malignant melanoma. Cancer 1999, 85, 375–382. [Google Scholar] [CrossRef] [Scilit]
- Vaisanen, A.; Kuvaja, P.; Kallioinen, M.; Turpeenniemi-Hujanen, T. A prognostic index in skin melanoma through the combination of matrix metalloproteinase-2, Ki67, and p53. Hum. Pathol. 2011, 42, 1103–1111. [Google Scholar] [CrossRef] [Scilit] [PubMed]
- Huang, Z.; Shiva, S.; Kim-Shapiro, D.B.; Patel, R.P.; Ringwood, L.A.; Irby, C.E.; Huang, K.T.; Ho, C.; Hogg, N.; Schechter, A.N.; et al. Enzymatic function of hemoglobin as a nitrite reductase that produces NO under allosteric control. J. Clin. Investig. 2005, 115, 2099–2107. [Google Scholar] [CrossRef] [Scilit] [PubMed]
- MacMillan-Crow, L.A.; Cruthirds, D.L.; Ahki, K.M.; Sanders, P.W.; Thompson, J.A. Mitochondrial tyrosine nitration precedes chronic allograft nephropathy. Free Radic. Biol. Med. 2001, 31, 1603–1608. [Google Scholar] [CrossRef] [Scilit] [PubMed]
- Beckman, J.S.; Koppenol, W.H. Nitric oxide, superoxide, and peroxynitrite: The good, the bad, and ugly. Am. J. Physiol. 1996, 271, C1424–C1437. [Google Scholar] [CrossRef] [Scilit] [PubMed]

Disclaimer/Publisher’s Note: The statements, opinions and data contained in all publications are solely those of the individual author(s) and contributor(s) and not of MDPI and/or the editor(s). MDPI and/or the editor(s) disclaim responsibility for any injury to people or property resulting from any ideas, methods, instructions or products referred to in the content. |
© 2026 by the authors. Licensee MDPI, Basel, Switzerland. This article is an open access article distributed under the terms and conditions of the Creative Commons Attribution (CC BY) license.