


Abstract
Smilax aspera L. (Smilacaceae), or sarsaparilla, is a wild Mediterranean climbing shrub whose red berries are used in Palestinian folk medicine for inflammatory, rheumatic, and dermatological conditions. Although its leaves, stems, and roots have attracted renewed phytochemical interest, the fruit remains only partly characterized at the compound level. This work determined the phenolic and flavonoid content of wild Palestinian S. aspera fruit extracted with water, 80% ethanol, and 99% ethanol; evaluated antioxidant activity by the DPPH and FRAP assays; screened antimicrobial activity against Staphylococcus aureus, Escherichia coli, and Candida albicans; fractionated the major UV-active constituents by preparative HPLC-PDA; and characterized them by ESI-MS and MS/MS. Water gave the highest phenolic content (8.21 mg GAE/g), while the FRAP responses of all three extracts were low and below the limit of quantification; 80% ethanol gave the highest flavonoid content (1.22 mg CE/g); and 99% ethanol showed the strongest DPPH activity (5.96 mg TE/g; 78.96% inhibition). Both ethanolic extracts inhibited S. aureus (20 mm) and C. albicans (19–20 mm), but not E. coli, while the aqueous extract inhibited only C. albicans (13 mm). Preparative HPLC-PDA gave eight fractions. Rutin (quercetin-3-O-rutinoside) and a caffeoylquinic acid of the chlorogenic acid type were identified as the main constituents, together with a quercetin-O-hexoside and an isorhamnetin-O-deoxyhexosyl-hexoside accompanied by a minor kaempferol-O-deoxyhexosyl-hexoside. The 80% ethanolic extract caused no visible morphological changes in HT-29 colon cancer cells. Wild Palestinian S. aspera fruit is therefore a source of flavonol glycosides and a caffeoylquinic acid that may contribute to the antioxidant and antimicrobial activity of its extracts, which supports further study of the fruit as a nutraceutical ingredient.
1. Introduction
Palestine is relatively small in area, yet its location at the meeting point of the African, Asian, and European continents contributes to a remarkably diverse flora and fauna. About 51,000 living species have been recorded in the region, representing approximately 3% of global biodiversity and occurring across five biogeographical zones and four phytogeographical regions. The Palestinian flora includes more than 2500 plant species, of which 54 are endemic taxa found nowhere else in the world [1].
Plants used in traditional medicine are an important source of secondary metabolites with a wide range of biological activities. Ethnobotanical studies from Palestine and the wider Middle East have documented numerous medicinal plants and their traditional uses [2,3,4,5]. Many of the secondary metabolites reported from these plants have also shown biological activity in experimental studies, including antimicrobial, antioxidant, anti-inflammatory, anti-allergic, antiviral, and anticancer effects [6].
Smilax aspera L. (S. aspera) is a wild, evergreen, creeping and strongly climbing shrub belonging to the family Smilacaceae, although the species has historically been placed in the Liliaceae. It is characteristic of the Mediterranean region and belongs to the genus Smilax, which contains approximately 350 species. The plant is commonly known as sarsaparilla and is locally known in Palestine as (عناب) Innab, with another local name being Ollaiq (عليق) [7]. Several parts of the plant are edible: the roots have been used as an ingredient in soft drinks, and the young shoots can be cooked and consumed as an asparagus substitute [8]. The berries, which are the focus of the present study, are bright red, spherical fruits approximately 5–10 mm in diameter, with a rubbery texture and a single large central seed [9]; their red color has been associated with anthocyanin pigments [8].
S. aspera has a long history of use in Mediterranean and Palestinian folk medicine. Different preparations of the plant have traditionally been used for conditions including syphilis, diabetes, rheumatism, inflammatory skin disorders, psoriasis, and urinary tract inflammation. The plant has also been used as a tonic and for its reported depurative, diaphoretic, diuretic, and antioxidant properties [10].
Several chemical and biological properties of S. aspera have already been investigated. The total phenolic content (TPC), total flavonoid content (TFC), antioxidant capacity, cytotoxicity, and potential anti-inflammatory activity of the species have been reported [10]. Various secondary metabolites, including steroidal saponins, trans-resveratrol, and anthocyanins, have also been isolated from S. aspera [11]. More broadly, a recent review compiled more than 1058 compounds reported from the genus Smilax, including flavonoids, phenolic acids, steroidal saponins, polysaccharides, and stilbenoids, reflecting the considerable chemical diversity of the genus and its wide range of reported pharmacological activities [12]. Antioxidant, anti-inflammatory, and pro-apoptotic anticancer effects have also been described for several Smilax species [13,14].
Phenolic constituents and, in several cases, DPPH radical-scavenging activity have been reported for a number of species within the genus, including S. bockii [14], S. campestris [15], S. glabra [16], S. lanceifolia [17], S. perfoliata [18], S. riparia [19], S. scobinicaulis [20], and S. sebeana [21]. Cytotoxic polyphenols have also been reported from S. china [22]. In S. aspera specifically, a comparison of leaves and fruits collected from different locations found relatively small differences between locations and species, but antioxidant capacity was consistently higher in the fruit than in the leaves [23].
More recent studies have provided additional evidence for the biological activity of S. aspera. A 70% methanolic extract of the aerial parts, consisting of leaves and stems and containing rutin and luteolin, showed cytotoxic activity against glioblastoma (A172) and rhabdomyosarcoma (TE671) cell lines; the same extract also showed antioxidant activity in the DPPH and ABTS assays [24]. Root extracts have separately been reported to be cytotoxic toward MDA-MB-231 breast, A549 lung, and OVCAR3 ovarian cancer cell lines, with evidence suggesting an apoptosis-related mechanism [25]. In another study, hydromethanolic extracts of S. aspera leaves and fruits showed activity against the plant pathogens Erwinia amylovora, Pseudomonas syringae pv. actinidiae, and Xanthomonas campestris pv. campestris, leading to their proposal as potential antibacterial “biorationals” for crop protection [26]. More recently, phenolic extracts from S. aspera roots showed antioxidant activity and moderate activity against Pseudomonas aeruginosa, Klebsiella pneumoniae, and Staphylococcus aureus, together with stronger activity against Candida albicans [27].
Although these studies provide useful information about the biological activity of S. aspera, most of the available work has focused on leaves, stems, or roots. The fruit has received considerably less attention at the level of individual, chromatographically separated secondary metabolites. This is particularly relevant because the fruit is an edible part of the plant and is consistent with the traditional use of S. aspera in the Mediterranean and Palestinian region.
The present study therefore investigated wild S. aspera fruit collected in Palestine using a combination of chemical and biological approaches. The objectives were to (i) determine the TPC and TFC of fruit extracts prepared with water, 80% ethanol, and 99% ethanol; (ii) evaluate their antioxidant activity using the DPPH and FRAP assays; (iii) screen their antibacterial and antifungal activity using the agar well-diffusion method; (iv) examine the effect of the most flavonoid-rich extract on the morphology of HT-29 colon cancer cells; and (v) fractionate and characterize the major UV-active constituents of the fruit using preparative HPLC-PDA followed by ESI-MS and MS/MS. The overall aim was to establish a compound-level phytochemical profile of wild Palestinian S. aspera fruit and to relate this profile to the antioxidant and antimicrobial properties observed in the crude extracts.
2. Materials and Methods
2.1. Plant Material, Chemicals, and Extraction
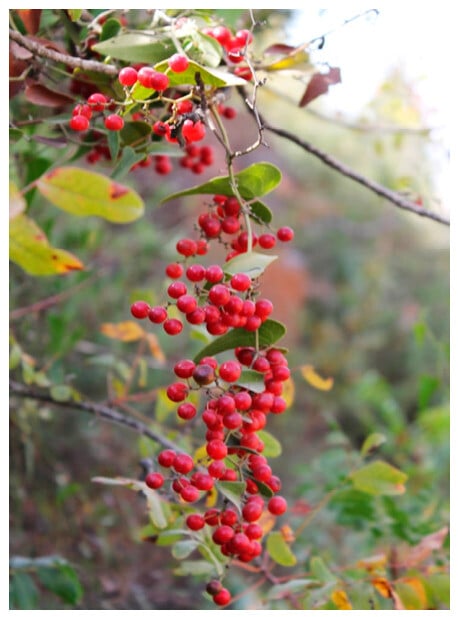
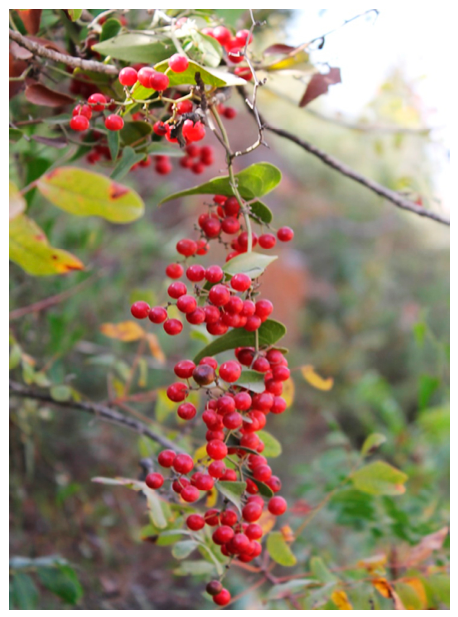
Ripened fruits of wild S. aspera (Figure 1) were collected from Wadi Al-Makhrour, Beit Jala (Palestine), during their maturity season in October. The plant was botanically identified according to Flora Palestina [7]; identification and authentication of the plant material were carried out by Dr. Khaled Sawalha, Department of Biology, Faculty of Science & Technology, Al-Quds University. A voucher specimen (Accession No. SMIASP AQU 2016) has been deposited at the Al-Quds University Botanic Garden & Herbarium (AQUB/HERB). Fruits were air-dried under shade at room temperature for approximately one month and ground to a fine powder with a blender. Ten grams of the dried powder (the original red flesh material) were sonicated separately with 100 mL of distilled water, 80% ethanol, or 99% ethanol for 90 min at 37 °C. One extract was prepared with each solvent from a composite sample of approximately 2 kg of fruit collected from four plants at the same site. Each extract was filtered through a disposable 0.45 µm PTFE membrane filter and the resulting crude extracts were stored at +4 °C until analysis.
Figure 1.
Ripe berries of wild Smilax aspera (Wadi Al-Makhrour, Beit Jala, Palestine) at the collection stage used in this study. Photo taken by Prof. Khaled Sawalha.
Folin–Ciocalteu reagent, gallic acid, (+)-catechin, Trolox, 2,2-diphenyl-1-picrylhydrazyl (DPPH), 2,4,6-tris(2-pyridyl)-s-triazine (TPTZ), iron(III) chloride hexahydrate, iron(II) sulfate heptahydrate, sodium nitrite, aluminum chloride, sodium hydroxide, sodium bicarbonate, acetic acid, and hydrochloric acid (analytical grade), as well as the phenolic and flavonoid reference standards listed in Section 2.8, were purchased from Sigma-Aldrich (St. Louis, MO, USA). HPLC-grade acetonitrile and water, LC-MS grade formic acid, acetonitrile, methanol, and water, and 0.45 µm membrane filters were also obtained from Sigma-Aldrich, and ethanol was obtained from Merck (Darmstadt, Germany). Ultrapure water (>18 MΩ·cm) was produced with a Milli-Q system (Millipore, Merck).
2.2. Total Phenolic Content (Folin–Ciocalteu Assay)
Total phenolics were determined using the Folin–Ciocalteu reagent [28]. Extract aliquots (40 µL), diluted 3-fold with the extraction solvent (dilution factor, DF = 3), were mixed with 1.8 mL of Folin–Ciocalteu reagent (pre-diluted 10-fold with distilled water) and left to stand at room temperature for 5 min; 1.2 mL of 7.5% sodium bicarbonate was then added. After standing for 60 min at room temperature, absorbance was measured at 765 nm. Aqueous gallic acid solutions (100, 200, 350, 450, and 500 ppm) were treated in the same way and used for calibration and results were expressed as mg gallic acid equivalents (GAE)/g dry sample [29]. TPC was calculated as C × DF × V/m, where C is the gallic acid-equivalent concentration of the diluted extract read from the calibration curve (mg/L), DF is the dilution factor of the extract in the assay, V is the volume of extraction solvent (0.1 L), and m is the mass of dry fruit extracted (10 g). The same calculation was used for TFC (DF = 1), DPPH (DF = 4), and FRAP (DF = 1) with the respective standard. Determinations were performed in duplicate and the mean absorbance was used for calculations.
2.3. Determination of Total Flavonoid Content
Total flavonoid content was determined by a colorimetric sodium nitrite–aluminum chloride assay [30]. Distilled water (4 mL) was added to 1 mL of undiluted extract (DF = 1), followed by 0.3 mL of 5% sodium nitrite and, after 5 min, 0.3 mL of 10% aluminum chloride. After incubation at room temperature for 5 min, 2 mL of 1 M sodium hydroxide were added and the volume was adjusted to 10 mL with distilled water. The pink color developed was measured at 510 nm. Aqueous catechin solutions (50–100 ppm) were used for calibration and results were expressed as mg catechin equivalents (CE)/g dry sample. Because this assay responds mainly to flavonoids with catechol or 3-/5-hydroxy-4-keto groups, TFC values expressed as catechin equivalents should be regarded as estimates that depend on the flavonoid classes present [31]. Determinations were performed in duplicate.
2.4. Antioxidant Activity: Ferric-Reducing Antioxidant Power (FRAP) Assay
Ferric-reducing antioxidant power was determined by the method of Benzie and Strain [32], with the longer reaction time proposed by Pulido et al. [33]. The FRAP reagent was prepared fresh by mixing 25 mL of 300 mM acetate buffer (pH 3.6), 2.5 mL of 10 mM TPTZ in 40 mM HCl, and 2.5 mL of 20 mM FeCl3·6H2O (10:1:1, v/v/v) and was warmed to 37 °C. The reagent (3.0 mL) was mixed with 40 µL of undiluted extract (DF = 1) and incubated at 37 °C for 60 min, and the absorbance was then read at 593 nm against a reagent blank incubated under the same conditions. We used 60 min instead of the 4 min of the original protocol because many polyphenols, particularly flavonoid glycosides and hydroxycinnamic acid esters, react slowly with the Fe3+–TPTZ complex and do not reach a stable absorbance within 4 min, so that a 4 min reading underestimates their reducing capacity [33]. Aqueous Fe2+ solutions (FeSO4·7H2O; 2.0, 2.5, 3.0, 3.5, 4.0, 4.5, and 5.0 mM) were used for calibration. The Fe2+ concentration read from the calibration curve (mM) was converted to mg/L (×55.85 mg/mmol) and then to mg Fe2+/g dry fruit as described in Section 2.2. Results corresponding to concentrations below the limit of quantification (LOQ, 1.6 mM; Table S1) are reported as <LOQ, with the extrapolated estimate given in parentheses for orientation only. Determinations were performed in duplicate.
2.5. Antioxidant Activity: DPPH Radical-Scavenging Assay
Free-radical scavenging activity was measured using the 2,2-diphenyl-1-picrylhydrazyl (DPPH) assay [34]. A 0.1 mM solution of DPPH in ethanol (3.9 mL) was added to 0.1 mL of extract (in 99% ethanol, 80% ethanol, or distilled water) diluted 4-fold with its extraction solvent (DF = 4), and the mixture was shaken and left to stand at room temperature for 30 min in the dark. Absorbance was measured at 515 nm; a lower absorbance indicated greater radical-scavenging activity. Percent DPPH inhibition was calculated as (A0 − A1)/A0 × 100, where A0 is the absorbance of the control (0.1 mL of the extraction solvent with 3.9 mL of DPPH solution) and A1 is the absorbance in the presence of the extract or standard. The control absorbance was A0 = 1.868. Trolox solutions in ethanol (20, 40, 60, 80, 100, and 120 ppm) were used for calibration, the Trolox-equivalent concentration of each extract was read from the calibration curve (Figure S1c) using its absorbance A1, and the result was converted to mg/g dry fruit as described in Section 2.2 and results were expressed as mg trolox equivalents (TE)/g dry sample. Determinations were performed in duplicate.
2.6. Antimicrobial Screening (Agar Well-Diffusion Assay)
Antimicrobial activity was evaluated against Staphylococcus aureus (Gram-positive), Escherichia coli (Gram-negative), and Candida albicans (yeast) using the agar well-diffusion method [35]. Mueller–Hinton agar (11.4 g in 300 mL distilled water) was autoclaved at 121 °C for 15 min, cooled to 45 °C, and inoculated with a standardized microbial suspension of each organism, adjusted with a UV–Vis spectrophotometer to a turbidity equivalent to the 0.5 McFarland standard (approximately 1.5 × 10⁸ CFU/mL) [36]; 1 mL of suspension was added to 15 mL of molten agar. The inoculated medium was poured into plates (20 mL/plate) and, after solidification, wells of 1 cm diameter were cut with a sterile cylinder. Each well received 100 µL of the filtered crude extract (99% ethanol, 80% ethanol, or distilled water), which corresponds to the extract of 10 mg of dry fruit; ethanol and distilled-water blanks served as negative controls, and penicillin G and gentamicin discs (10 µg/disc), placed on the same plates, served as positive controls for S. aureus and E. coli, respectively. No positive control was included for C. albicans. Plates were incubated at 37 ± 0.5 °C for 24 h and the diameter of the inhibition zone was measured with a caliper. The reported diameters include the 10 mm well. Each test was performed in duplicate.
2.7. HT-29 Cell Culture and Morphological Assessment
The effect of the most flavonoid-rich extract (80% ethanol) was examined on HT-29 human colorectal adenocarcinoma cells (ATCC® HTB-38™), originally sourced from the American Type Culture Collection (ATCC, Manassas, VA, USA) and kindly provided by Prof. Saad Lahham, Division of Anatomy, Molecular Biochemistry and Genetics, Department of Biomedical Sciences, Faculty of Medicine and Health Sciences, An-Najah National University, Nablus, Palestine. The cells were grown in Dulbecco’s modified Eagle’s medium (DMEM) supplemented with 10% fetal bovine serum, 1% L-glutamine, and 1% penicillin–streptomycin at 37 °C in a humidified 5% CO2 incubator and were cultured in 6-well plates. The extract was added from a 100 mg/mL stock solution in ethanol to give 1, 10, 50, and 100 µg of extract per well. Untreated cells and cells treated with the ethanol vehicle served as controls. The cells were examined after 24, 48, and 72 h under an inverted microscope and photographed. The assessment was qualitative: cell attachment, cell shape, the appearance of the monolayer, and the presence of rounded, detached, or floating cells were compared with the controls.
2.8. Sample Preparation for HPLC Analysis
Filtered plant extracts were evaporated under reduced pressure at 40 °C using a rotary evaporator. The resulting crude extracts were re-dissolved in their respective solvents (water, 99% ethanol, or 80% ethanol) at 5 mg/mL, filtered through a 0.45 µm PTFE membrane, and 20 µL was injected onto the analytical HPLC system. The phenolic and flavonoid standards used as markers for plant identification, on the basis of their retention time and UV-Vis spectra, were vanillic acid, ferulic acid, syringic acid, trans-cinnamic acid, catechin, p-coumaric acid, sinapic acid, 4-hydroxyphenylacetic acid, rutin hydrate, caffeic acid, quercetin, gallic acid, 3,4-dihydroxyphenylacetic acid, chlorogenic acid, taxifolin, luteolin 7-glucoside, apigenin 7-glucoside, luteolin, and quercetin 3-D-galactose, all purchased from Sigma. A mixture of 17 of these standards was injected under the conditions of Section 2.9 (Figure S6), and the retention times and UV spectra of the standards were compared with those of the peaks in the crude S. aspera extracts.
2.9. Analytical HPLC-PDA Conditions
Analytical HPLC-PDA was performed on a Waters Alliance system (e2695 separations module) equipped with a 2998 photodiode array (PDA) detector and controlled with Empower 3 chromatography software (Waters, Milford, MA, USA). Separation was achieved on an XBridge ODS column (4.6 mm i.d. × 150 mm, 5 µm; Waters) fitted with an XBridge ODS guard column (4.6 mm i.d. × 20 mm, 5 µm), using a mobile phase of 0.5% aqueous acetic acid (A) and acetonitrile (B) in linear-gradient mode: 100% A descending to 70% A over 40 min, to 40% A over the next 20 min, and to 10% A over 2 min, held for 6 min, before returning to initial conditions over 2 min, with a 5 min re-equilibration between injections. The flow rate was 1 mL/min, the injection volume 20 µL, the column temperature 25 °C, and the PDA acquisition range 210–600 nm.
2.10. Preparative HPLC-PDA Conditions
For preparative fractionation, dried fruit was macerated in ethanol (1:10, w/v) and sonicated for 2 h at room temperature; the extract was evaporated under reduced pressure at 40 °C, stored in an amber vial at 4 °C, and, prior to injection, redissolved in 80% ethanol (100 mg/mL) and filtered through a 0.45 µm PTFE membrane. Preparative HPLC-PDA was performed on an Atlantis® T3 Prep OBD™ column (100 Å, 10 µm, 19 × 250 mm; Waters) fitted with an Atlantis® T3 Prep guard column (5 µm, 19 × 20 mm), using a 3535 quaternary gradient module equipped with a 996 PDA detector. The gradient ran from 98% acidic water (0.5% acetic acid)/2% acetonitrile to 98% acetonitrile over 58 min, returning to initial conditions over 2 min. The flow rate was 15 mL/min, the injection volume 1000 µL, the column temperature ambient, and the PDA acquisition range 210–600 nm. All UV-active constituents eluted within the first 25 min; the rest of the gradient, up to 98% acetonitrile, served as a column wash to remove strongly retained, less polar material before the next 1 mL injection. Fractions were collected manually according to the PDA signal (collection windows are given in Section 3.7.
2.11. LC-MS and ESI-MS/MS Conditions
The crude extract was screened by reversed-phase UHPLC-MS on a Kinetex™ C8 column (2.6 µm, 100 Å, 100 × 2.1 mm; Phenomenex, Torrance, CA, USA) fitted with a matching SecurityGuard™ cartridge (injection volume 2 µL, column oven 35 °C), using a TSQ Quantum Access MAX system with a Dionex pump, an Accela PDA detector, and an Accela autosampler (Thermo Scientific, San Jose, CA, USA). The preparative fractions, which had already been separated, were analyzed without a column: each fraction was injected directly into a carrier stream of 70% acidic water (0.1% formic acid)/30% acetonitrile flowing at 50 µL/min into a TSQ Endura™ triple-quadrupole mass spectrometer (Thermo Fisher Scientific) fitted with an electrospray ionization (ESI) source, operated in both positive- and negative-ion full-scan and product-ion scanning (PIS) modes. The ion source parameters were as follows: positive-ion spray voltage, 3500 V; negative-ion spray voltage, 2500 V; sheath gas, 25 arb (~3.17 L/min); auxiliary gas, 10 arb (~7.97 L/min); sweep gas, 2 arb (~2.72 L/min); ion transfer tube temperature, 320 °C; and vaporizer temperature, 320 °C. Data acquisition and processing used TraceFinder 4.1 and Xcalibur Quan Browser 3.0 (Thermo Fisher Scientific, San Jose, CA, USA). Full-scan parameters, in both ionization modes, covered m/z 150–750 Da with a scan rate of 1000 Da/s; product-ion scanning of selected precursors in the negative-ion mode used collision energies of 15, 25, and 35 V with a CID gas pressure of 1.5 Torr; the quadrupole resolution was 0.7 Da (full width at half maximum), so spectra were recorded at unit mass resolution.
2.12. Statistical Analysis
For each solvent, one extract was prepared from the composite fruit sample, and each spectrophotometric assay (TPC, TFC, DPPH, FRAP) and agar well-diffusion test was performed in duplicate on that extract. The duplicates are therefore technical replicates, and the mean of the two readings, recorded at the time of measurement, is reported. Because of this design, the differences between extracts are described without inferential statistics. Calibration curves were fitted by least-squares linear regression; their slopes and intercepts with standard errors, coefficients of determination (R2), residual standard deviations (sy/x), and limits of detection and quantification (LOD = 3.3 sy/x/slope; LOQ = 10 sy/x/slope) are given in Table S1.
3. Results
3.1. Total Phenolic Content
Total phenolic content (TPC) of the three S. aspera fruit extracts was determined using a gallic acid calibration curve (y = 0.0027x − 0.1172, R2 = 0.9988; Figure S1a in the Supplementary Materials; Table S1). Taking the 3-fold dilution into account (Section 2.2), the gallic acid-equivalent concentrations in the assay solutions (152, 179, and 274 ppm for the 99% ethanolic, 80% ethanolic, and aqueous extracts) lay within the calibration range. The TPC values differed between the extracts (Table 1): the aqueous extract gave the highest TPC, followed by the 80% ethanolic extract, while the 99% ethanolic extract gave the lowest value.
Table 1.
Total phenolic content (TPC) and total flavonoid content (TFC) of wild S. aspera fruit extracts. Values are means of duplicate determinations.
This result suggests that, under the extraction conditions used here, a substantial proportion of the phenolic material measured by the Folin–Ciocalteu assay was recovered more effectively with water than with ethanol alone.
The higher TPC of the aqueous extract may seem surprising, because most flavonoid glycosides dissolve better in aqueous ethanol. Two factors probably explain it. Water extracts very polar phenolics efficiently, such as hydroxycinnamoyl-quinic acids, simple phenolic acids, and the anthocyanins that give S. aspera berries their red color [8]. In addition, the Folin–Ciocalteu reagent is not specific for phenolics: it is also reduced by other electron donors, including ascorbic acid, reducing sugars, some amino acids, and proteins, which water extracts readily from the sugar-rich fruit flesh [37,38]. In agreement with this, the aqueous extract gave by far the weakest absorbance at 350 nm in the HPLC-PDA profile (Section 3.6), showing that it contains less flavonol-type material than the ethanolic extracts. The TPC of the aqueous extract is therefore best regarded as a total Folin–Ciocalteu reducing capacity rather than as a phenolic content alone.
3.2. Total Flavonoid Content
Total flavonoid content (TFC) was calculated using a catechin calibration curve (y = 0.0048x + 0.0034, R2 = 1.000; Table S1 in the Supplementary Materials). In contrast to TPC, the highest TFC was obtained with the 80% ethanolic extract, whereas the 99% ethanolic extract gave the lowest value (Table 1). The catechin-equivalent concentrations in the assay solutions (DF = 1) were 73.6, 122.5, and 82.9 ppm for the 99% ethanolic, 80% ethanolic, and aqueous extracts; the value of the 80% ethanolic extract lies slightly above the highest standard (100 ppm) and is therefore a slight extrapolation.
The different extraction patterns for TPC and TFC suggest that the compounds measured by these two colorimetric assays were not distributed equally among the three solvent systems. The linearity of the catechin calibration curve over the tested range provided a suitable basis for calculating the TFC values.
3.3. Antioxidant Activity
The DPPH radical-scavenging activity of the extracts was calculated using a trolox calibration curve (y = −0.0026x + 0.7803, R2 = 0.9991; Figure S1c and Table S1 in the Supplementary Materials). The 99% ethanolic extract showed the highest activity, corresponding to 5.96 mg trolox equivalents (TE)/g dry fruit and 78.96% DPPH inhibition. This was followed by the aqueous extract (2.77 mg TE/g; 67.88% inhibition) and the 80% ethanolic extract (1.62 mg TE/g; 63.86% inhibition) (Table 2). With A0 = 1.868, the absorbances of the diluted extracts (A1) were 0.393 (99% ethanol), 0.675 (80% ethanol), and 0.600 (distilled water), corresponding to 149, 40, and 69 ppm Trolox equivalents in the assay solutions (DF = 4). The A1 values of the 80% ethanolic and aqueous extracts lie within the absorbance range of the Trolox standards (0.468–0.728), whereas that of the 99% ethanolic extract lies slightly below it; its TE value is therefore a slight extrapolation above the highest standard (120 ppm) and should be regarded as approximate.
Table 2.
DPPH free-radical-scavenging activity (mg trolox equivalents (TE)/g dry fruit and % inhibition) and ferric-reducing antioxidant power (FRAP, mg Fe2+/g dry fruit) of wild S. aspera fruit extracts. Values are means of duplicate determinations. FRAP values were below the LOQ of the assay (1.6 mM Fe2+); the numbers in parentheses are extrapolated estimates given for orientation only.
The FRAP responses of all three extracts were low. The Fe2+ concentrations in the assay solutions (DF = 1) were 1.09 (99% ethanol), 1.20 (80% ethanol), and 1.27 mM (distilled water), which are above the LOD (0.53 mM) but below both the LOQ (1.6 mM) and the lowest calibration standard (2.0 mM) (Table S1). The FRAP values are therefore reported as <LOQ (Table 2), and the corresponding estimates (0.61–0.71 mg Fe2+/g dry fruit) indicate only a weak ferric-reducing activity that does not allow the extracts to be ranked. The FRAP calibration curve is shown in Figure S1b.
Interestingly, the extract with the lowest measured TPC and TFC gave the strongest DPPH activity. This suggests that total phenolic or flavonoid content alone does not fully describe the antioxidant behavior of the extracts.
3.4. Antibacterial and Antifungal Activity
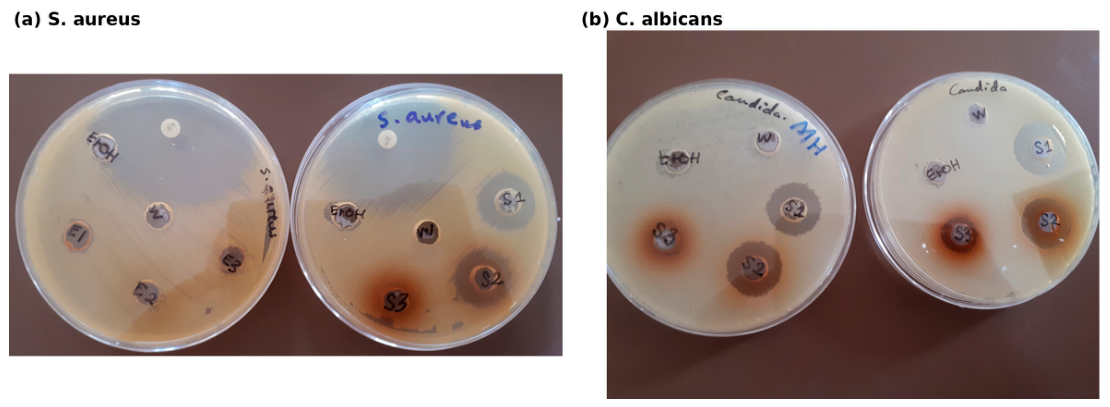
The activity of the extracts varied with the microorganism tested. Both the 99% and 80% ethanolic extracts inhibited Staphylococcus aureus, producing inhibition zones of 20 mm in each case, whereas the aqueous extract showed no detectable inhibition (Table 3, Figure 2a).
Table 3.
Inhibition-zone diameters of S. aspera fruit extracts against Staphylococcus aureus, Candida albicans, and Escherichia coli, with the corresponding positive controls (penicillin G and gentamicin). Ethanol and distilled-water solvent blanks gave no inhibition against any organism. Diameters include the 10 mm well and are means of duplicate tests. n.t., not tested.
Figure 2.
Representative agar well-diffusion plates showing zones of inhibition produced by S. aspera fruit extracts (S1: 99% ethanol; S2: 80% ethanol; S3: distilled water; W: distilled-water blank; EtOH: ethanol blank) against (a) Staphylococcus aureus and (b) Candida albicans.
Candida albicans was inhibited by all three extracts. The inhibition zones were 20 mm for the 99% ethanolic extract, 19 mm for the 80% ethanolic extract, and 13 mm for the aqueous extract (Table 3, Figure 2b). Because no positive control was included for C. albicans, this activity can be compared only with the solvent blanks, which were inactive.
In contrast, none of the three extracts inhibited Escherichia coli. The positive control, Gentamicin, produced a 24 mm inhibition zone. Representative plates showing the lack of inhibition around the extract wells are presented in Figure S2 of the Supplementary Materials.
3.5. Effect on HT-29 Colon Cancer Cells
The 80% ethanolic S. aspera fruit extract did not cause visible morphological changes in HT-29 cells under the conditions tested. Treatment with 1, 10, 50, or 100 µg of extract per well did not change the appearance of the monolayer or the shape of the cells, and did not increase the number of rounded, detached, or floating cells compared with the untreated and ethanol-vehicle controls.
This pattern was consistent at 24, 48, and 72 h after treatment; representative micrographs taken at 48 h are shown in Figure S3 of the Supplementary Materials. Within the concentration range and morphological assessment used in this study, no morphological signs of toxicity were therefore observed. Because cell number and viability were not measured, these observations do not exclude cytotoxic or antiproliferative effects.
3.6. Analytical HPLC-PDA Profiling of the Crude Extracts
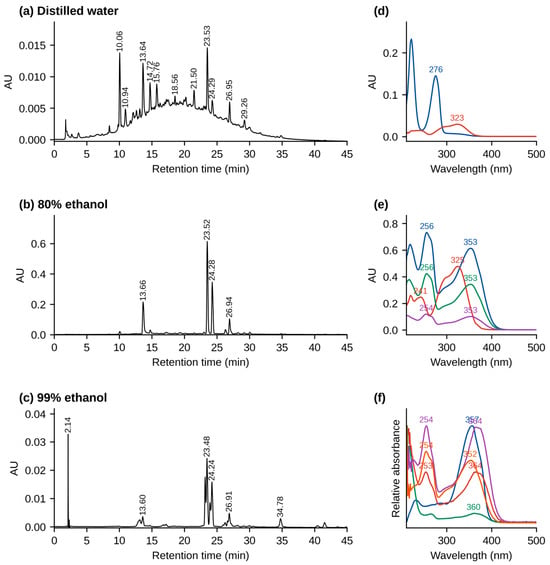
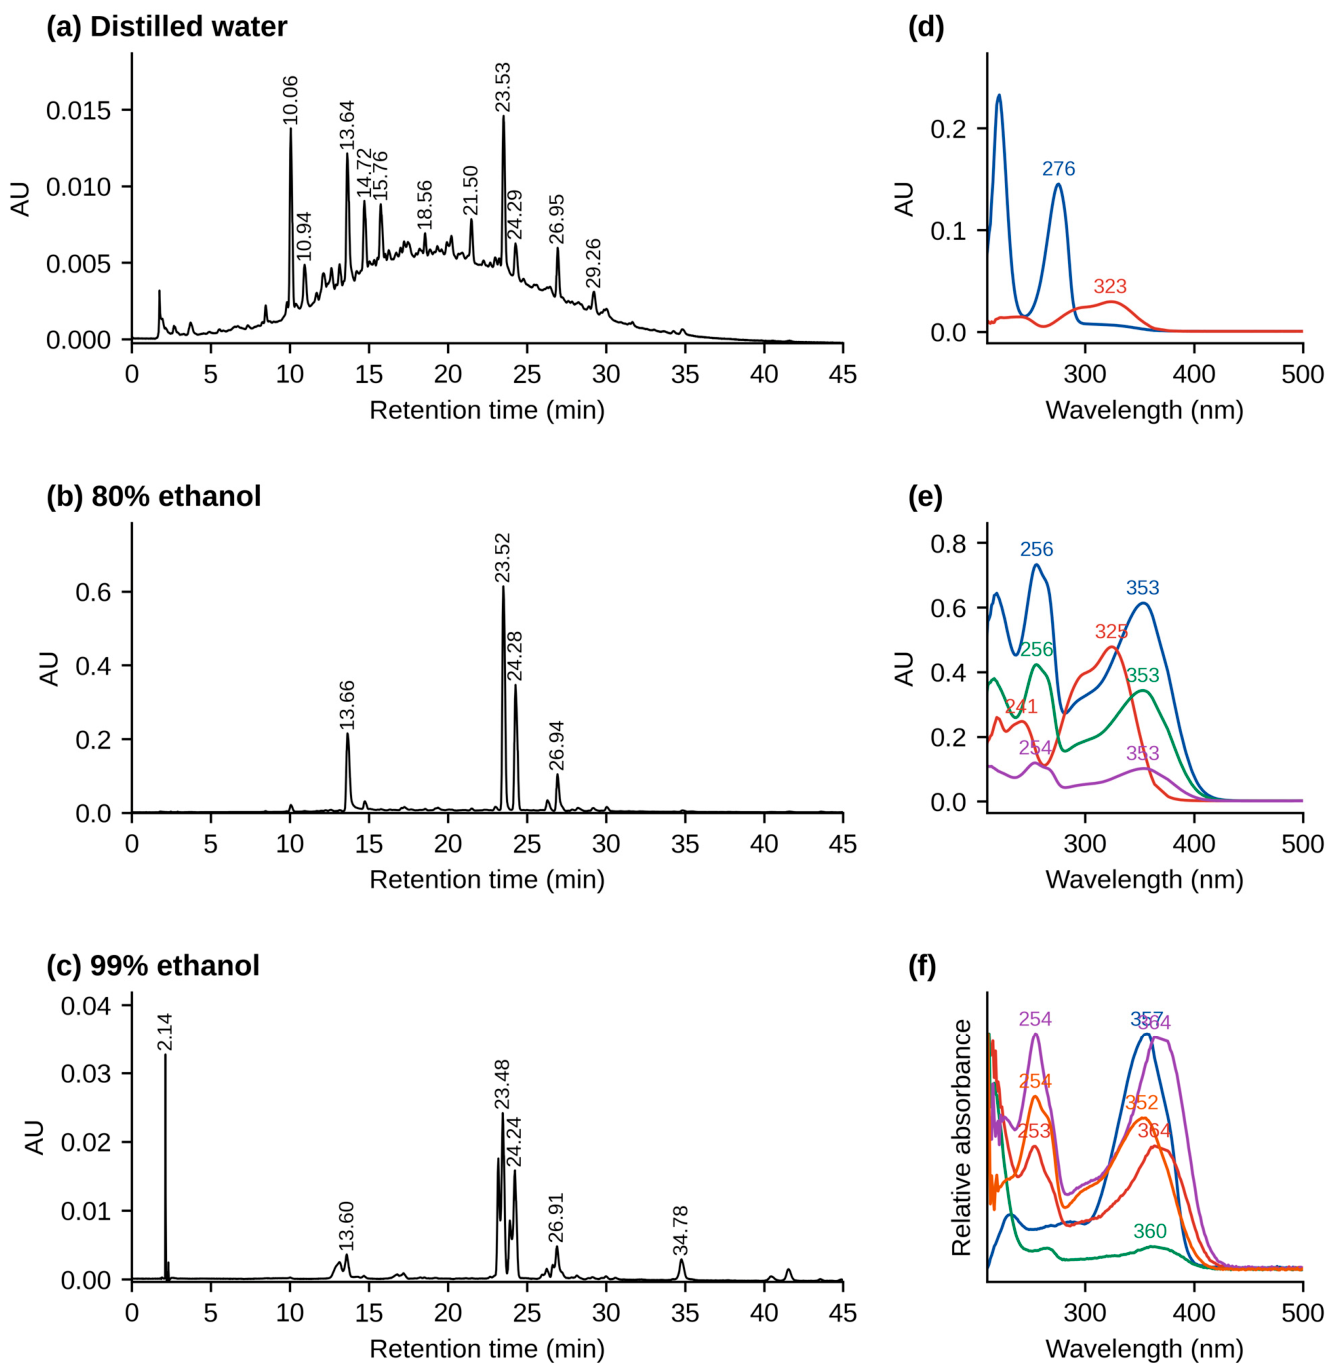
Analytical reversed-phase HPLC-PDA chromatograms recorded at 350 nm for the three crude S. aspera fruit extracts are compared in Figure 3, and the full-length chromatograms of the aqueous and 99% ethanolic extracts are given in Figures S4 and S5 of the Supplementary Materials. The 80% ethanolic extract showed the most pronounced and best-resolved chromatographic profile, with several major peaks eluting between approximately 13 and 27 min (Figure 3b).
Figure 3.
Analytical HPLC-PDA chromatograms (350 nm) of the crude S. aspera fruit extracts (5 mg/mL): (a) distilled water, (b) 80% ethanol, and (c) 99% ethanol, shown for 0–45 min (no further peaks eluted apart from a system peak at about 66 min; see Figures S4 and S5), and (d–f) UV–Vis spectra of the main peaks of each extract with their absorption maxima (nm).
The 99% ethanolic extract also produced a distinct chromatographic profile, with several closely eluting peaks around 23–24 min (Figure 3c). In comparison, the aqueous extract showed relatively low overall absorbance under the same detection conditions (Figure 3a; note the different absorbance scale). UV-Vis spectra between 210 and 600 nm were recorded for the principal peaks in each chromatogram. Two peaks, at about 13.6 and 23.5 min, were common to the aqueous and 80% ethanolic extracts. In the 80% ethanolic extract they showed UV maxima at 325 nm, with a shoulder near 300 nm, typical of a caffeoyl ester, and at 256 and 353 nm, typical of a flavonol 3-O-glycoside (Figure 3e). These two peaks correspond to preparative fractions 5 and 6 (Section 3.7).
Comparison with the mixture of 17 reference standards did not give a clear match between the major peaks of the extract and those of the standards at 350 nm (Figure S6). The compounds were therefore characterized from the UV and MS data of the preparative fractions (Section 3.8).
Because the 80% ethanolic extract gave the clearest chromatographic profile and the highest TFC, it was selected for preparative fractionation and subsequent LC-MS/MS characterization.
3.7. Preparative HPLC-PDA Fractionation
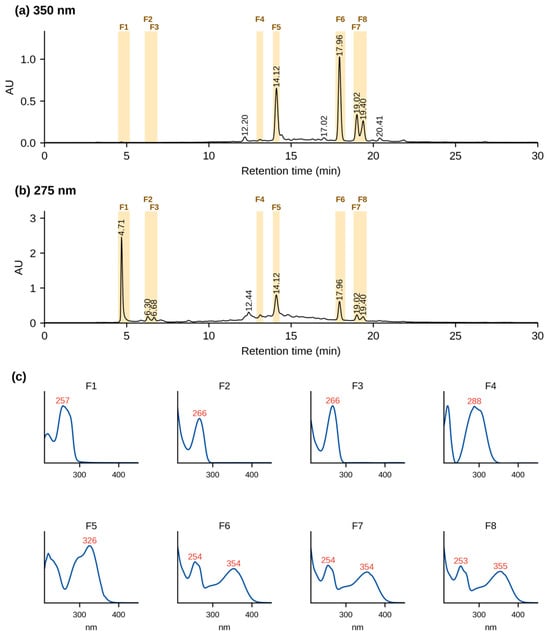
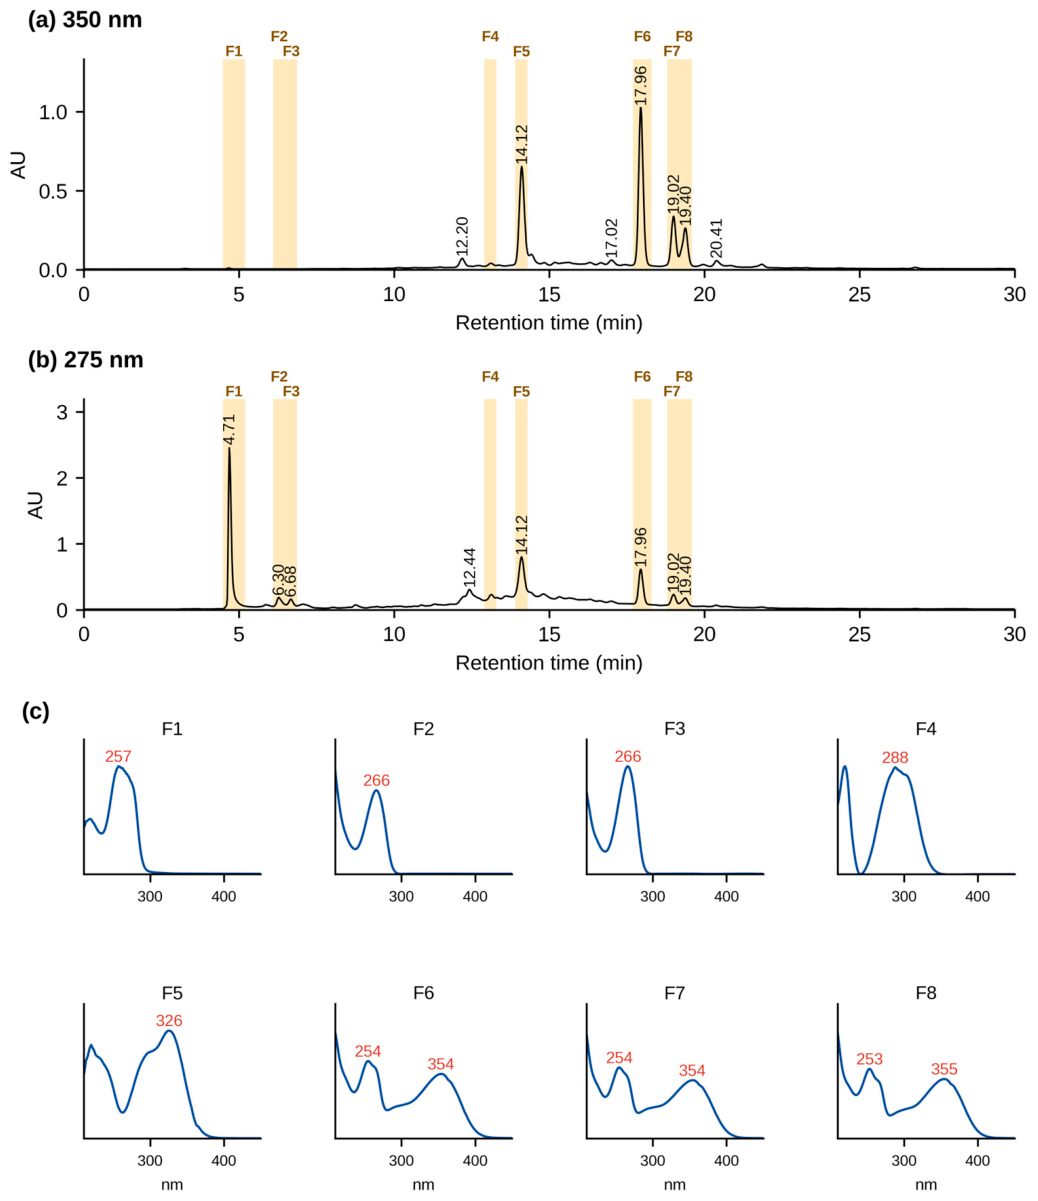
Preparative HPLC-PDA fractionation of the 80% ethanolic extract, monitored at 350 nm, produced eight UV-active fractions (Figure 4a), whose collection windows (F1–F8) are shaded in Figure 4a,b. These fractions were collected directly from the column effluent for subsequent mass-spectrometric analysis. The same separation monitored at 275 nm is shown in Figure 4b; fractions 1–3 are seen mainly at this wavelength. The UV–Vis spectrum of each fraction is shown in Figure 4c.
Figure 4.
Preparative HPLC-PDA fractionation of the 80% ethanolic crude extract of S. aspera fruit (100 mg/mL; 1 mL injected) monitored at (a) 350 nm and (b) 275 nm (0–30 min shown; no peaks eluted after 25 min). The shaded bands mark the collection windows of fractions F1–F8. (c) UV–Vis spectra of fractions F1–F8 (normalized) with their absorption maxima (nm).
The analytical and preparative chromatograms showed broadly similar peak patterns, although retention times differed slightly because of the different column dimensions and operating conditions. For example, two prominent analytical peaks eluting at 13.6 and 23.5 min appeared at 14.1 and 17.9 min, respectively, under the preparative conditions; their UV-Vis spectra were closely similar.
The isolated fractions showed UV absorption maxima between approximately 256.9 and 354.8 nm (Table 4). Fractions 2 and 3 had λmax values of 266.4 nm, whereas fractions 6, 7, and 8 showed λmax values of 353.6, 354.8, and 354.8 nm, respectively. The spectra of fractions 6–8, with band II at about 255 nm and band I at 353–355 nm, are typical of flavonol 3-O-glycosides, and that of fraction 5 (326 nm with a shoulder near 300 nm) is typical of a caffeic acid ester. Fractions 1–3 showed no band I absorption between 300 and 380 nm. UV data alone, however, was not sufficient for identification.
Table 4.
Preparative HPLC-PDA collection times, UV absorption maxima, and proposed identity of the eight fractions isolated from S. aspera fruit extract by preparative HPLC-PDA.
The collection windows and UV–Vis spectra of the eight fractions (Figure 4) were used to assess the chromatographic and spectral homogeneity of the fractions before LC-ESI-MS/MS analysis.
Figure 4 shows only the first 30 min of the run, because no UV-active constituents eluted after 25 min; the later part of the 60 min program served as a column wash (Section 2.10). The raised baseline between about 10 and 20 min, most visible at 275 nm, is attributed to a broad band of incompletely resolved polar constituents, possibly including polymeric polyphenols, that elutes from the heavily loaded preparative column (100 mg of extract per injection), together with the baseline drift of the gradient.
3.8. Characterization of the Preparative Fractions by ESI-MS and MS/MS
The eight preparative HPLC fractions were analyzed by direct-injection ESI-MS in both negative- and positive-ion modes, and the m/z 609 ion of fraction 6 was also examined by product-ion scanning. The retention windows, UV maxima, and diagnostic ions are summarized in Table 5.
Table 5.
Preparative collection windows, UV maxima, characteristic ESI-MS and MS/MS ions, and proposed identities of the main constituents of the eight preparative fractions from wild S. aspera fruit. n.d., not determined. Spectra were recorded at unit mass resolution; a product-ion spectrum was recorded for fraction 6 only.
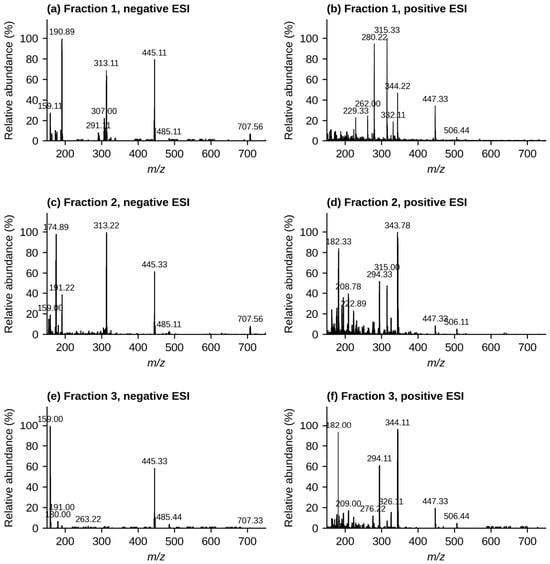
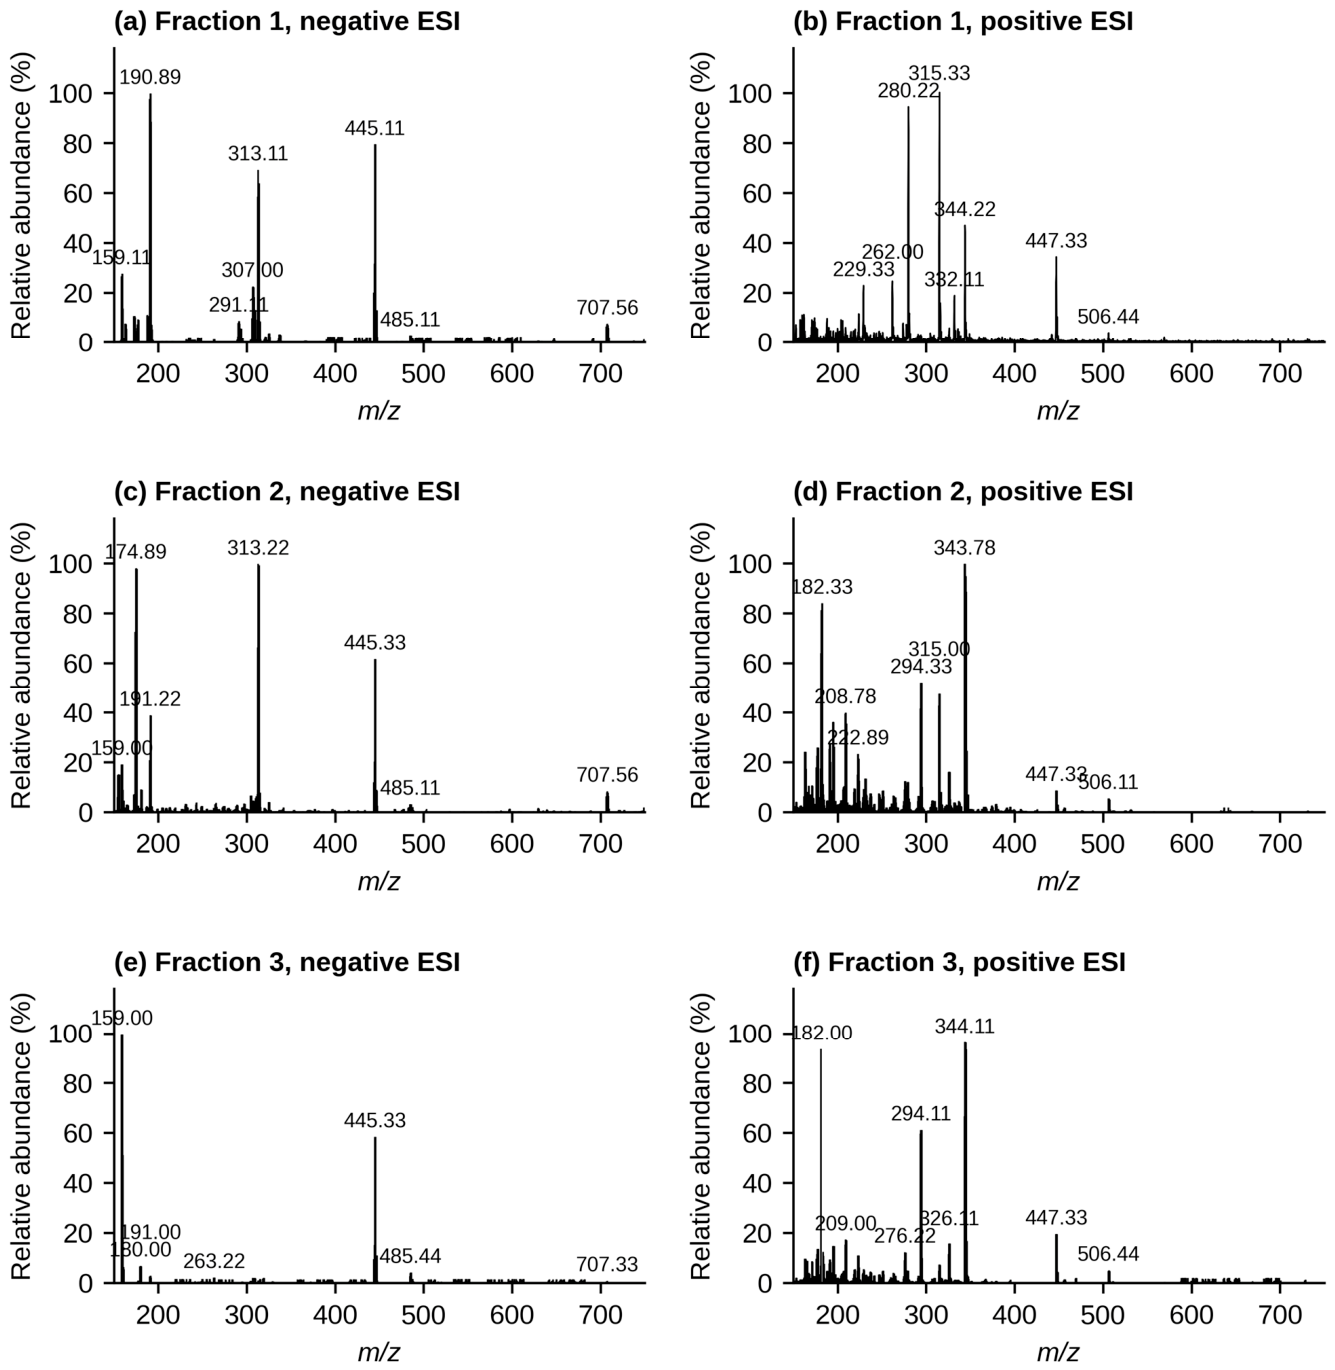
Fractions 1–3 eluted early in the preparative run (4.5–6.9 min), before the caffeoylquinic acid of fraction 5, and absorbed at 257 nm (fraction 1) and 266 nm (fractions 2 and 3), without the band I absorption (300–380 nm) of flavones and flavonols (Table 4). Their spectra contained an ion pair at m/z 445 ([M−H]−) and 447 ([M+H]+) (Figure 5), but this was not the base peak in any of them; the negative-ion spectra were dominated by m/z 191 (fraction 1), m/z 313 and 175 (fraction 2), and m/z 159 (fraction 3). A flavone glucuronide of the same mass, such as an apigenin glucuronide (C21H18O11), would be expected to elute after a caffeoylquinic acid on a reversed-phase column and to absorb near 335 nm, so this possibility is not supported by the data. The m/z 191 ion of fraction 1 is compatible with quinic or citric acid, which are common in fleshy fruits, but these acids do not explain the absorption at 257 nm. The m/z 445/447 pair, together with the m/z 313/315 pair formed from it by the loss of 132 Da (a pentose) in both ionization modes, points to a minor component with M = 446 that is shared by the three fractions. As no MS/MS data were recorded for these fractions, neither this minor component nor their main UV-absorbing constituents could be identified.
Figure 5.
ESI-MS spectra of preparative fractions 1–3 in negative (a,c,e) and positive (b,d,f) ionization mode: (a,b) fraction 1; (c,d) fraction 2; (e,f) fraction 3.
Compound 4 produced a precursor ion at m/z 567 Da ([M−H]−), with a base peak at m/z 355 Da. The available data was not sufficient to identify this compound.
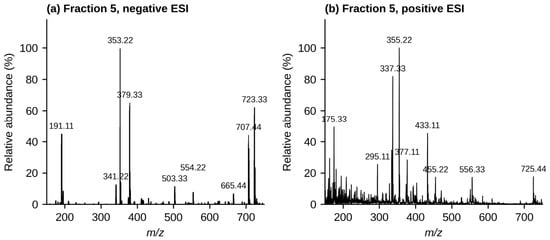
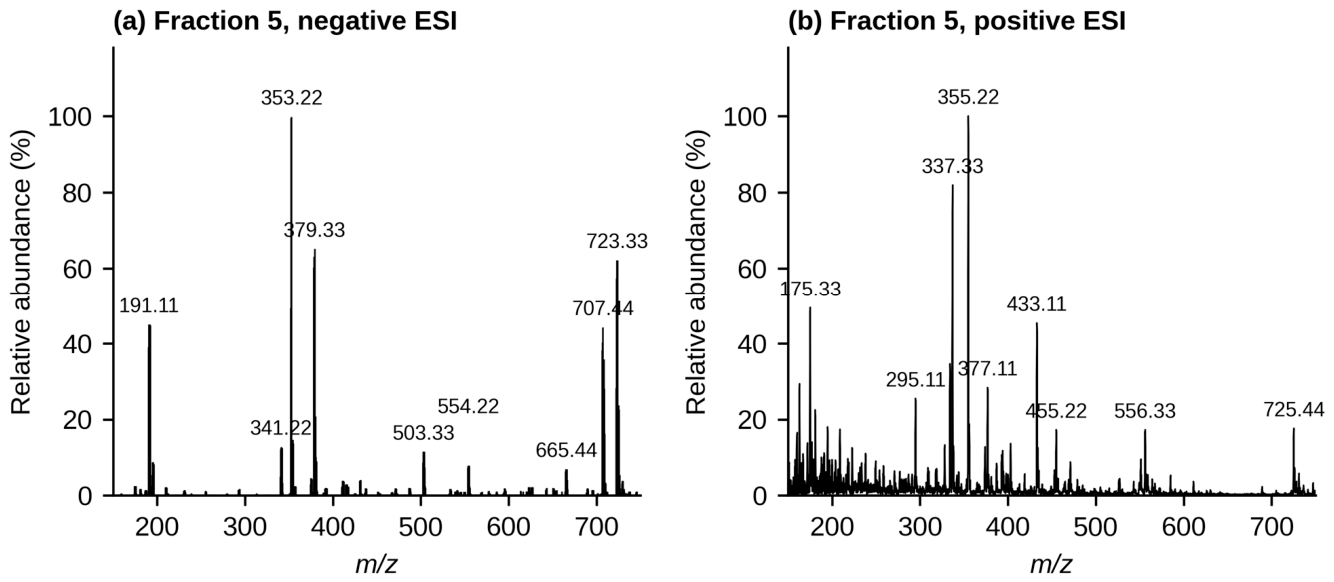
The spectra of fraction 5 (Figure 6) were dominated by m/z 353 ([M−H]−) and m/z 355 ([M+H]+), accompanied by m/z 191 ([quinic acid−H]−), m/z 707 ([2M−H]−), m/z 377 ([M+Na]+), and m/z 337 ([M+H−H2O]+). Together with the UV spectrum (λmax 326 nm with a shoulder near 300 nm), which is typical of caffeic acid esters, these ions identify the main constituent as a caffeoylquinic acid (C16H18O9, M = 354.31 g/mol) [39]. The same m/z 353/355 ions were also detected in the LC-MS screening of the crude extract. The prominent m/z 191 ion is characteristic of 3-O- and 5-O-caffeoylquinic acids, whereas 4-O-caffeoylquinic acid gives a base peak at m/z 173 [39]. Compound 5 is therefore most probably chlorogenic acid (5-O-caffeoylquinic acid) or its 3-O-isomer.
Figure 6.
ESI-MS spectra of fraction 5 in (a) negative and (b) positive ionization mode, showing the caffeoylquinic acid ions at m/z 353 ([M−H]−), 191, and 707 ([2M−H]−) and at m/z 355 ([M+H]+), 337, and 377 ([M+Na]+), and the minor m/z 723/725 pair.
A weaker ion pair at m/z 723 ([M−H]−) and 725 ([M+H]+) points to a minor co-eluting compound with M = 724. Its mass is consistent with a 3-hydroxy-3-methylglutaroyl (HMG) derivative of a pentosyl-hexosyl-luteolin (C32H36O19), similar to the HMG-flavonoid glycosides described in Cytisus multiflorus [40] and bergamot [41], but, as neither an MS/MS spectrum nor a reference standard was available, this compound was not identified.
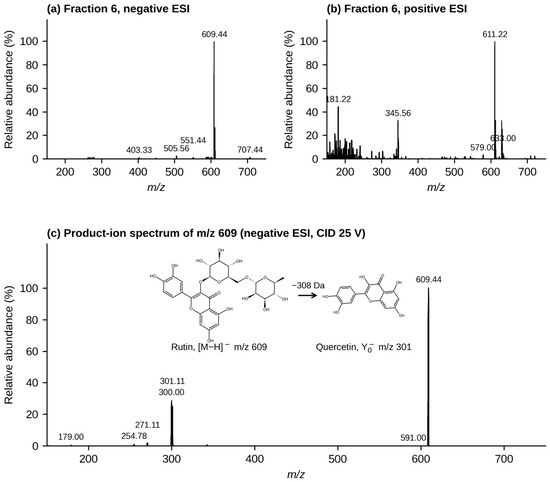
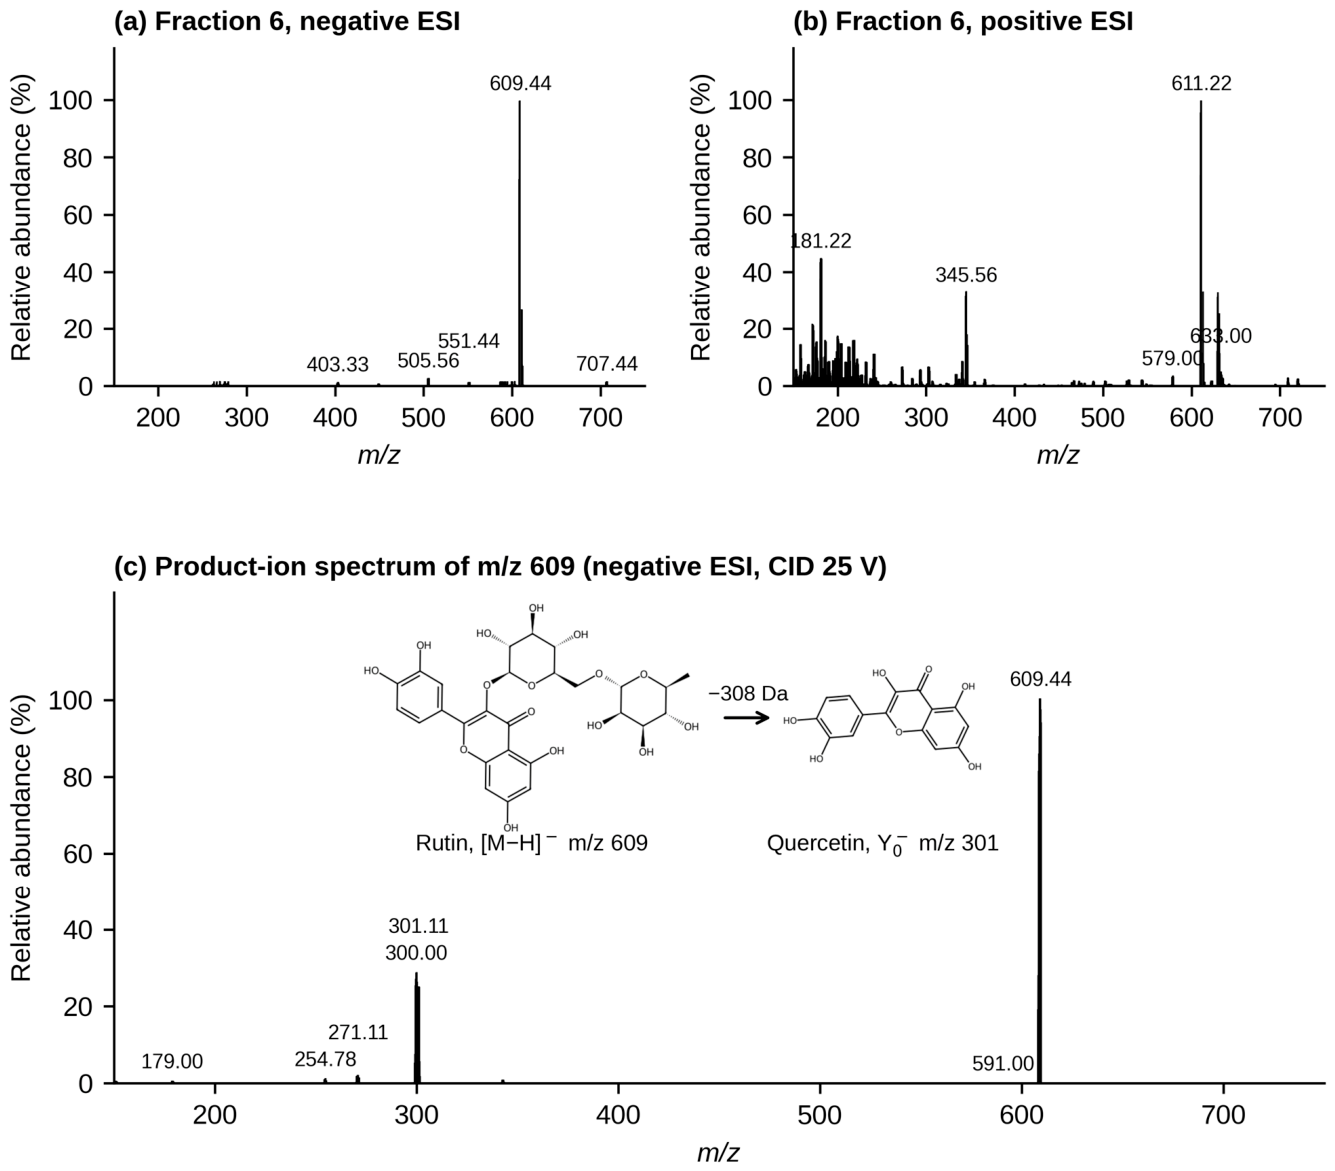
Fraction 6 gave [M−H]− at m/z 609 and [M+H]+ at m/z 611 (Figure 7a,b), corresponding to M = 610 (C27H30O16). The product-ion spectrum of m/z 609 at 25 V (Figure 7c) showed abundant ions at m/z 301 (Y0−) and m/z 300 ([Y0−H]•−), formed by the loss of 308 Da (rhamnose + glucose), together with m/z 271, 255, and 179, which are typical fragments of the quercetin aglycone. This pattern, in which the whole disaccharide is lost and both the Y0− and the radical [Y0−H]•− ions are formed, is characteristic of flavonol 3-O-glycosides. Flavone di-C-glycosides of the same mass, such as lucenin-2, behave differently: their sugars undergo cross-ring cleavage (losses of 90 and 120 Da, e.g., m/z 519, 489, 399, and 369), and their aglycone, luteolin, gives m/z 285 rather than 301 [42]. Together with the UV maxima at 256 and 353 nm, these data identify compound 6 as quercetin-3-O-rutinoside (rutin; M = 610.5 g/mol). The isomeric quercetin-3-O-neohesperidoside cannot be excluded by MS alone, but rutin is by far the more common quercetin rhamnosyl-glucoside in plants and has already been reported from the aerial parts of S. aspera [24].
Figure 7.
ESI-MS and MS/MS spectra of compound 6 (rutin): (a) negative-ion and (b) positive-ion spectra, and (c) negative-ion product-ion spectrum of m/z 609 (collision energy 25 V).
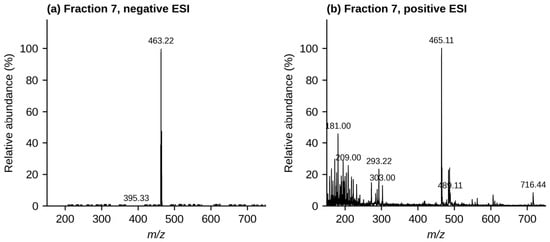
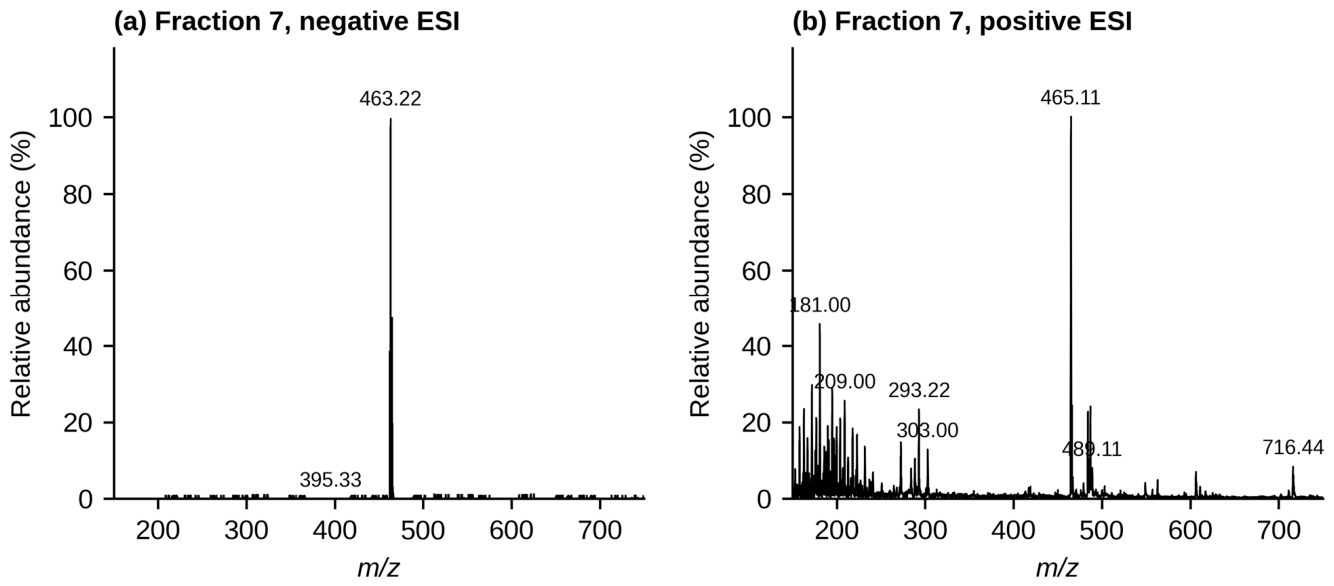
Compound 7 produced a deprotonated ion at m/z 463 Da and a protonated ion at m/z 465 Da (Figure 8a,b). These ions, the UV maximum at 355 nm, and the elution just after rutin are consistent with a quercetin-O-hexoside (C21H20O12, M = 464.38 g/mol) [43]. Isoquercitrin (quercetin-3-O-glucoside) and hyperoside (quercetin-3-O-galactoside) cannot be distinguished from these full-scan data, so compound 7 is reported as a quercetin-O-hexoside, most probably isoquercitrin.
Figure 8.
ESI-MS spectra of fraction 7 (quercetin-O-hexoside) in (a) negative and (b) positive ionization mode.
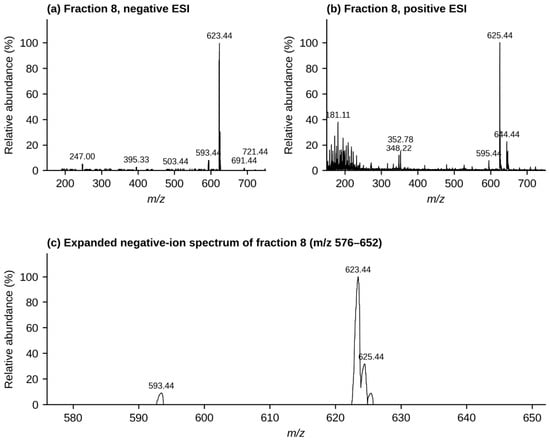
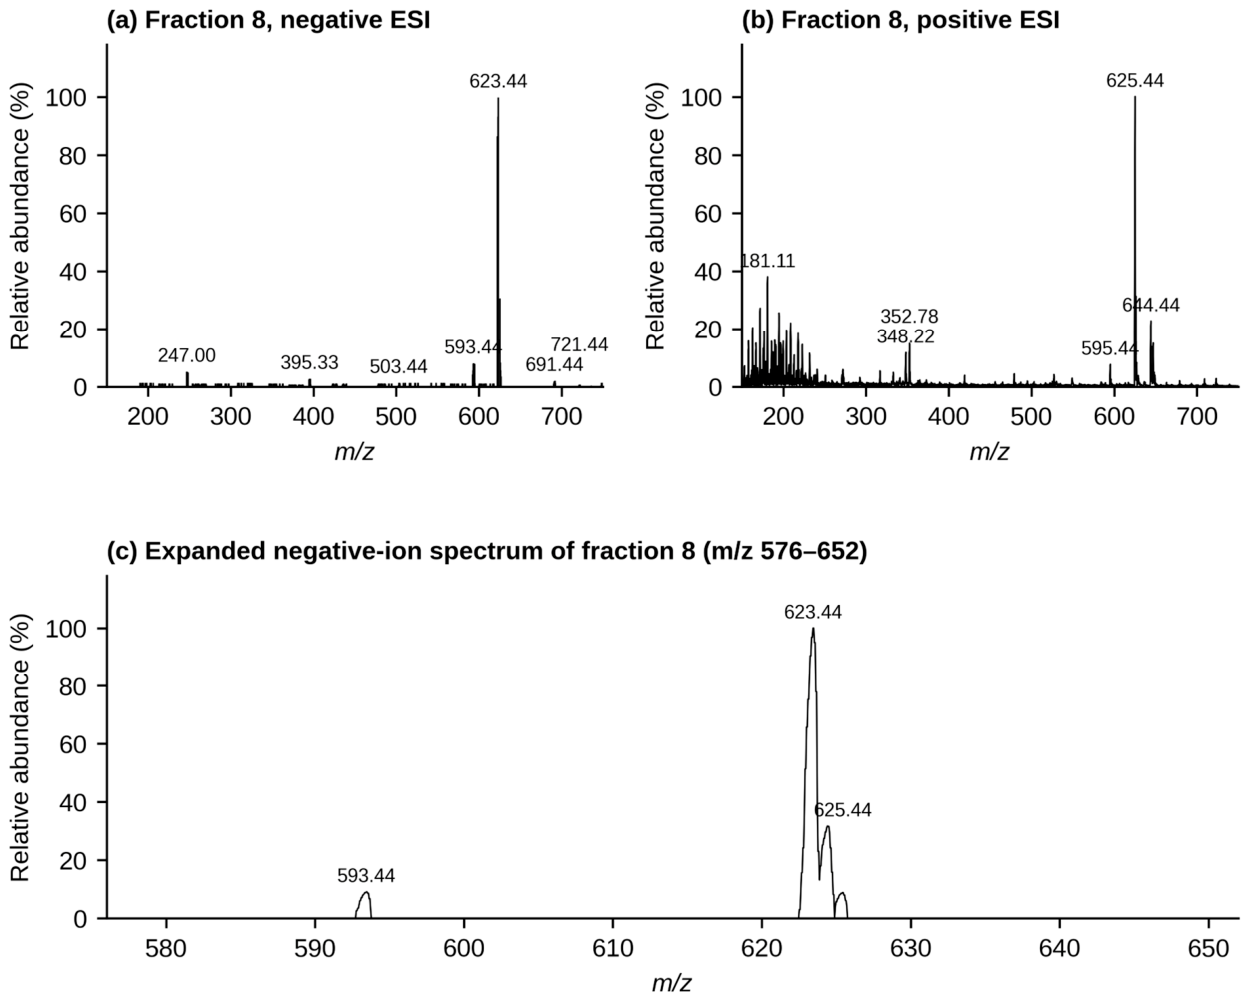
Compound 8 produced a deprotonated ion at m/z 623 Da and a protonated ion at m/z 625 Da (Figure 9a,b), consistent with an isorhamnetin-O-deoxyhexosyl-hexoside (C28H32O16, M = 624.55 g/mol), tentatively isorhamnetin-3-O-rutinoside (narcissin) [43]; this assignment is based on the molecular mass and the UV spectrum only. The preparative HPLC profile showed that this fraction was not completely resolved, with a partially separated doublet rather than a single symmetrical peak.
Figure 9.
ESI-MS spectra of fraction 8 in (a) negative and (b) positive ionization mode, and (c) expanded negative-ion spectrum (m/z 576–652) showing the isorhamnetin-O-deoxyhexosyl-hexoside ion cluster (m/z 623–625) and the smaller kaempferol-O-deoxyhexosyl-hexoside ion at m/z 593, which is 30 Da lighter and corresponds to the partly resolved doublet seen in the preparative HPLC-PDA profile.
The negative-ion spectrum also contained a lower-intensity ion cluster around m/z 593/594, approximately 30 Da lower than the dominant m/z 623 cluster. This difference is consistent with replacement of a methoxy group by hydrogen and therefore supports the possible presence of a co-eluting kaempferol-O-deoxyhexosyl-hexoside (tentatively kaempferol-3-O-rutinoside, nicotiflorin). Because this component was associated with a partially resolved chromatographic peak, it is more appropriately regarded as a minor co-eluting constituent rather than as a separately isolated compound.
Overall, the major constituents detected in the S. aspera fruit fractions were flavonol glycosides (rutin, a quercetin-O-hexoside, and an isorhamnetin-O-deoxyhexosyl-hexoside with a minor kaempferol analogue) and a caffeoylquinic acid. The retention windows, UV maxima, and characteristic ESI-MS and MS/MS ions are summarized in Table 5, and the structures are shown in Figure S7 of the Supplementary Materials. These assignments provide a useful first compound-level picture of the fruit, although structures proposed from unit-resolution MS data remain tentative until they are confirmed with authentic standards, high-resolution MS, or NMR.
4. Discussion
The chemical and biological results obtained from S. aspera fruit differed between the three extraction solvents. Water produced the highest TPC, whereas 80% ethanol gave the highest TFC and 99% ethanol produced the strongest DPPH radical-scavenging activity. Because only one extract per solvent was analyzed, in technical duplicate, these differences are indicative rather than statistically established; nevertheless, they suggest that the antioxidant behavior of the fruit cannot be described adequately by measuring total phenolics or total flavonoids alone.
The difference between TPC/TFC and antioxidant activity is not unexpected. Different phenolic compounds can vary considerably in their ability to donate hydrogen atoms or electrons, and their contribution to an assay depends not only on their concentration but also on their chemical structure. Anthocyanins, flavonoids, and stilbenoids, for example, can make different contributions to radical-scavenging and reducing activity [44,45]. The red color of the S. aspera fruit has previously been associated with anthocyanins [8], while the present MS results show flavonol glycosides and a caffeoylquinic acid. Rutin and the quercetin 3-O-glycosides keep the B-ring catechol and the 2,3-double bond conjugated with the 4-oxo group, which are the main structural features behind radical scavenging by flavonols, although glycosylation at C-3 lowers their activity compared with the aglycone. O-Methylation of the catechol, as in isorhamnetin glycosides, reduces the activity further, whereas caffeoylquinic acids are efficient scavengers because of their catechol group [39,46,47]. These compounds may therefore contribute differently to the two antioxidant assays.
The contrasting DPPH and FRAP results are also worth noting. The 99% ethanolic extract had the strongest DPPH activity despite having the lowest TPC and TFC, whereas the FRAP responses of all three extracts were below the LOQ and could not be used to rank the extracts. DPPH and FRAP do not measure exactly the same chemical property, so differences between the two assays can arise from the types of compounds extracted and from their different reaction mechanisms. DPPH is a mixed hydrogen-atom/electron-transfer assay run in an ethanolic medium, and its kinetics depend strongly on the solvent and the reaction time, whereas FRAP is a single-electron-transfer assay run in aqueous acetate buffer at pH 3.6 [46,48]. Since each extract was tested in its own extraction solvent, part of the difference in DPPH values may also reflect solvent effects on the reaction rate. The present results therefore suggest that the antioxidant activity of S. aspera fruit depends on the composition of the extract rather than simply on the total amount of phenolic or flavonoid material.
The antimicrobial activity depended on the organism tested. Both ethanolic extracts inhibited S. aureus, while all three extracts inhibited C. albicans. None of the extracts inhibited E. coli under the conditions used. Antimicrobial activity has also been reported in previous work on S. aspera, although against different organisms: hydromethanolic extracts of leaves and fruits showed activity against several Gram-negative plant pathogens [26], while phenolic extracts from the roots showed moderate activity against S. aureus and other bacteria but stronger activity against C. albicans [27]. The results obtained here are therefore broadly consistent with the antimicrobial potential previously reported for the species. Rutin, quercetin glycosides, and chlorogenic acid, all detected in the fruit, have been reported to have antibacterial activity, mainly against Gram-positive bacteria and usually at fairly high concentrations [39,47]. Because the fractions were not tested individually, however, their contribution to the activity of the crude extracts remains to be shown.
The absence of activity against E. coli should not, however, be interpreted as evidence that the fruit contains no compounds active against Gram-negative bacteria. Agar well-diffusion results are affected by several factors, including compound solubility, diffusion through the agar, and the concentration of the active constituents. Consequently, inhibition-zone diameter provides a useful screening measure but does not directly represent antimicrobial potency [49,50]. Determination of minimum inhibitory and bactericidal/fungicidal concentrations (MIC, MBC, and MFC) values would provide a more quantitative assessment of the activity. Such testing could also be applied to the purified compounds to determine whether the activity of the crude extracts can be linked to individual constituents. A reference antifungal agent should also be included in such tests, as the present screening had no positive control for C. albicans.
The absence of visible morphological changes in HT-29 cells treated with the 80% ethanolic fruit extract also provides an interesting contrast with previous studies of other S. aspera organs. A 70% methanolic extract of leaves and stems was reported to be cytotoxic toward glioblastoma and rhabdomyosarcoma cell lines [24], while root extracts showed cytotoxic and apoptosis-related effects against breast, lung, and ovarian cancer cell lines [25]. These differences may reflect several factors, including plant organ, extraction solvent, chemical composition, and the sensitivity of the target cell line.
The fruit extract examined here contained mainly flavonol glycosides (rutin, a quercetin-O-hexoside, and an isorhamnetin-O-deoxyhexosyl-hexoside with a minor kaempferol analogue) and a caffeoylquinic acid. Glycosylation can alter the polarity, membrane permeability, and cellular uptake of flavonoids compared with their corresponding aglycones. It is therefore possible that differences in chemical composition contribute to the different responses observed between fruit, aerial-part, and root extracts. Cell-line differences may also be important, since HT-29 cells cannot necessarily be expected to respond in the same way as glioblastoma, rhabdomyosarcoma, breast, lung, or ovarian cancer cells.
At the same time, the HT-29 result should be interpreted cautiously. The present experiment relied on morphological observations rather than a quantitative cell-viability assay, and the highest amount tested was 100 µg of extract per well. The result therefore shows only that no obvious morphological changes occurred under the conditions tested; it does not prove that the extract has no cytotoxic potential. A quantitative viability assay (for example MTT, SRB, or resazurin) with cell counting over a wider concentration range would be needed for that.
The HPLC-PDA and LC-MS/MS results provide further insight into the chemical composition of the fruit. The identified compounds belong to the flavonol glycoside and caffeoylquinic acid classes already reported within the genus Smilax [12], and rutin has been reported from S. aspera leaves and stems [24]. Rutin and lucenin-2 share the same precursor ion (m/z 609) and could only be told apart by their fragmentation, which shows how important MS/MS data are when flavonoid glycosides are analyzed at unit mass resolution. For fractions 1–3 and 5, the base peak, the elution order, and the UV spectrum were also more informative than the highest-mass ion.
The other assignments are supported to different degrees. The m/z 609 → 301/300 transition and the UV spectrum give good evidence for rutin (compound 6), whereas compounds 7 and 8 rest on the molecular mass and the UV spectrum only and are therefore described at the level of the compound class. The partly resolved peak of fraction 8 explains the minor m/z 593 ion attributed to a co-eluting kaempferol-O-deoxyhexosyl-hexoside.
Fraction 5 is dominated by a caffeoylquinic acid, while its minor m/z 723/725 component remains unidentified. Caffeoylquinic acids are among the most widespread phenolic esters in edible fruits and are efficient radical scavengers [39], so their presence agrees with the antioxidant activity of the ethanolic extracts.
These results illustrate the usefulness of combining preparative HPLC with PDA detection and LC-MS/MS. HPLC provided chromatographic separation of closely related compounds, while PDA supplied complementary UV information and mass spectrometry provided molecular-mass and fragmentation data. The combination was particularly useful for distinguishing compounds that would otherwise appear similar on the basis of molecular mass alone.
From a nutritional and nutraceutical perspective, S. aspera fruit is also of interest because it is an edible wild fruit with a history of traditional Mediterranean and Palestinian use. The combination of measurable antioxidant activity and selective antimicrobial activity, together with the presence of rutin, other flavonol glycosides, and a caffeoylquinic acid, which are common constituents of the human diet [39,47], suggests that the fruit deserves further investigation as a potential source of phytochemicals. This fits the wider interest in under-utilized wild edible plants as possible sources of nutritional and functional-food ingredients, as illustrated by recent nutritional surveys of traditionally consumed seeds in Morocco [51].
The present study nevertheless has several limitations. The fruit was collected from a single geographical location and during one season, so variation between populations, years, and stages of fruit maturity was not assessed. In addition, although the preparative fractions were chromatographically and spectrally characterized, several structural assignments were based primarily on mass spectrometric evidence. NMR spectroscopy and comparison with authentic standards would therefore strengthen the structural conclusions, particularly for the quercetin-O-hexoside, the isorhamnetin/kaempferol glycoside mixture of fraction 8, the unidentified constituents of fractions 1–4, and the minor m/z 723/725 compound. The mass spectra were recorded at unit mass resolution, and accurate-mass data would allow the elemental compositions to be confirmed. In addition, each assay was performed in duplicate on a single extract per solvent, so the variability due to sampling and extraction could not be assessed, and the individual fractions were not tested for antioxidant or antimicrobial activity.
The antimicrobial experiments were also intended as an initial screening rather than a complete pharmacological evaluation. MIC/MBC/MFC measurements would provide more meaningful quantitative information about antimicrobial potency. Similarly, the HT-29 experiment should be regarded as preliminary because it involved one cell line and a qualitative morphological assessment rather than a quantitative viability assay, and the antifungal screening had no positive control. Future studies could address these limitations while also examining additional extraction solvents and a wider range of biological assays.
5. Conclusions
This study provides a first compound-level characterization of wild Palestinian S. aspera fruit using a combination of phenolic and flavonoid measurements, antioxidant assays, antimicrobial screening, a morphological assessment on HT-29 cells, preparative HPLC-PDA, and ESI-MS/MS.
The measured properties of the fruit differed with the extraction solvent; although, with one extract per solvent, these differences are indicative only. Water gave the highest TPC, 80% ethanol gave the highest TFC, and 99% ethanol produced the strongest DPPH radical-scavenging activity, whereas the FRAP values of all three extracts were below the LOQ. The ethanolic extracts inhibited S. aureus and C. albicans, the aqueous extract inhibited only C. albicans, whereas none of the extracts inhibited E. coli under the conditions tested. The 80% ethanolic extract caused no visible morphological changes in HT-29 cells at the amounts and times examined.
Preparative HPLC-PDA followed by ESI-MS and MS/MS identified rutin (quercetin-3-O-rutinoside) and a caffeoylquinic acid of the chlorogenic acid type as major constituents, together with a quercetin-O-hexoside and an isorhamnetin-O-deoxyhexosyl-hexoside accompanied by a minor kaempferol-O-deoxyhexosyl-hexoside. The main constituents of fractions 1–4 and a minor compound in fraction 5 (M = 724) could not be identified. Confirmation with authentic standards, high-resolution MS, and NMR would strengthen the structures proposed from unit-resolution MS data.
Overall, the findings show that wild Palestinian S. aspera fruit contains flavonol glycosides and a caffeoylquinic acid, and that its crude extracts have measurable antioxidant and selective antimicrobial activities. Because the fractions were not tested individually, these activities belong to the crude extracts and cannot yet be attributed to particular compounds. The results provide a useful chemical and biological basis for further investigation of this traditionally used edible plant. However, additional work is needed before specific compounds can be linked directly to particular biological effects.
Future studies should focus on confirming the proposed structures by NMR spectroscopy and authentic standards, testing the isolated fractions individually, determining MIC/MBC/MFC values for the active extracts and isolated compounds with suitable positive controls, applying quantitative cytotoxicity assays across a wider concentration range and additional cell lines, using independent extractions, and examining fruits collected from different locations, seasons, and stages of maturity. Such work would help determine the reproducibility of the phytochemical profile and clarify the biological significance of the individual constituents.
Supplementary Materials
The following supporting information can be downloaded at https://www.mdpi.com/article/10.3390/nutraceuticals6040071/s1, Figure S1: Calibration curves for TPC (gallic acid), FRAP (Fe2+), and DPPH (Trolox); Figure S2: Representative agar well-diffusion plates showing the antibacterial activity of S. aspera fruit extracts against Escherichia coli; Figure S3: Phase-contrast micrographs of HT-29 cells treated with the 80% ethanolic S. aspera fruit extract; Figure S4: HPLC-PDA chromatogram (350 nm) of the aqueous crude extract of S. aspera fruit; Figure S5: HPLC-PDA chromatogram (350 nm) of the 99% ethanolic crude extract of S. aspera fruit; Figure S6: Overlaid HPLC-PDA chromatograms (350 nm) of the 80% ethanolic crude extract of S. aspera fruit and 17 reference phenolic compounds; Figure S7: Compounds identified in the preparative fractions of S. aspera fruit, with molecular formulae, molecular weights, characteristic ESI-MS ions, and structures; Table S1: Regression statistics of the calibration curves.
Author Contributions
Conceptualization, S.A.-L., F.A.-R. and K.S.; methodology, S.A.-L., F.A.-R., K.S. and M.S.; investigation, S.A.-L., F.A.-R. and M.S.; formal analysis, S.A.-L. and M.S.; writing—original draft preparation, M.S.; writing—review and editing, S.A.-L.; supervision, S.A.-L. and F.A.-R.; project administration, S.A.-L. All authors have read and agreed to the published version of the manuscript.
Funding
This research received no external funding.
Institutional Review Board Statement
Not applicable. This study did not involve human participants or vertebrate animals; only a wild-collected plant fruit, standard bacterial/fungal reference strains, and an established colon-cancer cell line (HT-29) were used.
Informed Consent Statement
Not applicable.
Data Availability Statement
The data supporting the findings of this study are available from the corresponding author upon reasonable request.
Acknowledgments
The authors thank Saad Lahham (Division of Anatomy, Molecular Biochemistry and Genetics, Department of Biomedical Sciences, Faculty of Medicine and Health Sciences, An-Najah National University, Nablus, Palestine) for kindly providing the HT-29 cell line used in this study.
Conflicts of Interest
The authors declare no conflicts of interest.
Abbreviations
The following abbreviations are used in this manuscript:
| Arb | Arbitrary units |
| CE | Catechin equivalents |
| CID | Collision-induced dissociation |
| DMEM | Dulbecco’s modified Eagle’s medium |
| DPPH | 2,2-diphenyl-1-picrylhydrazyl |
| ESI | Electrospray ionization |
| FRAP | Ferric-reducing antioxidant power |
| GAE | Gallic acid equivalents |
| HPLC | High-performance liquid chromatography |
| HPLC-PDA | High-performance liquid chromatography with photodiode-array detection |
| HMG | 3-hydroxy-3-methylglutaroyl |
| HT-29 | Human colorectal adenocarcinoma cell line |
| LC-ESI-MS/MS | Liquid chromatography–electrospray ionization-tandem mass spectrometry |
| LC-MS | Liquid chromatography–mass spectrometry |
| LC-MS/MS | Liquid chromatography–tandem mass spectrometry |
| MBC | Minimum bactericidal concentration |
| MFC | Minimum fungicidal concentration |
| MIC | Minimum inhibitory concentration |
| MS | Mass spectrometry |
| PDA | Photodiode array |
| PIS | Product-ion scanning |
| PTFE | Polytetrafluoroethylene |
| TE | Trolox equivalents |
| TFC | Total flavonoid content |
| TPC | Total phenolic content |
| TPTZ | 2,4,6-Tris(2-pyridyl)-s-triazine |
| UHPLC-MS | Ultra-high-performance liquid chromatography–mass spectrometry |
| UV-Vis | Ultraviolet–visible |
References
- EQA (Environmental Quality Authority–Palestine). Fifth National Report on Biodiversity Conservation; EQA: Ramallah, Palestine, 2015. [Google Scholar]
- Ali-Shtayeh, M.; Jamous, R.M. Ethnobotany of Palestinian herbal medicine in the northern West Bank and Gaza Strip: Review and comprehensive field study. Biodivers. Environ. Sci. Stud. Ser. 2006, 4, 1–122. [Google Scholar]
- Ali-Shtayeh, M.S.; Yaniv, Z.; Mahajna, J. Ethnobotanical survey in the Palestinian area: A classification of the healing potential of medicinal plants. J. Ethnopharmacol. 2000, 73, 221–232. [Google Scholar] [CrossRef] [Scilit]
- Azaizeh, H.; Fulder, S.; Khalil, K.; Said, O. Ethnobotanical survey of local practitioners of the Middle Eastern region: The status of traditional Arabic medicine. Fitoterapia 2003, 74, 98–108. [Google Scholar]
- Said, O.; Khalil, K.; Fulder, S.; Azaizeh, H. Ethnopharmacological survey of medicinal herbs in Israel, the Golan Heights and the West Bank region. J. Ethnopharmacol. 2002, 83, 251–265. [Google Scholar] [CrossRef] [Scilit]
- Kabera, J.N.; Semana, E.; Mussa, A.R.; He, X. Plant secondary metabolites: Biosynthesis, classification, function and pharmacological properties. J. Pharm. Pharmacol. 2014, 2, 377–392. [Google Scholar]
- Sawalha, K.; Jarrar, S.; Alkowni, R.; Alomari, A. Flora Palestina, 1st ed.; Palestine Academy: Ramallah, Palestine, 2020. (In Arabic) [Google Scholar]
- Longo, L.; Vasapollo, G. Extraction and identification of anthocyanins from Smilax aspera L. berries. Food Chem. 2006, 94, 226–231. [Google Scholar] [CrossRef] [Scilit]
- Busia, K. Fundamentals of Herbal Medicine: Major Plant Families, Analytical Methods, Materia Medica; Xlibris: Bloomington, IN, USA, 2016; Volume 2. [Google Scholar]
- Amira, S.; Dade, M.; Schinella, G.; Ríos, J.-L. Anti-inflammatory, antioxidant, and apoptotic activities of four plant species used in folk medicine in the Mediterranean basin. Pak. J. Pharm. Sci. 2012, 25, 65–72. [Google Scholar]
- Belhouchet, Z.; Sautour, M.; Miyamoto, T.; Lacaille-Dubois, M.-A. Steroidal saponins from the roots of Smilax aspera subsp. mauritanica. Chem. Pharm. Bull. 2008, 56, 1324–1327. [Google Scholar] [CrossRef] [Scilit]
- Sukhramani, G.; Choudhary, R.K. The genus Smilax L.: A comprehensive review of traditional uses, phytochemistry, pharmacological activities, and toxicity. S. Afr. J. Bot. 2026, 190, 77–110. [Google Scholar] [CrossRef] [Scilit]
- Gao, Y.; Su, Y.; Qu, L.; Xu, S.; Meng, L.; Cai, S.-Q.; Shou, C. Mitochondrial apoptosis contributes to the anti-cancer effect of Smilax glabra Roxb. Toxicol. Lett. 2011, 207, 112–120. [Google Scholar] [CrossRef] [Scilit]
- Xu, J.; Li, X.; Zhang, P.; Li, Z.-L.; Wang, Y. Antiinflammatory constituents from the roots of Smilax bockii Warb. Arch. Pharm. Res. 2005, 28, 395–399. [Google Scholar] [CrossRef] [Scilit]
- Rugna, A.; Polo, J.; Evelson, P.; Gurni, A.; Llesuy, S.; Wagner, M. Antioxidant activity in rhizomes from Smilax campestris Griseb. Smilacaceae. Mol. Med. Chem. 2003, 1, 21–25. [Google Scholar]
- Chen, T.; Li, J.; Cao, J.; Xu, Q.; Komatsu, K.; Namba, T. A new flavanone isolated from rhizoma smilacis glabrae and the structural requirements of its derivatives for preventing immunological hepatocyte damage. Planta Med. 1999, 65, 56–59. [Google Scholar] [CrossRef] [Scilit]
- Laitonjam, W.S.; Kongbrailatpam, B.D. Studies on the chemical constituents and antioxidant activities of extracts from the roots of Smilax lanceaefolia Roxb. Nat. Prod. Res. 2010, 24, 1168–1176. [Google Scholar] [CrossRef] [Scilit]
- Cheng, Y.-B.; Zhang, D.-M.; Yu, S.-S. Chemical constituents of Smilax perfoliata. Acta Bot. Sin. 2004, 46, 618–620. [Google Scholar]
- Sun, T.-T.; Zhang, D.-W.; Han, Y.; Dong, F.-Y.; Wang, W. Smilasides M and N, two new phenylpropanoid glycosides from Smilax riparia. J. Asian Nat. Prod. Res. 2012, 14, 165–170. [Google Scholar] [CrossRef] [Scilit]
- Zhang, C.-L.; Feng, S.-X.; Wang, Q.; Wang, P.; Xu, J.; Chen, T. Flavonoids and phenolic compounds from Smilax scobinicaulis. Chem. Nat. Compd. 2014, 50, 254–257. [Google Scholar] [CrossRef] [Scilit]
- Ao, C.; Higa, T.; Khanh, T.D.; Upadhyay, A.; Tawata, S. Antioxidant phenolic compounds from Smilax sebeana Miq. LWT-Food Sci. Technol. 2011, 44, 1681–1686. [Google Scholar] [CrossRef] [Scilit]
- Wu, L.-S.; Wang, X.-J.; Wang, H.; Yang, H.-W.; Jia, A.-Q.; Ding, Q. Cytotoxic polyphenols against breast tumor cell in Smilax china L. J. Ethnopharmacol. 2010, 130, 460–464. [Google Scholar] [CrossRef] [Scilit]
- Yıldız, Ö.Ş.; Ayanoğlu, F.; Bahadırlı, N.P. Some morphological and chemical characteristics of Sarsaparilla (Smilax aspera L., Smilax excelsa L.). MKU Ziraat Fak. Derg. 2018, 23, 254–261. [Google Scholar]
- Kakouri, E.; Hatziagapiou, K.; Kanakis, C.; Nikola, O.; Lambrou, G.I.; Trigas, P.; Kanaka-Gantenbein, C.; Tarantilis, P.A. Cytotoxic and antioxidant activity of a chemically characterized extract of Smilax aspera leaves and stems. Appl. Sci. 2023, 13, 4784. [Google Scholar] [CrossRef] [Scilit]
- Dalkılıç, S.; Korkmaz, İ.; Kadıoğlu Dalkılıç, L.; Akay, G.; Fidan, S. In vitro cytotoxic effects of Smilax aspera L. roots on cancer cell lines. Food Biosci. 2022, 46, 101501. [Google Scholar] [CrossRef] [Scilit]
- Fontana, R.; Sánchez-Hernández, E.; Martín-Ramos, P.; Martín-Gil, J.; Marconi, P. Smilax aspera L. leaf and fruit extracts as antibacterial agents for crop protection. Agronomy 2024, 14, 383. [Google Scholar] [CrossRef] [Scilit]
- Zakhrouf, Z.; Harrat, M.; Elhouiti, F.; Válega, M.; Yousfi, M.; Boudjeniba, M. Phytochemical profiling, antioxidant and antibacterial activities of phenolic extracts from Smilax aspera and Atractylis humilis roots. Vegetos 2025. [Google Scholar] [CrossRef] [Scilit]
- Singleton, V.L.; Rossi, J.A. Colorimetry of total phenolics with phosphomolybdic-phosphotungstic acid reagents. Am. J. Enol. Vitic. 1965, 16, 144–158. [Google Scholar] [CrossRef] [Scilit]
- Shui, G.; Leong, L.P. Residue from star fruit as valuable source for functional food ingredients and antioxidant nutraceuticals. Food Chem. 2006, 97, 277–284. [Google Scholar] [CrossRef] [Scilit]
- Zhishen, J.; Mengcheng, T.; Jianming, W. The determination of flavonoid contents in mulberry and their scavenging effects on superoxide radicals. Food Chem. 1999, 64, 555–559. [Google Scholar] [CrossRef] [Scilit]
- Shraim, A.M.; Ahmed, T.A.; Rahman, M.M.; Hijji, Y.M. Determination of total flavonoid content by aluminum chloride assay: A critical evaluation. LWT 2021, 150, 111932. [Google Scholar] [CrossRef] [Scilit]
- Benzie, I.F.; Strain, J.J. The ferric reducing ability of plasma (FRAP) as a measure of “antioxidant power”: The FRAP assay. Anal. Biochem. 1996, 239, 70–76. [Google Scholar] [CrossRef] [Scilit]
- Pulido, R.; Bravo, L.; Saura-Calixto, F. Antioxidant activity of dietary polyphenols as determined by a modified ferric reducing/antioxidant power assay. J. Agric. Food Chem. 2000, 48, 3396–3402. [Google Scholar] [CrossRef] [Scilit]
- Brand-Williams, W.; Cuvelier, M.E.; Berset, C. Use of a free radical method to evaluate antioxidant activity. LWT-Food Sci. Technol. 1995, 28, 25–30. [Google Scholar] [CrossRef] [Scilit]
- Valgas, C.; Souza, S.M.d.; Smânia, E.F.; Smânia, A., Jr. Screening methods to determine antibacterial activity of natural products. Braz. J. Microbiol. 2007, 38, 369–380. [Google Scholar] [CrossRef] [Scilit]
- CLSI. Performance Standards for Antimicrobial Disk Susceptibility Tests, 13th ed.; CLSI Standard M02; Clinical and Laboratory Standards Institute: Wayne, PA, USA, 2018. [Google Scholar]
- Everette, J.D.; Bryant, Q.M.; Green, A.M.; Abbey, Y.A.; Wangila, G.W.; Walker, R.B. Thorough study of reactivity of various compound classes toward the Folin–Ciocalteu reagent. J. Agric. Food Chem. 2010, 58, 8139–8144. [Google Scholar] [CrossRef] [Scilit]
- Pérez, M.; Dominguez-López, I.; Lamuela-Raventós, R.M. The chemistry behind the Folin–Ciocalteu method for the estimation of (poly)phenol content in food: Total phenolic intake in a Mediterranean dietary pattern. J. Agric. Food Chem. 2023, 71, 17543–17553. [Google Scholar] [CrossRef] [Scilit]
- Clifford, M.N.; Jaganath, I.B.; Ludwig, I.A.; Crozier, A. Chlorogenic acids and the acyl-quinic acids: Discovery, biosynthesis, bioavailability and bioactivity. Nat. Prod. Rep. 2017, 34, 1391–1421. [Google Scholar] [CrossRef] [Scilit]
- Pereira, O.R.; Silva, A.M.; Domingues, M.R.; Cardoso, S.M. Identification of phenolic constituents of Cytisus multiflorus. Food Chem. 2012, 131, 652–659. [Google Scholar] [CrossRef] [Scilit]
- Di Donna, L.; De Luca, G.; Mazzotti, F.; Napoli, A.; Salerno, R.; Taverna, D.; Sindona, G. Statin-like principles of bergamot fruit (Citrus bergamia): Isolation of 3-hydroxymethylglutaryl flavonoid glycosides. J. Nat. Prod. 2009, 72, 1352–1354. [Google Scholar] [CrossRef] [Scilit]
- Kachlicki, P.; Piasecka, A.; Stobiecki, M.; Marczak, Ł. Structural characterization of flavonoid glycoconjugates and their derivatives with mass spectrometric techniques. Molecules 2016, 21, 1494. [Google Scholar] [CrossRef] [Scilit]
- Cubukcu, B.; Yazgan, A. Isolation of isorhamnetin-3-rutinoside (narcissin) and quercetin-3-glucoside from the leaves and stems of Leontice leontopetalum. Lloydia 1974, 37, 537–538. [Google Scholar]
- Montoro, P.; Tuberoso, C.I.; Piacente, S.; Perrone, A.; De Feo, V.; Cabras, P.; Pizza, C. Stability and antioxidant activity of polyphenols in extracts of Myrtus communis L. berries used for the preparation of myrtle liqueur. J. Pharm. Biomed. Anal. 2006, 41, 1614–1619. [Google Scholar] [CrossRef] [Scilit]
- Shahidi, F.; Naczk, M. Phenolics in Food and Nutraceuticals; CRC Press: Boca Raton, FL, USA, 2003. [Google Scholar]
- Munteanu, I.G.; Apetrei, C. Analytical methods used in determining antioxidant activity: A review. Int. J. Mol. Sci. 2021, 22, 3380. [Google Scholar] [CrossRef] [Scilit]
- Ganeshpurkar, A.; Saluja, A.K. The pharmacological potential of rutin. Saudi Pharm. J. 2017, 25, 149–164. [Google Scholar] [CrossRef] [Scilit]
- Xie, J.; Schaich, K.M. Re-evaluation of the 2,2-diphenyl-1-picrylhydrazyl free radical (DPPH) assay for antioxidant activity. J. Agric. Food Chem. 2014, 62, 4251–4260. [Google Scholar] [CrossRef] [Scilit]
- Balouiri, M.; Sadiki, M.; Ibnsouda, S.K. Methods for in vitro evaluating antimicrobial activity: A review. J. Pharm. Anal. 2016, 6, 71–79. [Google Scholar] [CrossRef] [Scilit]
- Vlietinck, A. Screening methods for antibacterial and antiviral agents from higher plants. In Methods in Plant Biochemistry; Hostettmann, K., Ed.; Academic Press: London, UK, 1991; Volume 6, pp. 47–69. [Google Scholar]
- Ait Naanaa, C.; Ainane, A.; Cherroud, S.; El Yaacoubi, A.; Ainane, T. Study on the prevalence of oilseed consumption in Morocco: Chemical characteristics, nutritional profile, and health benefits of the most consumed seeds. Nutraceuticals 2026, 6, 28. [Google Scholar] [CrossRef] [Scilit]

Disclaimer/Publisher’s Note: The statements, opinions and data contained in all publications are solely those of the individual author(s) and contributor(s) and not of MDPI and/or the editor(s). MDPI and/or the editor(s) disclaim responsibility for any injury to people or property resulting from any ideas, methods, instructions or products referred to in the content. |
© 2026 by the authors. Licensee MDPI, Basel, Switzerland. This article is an open access article distributed under the terms and conditions of the Creative Commons Attribution (CC BY) license.