


Highlights
Public health relevance—How does this work relate to a public health issue?
- The study describes ten years of stillbirth, infant mortality, prematurity, and survival of extremely low birthweight (ELBW) infants at a single tertiary perinatal center in Turkistan, Kazakhstan.
- Annual records cover 94,337 births and show where preterm and ELBW infants contribute to mortality.
Public health significance—Why is this work of significance to public health?
- Infant mortality was lower in 2025 than in 2016. Recorded ELBW survival was also higher, but the evidence for a sustained trend was weak.
- Preterm births accounted for two-thirds of stillbirths, and ELBW infants for half of infant deaths.
Public health implications—What are the key implications or messages for practitioners, policy makers and/or researchers in public health?
- Routine institutional data can identify groups for focused mortality audit.
- Patient-level and intervention-linked analyses are needed before attributing these changes to care practices.
Abstract
Background: Longitudinal evidence on perinatal and infant mortality in Central Asia remains limited. We described prematurity, the liveborn birthweight distribution, survival of extremely low birthweight (ELBW, 500–999 g) infants, and mortality at a tertiary perinatal center in Turkistan, Kazakhstan. Methods: This single-center ecological study used annual aggregate data for 2016–2025, covering 94,337 births, including 93,482 live births. Poisson models estimated trends; risk ratios (RRs) compared 2025 with 2016. Results: The stillbirth rate was 9.06 per 1000 total births (95% confidence interval [CI] 8.47–9.69) and infant mortality was 4.62 per 1000 live births (95% CI 4.20–5.08). Between 2016 and 2025, perinatal mortality fell from 12.58 to 6.99 per 1000 (RR 0.56, 95% CI 0.41–0.75), stillbirth from 9.29 to 5.42 per 1000 (RR 0.58, 95% CI 0.41–0.82), and infant mortality from 7.66 to 3.57 per 1000 (RR 0.47, 95% CI 0.31–0.70). Preterm births made up 7.1% of births but 66.2% of stillbirths; ELBW infants accounted for 50.2% of infant deaths. Recorded ELBW survival was 21.9% (7/32) in 2016 and 53.8% (28/52) in 2025, but the pooled five-year comparison was not significant (39.9% vs. 47.0%, p = 0.180), and the annual trend lost significance when the 2025 cohort, whose follow-up was incomplete, was excluded. Deaths after discharge were not systematically ascertained. Conclusions: Mortality was lower at the end of the decade, and deaths remained concentrated among preterm and ELBW infants. The ELBW survival findings are hypothesis-generating.
1. Introduction
Deaths around the time of birth remain a major public-health challenge despite substantial global progress. Stillbirths, neonatal deaths, and maternal deaths share determinants across the continuum from antenatal care to childbirth and early postnatal care. The World Health Organization (WHO) has therefore emphasized integrated measurement and action across maternal and newborn health, rather than treating each endpoint as an isolated clinical event [1]. Sustainable Development Goal (SDG) 3.2 calls for ending preventable deaths of newborns and children under five by 2030, including a neonatal mortality target of no more than 12 deaths per 1000 live births in every country [2,3].
Prematurity and impaired fetal growth are central to this burden. Approximately 13.4 million infants were born preterm in 2020 [4], almost one in ten births worldwide. Low birthweight remains common, with an estimated 14.7% of live births affected globally in 2020 [5]. These categories overlap but are not interchangeable: low birthweight can result from prematurity, fetal growth restriction, or both [6,7]. Infants at the lowest gestational ages and birthweights experience the greatest immediate risks of death, respiratory failure, infection, intracranial injury, and long-term neurodevelopmental impairment [7,8].
International estimates also reveal slower progress for stillbirth than for mortality after live birth. Approximately two million stillbirths at 28 weeks or later occurred in 2019, and the global decline since 2000 lagged behind improvements in under-five mortality [9,10]. Many deaths arise from conditions that can be influenced by timely antenatal risk detection, appropriate referral, safe intrapartum care, neonatal resuscitation, thermal care, respiratory support, infection prevention, feeding support, and follow-up of small and sick newborns [1,8,11]. Facility-level surveillance can therefore do more than describe outcomes: it can show where along the care pathway preventable risk is concentrated.
Outcomes among extremely preterm and extremely low birthweight (ELBW) infants have improved in several high-resource neonatal networks, although survival and morbidity vary substantially among hospitals and countries [12,13,14,15,16,17,18]. These studies demonstrate the potential of organized perinatal systems and evidence-based neonatal care, but their estimates cannot simply be transferred to different health-system settings. Comparable longitudinal evidence remains limited in Central Asia, where referral patterns, registration practices, intensive-care resources, and follow-up systems may differ.
Kazakhstan has reported sustained national progress in child survival. UNICEF estimated that neonatal mortality declined from approximately 12 per 1000 live births in 2000 to 4 per 1000 in 2023 [19]. A recent confidential audit of perinatal deaths in Kazakhstani maternity hospitals nevertheless identified persistent opportunities related to clinical processes, health-system organization, professional training, and integration of mortality review with health information systems [20]. Longitudinal institutional data can complement national estimates by showing how changes are distributed across stillbirth, neonatal timing, prematurity, and birthweight strata.
This study evaluated annual trends in perinatal, stillbirth, neonatal, and infant mortality at a tertiary maternity center in Kazakhstan from 2016 through 2025. These mortality series overlap with our earlier analysis of the same registry [21], and we report them here mainly as context for the analyses that are new to this paper: changes in preterm birth prevalence, recorded survival among liveborn infants weighing 500–999 g, and the extent to which stillbirths and infant deaths were concentrated in preterm and ELBW groups. Low-birthweight prevalence among live births is reported alongside these for completeness. We hypothesized that mortality declined over time and that improvement would be detectable even within the highest-risk birthweight group.
2. Materials and Methods
2.1. Study Design and Setting
We conducted a retrospective, single-center ecological time-series study using routinely collected annual maternity and neonatal statistics from 1 January 2016 through 31 December 2025. The reporting approach was informed by the STROBE statement and the RECORD extension for observational studies using routinely collected health data [22,23]. A completed STROBE/RECORD checklist is provided in Supplementary Table S4.
The study was conducted at Regional Perinatal Center No. 3 in Turkistan, the administrative center of Turkistan Region in southern Kazakhstan. The center is a third-level (tertiary) facility in the national three-level system of perinatal care. It provides obstetric and neonatal care for the region, including the management of high-risk pregnancies and the care of small and sick newborns, and it receives referrals from lower-level maternity units in the surrounding districts. Over the study period it recorded between 7471 and 11,528 births a year (93,110 deliveries in total), with the highest volumes in 2021–2023. As the regional referral facility, the center receives a disproportionate share of high-risk pregnancies, so its case mix is not representative of all births in the region.
2.2. Data Source and Study Population
The source consisted of institutionally compiled annual aggregate tables. The study population included all deliveries and all infants recorded as liveborn or stillborn during the study period. No sampling was performed. Annual variables comprised number of deliveries, total births, live births, stillbirths, antepartum and intrapartum stillbirths, preterm births, early neonatal deaths (0–6 completed days), late neonatal deaths (7–27 days), postneonatal deaths (28 days to less than one year), birthweight categories among liveborn infants, and survival status among liveborn infants weighing 500–999 g. The tables were extracted from the medical statistics records of the center on 2 February 2026; the annual counts are given in Supplementary Table S1. The analysis begins in 2016 because the institutional tables reporting preterm births, the liveborn birthweight distribution, and ELBW survival status were compiled from 2016 onward; for 2015 only mortality counts were available.
Only de-identified aggregate counts were available for analysis. Individual maternal or neonatal records, gestational age, plurality, congenital anomalies, maternal comorbidities, referral status, treatment exposures, length of follow-up, and causes of death were not included. Accordingly, the study estimates population-level temporal associations and cannot provide adjusted individual-level causal effects. The annual mortality counts for 2016–2025 come from the same institutional registry as our earlier BABIES matrix analysis of this center for 2015–2025 [21]. The two papers therefore share the annual counts of births, stillbirths (antepartum and intrapartum), and early neonatal, late neonatal, and postneonatal deaths, and the stillbirth, perinatal, neonatal, and infant mortality rates derived from them. The earlier paper analyzed those rates over eleven years, cross-classified deaths by birthweight band and age at death, and reported trends in low and very low birthweight prevalence among total births. The present study uses ten of those years and adds three analyses that were not reported there: preterm birth prevalence, recorded survival of liveborn ELBW infants, and the concentration of stillbirths and infant deaths in preterm and ELBW groups. Its low-birthweight results, which use live births as the denominator, overlap with the earlier birthweight analysis and are included for completeness. Supplementary Table S3 sets out the overlap item by item.
2.3. Outcomes and Definitions
Total births were defined as live births plus stillbirths. Perinatal deaths were defined as stillbirths plus early neonatal deaths occurring at 0–6 completed days. Stillbirth and perinatal mortality rates used total births as the denominator. Early neonatal, late neonatal, neonatal, postneonatal, and infant mortality rates used live births as the denominator. Infant deaths comprised all recorded deaths from birth to less than one year. As in our earlier report [21], and as confirmed by the medical statistics department of the center, annual death counts were tabulated by the calendar year in which the death was recorded, among infants born at the center. Annual neonatal, postneonatal, and infant mortality rates are therefore period rates and should not be read as the one-year survival of that year’s birth cohort.
Low birthweight was defined as 500–2499 g among liveborn infants, very low birthweight as 500–1499 g, and ELBW as 500–999 g. Recorded ELBW survival was the proportion of liveborn infants weighing 500–999 g, tabulated by year of birth, for whom no death before one year of age was recorded in the institutional tables. Deaths were identified from the center’s own inpatient records and from deaths notified to the center after discharge or transfer; the tables were not linked to the civil registration system, and infants with unknown outcomes were not listed separately. The endpoint is therefore the absence of a recorded death rather than confirmed survival to one year. Because infants born in late 2025 had not reached one year of age when the data were extracted, ELBW survival analyses were repeated for the 2016–2024 birth cohorts only. Preterm birth was defined as birth from 22 completed weeks to before 37 completed weeks of gestation, with gestational age assessed by early ultrasound where available and otherwise by the last menstrual period, as classified by the institution. Stillbirth registration followed the national criteria adopted in 2008 (fetal death at 22 completed weeks or more, or birthweight of 500 g or more). Because individual gestational ages were absent from the extract, direct comparison with international estimates using a 28-week threshold should be made cautiously. The extract did not document whether registration rules, coding practice, or referral arrangements changed during 2016–2025.
2.4. Data Quality Assurance
Annual cells were treated as the primary observations, and all totals, percentages, and rates were recalculated. For every year, live births plus stillbirths equaled total births; antepartum plus intrapartum deaths equaled stillbirths; and early neonatal plus late neonatal plus postneonatal deaths equaled deaths before one year. Several printed summary values were inconsistent with the annual cells: the reported ten-year preterm total was 6935 rather than the recalculated 6735; the printed live-birth total in the birthweight table was 95,482 rather than 93,482; ELBW survival in 2020 was printed as 48.4% rather than 40.5%; and printed ELBW late-neonatal deaths totaled 70 rather than the recalculated 63. Analyses used the internally consistent annual counts. The two total-level discrepancies differ from the recalculated values in a single digit (by exactly 200 and 2000), which suggests transcription errors in the summary rows; the printed 95,482 live births also exceeds the total number of births (94,337), so it cannot be correct. To check that our conclusions did not depend on this choice, we repeated the affected analyses with the printed values (Supplementary Table S2). Using 6935 preterm births changed overall preterm prevalence from 7.1% to 7.4% and the stillbirth risk ratio for preterm versus nonpreterm births from 25.5 to 24.7. Using 95,482 live births would lower low-birthweight prevalence from 5.50% to 5.39%. Substituting the printed 2020 ELBW survival left the annual odds ratio at 1.10 (95% CI 1.00–1.21) but moved its p value from 0.046 to 0.058; the pooled five-year comparison remained non-significant. The printed late-neonatal ELBW total is not used in any analysis.
2.5. Statistical Analysis
Counts are reported with percentages or rates per 1000 relevant births. Exact Poisson 95% confidence intervals (CIs) were used for event rates, and Wilson CIs were used for binomial proportions. Log-linear Poisson regression modeled each annual event count with calendar year as a continuous predictor and the natural logarithm of the relevant annual birth denominator as an offset. Where the Pearson dispersion statistic (Pearson chi-square divided by residual degrees of freedom) exceeded one, standard errors were multiplied by its square root (quasi-Poisson scaling). Dispersion estimates for every model are reported with the trend results. The regression coefficient was transformed to an average annual percentage change (AAPC). Spearman rank correlation provided a complementary assessment of monotonic annual patterns without assuming linearity.
Risk ratios (RRs) and two-sided Fisher exact tests compared 2025 with 2016 and 2025 with the 2022 peak where clinically relevant. A grouped binomial logistic model estimated annual change in the odds of recorded survival among liveborn ELBW infants; the same Pearson dispersion scaling was applied to this model. Analyses were two-sided with alpha = 0.05. Because the ten trend outcomes describe related components of mortality and the analysis was exploratory, the main p values were not multiplicity-adjusted and should be interpreted together with effect sizes and CIs. As a check, we also report Bonferroni-adjusted p values for ten tests (equivalent to a threshold of p < 0.005), and we note which results remain significant under Benjamini–Hochberg false discovery rate control at 5%. Sensitivity analyses restricted the ELBW survival and infant mortality trends to 2016–2024, the years with complete one-year follow-up, and replaced recalculated values with the printed summary values (Section 2.4). To describe the 2021–2022 peak, rates for 2020–2022 were compared with those for 2016–2019. Calculations and figures were produced in Python 3.12 (Python Software Foundation, Wilmington, DE, USA) using the open-source packages statsmodels 0.15, SciPy 1.17, NumPy 2.3, pandas 2.2, and Matplotlib 3.10.
2.6. Ethical Considerations
The study was conducted in accordance with the Declaration of Helsinki and was approved by the Local Bioethics Commission of the Public Association “Academy of Preventive Medicine”, Almaty, Kazakhstan, at its meeting of 21 May 2025. The Commission records its decisions by meeting date and does not assign protocol numbers. It holds Good Clinical Practice certification, registration No. XIII-R, valid from 14 December 2023 to 14 December 2026.
The dataset contained only de-identified aggregate counts and no directly or indirectly identifiable participant information. Individual informed consent was not applicable, because the study used only anonymized routine statistics compiled retrospectively.
3. Results
3.1. Study Population and Overall Outcomes
During 2016–2025, the institution recorded 93,110 deliveries and 94,337 births, including 93,482 live births and 855 stillbirths. There were 1065 perinatal deaths and 432 deaths before one year. The overall stillbirth rate was 9.06 per 1000 total births (95% CI 8.47–9.69), the perinatal mortality rate was 11.29 per 1000 total births (95% CI 10.62–11.99), and the infant mortality rate was 4.62 per 1000 live births (95% CI 4.20–5.08). Of the stillbirths, 704 (82.3%) were antepartum and 151 (17.7%) intrapartum. Early neonatal deaths accounted for 48.6% of all deaths before one year (Table 1).
Table 1.
Overall maternal and infant service outcomes, 2016–2025.
3.2. Mortality Trends
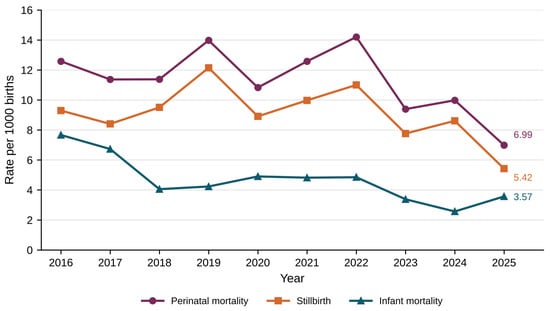
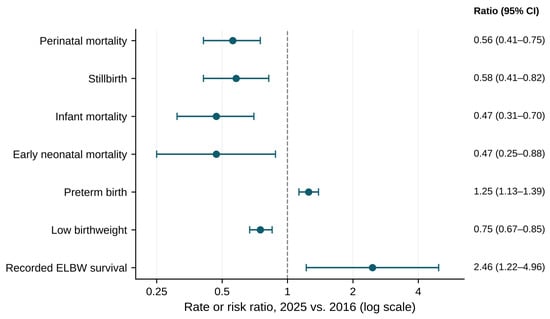
Perinatal mortality was 12.58 per 1000 total births in 2016, reached 14.20 in 2022, and subsequently declined to 6.99 in 2025 (Figure 1; Table 2). Relative to 2016, the 2025 rate was 44.5% lower (RR 0.56, 95% CI 0.41–0.75; p < 0.001). The log-linear model across all ten years estimated an AAPC of −3.6% (95% CI −7.3% to 0.3%; p = 0.067), reflecting the non-linear pattern and intervening 2021–2022 peak. During 2020–2022, perinatal mortality (12.58 vs. 12.33 per 1000 total births; RR 1.02, 95% CI 0.89–1.17) and stillbirth (9.99 vs. 9.80 per 1000) were similar to 2016–2019, but intrapartum stillbirth was higher (2.15 vs. 1.34 per 1000 total births; RR 1.60, 95% CI 1.10–2.35). Annual births were also about one-third higher in 2020–2022 than in 2016–2019 (mean 10,681 vs. 8011).
Figure 1.
Annual perinatal, stillbirth, and infant mortality rates, 2016–2025. Perinatal mortality (stillbirths plus early neonatal deaths) and stillbirth rates are per 1000 total births (live births plus stillbirths); infant mortality (deaths before one year, by calendar year of death) is per 1000 live births.
Table 2.
Annual births, mortality rates, and high-risk birth indicators.
Stillbirth decreased from 9.29 to 5.42 per 1000 total births between 2016 and 2025 (RR 0.58, 95% CI 0.41–0.82; p = 0.002). Infant mortality decreased from 7.66 to 3.57 per 1000 live births (RR 0.47, 95% CI 0.31–0.70; p < 0.001). The infant mortality AAPC was −8.6% (95% CI −12.2% to −4.9%; p < 0.001), and the rank correlation was consistent (Spearman rho = −0.76; p = 0.011). Restricting the model to 2016–2024 gave a similar estimate (AAPC −9.5%, 95% CI −13.6% to −5.1%). Both early and late neonatal mortality declined across the decade. The infant, neonatal, late neonatal, and low-birthweight trends remained significant after Bonferroni correction (Table 3). The early neonatal (p = 0.043) and postneonatal (p = 0.020) trends did not, and we regard them as suggestive; under false discovery rate control only the postneonatal trend was retained (q = 0.040).
Table 3.
Model-based and rank-based temporal trends, 2016–2025.
3.3. Prematurity and Low Birthweight
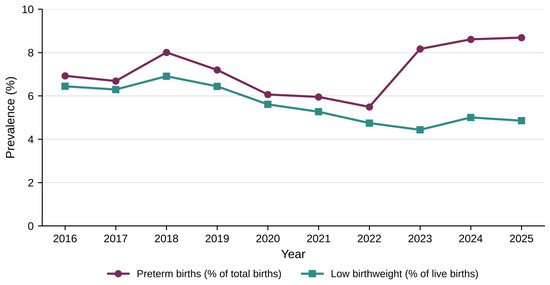
Across ten years, 6735 of 94,337 births were classified as preterm (7.1%, 95% CI 7.0–7.3%). Preterm prevalence was 6.92% in 2016 and 8.69% in 2025 (RR 1.25, 95% CI 1.13–1.39; p < 0.001), but the decade-wide linear trend was not statistically significant (AAPC 2.3%, 95% CI −1.2% to 6.0%; p = 0.199). Low birthweight occurred in 5144 of 93,482 live births (5.5%, 95% CI 5.4–5.7%) and decreased from 6.44% in 2016 to 4.85% in 2025 (RR 0.75, 95% CI 0.67–0.85; p < 0.001). The model-based AAPC in low birthweight was −4.3% (95% CI −6.0% to −2.7%; p < 0.001) (Figure 2). Most of the increase in preterm prevalence occurred between 2022 and 2023, when it rose from 5.49% to 8.16% (RR 1.49, 95% CI 1.34–1.65; p < 0.001) while low-birthweight prevalence did not rise (4.74% to 4.43%). A true shift toward earlier delivery would usually raise low birthweight as well, so this divergence may reflect a change in classification, recording, or case mix; the aggregate data do not allow us to tell which.
Figure 2.
Annual prevalence of preterm birth among total births and low birthweight among live births, 2016–2025.
3.4. Concentration of Risk
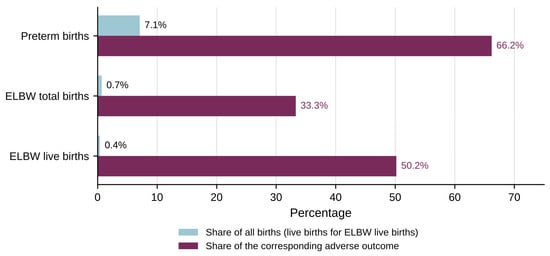
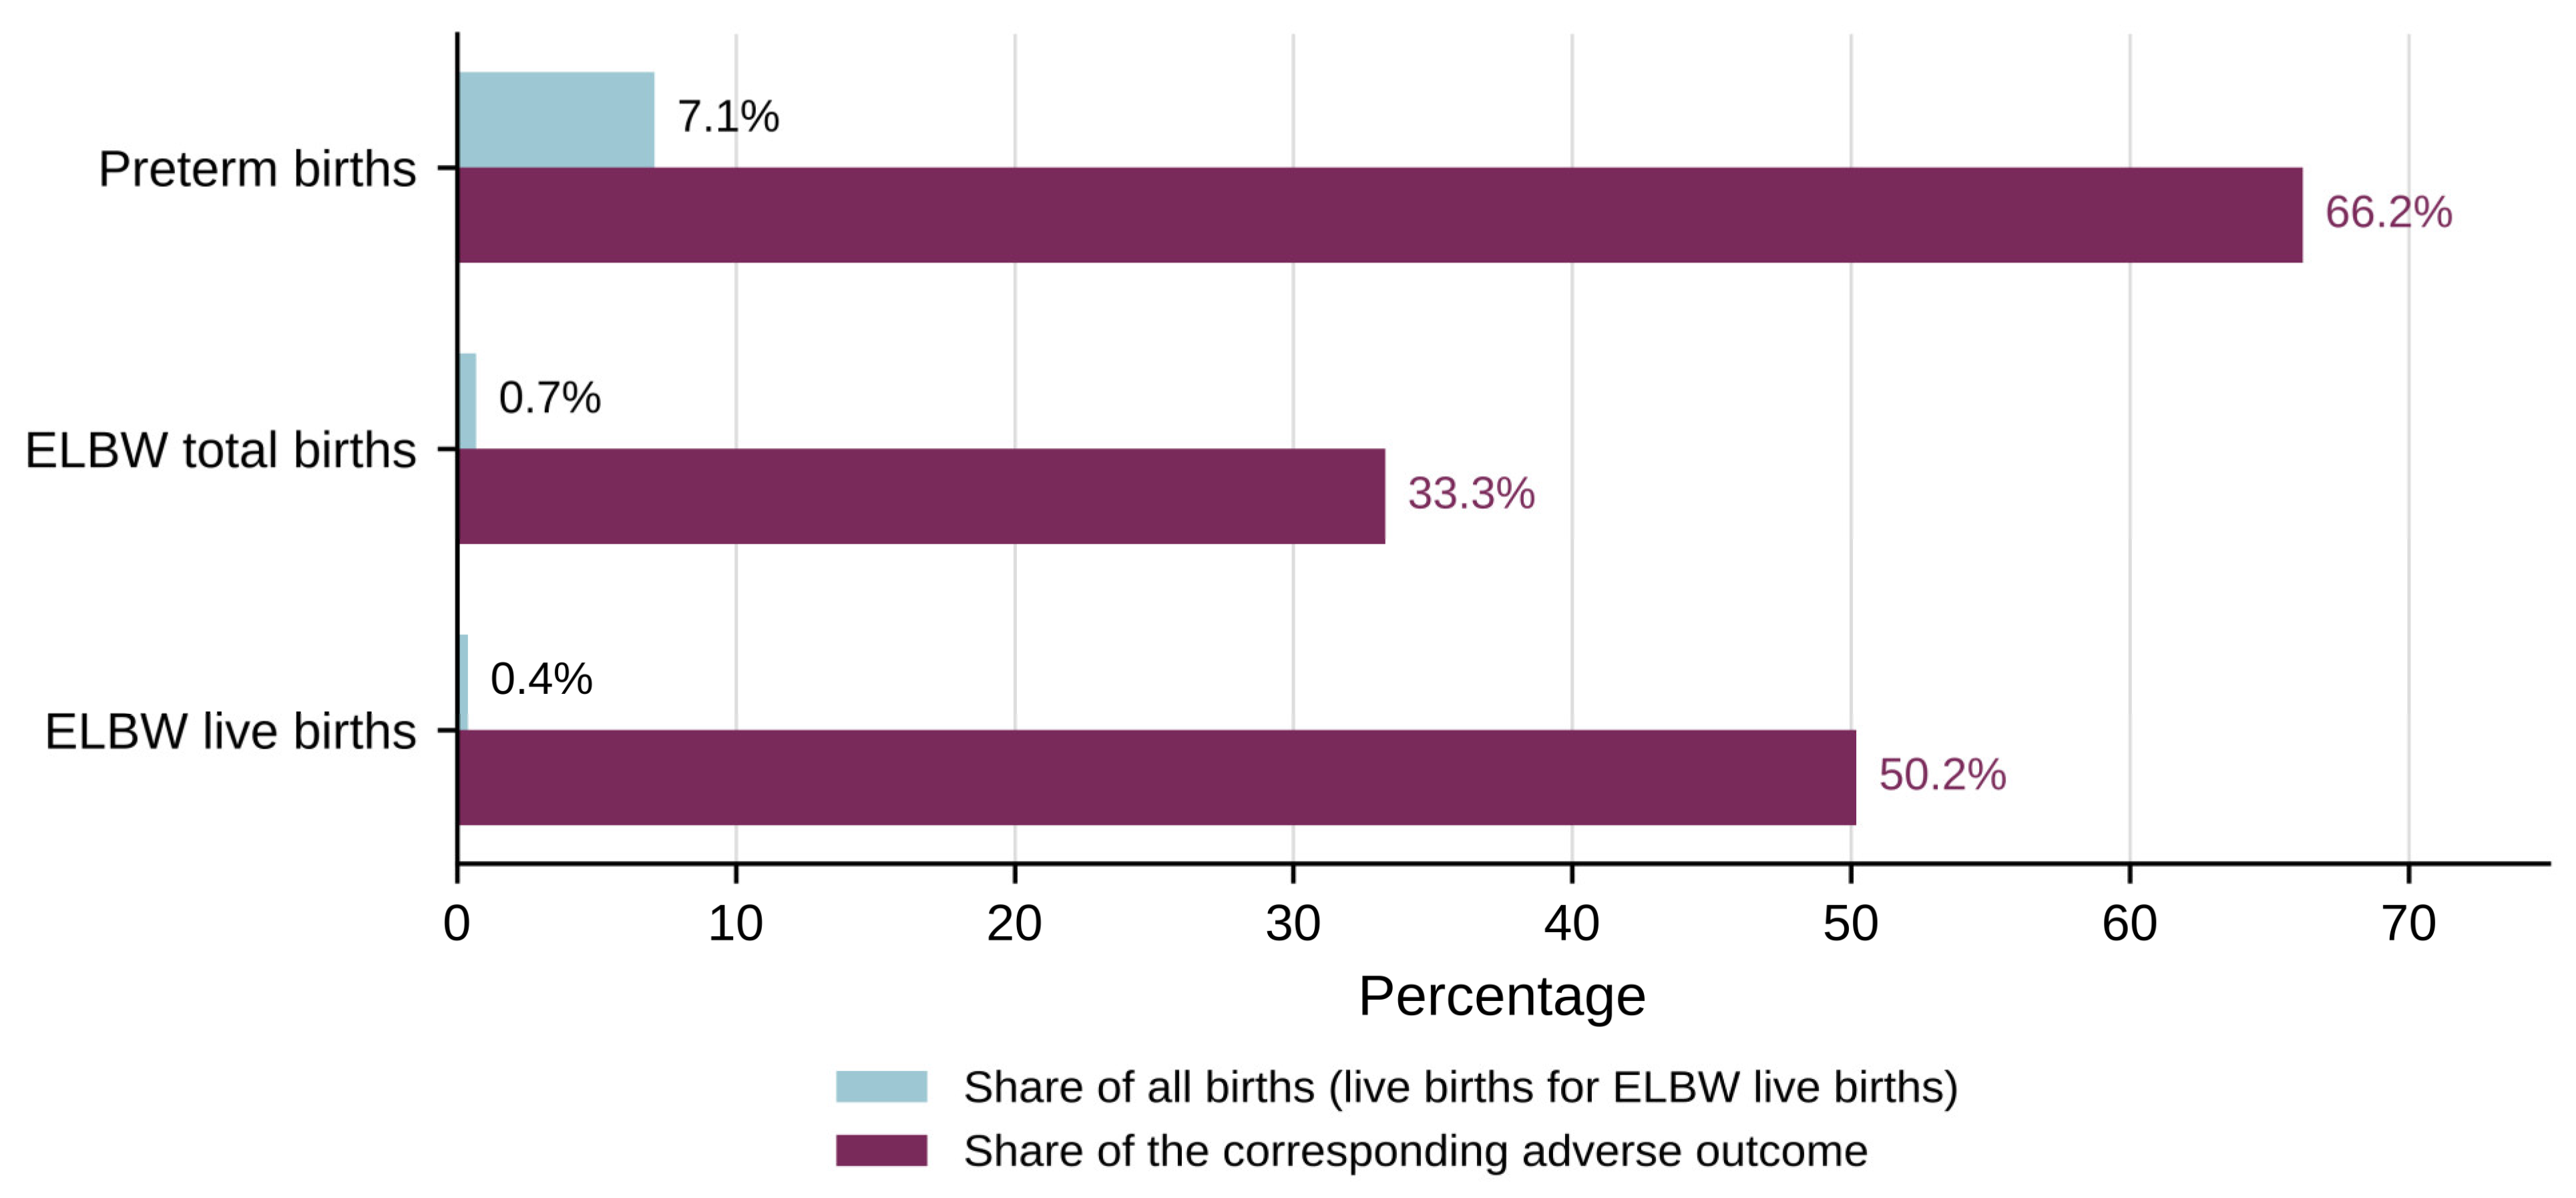
Preterm births represented 7.1% of all births but accounted for 566 of 855 stillbirths (66.2%). The stillbirth risk was 8.4% among preterm births and 0.33% among nonpreterm births (RR 25.5, 95% CI 22.2–29.3; p < 0.001; Table 4). Infants weighing 500–999 g represented 0.71% of total births but accounted for one-third of stillbirths. Among live births, ELBW infants represented only 0.41% but accounted for 217 of 432 deaths before one year (50.2%). Figure 3 places each group’s share of births beside its share of the corresponding adverse outcome. The ELBW deaths come from the birth-cohort survival table and the 432 deaths from calendar-year counts, so the 50.2% share is approximate. Their risk of death before one year was 56.1%, compared with 0.23% among other liveborn infants (RR 242.8, 95% CI 206.9–284.9; p < 0.001). These unadjusted contrasts quantify the concentration of adverse outcomes; they should not be interpreted as independent causal effects.
Table 4.
Risk concentration in preterm and extremely low birthweight groups.
Figure 3.
Population share and adverse-outcome share in preterm and ELBW groups. For preterm and ELBW total births, the corresponding adverse outcome is stillbirth; for ELBW live births, it is death before one year.
3.5. Survival Among Extremely Low Birthweight Infants
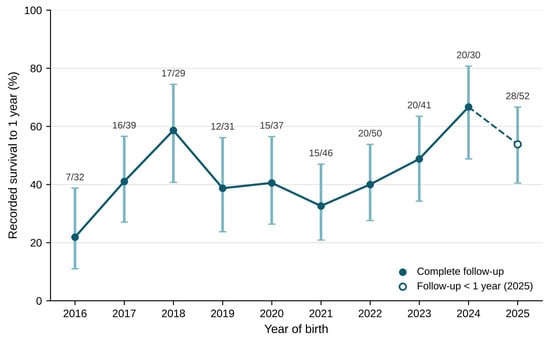
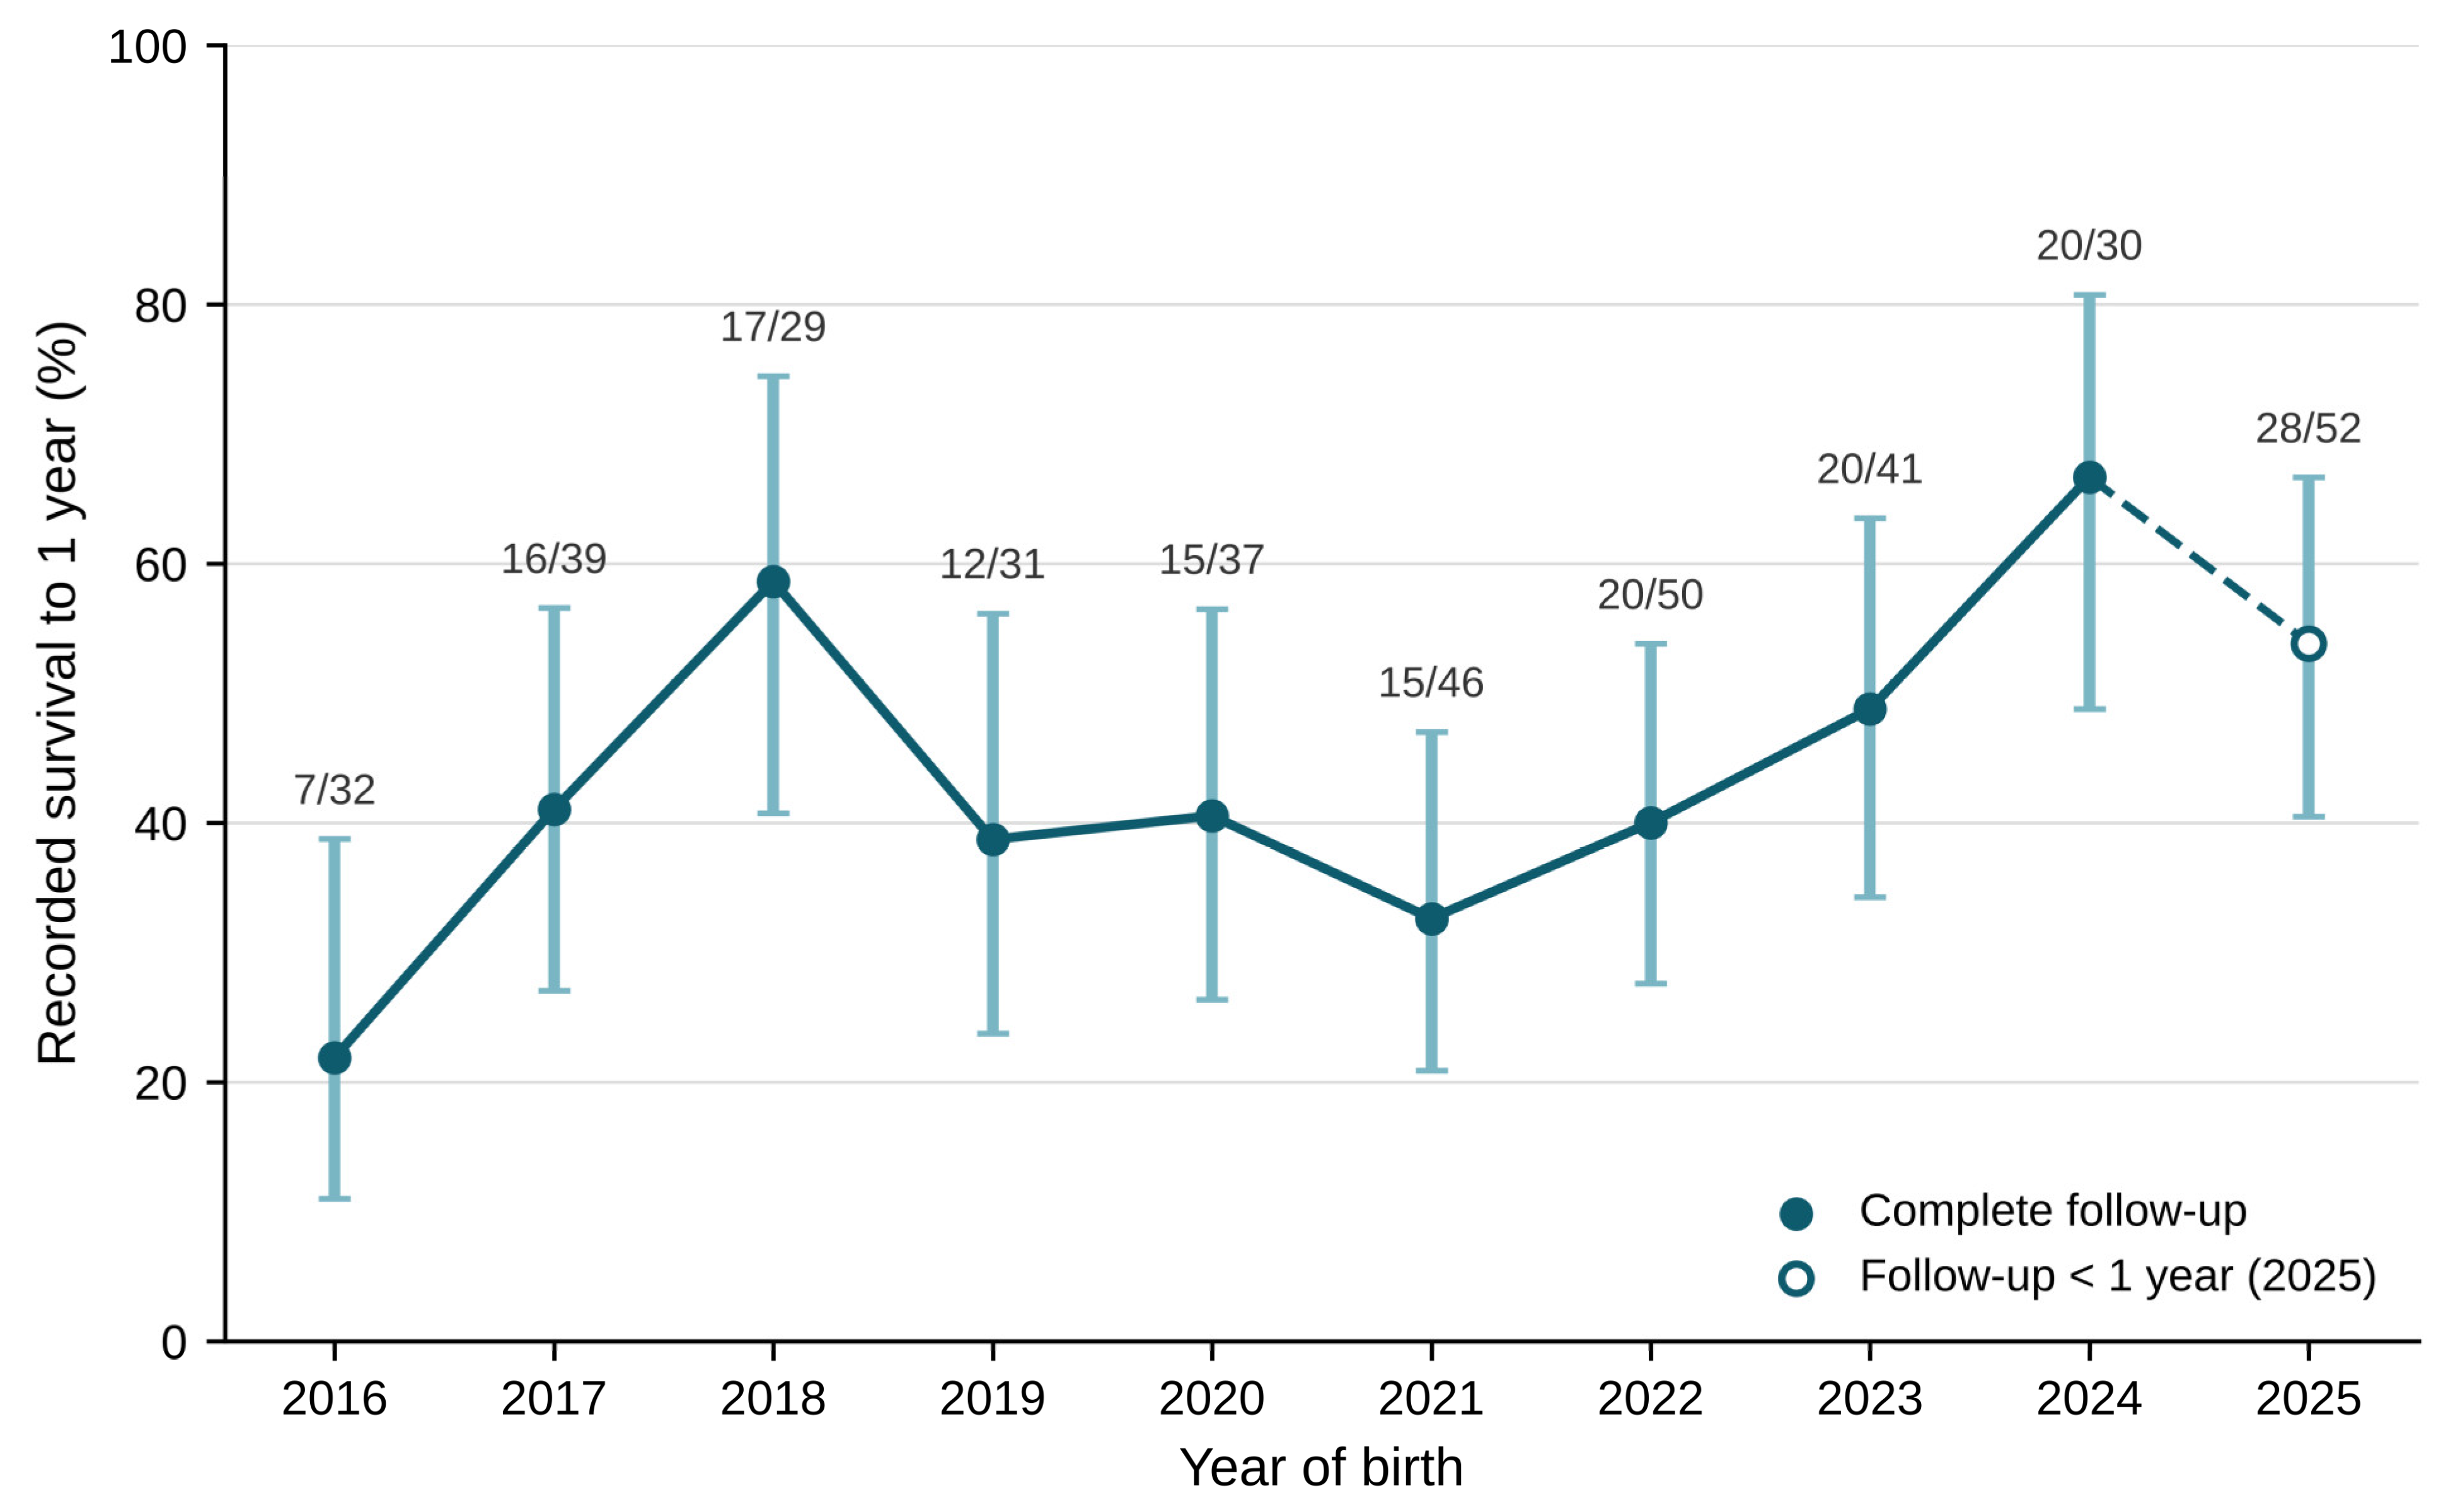
Among 387 liveborn infants weighing 500–999 g, 170 had no recorded death before one year and 217 died, giving an overall recorded survival of 43.9% (95% CI 39.1–48.9%). Annual denominators were small, ranging from 29 to 52 infants (Table 2, Figure 4). Recorded survival was 21.9% (7/32) in 2016 and 53.8% (28/52) in 2025 (RR 2.46, 95% CI 1.22–4.96; p = 0.006). The grouped logistic model, with standard errors scaled for overdispersion (Pearson dispersion 1.78), estimated a 10.3% annual increase in the odds of survival (OR 1.10, 95% CI 1.00–1.21; p = 0.046); without scaling, the p value would have been 0.008. This result does not survive Bonferroni correction. The other analyses were weaker. Pooled survival was 39.9% in 2016–2020 and 47.0% in 2021–2025 (RR 1.18, 95% CI 0.93–1.49; p = 0.180), and the rank correlation was not significant (Spearman rho = 0.49; p = 0.150). When the 2025 cohort, whose follow-up was incomplete, was excluded, the odds ratio was unchanged in size but no longer significant (OR 1.10, 95% CI 0.97–1.25; p = 0.126), although recorded survival in 2024 (20/30, 66.7%) remained higher than in 2016 (RR 3.05, 95% CI 1.51–6.15). Taken together, these results are compatible with improvement but do not establish a sustained trend.
Figure 4.
Annual recorded survival to one year among liveborn infants weighing 500–999 g, with Wilson 95% confidence intervals. Labels show survivors/liveborn ELBW infants. The open marker indicates the 2025 cohort, which had less than one year of follow-up at data extraction. The dashed segment joins 2024 to the 2025 cohort.
3.6. Timing of Death Before One Year
Of the 432 deaths before one year, 210 (48.6%) occurred during days 0–6, 134 (31.0%) during days 7–27, and 88 (20.4%) from 28 days to less than one year. The corresponding rates were 2.25, 1.43, and 0.94 per 1000 live births. Most deaths occurred in the neonatal period, and almost half in the first week, which points mortality audit toward childbirth and immediate neonatal care. Table 5 and Figure 5 summarize the comparison of 2025 with 2016 for all main outcomes.
Table 5.
Effect sizes comparing 2025 with 2016.
Figure 5.
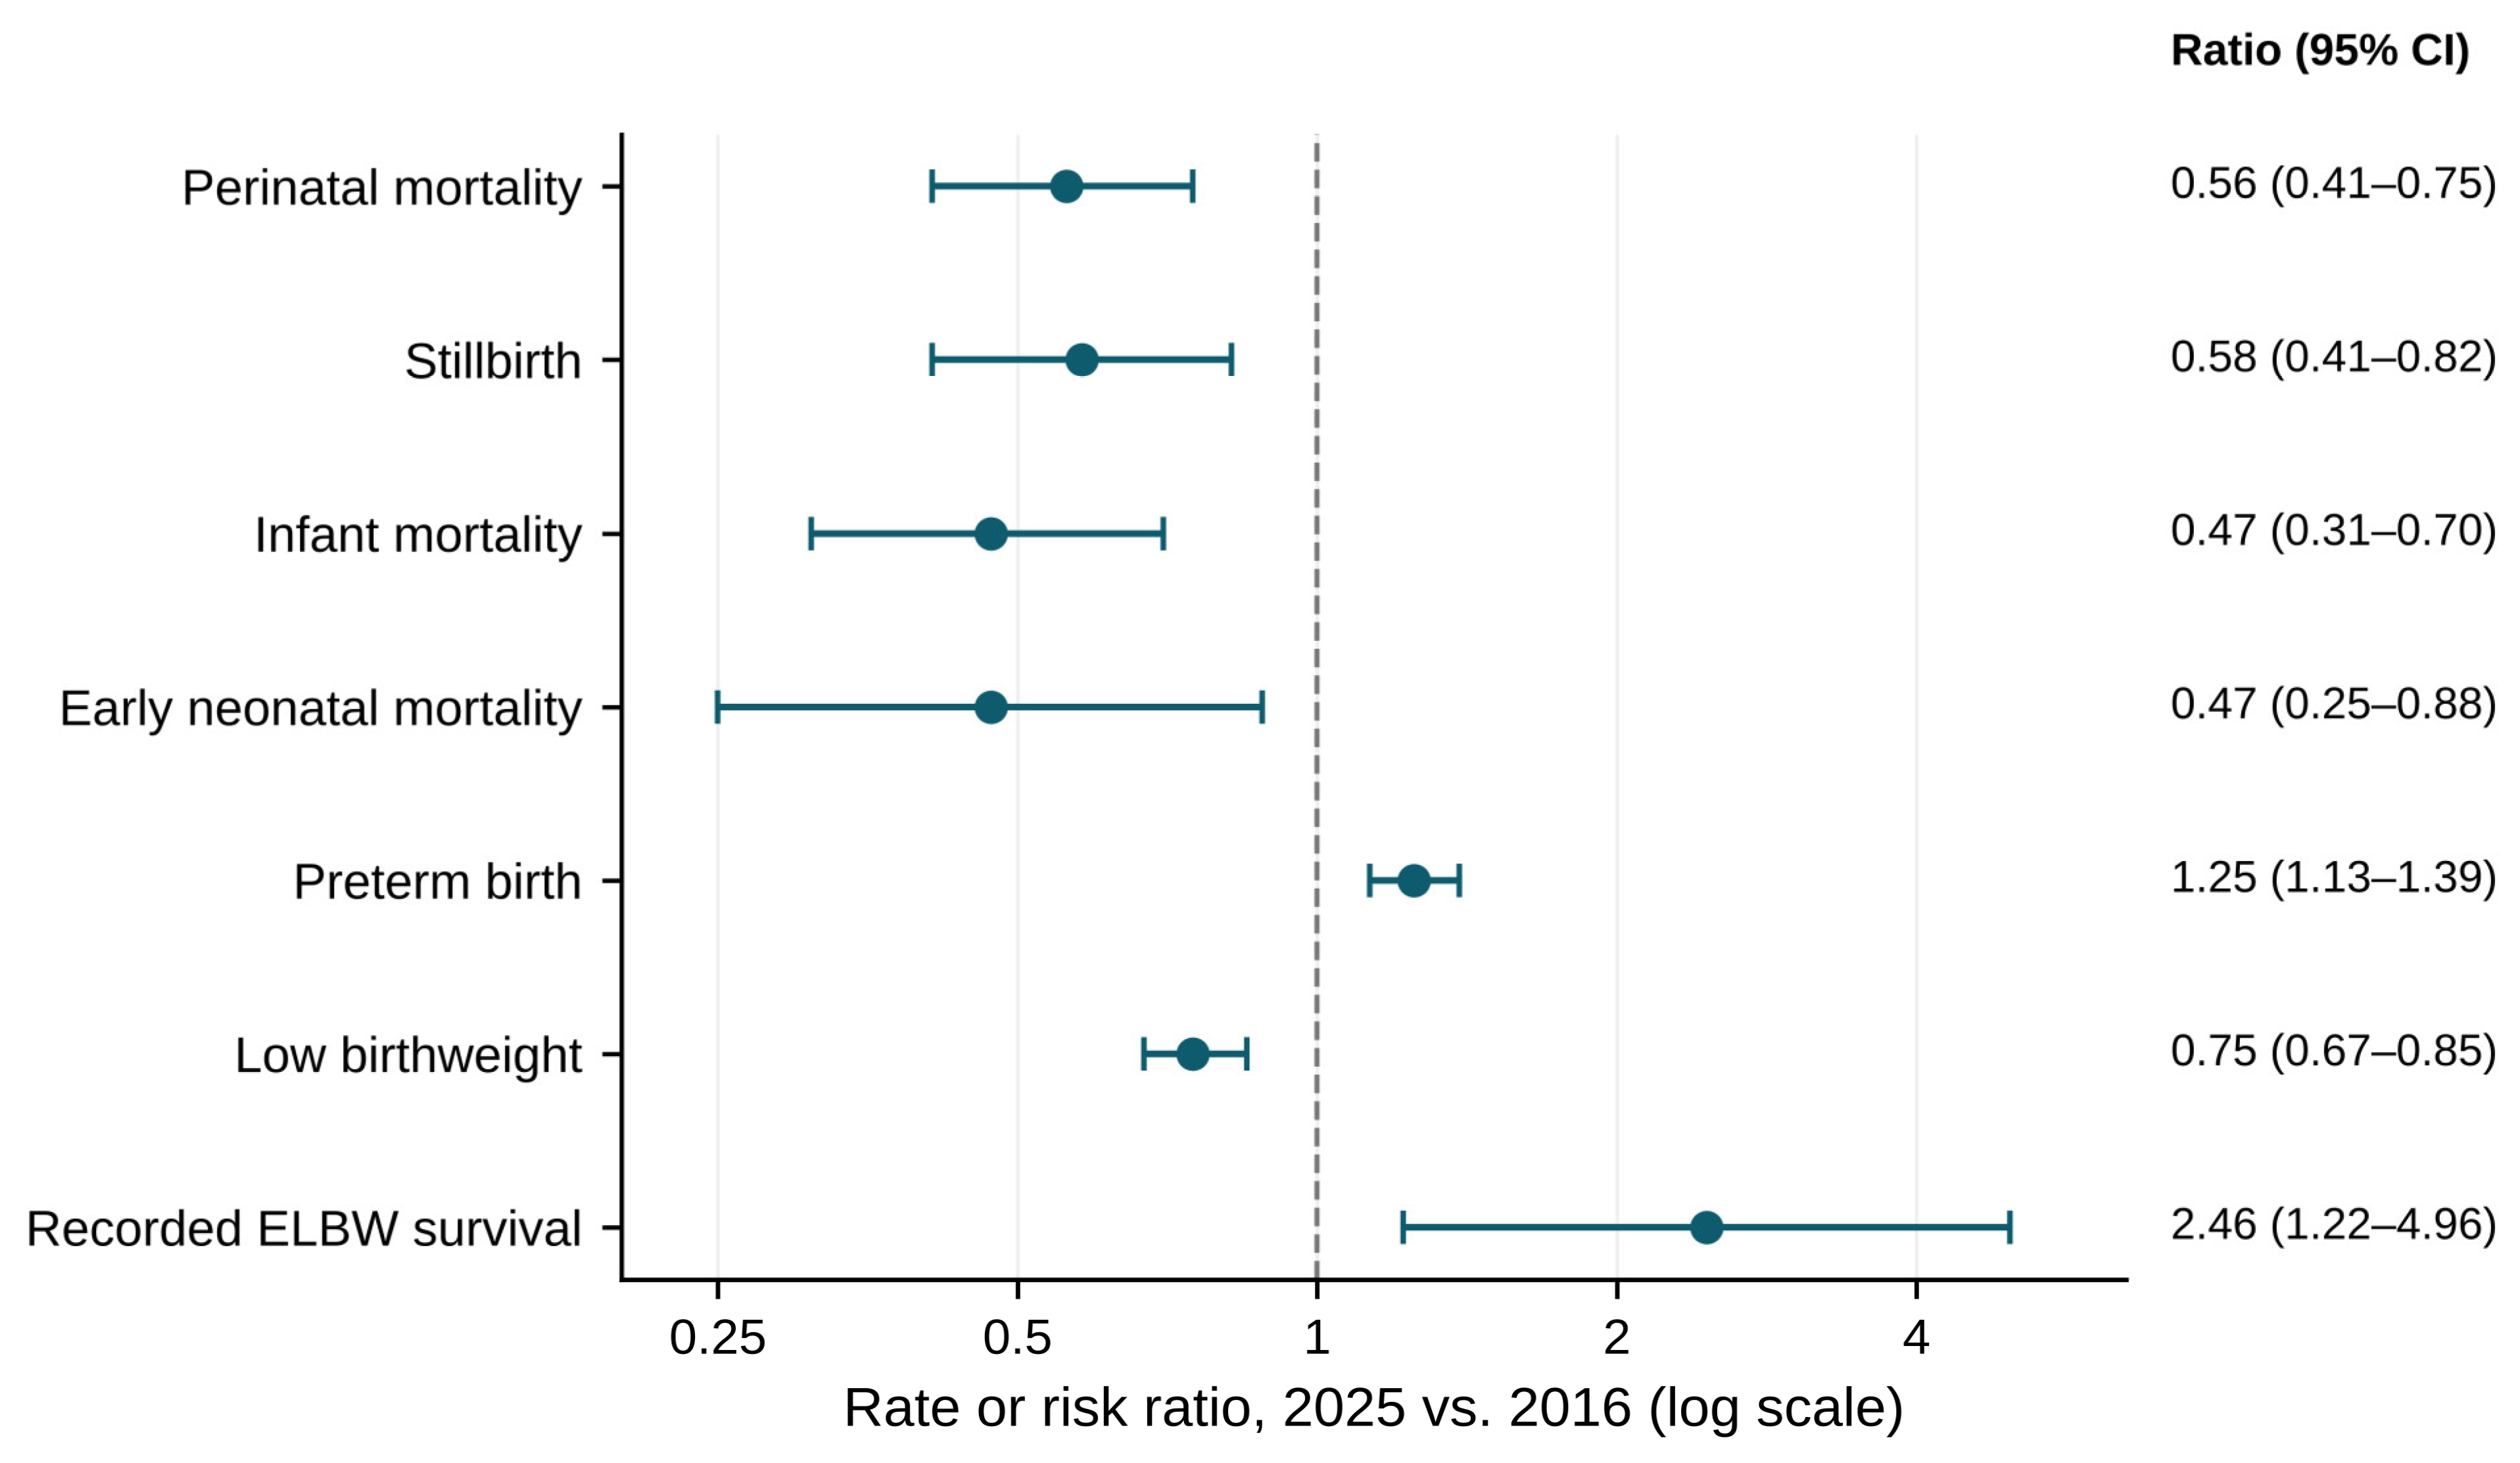
Rate and risk ratios comparing 2025 with 2016. The dashed vertical line marks a ratio of 1 (no difference between the two years). Values below 1 favor 2025 for mortality and low birthweight; values above 1 indicate higher prevalence or survival in 2025. ELBW, extremely low birthweight. ELBW survival is recorded survival; the 2025 cohort had incomplete follow-up.
4. Discussion
4.1. Principal Findings
In this ten-year analysis of more than 94,000 births, mortality was lower at the end of the decade than at the start. By 2025, perinatal mortality was 44.5% lower, stillbirth was 41.6% lower, and infant mortality was 53.5% lower than in 2016. The strongest statistical evidence concerned infant and neonatal mortality, which showed significant negative AAPCs and monotonic correlations across the decade and remained significant after Bonferroni correction. Perinatal mortality also reached its lowest observed level in 2025, although its decade-wide linear trend was not significant because of increases in 2019 and 2021–2022 followed by a sharp recent decline.
The ELBW results call for more caution than the mortality results. Recorded survival was 21.9% in 2016 and 53.8% in 2025, and the grouped model favored rising odds of survival, but the evidence is thin. Annual denominators were 29 to 52 infants. The model p value was borderline and depended on including 2025, a cohort with incomplete follow-up, and neither the pooled five-year comparison nor the rank correlation was significant. Deaths after discharge may also have been missed, which would overstate survival in any year and could distort the trend if ascertainment changed over time. We therefore read these data as compatible with improving ELBW survival and as a reason to study it with patient-level data, not as evidence that survival has improved.
The analysis also shows a highly concentrated distribution of risk. Preterm births accounted for approximately one in fourteen births but two-thirds of stillbirths. ELBW infants accounted for fewer than one in 200 live births but about half of all deaths before one year. This concentration may be useful for planning. Relatively small, identifiable groups account for a large share of adverse outcomes, and they are natural candidates for evaluating focused measures such as strengthened referral, delivery planning, neonatal intensive care, discharge coordination, and long-term follow-up.
4.2. Interpretation in the Global and Kazakhstani Context
Global evidence indicates that preterm birth and low birthweight remain major drivers of newborn mortality [4,5,6,7,8,9]. The observed institutional preterm prevalence of 7.1% was lower than the estimated global prevalence of approximately 9.9% in 2020 [4], while the liveborn low-birthweight prevalence of 5.5% was below the global estimate [5,6]. These comparisons are descriptive because referral composition, gestational-age assessment, registration thresholds, missing birthweights, and population coverage can differ. Referral matters most here. Because the center receives high-risk pregnancies from district maternity units, its rates of preterm and ELBW birth, stillbirth, and infant death are likely to be higher than those of the regional population, and the shares of deaths attributed to preterm and ELBW infants describe this referral population rather than all births. A tertiary center may also record outcomes more completely than non-referral facilities. That the observed preterm prevalence was nonetheless below the global estimate suggests that classification practice, and not only case mix, shapes these figures.
The institution’s overall neonatal mortality rate of 3.68 per 1000 live births across 2016–2025 and its 2025 rate of 2.62 per 1000 should be interpreted alongside, but not equated with, national estimates. UNICEF reported that Kazakhstan’s neonatal mortality declined from approximately 12 per 1000 live births in 2000 to 4 per 1000 in 2023 [19]. The present institutional pattern is therefore directionally consistent with national progress, while offering greater resolution by timing of death and birthweight. Differences in ascertainment after discharge could also lead institutional infant mortality to underestimate population-based mortality.
The recent Kazakhstan confidential audit demonstrated that perinatal mortality analysis can identify modifiable clinical and organizational factors, including access, timeliness, quality of care, professional training, and information-system integration [20]. The present findings complement case review by defining where the numerical burden is greatest. Stillbirth remained the largest component of perinatal mortality, accounting for 80.3% of perinatal deaths. Within stillbirths, 82.3% (704 of 855) occurred antepartum (Table 1). These patterns support prevention strategies that begin before labor, including risk identification, fetal-growth and wellbeing surveillance, timely referral, and planned delivery when indicated, while preserving robust intrapartum monitoring and neonatal stabilization.
The 2021–2022 rise in perinatal mortality and stillbirth coincided with the COVID-19 pandemic. A meta-analysis of the first pandemic year found higher stillbirth rates during the pandemic and pointed to disrupted antenatal care and delayed presentation as plausible mechanisms [24]. Two features of our data fit that picture, though neither proves it: intrapartum stillbirth was about 60% higher in 2020–2022 than in 2016–2019, and the center handled roughly one-third more births per year, which may reflect redistribution of deliveries from other facilities and greater pressure on staff and beds. Without monthly data or information on maternal infection, we cannot separate these explanations.
4.3. Implications for Maternal and Newborn Health Systems
The results support a systems approach spanning pregnancy, delivery, neonatal care, and infancy. First, routine data should be linked across these stages so that a death is not lost when an infant is transferred or dies after discharge. Second, gestational age, birthweight, fetal-growth status, major congenital anomalies, plurality, maternal complications, referral pathway, and treatment exposures should be captured in a common dataset. Third, every stillbirth and neonatal death should undergo standardized multidisciplinary review using WHO-aligned methods [11]. Financing and resource availability form a further layer. Cross-national work has linked the level and structure of public health spending to infant mortality [25], although associations of this kind at the country level cannot explain changes at a single center.
For the highest-risk infants, WHO recommends a package of evidence-based care that includes thermal care, kangaroo mother care, appropriate feeding support, respiratory support, infection prevention and treatment, and family involvement [8]. International cohorts show that survival at the limits of viability varies considerably by active treatment practices and hospital organization [12,13,14,15,16,17]. The present aggregate data cannot attribute any change to a specific intervention. Several explanations are possible, and they are not mutually exclusive. Neonatal care may have advanced through wider use of antenatal corticosteroids, surfactant, and noninvasive respiratory support. Obstetric management may have changed; earlier delivery for fetal compromise, for example, could raise recorded preterm births while lowering stillbirth. Referral patterns may have shifted the risk profile of women delivering at the center, and neonatal intensive-care capacity in the region may have expanded. Our design cannot weigh these possibilities. We offer them as hypotheses that a reconstructed timeline of obstetric and neonatal changes would need to test.
A subsequent evaluation should use monthly or quarterly counts and prespecified implementation dates for interventions such as regionalization, antenatal corticosteroid protocols, neonatal resuscitation training, early continuous positive airway pressure, surfactant availability, infection-prevention bundles, human-milk feeding, or follow-up programs. Interrupted time-series models could then distinguish level and slope changes from background secular trends. Patient-level models should additionally estimate risk-adjusted outcomes and test whether improvement was equitable across maternal residence, socioeconomic position, referral status, and other determinants relevant to the Special Issue.
4.4. Strengths and Limitations
The study has several strengths. It covers ten consecutive years and more than 94,000 births, providing stable denominators for uncommon outcomes. Mortality components were internally reconcilable, all rates were recalculated from annual counts, and sensitivity analyses showed that the conclusions did not depend on the discrepant printed values. The analysis reports effect sizes with CIs rather than relying on p values alone. Stratification by prematurity and birthweight revealed a concentration of risk that overall rates would hide.
The limitations are substantial. The dataset was ecological and aggregate, so confounding, clustering, repeated pregnancies, and interactions could not be addressed. Ten annual observations give limited power for trend models and cannot locate inflection points reliably, and ten outcomes were tested without formal multiplicity adjustment; the early neonatal, postneonatal, and ELBW survival trends would not survive Bonferroni correction. The extract lacked gestational age, maternal characteristics, plurality, congenital anomalies, referral source, treatments, and cause of death. Preterm birth came from the institution’s annual classification, and we could not verify whether classification criteria or recording practice changed over time. The jump in preterm prevalence between 2022 and 2023, without a matching rise in low birthweight, makes this a real concern for the comparability of preterm rates across years. Recorded survival to one year rested on institutional records without linkage to civil registration, so deaths after discharge or transfer may have been missed, and the 2025 cohort had incomplete follow-up. Mortality counts were tabulated by calendar year, which is not the same as following each birth cohort. The center is a tertiary referral facility that concentrates high-risk pregnancies; its rates are likely to be higher than those of the general population and should not be generalized to the region or to Kazakhstan. Finally, temporal associations cannot establish that any program or clinical intervention caused the changes we observed.
5. Conclusions
Between 2016 and 2025, infant mortality at this tertiary perinatal center in Turkistan declined, and perinatal mortality and stillbirth were lower in 2025 than in 2016, although their decade-wide trends were not significant. Preterm and ELBW infants made up small proportions of births but accounted for two-thirds of stillbirths and about half of deaths before one year. Recorded survival among liveborn infants weighing 500–999 g was higher at the end of the decade, but small numbers, incomplete follow-up of the latest cohort, and incomplete ascertainment of deaths after discharge leave this finding uncertain. These single-center data support risk-stratified planning and standardized mortality audit. They also generate hypotheses that patient-level, intervention-linked studies with linked death records will need to test.
Supplementary Materials
The following supporting information can be downloaded at: https://www.mdpi.com/article/10.3390/ijerph23111374/s1, Table S1: Annual counts, 2016–2025; Table S2: Sensitivity analyses; Table S3: Overlap with the earlier BABIES matrix analysis of the same registry; Table S4: STROBE/RECORD checklist.
Author Contributions
Conceptualization, A.A. (Ardak Ayazbekov), S.K. and M.N.; methodology, S.K., A.M. (Aizhan Moldakaryzova) and M.K.; formal analysis, S.K. and M.K.; investigation, A.A. (Aliya Aubakirova), N.S., G.A., A.B. and L.U.; data curation, A.A. (Aliya Aubakirova), M.N. and R.A.; validation, A.M. (Aigul Mustafaeva), A.N. and G.T.; visualization, Z.K. and K.N.; writing—original draft preparation, S.K., A.A. (Aliya Aubakirova) and N.S.; writing—review and editing, A.A. (Ardak Ayazbekov), A.M. (Aizhan Moldakaryzova), M.K., G.A. and L.U.; supervision, A.A. (Ardak Ayazbekov) and A.M. (Aizhan Moldakaryzova); project administration, A.A. (Aliya Aubakirova) and N.S. All authors have read and agreed to the published version of the manuscript.
Funding
This research received no external funding.
Institutional Review Board Statement
The study was conducted in accordance with the Declaration of Helsinki and approved by the Local Bioethics Commission of the Public Association “Academy of Preventive Medicine”, Almaty, Kazakhstan (meeting of 21 May 2025; the Commission does not assign protocol numbers; GCP certification No. XIII-R).
Informed Consent Statement
Not applicable. The study used only retrospective, de-identified aggregate counts and involved no contact with patients and no access to individual records.
Data Availability Statement
The annual aggregate data supporting the findings are presented in this article and in Supplementary Table S1. Further de-identified institutional data are available from the corresponding authors on reasonable request, with the permission of Regional Perinatal Center No. 3, Turkistan.
Acknowledgments
We thank the medical statistics staff of Regional Perinatal Center No. 3, Turkistan, who compiled the annual registry tables, and the center’s obstetric and neonatal teams, whose routine records made this analysis possible.
Conflicts of Interest
The authors declare no conflicts of interest. The funder had no role in the design of the study; in the collection, analysis or interpretation of data; in the writing of the manuscript; or in the decision to publish the results.
References
- World Health Organization. Improving Maternal and Newborn Health and Survival and Reducing Stillbirth: Progress Report 2023; World Health Organization: Geneva, Switzerland, 2023. [Google Scholar]
- United Nations Inter-Agency Group for Child Mortality Estimation. Levels and Trends in Child Mortality 2024; UNICEF: New York, NY, USA, 2025. [Google Scholar]
- United Nations. Transforming Our World: The 2030 Agenda for Sustainable Development; United Nations: New York, NY, USA, 2015. [Google Scholar]
- Ohuma, E.O.; Moller, A.B.; Bradley, E.; Chakwera, S.; Hussain-Alkhateeb, L.; Lewin, A.; Okwaraji, Y.B.; Mahanani, W.R.; Johansson, E.W.; Lavin, T.; et al. National, regional, and global estimates of preterm birth in 2020, with trends from 2010: A systematic analysis. Lancet 2023, 402, 1261–1271. [Google Scholar] [CrossRef] [Scilit] [PubMed]
- Okwaraji, Y.B.; Krasevec, J.; Bradley, E.; Conkle, J.; Stevens, G.A.; Gatica-Domínguez, G.; Ohuma, E.O.; Coffey, C.; Fernandez, D.G.E.; Blencowe, H.; et al. National, regional, and global estimates of low birthweight in 2020, with trends from 2000: A systematic analysis. Lancet 2024, 403, 1071–1080. [Google Scholar] [CrossRef] [Scilit] [PubMed]
- Blencowe, H.; Krasevec, J.; de Onis, M.; Black, R.E.; An, X.; Stevens, G.A.; Borghi, E.; Hayashi, C.; Estevez, D.; Cegolon, L.; et al. National, regional, and worldwide estimates of low birthweight in 2015, with trends from 2000: A systematic analysis. Lancet Glob. Health 2019, 7, e849–e860. [Google Scholar] [CrossRef] [Scilit] [PubMed]
- Lawn, J.E.; Ohuma, E.O.; Bradley, E.; Idueta, L.S.; Hazel, E.; Okwaraji, Y.B.; Erchick, D.J.; Yargawa, J.; Katz, J.; Lee, A.C.C.; et al. Small babies, big risks: Global estimates of prevalence and mortality for vulnerable newborns to accelerate change and improve counting. Lancet 2023, 401, 1707–1719. [Google Scholar] [CrossRef] [Scilit] [PubMed]
- World Health Organization. WHO Recommendations for Care of the Preterm or Low-Birth-Weight Infant; World Health Organization: Geneva, Switzerland, 2022. [Google Scholar]
- Hug, L.; You, D.; Blencowe, H.; Mishra, A.; Wang, Z.; Fix, M.J.; Wakefield, J.; Moran, A.C.; Gaigbe-Togbe, V.; Suzuki, E.; et al. Global, regional, and national estimates and trends in stillbirths from 2000 to 2019: A systematic assessment. Lancet 2021, 398, 772–785. [Google Scholar] [CrossRef] [Scilit] [PubMed]
- Blencowe, H.; Cousens, S.; Jassir, F.B.; Say, L.; Chou, D.; Mathers, C.; Hogan, D.; Shiekh, S.; Qureshi, Z.U.; You, D.; et al. National, regional, and worldwide estimates of stillbirth rates in 2015, with trends from 2000: A systematic analysis. Lancet Glob. Health 2016, 4, e98–e108. [Google Scholar] [CrossRef] [Scilit] [PubMed]
- World Health Organization. Making Every Baby Count: Audit and Review of Stillbirths and Neonatal Deaths; World Health Organization: Geneva, Switzerland, 2016. [Google Scholar]
- Stoll, B.J.; Hansen, N.I.; Bell, E.F.; Walsh, M.C.; Carlo, W.A.; Shankaran, S.; Laptook, A.R.; Sánchez, P.J.; Van Meurs, K.P.; Wyckoff, M.; et al. Trends in care practices, morbidity, and mortality of extremely preterm neonates, 1993–2012. JAMA 2015, 314, 1039–1051. [Google Scholar] [CrossRef] [Scilit] [PubMed]
- Bell, E.F.; Hintz, S.R.; Hansen, N.I.; Bann, C.M.; Wyckoff, M.H.; DeMauro, S.B.; Walsh, M.C.; Vohr, B.R.; Stoll, B.J.; Carlo, W.A.; et al. Mortality, in-hospital morbidity, care practices, and 2-year outcomes for extremely preterm infants in the US, 2013–2018. JAMA 2022, 327, 248–263. [Google Scholar] [CrossRef] [Scilit] [PubMed]
- Norman, M.; Hallberg, B.; Abrahamsson, T.; Björklund, L.J.; Domellöf, M.; Farooqi, A.; Bruun, C.F.; Gadsbøll, C.; Hellström-Westas, L.; Ingemansson, F.; et al. Association between year of birth and 1-year survival among extremely preterm infants in Sweden during 2004–2007 and 2014–2016. JAMA 2019, 321, 1188–1199. [Google Scholar] [CrossRef] [Scilit] [PubMed]
- Rysavy, M.A.; Li, L.; Bell, E.F.; Das, A.; Hintz, S.R.; Stoll, B.J.; Vohr, B.R.; Carlo, W.A.; Shankaran, S.; Walsh, M.C.; et al. Between-hospital variation in treatment and outcomes in extremely preterm infants. N. Engl. J. Med. 2015, 372, 1801–1811. [Google Scholar] [CrossRef] [Scilit] [PubMed]
- Younge, N.; Goldstein, R.F.; Bann, C.M.; Hintz, S.R.; Patel, R.M.; Smith, P.B.; Bell, E.F.; Rysavy, M.A.; Duncan, A.F.; Vohr, B.R.; et al. Survival and neurodevelopmental outcomes among periviable infants. N. Engl. J. Med. 2017, 376, 617–628. [Google Scholar] [CrossRef] [Scilit]
- Lee, S.K.; Beltempo, M.; McMillan, D.D.; Seshia, M.; Singhal, N.; Dow, K.; Aziz, K.; Piedboeuf, B.; Shah, P.S. Outcomes and care practices for preterm infants born at less than 33 weeks’ gestation: A quality-improvement study. Can. Med. Assoc. J. 2020, 192, E81–E91. [Google Scholar] [CrossRef] [Scilit] [PubMed]
- Zayegh, A.M.; Doyle, L.W.; Boland, R.A.; Mainzer, R.; Spittle, A.J.; Roberts, G.; Hickey, L.M.; Anderson, P.J.; Cheong, J.L.Y.; the Victorian Infant Collaborative Study Group. Trends in survival, perinatal morbidities and two-year neurodevelopmental outcomes in extremely low-birthweight infants over four decades. Paediatr. Perinat. Epidemiol. 2022, 36, 594–602. [Google Scholar] [CrossRef] [Scilit] [PubMed]
- UNICEF Kazakhstan. Situation Analysis of Children and Adolescents in Kazakhstan: 2024; UNICEF Kazakhstan: Astana, Kazakhstan, 2025. [Google Scholar]
- Marat, A.; Khamidullina, Z.; Muratbekova, S.; Jaxalykova, K.; Karin, B.; Samatova, N.; Usmanova, U.; Sharipova, M.; Kobetayeva, A.; Terzic, M.; et al. Confidential audit of perinatal mortality in the Republic of Kazakhstan: A pilot study. Med. Sci. 2025, 13, 77. [Google Scholar] [CrossRef] [Scilit] [PubMed]
- Ayazbekov, A.; Khaidarov, S.; Nartayeva, M.; Israilova, V.; Arginbekova, A.; Aubakirova, A.; Galiyeva, Z.; Meirmanova, A.; Rapilbekova, G.; Seisembekov, D. Eleven-Year Trends in Stillbirth, Neonatal and Infant Mortality and Birthweight-Specific Risk: A BABIES Matrix Analysis from a Tertiary Maternity Center in Kazakhstan, 2015–2025. Children 2026, 13, 1284. [Google Scholar] [CrossRef] [Scilit] [PubMed]
- von Elm, E.; Altman, D.G.; Egger, M.; Pocock, S.J.; Gotzsche, P.C.; Vandenbroucke, J.P. The Strengthening the Reporting of Observational Studies in Epidemiology (STROBE) statement: Guidelines for reporting observational studies. Ann. Intern. Med. 2007, 147, 573–577. [Google Scholar] [CrossRef] [Scilit] [PubMed]
- Benchimol, E.I.; Smeeth, L.; Guttmann, A.; Harron, K.; Moher, D.; Petersen, I.; Sørensen, H.T.; Von Elm, E.; Langan, S.M. The REporting of studies Conducted using Observational Routinely-collected health Data (RECORD) statement. PLoS Med. 2015, 12, e1001885. [Google Scholar] [CrossRef] [Scilit] [PubMed]
- Chmielewska, B.; Barratt, I.; Townsend, R.; Kalafat, E.; van der Meulen, J.; Gurol-Urganci, I.; O’Brien, P.; Morris, E.; Draycott, T.; Thangaratinam, S.; et al. Effects of the COVID-19 pandemic on maternal and perinatal outcomes: A systematic review and meta-analysis. Lancet Glob. Health 2021, 9, e759–e772. [Google Scholar] [CrossRef] [Scilit]
- Yılmaz, S.; Çelik, Y. Evaluating health financing typologies through healthy life expectancy and infant mortality: Evidence from OECD countries and Türkiye. Healthcare 2025, 13, 3149. [Google Scholar] [CrossRef] [Scilit]

Disclaimer/Publisher’s Note: The statements, opinions and data contained in all publications are solely those of the individual author(s) and contributor(s) and not of MDPI and/or the editor(s). MDPI and/or the editor(s) disclaim responsibility for any injury to people or property resulting from any ideas, methods, instructions or products referred to in the content. |
© 2026 by the authors. Licensee MDPI, Basel, Switzerland. This article is an open access article distributed under the terms and conditions of the Creative Commons Attribution (CC BY) license.