


Highlights
Public health relevance—How does this work relate to a public health issue?
- Childhood chronic conditions require sustained family management, making culturally appropriate measurement relevant to family-centered pediatric care.
- The Thai FaMM was adapted to examine family management among primary caregivers, including parents and other family members.
Public health significance—Why is this work of significance to public health?
- The findings provide preliminary, scale-specific measurement evidence, with limitations in several items and dimensions.
- Additional ordinal-data analyses did not uniformly corroborate the original dimensional structures, supporting further evaluation.
Public health implications—What are the key implications or messages for practitioners, policy makers and/or researchers in public health?
- Responses may inform discussion with caregivers, but clinical screening, intervention selection, and separate dimensional scoring require further validation.
- Condition Management Effort requires refinement, and measurement equivalence across caregiving and cultural contexts remains unestablished.
Abstract
The Family Management Measure (FaMM) assesses family management of childhood chronic conditions, but evidence on its measurement properties in Thailand is limited. This methodological study translated, culturally adapted, and evaluated the Thai FaMM among 350 primary family caregivers. Translation followed International Society for Pharmacoeconomics and Outcomes Research Task Force guidelines; psychometric evaluation followed the Consensus-based Standards for the Selection of Health Measurement Instruments framework. Independent exploratory and confirmatory subsamples comprised 150 and 200 caregivers. Child’s Daily Life was unidimensional after post hoc residual-covariance respecification. Multidimensional first-order models of Condition Management Ability, Family Life Difficulty, View of Condition Impact, and Parental (Caregiver) Mutuality fitted better than one-factor alternatives; second-order models did not improve fit. Internal consistency varied across scales and dimensions; nine items across these five scales had corrected item–total correlations below 0.30. Reported scale-level test–retest intraclass correlations ranged from 0.92 to 1.00. Condition Management Effort had low internal consistency (Cronbach’s α = 0.28), failed original exploratory extraction, and an inadmissible confirmatory solution. These preliminary, scale-specific findings require further validation before separating dimensional scoring or clinical use.
1. Introduction
An estimated 10–30% of children and adolescents live with long-term conditions that require ongoing management to maintain health, prevent disease progression, and optimize quality of life [1]. Similar epidemiological trends in Thailand have intensified demands on pediatric healthcare and family support systems [2]. Children with chronic conditions commonly experience physical limitations alongside emotional and behavioral challenges, including anxiety, depression, social isolation, irritability, and difficulties with attention, which are often associated with symptom burden, treatment demands, and disruptions in normal developmental experiences [3,4,5,6,7,8]. Because these challenges frequently exceed children’s developmental capacity for independent illness management, families assume primary responsibility for integrating treatment into everyday life. Management therefore depends on clinical care and how families perceive, organize, and sustain condition management in daily routines [9,10].
Family-centered pediatric nursing recognizes the family as the primary caregiving context [11,12]. Effective family management is associated with child health, psychosocial well-being, treatment adherence, and healthcare utilization [13]. Valid measurement can inform support needs, individualized interventions, and evaluation of change. Instruments must account for cultural differences in family roles, beliefs, and caregiving practices. This study therefore adapted and evaluated the Thai Family Management Measure (FaMM), examining how the Family Management Style Framework’s constructs were represented in this context.
Background and Theoretical Basis
The Family Management Style Framework explains how families define, organize, and respond to childhood chronic illness [14]. The framework conceptualizes family management through three interrelated components: family definition of the situation, encompassing perceptions of the child’s condition, the child’s identity, and family views of illness management; management behaviors, referring to the strategies and routines families employ in everyday care; and perceived consequences, representing families’ evaluations of the effects of the condition on the child and family life [15,16]. These components conceptualize family management as a dynamic, context-dependent process that extends beyond caregiver burden or family functioning to capture how families integrate chronic illness into daily life [17].
The FaMM operationalizes the Family Management Style Framework through six empirically derived scales: Condition Management Ability, Condition Management Effort, Family Life Difficulty, View of Condition Impact, Child’s Daily Life, and Parental Mutuality [18]. Together, they represent the framework’s three components [17]. The ease-oriented scales—Child’s Daily Life, Condition Management Ability, and Parental Mutuality—address adaptive processes and strengths. The difficulty-oriented scales—Condition Management Effort, Family Life Difficulty, and View of Condition Impact—address management challenges. These complementary orientations support assessment of family capacities and strain [13].
Although the FaMM has demonstrated satisfactory psychometric performance across Western and selected non-Western populations [13], no validated Thai-language version is currently available. This gap matters because family-centered care has become increasingly integrated into Thai pediatric nursing education, practice, and research [19]. Thai families are characterized by collectivist values, multigenerational caregiving, hierarchical family relationships, and strong cultural expectations regarding family obligation and harmony [20]. These characteristics may influence how families perceive childhood illness, organize caregiving responsibilities, and evaluate the consequences of chronic illness. Consequently, linguistic translation alone cannot ensure conceptual and measurement equivalence, making rigorous cross-cultural adaptation essential to preserve the theoretical meaning of the Family Management Style Framework constructs and ensure valid assessment within the Thai context [13,15,18,21]. Evidence remains limited on whether its underlying latent constructs are represented consistently across different sociocultural settings. Cross-cultural evaluation can examine linguistic and conceptual correspondence and how family management constructs are operationalized across settings.
Structural validity informs interpretation of reliability because dimensionality determines how scores represent the intended constructs. The original FaMM development study identified six scales through EFA [18], but comprehensive evaluations across all six scales in other cultural settings remain limited [13]. Whether these structures are retained after translation therefore requires evaluation. Previous studies have predominantly used Cronbach’s α [13], although its interpretation can be affected by multidimensionality and violations of its assumptions [22]. Complementary coefficients, including McDonald’s ω, should be interpreted alongside the measurement structure [22,23,24]. Reporting additional coefficients does not itself compensate for weak factors or establish that overall and dimensional scores are equally defensible.
This study translated, culturally adapted, and evaluated selected measurement properties of the Thai FaMM among primary family caregivers. Structural validity preceded interpretation of internal consistency; test–retest reliability was assessed separately. Agreement between administrations by different research assistants was a supplementary procedural assessment. The study examined construct representation in this sample, without establishing equivalence across cultural or caregiving groups.
2. Materials and Methods
2.1. Study Design
This methodological study comprised translation and cultural adaptation followed by psychometric evaluation, using a cross-sectional design with repeated measures for reliability assessment. The consensus-based standards for the selection of health measurement instruments (COSMIN) framework guided evaluation of structural validity, internal consistency, and test–retest reliability [25]. Reliability was interpreted alongside structural validity and item and dimensional limitations. Agreement between administrations by different research assistants was a supplementary procedural assessment. Construct validity hypothesis testing, measurement invariance, measurement error, responsiveness, and scale-level floor and ceiling effects were not evaluated; item response distributions were examined.
- Phase 1: Translation and cross-cultural adaptation of the Family Management Measure
2.2. Instrument
Family Management Measure
The FaMM is a 53-item self-report instrument assessing integration of childhood condition management into family life [18], with six separately scored scales based on the Family Management Style Framework [17]. Originally, all parents complete 45 items, and those living with an adult partner complete eight additional Parental Mutuality items. This study included parents and other relatives (e.g., grandparents or older siblings) responsible for daily care. “Partner” references encompassed identified family co-caregivers. Primary caregivers completed all 53 items, reporting their own perceptions of collaboration with the identified co-caregiver.
The scales contain 5 Child’s Daily Life, 12 Condition Management Ability, 4 Condition Management Effort, 14 Family Life Difficulty, 10 View of Condition Impact, and 8 Parental Mutuality items. Responses range from 1 (strongly disagree) to 5 (strongly agree). Original item-to-scale assignments and designated reverse scoring were retained. Each scale is scored independently, with higher scores reflecting its intended direction; no global FaMM score was calculated.
Throughout this report, the ease-oriented scales (Child’s Daily Life, Condition Management Ability, and Parental Mutuality) indicate adaptive management and strengths at higher scores. Higher scores on the difficulty-oriented scales (Condition Management Effort, Family Life Difficulty, and View of Condition Impact) indicate greater management challenges.
Previous studies reported Cronbach’s α of 0.51–0.91, test–retest reliability of 0.71–0.94, and expected relationships with family functioning, child behavior, and functional status supporting construct validity [13,18].
2.3. Translation and Cross-Cultural Adaptation Process
Translation and cross-cultural adaptation followed the International Society for Pharmacoeconomics and Outcomes Research (ISPOR) Task Force guidelines [26]. The process was coordinated by the co-principal investigator (J.S.), and involved by a multidisciplinary panel comprising five clinical and methodological experts and two bilingual linguistic experts. The panel’s expertise included pediatric nursing, family-centered care, chronic illness, and psychometric evaluation. The process included preparation, forward translation, reconciliation, back translation, back-translation review, harmonization, cognitive debriefing, finalization, and documentation. Throughout the process, the aim was to preserve the conceptual meaning of the Family Management Style Framework while supporting semantic, experiential, and conceptual correspondence and cultural appropriateness.
Fourteen items across five FaMM scales were culturally adapted to improve conceptual equivalence while preserving the underlying constructs. Changes addressed semantic clarity, caregiving terminology, and culturally appropriate expressions. Item 7’s “roller coaster” metaphor became “ups and downs like a boat riding the wave” to convey fluctuations in the child’s condition. “Partner” references were broadened to reflect extended-family caregiving in Thailand. Table S3 documents changes in emphasis and implications for conceptual correspondence, plus wording checks for items 13 and 32 that were not counted as substantive adaptations.
Translation-stage cognitive debriefing involved face-to-face interviews with 10 caregivers: three caring for children with cardiovascular and seven with non-cardiovascular conditions. Caregivers completed the pre-final version using think-aloud methods; probes addressed meaning, relevance, the metaphor, instructions, and response options. Feedback informed minor wording changes and provided qualitative evidence of comprehensibility. This activity preceded and was distinct from pilot testing. Tables S1–S3 detail the adaptation procedures.
2.4. Content Validity
Content validity of the translated Thai FaMM was evaluated by an independent panel comprising two family nursing researchers and three pediatric nurse specialists. Each translated item was rated using four-point ordinal scales for relevance (1 = not relevant; 4 = very relevant), clarity (1 = not clear; 4 = very clear), simplicity (1 = not simple; 4 = very simple), and absence of ambiguity (1 = doubtful meaning; 4 = clear meaning) [27]. Higher ratings indicated more favorable evaluations for all criteria; the ambiguity criterion therefore did not require reverse coding. Item-level content validity indices (I-CVIs) were calculated as the proportion of experts providing favorable ratings for each criterion. Criterion-specific scale-level indices (S-CVI/Ave) were calculated by averaging the corresponding I-CVIs within each FaMM scale [28]. Item-level content validity indices ranged from 0.80 to 1.00, and criterion-specific S-CVI/Ave values ranged from 0.95 to 1.00. Descriptive averages across the four criteria ranged from 0.96 to 1.00. These averages were not modified kappa coefficients. Detailed results are presented in Table S4.
- Phase 2: Psychometric evaluation of the Family Management Measure
2.5. Participants and Setting
Participants were primary family caregivers of children aged 3 months to 12 years with physician-diagnosed chronic conditions. Eligible caregivers (1) assumed primary responsibility for the child’s daily care and condition management, (2) were actively involved in caregiving, (3) resided with the child, and (4) were aged 18 years or older. Children’s diagnoses included congenital heart disease, diabetes, obesity, thalassemia, asthma, epilepsy, chronic kidney disease, cancer, and other chronic conditions. Each primary caregiver identified one co-caregiver who also participated in the child’s care. Paid caregivers were excluded.
Participants were recruited using convenience sampling from the pediatric inpatient and outpatient units of one tertiary teaching hospital and one general hospital in southern Thailand. Eligible caregivers were approached during inpatient admissions or routine outpatient visits. Only one primary caregiver was enrolled for each child. Primary caregivers completed all 53 items, including the eight Parental (Caregiver) Mutuality items. For these eight items, respondents reported their own perceptions of their relationship with the identified co-caregiver.
The research protocol specified an a priori recruitment target of 530 caregivers, corresponding to 10 participants per item for the 53-item FaMM. This planning approach was informed by published sample-size guidance for factor analysis [29]. Recruitment yielded 373 caregivers, below the planned target. Following the exclusion of 23 observations identified through multivariate outlier screening, the final analytic sample comprised 350 caregivers, allocated to independent exploratory (n = 150) and confirmatory (n = 200) subsamples. Sample-size adequacy was considered separately for each analysis in relation to model complexity, communalities, and the number of indicators per factor, rather than inferred solely from the combined sample size or participant-to-item ratio [30]. The smaller-than-planned sample, particularly the exploratory subsample and low communalities of several items, warranted caution when interpreting structural stability.
2.6. Data Collection Procedures
2.6.1. Research Assistant Training
Two registered nurses experienced in pediatric and family-centered care completed training in study procedures, FaMM theory, ethics, and standardized administration, including competency-based role-play. Agreement between their repeated questionnaire administrations was subsequently examined as a supplementary procedural assessment.
2.6.2. Pilot Testing
The translated FaMM was pilot tested with 20 caregivers (5 cardiovascular and 15 non-cardiovascular cases) for clarity, cultural appropriateness, and feasibility. Questionnaire completion was followed by structured cognitive debriefing, distinct from translation-stage interviews. No substantive concerns required modification. The questionnaire remained unchanged, and pilot participants were retained in the final sample.
2.6.3. Main Data Collection
Between November 2024 and June 2025, consenting caregivers completed paper questionnaires during hospitalization or outpatient visits. Standardized forms recorded demographic and clinical information. Each primary caregiver completed all 53 FaMM items, including Mutuality items referring to the identified co-caregiver.
A randomly selected subsample of 60 caregivers repeated the questionnaire after two weeks for a test–retest assessment. In a separate random subsample of 40, each caregiver completed it under the supervision of two research assistants no more than 30 min apart. This was a supplementary procedural assessment, not evidence of interobserver reliability of the self-report instrument.
2.7. Statistical Analysis
SPSS Statistics 26.0 supported descriptive analyses and original EFA; AMOS 24.0 supported CFA. Additional ordinal-data EFA during revision used Python (version 3.12.13), as specified below. Descriptive statistics summarized participant characteristics and item distributions.
Squared Mahalanobis distances across 53 items screened the original 373 observations. Values exceeding 90.573 (df = 53, p < 0.001) identified potential multivariate outliers [31]. Excluding 23 observations (6.2%) left 350 cases, with no missing analysis data. Exclusion aimed to limit unusual response patterns’ influence on conventional maximum likelihood analyses but did not establish erroneous responses. Mahalanobis distance itself is outlier-sensitive because it uses the sample mean and covariance matrix [32]. A computer-generated sequence assigned participants to nonoverlapping exploratory (n = 150) and confirmatory (n = 200) subsamples, allowing evaluation of structures in participants not involved in extraction. Reported item skewness and kurtosis were below 3.0 and 10.0, respectively [33]. These univariate checks did not establish multivariate normality.
Original scale-specific EFA used maximum likelihood extraction based on Pearson correlations. Maximum likelihood was selected because initial univariate screening suggested approximate normality; this method permits model-fit evaluation and statistical inference when its distributional assumptions are adequately met [34]. Promax oblique rotation was applied to multifactor solutions because the underlying dimensions were expected to correlate [35]. Sampling adequacy and factorability were assessed using the Kaiser–Meyer–Olkin statistic, with ≥0.60 as the adopted criterion, and Bartlett’s test of sphericity [35,36]. Factor retention was guided by examination of eigenvalues and visual inspection of the scree plot. KMO and Bartlett’s test assessed factorability and did not determine the number of factors retained. In the original analyses, extracted communalities (h2) represented the proportion of item variance accounted for by the retained factors, with values ≥ 0.40 considered acceptable for item representation. Values below 0.40 indicated a need for further evaluation rather than automatic exclusion [35].
Revision-stage exploratory analyses used the original exploratory subsample (n = 150), with each FaMM scale analyzed separately. Existing reverse scoring was retained. Two-step polychoric correlations were estimated from ordinal responses using empirical marginal thresholds [37]. Unobserved response categories were omitted from threshold estimation without merging observed categories. Principal axis factoring used squared multiple correlations as initial communalities and Promax oblique rotation for multifactor solutions. Factor retention was evaluated using permutation parallel analysis. A total of 1000 datasets were generated by independently permuting responses within each item, preserving observed response-category frequencies. Observed eigenvalues of the polychoric matrices, with squared multiple correlations on the diagonal, were compared with the corresponding 95th-percentile null eigenvalues. Successive leading eigenvalues exceeding this criterion determined the suggested factor count. Component-based parallel analysis using unit diagonals was also examined to assess sensitivity to the retention procedure.
Parallel-analysis recommendations considered convergence, communalities, loading patterns, factor correlations, and interpretability. No matrix smoothing or continuity correction was applied. Principal axis iterations used a maximum of 10,000 iterations and a maximum absolute communality-change tolerance of 10−7; Promax rotation used a power of 4. The additional analyses used a custom Python implementation (version 3.12.13) with NumPy 2.3.5 and SciPy 1.17.0, with random seed 20260908. Numerical specifications, validation checks, and analysis code are provided in the Supplementary Analysis Materials.
Original ML EFA structures were evaluated using maximum likelihood CFA in the confirmatory subsample (n = 200). Alternative structures suggested by the additional ordinal-data EFA were not evaluated in the confirmatory sample. The original EFA and CFA treated the five-category item responses as approximately continuous. The ordinal response format and observed item skewness were therefore considered limitations when interpreting conventional maximum likelihood estimates and fit statistics [38]. Model fit was evaluated using complementary indices [39,40,41]. Comparative fit index (CFI) and Tucker–Lewis index (TLI) values ≥ 0.90 indicated acceptable fit, and values ≥ 0.95 indicated good fit. Root mean square error of approximation (RMSEA) values ≤ 0.08 indicated acceptable fit, and values ≤ 0.05 indicated good fit; 90% confidence intervals were reported. Standardized root mean square residual (SRMR) values < 0.08 indicated good fit. Thresholds were interpretive guidelines, not absolute rules. The chi-square statistic was reported and interpreted alongside approximate fit indices because of its sensitivity to sample size. Absolute standardized loadings ≥ 0.30 were the minimum acceptable magnitude; direction was evaluated against content and scoring. Lower loadings indicated poor performance even for retained items. Loadings and communalities were interpreted alongside corrected item–total correlations, internal consistency, and content. Retention, acceptable global fit, or overall reliability did not establish item or dimensional scoring adequacy.
Each respecification began with the hypothesized model. All selected residual covariances were then added simultaneously, and the respecified model was estimated once [42]. No further modification rounds followed. These modifications were introduced post hoc, and the hypothesized and respecified models were evaluated in the same confirmatory sample. Improvements in fit were therefore interpreted as within-sample findings requiring independent replication. Second-order CFA examined hierarchical representations of relationships among first-order dimensions [43]. First-order and second-order models were compared descriptively using their fit statistics and degrees of freedom. Identical global fit was not interpreted as independent confirmation of a higher-order structure, and interpretation considered the restrictions imposed by each model specification [44].
Average variance extracted (AVE) was estimated from the final reported first- or second-order CFA models using standardized item loadings for the unidimensional Child’s Daily Life scale and the constituent first-order factors of the multidimensional scales. AVE was not estimated for Condition Management Effort because its CFA solution was inadmissible. AVE was calculated by dividing the sum of squared standardized factor loadings by that sum plus the sum of standardized residual variances. Values ≥ 0.50 were used as an interpretive benchmark for factor-specific AVE, indicating that the corresponding factor accounted for at least half of its indicators’ variance on average [45]. For multidimensional scales, pooled summaries were the item-count-weighted mean of the constituent first-order AVEs. This summary described the average indicator variance accounted for by the first-order factors collectively; it was not interpreted as evidence of unidimensionality, variance attributable exclusively to the higher-order factor, or the adequacy of an overall scale score. Estimates were interpreted alongside structural validity, item performance, and reliability and did not independently establish external construct validity or the adequacy of separate dimensional scores.
Internal consistency was assessed using McDonald’s omega total (ω_total) and Cronbach’s α for scales and applicable dimensions. Omega total estimates the proportion of score variance attributable to all common factors represented in the specified measurement model and accommodates unequal factor loadings [22,23,24]. It was not interpreted as evidence that a higher-order factor alone adequately represented the scale score or that multidimensionality was automatically resolved. Cronbach’s α was interpreted cautiously because its equality to score reliability depends on assumptions including essential tau-equivalence and uncorrelated measurement errors. Essential tau-equivalence requires equal unstandardized loadings on a common factor while allowing item intercepts to differ; this assumption was not established in the present study [46]. Interpretation considered structural validity and item performance. Corrected item–total correlations were examined using ≥0.30 as the study’s criterion for acceptable item discrimination, with lower values indicating items requiring further evaluation [47].
Test–retest reliability was estimated using intraclass correlation coefficients (ICCs) derived from a two-way mixed-effects model with absolute agreement [48]. Agreement between repeated administrations conducted by different research assistants was estimated using a two-way random-effects ICC with absolute agreement and treated as a supplementary procedural assessment. ICCs were reported with 95% confidence intervals. Point estimates were interpreted as poor (<0.50), moderate (0.50 to <0.75), good (0.75 to <0.90), or excellent (≥0.90), with confidence intervals considered when assessing precision [48].
Revision-stage CFA sensitivity analyses evaluated the original unidimensional structures of Condition Management Ability, Parental (Caregiver) Mutuality, Family Life Difficulty, and View of Condition Impact in the confirmatory sample. Each model retained the original scale items, specified a single latent factor, and included no correlated item residuals. All models were estimated using maximum likelihood. Their fit was compared descriptively with that of the corresponding original EFA-derived first-order models before the addition of correlated item residuals. Comparisons focused on CFI, TLI, and RMSEA to distinguish differences associated with dimensionality from those associated with subsequent model respecification. These analyses tested dimensionality, not robustness to ordinal or robust CFA estimation. Sensitivity to the inclusion of the 23 excluded observations was not evaluated.
3. Results
3.1. Participant Characteristics
The 350 primary caregivers were predominantly women (89.1%) and mothers (78.3%); 75.1% were married or partnered. Mean age was 38.8 years and caregiving duration was 4.85 years. Most had at least secondary education, 57.7% reported sufficient income, and 68.0% identified a parent as secondary caregiver (Table 1).
Table 1.
Characteristics of participants (n = 350).
Children’s mean age was 7.8 years; 340 (97.1%) had one chronic condition, and 10 (2.9%) had multiple conditions, reported separately (Table 1). Thalassemia and asthma predominated; 16 children (4.6%) had congenital heart disease within single-condition categories. Each exploratory and confirmatory subsample included five children with multiple conditions (Table S5).
3.2. Item Descriptive Analysis
Item statistics (Tables S6 and S7) and response percentages (Table S8) varied across scales. All ease-oriented items had means above the midpoint (M > 3.00); 22 of 28 difficulty-oriented items were below it (M < 3.00). Thirty-six items (67.9%) had percentages ≥60% in Table S8’s summary column, ranging from 2.6% for Item 8 to 89.1% for Item 25. Interpretation depends on wording and scoring direction; these patterns do not indicate uniformly favorable family management.
3.3. Ease-Oriented Scales’ Structural Validity, Internal Consistency Reliability, and Item Analysis
Figure 1, Figure 2 and Figure 3 show final ease-oriented CFA models derived from original ML EFA. Table 2 reports original/ordinal EFA and final CFA loadings; Table 3 reports CFA fit; Table S6 reports item statistics, corrected item–total correlations, reliability, and AVE. Figure S1 provides additional CFA diagrams (panels S1.1–S1.4).
Figure 1.
Final CFA model of the Child’s Daily Life scale.
Figure 2.
Final CFA model of the Condition Management Ability scale.
Figure 3.
Final CFA model of the Parental (Caregiver) Mutuality scale.
Table 2.
Original maximum likelihood EFA loadings, additional polychoric-based principal axis factor loadings, communalities, and CFA loadings for the ease-oriented Thai Family Management Measure scales.
Table 3.
Fit index values for the Family Management Measure.
3.3.1. Child’s Daily Life Scale
Original ML EFA supported a unidimensional structure for Child’s Daily Life (KMO = 0.73; Bartlett’s χ2 = 168.64, p < 0.001), explaining 38.0% of the total variance, with factor loadings ranging from 0.42 to 0.79. Originally reported communalities were below 0.40 for Items 1, 5, 10, and 16 (Table 2). The hypothesized CFA model showed mixed fit, with TLI and RMSEA outside the prespecified acceptable thresholds. Global fit improved following the post hoc addition of a residual covariance between Items 1 and 10 (Table 3; Figure 1). Standardized loadings in the respecified model ranged from 0.35 to 0.81. Same-sample identification and evaluation leave structural support provisional pending independent replication.
Internal consistency was satisfactory (ω_total = 0.75; α = 0.74), with corrected item–total correlations of 0.38–0.64. AVE was approximately 0.37, below 0.50 (Table S6). Item-deletion checks did not improve internal consistency or establish reduced-item structural validity or content coverage; all five items remained.
3.3.2. Condition Management Ability Scale
Original ML EFA identified three Ability factors (KMO = 0.74; Bartlett’s χ2 = 481.46, p < 0.001), explaining 44.7% of variance; loadings were 0.41–0.98. Originally reported communalities were below 0.40 for Items 15, 17, 18, 34, and 41 (Table 2). The hypothesized first-order TLI fell below the acceptable threshold. Simultaneously adding three post hoc residual covariances yielded a broadly acceptable fit, loadings of 0.32–0.81, and inter-factor correlations of 0.17–0.67 (Figures S1.2 and S1.3).
Second-order fit remained broadly acceptable but slightly poorer than the respecified first-order fit: χ2 increased by 6.36, with degrees of freedom increasing from 48 to 50 (Table 3). Standardized item loadings ranged from 0.36 to 0.79; loadings for the future planning and resources Items 4, 14, and 15 were 0.64, 0.78, and 0.36, respectively (Table 2; Figure 2). Second-order loadings were 0.86, 0.76, and 0.49. Management challenges had the lowest second-order loading (λ = 0.49; R2 = 0.24), indicating that the higher-order factor accounted for approximately 24% of its variance.
Overall reliability was ω_total = 0.74 and α = 0.76. Caregiving efficacy was satisfactory (ω_total = 0.77; α = 0.76); future planning/resources (ω_total = 0.60; α = 0.56) and management challenges (ω_total = 0.68; α = 0.65) were lower. Corresponding AVEs were approximately 0.39, 0.38, and 0.38, all below 0.50; pooled AVE was 0.387 (Table S6). Item 17’s corrected item–total correlation was 0.22. Low AVEs, uneven dimensional reliability, and weak item performance limit separate scoring despite acceptable global fit.
3.3.3. Parental (Caregiver) Mutuality Scale
Original ML EFA identified a two-factor structure for Parental (Caregiver) Mutuality (KMO = 0.84; Bartlett’s χ2 = 570.57, p < 0.001), explaining 57.2% of the variance, with loadings ranging from 0.36 to 0.95. Originally reported communalities were below 0.40 for three items: 46, 47, and 52 (Table 2). The first-order CFA model demonstrated broadly acceptable fit without adding correlated item residuals (Figure S1.4). Standardized loadings ranged from 0.50 to 0.81, and the inter-factor correlation was 0.70. The first-order and second-order representations produced identical fit statistics and degrees of freedom; global fit therefore did not distinguish between them (Table 3). Second-order loadings were 0.96 and 0.73 (Figure 3). The loading for caregiving teamwork approached unity (λ = 0.96; reported R2 = 0.93), indicating that approximately 93% of its variance was attributed to the higher-order factor under this model specification.
Reliability was satisfactory overall (ω_total = 0.84; α = 0.84), for teamwork (ω_total = 0.81; α = 0.81), and for concordance (ω_total = 0.75; α = 0.74). Corrected item–total correlations were 0.39–0.69. AVEs were approximately 0.47 and 0.52, respectively; only concordance met 0.50. Pooled AVE was 0.496 (Table S6). Variance explained differed despite satisfactory reliability, and identical fit did not favor a hierarchy.
3.4. Difficulty-Oriented Scales’ Structural Validity, Internal Consistency Reliability, and Item Analysis
Figure 4 and Figure 5 show final Difficulty and Impact CFA models derived from original ML EFA. Table 3 reports CFA fit; Table 4 reports original/ordinal EFA and interpretable CFA loadings; Table S7 reports item statistics, corrected item–total correlations, reliability, and AVE. Effort had no interpretable CFA solution. Figure S2 provides additional diagrams (panels S2.1–S2.3).
Figure 4.
Final CFA model of the Family Life Difficulty scale.
Figure 5.
Final CFA model of the View of Condition Impact scale.
Table 4.
Original maximum likelihood EFA loadings, additional polychoric-based principal axis factor loadings, communalities, and CFA loadings for the difficulty-oriented Thai Family Management Measure scales.
3.4.1. Family Life Difficulty Scale
Original ML EFA identified a three-factor structure for Family Life Difficulty (KMO = 0.86; Bartlett’s χ2 = 666.72, p < 0.001), explaining 43.4% of the variance. Loadings ranged from 0.21 to 0.81; Item 36 loaded at 0.31, whereas Item 44 loaded at 0.21, below the prespecified 0.30 criterion. Originally reported communalities were below 0.40 for five items: 23, 33, 36, 39, and 44 (Table 4). The hypothesized first-order CFA model had a TLI slightly below the acceptable threshold. Following the simultaneous post hoc addition of two residual covariances, the respecified model demonstrated broadly acceptable fit, with inter-factor correlations ranging from 0.45 to 0.73.
Second-order fit remained broadly acceptable, although χ2 increased by 5.76 and degrees of freedom increased from 72 to 74 relative to the respecified first-order model (Table 3). Second-order loadings were 0.79, 0.87, and 0.67. Most standardized item loadings ranged from 0.50 to 0.74; however, Item 36 loaded at 0.23, and Item 44 had an essentially null loading of −0.03 (Table 4; Figure 4).
Overall internal consistency was satisfactory (McDonald’s ω_total = 0.82; Cronbach’s α = 0.81). Dimensional estimates were satisfactory for family life disruption (ω_total = 0.83; α = 0.83), lower for emotional life difficulty (ω_total = 0.68; α = 0.67), and poor for normalcy of family life (ω_total = 0.38; α = 0.25). Corresponding AVE estimates were approximately 0.40, 0.43, and 0.27, all below the 0.50 benchmark. The descriptive pooled scale-level value was 0.38 (Table S7). Corrected item–total correlations were below 0.30 for Items 23, 36, 38, and 44, including a near-zero negative correlation for Item 44 (−0.01). Overall fit and reliability did not extend uniformly to items and dimensions. The low AVE, poor reliability, and weak item performance of the normalcy dimension did not support its separate scoring.
3.4.2. Condition Management Effort Scale
Effort showed substantial limitations. KMO was below criterion (0.55), although Bartlett’s test was significant (χ2 = 22.30, p = 0.001). Two-factor ML extraction stopped because the Hessian was not positive definite. Original communalities of 0.03–0.10 were initial, not extracted, estimates (Table 4). One-factor CFA was also inadmissible, including a negative Item 35 residual variance. Neither ML EFA nor CFA loadings were interpreted, and AVE was withheld. Software-reported CFA fit appears in Table 3 for transparency.
Internal consistency was low (α = 0.28). Only Item 3 met corrected item–total correlation ≥0.30 (0.33); Items 7, 12, and 35 had 0.29, 0.06, and −0.12 (Table S7). Additional ordinal EFA converged but retained weak items (Section 3.5). These findings did not support the Effort score interpretation.
3.4.3. View of Condition Impact Scale
Original ML EFA identified long-term life difficulty and condition manageability (KMO = 0.73; Bartlett’s χ2 = 234.86, p < 0.001), explaining 31.6% of variance. Loadings were 0.13–0.73, with Items 21 and 32 below 0.30. Only Items 29, 30, and 40 had originally reported communalities ≥0.40 (Table 4).
First-order CFA fit was broadly acceptable without residual covariances; the factor correlation was 0.46. First- and second-order fit and df were identical (Table 3, models F1 and F2). Second-order item loadings were mostly 0.42–0.75, but Items 8, 21, and 32 loaded at 0.25, 0.16, and 0.18. Higher-order loadings were 0.63 and 0.72 (Table 4; Figure 5).
Overall reliability was modest (ω_total = 0.66; α = 0.60), with ω_total = 0.69 and α = 0.67 for long-term difficulty and ω_total = 0.43 and α = 0.14 for manageability. Corresponding AVEs were approximately 0.29 and 0.21, below 0.50; the pooled AVE was 0.26 (Table S7). Items 8, 21, 32, and 40 had corrected item–total correlations below 0.30. Deletion marginally improved internal consistency, but manageability remained unsatisfactory. These checks did not establish reduced-item structural validity or content coverage. Low AVE, reliability, and item performance did not support separate manageability scoring.
3.5. Additional Ordinal-Data Exploratory Analyses
All six polychoric matrices were positive definite without smoothing. Common-factor parallel analysis suggested two Child’s Daily Life, three Ability, one Effort, and two each Difficulty, Mutuality, and Impact factors (Table 5). Two-factor Child’s Daily Life did not converge and produced an improper communality; three-factor Ability was improper (Item 14 h2 = 1.09). One-factor Child’s Daily Life and two-factor Ability alternatives were admissible.
Table 5.
Factor-retention recommendations and solution diagnostics from additional ordinal-data exploratory analyses of the Thai Family Management Measure.
Component parallel analysis suggested one Child’s Daily Life and Mutuality component and two Ability components, indicating retention sensitivity. Both procedures suggested two Difficulty dimensions instead of the original three. Table S9 reports parallel-analysis eigenvalues; Table S10 reports pattern loadings, communalities, factor correlations, and alternative solutions. Ordinal communalities below 0.40 occurred for Child’s Daily Life Items 1 and 10 (0.24, 0.36); Ability Items 4 (0.32), 15 (0.24), 17 (0.29), 18 (0.34), 34 (0.30), and 41 (0.33); and Mutuality Items 46 and 47 (0.36, 0.37).
Effort’s one-factor loadings were 0.67, 0.45, −0.18, and 0.29 for Items 3, 7, 12, and 35; communalities for Items 7, 12, and 35 were below 0.40 (0.21, 0.03, 0.08). Difficulty Items 2, 36, and 44 had communalities of 0.25, 0.16, and 0.07; Items 36 and 44 also had absolute pattern loadings below 0.30 on both factors. Impact Items 8, 21, 24, and 32 had communalities of 0.39, 0.09, 0.33, and 0.02; Items 21 and 32 had absolute loadings below 0.30 on both factors.
Ordinal analyses did not uniformly corroborate original structures. Retaining low-communality items did not establish adequacy. Section 3.3 and Section 3.4 report CFA of original-analysis models; ordinal-EFA alternatives were not evaluated in the confirmatory sample.
3.6. Test–Retest Reliability
Test–retest ICCs (n = 60) were 0.92 (95% CI = 0.85–0.95) for Mutuality, 0.98 (95% CI = 0.97–0.99) for Child’s Daily Life, and 1.00 (95% CI = 1.00–1.00) for Ability, Difficulty, Effort, and Impact (Table S4).
3.7. Agreement Between Repeated Administrations
In the separate subsample (n = 40), reported ICCs were 1.00 across items and scales administered by different assistants. These short-interval estimates describe procedural agreement, not independent evidence of FaMM interobserver reliability.
3.8. Sensitivity Analyses
Original one-factor Ability, Mutuality, Difficulty, and Impact models did not meet acceptable global-fit criteria (Figure S3, panels S3.1–S3.4). All had lower CFI/TLI and higher RMSEA than EFA-derived first-order alternatives without residual covariances. Comparisons favored multidimensionality in this sample but did not distinguish first- and second-order representations or resolve item and reliability limitations.
3.9. Overall Psychometric Performance
Performance varied across scales (Table 6). Respecified unidimensional Child’s Daily Life had satisfactory internal consistency and item–total correlations. Multidimensional Ability, Mutuality, Difficulty, and Impact models showed broadly acceptable fit and outperformed one-factor alternatives. Reliability and item performance remained limited, particularly for future planning/resources, management challenges, normalcy, and manageability.
Table 6.
Measurement models, psychometric findings, and implications of the Thai Family Management Measure.
Nine items across these five scales had corrected item–total correlations below 0.30: one Ability, four Difficulty, and four Impact items. All Child’s Daily Life and Mutuality items met the criterion (Tables S6 and S7).
Second-order models did not improve fit: Mutuality and Impact had identical fit, while Ability and Difficulty had slightly poorer fit with two additional df. Hierarchical superiority was therefore unestablished. Effort had inadequate structural validity and internal consistency.
4. Discussion
The culturally adapted Thai FaMM showed preliminary, scale-specific measurement support. Original analyses identified unidimensional Child’s Daily Life and four multidimensional scales, whereas Effort was unsupported. Acceptable CFA fit coexisted with low communalities, weak loadings, and uneven dimensional reliability. Additional ordinal EFA did not uniformly corroborate these structures. Although multidimensional first-order models outperformed one-factor alternatives, second-order models offered no superior fit. The findings warrant further examination of Family Management Style Framework measurement [14,15] without establishing culturally specific differences or adequate separate dimensional scores. The dimensions may inform Family Management Style Framework operationalization [14,15], distinguishing present competence from future preparedness, emotional difficulty from disrupted routines, and teamwork from interpersonal concordance. These patterns are compatible with dynamic, context-dependent family management [16,17], but do not establish cultural specificity or superior hierarchical measurement.
Evaluation of higher-order structures requires attention to model specification, identification, and the restrictions imposed on relationships among first-order factors [44]. For Parental (Caregiver) Mutuality and View of Condition Impact, the first-order and second-order representations produced identical global fit statistics without adding correlated item residuals. Global fit therefore did not distinguish these representations or independently confirm a higher-order structure. For Condition Management Ability and Family Life Difficulty, the second-order models had two additional degrees of freedom and slightly lower CFI and TLI values, although approximate fit remained broadly acceptable. These hierarchical representations offer a possible theoretical account of relationships among dimensions, but their interpretation depends on the imposed constraints and the measurement quality of the constituent dimensions. Moreover, multidimensionality alone does not establish the suitability of overall scale scores or separate dimensional scores; additional evidence concerning the reliable variance represented by each score is required [49]. For Parental (Caregiver) Mutuality, the near-unit loading for caregiving teamwork suggested substantial overlap with the proposed higher-order factor under the fitted specification. For Condition Management Ability, the higher-order factor explained approximately 24% of the variance in management challenges, indicating uneven representation of its dimensions. The weak first-order correlation of 0.17 within this scale also warrants caution when interpreting a common higher-order construct. These estimates do not independently establish factor distinctiveness or justify separate dimensional scores.
The exploratory solutions explained modest variance (31.6% to 44.7%) across View of Condition Impact, Child’s Daily Life, Family Life Difficulty, and Condition Management Ability scales, compared with 57.2% in Parental (Caregiver) Mutuality. These proportions should be interpreted alongside the observed loadings and communalities. Low communalities and weakly defined factors can reduce the stability of factor recovery, particularly in smaller samples [30]. In this study, these concerns, together with uneven dimensional reliability, limit the strength of support for the proposed measurement structures. Moreover, identifying multiple factors does not itself justify separate dimensional scores; their interpretation requires evidence concerning the reliable variance represented by those scores [49]. Independent replication is therefore needed to evaluate structural stability and scoring implications.
Sociocultural characteristics offer one possible explanation for the multidimensional structures identified in this sample. Family management is embedded within cultural expectations regarding caregiving roles, family relationships, and collective responsibility [13]. Multigenerational caregiving and shared family responsibilities may be relevant to how caregivers perceive management competence, future preparedness, disruption of family routines, and caregiving collaboration. However, these cultural influences were not directly tested in the present study. Similar observations in Turkish and Brazilian adaptations [50,51] suggest that although the Family Management Style Framework is broadly transferable across cultures, the measurement structure through which its constructs are operationalized should not be assumed to be universally invariant [14]. An alternative explanation concerns item wording and keying direction. The management challenges dimension comprised reverse-keyed Condition Management Ability items, the family life normalcy dimension comprised reverse-keyed Family Life Difficulty items, and condition manageability contained predominantly reverse-keyed items. Although these items were scored according to the original FaMM instructions, correct reverse scoring does not exclude wording-related response effects. The observed groupings may therefore reflect substantive content, wording direction, or both. Because these contributions were not separately evaluated, the findings should not be attributed solely to Thai sociocultural characteristics. Further evaluation of wording effects and measurement invariance is needed to clarify the interpretation and cross-cultural comparability of the proposed dimensions.
ML sensitivity comparisons preceded residual-covariance additions, so poorer one-factor fit was not attributable to subsequent respecification. Better relative fit nevertheless establishes neither structural stability nor scoring adequacy. Respecification requires substantive explanations alongside diagnostics: meaning and presentation order can produce residual dependence [52], but conceptual relationships or modification indices alone do not justify it. Child’s Daily Life items 1–10 may connect peer participation with judgements of everyday-life similarity. Difficulty Items 33–36 connect obtaining help with balancing care and family life; Items 36–39 connect balance with school functioning. These links are indirect, particularly 36–39, and Item 36 remained weak. Ability Items 19–34 concern responding to condition changes and establishing routines; items 41–15 concern goals and financial resources. Clear wording duplication is absent, and the basis for 15–27 remains uncertain. These retrospective interpretations establish neither residual-dependence causes nor original selection criteria. Same-sample post hoc searches may capitalize on chance and require independent validation [53].
Ordinal EFA provided mixed evidence of structural stability. Although common-factor parallel analysis suggested the original factor counts for several scales, the three-factor Condition Management Ability solution was improper, and both parallel-analysis procedures suggested two dimensions for Family Life Difficulty rather than the original three. Other procedural disagreements indicated retention sensitivity. Retention recommendations should therefore be considered alongside solution admissibility, loading patterns, and interpretability [34]. These findings qualify the original structural conclusions and support confirmatory evaluation of competing models. They do not establish the proposed dimensions as separate clinical subscales, which require additional evidence supporting their score interpretation [49]. Ordinal analyses identified representation limitations across all scales. Communalities below 0.40 warrant examination of an item’s relationship to the retained factors and its intended content rather than automatic deletion [35]. Magnitude matters: Item 8 in View of Condition Impact was close to the guideline (h2 = 0.39), whereas items 12 and 35 in Condition Management Effort, item 44 in Family Life Difficulty, and items 21 and 32 in View of Condition Impact had communalities below 0.10. These particularly low values indicate that the evaluated factors accounted for little of the corresponding underlying item-response variance.
Six items remained below 0.40 in the two-factor Condition Management Ability solution, indicating that the admissible alternative still provided limited representation of several items. Child’s Daily Life and Parental (Caregiver) Mutuality also contained items below the guideline, showing that representation problems extended beyond the weakest scales. Low communalities do not establish whether the problem arises from item wording, distinct but relevant content, or an inadequate factor structure. Moreover, communalities and the number of strong indicators per factor influence the sample size needed for stable factor recovery, warranting caution with the exploratory sample [30]. Decisions about revision or removal should therefore combine content review and caregivers’ interpretations with further evaluation of competing measurement structures. Neither retention nor deletion was established to improve measurement. Item 44 (“We know when our child needs to be a child like the other children”) warrants particular attention because its final CFA loading was essentially null (−0.03), accompanied by a near-zero corrected item–total correlation (−0.01) and low communality in the additional ordinal EFA (0.07). Its adapted wording concerns recognizing when the child wants to be like other children, which may differ from the family-level normalcy represented by the other items in this dimension. This is a possible content mismatch, rather than an established explanation for its performance. Retention in the reported model does not support its contribution to scoring. The effects of removing item 44 on model fit, reliability, and content coverage were not evaluated and remain unresolved.
This study evaluated structural validity before interpreting internal consistency, consistent with recommendations for evaluating health measurement instruments [25]. Interpretation considered item performance and dimensional reliability alongside global fit. Internal consistency was assessed using McDonald’s ω_total and Cronbach’s α, with interpretation informed by the measurement structure and assumptions underlying their calculation [22,54]. Variable internal consistency precluded endorsing all five scales with broadly acceptable fit. AVE further qualified the measurement findings. Only the caregiving concordance dimension of Mutuality met the 0.50 benchmark; the remaining factor-specific estimates indicated that the corresponding factors accounted for less than half of their indicators’ variance on average [45]. Child’s Daily Life and caregiving teamwork demonstrated satisfactory internal consistency despite AVEs below this benchmark, illustrating that internal consistency and average indicator variance explained provide distinct information. The particularly low AVEs for family life normalcy and condition manageability, together with their poor internal consistency and weak item performance, further limited support for separate dimensional scores. Pooled scale-level summaries were interpreted descriptively because they could obscure differences between dimensions and did not establish variance attributable exclusively to the higher-order factor or justify overall scale scoring. These findings support further evaluation of item content and competing measurement structures; low AVE alone does not determine whether an item should be removed.
Alpha is calculable for Likert responses, but reliability interpretation assumes essential tau-equivalence and uncorrelated errors, neither established here. Omega total allows unequal loadings but remains model-dependent; neither coefficient establishes unidimensionality or separate scoring adequacy [46]. Five-category responses and item skewness remain concerns despite reporting omega. Cross-study comparisons must consider item composition, scoring, distributions, and sample characteristics. Brazilian [51] and Thai Effort coefficients therefore describe low consistency within each sample, rather than test cross-cultural differences.
Overall and dimensional performance differed particularly for Family Life Difficulty and View of Condition Impact. Their family life normalcy and condition manageability dimensions had low internal consistency, comparable to that of the unsupported Condition Management Effort scale (Table S7). These dimensions therefore should not be considered adequately supported for separate scoring merely because the broader models showed acceptable global fit. Evidence supporting dimensional scores requires evaluation of the reliable variance represented by those scores [49]. Similarly, items with CFA loadings below the study’s criterion of 0.30 remained poorly performing indicators despite their inclusion in the reported models. Their retention and contribution to the proposed hierarchical structures require further evaluation, considering both measurement performance and content coverage.
Item endpoint concentrations warrant further evaluation. These patterns do not establish scale-level floor or ceiling effects. Such assessment requires examining the proportions of respondents obtaining the minimum or maximum possible score on each scale [55]. Endpoint concentrations may indicate limited differentiation among respondents and should be examined alongside item content and score distributions. Moreover, the inclusion of non-parent caregivers broadens the sample’s caregiving perspectives but does not establish measurement equivalence across caregiver relationships. Equivalence requires explicit evaluation of measurement invariance across the relevant groups [56].
Reported test–retest reliability suggests temporal consistency [18,57], but does not resolve structural or internal-consistency limitations, particularly Effort’s unsupported structure. Agreement between administrations by trained assistants suggests consistent responses under standardized procedures, although the ≤30 min interval allowed possible recall. This provides limited procedural evidence, not established reproducibility across clinicians in routine practice.
Effort had failed original exploratory extraction, inadmissible CFA, and α = 0.28. Brazilian Effort reliability was also low (α = 0.36) [51], without establishing a shared cause. Wording, content coverage, and sample contributions remain unresolved. Item 7’s initial communality was 0.09 and corrected item–total correlation 0.29. Its inadmissible CFA loading was uninterpretable, so these findings cannot establish improved comprehension or conceptual correspondence from the metaphor. Diagnostic heterogeneity was not tested. Cognitive interviews should inform evaluation of wording, scoring, content, and dimensionality before score use.
In sum, this study evaluated the translation, cultural adaptation, structural validity, and reliability of the Thai FaMM among family caregivers of children with chronic conditions. These findings provide preliminary Thai FaMM evidence with uneven item and dimensional performance. Condition Management Effort was not supported, and several proposed dimensions demonstrated limited reliability or low average indicator variance explained. Differences between the original and additional exploratory analyses further qualify the proposed structures.
4.1. Strengths
This study combined systematic translation and cultural adaptation following ISPOR guidance with evaluation of selected measurement properties informed by the COSMIN framework [25,26]. Forward and backward translation, expert review, and cognitive debriefing provided complementary evidence concerning the wording and comprehensibility of the Thai version. Including both parental and non-parental caregivers broadened the caregiving experiences represented in the sample.
Independent exploratory and confirmatory subsamples allowed the original EFA-derived structures to be evaluated in participants not involved in their extraction. Additional ordinal-data EFA and parallel analysis examined sensitivity to estimation and factor-retention procedures, while comparisons with the original one-factor CFA models provided further information about dimensionality. Reporting item performance, dimensional reliability, and AVE alongside global fit made the limitations of the proposed models explicit. These strengths do not remove the need for independent replication or establish equivalence across caregiving and cultural contexts.
4.2. Limitations
Several limitations should be acknowledged. First, inadequate Effort structure and internal consistency preclude clinical score interpretation; wording, scoring, content, and dimensionality require review. Poor normality and reliability likewise limit separate scores despite acceptable broader model fit.
Second, the exploratory sample comprised 150 participants, and several items had low communalities, potentially limiting the stability of the extracted structures. Sample-size adequacy cannot be established solely from the total sample size or a participant-to-item ratio [30]. Additional polychoric-based principal axis analyses and permutation parallel analysis examined sensitivity to the ordinal response format and factor-retention procedure. Nevertheless, some solutions were nonconvergent, improper, or sensitive to the retention method, and several items had sparse response categories. Polychoric estimation assumes underlying bivariate normal response variables and therefore does not eliminate distributional assumptions [37]. The additional analyses did not evaluate ordinal or robust CFA estimation or test the suggested alternative structures in the independent confirmatory sample.
Third, same-sample post hoc residual additions may yield optimistic fit. Although this sample was independent of the exploratory sample, it did not provide independent validation of the subsequent modifications. The respecified models therefore require replication. Sensitivity to the exclusion of 23 observations identified using Mahalanobis distance was not evaluated. These observations may include valid but uncommon caregiving experiences; consequently, the influence of their exclusion on factor structures, reliability estimates, and representation of the target population remains uncertain. Item-removal sensitivity analyses were not conducted using a consistent framework across scales. The available checks therefore do not establish whether removing problematic items, including Item 44, would improve structural validity and reliability while preserving content coverage. The additional ordinal EFA and dimensionality comparisons did not evaluate this question, and the findings do not support recommendations for reduced-item versions.
Fourth, the confirmatory analyses used maximum likelihood estimation, treating the five-category responses as approximately continuous. The requested CFA using ordered indicators, WLSMV estimation, and theta parameterization was not performed. Consequently, the sensitivity of the reported factor loadings, standard errors, and fit statistics to ordinal estimation remains unknown. The additional polychoric-based EFA does not resolve this limitation. Further evaluation should apply an appropriate ordinal estimator to the same substantive CFA models before separately examining alternative structures suggested by the additional exploratory analyses.
Fifth, measurement invariance was not evaluated across caregiving contexts, including parental versus non-parental caregivers, caregivers of boys versus girls, and different childhood chronic conditions. Consequently, the findings do not establish equivalent measurement across these groups or justify interpreting between-group score differences solely as differences in family management. Cross-cultural measurement equivalence also remains unestablished.
Sixth, wording-related method effects were not explicitly modeled. Although designated items were reverse-scored according to the original FaMM instructions, several identified dimensions comprised predominantly reverse-keyed items. The analyses therefore could not distinguish the contributions of substantive content and wording direction to the observed factor structures. Sociocultural explanations for these structures consequently remain tentative.
Finally, translation permission was obtained, but developer endorsement was not. Independent developer review could scrutinize adapted wording and conceptual correspondence.
4.3. Implications for Practice
The cross-culturally adapted Thai FaMM may offer a structured approach to discussing how families manage childhood chronic conditions in everyday life. Its potential clinical contribution lies in considering both family strengths and management difficulties. However, interpretation should reflect the evidence and limitations for each scale; the present findings do not establish effectiveness for clinical screening, selecting interventions, or improving care outcomes.
The ease-oriented scales—Child’s Daily Life, Condition Management Ability, and Parental (Caregiver) Mutuality—address perceptions of the child’s everyday life, management capability, and collaboration in caregiving. The difficulty-oriented scales address perceived management effort, disruption of family life, and concerns about the condition and its future implications. These topics may inform dialog with caregivers alongside clinical assessment. Interpretation of Mutuality responses should consider the relationship of the identified co-caregiver to the respondent.
The present findings do not support clinical interpretation of Condition Management Effort scores or separate scores for dimensions with inadequate reliability, particularly family life normalcy and condition manageability. Other proposed dimensional scores also require further confirmation before being used to guide targeted interventions. Individual item responses may provide topics for discussion, but no item-level clinical thresholds or screening accuracy were established; responses should therefore not be treated as validated clinical flags or independently determine care decisions. Further research should evaluate clinical interpretability, responsiveness, and usefulness in routine family-centered care.
4.4. Implications for Research
Preliminary findings warrant further Thai FaMM evaluation. Original and ordinal exploratory differences require further structural evaluation. A priority is to evaluate the original CFA models using ordered indicators and an appropriate ordinal estimator, such as WLSMV [58]. Retaining the same substantive model specifications would help distinguish the influence of estimation method from changes in model structure. Alternative structures suggested by the additional EFA should then undergo confirmatory evaluation, followed by independent replication. Before recommending separate dimensional scores for research use, further analyses should establish whether these scores provide reliable information beyond that represented by the broader scale [49].
Cognitive interviews or focus groups should examine Effort item interpretation and content coverage, informing wording clarification, scoring review, or theory-informed redevelopment before quantitative evaluation. Normalcy and manageability also need refinement given low reliability and AVE. Further analyses should examine wording effects, systematic item removal, and sensitivity to retaining unusual but potentially valid responses.
Once defensible models are established, evaluate invariance across caregiving contexts, including parental and non-parental caregivers, caregivers of boys and girls, and different childhood chronic conditions. Group-specific sample sizes and response-category frequencies should inform feasibility, and ordinal multi-group analyses should use appropriate identification procedures to evaluate configural, metric, scalar, and strict invariance [59]. Any partial invariance and its implications for the intended comparisons should be reported transparently. Separate evaluations across healthcare settings and cultural groups are also needed. Longitudinal studies should assess responsiveness and invariance over time before interpreting score changes as changes in family management. Further evaluation of predictive validity and clinical interpretability would clarify the usefulness of scale and dimensional scores in observational and intervention research and establish when comparisons across populations and over time are justified.
5. Conclusions
The culturally adapted Thai FaMM provides preliminary, scale-specific evidence, with uneven item and dimensional performance. Condition Management Effort was unsupported, and additional ordinal analyses qualified the original structures. Refinement, ordinal CFA, and independent validation remain necessary before recommending separate dimensional scoring, between-group comparisons, or clinical decision-making. These limitations should guide interpretation of the current scores.
Supplementary Materials
The following supporting information can be downloaded at: https://www.mdpi.com/article/10.3390/ijerph23101253/s1, Tables S1–S3 document ISPOR-guided adaptation, expert roles, and item adaptations/wording checks; Table S1: Detailed application of the ISPOR framework to the Thai Family Management Measure translation and cultural adaptation; Table S2: Composition, roles, and responsibilities of the expert panel; Table S3: Cross-cultural adaptations, wording verification, and implications for conceptual correspondence in the Thai Family Management Measure; Table S4: Content validity (n = 5) and test–retest reliability (n = 60) of the Thai Family Management Measure; Table S5: Characteristics of participants in the exploratory and confirmatory subsamples; Table S6: Item descriptive statistics, corrected item–total correlations, internal consistency, and average variance extracted for the ease-oriented Thai Family Management Measure scales; Table S7: Item descriptive statistics, corrected item–total correlations, internal consistency, and average variance extracted for the difficulty-oriented Thai Family Management Measure scales; Table S8: Item response percentages for the Family Management Measure in the overall sample of Thai families of children with chronic conditions; Table S9: Parallel-analysis eigenvalues for the Thai FaMM scales (n = 150); Table S10: Pattern loadings, communalities, and factor correlations from polychoric-based principal axis analyses (n = 150); Figure S1: Confirmatory factor analysis models for the ease-oriented Family Management Measure scales (S1.1–S1.4); Figure S2: Confirmatory factor analysis models for the difficulty-oriented Family Management Measure scales (S2.1–S2.3); Figure S3: Sensitivity analyses evaluating the original unidimensional models of four Family Management Measure scales (S3.1–S3.4); Family Management Measure (FaMM) in Chronic Illness Children.
Author Contributions
Conceptualization, S.S., K.T., J.S. (Jindarat Somjainuek), P.K. and J.S. (Jom Suwanno); methodology, S.S., K.T., J.S. (Jindarat Somjainuek), P.K. and J.S. (Jom Suwanno); validation, S.S. and J.S. (Jom Suwanno); formal analysis, S.S. and J.S. (Jom Suwanno); investigation, S.S., K.T., J.S. (Jindarat Somjainuek) and P.K.; resources, J.S. (Jom Suwanno); data curation, S.S. and J.S. (Jom Suwanno); writing—original draft preparation, S.S. and J.S. (Jom Suwanno); writing—review and editing, S.S., K.T., J.S. (Jindarat Somjainuek), P.K. and J.S. (Jom Suwanno); supervision, J.S. (Jom Suwanno); project administration, S.S. and J.S. (Jom Suwanno); funding acquisition, S.S., K.T., J.S. (Jindarat Somjainuek), P.K. and J.S. (Jom Suwanno). All authors have read and agreed to the published version of the manuscript.
Funding
This research was funded by Walailak University, grant number WU66270, Year 2023.
Institutional Review Board Statement
The study was conducted in accordance with the ethical principles of the Declaration of Helsinki. and approved by the Ethics Committee in Human Research Walailak University (Approval Code: WUEC-24-244-01; Approval Date: 8 July 2024), and the Research Ethics Committee of Maharaj Nakhon Si Thammarat Hospital (Approval Code: A001/2568; Approval Date: 31 October 2024).
Informed Consent Statement
Participants received verbal and written study information and provided written informed consent. Participation was voluntary, with withdrawal permitted without consequence. Data were anonymized and kept confidential.
Data Availability Statement
The raw data supporting the conclusions of this article will be made available by the authors on request.
Acknowledgments
We thank Anu Jarernvongrayab, Division of Research Measurement and Evaluation, Faculty of Education, Suratthani Rajabhat University, Thailand, for statistical consultation and critical review of the analysis and interpretation. During the preparation of this work, the authors used Open AI ChatGPT (GPT-5.6 Sol) to improve language and readability with caution. After using this tool, the authors reviewed and edited the content as required and took full responsibility for the content of the publication.
Conflicts of Interest
The authors declare no conflicts of interest.
Abbreviations
| CFA | Confirmatory factor analysis |
| CFI | Comparative fit index |
| CMIN/df | Minimum discrepancy per degree of freedom |
| EFA | Exploratory factor analysis |
| FaMM | Family Management Measure |
| TLI | Tucker–Lewis index |
| RMSEA | Root mean square error of approximation |
| SRMR | Standardized root mean square residual |
References
- Mastorci, F.; Lazzeri, M.F.L.; Ait-Ali, L.; Festa, P.; Pingitore, A. Chronic disease in pediatric population: A narrative review of psychosocial dimensions and strategies for management. Children 2025, 12, 967. [Google Scholar] [CrossRef] [Scilit] [PubMed]
- Aekplakorn, W.; Mohsuwan, L.; Satheannoppakao, W.; Puckcharern, P. The 6th Thai National Health Examination Survey 2019–2020: Report on Children’s Health; Faculty of Medicine Ramathibodi Hospital, Mahidol University: Bangkok, Thailand, 2023. [Google Scholar]
- Boris, P.; Kovács, K.E.; Nagy, B.E. The comparative study of chronically ill and healthy children and adolescents in the light of their general mental health. Sci. Rep. 2024, 14, 6754. [Google Scholar] [CrossRef] [Scilit] [PubMed]
- Lebel, S.; Mutsaers, B.; Tomei, C.; Leclair, C.S.; Jones, G.; Petricone-Westwood, D.; Rutkowski, N.; Ta, V.; Trudel, G.; Laflamme, S.Z.; et al. Health anxiety and illness-related fears across diverse chronic illnesses: A systematic review on conceptualization, measurement, prevalence, course, and correlates. PLoS ONE 2020, 15, e0234124. [Google Scholar] [CrossRef] [Scilit] [PubMed]
- Adams, J.S.; Chien, A.T.; Wisk, L.E. Mental illness among youth with chronic physical conditions. Pediatrics 2019, 144, e20181819. [Google Scholar] [CrossRef] [Scilit] [PubMed]
- Barker, M.M.; Beresford, B.; Bland, M.; Fraser, L.K. Prevalence and incidence of anxiety and depression among children, adolescents, and young adults with life-limiting conditions: A systematic review and meta-analysis. JAMA Pediatr. 2019, 173, 835–844. [Google Scholar] [CrossRef] [Scilit] [PubMed]
- Runions, K.C.; Vithiatharan, R.; Hancock, K.; Lin, A.; Brennan-Jones, C.G.; Gray, C.; Payne, D. Chronic health conditions, mental health and the school: A narrative review. Health Educ. J. 2020, 79, 471–483. [Google Scholar] [CrossRef] [Scilit]
- Pinquart, M.; Shen, Y. Behavior problems in children and adolescents with chronic physical illness: A meta-analysis. J. Pediatr. Psychol. 2011, 36, 1003–1016. [Google Scholar] [CrossRef] [Scilit] [PubMed]
- Kuo, D.Z.; Houtrow, A.J.; Arango, P.; Kuhlthau, K.A.; Simmons, J.M.; Neff, J.M. Family-centered care: Current applications and future directions in pediatric health care. Matern. Child Health J. 2012, 16, 297–305. [Google Scholar] [CrossRef] [Scilit] [PubMed]
- Committee on Hospital Care; American Academy of Pediatrics. Family-centered care and the pediatrician’s role. Pediatrics 2003, 112, 691–697. [Google Scholar] [CrossRef] [Scilit]
- Dall’Oglio, I.; Gasperini, G.; Carlin, C.; Biagioli, V.; Gawronski, O.; Spitaletta, G.; Grimaldi Capitello, T.; Salata, M.; Vanzi, V.; Rocco, G.; et al. Self-care in pediatric patients with chronic conditions: A systematic review of theoretical models. Int. J. Environ. Res. Public Health 2021, 18, 3513. [Google Scholar] [CrossRef] [Scilit] [PubMed]
- Harrison, T.M. Family-centered pediatric nursing care: State of the science. J. Pediatr. Nurs. 2010, 25, 335–343. [Google Scholar] [CrossRef] [Scilit] [PubMed]
- Knafl, K.A.; Deatrick, J.A.; Gallo, A.M.; Skelton, B. Tracing the use of the Family Management Framework and Measure: A scoping review. J. Fam. Nurs. 2021, 27, 87–106. [Google Scholar] [CrossRef] [Scilit] [PubMed]
- Knafl, K.A.; Deatrick, J.A. Family management style: Concept analysis and development. J. Pediatr. Nurs. 1990, 5, 4–14. [Google Scholar] [PubMed]
- Knafl, K.A.; Deatrick, J.A. Family management style and the challenge of moving from conceptualization to measurement. J. Pediatr. Oncol. Nurs. 2006, 23, 12–18. [Google Scholar] [CrossRef] [Scilit] [PubMed]
- Knafl, K.A.; Deatrick, J.A. Further refinement of the Family Management Style Framework. J. Fam. Nurs. 2003, 9, 232–256. [Google Scholar] [CrossRef] [Scilit]
- Knafl, K.A.; Deatrick, J.A.; Havill, N.L. Continued development of the Family Management Style Framework. J. Fam. Nurs. 2012, 18, 11–34. [Google Scholar] [CrossRef] [Scilit] [PubMed]
- Knafl, K.; Deatrick, J.A.; Gallo, A.; Dixon, J.; Grey, M.; Knafl, G.; O’Malley, J. Assessment of the psychometric properties of the Family Management Measure. J. Pediatr. Psychol. 2011, 36, 494–505. [Google Scholar] [CrossRef] [Scilit] [PubMed]
- Wacharasin, C.; Theinpichet, S. Family nursing practice, education, and research: What is happening in Thailand? J. Fam. Nurs. 2008, 14, 429–435. [Google Scholar]
- Junla, D.; Yotanyamaneewong, S. Cultural values, parenting and child adjustment in Thailand. Int. J. Psychol. 2024, 59, 559–567. [Google Scholar] [CrossRef] [Scilit] [PubMed]
- van Widenfelt, B.M.; Treffers, P.D.; de Beurs, E.; Siebelink, B.M.; Koudijs, E. Translation and cross-cultural adaptation of assessment instruments used in psychological research with children and families. Clin. Child Fam. Psychol. Rev. 2005, 8, 135–147. [Google Scholar] [CrossRef] [Scilit] [PubMed]
- Barbaranelli, C.; Lee, C.S.; Vellone, E.; Riegel, B. The problem with Cronbach’s alpha: Comment on Sijtsma and van der Ark (2015). Nurs. Res. 2015, 64, 140–145. [Google Scholar] [PubMed]
- Raykov, T. Scale construction and development using structural equation modeling. In Handbook of Structural Equation Modeling; Hoyle, R.H., Ed.; Guilford Press: New York, NY, USA, 2012; pp. 472–492. [Google Scholar]
- McDonald, R.P. Test Theory: A Unified Treatment; Lawrence Erlbaum Associates: Hillsdale, NJ, USA, 1999. [Google Scholar]
- Mokkink, L.B.; Terwee, C.B.; Patrick, D.L.; Alonso, J.; Stratford, P.W.; Knol, D.L.; Bouter, L.M.; de Vet, H.C.W. The COSMIN checklist for assessing the methodological quality of studies on measurement properties of health status measurement instruments: An international Delphi study. Qual. Life Res. 2010, 19, 539–549. [Google Scholar] [CrossRef] [Scilit] [PubMed]
- Wild, D.; Grove, A.; Martin, M.; Eremenco, S.; McElroy, S.; Verjee-Lorenz, A.; Erikson, P. Principles of good practice for the translation and cultural adaptation process for patient-reported outcomes (PRO) measures: Report of the ISPOR Task Force for Translation and Cultural Adaptation. Value Health 2005, 8, 94–104. [Google Scholar] [CrossRef] [Scilit] [PubMed]
- Yaghmale, F. Content validity and its estimation. J. Med. Educ. 2003, 3, 25–27. [Google Scholar] [CrossRef] [Scilit] [PubMed]
- Polit, D.F.; Beck, C.T.; Owen, S.V. Is the CVI an acceptable indicator of content validity? Appraisal and recommendations. Res. Nurs. Health 2007, 30, 459–467. [Google Scholar] [CrossRef] [Scilit] [PubMed]
- Anthoine, E.; Moret, L.; Regnault, A.; Sébille, V.; Hardouin, J.B. Sample size used to validate a scale: A review of publications on newly developed patient-reported outcome measures. Health Qual. Life Outcomes 2014, 12, 176. [Google Scholar] [CrossRef] [Scilit] [PubMed]
- MacCallum, R.C.; Widaman, K.F.; Zhang, S.; Hong, S. Sample size in factor analysis. Psychol. Methods 1999, 4, 84–99. [Google Scholar] [CrossRef] [Scilit]
- Tabachnick, B.G.; Fidell, L.S. Using Multivariate Statistics, 6th ed.; Pearson: Boston, MA, USA, 2013. [Google Scholar]
- Leys, C.; Klein, O.; Dominicy, Y.; Ley, C. Detecting multivariate outliers: Use a robust variant of the Mahalanobis distance. J. Exp. Soc. Psychol. 2018, 74, 150–156. [Google Scholar] [CrossRef] [Scilit]
- Kline, R.B. Principles and Practice of Structural Equation Modeling, 4th ed.; Guilford Press: New York, NY, USA, 2015. [Google Scholar]
- Fabrigar, L.R.; Wegener, D.T.; MacCallum, R.C.; Strahan, E.J. Evaluating the use of exploratory factor analysis in psychological research. Psychol. Methods 1999, 4, 272–299. [Google Scholar] [CrossRef] [Scilit]
- Costello, A.B.; Osborne, J. Best practices in exploratory factor analysis: Four recommendations for getting the most from your analysis. Pract. Assess. Res. Eval. 2005, 10, 7. [Google Scholar]
- Kaiser, H.F. An index of factorial simplicity. Psychometrika 1974, 39, 31–36. [Google Scholar] [CrossRef] [Scilit]
- Olsson, U. Maximum likelihood estimation of the polychoric correlation coefficient. Psychometrika 1979, 44, 443–460. [Google Scholar] [CrossRef] [Scilit]
- Flora, D.B.; Curran, P.J. An empirical evaluation of alternative methods of estimation for confirmatory factor analysis with ordinal data. Psychol. Methods 2004, 9, 466–491. [Google Scholar] [CrossRef] [Scilit] [PubMed]
- Meade, A.W.; Johnson, E.C.; Braddy, P.W. Power and sensitivity of alternative fit indices in tests of measurement invariance. J. Appl. Psychol. 2008, 93, 568–592. [Google Scholar] [CrossRef] [Scilit] [PubMed]
- Hu, L.; Bentler, P.M. Cutoff criteria for fit indexes in covariance structure analysis: Conventional criteria versus new alternatives. Struct. Equ. Model. 1999, 6, 1–55. [Google Scholar] [CrossRef] [Scilit]
- Browne, M.W.; Cudeck, R. Alternative ways of assessing model fit. In Testing Structural Equation Models; Bollen, K.A., Long, J.S., Eds.; Sage Publications: Newbury Park, CA, USA, 1993; pp. 136–162. [Google Scholar]
- Bagozzi, R.P.; Yi, Y. Specification, evaluation, and interpretation of structural equation models. J. Acad. Mark. Sci. 2012, 40, 8–34. [Google Scholar] [CrossRef] [Scilit]
- Gribbons, B.C.; Hocevar, D. Levels of aggregation in higher-level confirmatory factor analysis: Application for academic self-concept. Struct. Equ. Model. 1998, 5, 377–390. [Google Scholar] [CrossRef] [Scilit]
- Rindskopf, D.; Rose, T. Some theory and applications of confirmatory second-order factor analysis. Multivar. Behav. Res. 1988, 23, 51–67. [Google Scholar] [CrossRef] [Scilit] [PubMed]
- Fornell, C.; Larcker, D.F. Evaluating structural equation models with unobservable variables and measurement error. J. Mark. Res. 1981, 18, 39–50. [Google Scholar] [CrossRef] [Scilit]
- Flora, D.B. Your coefficient alpha is probably wrong, but which coefficient omega is right? A tutorial on using R to obtain better reliability estimates. Adv. Methods Pract. Psychol. Sci. 2020, 3, 484–501. [Google Scholar] [CrossRef] [Scilit]
- Boateng, G.O.; Neilands, T.B.; Frongillo, E.A.; Melgar-Quiñonez, H.R.; Young, S.L. Best practices for developing and validating scales for health, social, and behavioral research: A primer. Front. Public Health 2018, 6, 149. [Google Scholar] [CrossRef] [Scilit] [PubMed]
- Koo, T.K.; Li, M.Y. A guideline of selecting and reporting intraclass correlation coefficients for reliability research. J. Chiropr. Med. 2016, 15, 155–163. [Google Scholar] [CrossRef] [Scilit] [PubMed]
- Reise, S.P.; Bonifay, W.E.; Haviland, M.G. Scoring and modeling psychological measures in the presence of multidimensionality. J. Pers. Assess. 2013, 95, 129–140. [Google Scholar] [CrossRef] [Scilit] [PubMed]
- Ergun, A.; Sisman, F.N.; Erol, S.; Gur, K.; Kolac, N.; Kadioglu, H. The family management of childhood chronic conditions: Measurement in a Turkish sample. J. Pediatr. Nurs. 2019, 47, e16–e23. [Google Scholar] [CrossRef] [Scilit] [PubMed]
- Ichikawa, C.R.; Bousso, R.S.; Misko, M.D.; Mendes-Castillo, A.M.; Bianchi, E.R.; Damião, E.B. Cultural adaptation of the Family Management Measure among families of children and adolescents with chronic diseases. Rev. Lat. Am. Enferm. 2014, 22, 115–122. [Google Scholar] [CrossRef] [Scilit] [PubMed]
- Bandalos, D.L. Item meaning and order as causes of correlated residuals in confirmatory factor analysis. Struct. Equ. Model. 2021, 28, 903–913. [Google Scholar] [CrossRef] [Scilit]
- MacCallum, R.C.; Roznowski, M.; Necowitz, L.B. Model modifications in covariance structure analysis: The problem of capitalization on chance. Psychol. Bull. 1992, 111, 490–504. [Google Scholar] [CrossRef] [Scilit] [PubMed]
- Trizano-Hermosilla, I.; Gálvez-Nieto, J.L.; Alvarado, J.M.; Saiz, J.L.; Salvo-Garrido, S. Reliability estimation in multidimensional scales: Comparing the bias of six estimators in measures with a bifactor structure. Front. Psychol. 2021, 12, 508287. [Google Scholar] [CrossRef] [Scilit] [PubMed]
- Terwee, C.B.; Bot, S.D.; de Boer, M.R.; van der Windt, D.A.; Knol, D.L.; Dekker, J.; Bouter, L.M.; de Vet, H.C. Quality criteria were proposed for measurement properties of health status questionnaires. J. Clin. Epidemiol. 2007, 60, 34–42. [Google Scholar] [CrossRef] [Scilit] [PubMed]
- Prinsen, C.A.C.; Mokkink, L.B.; Bouter, L.M.; Alonso, J.; Patrick, D.L.; de Vet, H.C.W.; Terwee, C.B. COSMIN guideline for systematic reviews of patient-reported outcome measures. Qual. Life Res. 2018, 27, 1147–1157. [Google Scholar] [CrossRef] [Scilit] [PubMed]
- McCrae, R.R.; Kurtz, J.E.; Yamagata, S.; Terracciano, A. Internal consistency, retest reliability, and their implications for personality scale validity. Pers. Soc. Psychol. Rev. 2011, 15, 28–50. [Google Scholar] [CrossRef] [Scilit] [PubMed]
- Park, C.G. Implementing alternative estimation methods to test the construct validity of Likert-scale instruments. Korean J. Women Health Nurs. 2023, 29, 85–90. [Google Scholar] [CrossRef] [Scilit] [PubMed]
- Wu, H.; Estabrook, R. Identification of confirmatory factor analysis models of different levels of invariance for ordered categorical outcomes. Psychometrika 2016, 81, 1014–1045. [Google Scholar] [CrossRef] [Scilit] [PubMed]
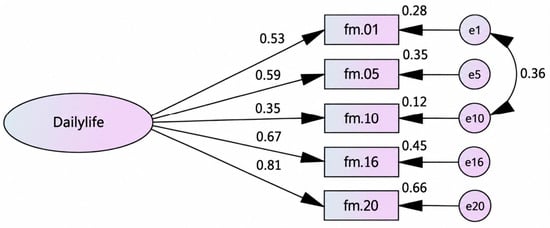
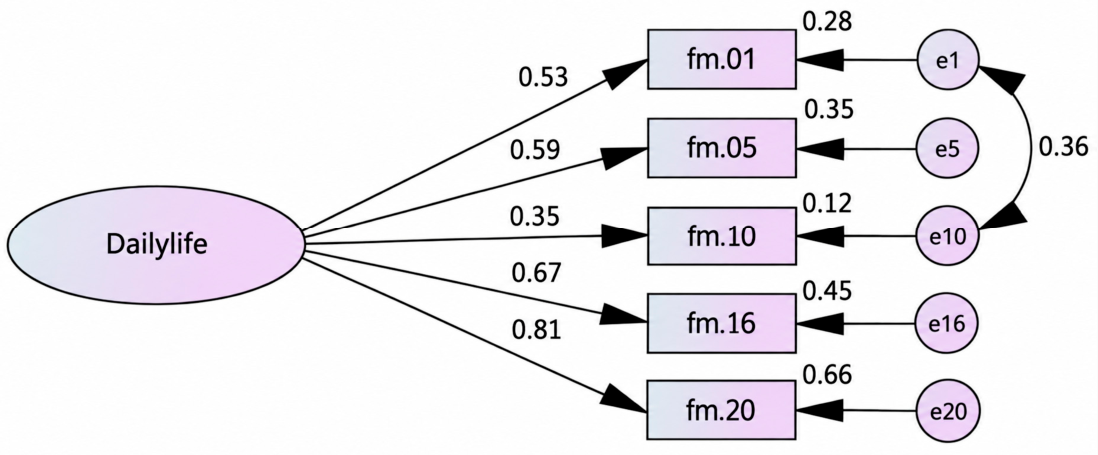
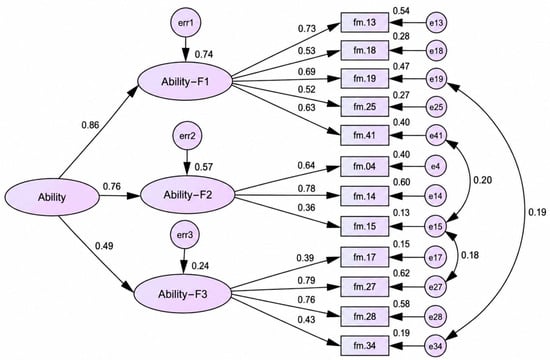
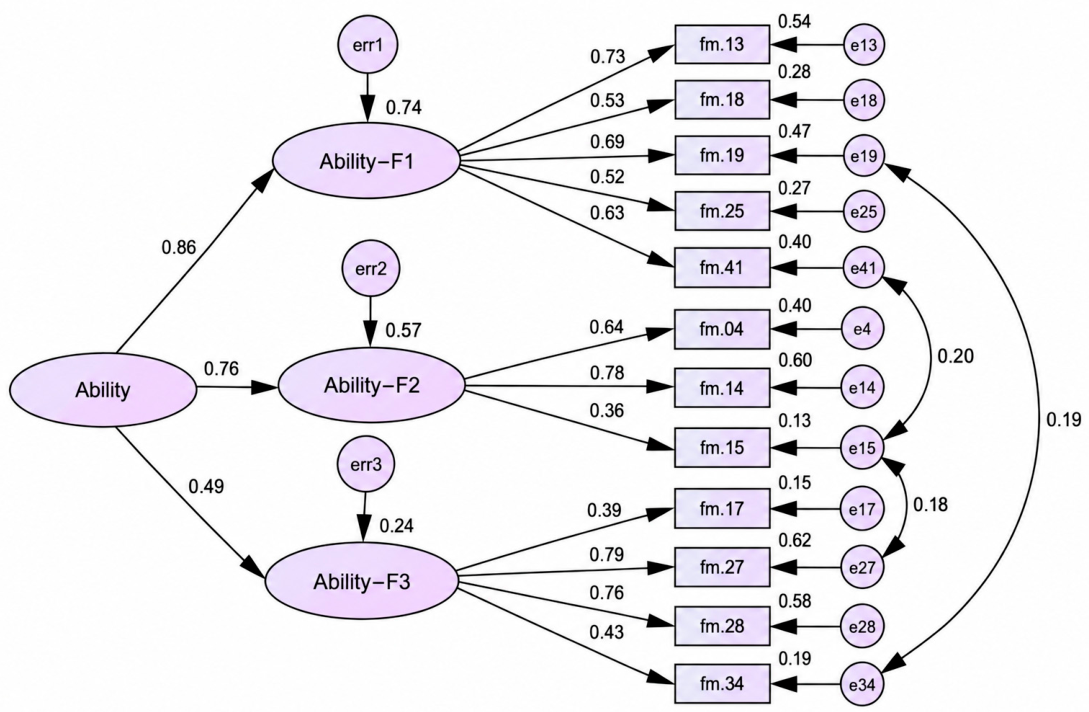
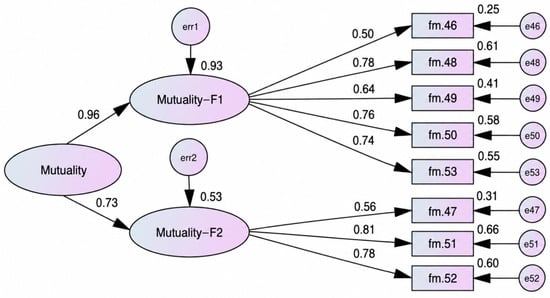
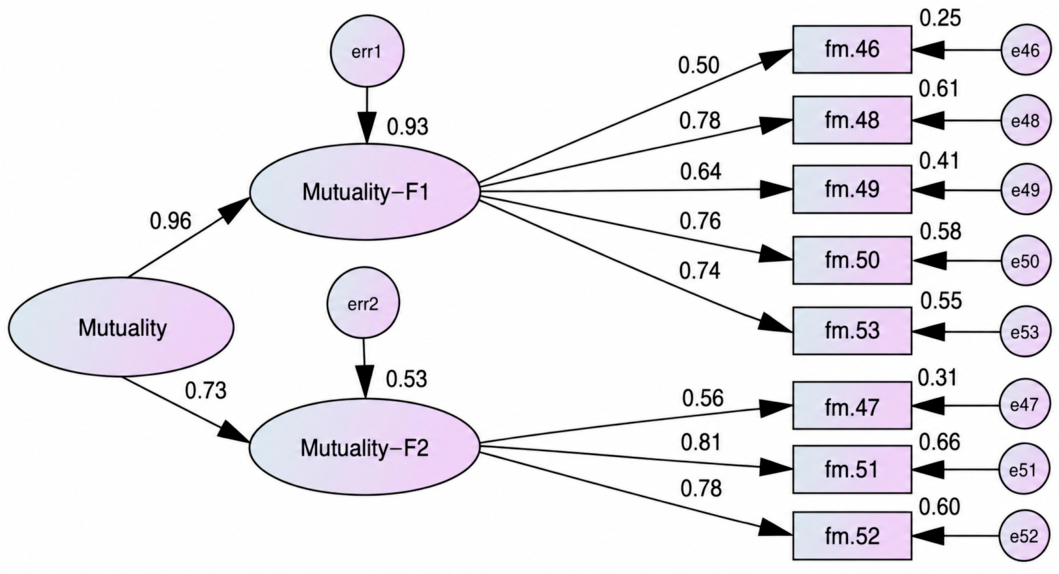
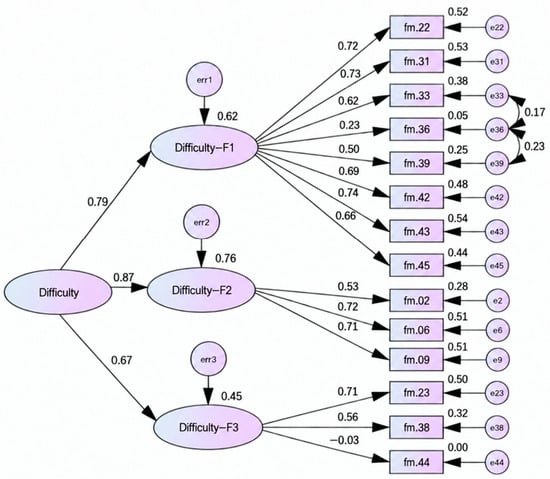
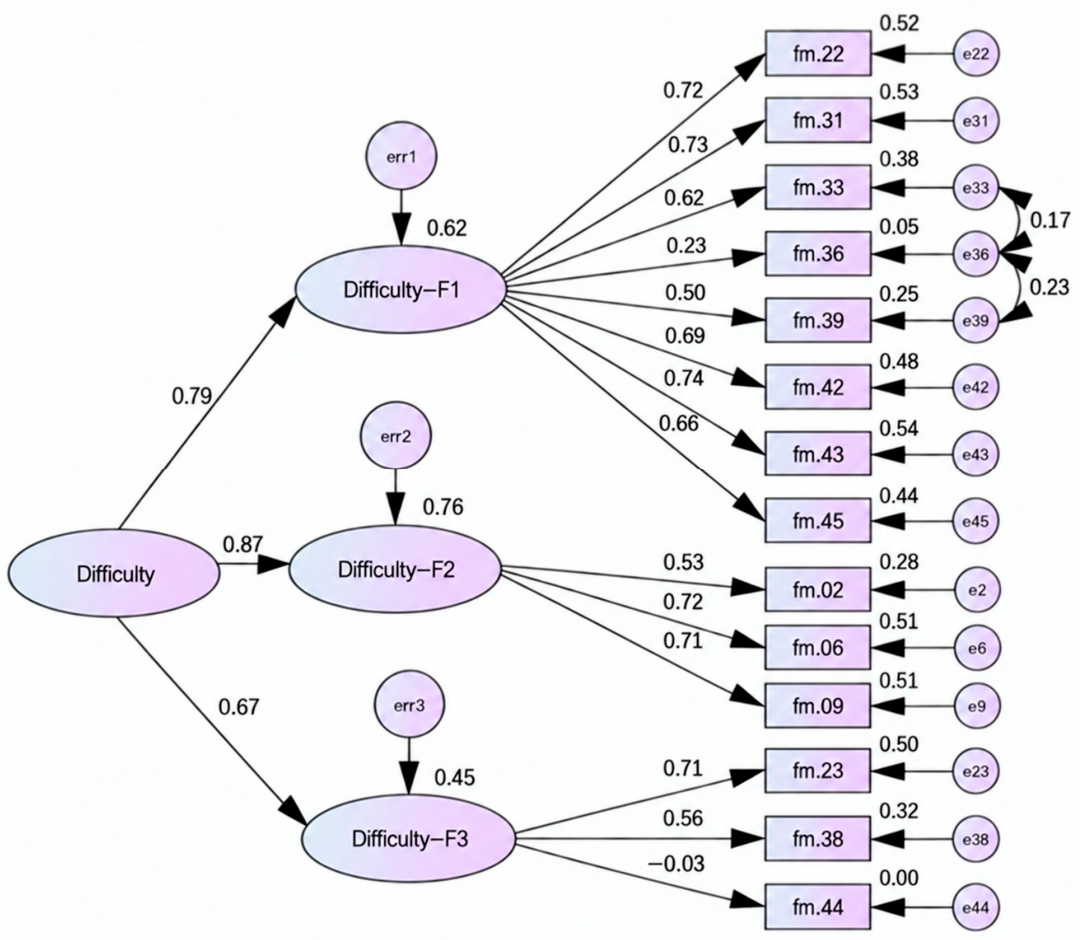
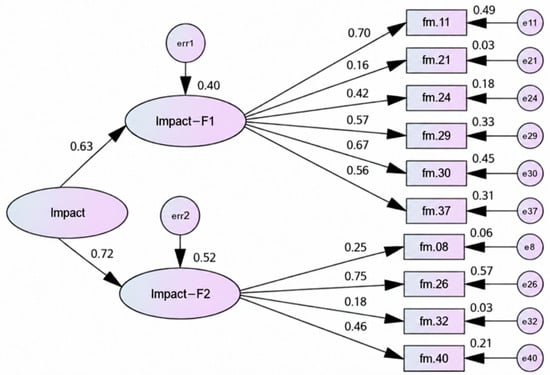
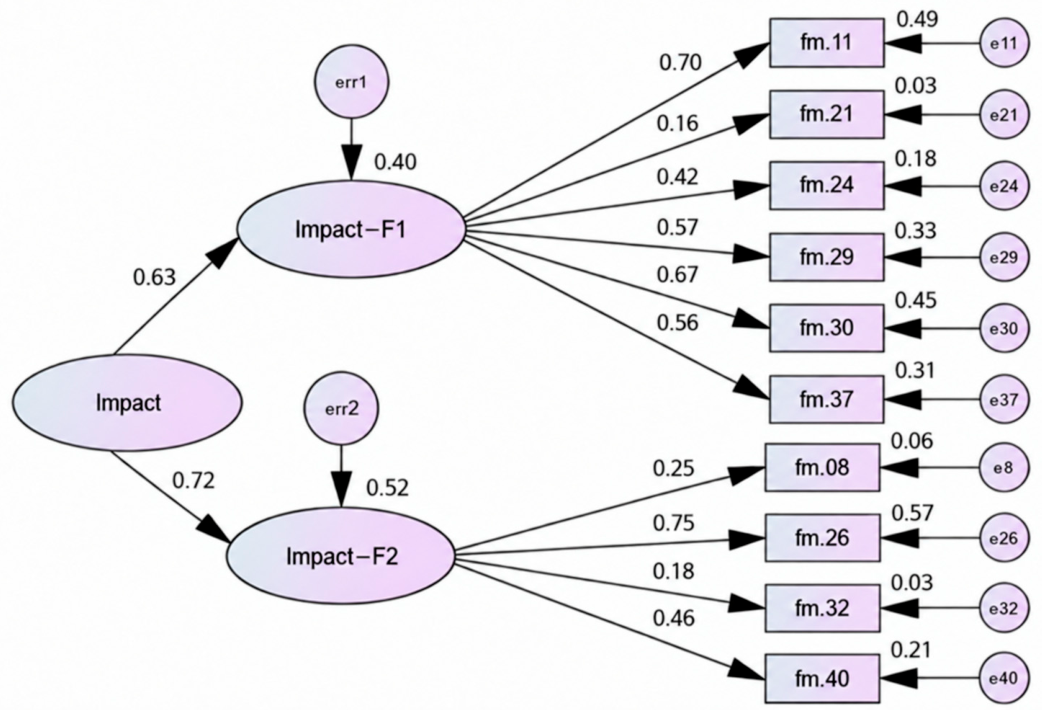

Disclaimer/Publisher’s Note: The statements, opinions and data contained in all publications are solely those of the individual author(s) and contributor(s) and not of MDPI and/or the editor(s). MDPI and/or the editor(s) disclaim responsibility for any injury to people or property resulting from any ideas, methods, instructions or products referred to in the content. |
© 2026 by the authors. Licensee MDPI, Basel, Switzerland. This article is an open access article distributed under the terms and conditions of the Creative Commons Attribution (CC BY) license.