


Abstract
The COVID-19 pandemic raises awareness of how the fatal spreading of infectious disease impacts economic, political, and cultural sectors, which causes social implications. Across the world, strategies aimed at quickly recognizing risk factors have also helped shape public health guidelines and direct resources; however, they are challenging to analyze and predict since those events still happen. This paper intends to invesitgate the association between air pollutants and COVID-19 confirmed cases using Deep Learning. We used Delhi, India, for daily confirmed cases and air pollutant data for the dataset. We used LSTM deep learning for training the combination of COVID-19 Confirmed Case and AQI parameters over the four different lag times of 1, 3, 7, and 14 days. The finding indicates that CO is the most excellent model compared with the others, having on average, 13 RMSE values. This was followed by pressure at 15, PM2.5 at 20, NO2 at 20, and O3 at 22 error rates.
1. Introduction
Although we remember and contemplate that during 26 January–3 October 2020, more than 300,000 people died in the United States, with two thirds of those deaths directly associated to COVID-19 [1], we might also assess what the newest science says about the pandemic. We know that those who live in places with severe levels of air pollution will face several hazards concerning their respiratory health throughout this outbreak. Currently, new research focuses on the correlations between air pollution and severe COVID-19 sickness, emphasizing the crucial need for everyone to breathe clean air. Research published in December 2020 attempted to assess the extent to which COVID-19 mortality is due to long-term exposure to fine particle pollution [2]. Using a combination of epidemiological data, satellite data, and other monitoring data worldwide, the researchers concluded that chronic air pollution might be responsible for 15% of COVID-19 fatalities globally [2]. The experts also distinguished air pollution generated by fossil fuels and pollution that is induced by other human activities. In the United States, fossil fuel-related air pollution is responsible for 15% of COVID-19 mortality, indicating that fossil fuel related air pollution contributes considerably to overall U.S. air quality [2].
Several researchers used machine learning to evaluate the association and prediction cases when investigating the relationship between two parameters [3,4]. Machine learning is commonly used in drug development research to anticipate chemical characteristics and help identify active molecules. Perez and Bajorath [5] provide a new method to discover links between target proteins that incorporate internal model information from chemical activity predictions. Feature importance correlation analysis is proven to discover comparable drug binding features based on a large-scale investigation that compared machine learning models for more than 200 proteins. Surprisingly, the research also finds functional links between proteins that are not dependent on active chemicals or binding properties. Malki et al. [6] also provide several regressor machine learning algorithms to extract the association between different parameters and the COVID-19 distribution rate. By extracting the association between the number of confirmed cases and the climatic variables in specified places, the machine learning methods used in this study assess the influence of weather variables such as temperature and humidity on COVID-19 transmission. As a result of this finding, they may deduce that temperature and humidity are critical factors in determining COVID-19 death rates. Furthermore, it has been shown that the greater the temperature, the lower the number of infection cases. To collectively predict the correlated time series, Wan et al. [7] suggested CTS-LSTM, a unique variation of LSTM. Experiments are carried out on two types of real-world datasets: civil aviation passenger demand data and air quality data. In addition, when compared with state-of-the-art baselines, CTS-LSTM achieves at least 9.0%, 16.5%, and 21.3% reduced RMSE, MAE, and MAPE. An LSTM recurrent neural network-based technique for predicting the load of non-residential customers utilizing various correlated sequence information is provided in [8]. The suggested methodology is evaluated on a real data set containing energy consumption data from 48 non-residential users in China. The results of the experiments suggest that this strategy can effectively use numerous sequence information and successfully capture the relationships between different sequences.
Therefore, based on the previous research on the potential correlation of two or more different resources conducted by some experts, we examined the relationship between air pollutants and COVID-19 using deep learning. The objectives of this paper are listed as follows:
- To correlate COVID-19 Confirmed Case with AQI parameters.
- To train the integration of COVID-19 Confirmed Case and AQI parameters in four different lag times, 1, 3, 7, and 14 days, using long short-term memory (LSTM) deep learning.
- To evaluate and compare the RMSE values for the trained models.
The contribution of this paper might leverage the research of correlation and prediction analysis of air pollutants and COVID-19 using different approaches, such as lag times and LSTM methods combined with correlation analysis.
2. Background Review and Related Work
Cui et al. [9] discovered that the residents of a severely polluted area of China were more likely to die of SARS than residents in a less polluted area. Kan et al. [10] discovered that increases in particulate matter air pollution enhanced the probability of dying from the disease during the 2003 SARS pandemic. Numerous viruses, including adenovirus and influenza virus, have been proven to be transmitted by air particles. Zhao et al. [11] concluded that particulate matter was probably a factor in the propagation of the 2015 avian influenza. According to Chen et al. [12], air pollution can hasten the spread of respiratory diseases.
2.1. Research on Association of Air Pollutant and COVID-19
Researchers conducted the study related to the association of air pollution and COVID-19 in various countries. We examined their works to enrich our knowledge of this topic, as follows.
Zhu et al. [13] investigated the association between ambient air pollution and coronavirus infection. Between 23 January 2020 and 29 February 2020, in China, daily confirmed cases, air pollution concentrations, and climatic data were collected in 120 cities. They used a generalized additive model to examine the relationships between six air pollutants (PM2.5, PM10, SO2, CO, NO2, and O3) and verified instances of COVID-19.
Gupta et al. [14] estimated the increased risk of coronavirus disease (COVID-19), caused by severe acute respiratory syndrome coronavirus 2, by establishing a link between the mortality rate of infected individuals and air pollution, specifically Particulate Matters (PM) with aerodynamic diameters of 10 m and 2.5 m. Nine Asian cities’ data are studied using statistical techniques such as analysis of variance and regression modeling.
Lolli et al. [15] quantified the relationship between COVID-19 transmission and meteorological and air quality indices in two significant urban regions in Northern Italy, Milan, and Florence, as well as the autonomous province of Trento. Milan, the capital of the Lombardy region, is often regarded as the heart of Italy’s HIV epidemic.
Bashir et al. [16] investigated the relationship between COVID-19 and climatic indicators in New York City, United States of America. They analyzed secondary public data from the New York City Department of Health and the National Weather Service in the United States of America. The average temperature, lowest temperature, maximum temperature, rainfall, average humidity, wind speed, and air quality are all covered in the research. The Kendall and Spearman rank correlation tests were used to analyze the data.
Suhaimi et al. [17] investigated the relationships between air quality, climatic variables, and COVID-19 cases in Kuala Lumpur, Malaysia. The Department of Environment Malaysia provided air pollutants and meteorological data from 2018–2020, whereas the Ministry of Health Malaysia provided daily new COVID-19 case data in 2020.
Mehmood et al. [18] used geospatial tools to analyze the relationship between COVID-19 cases, air pollution, meteorological, and socioeconomic characteristics in three provincial capital cities and the federal capital city of Pakistan.
Hoang and Tran [19] investigated the temporal association in seven metropolitan centers and nine regions across Korea using the generalized additive model. The findings indicate a substantial nonlinear relationship between daily temperature and verified COVID-19 cases.
Travaglio et al. [20] matched current SARS-CoV-2 cases and fatalities from public databases to regional and subregional air pollution data collected across England.
In Singapore, Lorenzo et al. [21] examined the relationship between core air pollutant concentrations, climatic factors, and daily verified COVID-19 case numbers. We collected data on air pollutant concentrations (particulate matter [PM2.5, PM10], ozone [O3], carbon monoxide [CO], nitrogen dioxide [NO2], sulphur dioxide [SO2], pollutant standards index [PSI]), and climatic variables (rainfall, humidity, and temperature). Table 1 summarizes recent studies on the association between air pollutants and COVID-19.
Table 1.
Recent research on Association of Air Pollutant and COVID-19.
Recent important research findings in 2022 also indicated that there is a correlation between air pollutants and COVID-19 cases [22,23,24,25,26].
2.2. Research on Prediction of Air Pollutant and COVID-19 Using Deep Learning
Aragão et al. [27] examined climate factors as extra features in a data-driven multivariate prediction model to predict the number of COVID-19 deaths in Brazilian states and significant cities in the short future. The basic premise is that by including these climatic characteristics as inputs to data-driven model training, the prediction performance increases when compared with single-input models. For both the multivariate and univariate models, the training adopted a Stacked LSTM as the network architecture. Using the mean fitting error, average forecast error, and the profile of the cumulative deaths for the forecast as evaluation criteria, the tests revealed that the best multivariate model is more skillful than the best standard data-driven univariate model we found. These findings suggest that by using additional important variables as input for a multivariate method, the quality of prediction models may be improved even more.
Al-Qaness et al. [28] presented an upgraded version of the adaptive neuro-fuzzy inference system (ANFIS) for forecasting the air quality index in Wuhan City, China. The PSOSMA is a hybrid optimization approach that uses a novel modified meta-heuristics (MH) algorithm, and a slime mold algorithm (SMA), which is enhanced by employing the particle swarm optimizer to increase ANFIS performance (PSO). The proposed PSOSMA-ANFIS was trained using three years of air quality index time series data and then used to forecast fine particulate matter (PM2.5), sulfur dioxide (SO2), carbon dioxide (CO2), and nitrogen dioxide (NO2) for a year. The suggested PSOSMA was also compared with various MH algorithms used to train ANFIS. The results discovered that the improved ANFIS incorporating PSOSMA outperformed the other methods.
Zhou et al. [29] discussed the COVID-19 forecasting, using the relevance of government initiatives in their suggested model, the Interpretable Temporal Attention Network (ITANet). Long short-term memory (LSTM) for temporal feature extraction and multi-head attention for the long-term dependency caption are used in the proposed model, which has an encoder–decoder architecture. The ITANet outperforms other models when it comes to anticipating COVID-19 new confirmed cases.
Saravanan et al. [30] described the impact of lockdown measures on air quality and rainwater accumulation in major cities. With respect to varying time length and climatic variables, the effects of COVID-19 on the environment during lockdown conditions were compared with those without lockdown conditions. During the lockdown, the concentrations of particulate pollution in Chennai, Bangalore, Delhi, and Melbourne were measured. The findings of this research indicate the effects of government actions and give a detailed perspective of the death rate in relation to air quality decrease.
Xu, et al. [31] created three deep learning models in their study to forecast the number of COVID-19 cases for Brazil, India, and Russia, including CNN, LSTM, and CNN-LSTM. The LSTM model, among the models constructed in this study, has the best forecasting performance, which indicates an improvement in prediction accuracy over certain current models.
Fu, et al. [32] used experimental public data sets from the Johns Hopkins University Center for Systems Science and Engineering (JHU CSSE), the Air Quality Open Data Platform, the China Meteorological Data Network, and the WorldPop website. The Dual-link Bi-GRU Network predicts the epidemic scenario, and the Gauss–Newton iteration method quantifies the relationship between epidemic spread and other feature parameters. Among the selected characteristic elements, the study discovered that population density had the most positive link with pandemic spread, followed by the number of landing planes.
Mumtaz, et al. [33] suggested an indoor air quality monitoring and prediction system based on the newest Internet of Things (IoT) sensors and machine learning capabilities, which can assess a variety of indoor pollutants. An IoT node including numerous sensors for eight pollutants, including NH3, CO, NO2, CH4, CO2, PM2.5, as well as the ambient temperature and air humidity, has been designed for this purpose. With an accuracy of 99.37%, precision of 99%, recall of 98%, and F1-score of 99%, this model has showed promise in forecasting air pollutants’ concentrations as well as overall air quality.
2.3. LSTM Network
In nonlinear sequence prediction issues, the LSTM network is a recurrent neural network (RNN) design that can learn order dependence. They have a habit of memorizing things for a long period. The memory cell, which substitutes classic neurons’ hidden layers, is at the foundation of the LSTM network [34]. The LSTM networks, similarly to other RNNs, feature recurrent cells, but instead of a single NN gate, the recurring cell has an interactive input gate, output gate, and forget gate [35]. The cell remembers values for arbitrary time intervals, and these three gates control the flow of information into and out of the cell. Based on the past state, accessible memory, and current input, this structure guarantees that the LSTM can recognize which cells are stimulated and compressed. The LSTM networks were created to solve the problem of disappearing gradients that might occur when training traditional RNNs. As there may be unexpected delays between critical occurrences in a time series, LSTM networks are ideally suited for categorizing, processing, and generating predictions based on time series data. In many cases, LSTM has an advantage over RNNs, hidden Markov models, and other sequence learning approaches due to its relative insensitivity to gap length; therefore, we selected LSTM as the model to predict the integration of COVID-19 and air pollutant data.
3. Materials and Methods
In this section, we presented the materials and methods, including the dataset used in this paper, the research workflows, and the LSTM training method.
3.1. Dataset
The dataset was extracted from different resources, as follows.
- India’s COVID-19 dataset per state.
- AQI in India per State.
- These two datasets were then integrated based on Delhi as the case study.
- From the data integration of AQI and COVID-19, we obtained 609 records from the period of 2 March 2020 to 31 October 2021.
Based on these resources, we obtained the parameters, as described in Table 2.
Table 2.
Dataset parameters.
3.2. Research Workflows
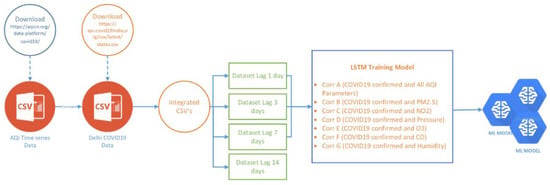
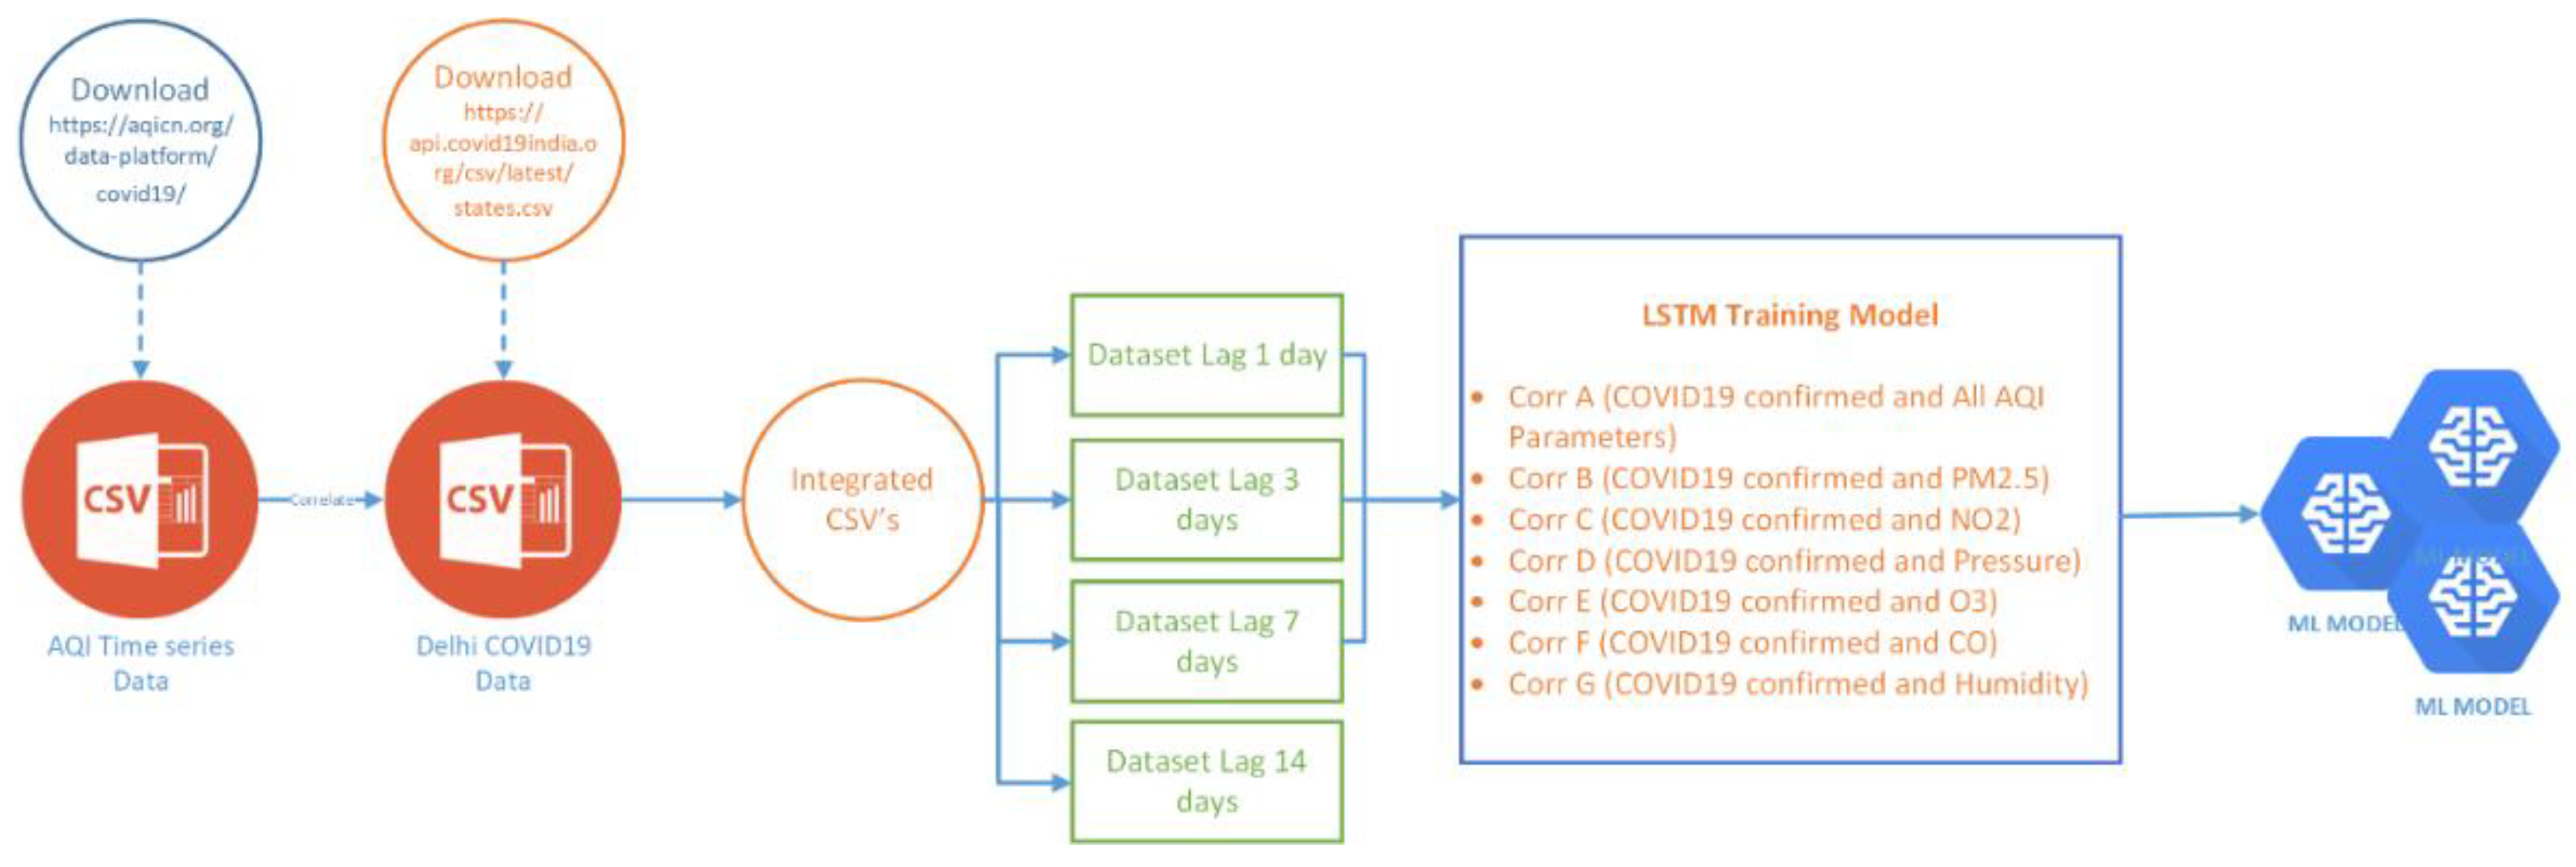
First, we collected the dataset from two resources. The first resource is from the Indian government’s COVID-19 dataset per state, from which, Delhi was selected. The second resource was the AQI parameters based on city/state (again, we selected Delhi). Then, we integrated these two resources based on per day values. After that, we separated the lag time between air pollution and COVID-19 confirmed cases for 1, 3, 7, and 14 day lag times. In this case, the majority approach of lag time selections rely on trials to determine the best time-lags, which may not always be sufficient in real-world circumstances [36,37,38,39]. These approaches, on the other hand, are mostly based on trial-and-error scenarios, which necessitates the training of various models multiple times in order to identify the best among them. Next, we train the dataset using LSTM and use the models [40,41,42]. Figure 1 shows the workflows of this research.
Figure 1.
Research Workflow.
3.3. Data Preprocessing
In machine learning, data preparation is a critical step that helps improve data quality and facilitates the extraction of relevant insights from the data [43,44]. After we integrated COVID-19 confirmed cases and air pollutants, we completed the data preprocessing. The data preprocessing was conducted as follows.
- For handling the missing values, we marked all NA values with 0.
- To make sure that the calculations are fine, we ensured that all data were floats.
- To complete the standardization of all values, we normalized all features.
- Then, we converted our time-series data to a supervised learning problem.
- For the model’s training requirements, we split the dataset into training and test sets.
- Next, we paired the input and outputs from the data sequence.
- For LSTM model, we needed to reshape the input into 3D (samples, timesteps, features).
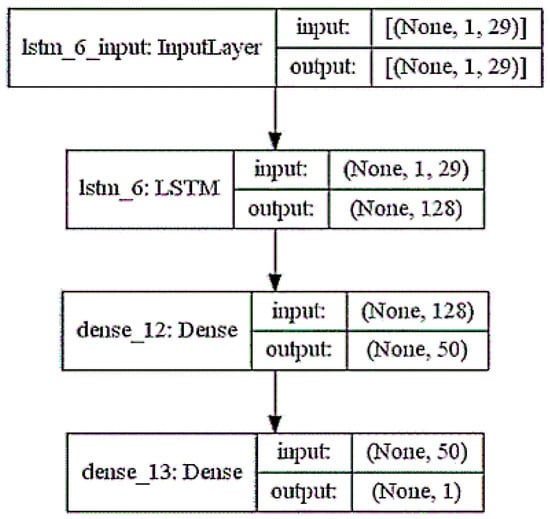
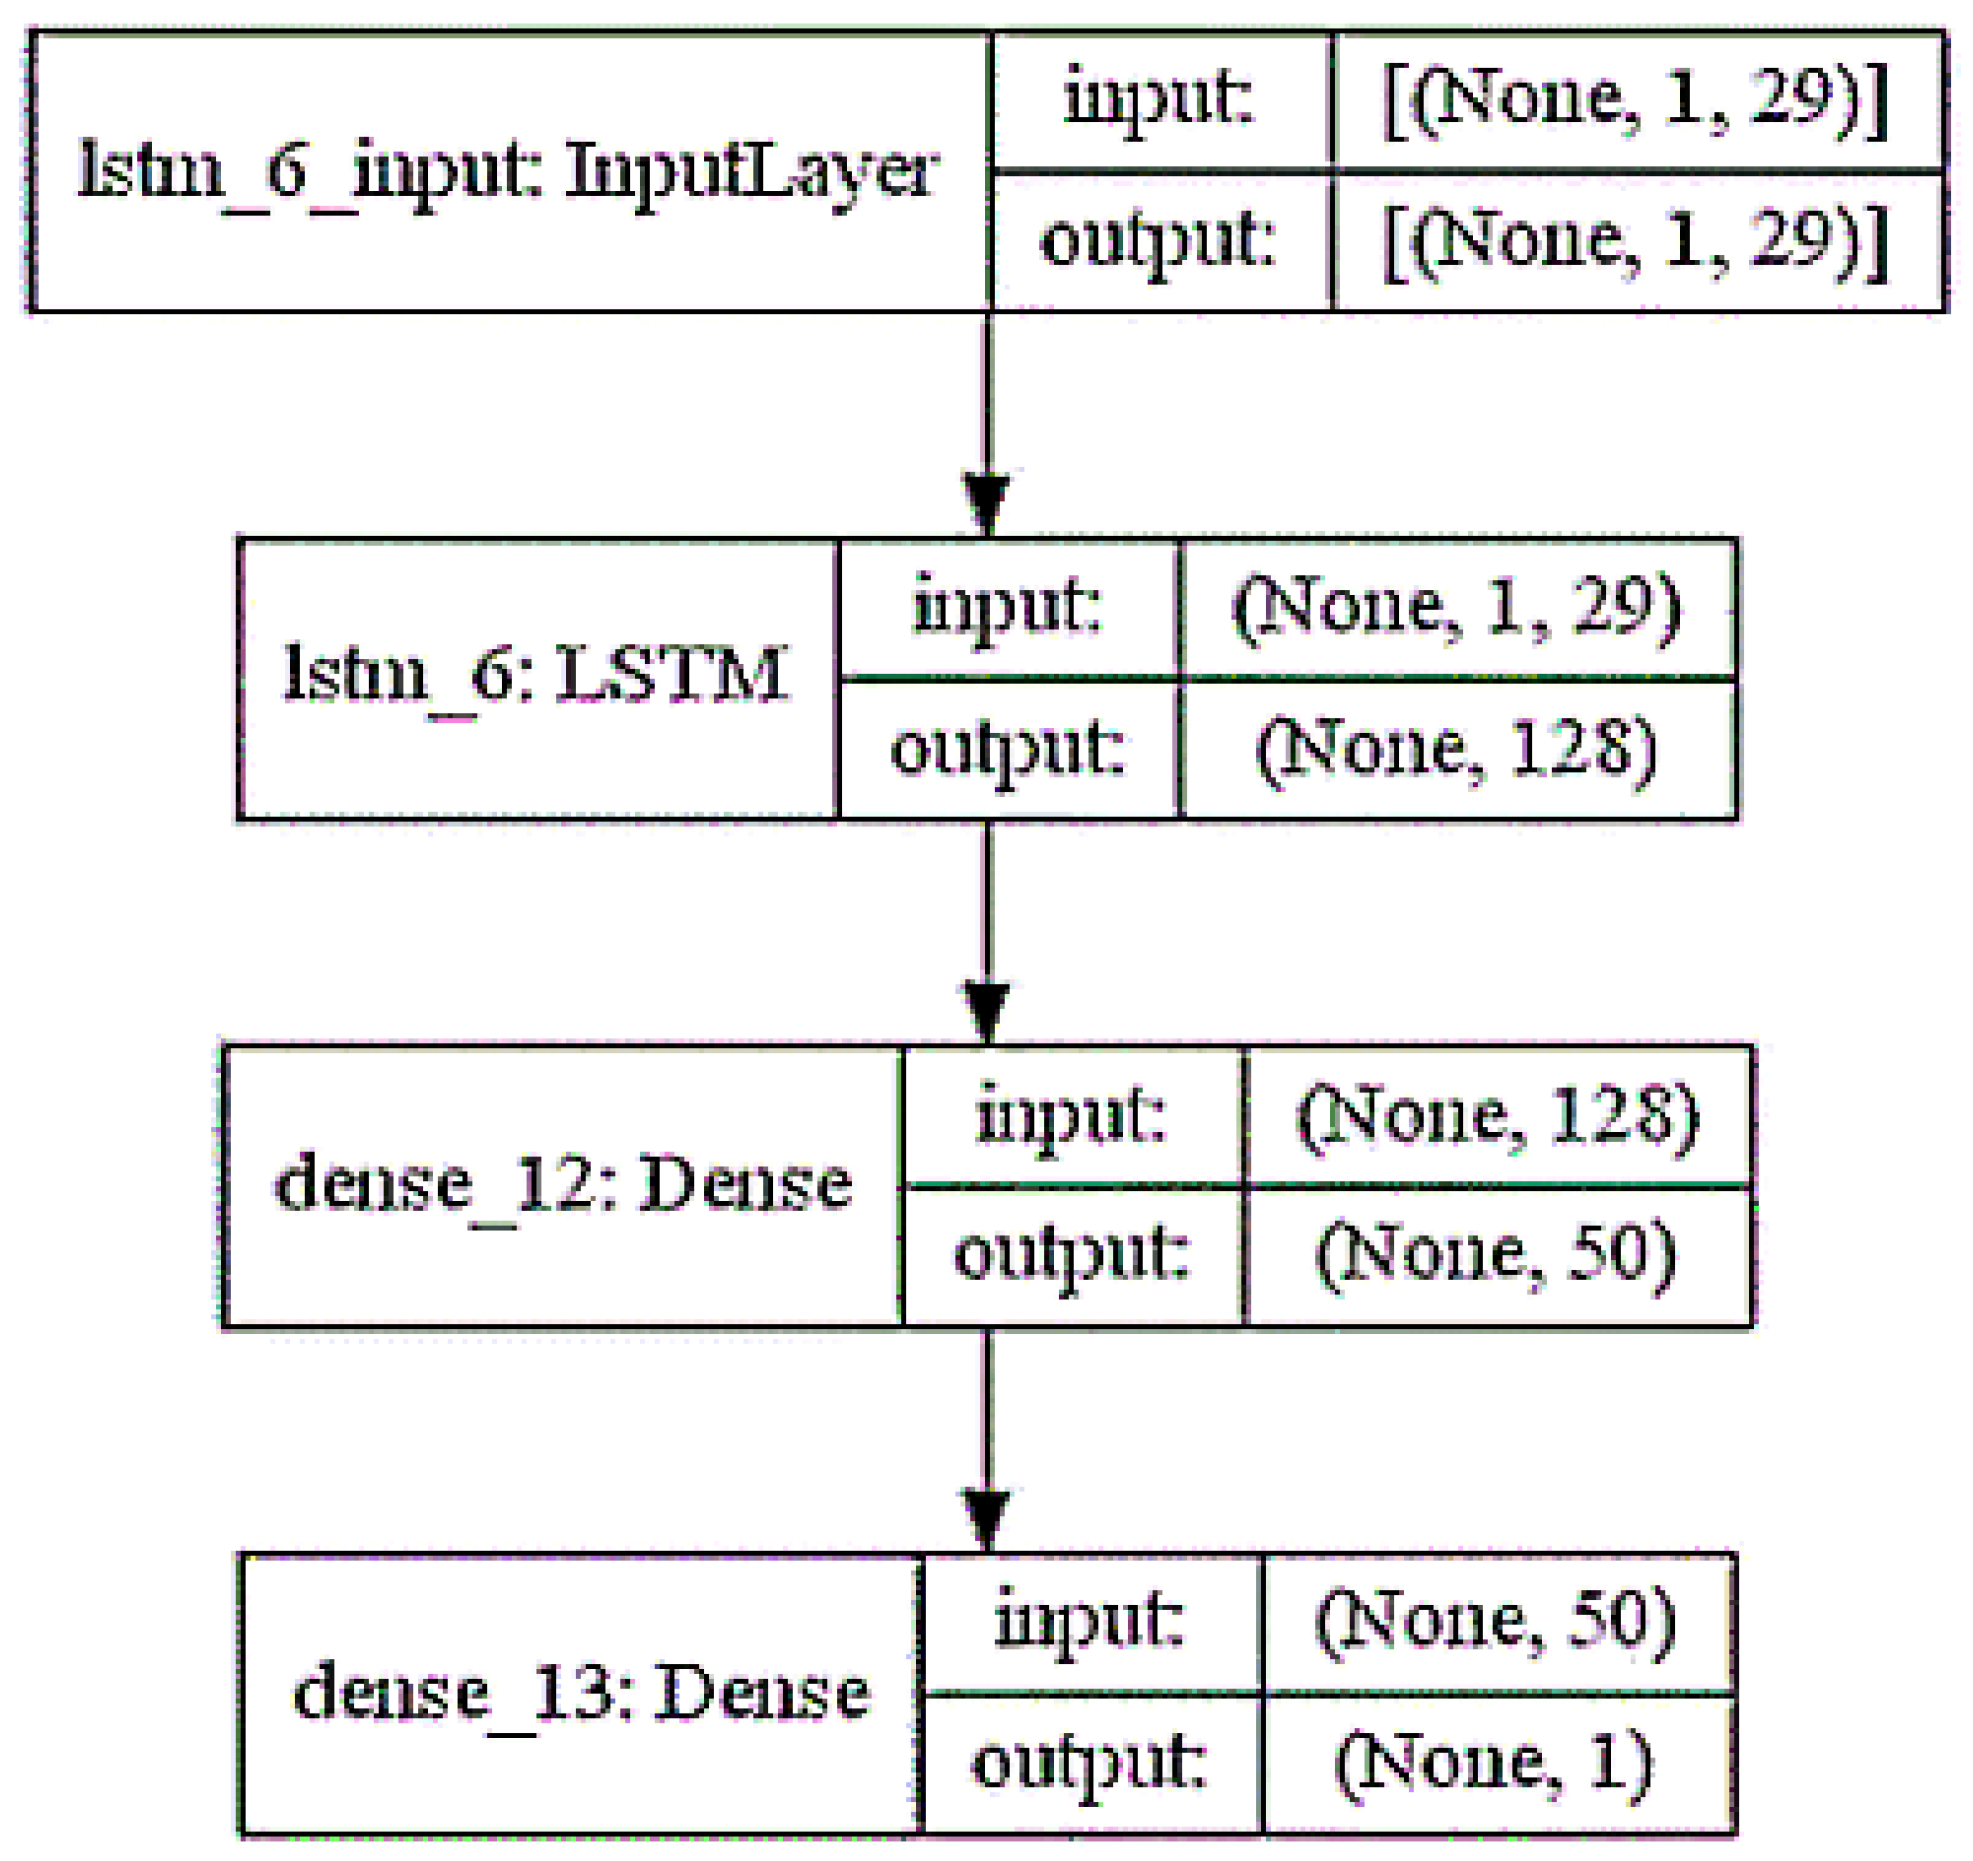
3.4. LSTM Training Modelling
Figure 2.
LSTM layers model.
Figure 3.
LSTM model plot.
The model was compiled with the setting:
- model.compile(loss = ‘mae’, optimizer = ‘adam’)
- EarlyStopping(monitor = “val_loss”, patience = 20, verbose = 1, mode = “auto”)
- history = model.fit(train_X, train_y, epochs = 200, batch_size = 72, validation_data = (test_X, test_y), validation_split = 0.33, verbose = 1, shuffle = False, callbacks = [callback])
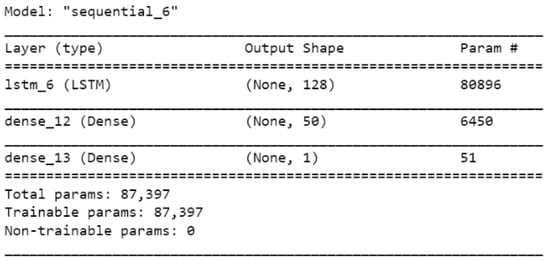
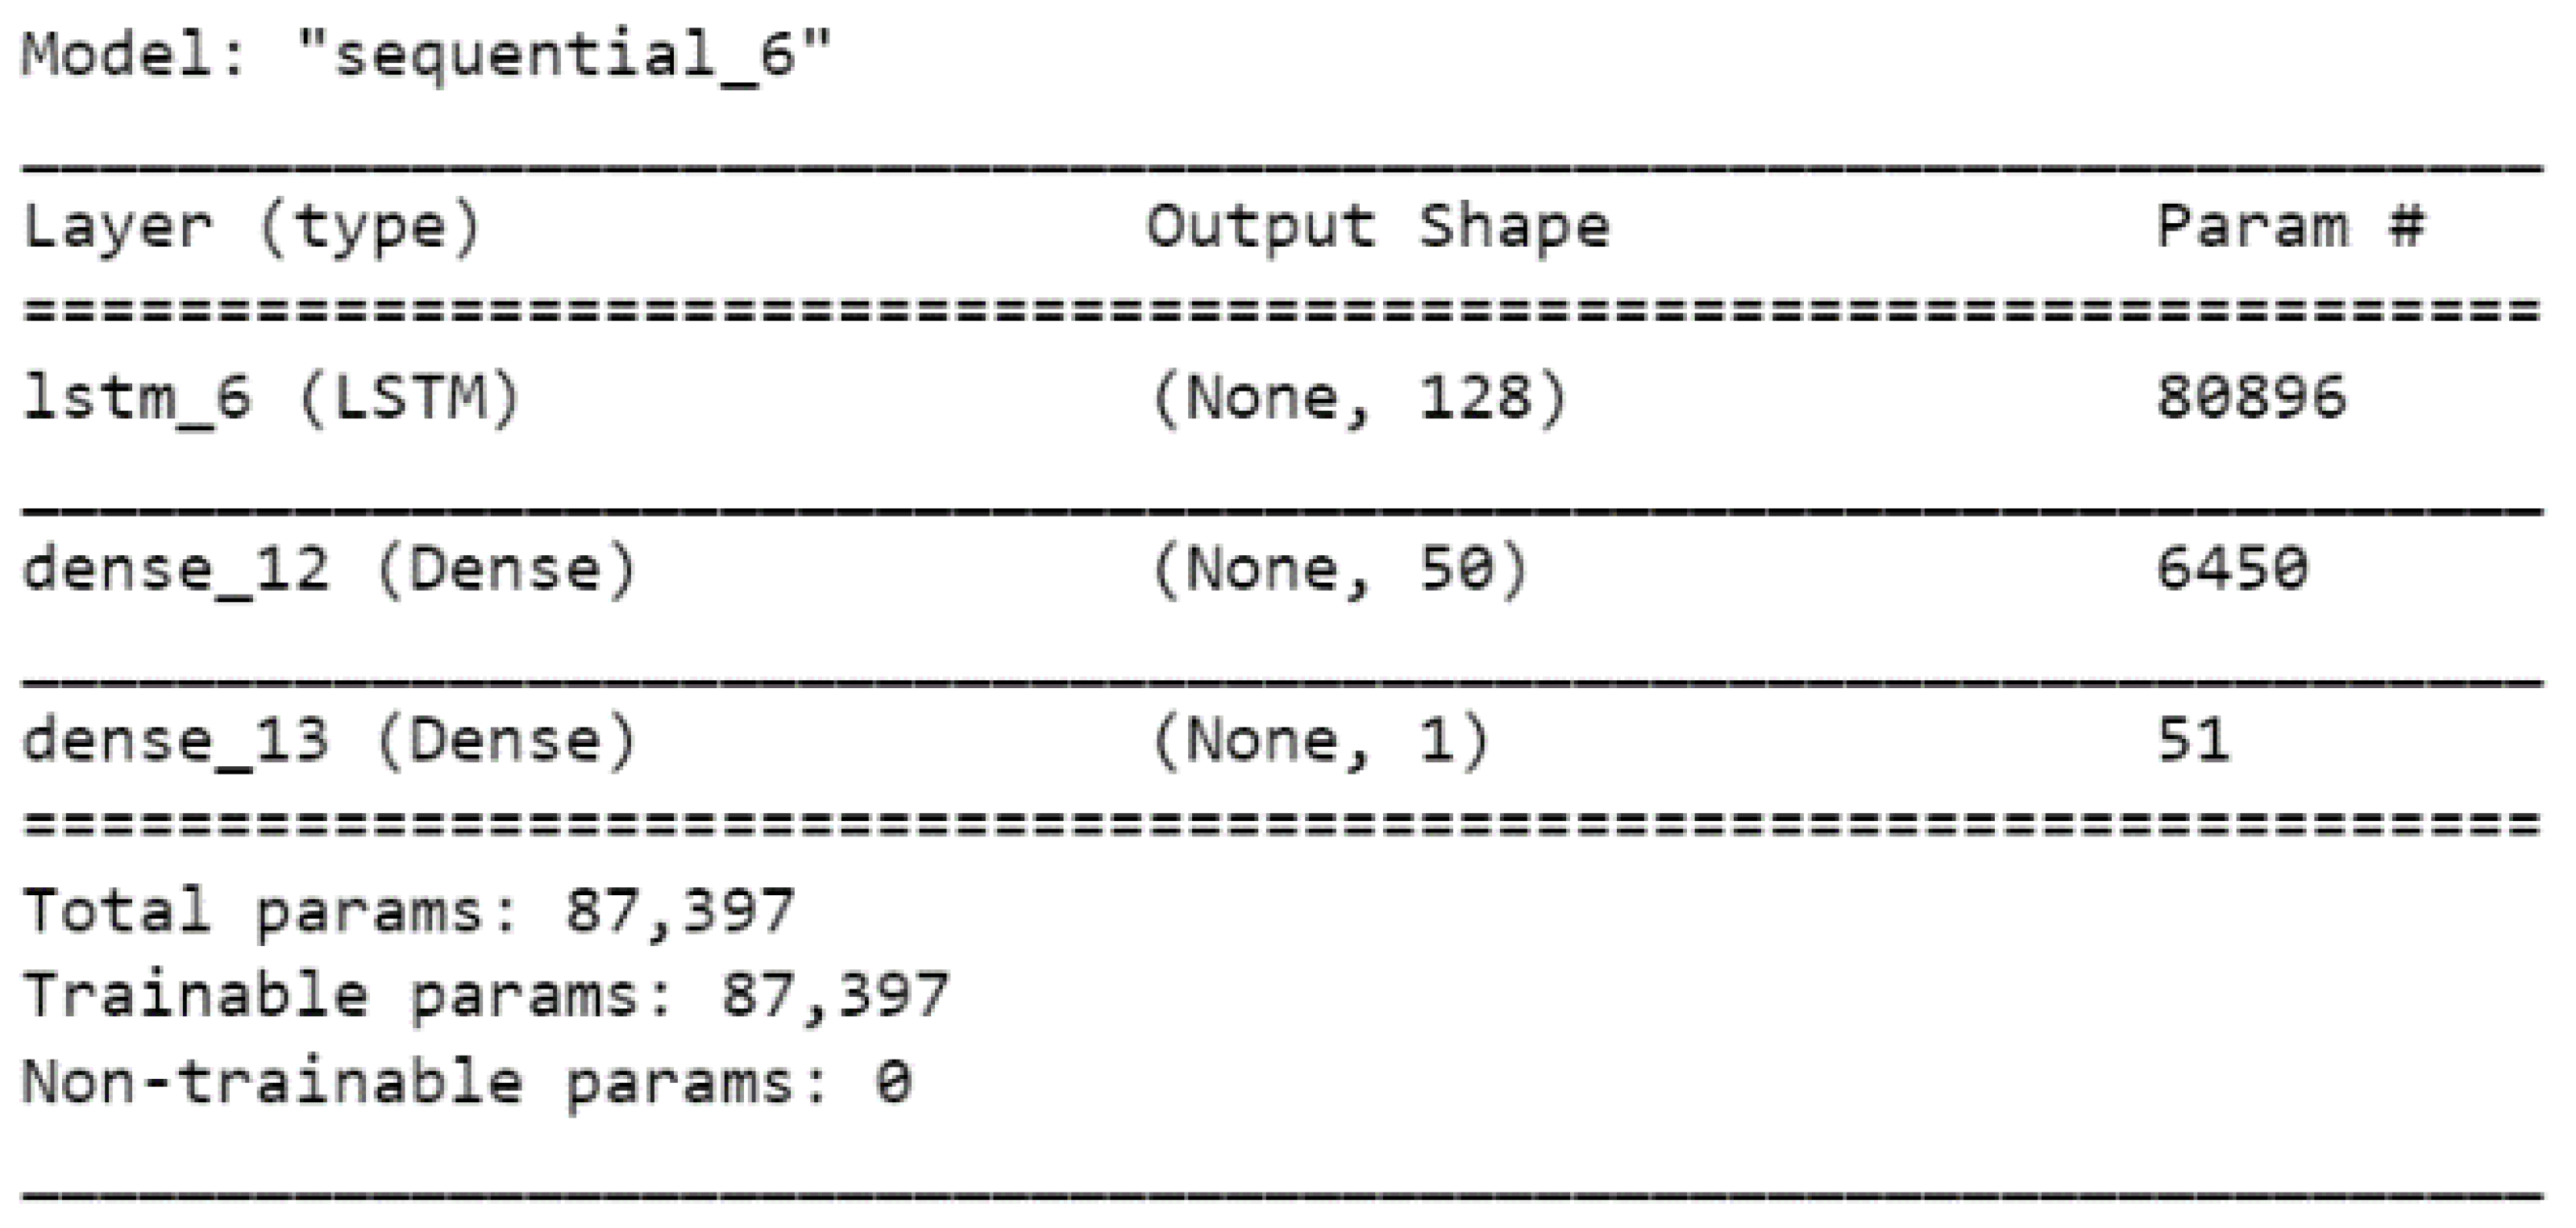
The training was based on MAE Loss, with an Adam Optimizer. We implemented the EarlyStopping method to avoid overfitting. The fit network was set in 200 epochs, and a 72 batch size.
To make a prediction, the process is as follows.
- Feed the model into test data.
- Invert scaling for forecast data.
- Invert scaling for actual data.
- Calculate RMSE.
4. Results
Based on the designed experiments, we have 28 models for comparison. The results are as follows.
4.1. Matrix Correlations
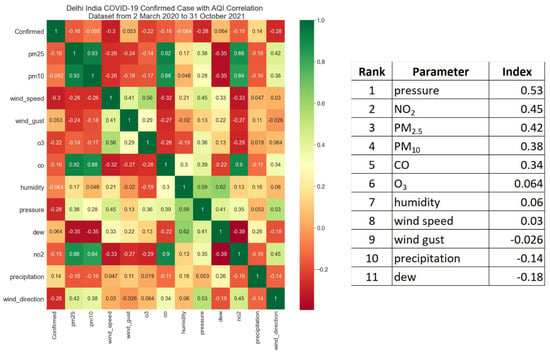
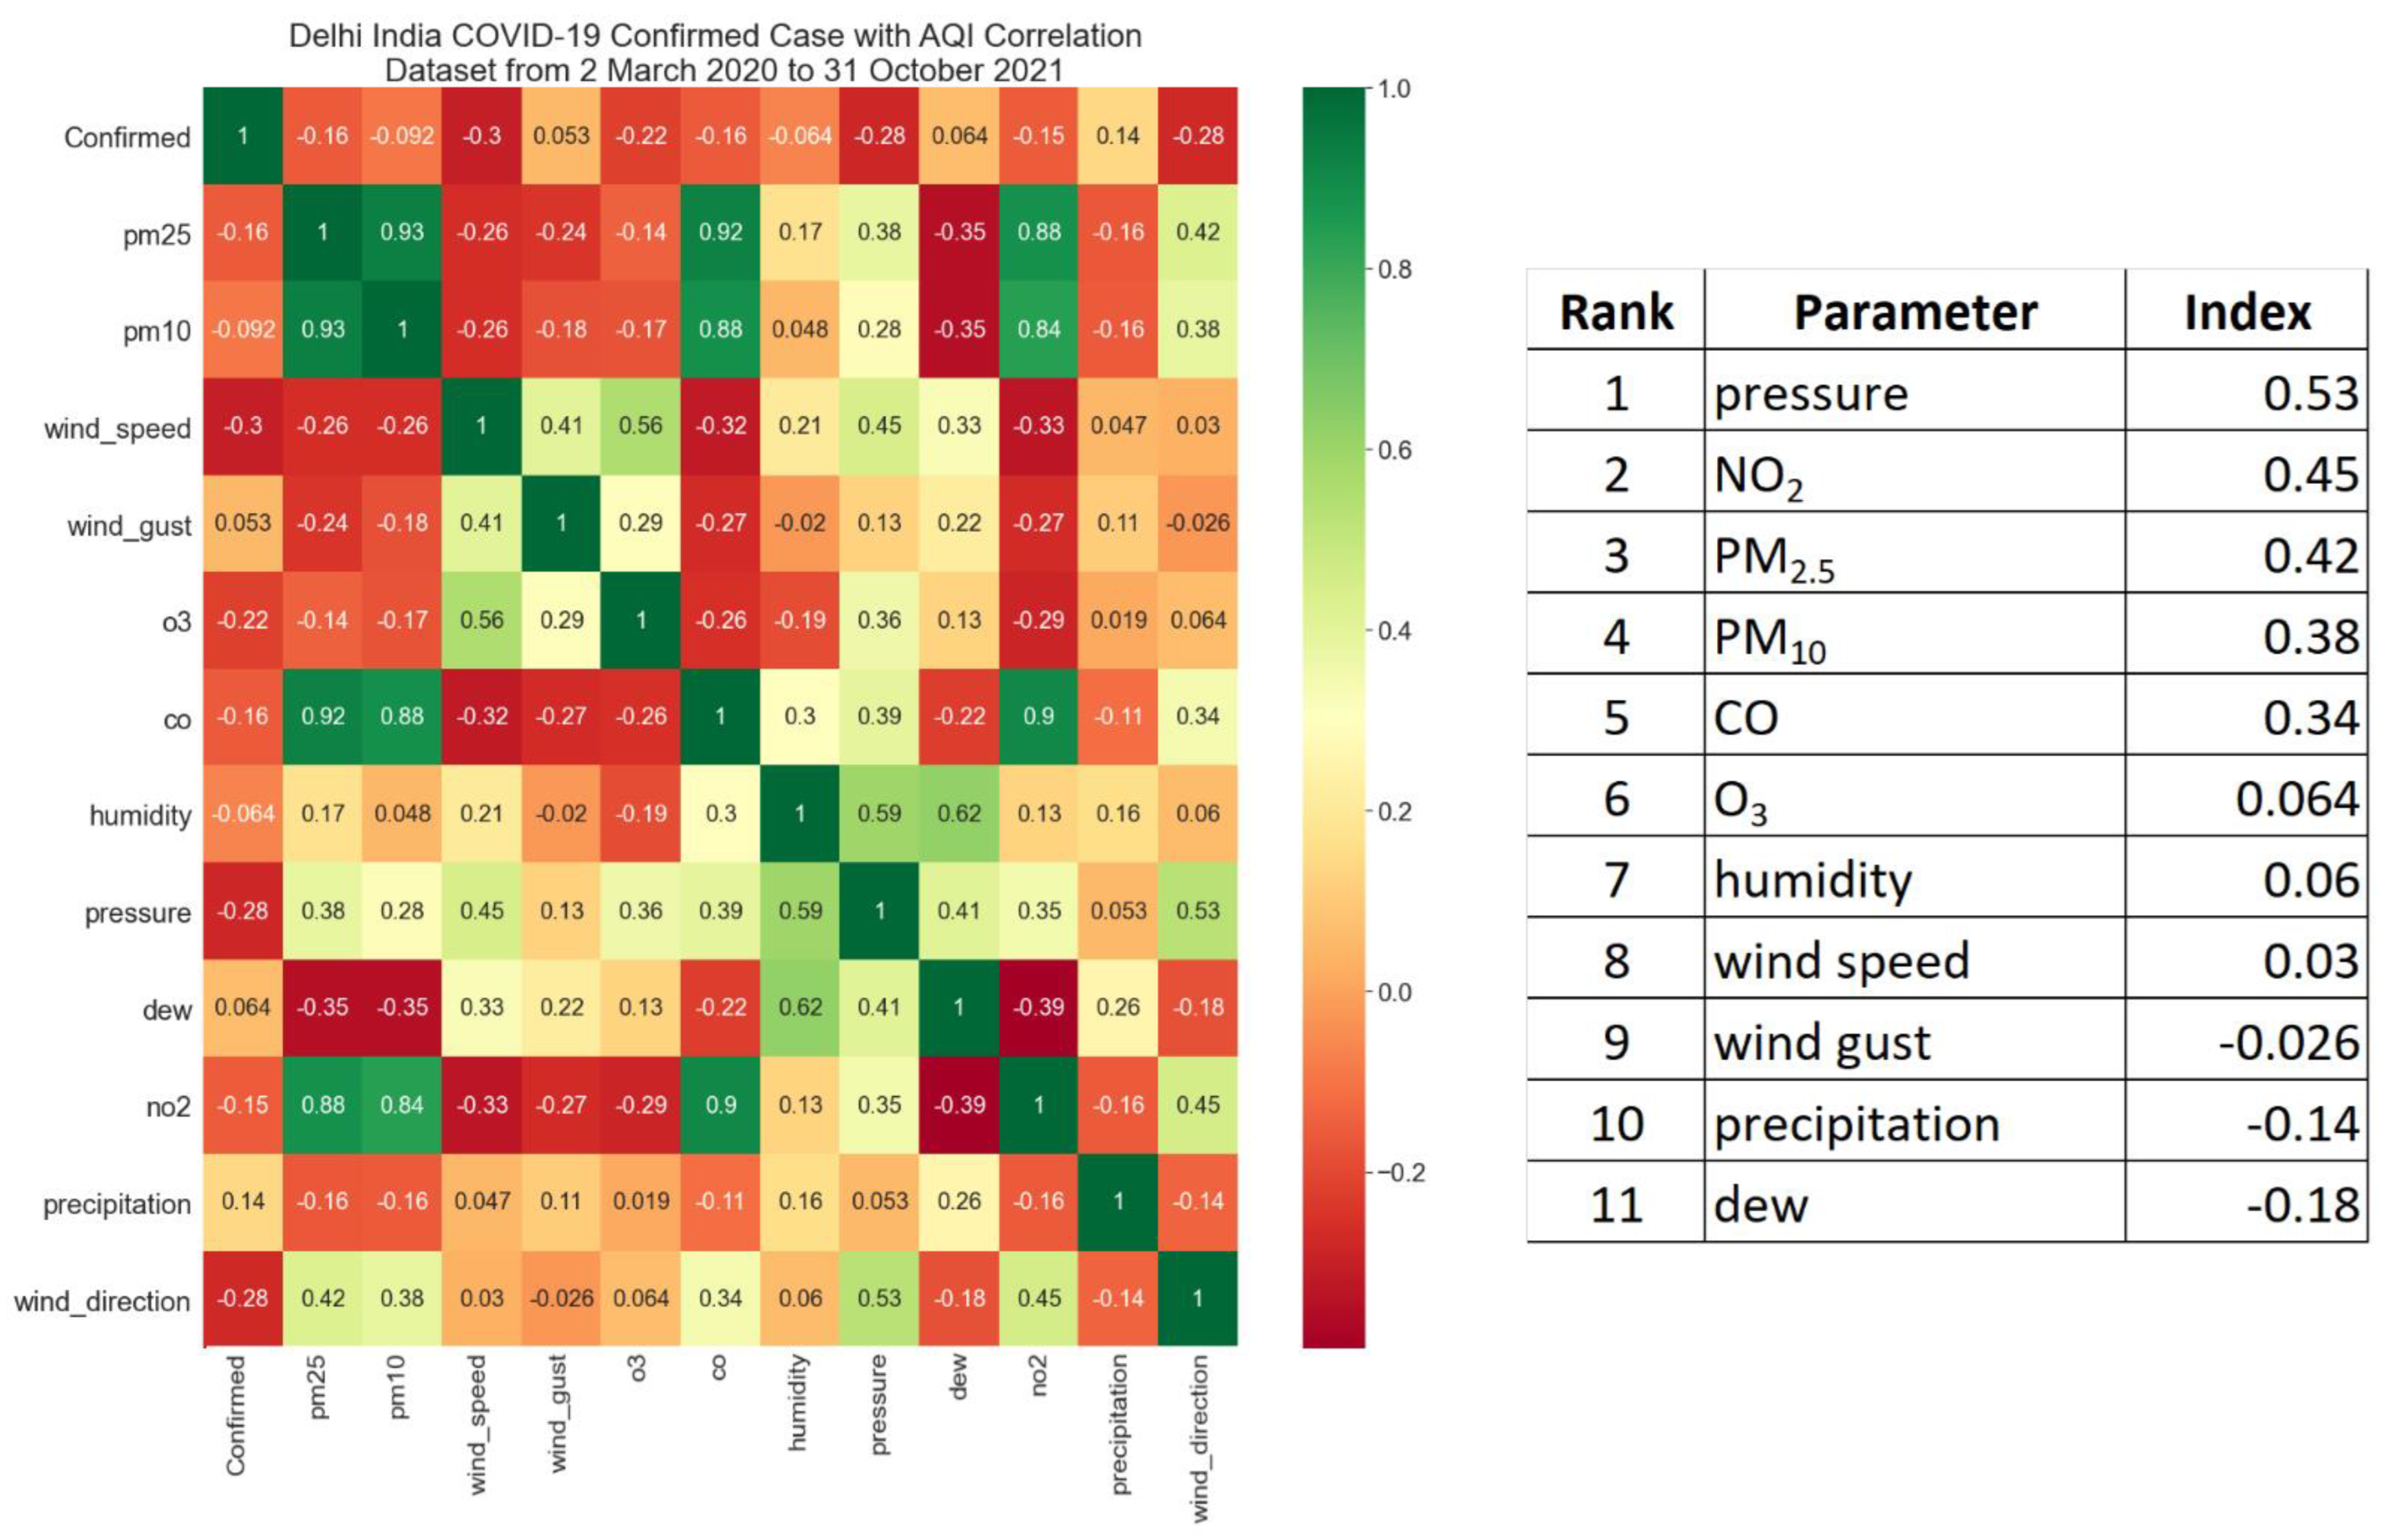
Based on the matrix correlation in Figure 4, it can be seen that there are 3 parameters that have a strong positive correlation, which are pressure, NO2, and PM2.5 at 0.53, 0.45, and 0.42, respectively.
Figure 4.
Matrix correlation of air pollutants and COVID-19.
4.2. Model Training Results
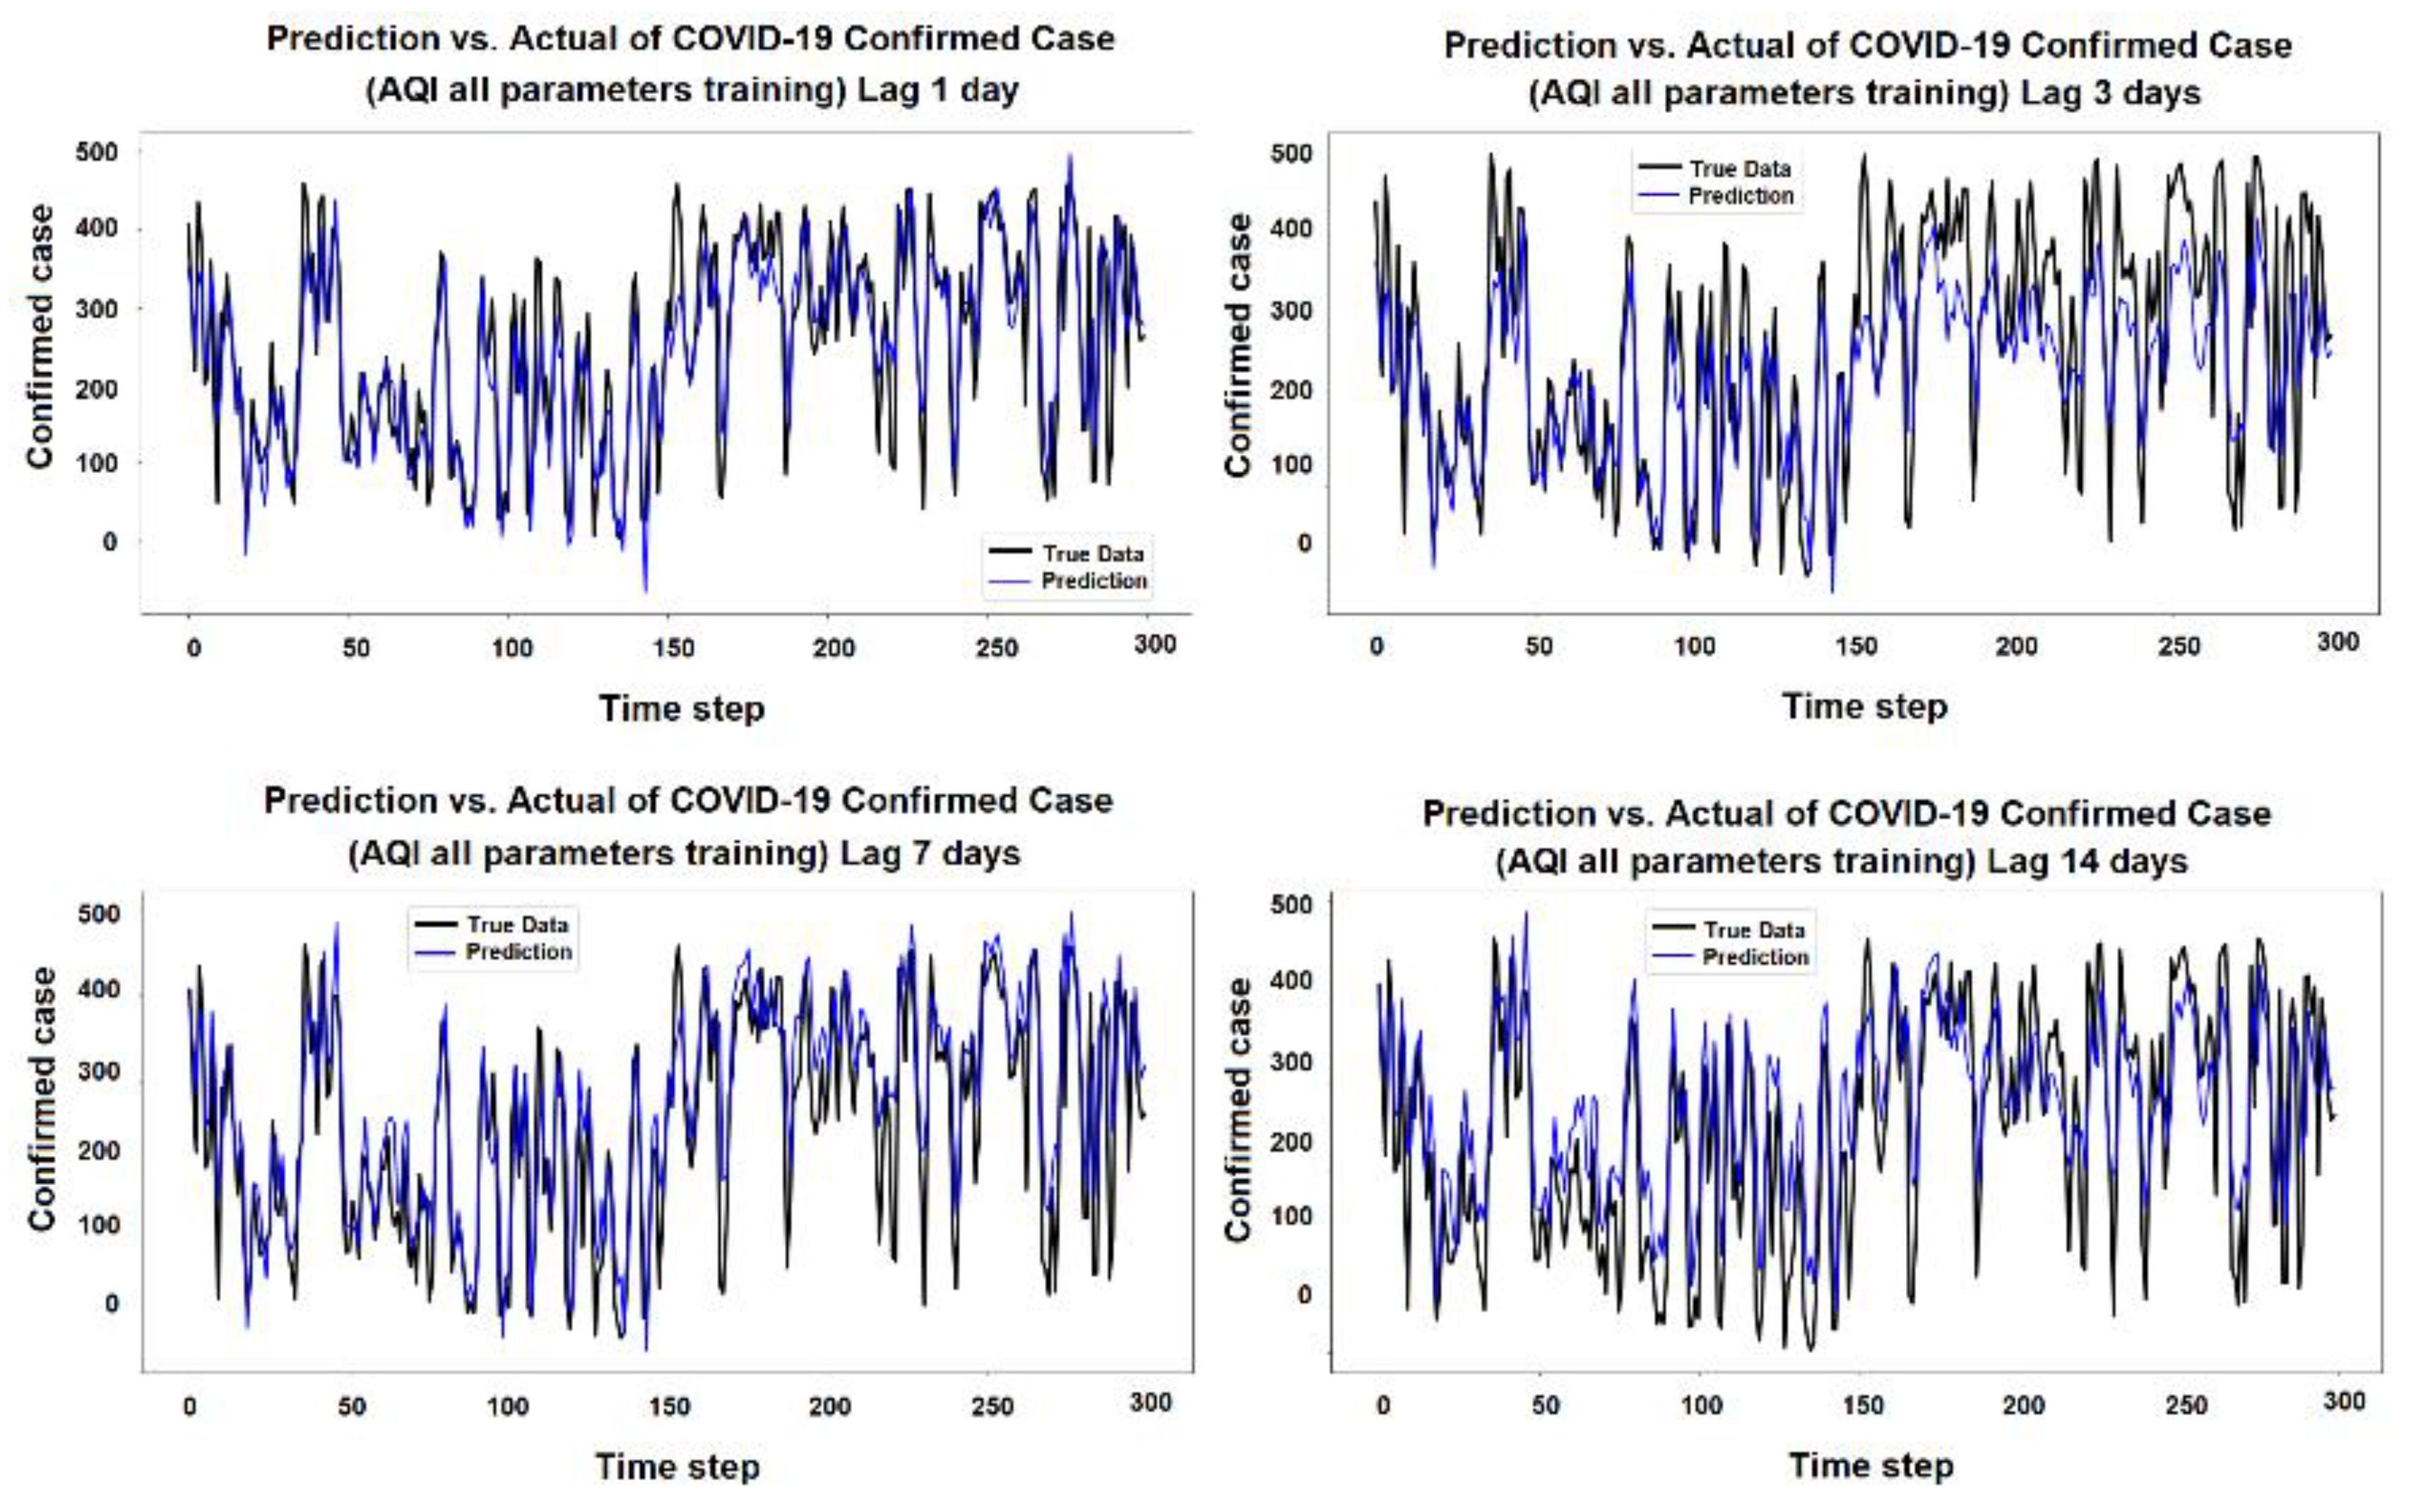
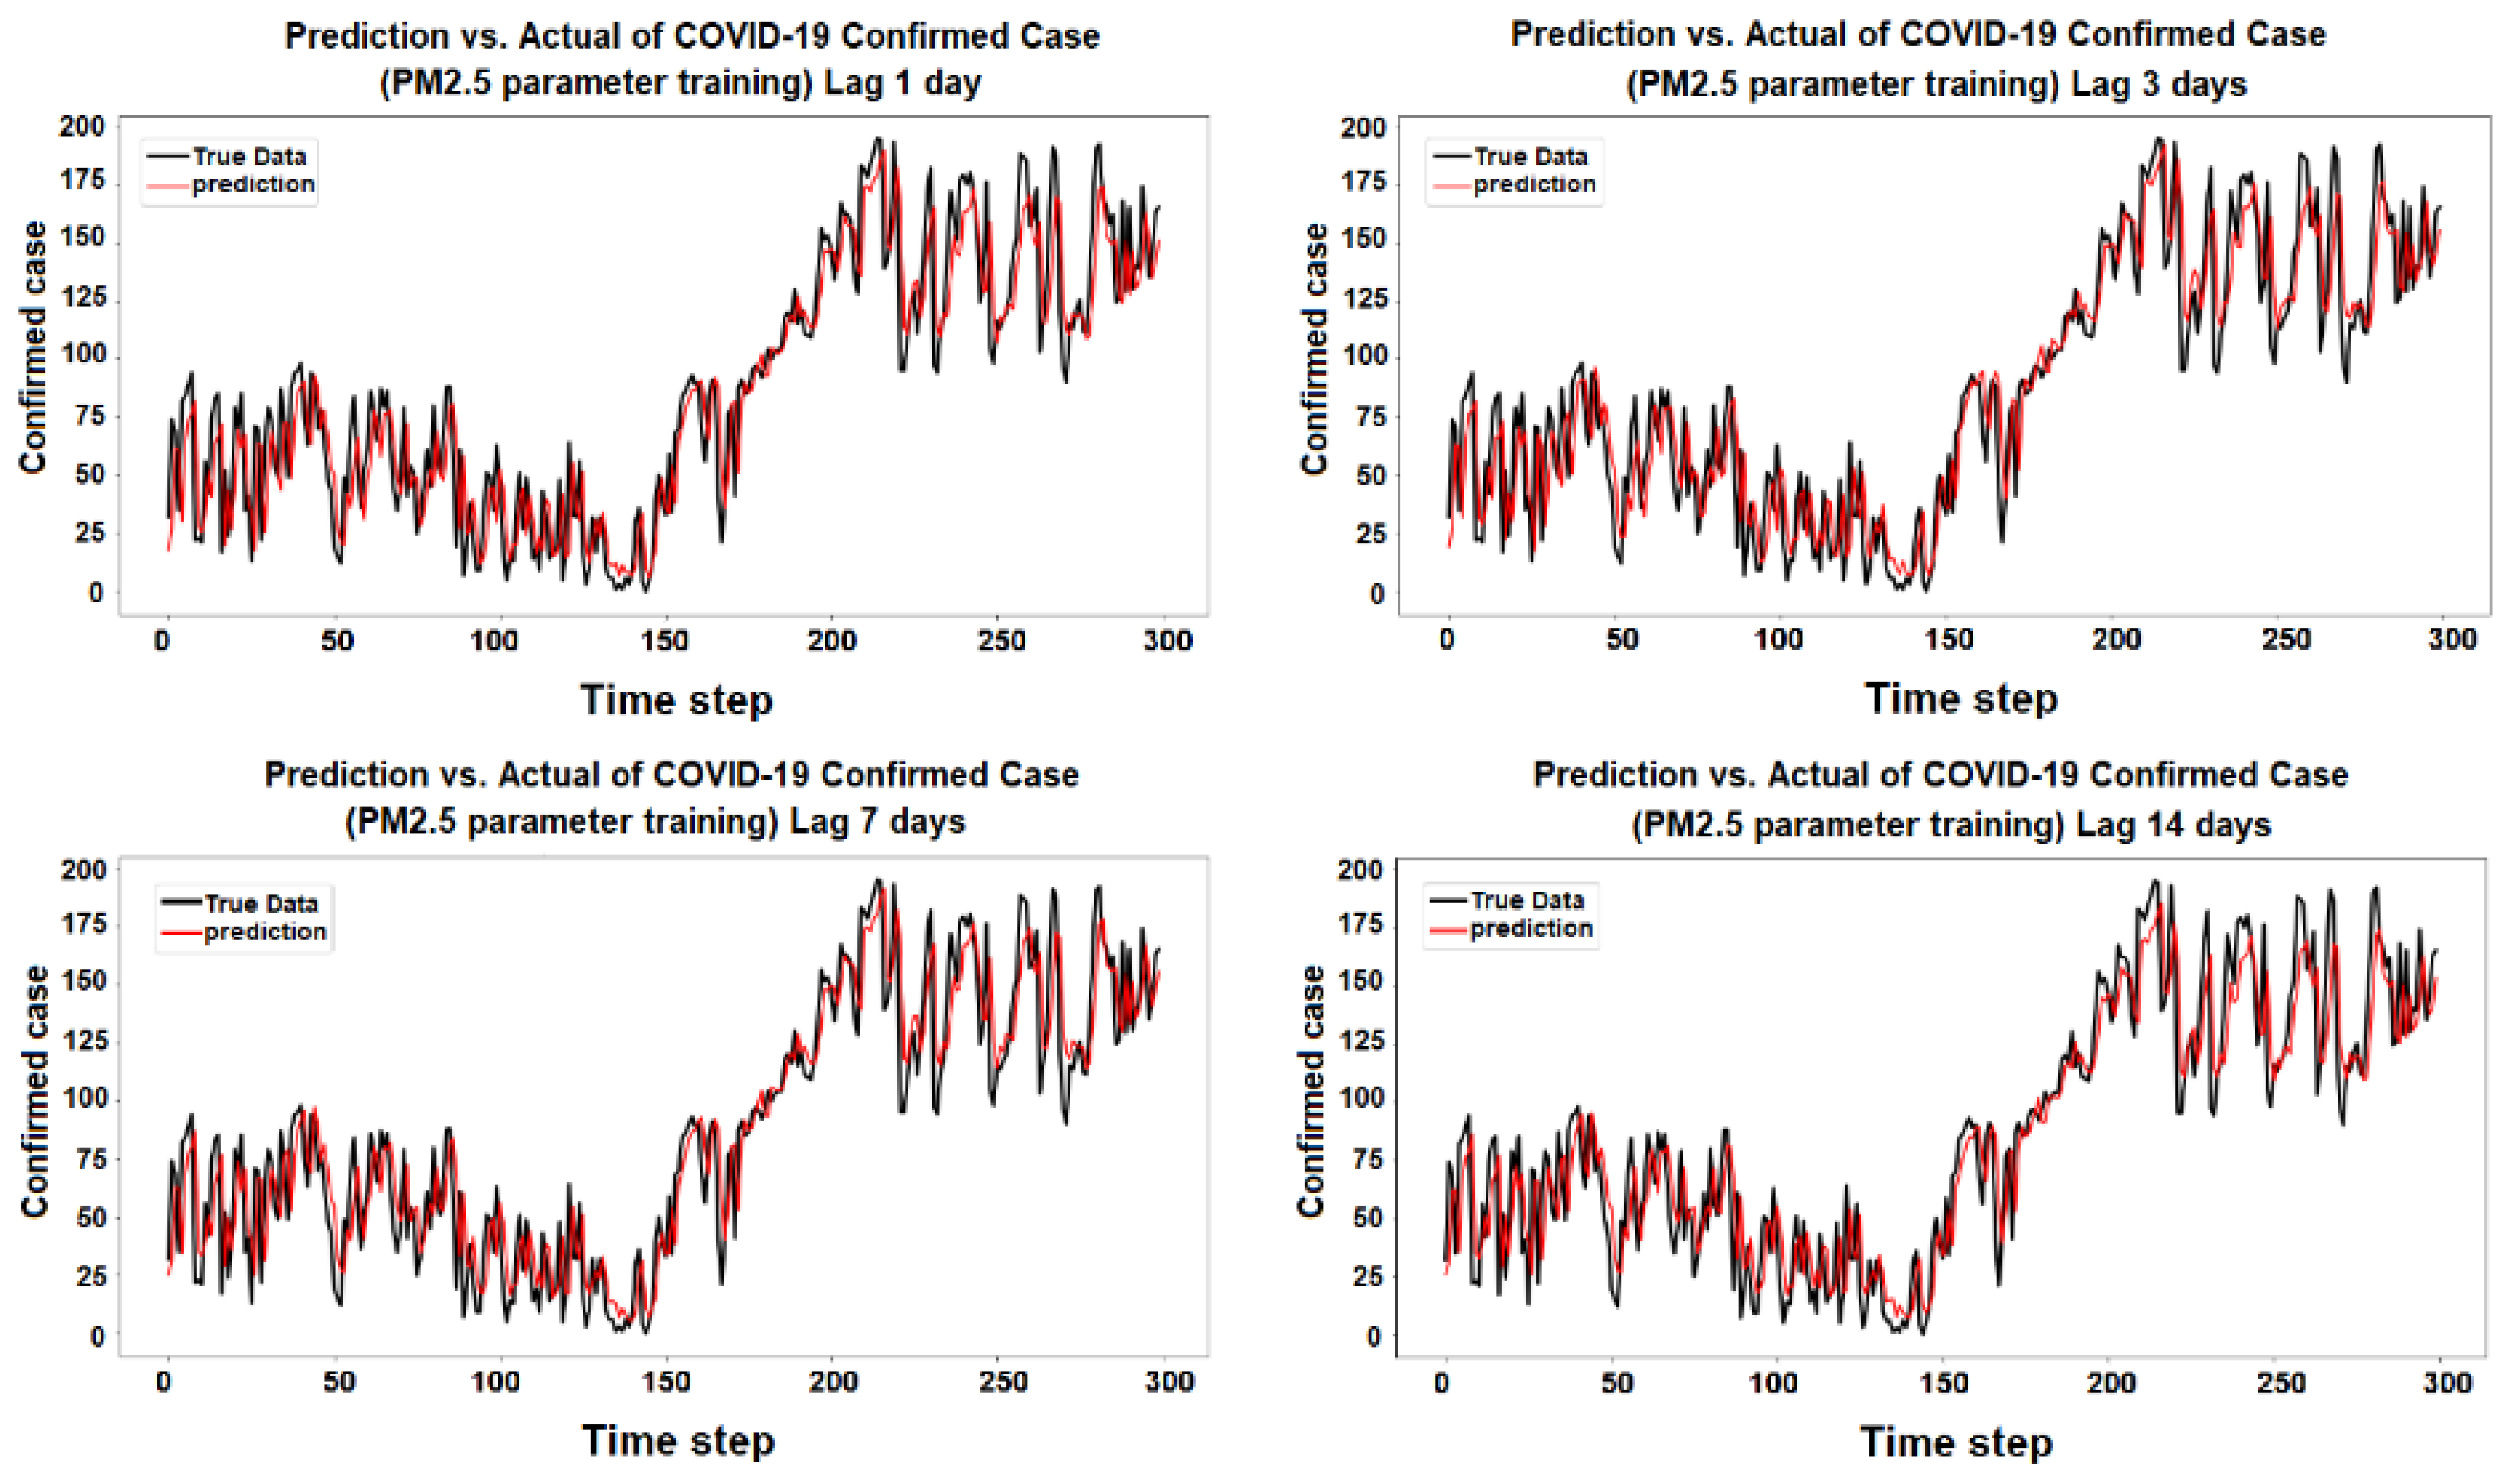
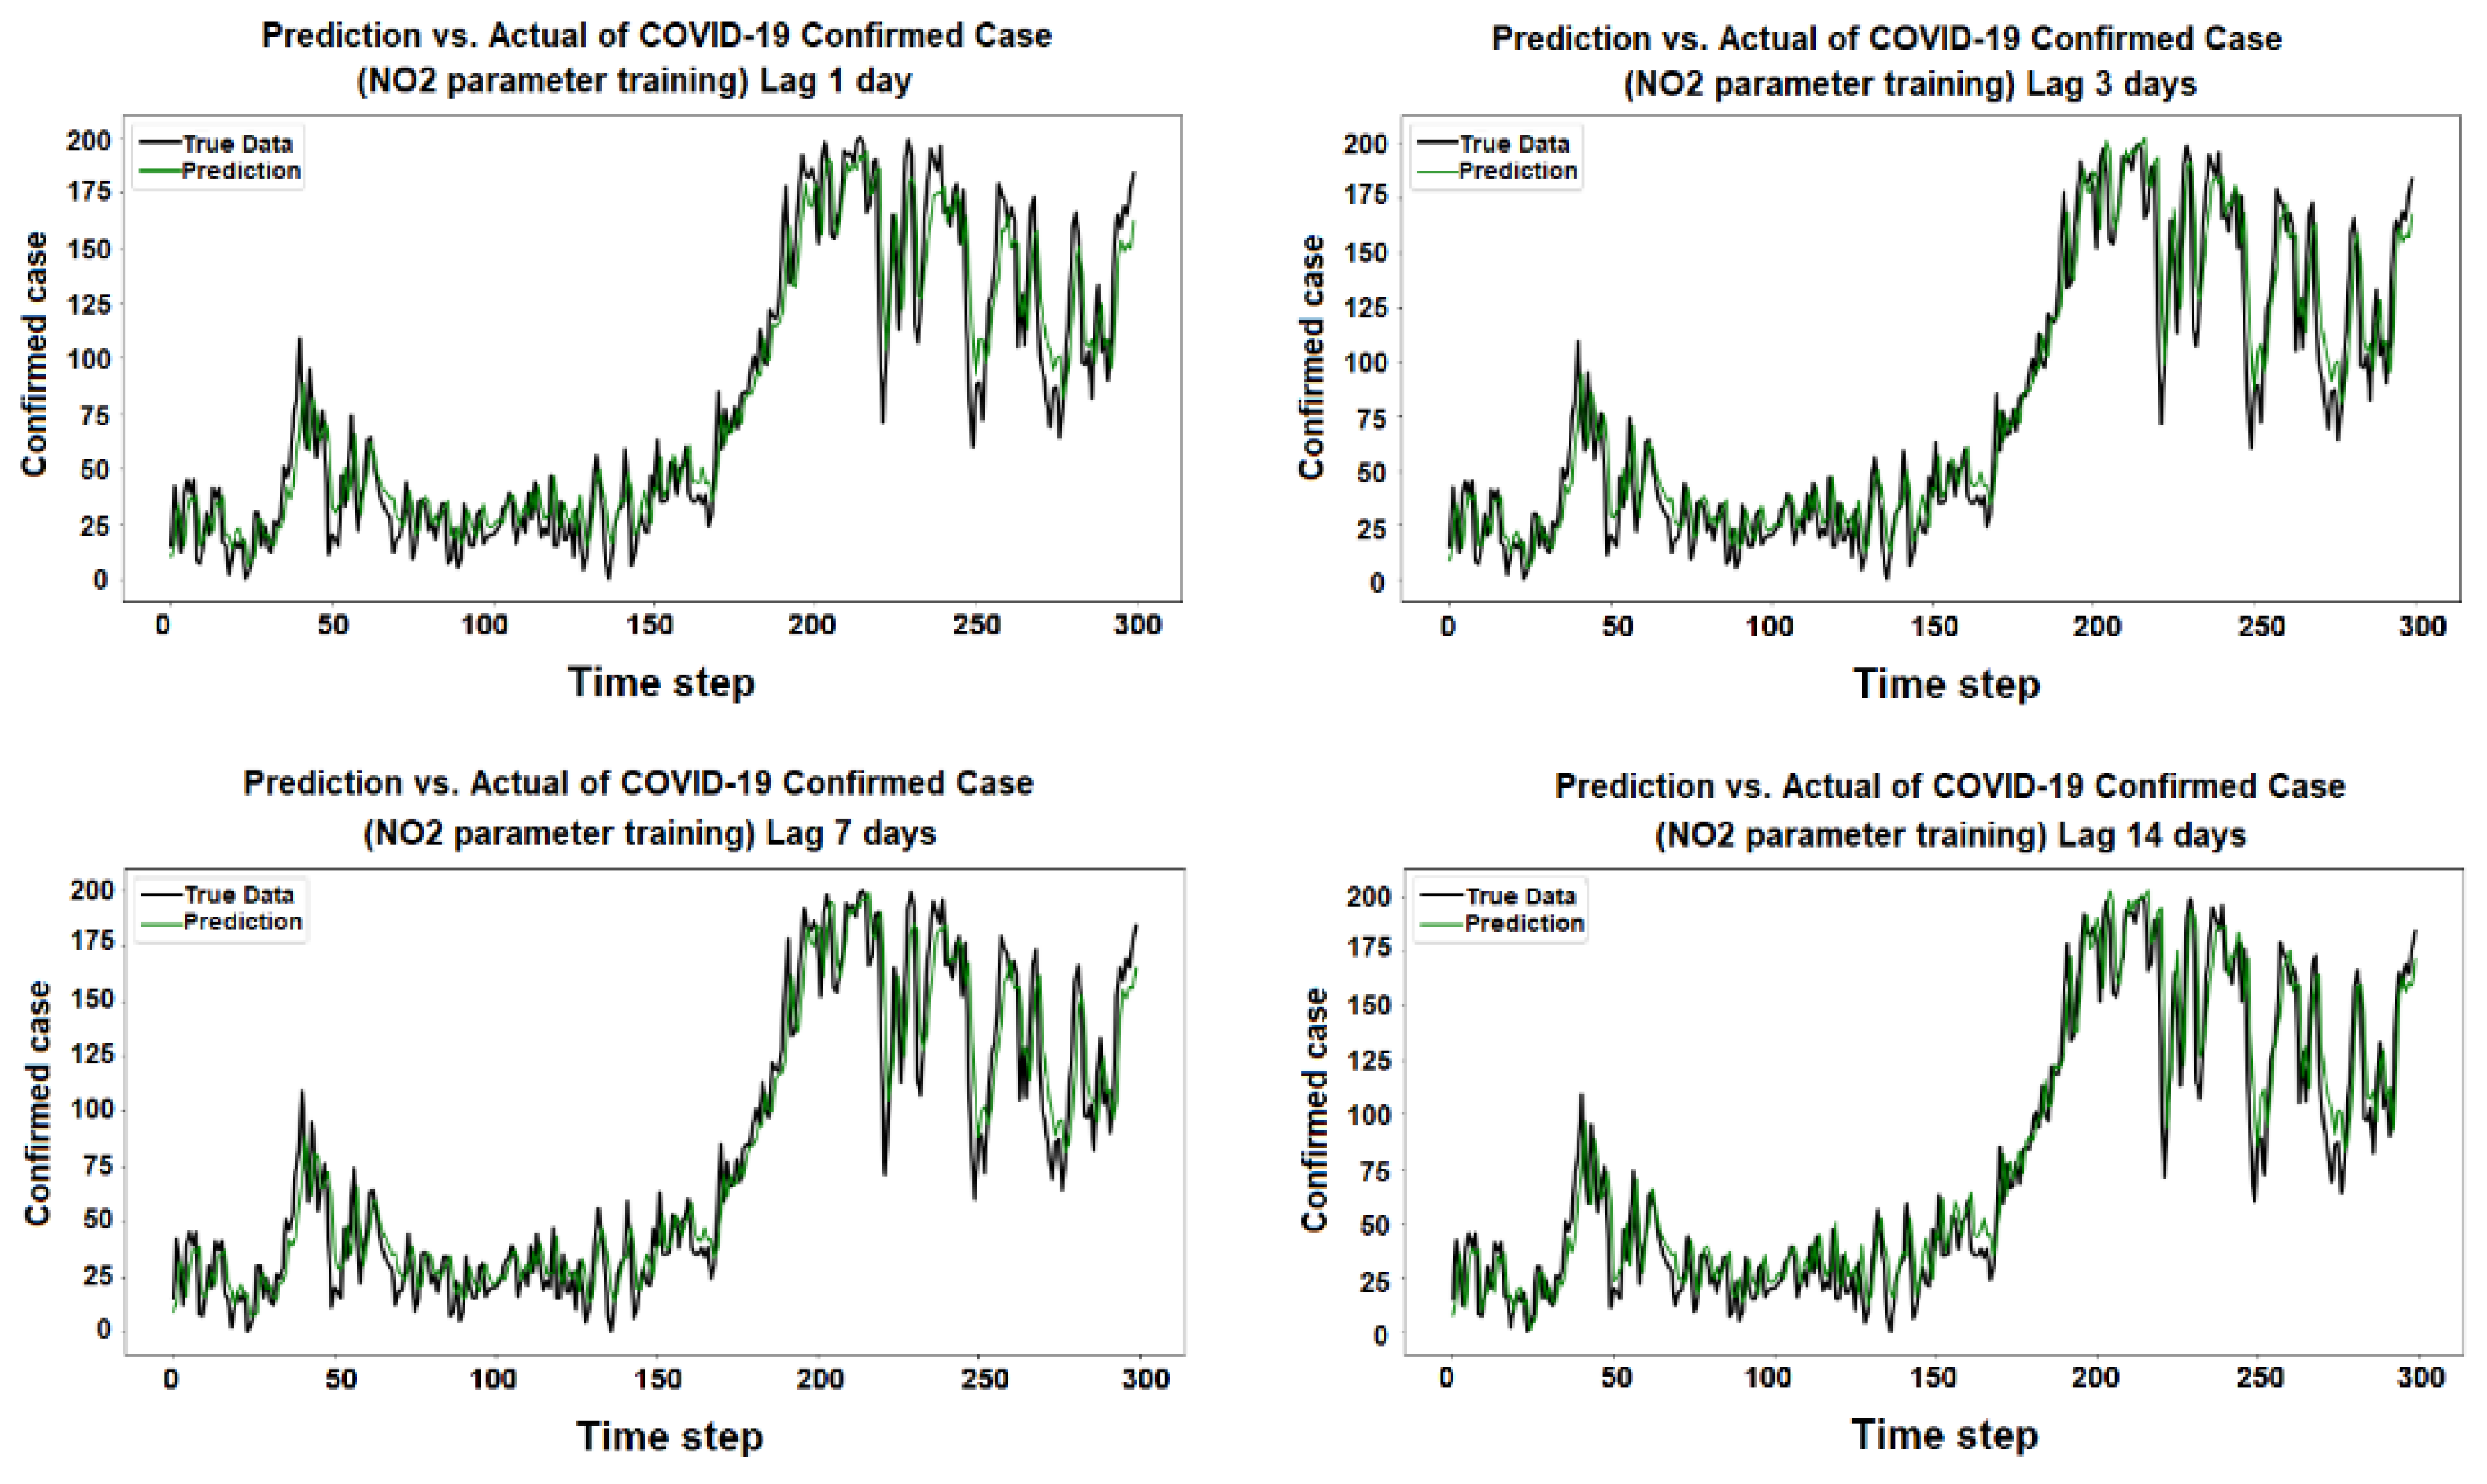
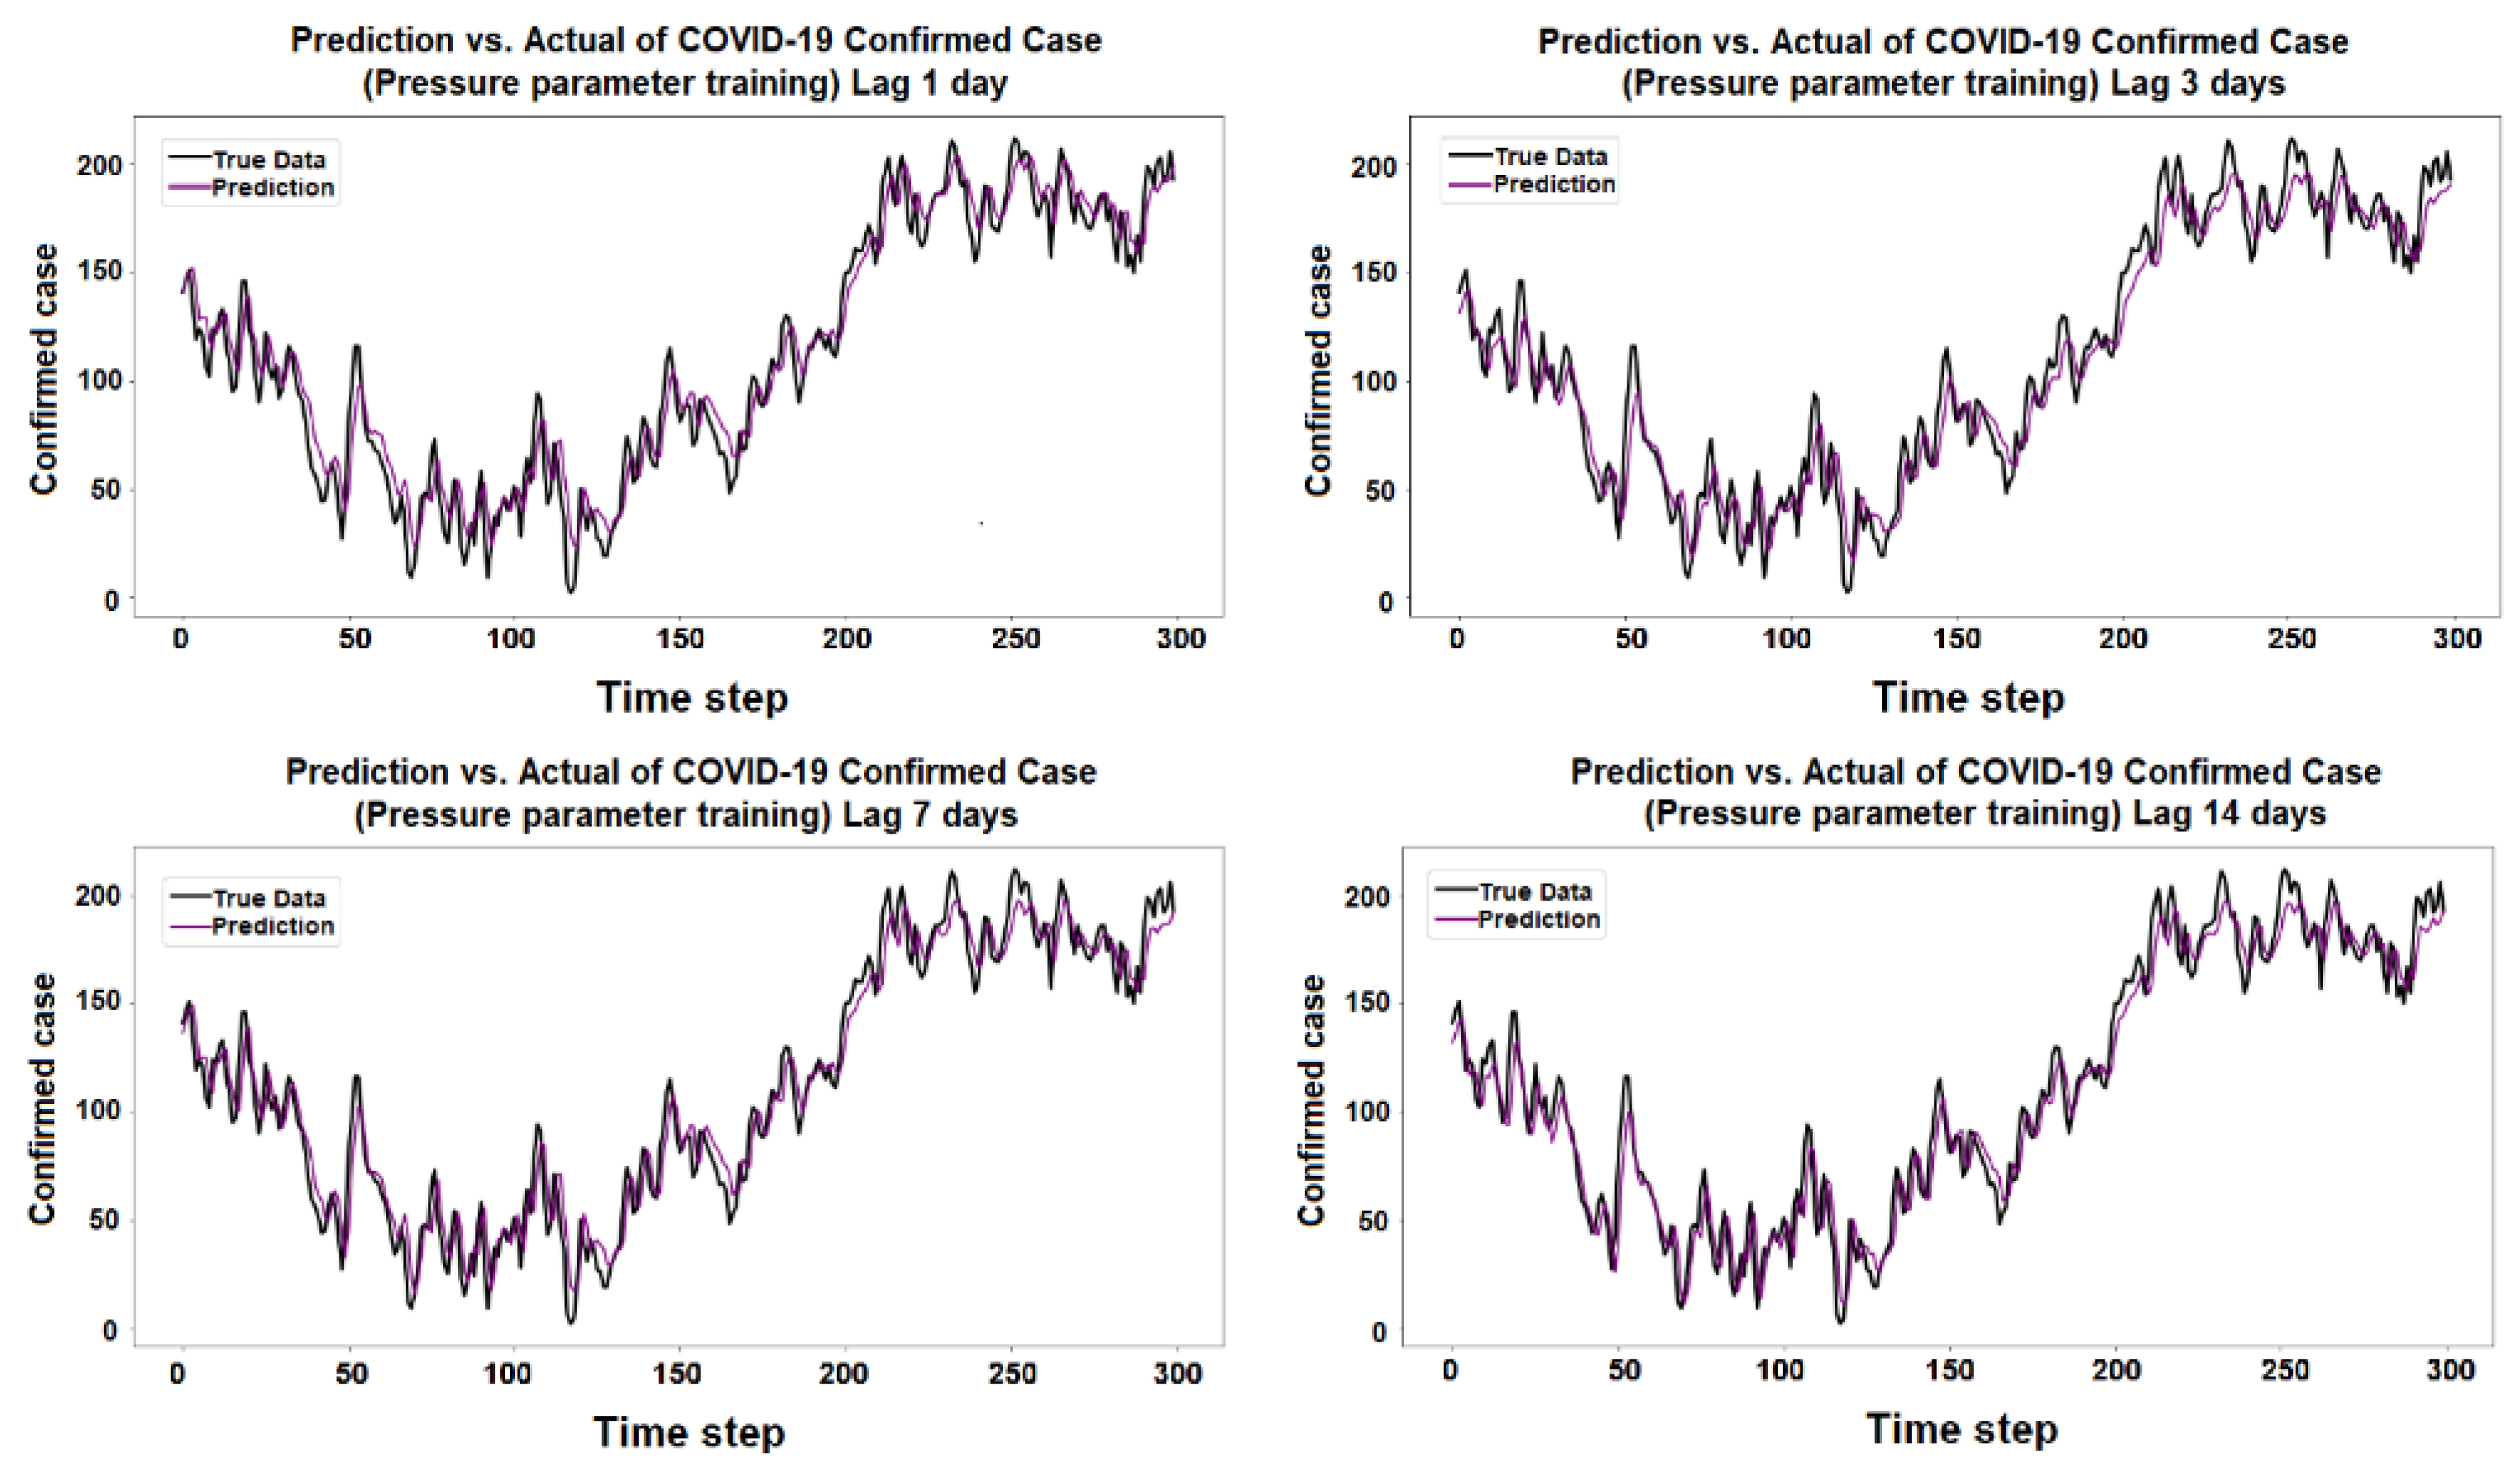
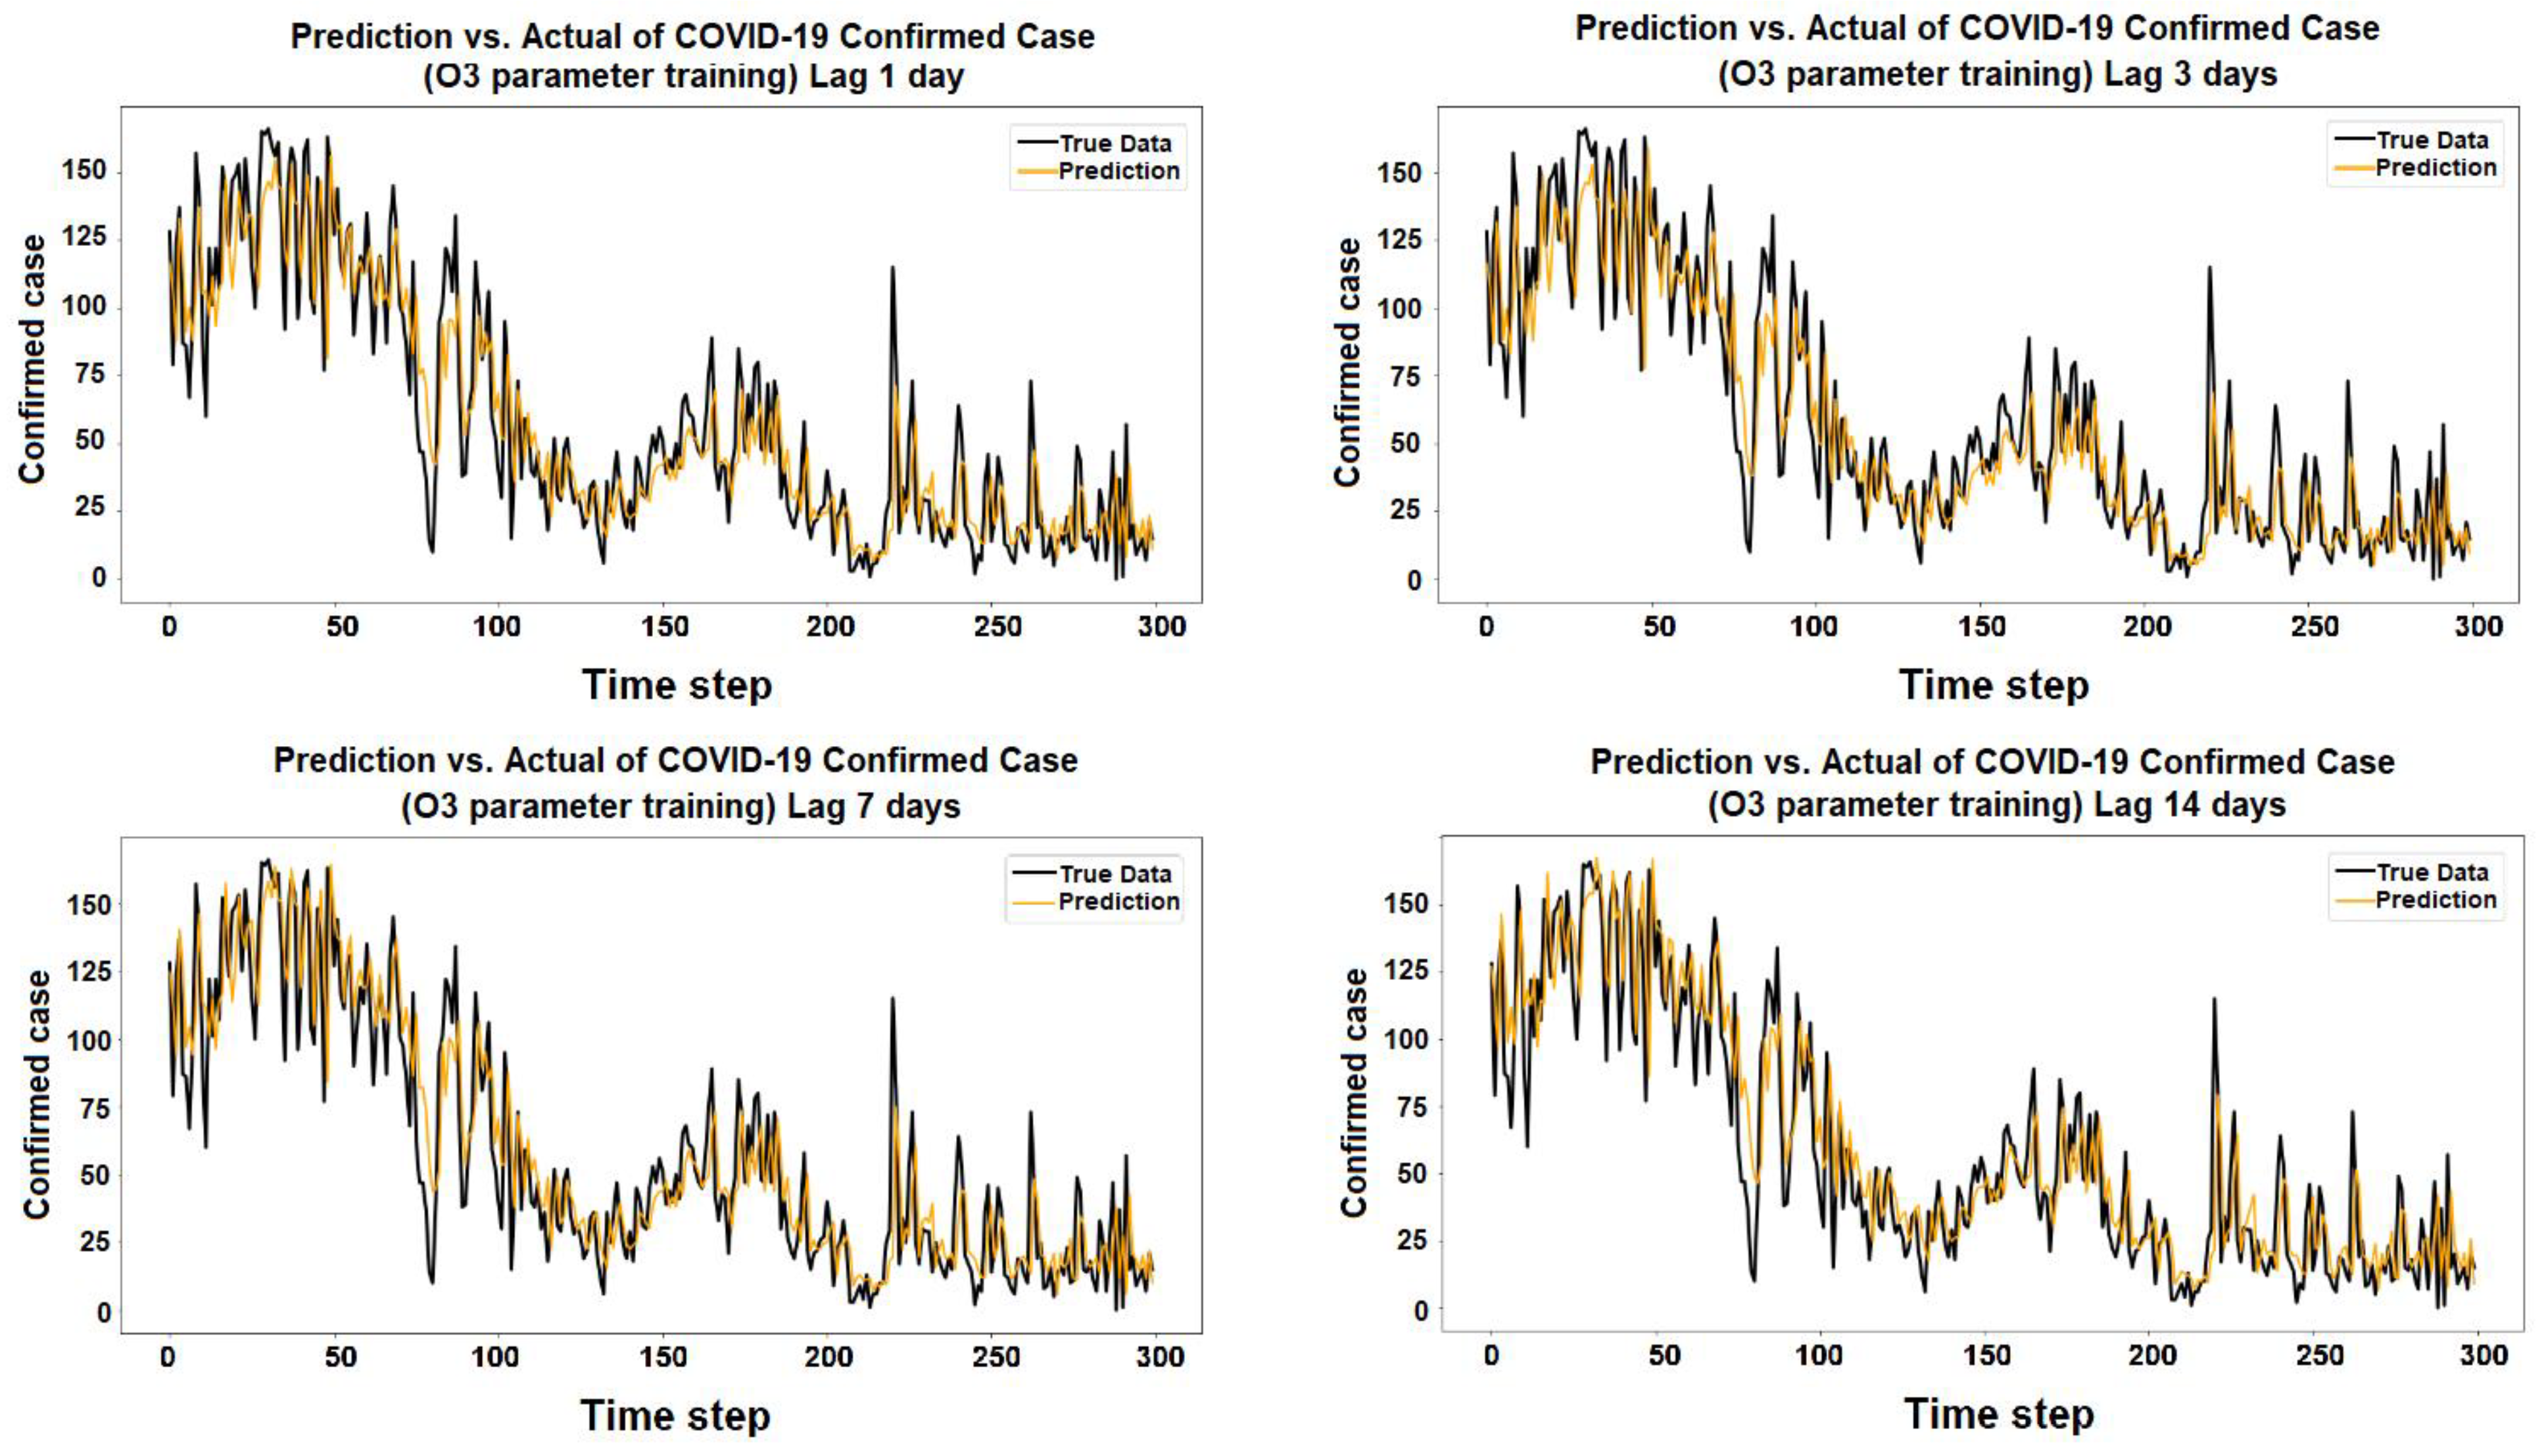
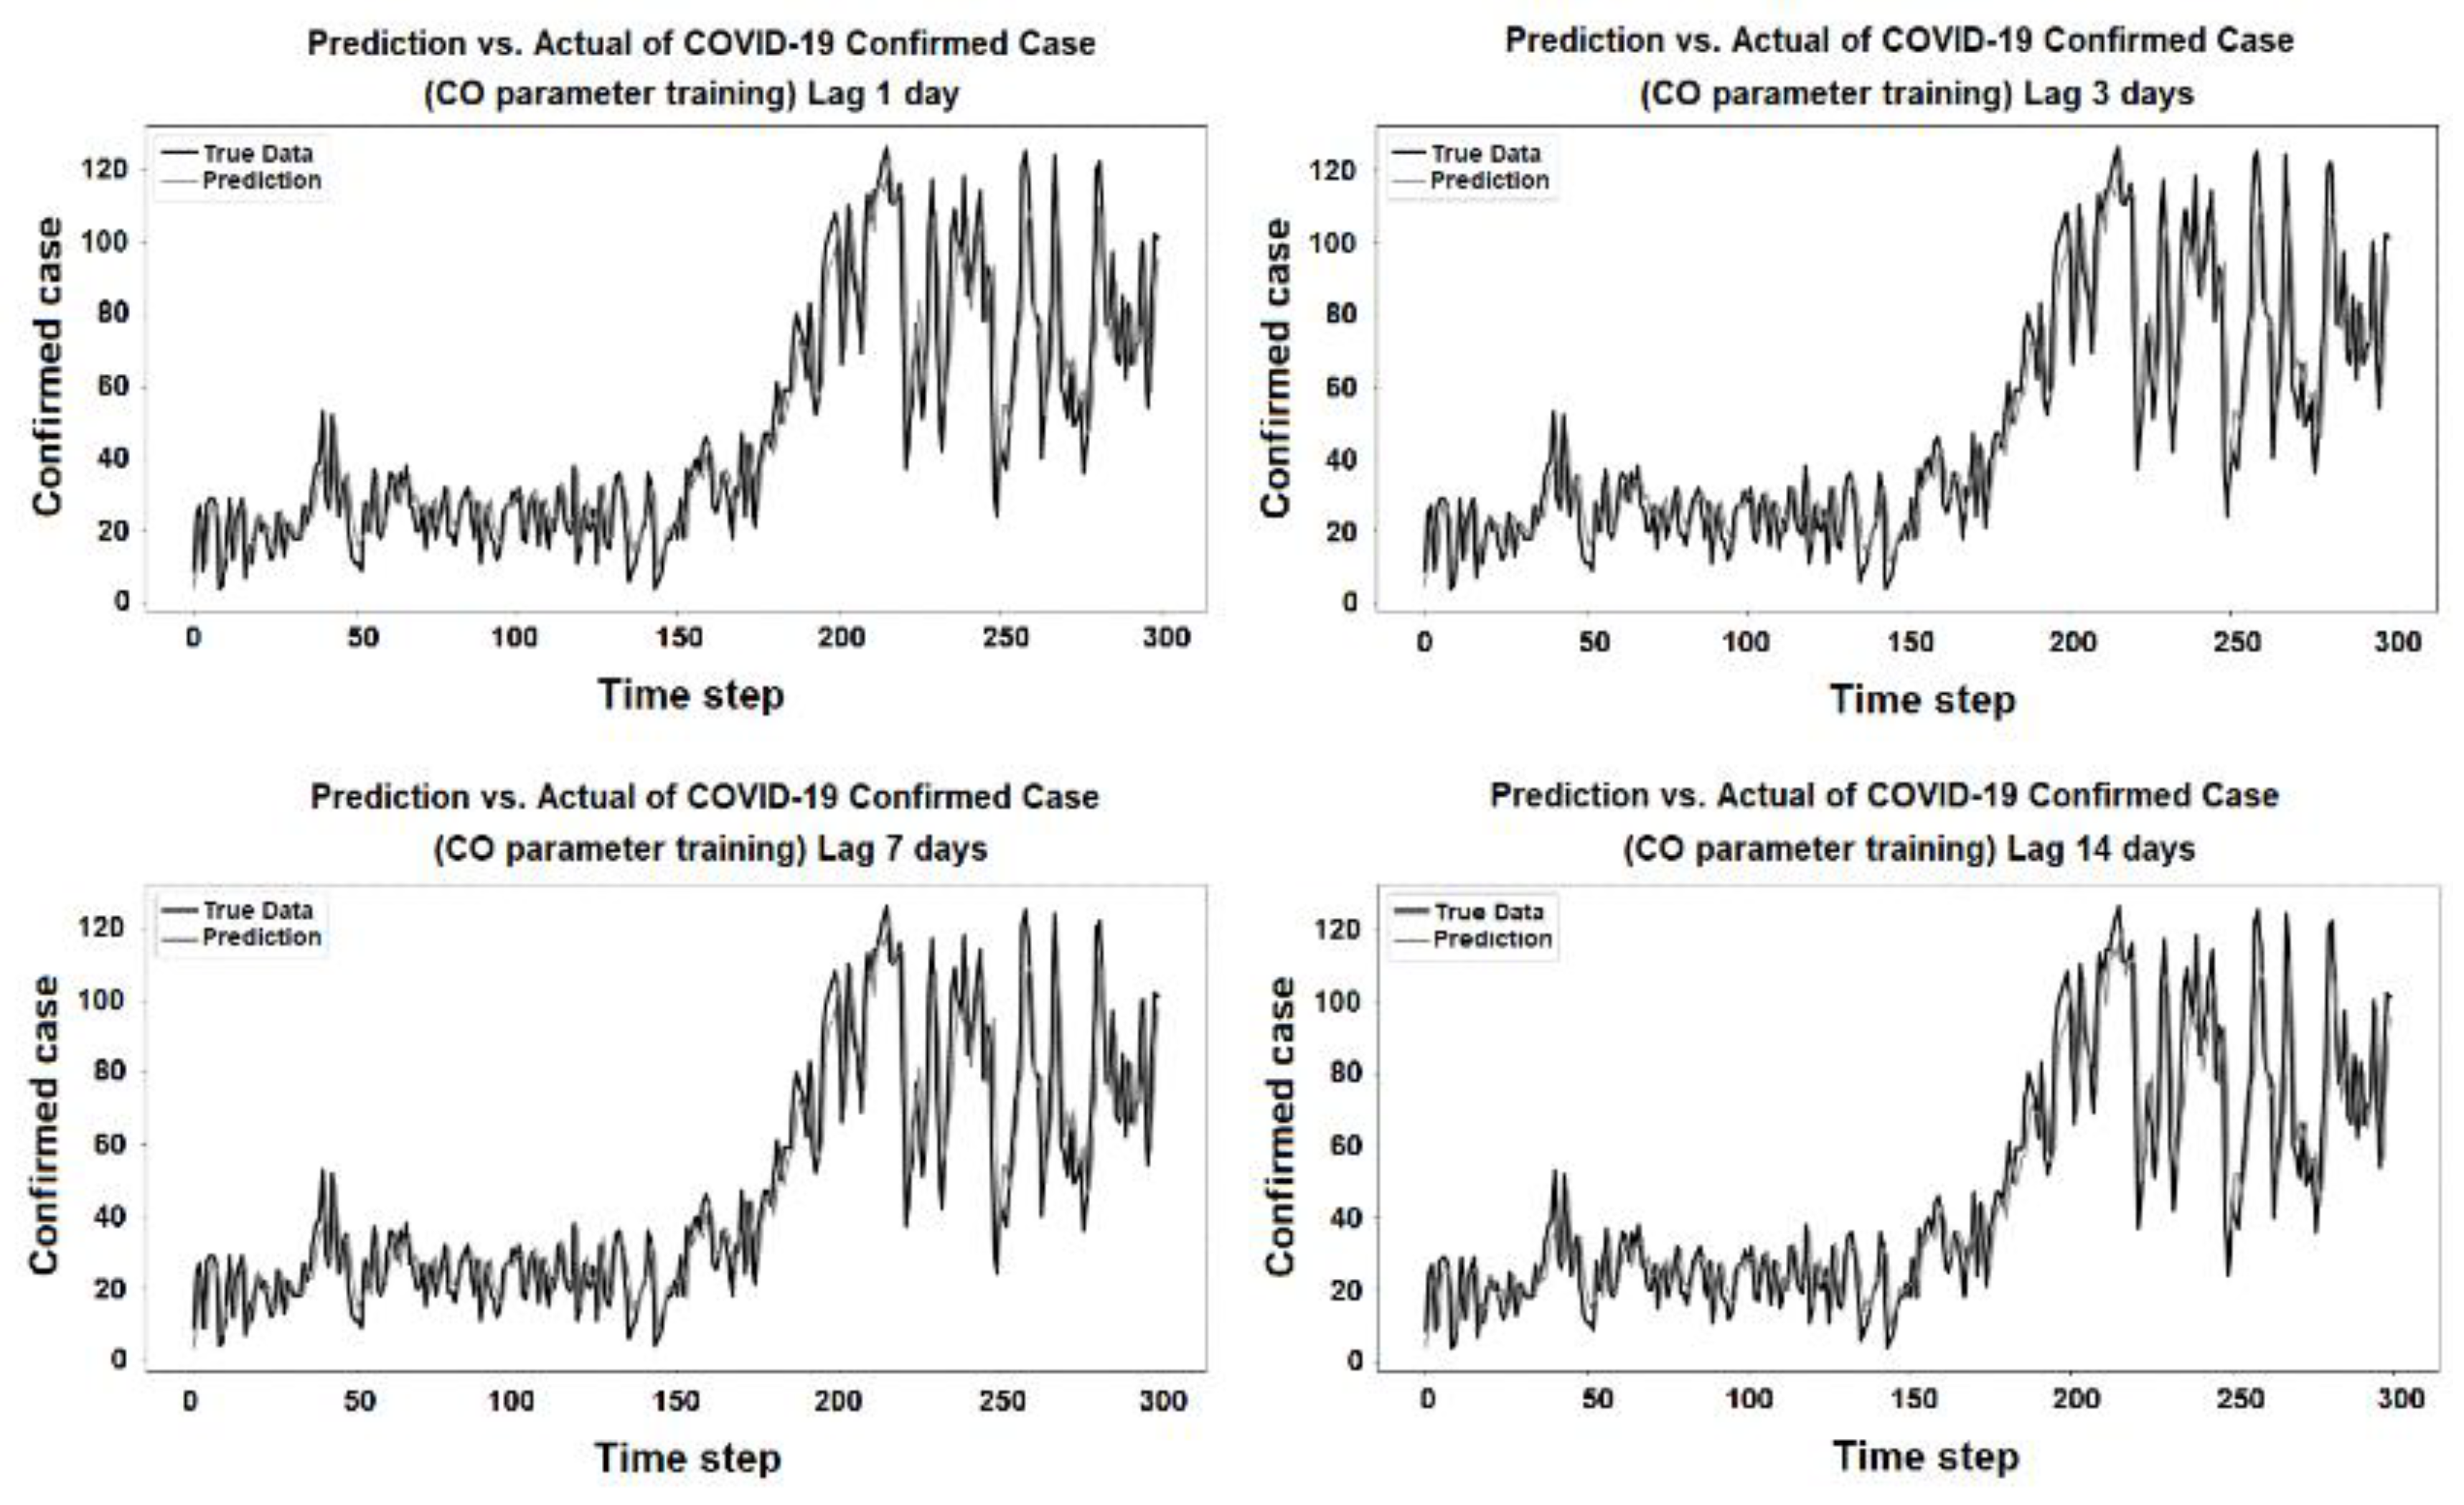
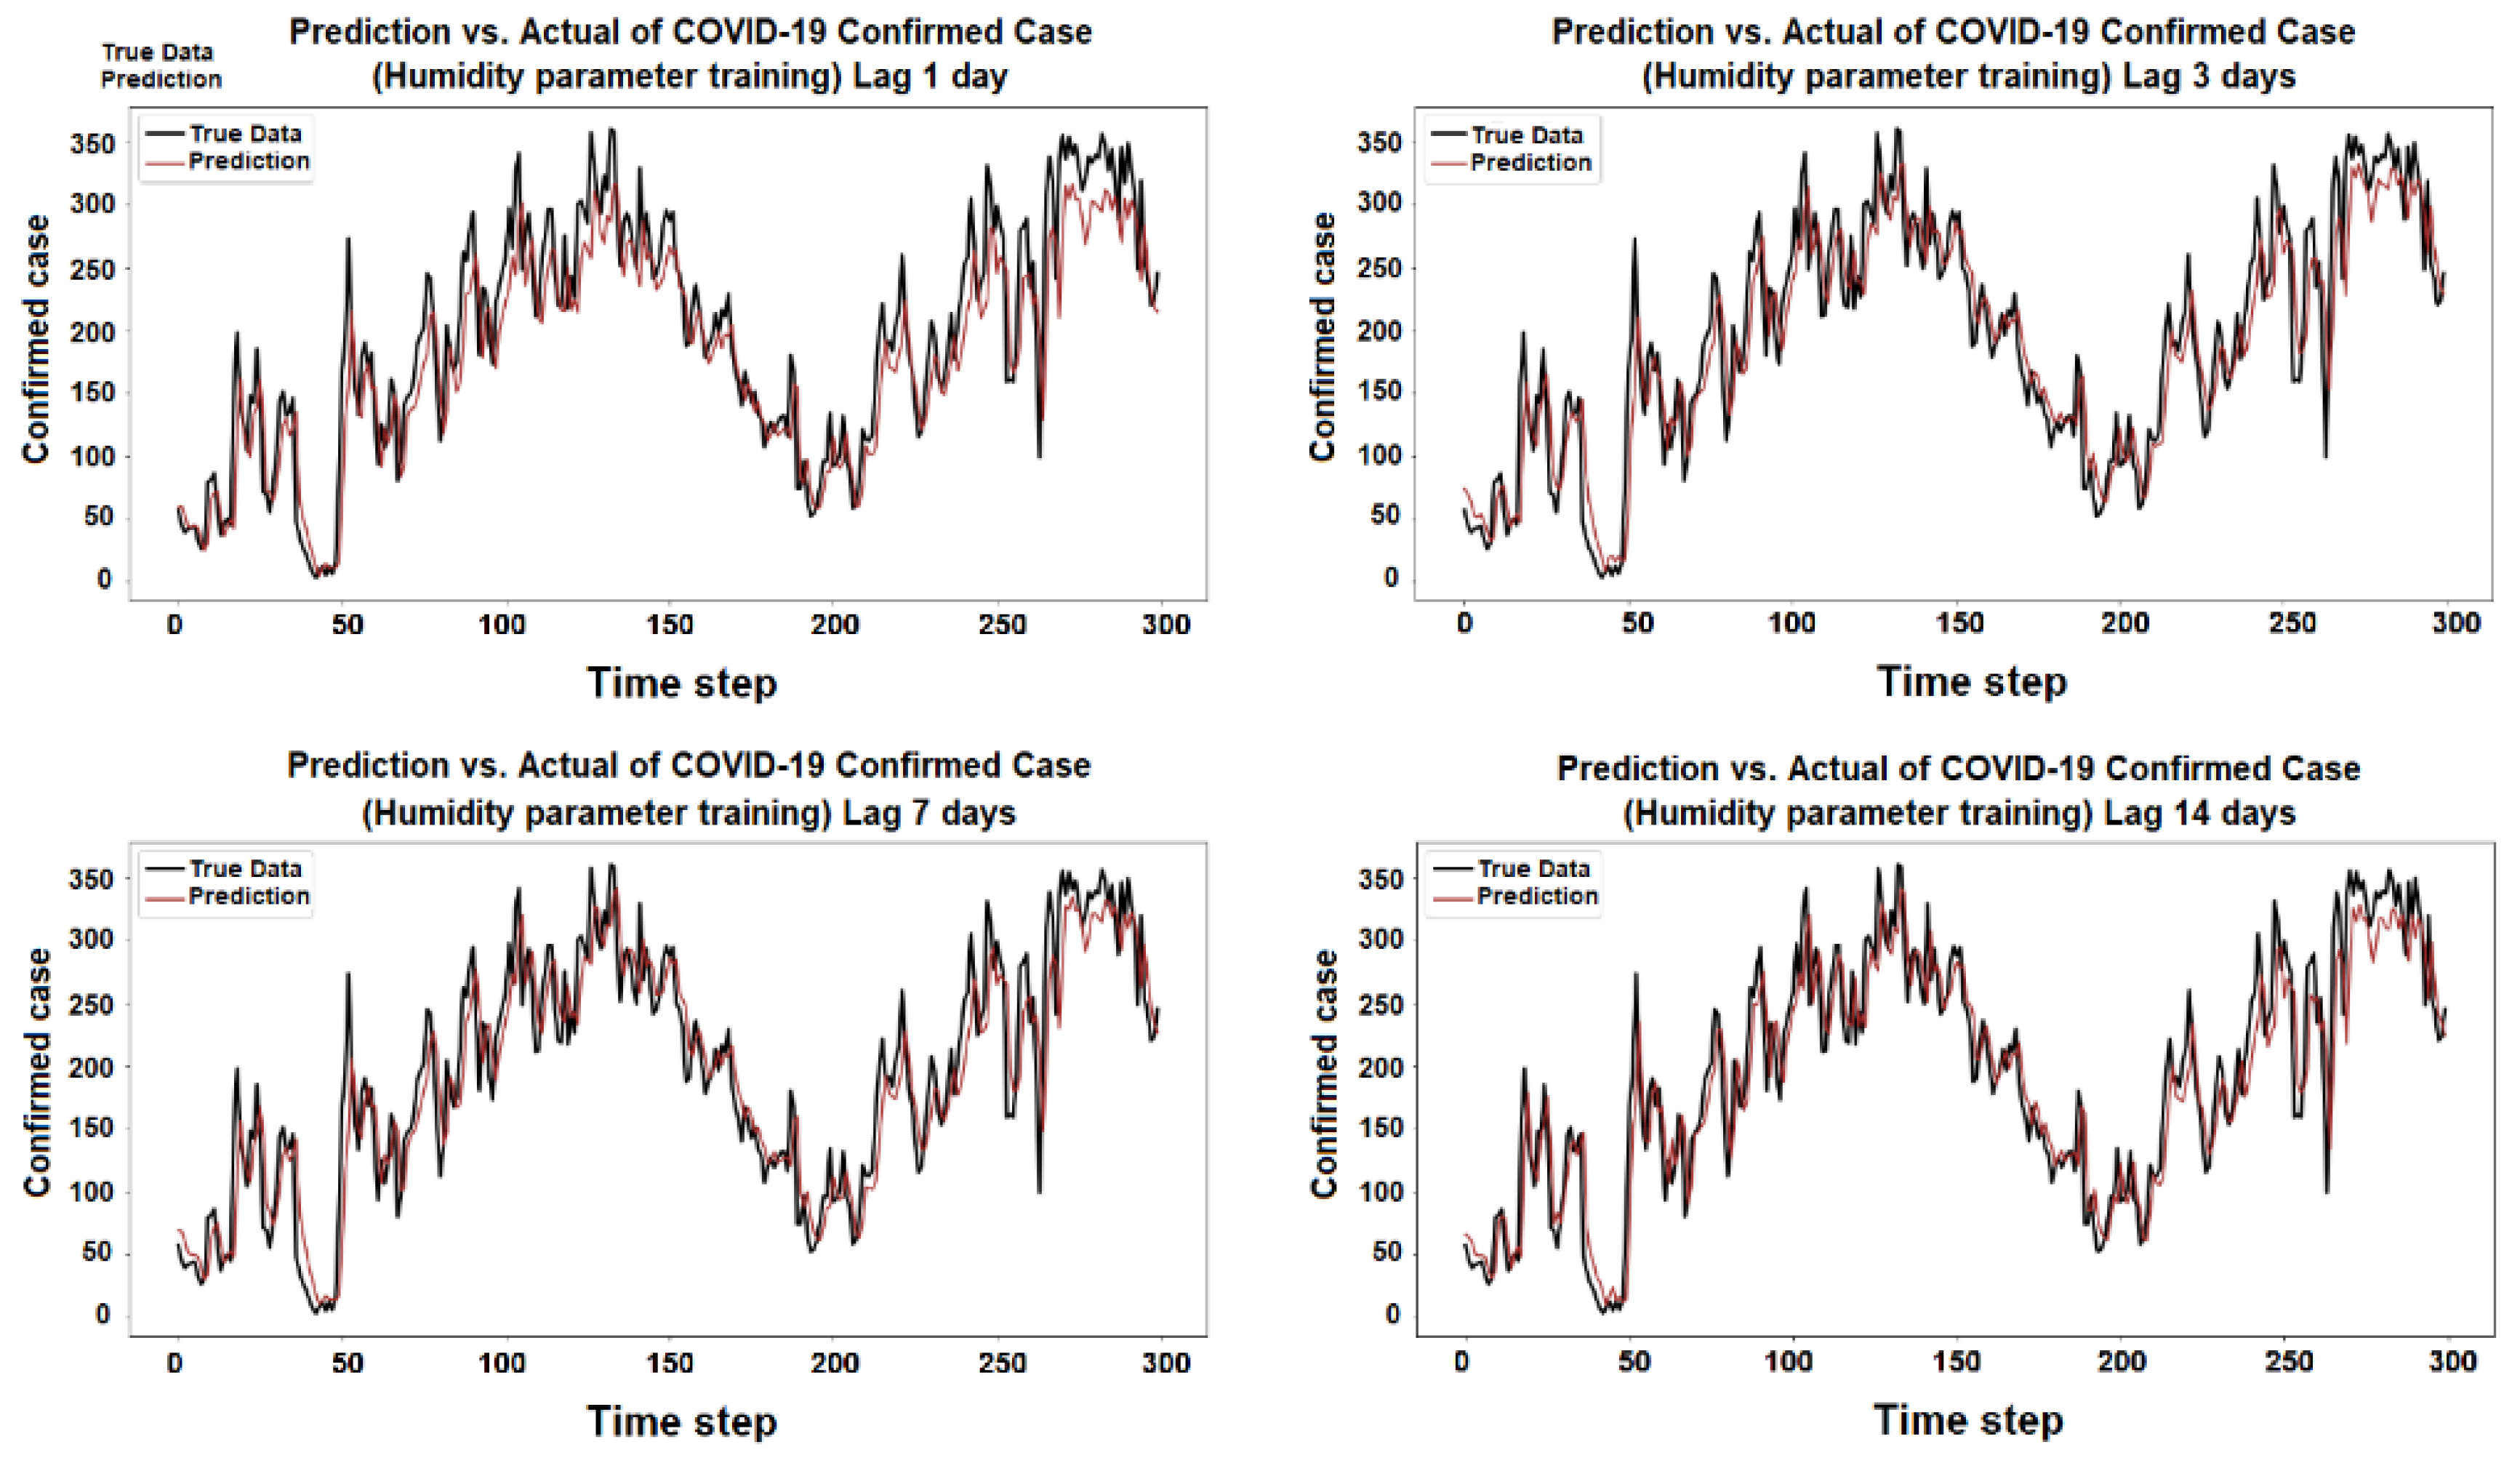
The purpose of the learning algorithm is to find a decent match between an overfit and an underfit model. A good fit is defined as a training and validation loss that declines to the point of stability with a slight difference between the two final loss values. The model’s loss is usually always smaller than the validation dataset on the training dataset. It implies that a divergence between the training and validation loss learning curves should be expected. If the training loss plot drops to the point of stability, the plot of learning curves reveals a satisfactory match. The validation loss plot reaches a point of stability, with a tiny gap between it and the training loss, as shown in Figure 5, Figure 6, Figure 7, Figure 8, Figure 9, Figure 10, Figure 11, Figure 12, Figure 13, Figure 14, Figure 15, Figure 16, Figure 17 and Figure 18. Figure 5, Figure 7, Figure 9, Figure 11, Figure 13, Figure 15 and Figure 17 illustrate that all the learning curves were a good fit; therefore, when plotted, the prediction looks to be substantially closer to the test set, as shown in Figure 6, Figure 8, Figure 10, Figure 12, Figure 14, Figure 16 and Figure 18.
- COVID-19 Confirmed Cases and all AQI Parameters
Figure 5.
Training and test of all AQI parameters during the 1, 3, 7, and 14 day lag times.
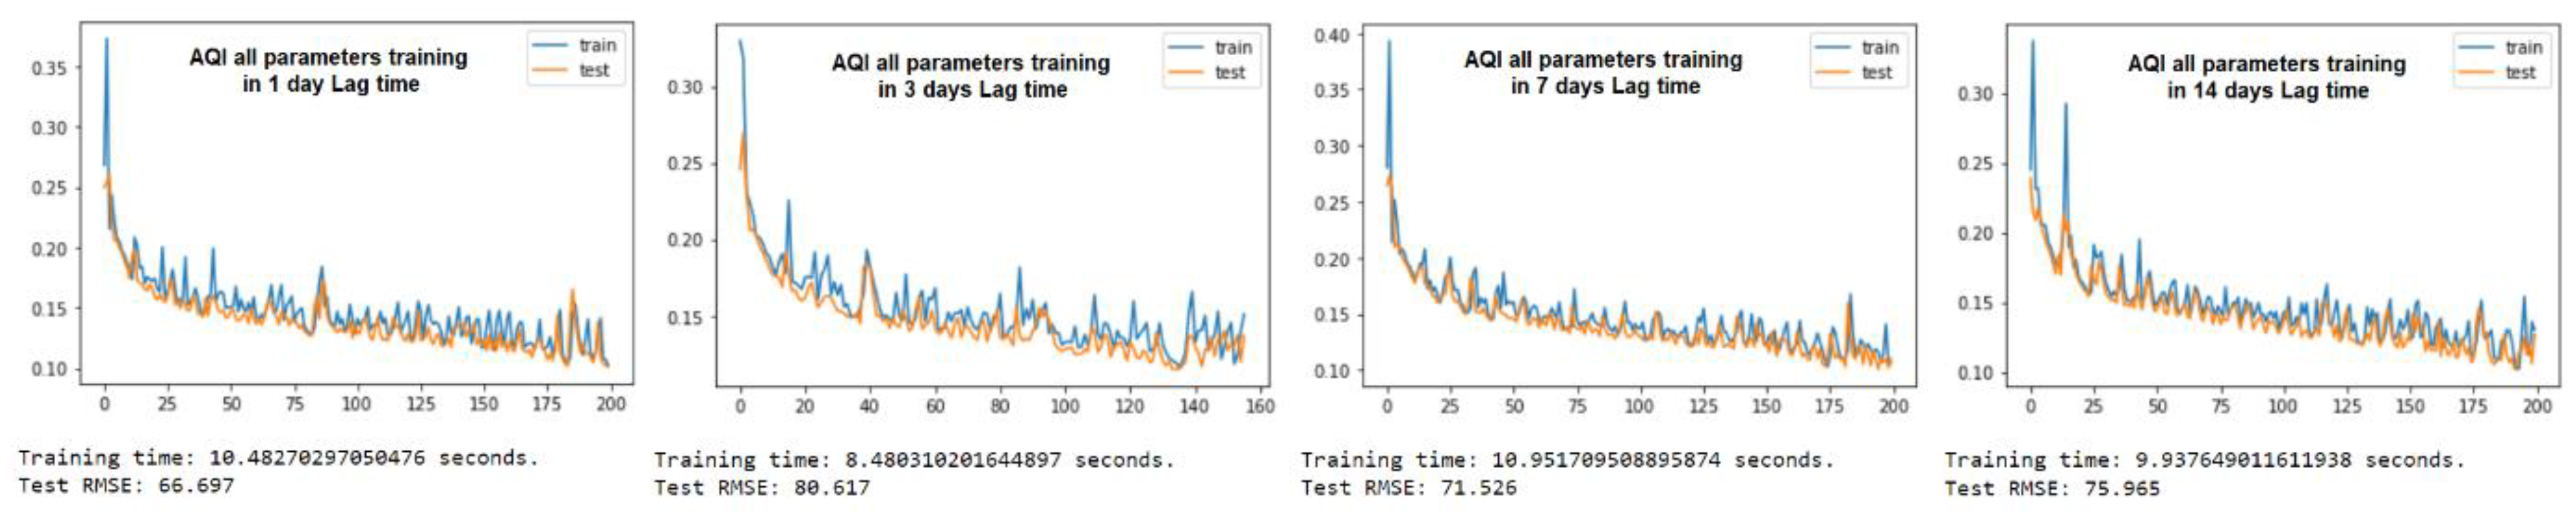
Figure 6.
Prediction vs. actual results of AQI parameters during the 1, 3, 7, and 14 day lag times.
- COVID-19 Confirmed Cases and PM2.5 Parameters
Figure 7.
Training and test for PM2.5 during the 1, 3, 7, and 14 day lag times.

Figure 8.
Prediction vs. actual results of PM2.5 during the 1, 3, 7, and 14 day lag times.
- COVID-19 Confirmed Cases and NO2 Parameters
Figure 9.
Training and test for NO2 during the 1, 3, 7, and 14 day lag times.

Figure 10.
Prediction vs. actual results of NO2 during the 1, 3, 7, and 14 day lag times.
- COVID-19 Confirmed Cases and Pressure Parameters
Figure 11.
Training and test for pressure during the 1, 3, 7, and 14 day lag times.

Figure 12.
Prediction vs. actual results of pressure during the 1, 3, 7, and 14 day lag times.
- COVID-19 Confirmed Cases and O3 Parameters
Figure 13.
Training and test for O3 during the 1, 3, 7, and 14 day lag times.

Figure 14.
Prediction vs. actual results of O3 during the 1, 3, 7, and 14 day lag times.
- COVID-19 Confirmed Cases and CO Parameters
Figure 15.
Training and test for CO during the 1, 3, 7, and 14 day lag times.

Figure 16.
Prediction vs. actual results for CO during the 1, 3, 7, and 14 day lag times.
- COVID-19 Confirmed Cases and Humidity Parameters
Figure 17.
Training and test for humidity during the 1, 3, 7, and 14 day lag times.

Figure 18.
Prediction vs. actual results for Humidity during the 1, 3, 7, and 14 day lag times.
4.3. RMSE and Variance Model Comparison
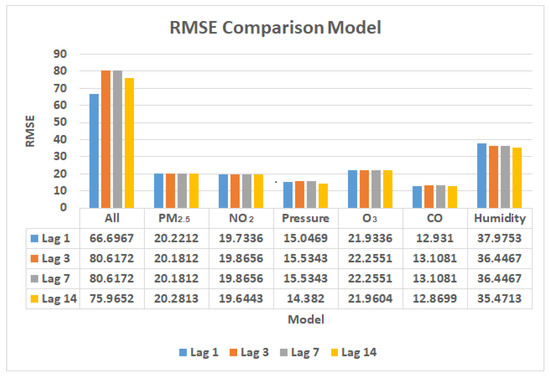
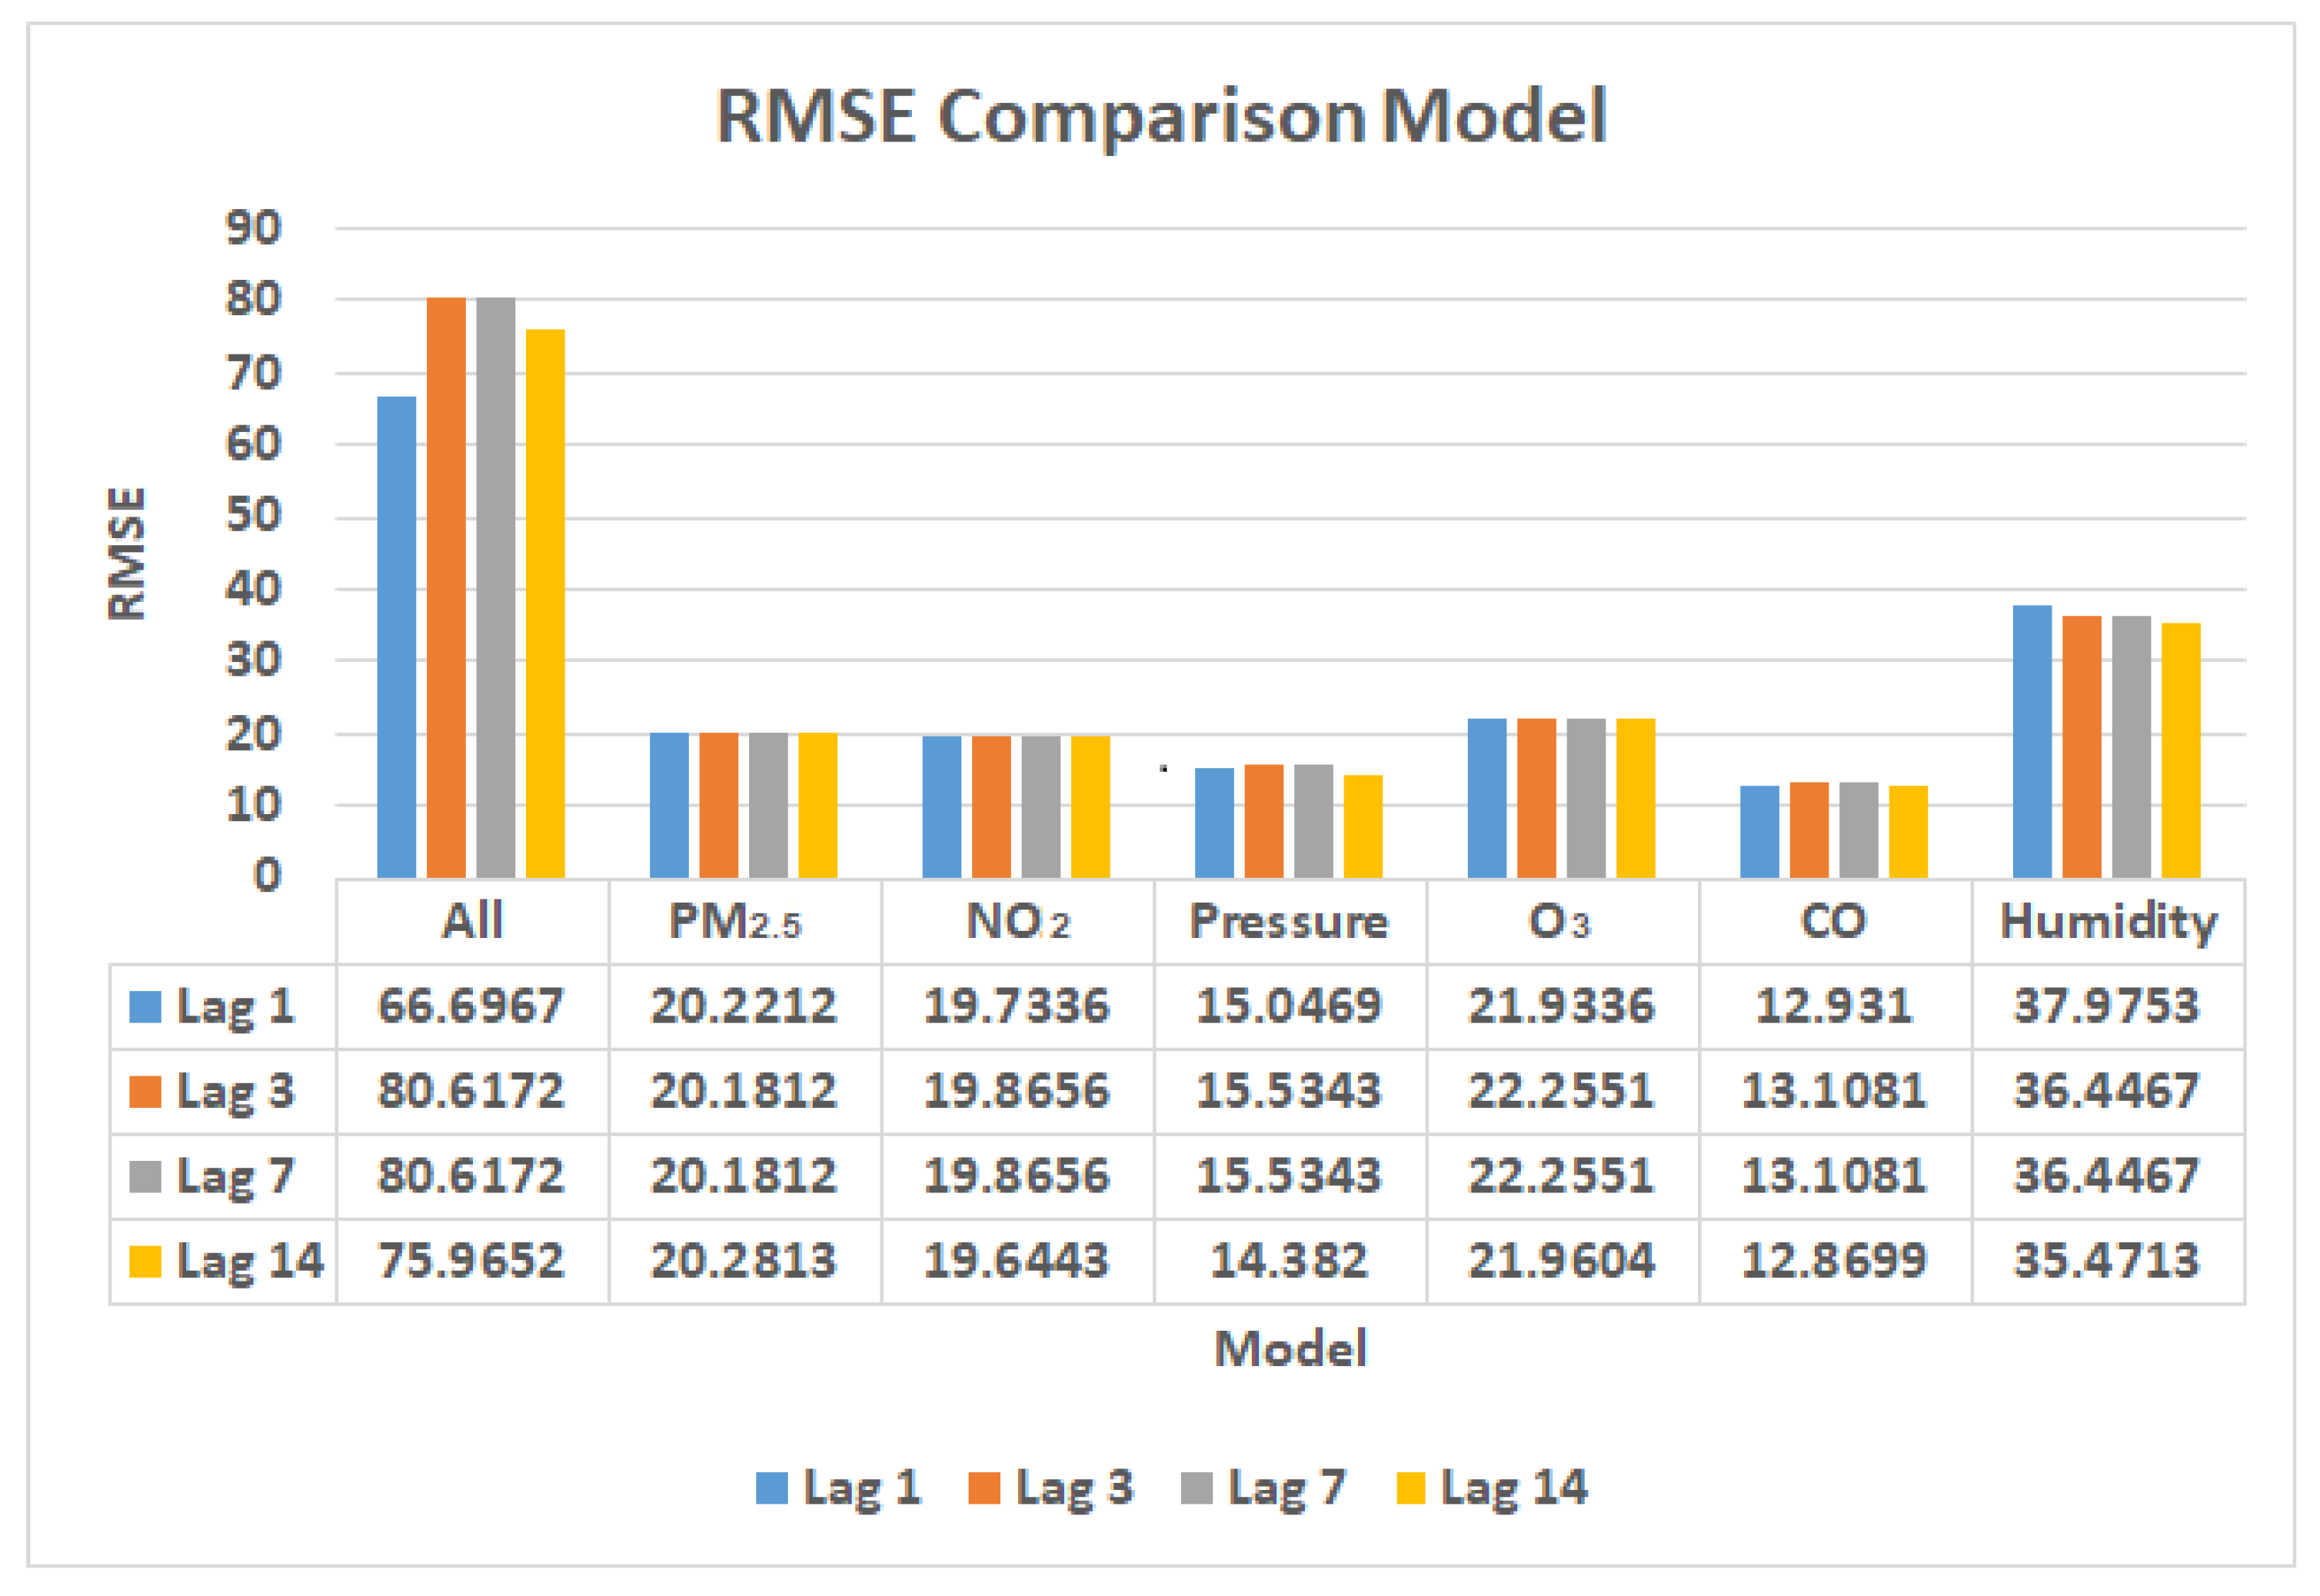
The RMSE comparison graph in Figure 19 illustrates the comparison of LSTM models of COVID-19 confirmed cases and air pollutant parameters. The dataset was divided into four lag times: 1, 3, 7, and 14 days.
Figure 19.
RMSE comparison models for the 1, 3, 7, and 14 day lag times.
- The first model contains all air pollutant parameter training, which uses 12 parameters, PM2.5, PM10, WIND_SPEED, WIND_GUST, O3, CO, Humidity, Pressure, Dew, NO2, Precipitation, and WIND_DIREC. The results show that the RMSE values are the highest compared with the other models, at 66.6967 for the 1 day lag time, 80.6172 for the 3 day lag time, 80.6172 for the 7 day lag time, and 75.9652 for the 14 day lag time, respectively.
- The second model uses PM2.5 parameter training. It can be seen from the results that the RMSE values reach 20.2212 for the 1 day lag time, 20.1812 for the 3 day lag time, 20.1812 for the 7 day lag time, and 20.2813 for the 14 day lag time, respectively.
- The third model uses NO2 parameter training. It can be seen from the results that the RMSE values reach 19.7336 for the 1 day lag time, 19.8656 for the 3 day lag time, 19.8656 for the 7 day lag time, and 19.6443 for the 14 day lag time, respectively.
- The fourth model uses pressure parameter training. It can be seen from the results that the RMSE values reach 15.0469 for the 1 day lag time, 15.5343 for the 3 day lag time, 15.5343 for the 7 day lag time, and 14.382 for the 14 day lag time, respectively.
- The fifth model uses O3 parameter training. It can be seen from the results that the RMSE values reach 21.9336 for the 1 day lag time, 22.2551 for the 3 day lag time, 22.2551 for the 7 day lag time, and 21.9604 for the 14 day lag time, respectively.
- The sixth model is the most excellent model compared to the others, it uses CO parameter training. It can be seen from the results that the RMSE values reach 12.931 for the 1 day lag time, 13.1081 for the 3 day lag time, 13.1081 for the 7 day lag time, and 12.8699 for the 14 day lag time, respectively.
- Finally, the seventh model uses humidity parameter training. It can be seen from the results that the RMSE values reach 37.9753 for the 1 day lag time, 36.4467 for the 3 day lag time, 36.4467 for the 7 day lag time, and 35.4713 for the 14 day lag time, respectively.
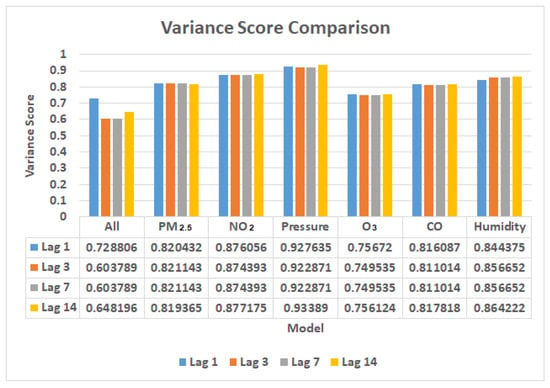
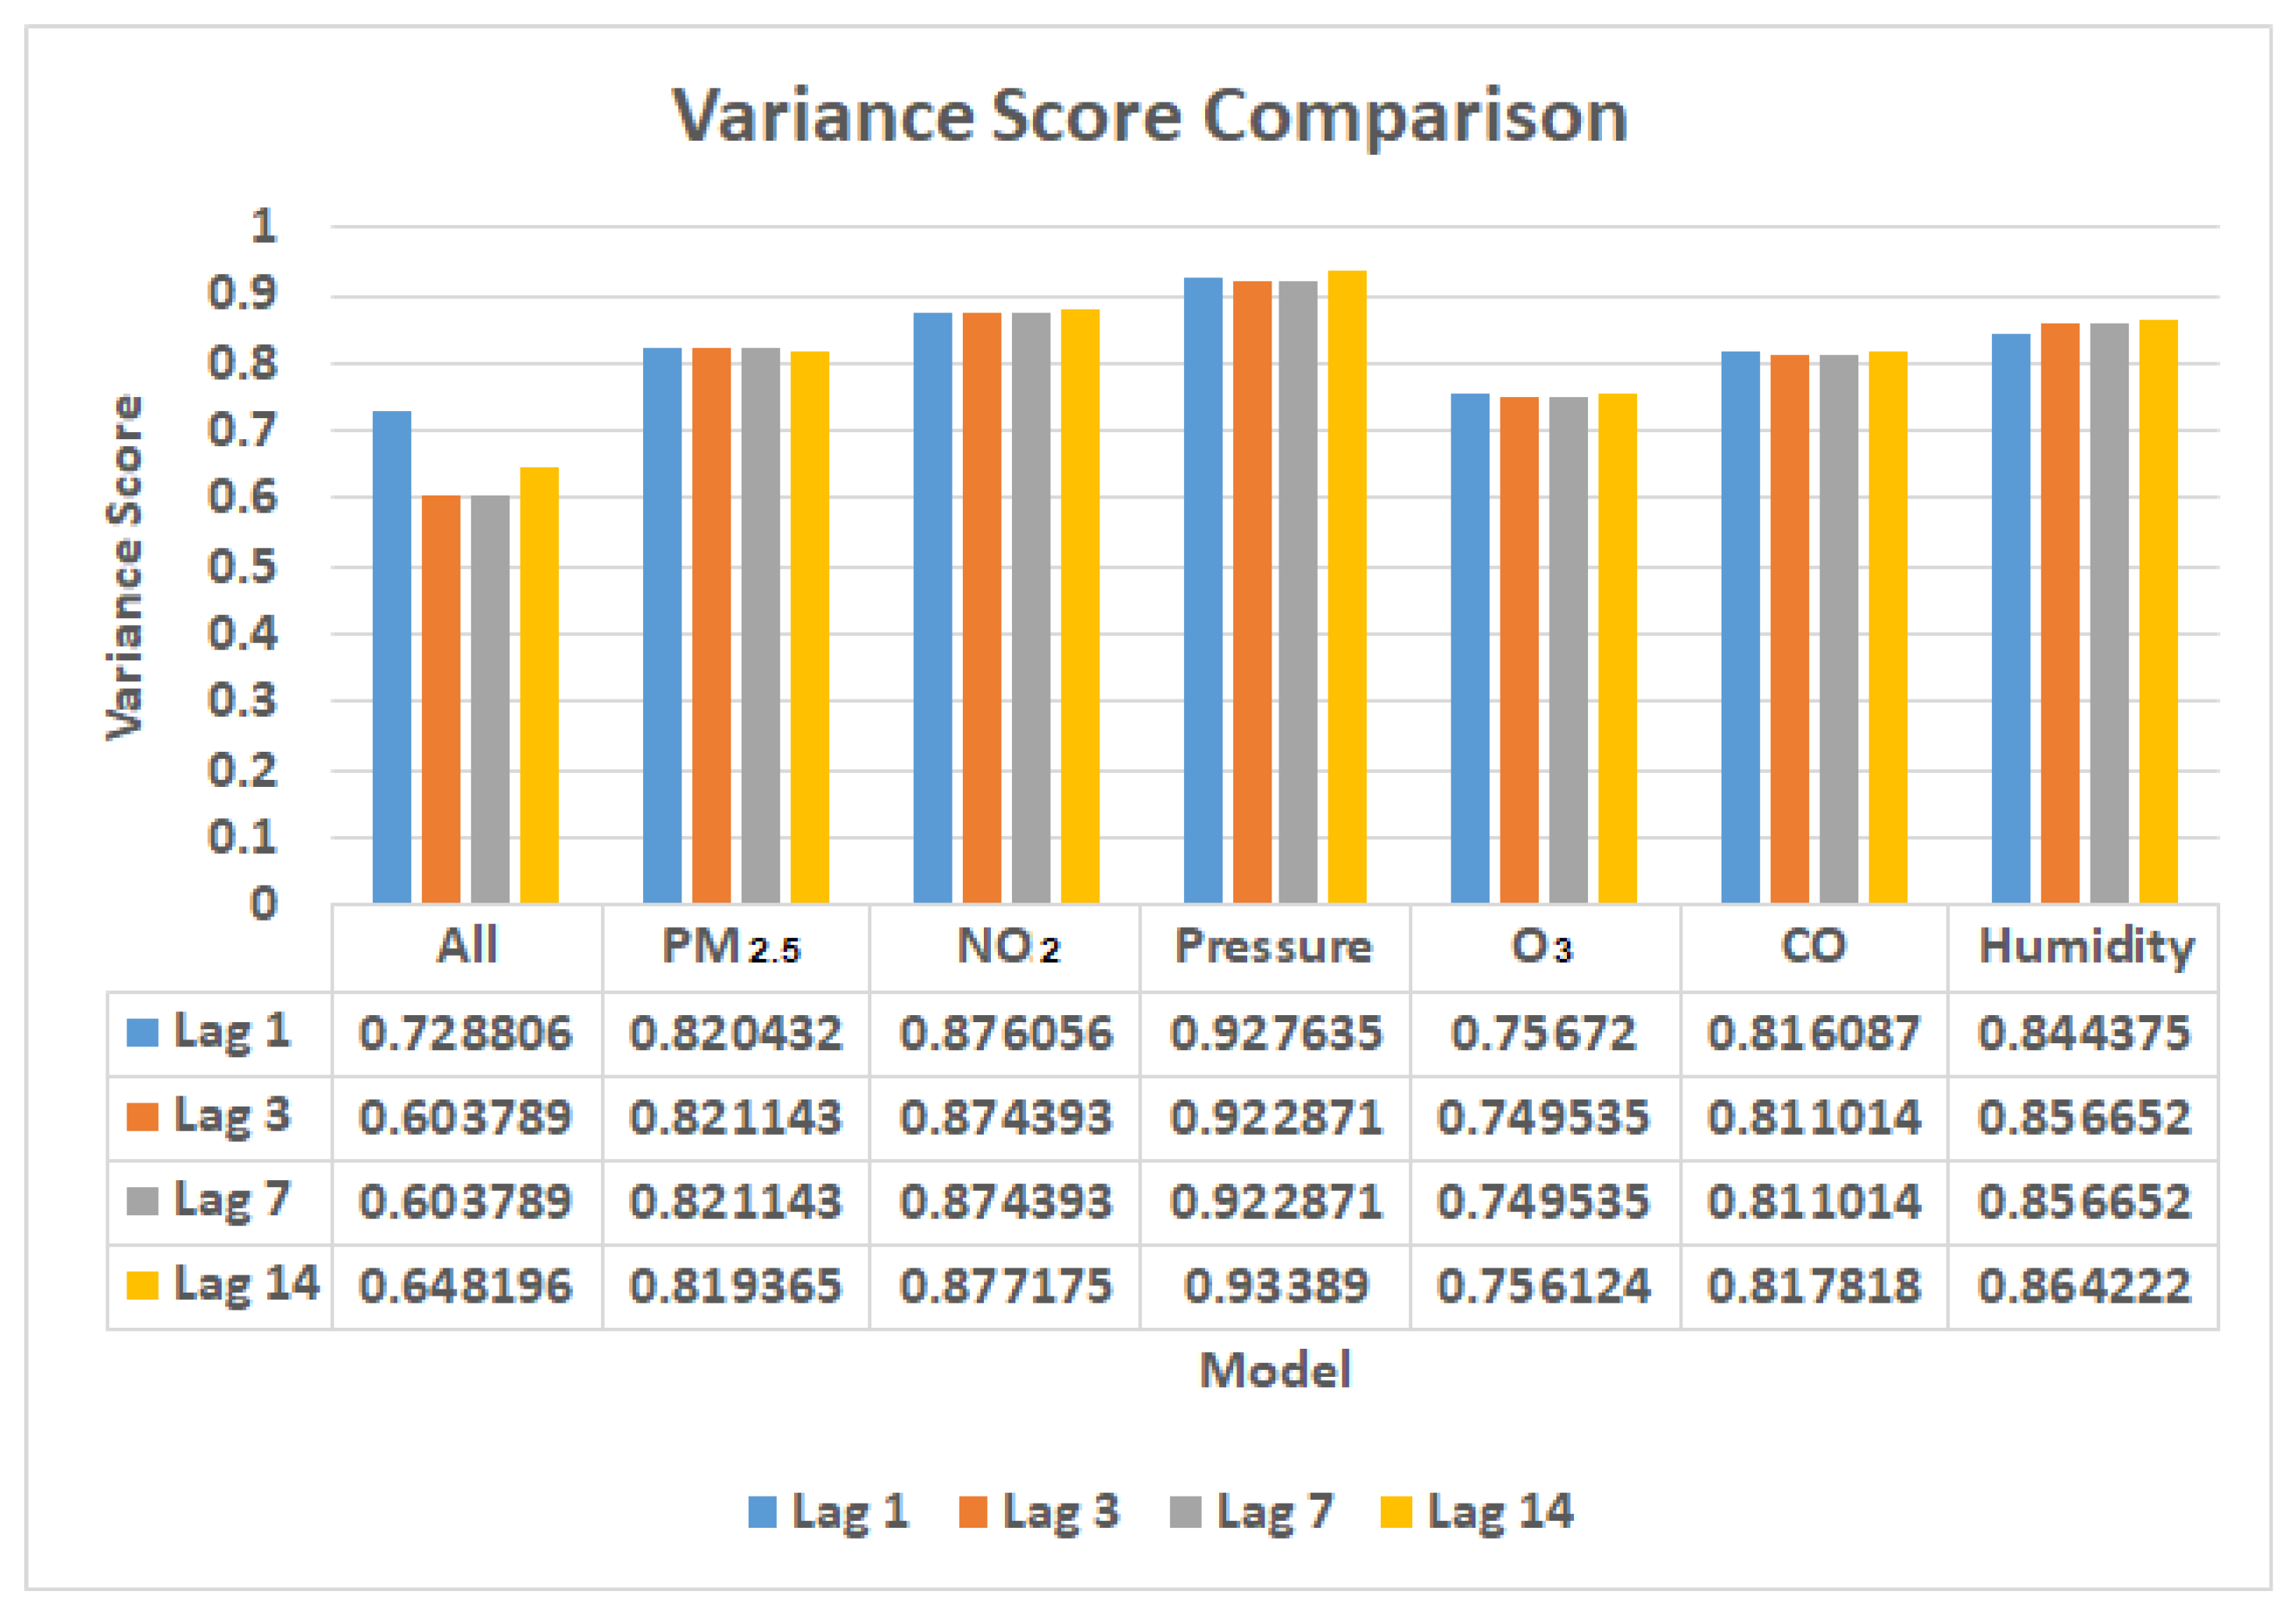
The explained variance is a metric for determining how much variability exists in a machine learning model’s predictions. To put it another way, it is the difference between the expected and forecasted values. Understanding how much information we can lose by reconciling the dataset is a crucial subject. At least 60% of the variation in a machine learning model must be explained. The goal is to have a value that is low. From the Graph Variance Score Comparison in Figure 20, it can be seen that the fourth model (pressure parameter training) has excellent variance scores at more than 0.9, whereas the first model has the worst variance scores. NO2, PM2.5, CO, and humidity models have a score of more than 0.8, which is also acceptable.
Figure 20.
Variance score comparison in 1, 3, 7, and 14 lag times.
5. Conclusions and Future Work
This study investigates the correlation of COVID-19 confirmed cases with AQI parameters using deep learning. The dataset was divided into four lag times, 1, 3, 7, and 14 days. From the lag times experiments, it can be found that one day lag time has an excellent RMSE. The deep learning models were good using the association of COVID-19 and air pollutants in the 1 day lag time scenario. We also performed the correlation in the matrix correlation coefficient, and the results show that the orders are pressure, NO2, PM2.5, PM10, CO, and O3, followed by humidity; however, these orders were different when we trained using deep learning. Seven models have experimented with deep learning LSTM, and COVID-19 confirmed cases with all air pollutant parameters, PM2.5, NO2, pressure, O3, CO, and humidity. From the training models, we found that CO is the most excellent model compared with the others, having on average, 13 RMSE values. CO is followed by pressure at 15, PM2.5 at 20, NO2 at 20, O3 at 22, humidity at 37, and finally, all air pollutant parameters at 76. As a result of the finding, we assume that CO, Pressure, NO2, and PM2.5 have a significant role in COVID-19 confirmed rates. In the future, more machine learning algorithms can be conducted to compare these results. Moreover, other data resources, such as people mobility, social media, and other countries’ data, might be analyzed in deep experiments.
Author Contributions
Conceptualization, Y.-T.T. and P.-Y.L.; methodology, C.-T.Y. and W.-M.C.; software, E.K.; validation, Y.-T.T., P.-Y.L. and C.-T.Y.; formal analysis, E.K. and C.-T.Y.; investigation, C.-T.Y.; resources, Y.-T.T. and P.-Y.L.; data curation, E.K.; writing—original draft preparation, E.K.; writing—review and editing, Y.-T.T., P.-Y.L., W.-M.C. and C.-T.Y.; supervision, C.-T.Y. All authors have read and agreed to the published version of the manuscript.
Funding
This work was sponsored by the Ministry of Science and Technology (MOST), Taiwan, under Grant No. MOST 110-2221-E-029-020-MY3, MOST 110-2621-M-029-003, MOST 110-2811-E-029-003, and MOST 111-2622-E-029-003. This work also supported by grants from Taichung Veterans General Hospital (TCVGH), Taiwan under Grant No. TCVGH-T1087804, TCVGH-T1097801, TCVGH-T1107803, TCVGH-1107201C, TCVGH-T1117803, TCVGH-NK1099003, and TCVGH-1103602D.
Institutional Review Board Statement
Not applicable.
Informed Consent Statement
Not applicable.
Data Availability Statement
The data are available in a publicly accessible repository that does not issue DOIs. Publicly available datasets were analyzed in this study. This data can be found here: https://api.COVID-19india.org/csv/latest/states.csv and https://aqicn.org/data-platform/COVID-19/ accessed on 1 January 2022.
Conflicts of Interest
The authors declare no conflict of interest.
References
- Rossen, L.M.; Branum, A.M.; Ahmad, F.B.; Sutton, P.; Anderson, R.N. Excess Deaths Associated with COVID-19, by Age and Race and Ethnicity—United States, 26 January–3 October 2020. MMWR Morb. Mortal. Wkly. Rep. 2020, 69, 1522–1527. [Google Scholar] [CrossRef] [Scilit] [PubMed]
- Pozzer, A.; Dominici, F.; Haines, A.; Witt, C.; Münzel, T.; Lelieveld, J. Regional and global contributions of air pollution to risk of death from COVID-19. Cardiovasc. Res. 2020, 116, 2247–2253. [Google Scholar] [CrossRef] [Scilit] [PubMed]
- Lu, H.; Ma, X.; Ma, M. A hybrid multi-objective optimizer-based model for daily electricity demand prediction considering COVID-19. Energy 2021, 219, 119568. [Google Scholar] [CrossRef] [Scilit]
- Tsan, Y.-T.; Chen, D.-Y.; Liu, P.-Y.; Kristiani, E.; Nguyen, K.L.P.; Yang, C.-T. The Prediction of Influenza-like Illness and Respiratory Disease Using LSTM and ARIMA. Int. J. Environ. Res. Public Health 2022, 19, 1858. [Google Scholar] [CrossRef] [Scilit] [PubMed]
- Rodríguez-Pérez, R.; Bajorath, J. Feature importance correlation from machine learning indicates functional relationships between proteins and similar compound binding characteristics. Sci. Rep. 2021, 11, 14245. [Google Scholar] [CrossRef] [Scilit] [PubMed]
- Malki, Z.; Atlam, E.-S.; Hassanien, A.E.; Dagnew, G.; Elhosseini, M.A.; Gad, I. Association between weather data and COVID-19 pandemic predicting mortality rate: Machine learning approaches. Chaos Solitons Fractals 2020, 138, 110137. [Google Scholar] [CrossRef] [Scilit] [PubMed]
- Wan, H.; Guo, S.; Yin, K.; Liang, X.; Lin, Y. CTS-LSTM: LSTM-based neural networks for correlated time series prediction. Knowl.-Based Syst. 2020, 191, 105239. [Google Scholar] [CrossRef] [Scilit]
- Jiao, R.; Zhang, T.; Jiang, Y.; He, H. Short-Term Non-Residential Load Forecasting Based on Multiple Sequences LSTM Recurrent Neural Network. IEEE Access 2018, 6, 59438–59448. [Google Scholar] [CrossRef] [Scilit]
- Cui, Y.; Zhang, Z.F.; Froines, J.; Zhao, J.; Wang, H.; Yu, S.Z.; Detels, R. Air pollution and case fatality of SARS in the People’s Republic of China: An ecologic study. Environ. Health 2003, 2, 15. [Google Scholar] [CrossRef] [Scilit]
- Kan, H.-D.; Chen, B.-H.; Fu, C.-W.; Yu, S.-Z.; Mu, L.-N. Relationship between ambient air pollution and daily mortality of SARS in Beijing. Biomed. Environ. Sci. 2005, 18, 1–4. [Google Scholar]
- Zhao, Y.; Richardson, B.; Takle, E.; Chai, L.; Schmitt, D.; Xin, H. Airborne transmission may have played a role in the spread of 2015 highly pathogenic avian influenza outbreaks in the United States. Sci. Rep. 2019, 9, 11755. [Google Scholar] [CrossRef] [Scilit] [PubMed]
- Chen, G.; Zhang, W.; Li, S.; Zhang, Y.; Williams, G.; Huxley, R.; Ren, H.; Cao, W.; Guo, Y. The impact of ambient fine particles on influenza transmission and the modification effects of temperature in China: A multi-city study. Environ. Int. 2017, 98, 82–88. [Google Scholar] [CrossRef] [Scilit] [PubMed]
- Zhu, Y.; Xie, J.; Huang, F.; Cao, L. Association between short-term exposure to air pollution and COVID-19 infection: Evidence from China. Sci. Total Environ. 2020, 727, 138704. [Google Scholar] [CrossRef] [Scilit] [PubMed]
- Gupta, A.; Bherwani, H.; Gautam, S.; Anjum, S.; Musugu, K.; Kumar, N.; Anshul, A.; Kumar, R. Air pollution aggravating COVID-19 lethality? Exploration in Asian cities using statistical models. Environ. Dev. Sustain. 2021, 23, 6408–6417. [Google Scholar] [CrossRef] [Scilit]
- Lolli, S.; Chen, Y.-C.; Wang, S.-H.; Vivone, G. Impact of meteorological conditions and air pollution on COVID-19 pandemic transmission in Italy. Sci. Rep. 2020, 10, 16213. [Google Scholar]
- Bashir, M.F.; Ma, B.; Komal, B.; Bashir, M.A.; Tan, D.; Bashir, M. Correlation between climate indicators and COVID-19 pandemic in New York, USA. Sci. Total Environ. 2020, 728, 138835. [Google Scholar] [CrossRef] [Scilit] [PubMed]
- Suhaimi, N.F.; Jalaludin, J.; Latif, M.T. Demystifying a Possible Relationship between COVID-19, Air Quality and Meteorological Factors: Evidence from Kuala Lumpur, Malaysia. Aerosol Air Qual. Res. 2020, 20, 1520–1529. [Google Scholar] [CrossRef] [Scilit]
- Mehmood, K.; Bao, Y.; Abrar, M.M.; Petropoulos, G.P.; Soban, A.; Saud, S.; Khan, Z.A.; Khan, S.M.; Fahad, S. Spatiotemporal variability of COVID-19 pandemic in relation to air pollution, climate and socioeconomic factors in Pakistan. Chemosphere 2021, 271, 129584. [Google Scholar] [CrossRef] [Scilit]
- Hoang, T.; Tran, T.T.A. Ambient air pollution, meteorology, and COVID-19 infection in Korea. J. Med. Virol. 2021, 93, 878–885. [Google Scholar] [CrossRef] [Scilit]
- Travaglio, M.; Yu, Y.; Popovic, R.; Selley, L.; Leal, N.S.; Martins, L.M. Links between air pollution and COVID-19 in England. Environ. Pollut. 2021, 268, 115859. [Google Scholar] [CrossRef] [Scilit]
- Lorenzo, J.S.L.; Tam, W.W.S.; Seow, W.J. Association between air quality, meteorological factors and COVID-19 infection case numbers. Environ. Res. 2021, 197, 111024. [Google Scholar] [CrossRef] [Scilit] [PubMed]
- Mandalapu, A.; Jiao, J.; Azimian, A. Exploring the Spatial Distribution of Air Pollutants and COVID-19 Death Rate: A Case Study for Los Angeles County, California. Int. J. Geospat. Environ. Res. 2022, 9, 4. [Google Scholar]
- Sidell, M.A.; Chen, Z.; Huang, B.Z.; Chow, T.; Eckel, S.P.; Martinez, M.P.; Lurmann, F.; Thomas, D.C.; Gilliland, F.D.; Xiang, A.H. Ambient air pollution and COVID-19 incidence during four 2020–2021 case surges. Environ. Res. 2022, 208, 112758. [Google Scholar] [CrossRef] [Scilit] [PubMed]
- Luo, K.; Wang, Z.; Wu, J. Association of population migration with air quality: Role of city attributes in China during COVID-19 pandemic (2019–2021). Atmos. Pollut. Res. 2022, 13, 101419. [Google Scholar] [CrossRef] [Scilit] [PubMed]
- Abdullah, S.; Imran, M.A.; Mansor, A.A.; Yusof, K.M.K.K.; Dom, N.C.; Saijan, S.K.; Yatim, S.R.M.; Ahmed, A.N.; Ismail, M. Association of Air Pollutant Index (API) on SARS-CoV-2 of Coronavirus Disease 2019 (COVID-19) in Malaysia. Asian J. Atmos. Environ. 2022, 16, 2021094. [Google Scholar] [CrossRef] [Scilit]
- Huang, H.; Lin, C.; Liu, X.; Zhu, L.; Avellán-Llaguno, R.D.; Lazo, M.M.L.; Ai, X.; Huang, Q. The impact of air pollution on COVID-19 pandemic varied within different cities in South America using different models. Environ. Sci. Pollut. Res. 2022, 29, 543–552. [Google Scholar] [CrossRef] [Scilit]
- Aragão, D.P.; Oliveira, E.V.; Bezerra, A.A.; dos Santos, D.H.; Da Silva, A.G., Jr.; Pereira, I.G.; Piscitelli, P.; Miani, A.; Distante, C.; Cuno, J.S.; et al. Multivariate data driven prediction of COVID-19 dynamics: Towards new results with temperature, humidity and air quality data. Environ. Res. 2022, 204, 112348. [Google Scholar] [CrossRef] [Scilit]
- Al-Qaness, M.A.; Fan, H.; Ewees, A.A.; Yousri, D.; Elaziz, M.A. Improved ANFIS model for forecasting Wuhan City Air Quality and analysis COVID-19 lockdown impacts on air quality. Environ. Res. 2021, 194, 110607. [Google Scholar] [CrossRef] [Scilit]
- Zhou, B.; Yang, G.; Shi, Z.; Ma, S. Interpretable Temporal Attention Network for COVID-19 forecasting. Appl. Soft Comput. 2022, 120, 108691. [Google Scholar] [CrossRef] [Scilit]
- Saravanan, M.; Velmurugan, S.; Bhanupriya, P.; Booma Devi, P. Exploitation of artificial intelligence for predicting the change in air quality and rain fall accumulation during COVID-19. Energy Sources Part A Recover. Util. Environ. Eff. 2020, 1–10. [Google Scholar] [CrossRef] [Scilit]
- Xu, L.; Magar, R.; Farimani, A.B. Forecasting COVID-19 new cases using deep learning methods. Comput. Biol. Med. 2022, 144, 105342. [Google Scholar] [CrossRef] [Scilit] [PubMed]
- Fu, Y.; Lin, S.; Xu, Z. Research on Quantitative Analysis of Multiple Factors Affecting COVID-19 Spread. Int. J. Environ. Res. Public Health 2022, 19, 3187. [Google Scholar] [CrossRef] [Scilit] [PubMed]
- Mumtaz, R.; Zaidi, S.; Shakir, M.Z.; Shafi, U.; Malik, M.M.; Haque, A.; Mumtaz, S.; Zaidi, S. Internet of Things (IoT) Based Indoor Air Quality Sensing and Predictive Analytic—A COVID-19 Perspective. Electronics 2021, 10, 184. [Google Scholar] [CrossRef] [Scilit]
- Hochreiter, S.; Schmidhuber, J. Long short-term memory. Neural Comput. 1997, 9, 1735–1780. [Google Scholar] [CrossRef] [Scilit] [PubMed]
- Altan, A.; Karasu, S.; Bekiros, S. Digital currency forecasting with chaotic meta-heuristic bio-inspired signal processing tech-niques. Chaos Solit. Fractals 2019, 126, 325–336. [Google Scholar] [CrossRef] [Scilit]
- Wang, Y.; Lin, K.; Qi, Y.; Lian, Q.; Feng, S.; Wu, Z.; Pan, G. Estimating Brain Connectivity with Varying-Length Time Lags Using a Recurrent Neural Network. IEEE Trans. Biomed. Eng. 2018, 65, 1953–1963. [Google Scholar] [CrossRef] [Scilit]
- Lim, Y.B.; Aliyu, I.; Lim, C.G. Air pollution matter prediction using recurrent neural networks with sequential data. In Proceedings of the 2019 3rd International Conference on Intelligent Systems, Metaheuristics & Swarm Intelligence, Male, Maldives, 23–24 March 2019; pp. 40–44. [Google Scholar]
- Fung, P.L.; Zaidan, M.A.; Surakhi, O.; Tarkoma, S.; Petäjä, T.; Hussein, T. Data imputation in in situ-measured particle size distributions by means of neural networks. Atmos. Meas. Tech. 2021, 14, 5535–5554. [Google Scholar] [CrossRef] [Scilit]
- Surakhi, O.; Zaidan, M.A.; Fung, P.L.; Motlagh, N.H.; Serhan, S.; AlKhanafseh, M.; Ghoniem, R.M.; Hussein, T. Time-Lag Selection for Time-Series Forecasting Using Neural Network and Heuristic Algorithm. Electronics 2021, 10, 2518. [Google Scholar] [CrossRef] [Scilit]
- Kristiani, E.; Kuo, T.-Y.; Yang, C.-T.; Pai, K.-C.; Huang, C.-Y.; Nguyen, K.L.P. PM2.5 Forecasting Model Using a Combination of Deep Learning and Statistical Feature Selection. IEEE Access 2021, 9, 68573–68582. [Google Scholar] [CrossRef] [Scilit]
- Kristiani, E.; Lin, H.; Lin, J.R.; Chuang, Y.H.; Huang, C.Y.; Yang, C.T. Short-term prediction of PM2. 5 using LSTM deep learning methods. Sustainability 2022, 14, 2068. [Google Scholar] [CrossRef] [Scilit]
- Kristiani, E.; Chen, Y.-A.; Yang, C.-T.; Huang, C.-Y.; Tsan, Y.-T.; Chan, W.-C. Using deep ensemble for influenza-like illness consultation rate prediction. Futur. Gener. Comput. Syst. 2021, 117, 369–386. [Google Scholar] [CrossRef] [Scilit]
- Yang, C.-T.; Chen, Y.-A.; Chan, Y.-W.; Lee, C.-L.; Tsan, Y.-T.; Chan, W.-C.; Liu, P.-Y. Influenza-like illness prediction using a long short-term memory deep learning model with multiple open data sources. J. Supercomput. 2020, 76, 9303–9329. [Google Scholar] [CrossRef] [Scilit]
- Liu, P.-Y.; Tsan, Y.-T.; Chan, Y.-W.; Chan, W.-C.; Shi, Z.-Y.; Yang, C.-T.; Lou, B.-S. Associations of PM2.5 and aspergillosis: Ambient fine particulate air pollution and population-based big data linkage analyses. J. Ambient Intell. Humaniz. Comput. 2018, 1–11. [Google Scholar] [CrossRef] [Scilit]

Publisher’s Note: MDPI stays neutral with regard to jurisdictional claims in published maps and institutional affiliations. |
© 2022 by the authors. Licensee MDPI, Basel, Switzerland. This article is an open access article distributed under the terms and conditions of the Creative Commons Attribution (CC BY) license (https://creativecommons.org/licenses/by/4.0/).