


Abstract
Background and Objectives: Extensive-stage small-cell lung cancer (ES-SCLC) is an aggressive disease, and the survival benefit of adding immune checkpoint inhibitors (ICIs) to first-line chemotherapy is modest and heterogeneous; simple, accessible prognostic markers are therefore needed. We evaluated composite risk scores combining pretreatment positron emission tomography (PET)-derived metabolic tumor burden with systemic inflammatory markers in this setting. Materials and Methods: This single-center retrospective cohort study included 112 consecutive patients diagnosed between January 2019 and December 2025. Metabolic tumor volume (MTV) and total lesion glycolysis (TLG) on pretreatment 18F-fluorodeoxyglucose PET/computed tomography were combined with one of three blood-based inflammatory markers: neutrophil-to-lymphocyte ratio (NLR), platelet-to-lymphocyte ratio (PLR) or systemic immune–inflammation index (SII). Each component was scored 0 or 1 at the cohort median, yielding three risk scores of 0–3 points (RS1, NLR-based; RS2, PLR-based; RS3, SII-based) and low-, intermediate- and high-risk groups. Progression-free survival (PFS) and overall survival (OS) were analyzed with the Kaplan–Meier method, the log-rank test and separate multivariable Cox models for each score adjusted for performance status and liver and bone metastases; incremental value was assessed with Harrell’s concordance index (C-index). Results: Median PFS was 7.70 months and median OS was 14.43 months, with a median follow-up of 27.6 months. All three scores stratified PFS and OS in univariable analysis (RS1: p = 0.008 and p = 0.002, respectively). RS1 was the only score independently associated with both outcomes (PFS: hazard ratio [HR] per risk tier 1.39, 95% confidence interval [CI] 1.04–1.86, p = 0.026; OS: HR 1.53, 95% CI 1.09–2.16, p = 0.014). RS2 and RS3 were not independently significant. RS1 modestly improved the C-index of clinical factors (by approximately 0.02), but NLR added no significant information beyond metabolic burden. Conclusions: A composite score combining PET-derived metabolic burden with NLR was independently associated with survival in ES-SCLC treated with chemoimmunotherapy, but its added discrimination was modest and driven mainly by the metabolic component; these exploratory findings require prospective validation.
1. Introduction
Small-cell lung cancer (SCLC) is an aggressive neuroendocrine tumor that accounts for approximately 15% of lung cancers and carries a high proliferation rate, early widespread metastasis, and poor prognosis [1]. Most patients present with extensive-stage disease, and for decades platinum–etoposide chemotherapy was the only standard of care. Adding atezolizumab (IMpower133) or durvalumab (CASPIAN) to first-line chemotherapy extended median overall survival (OS) from ~10 to 12–13 months, establishing immune checkpoint inhibitors (ICIs) as the new standard [2,3]. Yet this gain is modest, benefit is markedly heterogeneous, and most cases progress quickly [1,2,3].
This creates an urgent need for accessible, standardized biomarkers that reliably stratify prognosis in patients with extensive-stage SCLC (ES-SCLC) receiving ICI-based therapy. Unlike many solid tumors, in SCLC, programmed death-ligand 1 (PD-L1) expression, tumor mutational burden, and genomic subtyping fall short of a routine, actionable predictor [1,2,4,5]. By contrast, two complementary axes are already available in routine practice: metabolic tumor burden on 2-deoxy-2-[18F]fluoro-D-glucose positron emission tomography/computed tomography (18F-FDG PET/CT), namely metabolic tumor volume (MTV) and total lesion glycolysis (TLG), and systemic inflammatory markers from the complete blood count (neutrophil-to-lymphocyte ratio [NLR], platelet-to-lymphocyte ratio [PLR], and systemic immune–inflammation index [SII])—both obtained during routine pretreatment evaluation without added cost or invasive procedures.
These axes are also biologically complementary. Metabolic parameters quantify viable tumor burden and glycolytic activity, whereas blood-based indices reflect the tumor-associated host inflammatory response. Neutrophilia and thrombocytosis point to an immunosuppressive microenvironment and reduced effector T-cell activity [6,7]; this is particularly important in the ICI era, where clinical benefit depends on a competent host immune response. Each axis is prognostic on its own: high MTV/TLG predicts shorter OS and progression-free survival (PFS) in SCLC [8], and high NLR likewise indicates unfavorable survival [9]. However, inflammatory ratios alone are inconsistent; for example, the independent effect of PLR is non-significant in meta-analyses [9]. Although pretreatment SII is a strong prognostic marker in chemotherapy-treated SCLC [10], its value in ICI-treated ES-SCLC remains uncertain [11].
Nevertheless, existing combined-biomarker studies have largely paired inflammatory indices with one another or with PD-L1 [11]; data integrating PET metabolic-burden parameters with systemic inflammatory indices into a single composite score—specifically in ICI-treated ES-SCLC—remain limited. Because the three inflammatory markers reflect different biological dimensions and differ in individual prognostic power, their combinations with metabolic burden may also differ. To address this gap, we defined three composite risk scores pairing the two common pretreatment PET parameters (MTV + TLG) with one inflammatory marker each (MTV + TLG + NLR; MTV + TLG + PLR; MTV + TLG + SII), and evaluated their risk-stratification power for OS and PFS in 112 patients with ES-SCLC who received first-line chemoimmunotherapy. We hypothesized that such simple, threshold-based scores could provide low-cost stratification—particularly for OS—that refines what individual markers offer.
2. Materials and Methods
2.1. Study Design and Patient Selection
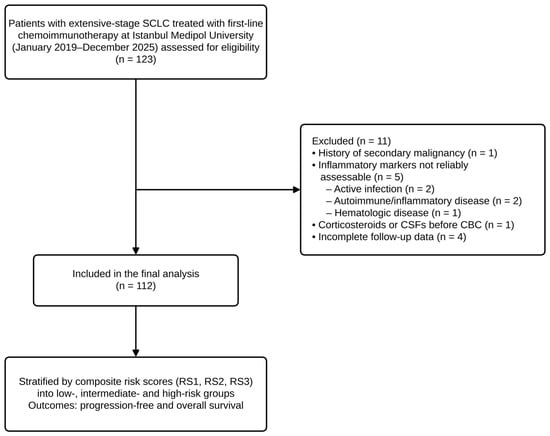
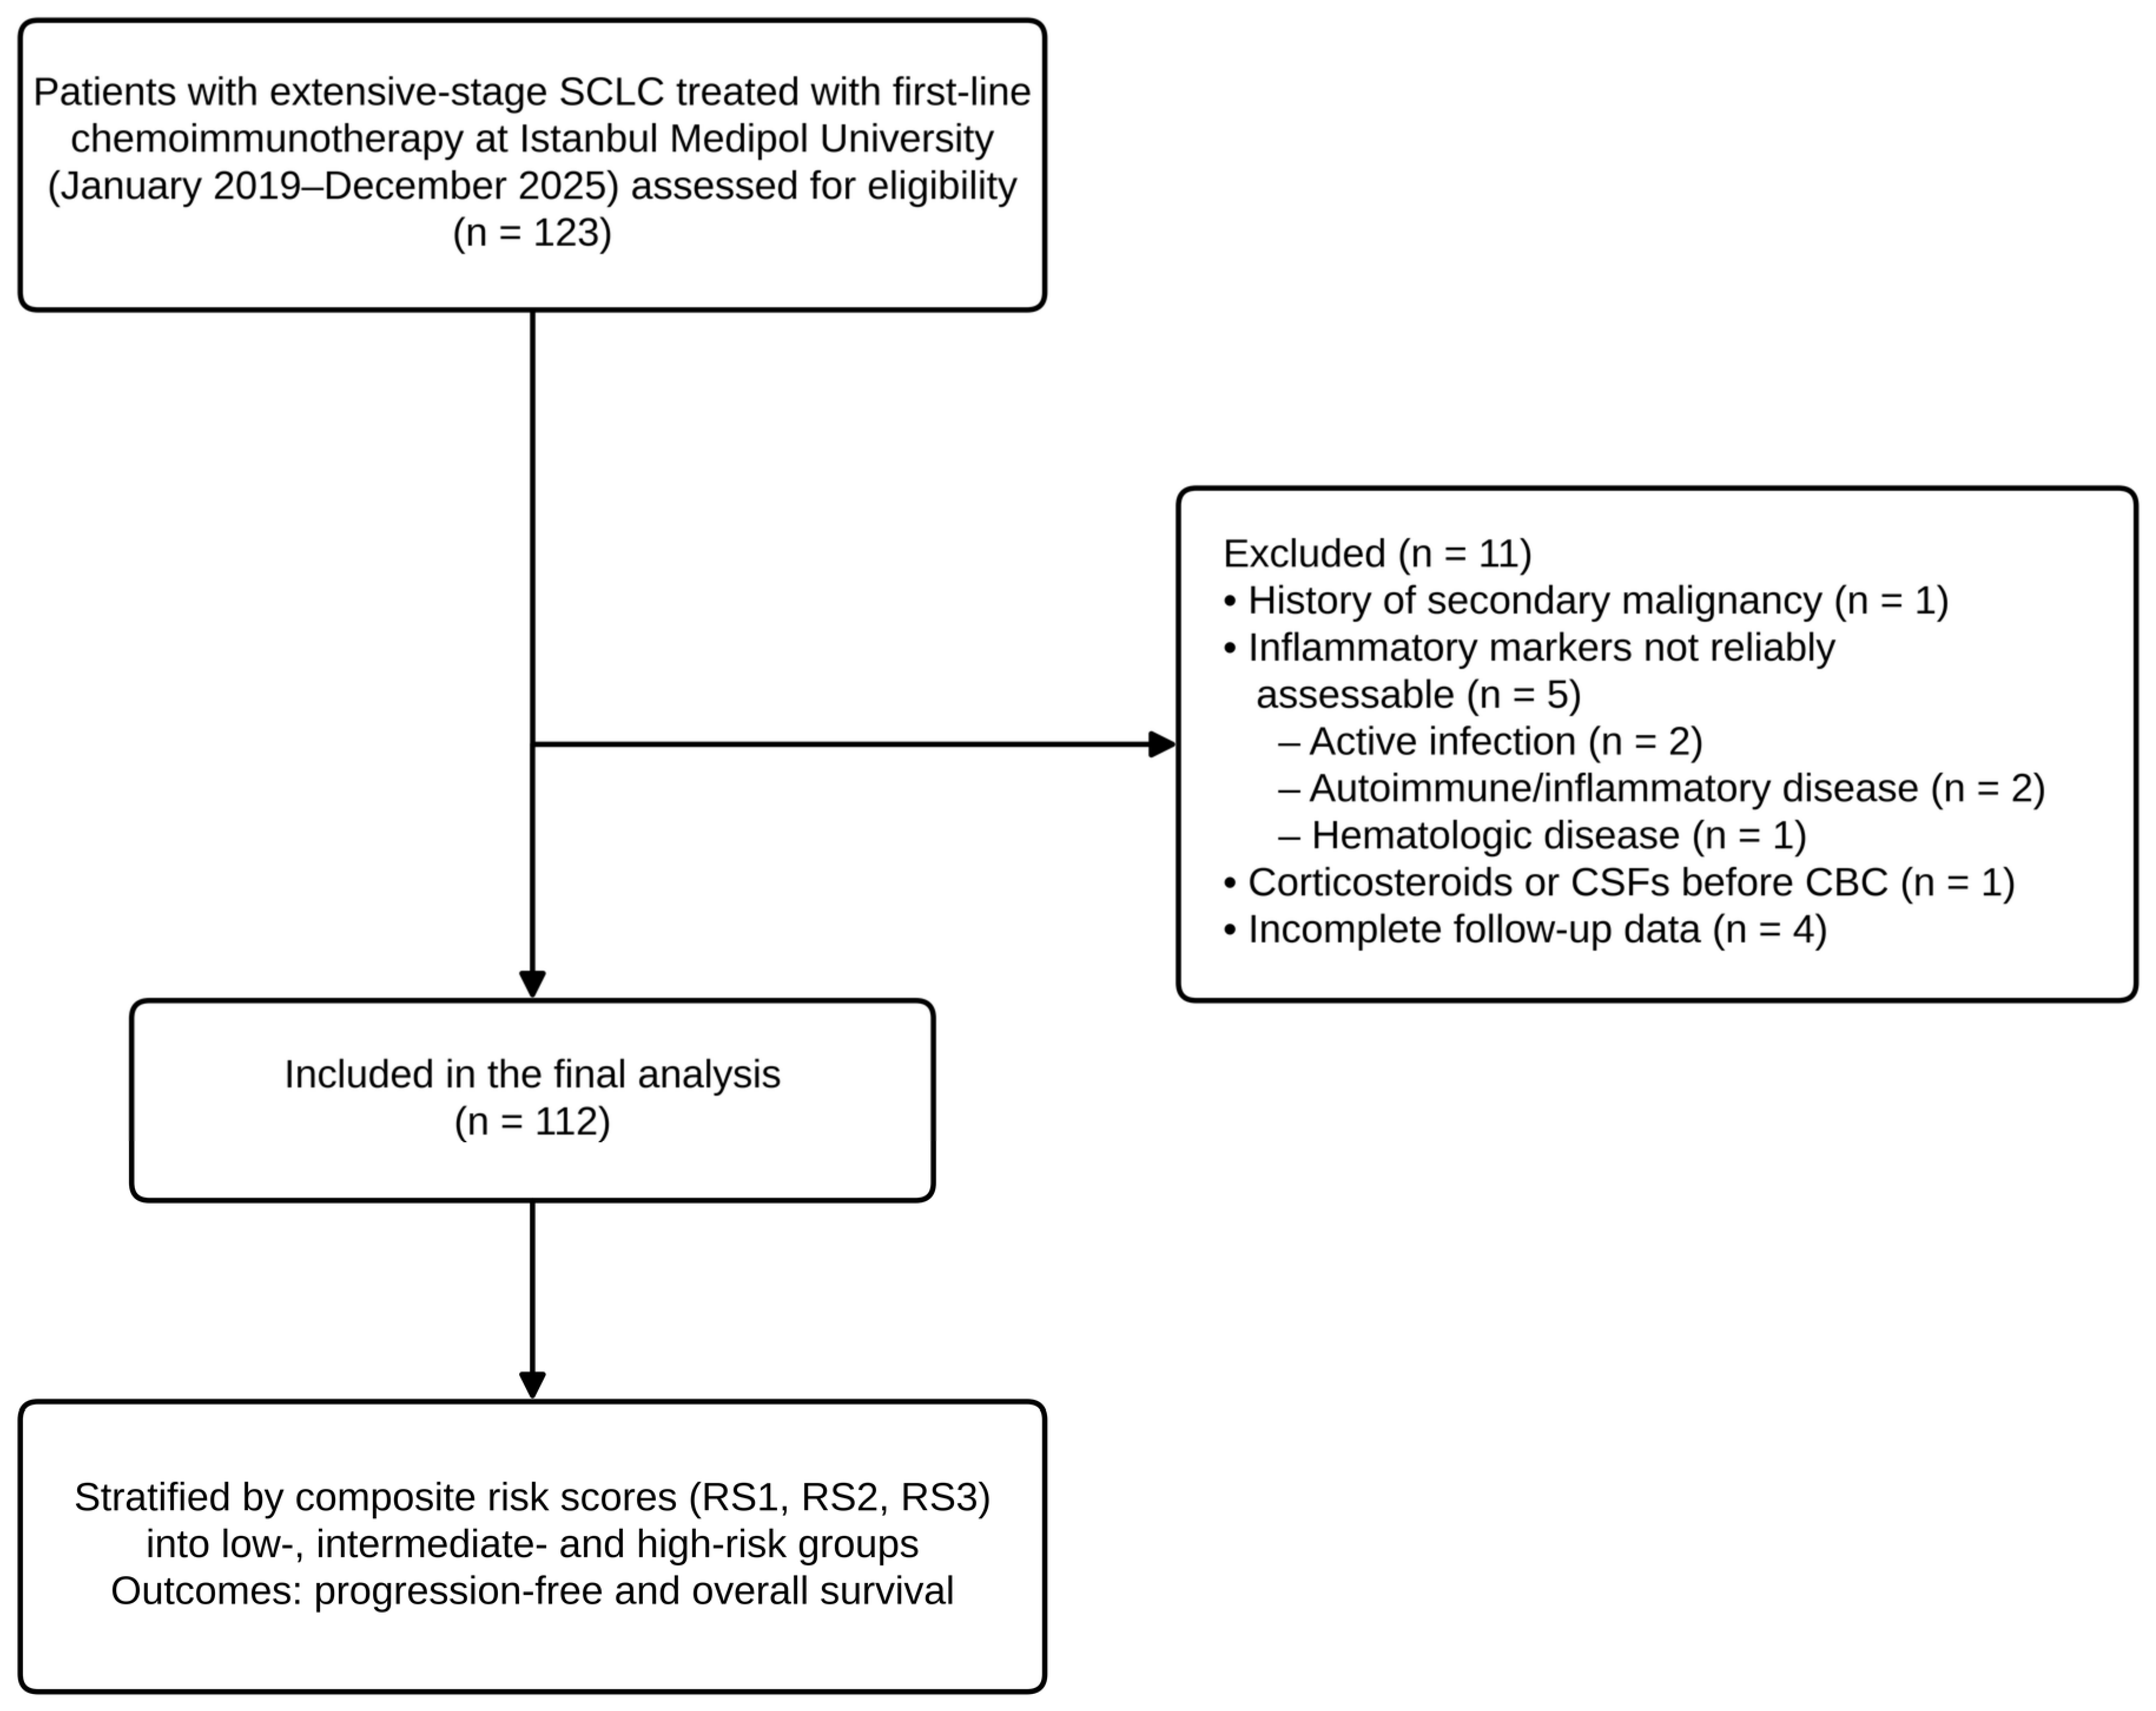
This was a single-center, retrospective cohort study based on the records of patients diagnosed with ES-SCLC who were followed and treated at the Department of Medical Oncology, Istanbul Medipol University Faculty of Medicine, between January 2019 and December 2025. Consecutive patients were included if they had a histopathologically confirmed diagnosis of small-cell lung carcinoma, were considered to have extensive-stage disease at diagnosis, had received first-line chemotherapy plus an ICI, and had available pretreatment 18F-FDG PET/CT imaging and complete blood count data. Because MTV and TLG were measured directly on the images, only patients whose pretreatment 18F-FDG PET/CT images were available in our institutional archive were eligible; this requirement may have favored patients who were fit enough to complete staging at our center. Patients were excluded if they had a history of secondary malignancy; if inflammatory markers could not be reliably assessed because of active infection, autoimmune/inflammatory disease, or hematologic disease; if they had received systemic corticosteroids or colony-stimulating factors before the complete blood count; or if clinical follow-up data were incomplete. A total of 112 patients who met all eligibility criteria were included in the final analysis. The patient selection process is summarized in Figure 1.
Figure 1.
Participant flow diagram. Of 123 patients assessed for eligibility, 11 were excluded and 112 were included in the final analysis. SCLC, small-cell lung cancer; CBC, complete blood count; CSF, colony-stimulating factor; RS, risk score.
The study was designed in accordance with the principles of the Declaration of Helsinki and was approved by the Non-Interventional Clinical Research Ethics Committee of Istanbul Medipol University (E-10840098-202.3.02-1126; 10 February 2026). All methods were performed in accordance with the relevant guidelines and regulations. Data collection was performed between 10 April 2026 and 20 June 2026, following ethics committee approval; the last recorded follow-up visit was on 3 June 2026, which was used as the cut-off date for survival analysis. The study was reported in accordance with the STROBE (Strengthening the Reporting of Observational Studies in Epidemiology) guidelines. Written informed consent was obtained from all patients before inclusion, and all patient records were anonymized before analysis. Generative artificial intelligence tools, including large language models, were not used in this research or in the preparation of this manuscript.
2.2. Metabolic Burden Parameters
All patients underwent pretreatment (baseline) 18F-FDG PET/CT for staging. All FDG-avid lesions, including the primary lung tumor, regional (hilar and mediastinal) lymph nodes, and distant metastases, were included in the analysis to quantify whole-body metabolic tumor burden. MTV was calculated as the total volume of all FDG-avid lesions, with the tumor boundary defined by a fixed standardized uptake value (SUV) threshold of 2.5, and TLG was calculated as the product of MTV and the mean SUV (SUVmean) (TLG = MTV × SUVmean), summed across all metabolically active lesions [12,13]. All measurements were performed by a single nuclear medicine physician blinded to the patients’ clinical outcomes. The fixed SUV 2.5 threshold was selected as an absolute, reproducible, and widely applied segmentation method; a dedicated method-comparison study reported strong correlation between the metabolic tumor volumes derived from the SUV 2.5, 41% of the maximum SUV (SUVmax), and PET Response Criteria in Solid Tumors (PERCIST) approaches [13].
2.3. Systemic Inflammatory Markers
Three systemic inflammatory markers were calculated using the absolute neutrophil, lymphocyte, and platelet counts obtained from the routine complete blood count performed before the start of treatment: NLR = absolute neutrophil count/absolute lymphocyte count [9]; PLR = absolute platelet count/absolute lymphocyte count [9]; and SII = (platelet × neutrophil)/lymphocyte [10]. These markers were selected because they reflect the tumor-associated host inflammatory response and carry prognostic value in various solid tumors.
2.4. Construction of the Composite Prognostic Risk Scores
Three separate composite risk scores were defined by combining the two metabolic burden parameters (MTV and TLG) with the three inflammatory markers (NLR, PLR, SII). In each composite score, the two common PET/CT parameters (MTV and TLG) were combined with a single inflammatory marker:
Risk Score 1 (RS1) = MTV + TLG + NLR
Risk Score 2 (RS2) = MTV + TLG + PLR
Risk Score 3 (RS3) = MTV + TLG + SII
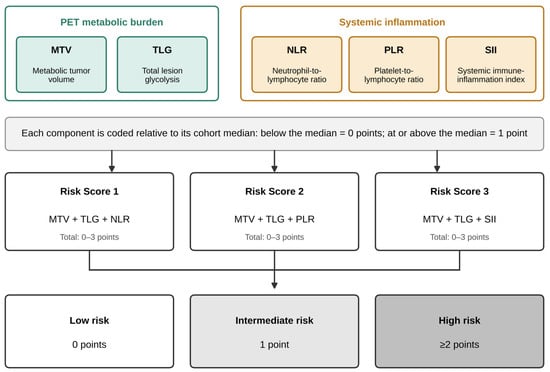
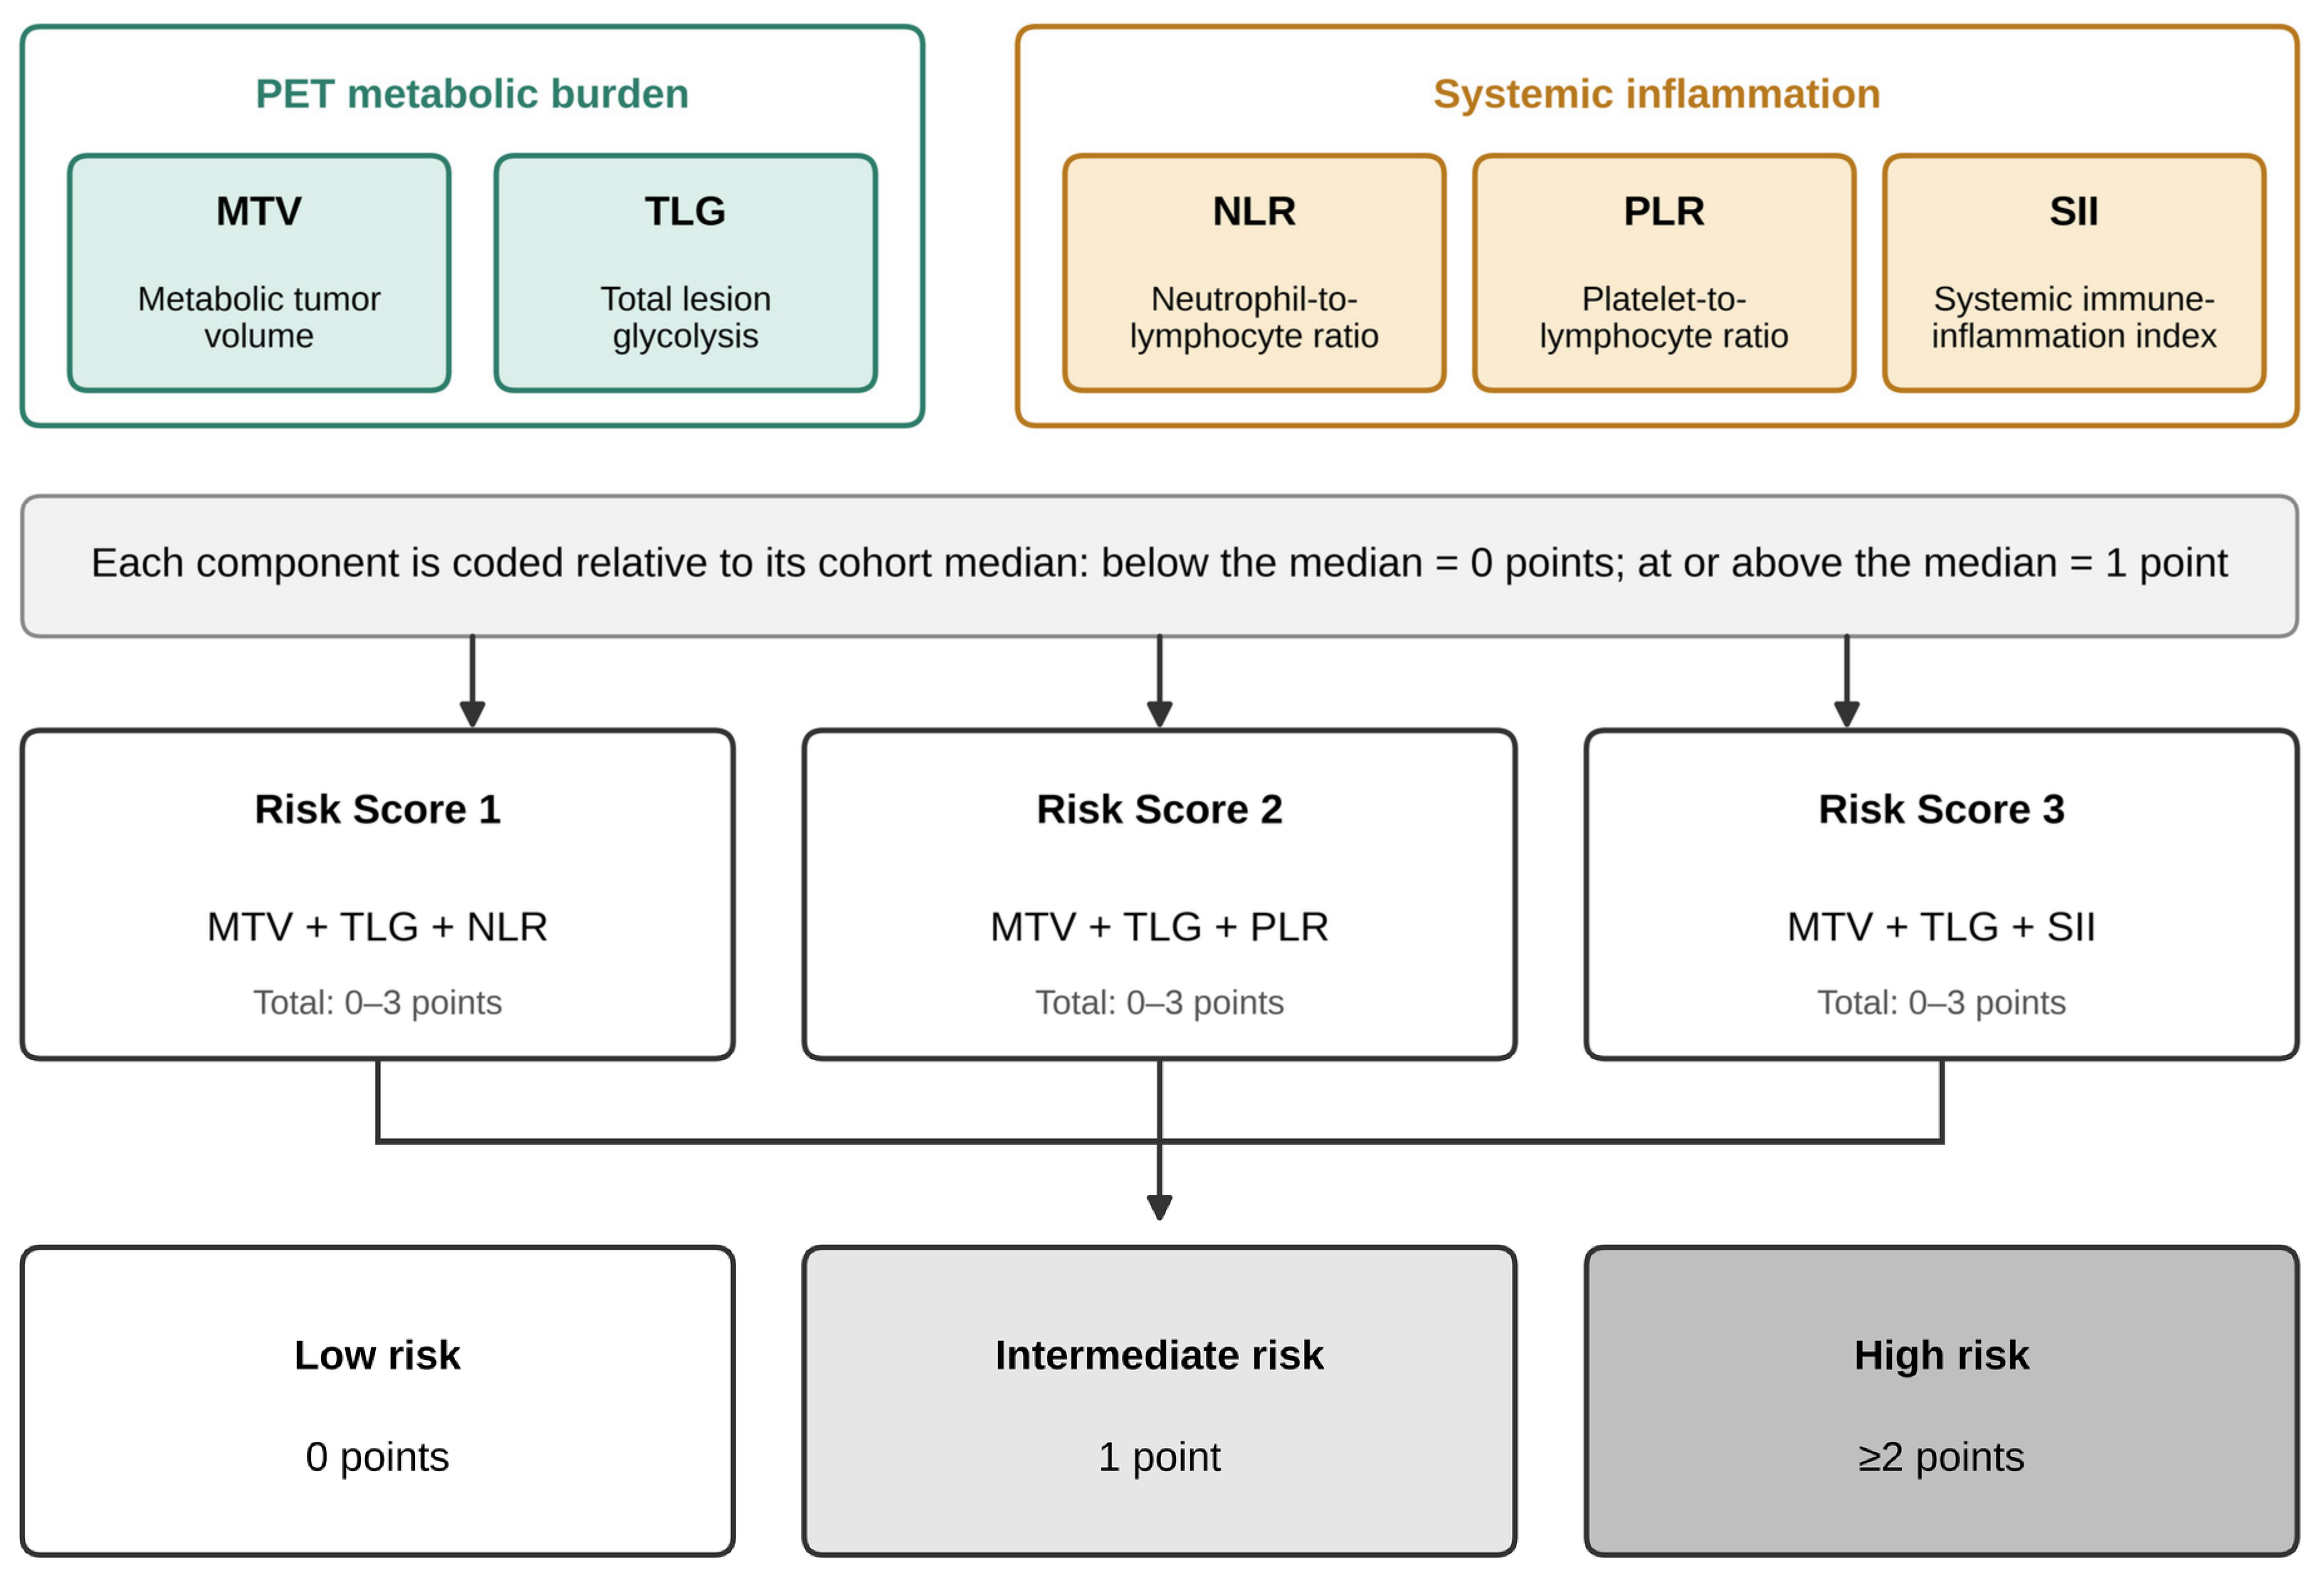
In constructing the scores, each of the three components was dichotomized. To avoid bias arising from data-driven cutoff optimization, the within-cohort median value was prespecified as the threshold for each component; values below the median were coded as low (0 points) and values at or above the median as high (1 point). For each patient, the scores of the three components were summed to yield a composite score ranging from 0 to 3, and patients were divided into three prognostic strata: a total of 0 points, low risk; 1 point, intermediate risk; and 2 points or more, high risk. The same classification logic was applied separately to each of the three composite scores (Figure 2). MTV and TLG were both included because they are the two most widely reported volumetric PET parameters in SCLC and capture related but distinct aspects of metabolic burden, namely tumor volume and volume-weighted glycolytic activity [8]; because TLG is derived from MTV, their redundancy was examined in sensitivity analyses (see Statistical Analysis). Equal weights were assigned to the components, and scores of 2 and 3 were combined into a single high-risk category a priori, to keep the score simple and to avoid data-driven weighting in a cohort of this size. The prespecified median thresholds were 191.3 cm3 for MTV, 1460.7 for TLG, 3.52 for NLR, 173.7 for PLR, and 964.7 for SII.
Figure 2.
Construction of the composite prognostic risk scores. Two common PET metabolic burden parameters (MTV and TLG) and one systemic inflammatory marker were dichotomized in each patient relative to the median value at diagnosis (below the median = 0 points; at or above the median = 1 point). The sum of the three components yielded a score from 0 to 3, and patients were divided into low- (0 points), intermediate- (1 point), and high-risk (≥2 points) groups. The same scheme was applied to each of the three composite scores: Risk Score 1 = MTV + TLG + NLR; Risk Score 2 = MTV + TLG + PLR; Risk Score 3 = MTV + TLG + SII. PET, positron emission tomography; MTV, metabolic tumor volume; TLG, total lesion glycolysis; NLR, neutrophil-to-lymphocyte ratio; PLR, platelet-to-lymphocyte ratio; SII, systemic immune–inflammation index.
2.5. Endpoints
The endpoints were OS and PFS. OS was defined as the time from the date of diagnosis of extensive-stage disease to death from any cause or to the last follow-up date, and PFS as the time from the date of diagnosis of extensive-stage disease to disease progression or death. Patients without an event were censored at the last follow-up date. The date of diagnosis of extensive-stage disease (for patients with recurrent disease, the date of diagnosis of extensive-stage recurrence) was used as the time origin for both endpoints; first-line chemoimmunotherapy was started a median of 13 days (interquartile range, 6–22 days) after this date. Death without documented progression was counted as a PFS event.
2.6. Statistical Analysis
Descriptive statistics were computed with IBM SPSS Statistics version 27 (IBM Corp., Armonk, NY, USA); survival analyses, C-index estimation, and bootstrap validation were performed with Python version 3.13 (Python Software Foundation, Wilmington, DE, USA) using the lifelines package version 0.30.3. Continuous variables were summarized as median (range) because of their skewed distributions, and categorical variables as counts and percentages. Survival curves were estimated using the Kaplan–Meier method, and differences among the three risk strata were compared with the log-rank (Mantel–Cox) test; 95% confidence intervals (CIs) of median survival times were calculated with the log–log transformation. p values in the multivariable models were derived from the Wald test. Because the three composite scores share the MTV and TLG components, each score was evaluated in a separate multivariable Cox proportional-hazards model for PFS and OS. To limit the number of parameters relative to the number of events, each model included the same set of baseline clinical covariates available before treatment initiation, selected on the basis of clinical relevance and univariable association with survival—Eastern Cooperative Oncology Group (ECOG) performance status (0 vs. ≥1), liver metastasis, and bone metastasis—yielding four parameters per model (approximately 21 and 17 events per parameter for PFS and OS, respectively). Post-baseline variables (treatment-related toxicity and immune-related adverse events [irAEs]) were not included in the prognostic models. The risk scores were entered as ordinal variables (per one-tier increase), and RS1 was additionally modeled as a categorical variable with the low-risk group as the reference. The proportional-hazards assumption was verified with scaled Schoenfeld residual tests. To assess incremental prognostic value, the clinical model was compared with models additionally including the PET component alone (MTV + TLG, 0–2 points), NLR alone, the PET component and NLR as separate terms, or each composite score; discrimination was quantified with Harrell’s concordance index (C-index), with optimism correction based on 500 bootstrap resamples, model fit was compared with the Akaike information criterion (AIC), and nested models were compared with the likelihood ratio test. The correlation between MTV and TLG was assessed with Spearman’s rank correlation coefficient. As sensitivity analyses, RS1 was reconstructed with MTV alone or TLG alone as the metabolic component (MTV + NLR and TLG + NLR, 0–2 points each), and the RS1 models were additionally adjusted for age and smoking history. In a further sensitivity analysis, survival was measured from the start of chemoimmunotherapy (or from the diagnosis of extensive-stage disease, whichever was later). ECOG performance status was included in the main models because of its established prognostic role in ES-SCLC, and liver and bone metastases because they were associated with survival in univariable analysis; smoking history was not included in the main models because of the small number of never-smokers (n = 8). In addition, RS1 was analyzed as a four-level score (0, 1, 2, and 3 points), adjusted for the same covariates, to evaluate the grouping of scores of 2 and 3. Results were presented as the hazard ratio (HR) with the 95% confidence interval (CI). A two-sided p < 0.05 was considered the threshold for statistical significance. Exact p values are reported, except that values below 0.001 are shown as p < 0.001. The median follow-up was calculated using the reverse Kaplan–Meier method. No formal correction for multiple comparisons was applied, and the multivariable results were regarded as exploratory (hypothesis-generating). Because the study was retrospective and comprised all consecutive eligible patients, no a priori sample-size or power calculation was performed.
3. Results
3.1. Patient and Disease Characteristics
Of 123 patients assessed for eligibility, 11 were excluded, and 112 patients were included in the final analysis (Figure 1). The median age was 63 years, 68.8% were male, and 92.9% were current or former smokers. Most had an Eastern Cooperative Oncology Group (ECOG) performance status of 0 (75.9%) and de novo metastatic disease (91.1%); the most common metastatic sites were bone (60.7%) and liver (38.4%). First-line ICI was atezolizumab in 79.5% and durvalumab in 20.5% (Table 1). By Response Evaluation Criteria in Solid Tumors (RECIST) version 1.1, the objective response rate (ORR) was 81.3% and the disease control rate (DCR) 84.8%. Treatment-related toxicity occurred in 79.5% and an immune-related adverse event (irAE) in 8.9%.
Table 1.
Patient and disease characteristics (n = 112).
On pretreatment 18F-FDG PET/CT, the median MTV was 191.3 cm3 and the median TLG was 1460.7; the medians of the maximum standardized uptake value (SUVmax) and the systemic inflammatory markers (NLR, PLR, SII) are shown in Table 2.
Table 2.
Descriptive statistics of the continuous variables (N = 112).
3.2. Univariable Survival Analysis (PFS and OS)
In the whole cohort, 83 progression/death events (74.1%) were observed in the PFS analysis, with a median PFS of 7.70 months (95% confidence interval [CI], 7.23–8.10). In the OS analysis, 68 deaths (60.7%) were observed, with a median OS of 14.43 months (95% CI, 10.83–18.67). The median follow-up (by the reverse Kaplan–Meier method) was 27.6 months (95% CI, 17.9–35.6). For each of the three composite risk scores, the high-risk group constituted the largest subgroup (n = 58).
All demographic, clinical, pathological, treatment-related, and imaging/laboratory variables were evaluated for their association with PFS and OS at the univariable level using the log-rank test (Table 3).
Table 3.
Univariable survival analysis (log-rank test) for PFS and OS; median survival times.
The significant prognostic variables for PFS were smoking history (p = 0.002), liver metastasis (p = 0.001), bone metastasis (p = 0.002), treatment-related toxicity (p = 0.005), and irAE (p = 0.005). The significant variables for OS were ECOG performance status (p < 0.001), liver metastasis (p = 0.006), bone metastasis (p = 0.008), and irAE (p = 0.012); ICI type showed a borderline trend (p = 0.072).
3.2.1. Survival by Risk Score 1 (MTV + TLG + NLR)
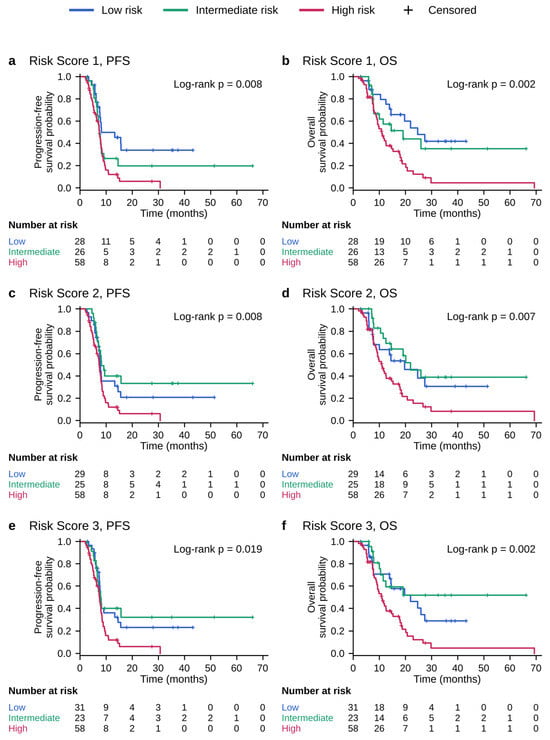
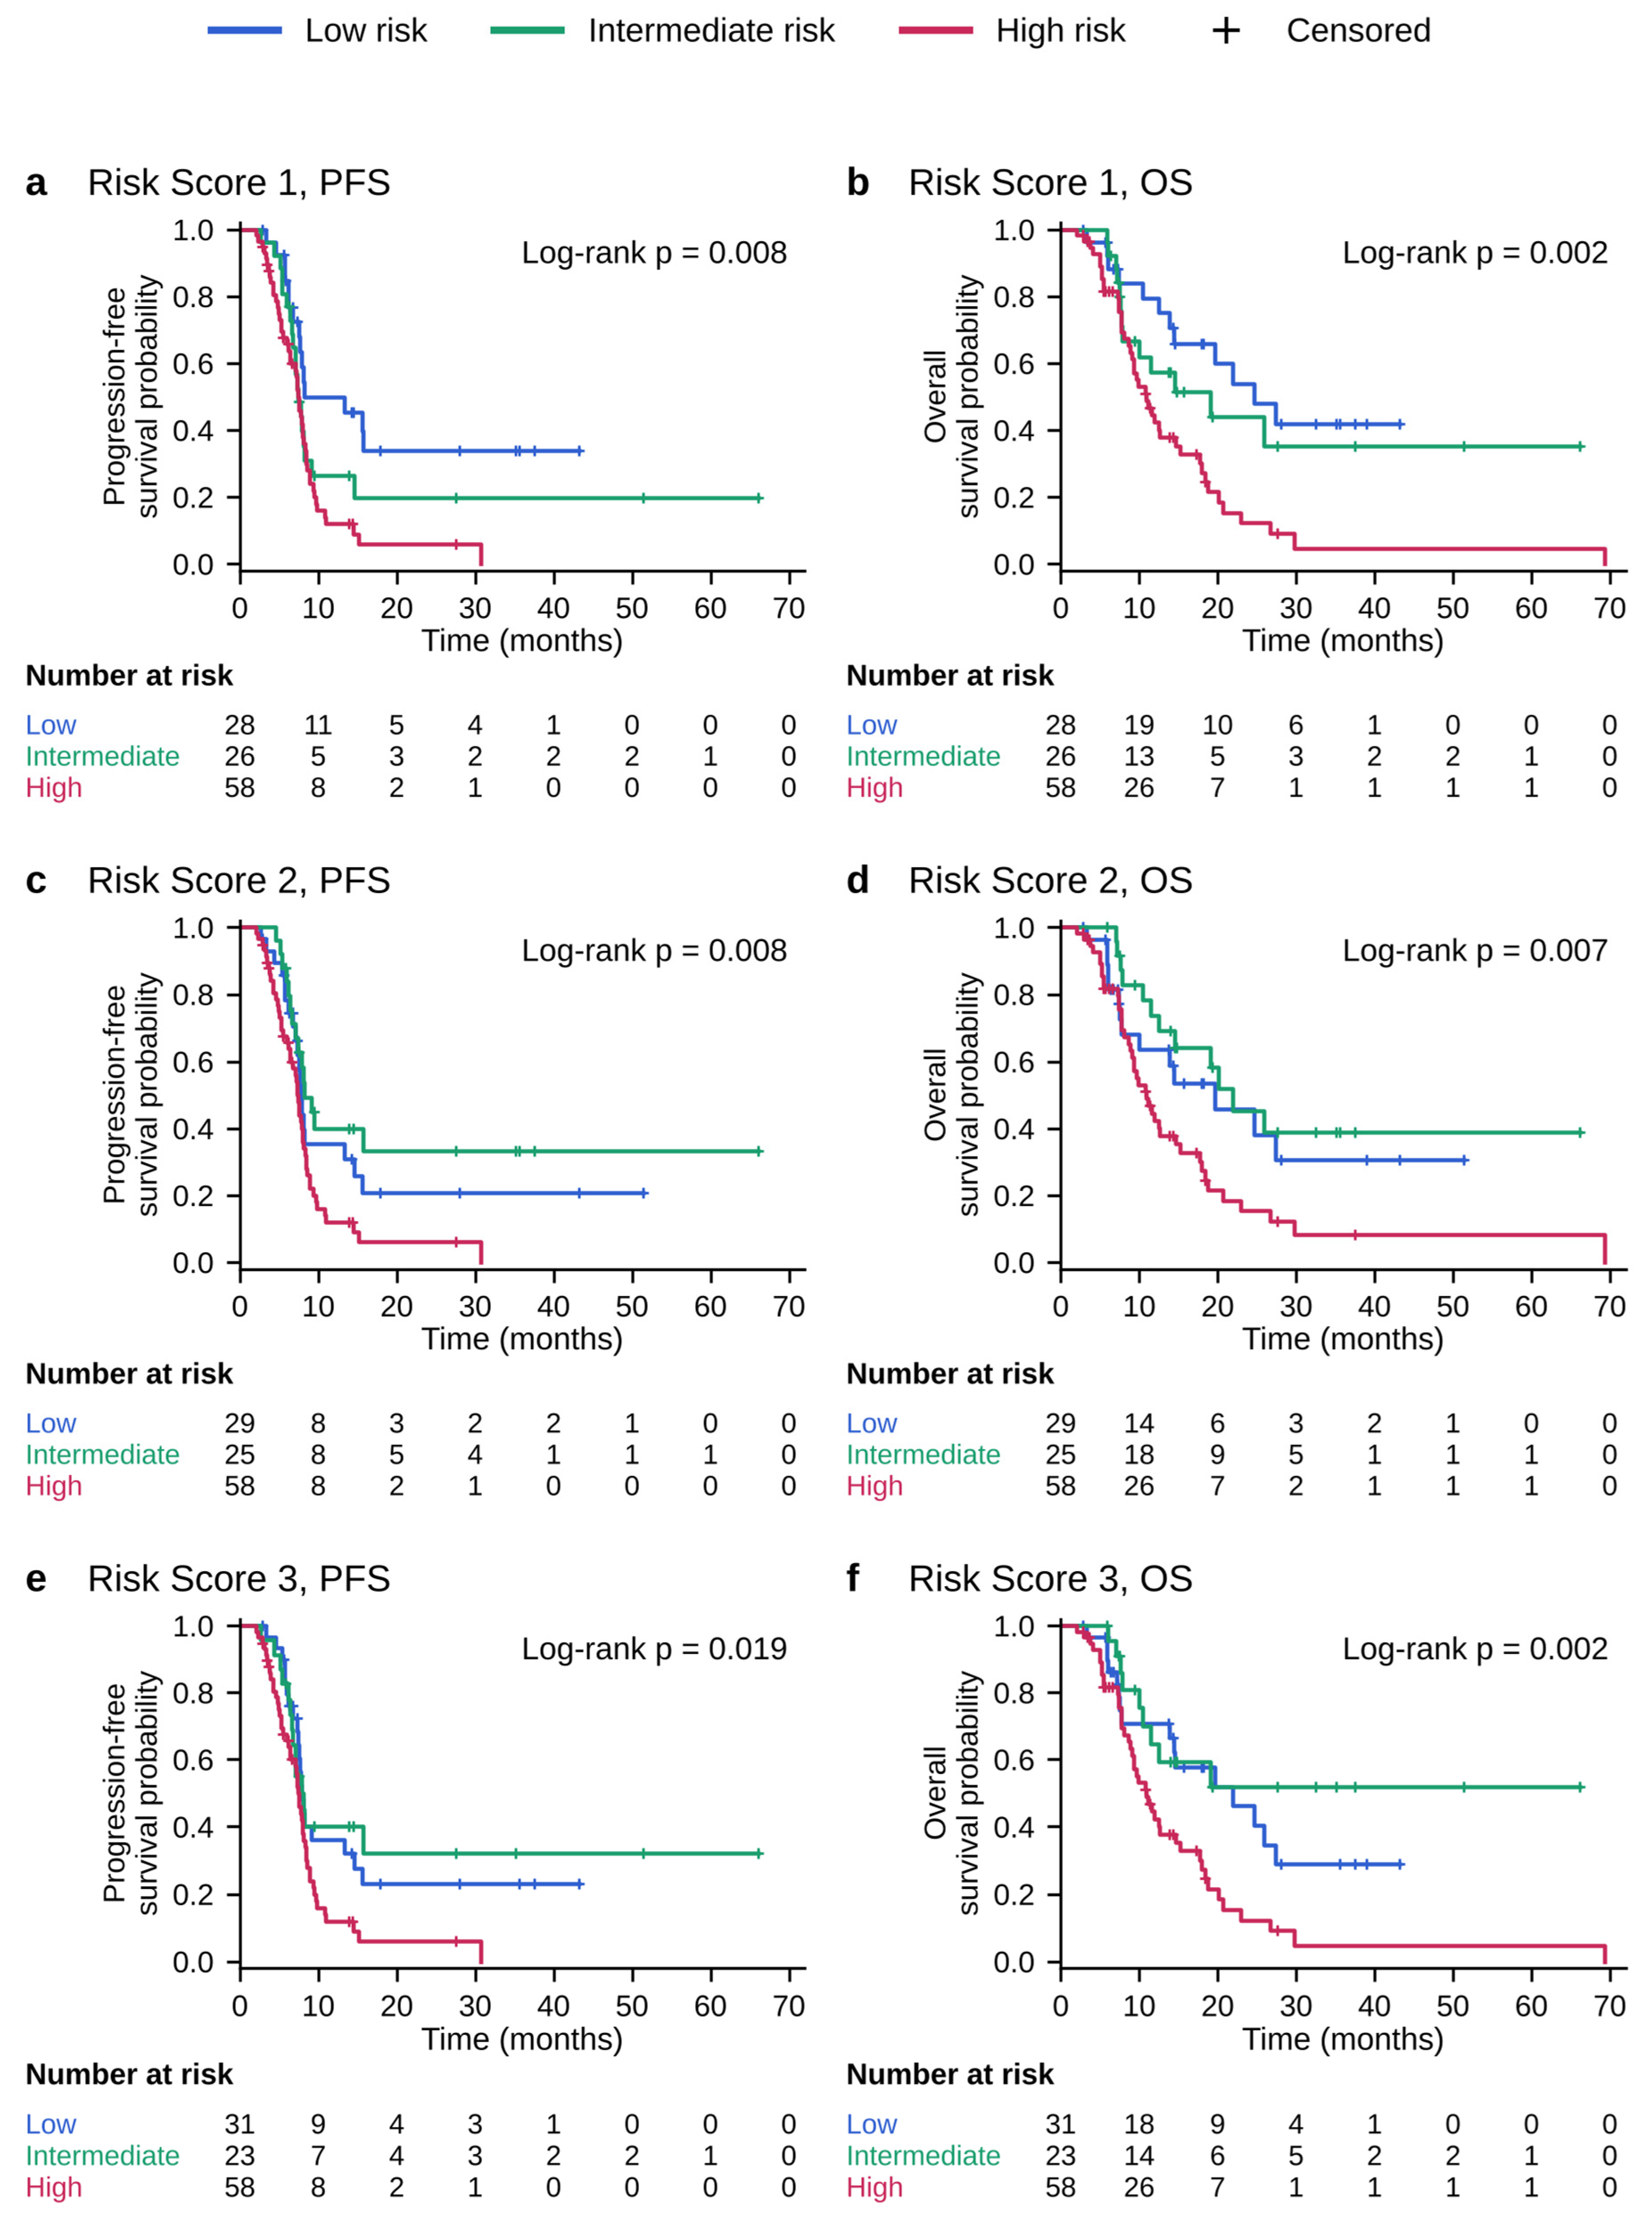
Risk Score 1 significantly separated patients for both PFS and OS (PFS, p = 0.008; OS, p = 0.002). For PFS, the median times were similar across the groups (8.17, 7.37, and 7.40 months in the low-, intermediate-, and high-risk groups, respectively); the separation of the curves (p = 0.008) appeared to reflect mainly the larger proportion of patients with durable disease control in the low-risk group (Figure 3a), and no gradient was observed between the intermediate- and high-risk groups. The separation was more pronounced for OS: the median OS declined from 24.67 months in the low-risk group to 19.03 months in the intermediate-risk group and 10.83 months in the high-risk group, and the difference was significant (p = 0.002) (Table 4, Figure 3a,b).
Figure 3.
Kaplan–Meier survival curves according to the three composite risk groups (low/intermediate/high). The left column shows PFS and the right column shows OS: (a,b) Risk Score 1; (c,d) Risk Score 2; (e,f) Risk Score 3. Groups were compared with the log-rank test; log-rank p values are shown in each panel and in Table 4. Crosses indicate censored observations. The numbers of patients at risk over time (low/intermediate/high) are listed below each panel. PFS, progression-free survival; OS, overall survival. PFS events include deaths without documented progression.
Table 4.
PFS and OS results according to the three composite risk scores.
3.2.2. Survival by Risk Score 2 (MTV + TLG + PLR)
Risk Score 2 also provided significant separation for both endpoints (PFS, p = 0.008; OS, p = 0.007). For PFS, although the median times were similar across the low-, intermediate-, and high-risk groups (7.70, 8.17, and 7.27 months, respectively), the log-rank test was significant (p = 0.008). The separation was stronger for OS: the median OS was 19.63 months in the low-risk group, 21.93 months in the intermediate-risk group, and 10.83 months in the high-risk group, and the difference was significant (p = 0.007) (Table 4, Figure 3c,d).
3.2.3. Survival by Risk Score 3 (MTV + TLG + SII)
Risk Score 3 showed a significant difference for PFS (median times of 7.83, 8.03, and 7.40 months in the low-, intermediate-, and high-risk groups, respectively; p = 0.019) and a more pronounced separation for OS. For OS, the median was 21.93 months in the low-risk group, was not reached during follow-up in the intermediate-risk group, and declined to 10.83 months in the high-risk group (p = 0.002) (Table 4, Figure 3e,f).
3.3. Multivariable Survival Analysis (PFS and OS)
In separate multivariable models adjusted for ECOG performance status, liver metastasis, and bone metastasis, RS1 remained independently associated with both PFS (HR per one-tier increase, 1.39; 95% CI, 1.04–1.86; p = 0.026) and OS (HR, 1.53; 95% CI, 1.09–2.16; p = 0.014), whereas neither RS2 (PFS, p = 0.228; OS, p = 0.173) nor RS3 (PFS, p = 0.169; OS, p = 0.079) retained independent significance (Table 5). In the RS1 model, ECOG performance status ≥1 was independently associated with OS (HR, 2.31; 95% CI, 1.27–4.19; p = 0.006), and liver metastasis with PFS (HR, 1.66; 95% CI, 1.02–2.71; p = 0.041). The proportional-hazards assumption was not violated in any model (all p > 0.05).
Table 5.
Multivariable Cox regression analyses for PFS and OS, with each composite risk score evaluated in a separate model.
When RS1 was modeled categorically, the high-risk group had a significantly higher hazard of progression or death than the low-risk group (HR, 2.08; 95% CI, 1.12–3.85; p = 0.020), and the intermediate-risk group showed a borderline association of similar magnitude (HR, 2.04; 95% CI, 1.00–4.17; p = 0.050), with no gradient between them; for OS, only the high-risk group differed significantly from the low-risk group (intermediate risk: HR, 1.34; 95% CI, 0.59–3.05; p = 0.481; high risk: HR, 2.28; 95% CI, 1.13–4.58; p = 0.021). When RS1 was analyzed as a four-level score, patients with scores of 2 (n = 30) and 3 (n = 28) had similar adjusted hazards relative to those with a score of 0 for both PFS (HR, 1.96 and 2.25, respectively) and OS (HR, 2.41 and 2.12, respectively).
In a sensitivity analysis additionally adjusted for age and smoking history, the association of RS1 with PFS (HR, 1.46; 95% CI, 1.08–1.98; p = 0.014) and OS (HR, 1.54; 95% CI, 1.09–2.18; p = 0.015) was maintained. When survival was measured from the start of chemoimmunotherapy (or from the diagnosis of extensive-stage disease, whichever was later), the association of RS1 with PFS (HR, 1.40; 95% CI, 1.05–1.87; p = 0.023) and OS (HR, 1.53; 95% CI, 1.09–2.15; p = 0.015) was also maintained.
3.4. Incremental Prognostic Value
The clinical model (ECOG performance status, liver metastasis, and bone metastasis) yielded a C-index of 0.608 for PFS and 0.633 for OS (Table 6). Adding RS1 improved model fit for both PFS (likelihood ratio test, p = 0.021) and OS (p = 0.011) and yielded the lowest Akaike information criterion (AIC); the C-index increased to 0.633 and 0.656, respectively (optimism-corrected, 0.613 and 0.637). However, the PET component accounted for most of this gain: adding NLR to a model already containing the PET component did not significantly improve fit for PFS (p = 0.233) or OS (p = 0.579), whereas adding the PET component to a model containing NLR improved fit for OS (p = 0.026) and showed a trend for PFS (p = 0.072).
Table 6.
Discrimination and model fit of the clinical model and of models including the PET component, NLR, or the composite risk scores.
MTV and TLG were highly correlated (Spearman ρ = 0.98), and their median-based categories agreed in 96.4% of patients. When RS1 was reconstructed with MTV alone or TLG alone, the associations with PFS (MTV + NLR: HR, 1.39; 95% CI, 1.01–1.91; p = 0.040; TLG + NLR: HR, 1.43; 95% CI, 1.04–1.96; p = 0.028) and OS (MTV + NLR: HR, 1.44; 95% CI, 1.00–2.05; p = 0.048; TLG + NLR: HR, 1.39; 95% CI, 0.97–2.00; p = 0.075) were of similar magnitude, with C-indices comparable to that of the original RS1 (Table 6).
4. Discussion
In this study, we compared composite prognostic risk scores that combine pretreatment metabolic tumor burden measured by 18F-FDG PET/CT (MTV + TLG) with three systemic inflammatory markers derived from the complete blood count, in patients with ES-SCLC receiving first-line chemoimmunotherapy. The most consistent prognostic signal was obtained from Risk Score 1 (RS1), based on MTV + TLG + NLR: this score provided significant stratification in univariable analysis for both PFS and OS (p = 0.008 and p = 0.002, respectively) and remained independently associated with both endpoints in separate multivariable Cox models adjusted for ECOG performance status and metastatic sites (HR 1.39 for PFS and 1.53 for OS per one-tier increase in risk). By contrast, neither PLR-based Risk Score 2 (RS2) nor SII-based Risk Score 3 (RS3) was independently significant for either endpoint after adjustment for baseline clinical factors. Taken together, this pattern suggests that the NLR-based composite score—combining two readily accessible and complementary biological axes, viable tumor burden and the host inflammatory response, in a single threshold-based metric—may provide low-cost survival stratification for ES-SCLC in the ICI era. However, the incremental analyses indicated that the prognostic information of RS1 derived mainly from its metabolic component: NLR did not add statistically significant information beyond PET-derived metabolic burden, and the gain in discrimination over clinical factors was modest (C-index increase of approximately 0.02).
The inclusion of NLR in the composite score is biologically plausible. A predominance of neutrophils and relative lymphopenia reflect a host state characterized by expansion of myeloid-derived suppressor cells, suppression of effector T-cell function, and increased tumor-associated inflammation. This microenvironment may limit the efficacy of ICIs, whose benefit depends largely on pre-existing adaptive immunity [6,7]. Whereas the metabolic parameters (MTV and TLG) quantify the viable tumor burden and glycolytic activity throughout the body, NLR captures this unfavorable dimension of the host response; combining the two axes may yield a more comprehensive risk profile, although in our cohort the added contribution of NLR beyond metabolic burden did not reach statistical significance. This framework also aligns with the molecular subtypes of ES-SCLC: in transcription factor-based classification, the “inflamed” SCLC-I subtype derives the greatest benefit from adding immunotherapy to chemotherapy [14]. Although molecular subtyping data were not available in our study, blood-based inflammatory markers might partly reflect an unfavorable immune milieu.
Our findings regarding the metabolic component are consistent with the existing literature. A systematic review and meta-analysis showed that pretreatment MTV and TLG are associated with shorter OS and PFS in SCLC [8]. More importantly, a multicenter study reported that a high total metabolic tumor volume was independently associated with worse outcomes in patients with ES-SCLC receiving first-line chemoimmunotherapy, and that this association was particularly pronounced in the chemoimmunotherapy cohort [15]. Similarly, pretreatment metabolic tumor burden has emerged as a strong predictor of survival in ICI-treated melanoma and non-small-cell lung cancer [16,17]. Our data add to this body of evidence indicating that metabolic burden also carries prognostic information in ES-SCLC in the ICI era.
The pattern observed among the inflammatory markers is broadly in line with prior evidence. Whereas NLR is a strong and consistent adverse prognostic marker in SCLC, the independent effect of PLR does not reach significance in meta-analyses [9], which is consistent with the lack of independent prognostic value of PLR-based Risk Score 2. Although SII has been described as a strong prognostic biomarker in patients with SCLC treated with chemotherapy [10], its value in the ICI-treated population is less well established; in our study, the SII-based score stratified both PFS and OS in univariable analysis but did not retain independent significance after adjustment for baseline clinical factors. However, the three scores were not formally compared with each other, and their C-indices were similar (Table 6); therefore, our data do not establish that the inflammatory markers differ in prognostic value.
The limitations of individual markers have increased interest in combined biomarkers. Previous studies have largely combined inflammatory indices with one another or with PD-L1 [11] or combined a metabolic score with a derived NLR [17]. The contribution of our study is that it integrates PET-measured metabolic tumor burden with systemic inflammation into a single composite score, specifically in the ICI-treated ES-SCLC population, and that it uses prespecified median thresholds for each component to reduce the bias arising from data-driven cutoff optimization. This simple, three-component (0–3 point) stratification, which divides patients into three risk strata (low = 0; intermediate = 1; high = ≥2 points), can be obtained from routine pretreatment evaluation without additional cost or invasive procedures.
MTV and TLG were both included in the scores because they are the two most widely reported volumetric PET parameters in SCLC and capture related but distinct aspects of tumor burden, namely tumor volume and volume-weighted glycolytic activity [8]. However, because TLG is the product of MTV and SUVmean, the two parameters were almost perfectly correlated in our cohort, so that their inclusion as two separate components effectively doubled the weight of metabolic burden relative to the inflammatory marker. Sensitivity analyses using MTV or TLG alone yielded associations of similar magnitude, indicating that a single volumetric parameter conveys essentially the same prognostic information and that a simpler two-component score may be preferable in future validation studies. The equal weighting of the components and the merging of scores of 2 and 3 into a single high-risk category were chosen a priori for simplicity; in an exploratory analysis of RS1 as a four-level score, patients with scores of 2 and 3 had similar hazards for both PFS and OS, supporting this grouping.
Our findings regarding the clinical covariates are also biologically meaningful. Liver metastasis was independently associated with PFS in the RS1 model (p = 0.041), consistent with mechanistic evidence that liver metastases create a systemic “immune desert” by siphoning off and eliminating antigen-specific CD8+ T-cells in the hepatic microenvironment, thereby reducing ICI efficacy independently of other markers [18]. ECOG performance status was independently associated with OS, consistent with its established prognostic role in ES-SCLC, and RS1 remained significant after adjustment for it. In univariable analysis, the development of an irAE was associated with longer PFS and OS (log-rank p = 0.005 and p = 0.012, respectively); large meta-analyses demonstrating an association between the presence of irAEs and ICI efficacy in lung cancer support this observation [19]. Likewise, the presence of treatment-related toxicity was associated with longer PFS in univariable analysis (p = 0.005). These associations for both irAEs and toxicity are susceptible to immortal-time bias, because such events occur over the course of treatment; these variables should therefore be interpreted with caution and not as causal protective factors, because these associations may partly reflect longer treatment exposure. For this reason, these post-baseline variables were not included in the baseline prognostic models; a time-dependent analysis was not performed because the onset dates of these events were not consistently available.
Strengths of the study include a relatively homogeneous population (only patients with ES-SCLC receiving first-line chemoimmunotherapy), performance of the PET measurements by a single nuclear medicine physician blinded to clinical outcomes, avoidance of data-driven cutoff optimization by fixing the cutoffs in advance at the median values, assessment of incremental prognostic value with the C-index and bootstrap validation, and joint evaluation of both PFS and OS. In addition, the cohort’s median OS (14.43 months) is consistent with the range reported in registration trials such as IMpower133 and CASPIAN [2,3], supporting the real-world representativeness of the sample.
The study has several limitations. First, its single-center, retrospective design and relatively limited sample size carry a risk of selection bias and limited statistical power; although the multivariable models were restricted to four parameters (approximately 21 and 17 events per parameter for PFS and OS, respectively), overfitting cannot be excluded, and the modest optimism-corrected C-indices indicate that the results should be regarded as exploratory and hypothesis-generating. Second, the three composite scores share the MTV and TLG components and were highly correlated (Pearson correlation coefficients, 0.87–0.93); to avoid collinearity, each score was therefore evaluated in a separate model. Third, each component was dichotomized at the cohort-specific median. Although prespecified medians avoid data-driven cutoff optimization, dichotomization discards information within each category, and the thresholds depend on the distribution of the study population, PET acquisition and segmentation methods, and laboratory practice; they may therefore not be directly transportable to other cohorts, and validated external cutoffs are needed before clinical application. The thresholds used in this study (MTV, 191.3 cm3; TLG, 1460.7; NLR, 3.52; PLR, 173.7; SII, 964.7) are reported to facilitate comparison, and analyses of the components as continuous variables in larger cohorts are warranted. Fourth, the cohort was restricted to patients with pretreatment PET/CT images available in our institutional archive and consisted mostly of patients with good performance status (ECOG 0, 75.9%; ECOG 2, 4.5%), which may limit generalizability to patients with poorer performance status. In addition, because survival was measured from the diagnosis of extensive-stage disease and only patients who started chemoimmunotherapy were included, a short period of immortal time may have been introduced; however, when survival was measured from the start of chemoimmunotherapy (or from the diagnosis of extensive-stage disease, whichever was later), the association of RS1 with PFS (HR, 1.40; 95% CI, 1.05–1.87; p = 0.023) and OS (HR, 1.53; 95% CI, 1.09–2.15; p = 0.015) was unchanged. Fifth, complementary biomarkers such as PD-L1 expression, molecular subtype, and circulating tumor DNA (ctDNA) were not available. Finally, although discrimination was assessed with the C-index and internal bootstrap validation, calibration was not assessed, and external validation was not performed.
External validation in prospective, multicenter, and independent cohorts is a priority for translating these findings into clinical use. Although a fixed SUV 2.5 threshold was applied in this study, the strong inter-method correlation reported for metabolic tumor volume measurement suggests that this choice is unlikely to have materially affected the observed prognostic associations [13], although alternative segmentation methods were not tested in our cohort. Future studies should standardize MTV measurement methods; integrate the composite score with orthogonal markers such as molecular subtype (particularly SCLC-I) and ctDNA; and confirm whether the inflammatory component adds prognostic value beyond metabolic burden and established clinical factors. In addition, the prognostic contribution of on-treatment metabolic and inflammatory changes (delta) is worth investigating.
5. Conclusions
In patients with ES-SCLC treated with ICIs, the NLR-based composite risk score combining pretreatment metabolic tumor burden with systemic inflammation was independently associated with both PFS and OS after adjustment for ECOG performance status and metastatic sites. However, its gain in discrimination over clinical factors was modest and driven mainly by the metabolic component, and the added value of NLR could not be demonstrated. These exploratory findings should be confirmed in prospective, multicenter cohorts before the score is considered for risk stratification in clinical practice or trial design.
Author Contributions
Conceptualization, H.Ö., M.M.M. and A.B.; Methodology, H.Ö., J.H., Y.K. and A.B.; Validation, A.K.; Formal Analysis, H.Ö., B.Ç.D., Ö.A. and A.B.; Investigation, H.Ö., M.M.M., A.L.G., M.E., M.H.Y., E.S., E.E.D., S.F., C.T., B.Ç.D., J.H., Y.K., Ö.A. and M.Ş.; Data Curation, H.Ö., M.M.M., M.E., M.H.Y., E.S., E.E.D., S.F., C.T., B.Ç.D., J.H., Y.K., Ö.A. and M.Ş.; Writing—Original Draft Preparation, H.Ö.; Writing—Review & Editing, H.Ö., M.M.M., A.L.G., A.K., M.E., M.H.Y., E.S., E.E.D., S.F., C.T., B.Ç.D., J.H., Y.K., Ö.A., M.Ş. and A.B.; Visualization, H.Ö.; Supervision, M.Ş. and A.B.; Project Administration, H.Ö. and A.B. All authors have read and agreed to the published version of the manuscript.
Funding
This research received no external funding.
Institutional Review Board Statement
The study was conducted in accordance with the Declaration of Helsinki and approved by the Non-Interventional Clinical Research Ethics Committee of Istanbul Medipol University (protocol code E-10840098-202.3.02-1126; date of approval: 10 February 2026).
Informed Consent Statement
Informed consent was obtained from all subjects involved in the study.
Data Availability Statement
The data presented in this study are available on request from the corresponding author due to patient privacy and institutional data-protection restrictions.
Conflicts of Interest
The authors declare no conflicts of interest.
References
- Rudin, C.M.; Brambilla, E.; Faivre-Finn, C.; Sage, J. Small-cell lung cancer. Nat. Rev. Dis. Primers 2021, 7, 3. [Google Scholar] [CrossRef] [Scilit] [PubMed]
- Horn, L.; Mansfield, A.S.; Szczęsna, A.; Havel, L.; Krzakowski, M.; Hochmair, M.J.; Huemer, F.; Losonczy, G.; Johnson, M.L.; Nishio, M.; et al. First-Line Atezolizumab plus Chemotherapy in Extensive-Stage Small-Cell Lung Cancer. N. Engl. J. Med. 2018, 379, 2220–2229. [Google Scholar] [CrossRef] [Scilit] [PubMed]
- Paz-Ares, L.; Dvorkin, M.; Chen, Y.; Reinmuth, N.; Hotta, K.; Trukhin, D.; Statsenko, G.; Hochmair, M.J.; Özgüroğlu, M.; Ji, J.H.; et al. Durvalumab plus platinum-etoposide versus platinum-etoposide in first-line treatment of extensive-stage small-cell lung cancer (CASPIAN): A randomised, controlled, open-label, phase 3 trial. Lancet 2019, 394, 1929–1939. [Google Scholar] [CrossRef] [Scilit] [PubMed]
- Rudin, C.M.; Awad, M.M.; Navarro, A.; Gottfried, M.; Peters, S.; Csőszi, T.; Cheema, P.K.; Rodriguez-Abreu, D.; Wollner, M.; Yang, J.C.; et al. Pembrolizumab or Placebo Plus Etoposide and Platinum as First-Line Therapy for Extensive-Stage Small-Cell Lung Cancer: Randomized, Double-Blind, Phase III KEYNOTE-604 Study. J. Clin. Oncol. 2020, 38, 2369–2379. [Google Scholar] [CrossRef] [Scilit] [PubMed]
- Hellmann, M.D.; Callahan, M.K.; Awad, M.M.; Calvo, E.; Ascierto, P.A.; Atmaca, A.; Rizvi, N.A.; Hirsch, F.R.; Selvaggi, G.; Szustakowski, J.D.; et al. Tumor Mutational Burden and Efficacy of Nivolumab Monotherapy and in Combination with Ipilimumab in Small-Cell Lung Cancer. Cancer Cell 2019, 35, 329. [Google Scholar] [CrossRef] [Scilit] [PubMed]
- Yao, J.; Ji, L.; Wang, G.; Ding, J. Effect of neutrophils on tumor immunity and immunotherapy resistance with underlying mechanisms. Cancer Commun. 2025, 45, 15–42. [Google Scholar] [CrossRef] [Scilit] [PubMed]
- Rachidi, S.; Metelli, A.; Riesenberg, B.; Wu, B.X.; Nelson, M.H.; Wallace, C.; Paulos, C.M.; Rubinstein, M.P.; Garrett-Mayer, E.; Hennig, M.; et al. Platelets subvert T cell immunity against cancer via GARP-TGFβ axis. Sci. Immunol. 2017, 2, eaai7911. [Google Scholar] [CrossRef] [Scilit] [PubMed]
- Nie, K.; Zhang, Y.X.; Nie, W.; Zhu, L.; Chen, Y.N.; Xiao, Y.X.; Liu, S.Y.; Yu, H. Prognostic value of metabolic tumour volume and total lesion glycolysis measured by 18F-fluorodeoxyglucose positron emission tomography/computed tomography in small cell lung cancer: A systematic review and meta-analysis. J. Med. Imaging Radiat. Oncol. 2019, 63, 84–93. [Google Scholar] [CrossRef] [Scilit] [PubMed]
- Zhao, Y.; Wang, Y.; Jiang, Y.; Yang, J.; Zhang, Y. The prognostic impact of neutrophil-to-lymphocyte ratio and platelet-to-lymphocyte ratio on patients with small cell lung cancer receiving first-line platinum-based chemotherapy: A systematic review and meta-analysis. BMC Pulm. Med. 2024, 24, 630. [Google Scholar] [CrossRef] [Scilit] [PubMed]
- Wang, C.; Jin, S.; Xu, S.; Cao, S. High Systemic Immune-Inflammation Index (SII) Represents an Unfavorable Prognostic Factor for Small Cell Lung Cancer Treated with Etoposide and Platinum-Based Chemotherapy. Lung 2020, 198, 405–414. [Google Scholar] [CrossRef] [Scilit] [PubMed]
- Baek, J.M.; Cha, H.; Moon, Y.; Kim, L.; Kwak, S.M.; Park, E.S.; Nam, H.S. A Systemic Immune Inflammation Index and PD-L1 (SP142) Expression as a Potential Combined Biomarker of the Clinical Benefit of Chemo-Immunotherapy in Extensive-Stage Small-Cell Lung Cancer. J. Clin. Med. 2024, 13, 1521. [Google Scholar] [CrossRef] [Scilit] [PubMed]
- Larson, S.M.; Erdi, Y.; Akhurst, T.; Mazumdar, M.; Macapinlac, H.A.; Finn, R.D.; Casilla, C.; Fazzari, M.; Srivastava, N.; Yeung, H.W.; et al. Tumor Treatment Response Based on Visual and Quantitative Changes in Global Tumor Glycolysis Using PET-FDG Imaging. The Visual Response Score and the Change in Total Lesion Glycolysis. Clin. Positron Imaging 1999, 2, 159–171. [Google Scholar] [CrossRef] [Scilit] [PubMed]
- Ilyas, H.; Mikhaeel, N.G.; Dunn, J.T.; Rahman, F.; Møller, H.; Smith, D.; Barrington, S.F. Defining the optimal method for measuring baseline metabolic tumour volume in diffuse large B cell lymphoma. Eur. J. Nucl. Med. Mol. Imaging 2018, 45, 1142–1154. [Google Scholar] [CrossRef] [Scilit] [PubMed]
- Gay, C.M.; Stewart, C.A.; Park, E.M.; Diao, L.; Groves, S.M.; Heeke, S.; Nabet, B.Y.; Fujimoto, J.; Solis, L.M.; Lu, W.; et al. Patterns of transcription factor programs and immune pathway activation define four major subtypes of SCLC with distinct therapeutic vulnerabilities. Cancer Cell 2021, 39, 346–360.e347. [Google Scholar] [CrossRef] [Scilit] [PubMed]
- Grambow-Velilla, J.; Seban, R.D.; Chouahnia, K.; Assié, J.B.; Champion, L.; Girard, N.; Bonardel, G.; Matton, L.; Soussan, M.; Chouaïd, C.; et al. Total Metabolic Tumor Volume on 18F-FDG PET/CT Is a Useful Prognostic Biomarker for Patients with Extensive Small-Cell Lung Cancer Undergoing First-Line Chemo-Immunotherapy. Cancers 2023, 15, 2223. [Google Scholar] [CrossRef] [Scilit] [PubMed]
- Ito, K.; Schöder, H.; Teng, R.; Humm, J.L.; Ni, A.; Wolchok, J.D.; Weber, W.A. Prognostic value of baseline metabolic tumor volume measured on (18)F-fluorodeoxyglucose positron emission tomography/computed tomography in melanoma patients treated with ipilimumab therapy. Eur. J. Nucl. Med. Mol. Imaging 2019, 46, 930–939. [Google Scholar] [CrossRef] [Scilit] [PubMed]
- Seban, R.D.; Assié, J.B.; Giroux-Leprieur, E.; Massiani, M.A.; Soussan, M.; Bonardel, G.; Chouaid, C.; Playe, M.; Goldfarb, L.; Duchemann, B.; et al. Association of the Metabolic Score Using Baseline FDG-PET/CT and dNLR with Immunotherapy Outcomes in Advanced NSCLC Patients Treated with First-Line Pembrolizumab. Cancers 2020, 12, 2234. [Google Scholar] [CrossRef] [Scilit] [PubMed]
- Yu, J.; Green, M.D.; Li, S.; Sun, Y.; Journey, S.N.; Choi, J.E.; Rizvi, S.M.; Qin, A.; Waninger, J.J.; Lang, X.; et al. Liver metastasis restrains immunotherapy efficacy via macrophage-mediated T cell elimination. Nat. Med. 2021, 27, 152–164. [Google Scholar] [CrossRef] [Scilit] [PubMed]
- Wang, D.; Chen, C.; Gu, Y.; Lu, W.; Zhan, P.; Liu, H.; Lv, T.; Song, Y.; Zhang, F. Immune-Related Adverse Events Predict the Efficacy of Immune Checkpoint Inhibitors in Lung Cancer Patients: A Meta-Analysis. Front. Oncol. 2021, 11, 631949. [Google Scholar] [CrossRef] [Scilit] [PubMed]

Disclaimer/Publisher’s Note: The statements, opinions and data contained in all publications are solely those of the individual author(s) and contributor(s) and not of MDPI and/or the editor(s). MDPI and/or the editor(s) disclaim responsibility for any injury to people or property resulting from any ideas, methods, instructions or products referred to in the content. |
© 2026 by the authors. Published by MDPI on behalf of the Lithuanian University of Health Sciences. Licensee MDPI, Basel, Switzerland. This article is an open access article distributed under the terms and conditions of the Creative Commons Attribution (CC BY) license.