


Abstract
Background: We evaluated associations of CT-defined sarcopenia and myosteatosis with complicated acute left-sided colonic diverticulitis (ALCD) and their incremental discrimination beyond clinical characteristics and inflammatory markers. Methods: This retrospective single-center cohort included 164 adults hospitalized with CT-confirmed ALCD. L3 skeletal muscle index (SMI) and attenuation classified patients as having neither abnormality, CT-defined sarcopenia only, myosteatosis only, or both abnormalities. Complicated ALCD was defined as World Society of Emergency Surgery (WSES) CT stage ≥ 1A. Multivariable logistic regression and bootstrap internal validation of discrimination and calibration were performed. An additional sensitivity analysis used WSES stage ≥ 1B. Results: Complicated ALCD occurred in 93/164 patients (56.7%). Proportions differed across the four phenotypes (34.7%, 48.0%, 61.5% and 78.4%; overall p < 0.001). A separate analysis showed a positive trend with the number of muscle abnormalities (0, 1 or 2; p < 0.001). After adjustment, myosteatosis alone (aOR, 4.27; 95% CI, 1.34–13.62) and both abnormalities (aOR, 9.27; 95% CI, 2.85–30.17) remained independently associated with complicated ALCD, whereas CT-defined sarcopenia alone did not. Adding muscle phenotypes to a clinical reference model containing age, sex, ASA class, ACCI, WBC and CRP increased the apparent AUC from 0.837 to 0.877 (apparent ΔAUC, 0.040; 95% CI, 0.004–0.078). Optimism-corrected AUCs were 0.812 and 0.845 (corrected ΔAUC, 0.033). The phenotype-extended clinical model had an optimism-corrected calibration slope of 0.806, indicating residual overfitting. Associations for myosteatosis and the combined phenotype were also observed using WSES stage ≥ 1B. Twelve-month CT-confirmed repeat attacks occurred in 11/121 evaluable patients (9.1%), without phenotype differences (p = 0.553). Conclusions: Myosteatosis and the combined phenotype were associated with complicated ALCD and added discriminatory information beyond the clinical reference model. Residual overfitting and the absence of external validation limit clinical application; clinical net benefit remains unestablished.
1. Introduction
Acute colonic diverticulitis (ACD) is a frequent cause of emergency admission, particularly in Western countries [1]. The clinical presentation is variable, ranging from localized uncomplicated inflammation to abscess, perforation, and generalized peritonitis [2]. Most patients can be managed without invasive treatment; however, complicated ACD remains associated with greater morbidity and more intensive treatment requirements [3]. Identifying patients who are more likely to present with complicated disease is therefore relevant to early management.
Contrast-enhanced computed tomography (CT) is the standard imaging modality for confirming ACD and assessing its extent [4]. CT findings also form the basis of commonly used severity classifications and influence decisions regarding conservative treatment, percutaneous drainage, and surgery [5]. These findings are usually considered together with clinical assessment and laboratory parameters [6]. White blood cell count and C-reactive protein are readily available and useful indicators of the inflammatory response, but they provide limited information about the patient’s baseline physical condition and physiological reserve [7]. At the same time, abdominal CT obtained for the diagnosis of diverticulitis contains information beyond the local inflammatory process that may be clinically useful [8].
Skeletal muscle can be evaluated on routine CT images without additional imaging. CT provides imaging measures of skeletal muscle quantity and attenuation. Low muscle mass on CT alone does not establish a clinical diagnosis of sarcopenia, whereas low muscle attenuation is commonly used as an imaging marker of myosteatosis [9]. The relevance of these findings in diverticulitis has received increasing attention. Dahlbäck et al. reported associations between muscle characteristics and clinical outcomes in patients with acute uncomplicated diverticulitis [10]. Sarcopenia and myosteatosis have also been investigated in patients undergoing surgery for diverticular disease, with both abnormalities showing associations with postoperative outcomes [11]. More recently, sarcopenia has been examined specifically as a factor related to disease severity and treatment decisions in acute diverticulitis [12].
The available studies, however, do not indicate that muscle quantity and muscle quality necessarily carry the same clinical information. In a large cohort of patients with ACD, Surov et al. found sarcopenia to be independently associated with complicated disease, whereas myosteatosis was associated with free perforation [13]. Prospective evidence has also linked CT-derived adiposity measures with WSES-defined complicated diverticulitis, although these findings concern adipose tissue rather than skeletal muscle composition [14]. These observations raise the question of whether CT-defined sarcopenia and myosteatosis, separately and in combination, are associated with complicated disease at presentation and provide discriminatory information beyond routinely available inflammatory markers.
The present study evaluated the associations of CT-defined sarcopenia and myosteatosis with complicated ACD, considering both abnormalities separately and as combined body composition phenotypes. We also examined associations with treatment requirements and clinical outcomes and assessed incremental discrimination beyond inflammatory and clinical reference models, together with internally validated calibration.
2. Materials and Methods
2.1. Study Design and Patient Population
This retrospective, single-center cohort study was conducted at the Department of General Surgery, Van Yüzüncü Yıl University Faculty of Medicine, a tertiary referral center. Institutional records of consecutive adult patients hospitalized with acute colonic diverticulitis between 1 January 2016, and 31 May 2025, were retrospectively screened for eligibility. The final study cohort was restricted to patients with acute left-sided colonic diverticulitis (ALCD). Clinical and follow-up data were reviewed through 30 May 2026, using institutional electronic medical records, radiological archives, operative reports, and outpatient follow-up records.
Acute diverticulitis was defined by a compatible clinical presentation together with characteristic findings on contrast-enhanced abdominal computed tomography (CT). Eligibility required age ≥ 18 years, hospitalization for an index episode of CT-confirmed acute left-sided colonic diverticulitis (ALCD), and an index CT examination suitable for both assessment of diverticulitis severity and quantitative body composition analysis at the third lumbar vertebral level (L3). Left-sided disease was defined as diverticulitis involving the descending and/or sigmoid colon.
Patients were excluded if the index CT examination was unavailable or could not be reliably evaluated, including inadequate L3 coverage or image quality insufficient for quantitative analysis. Patients with diverticulitis confined to the cecum, ascending colon, or transverse colon were excluded to maintain an anatomically homogeneous cohort of ALCD. Additional exclusion criteria were previous colorectal resection, known colorectal malignancy at presentation, inflammatory bowel disease, concomitant intra-abdominal inflammatory or malignant disease that could interfere with assessment of the index episode, chronic immunosuppressive therapy, missing data required for the planned analyses, or inadequate clinical records. For patients with multiple admissions for diverticulitis during the study period, only the first eligible index admission was included in the primary cohort.
We screened a total of 219 potentially eligible patients. After application of the predefined exclusion criteria, 164 patients constituted the final study cohort (Figure 1).
Figure 1.
Study cohort and 12-month outcome assessment. Legend: Of 219 hospitalized adults with acute diverticulitis screened for eligibility, 55 were excluded and 164 patients with CT-confirmed acute left-sided colonic diverticulitis were included in the study cohort. Nineteen patients underwent emergency surgery during the index admission. Among the remaining 145 patients, the 12-month outcome was evaluable in 121 and unavailable in 24. Eleven of the 121 evaluable patients experienced at least one CT-confirmed repeat diverticulitis attack within 12 months; each patient was counted once regardless of the number of repeat attacks. Abbreviations: CT, computed tomography.
2.2. Ethical Approval
The study was conducted in accordance with the Declaration of Helsinki and was approved by the Van Yüzüncü Yıl University Non-Interventional Clinical Research Ethics Committee (Decision No. 2026/07-08; 14 August 2026). The study involved retrospective review of existing clinical, laboratory, and radiological records, with no additional research-related diagnostic or therapeutic intervention.
2.3. Clinical and Laboratory Data
Demographic characteristics, body mass index (BMI), smoking status, comorbidities, laboratory findings, CT characteristics, treatment strategy, percutaneous interventions, operative details, length of hospital stay, and subsequent clinical outcomes were retrieved from the institutional records. Comorbidity burden was summarized using the age-adjusted Charlson Comorbidity Index (ACCI), which incorporates age-related points in addition to weighted comorbid conditions.
ASA physical status class was extracted from the initial admission assessment documented by the admitting general surgeon as part of routine clinical practice. The classification recorded at the beginning of the index hospitalization was used without retrospective reassignment. ASA data were available for all 164 patients, including those managed nonoperatively, and were categorized as classes I–II versus III–IV for the clinical reference models.
Laboratory measurements obtained at the index admission included white blood cell count (WBC), neutrophil, lymphocyte, monocyte, and platelet counts, C-reactive protein (CRP), serum albumin, hemoglobin, and creatinine. The neutrophil-to-lymphocyte ratio, platelet-to-lymphocyte ratio, monocyte-to-lymphocyte ratio, and prognostic nutritional index were derived from the admission laboratory values. The prognostic nutritional index was calculated as 10 × serum albumin (g/dL) + 0.005 × total lymphocyte count (/mm3).
2.4. CT Acquisition and Image Selection
Contrast-enhanced abdominal CT examinations obtained during the index admission were retrieved from the institutional Picture Archiving and Communication System (PACS; enliPACS, version 2.5). CT examinations were performed using a 16-slice scanner (Philips MX16, Philips Healthcare, Best, The Netherlands) or a 256-slice scanner (Philips Brilliance iCT, Philips Healthcare, Best, The Netherlands). Examinations performed before 2017 used the 16-slice scanner. From 2017 onward, the 256-slice scanner was used for the majority of examinations, whereas some examinations were performed using the 16-slice scanner.
Portal venous-phase images were acquired approximately 70 s after intravenous contrast administration, with a tube voltage of 120 kVp and a reconstructed slice thickness of 3 mm. The Standard (B) reconstruction kernel was used for images acquired with the Philips Brilliance iCT and the SB kernel was used for images acquired with the Philips MX16. Images were reviewed and quantitative body composition measurements were performed using a syngo.via VB80A workstation (version VB80A, Siemens Healthineers, Erlangen, Germany), with the ROI HU Threshold tool within syngo. CT Extended Functionality.
CT examinations were considered suitable when the affected colonic segment could be adequately evaluated for diverticulitis severity and the complete L3 skeletal musculature was included within the field of view with sufficient image quality for quantitative analysis. Examinations with severe motion or reconstruction artifacts, inadequate anatomical coverage, or image degradation preventing reliable muscle segmentation or attenuation measurement were excluded. Body composition measurements and assessment of diverticulitis severity were based on the index CT examination obtained for the acute episode.
2.5. Retrospective Radiological Review and Measurement Reproducibility
Two radiologists working at the same institution, each with more than 10 years of experience in abdominal imaging, participated in the imaging assessments. The primary radiologist retrospectively reviewed all 164 eligible index CT examinations for WSES severity classification and quantitative body composition assessment. WSES classification was performed without reference to the body composition phenotype. During body composition assessment, both radiologists were blinded to WSES stage, subsequent treatment requirements, clinical course and outcomes. Quantitative muscle measurements were performed anew using the predefined protocol rather than extracted from the original radiology reports. For intraobserver reproducibility, 30 patients were randomly selected from the cohort. The primary radiologist repeated the SMI and mean muscle attenuation measurements after a four-week interval without access to the initial results. The L3 axial image was independently reselected, and segmentation and attenuation measurements were performed de novo.
For interobserver reproducibility, the second radiologist independently assessed the same 30 randomly selected index CT examinations under the same blinding conditions. The second radiologist had no access to the primary radiologist’s measurements, selected slices or segmentation masks and independently selected the L3 slice and performed segmentation and attenuation measurements de novo. Interobserver agreement was assessed by comparing the second radiologist’s measurements with the primary radiologist’s initial measurements. The primary radiologist’s initial measurements were retained for the main cohort analyses. Reproducibility and classification agreement results are presented in Supplementary Table S1.
2.6. CT-Derived Body Composition Assessment
Body composition was assessed on a single axial image independently selected at the mid-vertebral body level of L3 from the portal venous-phase series of the index CT examination. Skeletal muscle segmentation included the bilateral psoas, erector spinae/paraspinal, quadratus lumborum, transversus abdominis, internal and external oblique, and rectus abdominis muscles. The muscles were manually contoured, and pixel selection was performed using an attenuation range of −29 to +150 Hounsfield units (HU), with manual correction when required.
Total skeletal muscle area (SMA) and the mean attenuation of all selected pixels were recorded from the final muscle mask. Skeletal muscle index (SMI) was calculated as SMA divided by height in metres squared and expressed as cm2/m2. Mean muscle attenuation was expressed in HU. The same measurement protocol was used for the initial, repeat and second-reader assessments. The measurement procedure is illustrated in Figure 2.
Figure 2.
CT-based assessment of skeletal muscle quantity and quality at the L3 vertebral level. Legend: (A) Axial CT image at the L3 vertebral level. (B) Skeletal muscle segmentation using an attenuation range of −29 to +150 HU, encompassing the bilateral psoas, paraspinal, quadratus lumborum, rectus abdominis, transversus abdominis, and internal and external oblique muscles. (C) Quantitative parameters derived from the segmented L3 slice, including total skeletal muscle area, skeletal muscle index, and mean skeletal muscle attenuation. SMI was calculated as total skeletal muscle area normalized to height squared (cm2/m2), and mean skeletal muscle attenuation was expressed in HU. Abbreviations: CT, computed tomography; HU, Hounsfield unit; L3, third lumbar vertebral level; SMA, skeletal muscle area; SMI, skeletal muscle index.
2.7. CT-Defined Sarcopenia and Myosteatosis
CT-defined low skeletal muscle mass was classified using the sex- and BMI-specific L3 SMI thresholds described by Martin et al. [15]. An SMI < 43 cm2/m2 was considered low in men with BMI < 25 kg/m2, <53 cm2/m2 in men with BMI ≥ 25 kg/m2, and <41 cm2/m2 in women. Patients meeting these criteria were classified as having CT-defined sarcopenia.
Muscle strength and physical performance data were unavailable. Accordingly, “CT-defined sarcopenia” is used here as an operational label for low skeletal muscle mass on CT and does not indicate that clinical sarcopenia was diagnosed. This distinction is consistent with the GLIS conceptual definition, which includes muscle mass, muscle strength and muscle-specific strength [16].
CT-defined myosteatosis was classified using the BMI-specific mean L3 skeletal muscle attenuation thresholds described by Martin et al. [15]: <41 HU in patients with BMI < 25 kg/m2 and <33 HU in those with BMI ≥ 25 kg/m2.
According to these predefined criteria, patients were assigned to four mutually exclusive body composition phenotypes: neither CT-defined abnormality, CT-defined sarcopenia only, CT-defined myosteatosis only, and both CT-defined abnormalities. Continuous SMI and mean skeletal muscle attenuation values were retained for analyses in which muscle quantity and quality were evaluated as continuous measures.
2.8. CT Assessment of Diverticulitis Severity
The index CT examination was evaluated for the location and extent of diverticular inflammation and for findings indicating local or distant complications. Disease severity was classified according to the World Society of Emergency Surgery (WSES) CT classification [17].
For the primary analysis, WSES stage 0 was classified as uncomplicated acute diverticulitis, whereas WSES stage ≥ 1A was classified as complicated acute diverticulitis. WSES severity was additionally recorded as stages 0, 1A, 1B, 2A, and 2B–4 to characterize the distribution of radiological severity within the cohort.
The classification of complicated diverticulitis was based exclusively on findings present on the index CT examination. Subsequent need for percutaneous drainage, emergency surgery, or other treatment escalation was not used to define the primary endpoint.
2.9. Treatment and In-Hospital Outcomes
Treatment was determined according to CT severity, clinical condition, hemodynamic status, evidence of systemic infection or sepsis, characteristics and accessibility of collections for percutaneous drainage, and response to initial treatment.
Initial nonoperative management, percutaneous abscess drainage, and emergency surgery were recorded separately. For patients undergoing surgery, the indication, timing, operative approach, procedure performed, stoma formation when applicable, and postoperative course were obtained from operative and clinical records. Operative duration, postoperative complications, reinterventions, and length of hospital stay were also recorded when applicable.
Operations performed after resolution of the index episode were classified separately as subsequent elective procedures and were not combined with emergency surgery during the index admission.
2.10. Retrospective Ascertainment of Follow-Up Outcomes
Post-discharge outcomes were ascertained retrospectively from routinely collected clinical records available through 30 May 2026. Sources included outpatient visits, emergency department presentations, subsequent admissions, imaging examinations, colonoscopic evaluations and surgical records.
The 12-month analysis was performed among patients eligible for the respective outcome and for whom 12-month outcome status could be adequately established. Patients without sufficient information to determine the 12-month outcome were not assumed to be event-free and were excluded from that specific follow-up analysis. Follow-up completeness was additionally examined across the four predefined body composition phenotypes to assess the possibility of differential outcome ascertainment.
Recurrent diverticulitis was not defined solely by recurrent abdominal symptoms or an undocumented clinical diagnosis. A recurrent attack was recorded when a new clinically suspected episode was supported by a new CT examination demonstrating acute diverticulitis.
For the patient-level 12-month endpoint, a patient with one or more CT-confirmed attacks during the first 12 months was counted once as having experienced recurrent diverticulitis. Individual episodes were retained separately when the number and timing of attacks were evaluated. CT-confirmed attacks occurring beyond 12 months were recorded separately and were not incorporated into the 12-month endpoint.
Post-episode colonoscopy was recorded when available and was considered part of subsequent evaluation rather than treatment of the acute index episode. Histopathological findings and subsequent diagnoses of colorectal neoplasia were recorded when tissue diagnosis was available.
2.11. Study Outcomes
The primary outcome was complicated acute left-sided colonic diverticulitis on the index CT examination, defined as WSES stage ≥ 1A.
Secondary outcomes included WSES severity distribution, percutaneous abscess drainage, emergency surgery, length of hospital stay, subsequent elective surgery, and CT-confirmed recurrent diverticulitis during follow-up. These outcomes were evaluated according to the four predefined body composition phenotypes.
An additional objective was to determine whether CT-derived body composition provided discriminatory information beyond inflammatory markers and clinical characteristics. Two reference models were evaluated: an inflammatory reference model containing WBC and CRP, and a clinical reference model containing age, sex, ASA class, ACCI, WBC and CRP. Each reference model was compared with models additionally incorporating categorical muscle phenotype or, separately, continuous SMI and muscle attenuation.
2.12. Statistical Analysis
Continuous variables were assessed for distributional characteristics and are presented as mean ± standard deviation or median with interquartile range, as appropriate. Categorical variables are presented as number and percentage. Normality of continuous variables was assessed using the Shapiro–Wilk test.
Comparisons across the four body composition phenotypes were performed using one-way analysis of variance or the Kruskal–Wallis test for continuous variables, as appropriate, and Pearson’s chi-square test or Fisher’s exact test for categorical variables.
An additional exploratory trend analysis was performed during revision using the number of CT-defined muscle abnormalities, coded as 0, 1 or 2. Patients with isolated CT-defined sarcopenia or isolated myosteatosis were combined in the one-abnormality category. Trends in the proportions with WSES stage ≥ 1A and, separately, WSES stage ≥ 1B were assessed using two-sided asymptotic Cochran–Armitage tests with equally spaced scores of 0, 1 and 2, without continuity correction. These were unadjusted analyses. The original four-category phenotype variable was retained for all primary group comparisons and multivariable models; no severity ordering was imposed between isolated CT-defined sarcopenia and isolated myosteatosis.
Associations with complicated diverticulitis were evaluated using logistic regression. Effect estimates are reported as odds ratios (ORs) with 95% confidence intervals (CIs). Covariates were selected on clinical grounds rather than solely on univariable statistical significance. The number of fitted parameters and the precision of the resulting estimates were considered when interpreting the models. Linear collinearity was examined using design-matrix variance inflation factors (VIFs), calculated as 1/(1−R2) from auxiliary ordinary least-squares regressions of each predictor on the remaining predictors, including an intercept. The four-category phenotype was represented by three indicator variables. Tolerance was defined as 1/VIF. These diagnostics were interpreted alongside the sensitivity analyses because low VIFs do not exclude conceptual dependence between BMI and BMI-stratified phenotype definitions. WBC and CRP were entered as continuous variables; effect estimates were expressed per 1 × 10⁹/L increase in WBC and per 10 mg/L increase in CRP. BMI was retained as a continuous covariate in the main association models because BMI-stratified phenotype thresholds do not necessarily account fully for associations between overall adiposity and disease severity. However, because BMI also contributes to phenotype classification, additional sensitivity analyses repeated Models 1 and 2 after removing BMI as a separate covariate. Phenotype assignments were unchanged, and all other covariates and the analysis population were retained. These analyses were conducted for both the primary WSES stage ≥ 1A outcome and the WSES stage ≥ 1B sensitivity outcome.
Additional exploratory analyses examined the sensitivity of the phenotype estimates to age adjustment. First, the unadjusted association between age and each outcome was evaluated using logistic regression, with ORs expressed per 10-year increase. Age was then represented by a restricted cubic spline with three knots at the 10th, 50th and 90th percentiles of the observed age distribution, corresponding to 48.3, 64.0 and 79.7 years. This specification used two degrees of freedom for age. Models 1 and 2 were repeated with the spline terms replacing the linear age term, while retaining BMI, ACCI and the other covariates.
Overall age associations were evaluated using likelihood ratio tests comparing the spline model with the corresponding model excluding age (two degrees of freedom). Nonlinearity was evaluated by comparing spline and linear-age models (one degree of freedom). Because ACCI already incorporates age, an additional sensitivity analysis omitted ACCI from the spline-adjusted Model 2 to examine the stability of the phenotype estimates when chronological age and an age-containing comorbidity score were not entered simultaneously. All other covariates, including BMI, were retained. All analyses included the same 164 patients and were performed for both outcome thresholds. The association between age and ACCI was summarized using Pearson’s correlation coefficient.
Additional exploratory analyses evaluated multiplicative interaction between CT-defined sarcopenia and myosteatosis. The four-category phenotype variable was replaced by binary indicators for CT-defined sarcopenia and myosteatosis and their product term. The interaction models retained the covariates of the original linear-age Models 1 and 2 and were fitted separately for both outcome thresholds. The interaction OR was obtained by exponentiating the product-term coefficient, with a Wald 95% CI. Interaction was tested using a one-degree-of-freedom likelihood ratio test comparing models with and without the product term. The four-category phenotype and the binary/product-term representation were not entered simultaneously. Joint phenotype associations and multiplicative interaction were interpreted as distinct quantities [18].
An additional exploratory contrast compared patients with both abnormalities against those with myosteatosis only. Contrast estimates and Wald CIs were calculated using the fitted coefficient covariance matrix. These pairwise p values were not adjusted for multiple comparisons.
To examine sensitivity to small-sample bias and sparse-data instability, the original association Models 1 and 2 were repeated using Firth’s bias-reducing penalized logistic regression for both outcome thresholds. The analysis population, phenotype coding and covariate specifications were unchanged. Model 1 included phenotype, linear age, sex, BMI and ACCI; Model 2 additionally included WBC and CRP. Firth estimation maximized the binomial log likelihood with the Jeffreys information penalty. Confidence intervals were obtained by profiling the penalized likelihood, and p values were calculated using penalized likelihood ratio tests [19].
Numerical convergence and design-matrix rank were checked, and complete or quasi-complete separation was assessed using linear programming. Influence was examined using leverage and Cook’s distance from the ordinary logistic models and exact leave-one-patient-out refitting of both ordinary and Firth models. Cook’s distance greater than 4/n was used as an exploratory screening threshold rather than an exclusion criterion. No patient was excluded on the basis of these diagnostics.
Receiver operating characteristic (ROC) analysis evaluated discrimination using two families of reference models. The inflammatory reference model contained WBC and CRP. The clinical reference model contained chronological age, sex, ASA class III–IV versus I–II, ACCI, WBC and CRP. Within each family, the reference model was compared with a model adding three indicators for the four-category muscle phenotype and with a separate model adding continuous SMI and mean muscle attenuation. Age, ACCI, WBC, CRP, SMI and attenuation were entered as continuous variables. The clinical models used linear age and did not include BMI. All models included an intercept and were fitted to the same 164 patients for both outcome thresholds.
The same bootstrap procedure was applied to both the primary WSES stage ≥ 1A outcome and the WSES stage ≥ 1B sensitivity outcome. Percentile 95% CIs for apparent AUCs and paired differences in AUC were estimated using 2000 outcome-stratified bootstrap resamples of the original fitted prediction–outcome pairs. Identical sampled patient indices were used across the models within each comparison family and resample; model coefficients were not refitted for this ROC interval calculation. Internal validation was performed separately using 1000 ordinary patient bootstrap resamples, with each model completely refitted in every resample. Optimism was calculated as the AUC in the bootstrap sample minus the AUC obtained by applying that bootstrap-fitted model to the original cohort. Mean optimism was subtracted from the original apparent AUC, following the general bootstrap optimism-correction approach [20]. Optimism-corrected differences in AUC were calculated from the corrected AUCs. All AUC differences were calculated before rounding. Random seeds were set to 20261028 for ROC confidence intervals and 20261029 for internal validation.
Calibration was evaluated for all inflammatory and clinical ROC models at both outcome thresholds. Calibration-in-the-large (CITL) was estimated as the intercept of a logistic model using the original model linear predictor as an offset with its coefficient fixed at 1. Calibration slope was estimated by logistic recalibration with a freely estimated intercept and slope. Overall probability error was summarized using the Brier score, calculated as the mean squared difference between predicted probabilities and observed binary outcomes.
Optimism-corrected CITL, calibration slopes and Brier scores were estimated using the same 1000 ordinary patient bootstrap resamples and complete model refitting used for AUC validation. For each measure, mean bootstrap training-minus-original-sample test performance was subtracted from apparent performance. Calibration curves were estimated using logistic restricted cubic spline smoothers of the predicted log odds, with three knots fixed at the original predictions’ 10th, 50th and 90th percentiles. Curves were corrected for bootstrap optimism on the probability scale and displayed over each model’s 5th–95th percentile prediction range. Original-sample decile estimates were included descriptively. These analyses evaluated the existing unpenalized ROC models and did not recalibrate their reported coefficients.
Decision curve analysis was not performed because no distinct model-guided clinical action or defensible probability threshold was defined for this concurrent CT-based outcome. WSES severity was already available from the same index examination. Accordingly, the analyses were restricted to associations, discrimination, calibration and overall probability error; clinical net benefit was not evaluated.
The WSES stage ≥ 1B sensitivity analysis repeated both association models and both ROC model families using the same covariate specifications and validation procedures described above. All 164 patients were retained: 75 patients with WSES stage ≥ 1B were coded as outcome-positive, and 89 patients with stage 0 or 1A were coded as outcome-negative for this sensitivity endpoint. This coding did not alter the primary classification of stage 1A as complicated diverticulitis. Ordinary logistic regression estimates were obtained by unpenalized maximum likelihood, with Wald 95% CIs and two-sided Wald tests. This sensitivity analysis was added during revision and was not prespecified.
Additional sensitivity analyses examined the influence of CT scanner on the phenotype associations. Scanner information was available for all 164 patients. Models 1 and 2 were repeated for both outcome thresholds after adding scanner as a binary categorical covariate, with the 256-slice scanner as the reference. Exploratory analyses additionally repeated the original models among the 104 patients examined using the 256-slice scanner. Phenotype definitions and all other covariates were unchanged. Estimates were obtained using unpenalized maximum likelihood with Wald 95% confidence intervals.
Intraobserver reproducibility of SMI and mean muscle attenuation was assessed using a two-way mixed-effects, absolute-agreement, single-measurement intraclass correlation coefficient (ICC). Interobserver reproducibility was assessed using a two-way random-effects, absolute-agreement, single-measurement ICC [ICC(2,1)], with model specification reported according to published guidance [21]. ICCs were reported with 95% confidence intervals calculated using an F-distribution-based approach. Bland–Altman summary statistics were calculated for both measurements, with paired differences defined as the repeat or second-reader measurement minus the primary radiologist’s initial measurement. Mean differences and 95% limits of agreement, calculated as the mean difference ±1.96 standard deviations of the paired differences, were reported. Agreement in CT-defined sarcopenia status, myosteatosis status and the four-category muscle phenotype was assessed separately using percentage agreement and unweighted Cohen’s kappa. Four-category classification agreement was additionally summarized using cross-tabulation. Phenotype assignment used the original measurement precision and the predefined sex- and BMI-specific thresholds.
Descriptive analyses and group comparisons were performed using IBM SPSS Statistics for Windows, version 29.0 (IBM Corp., Armonk, NY, USA). During revision, logistic regression models were reproduced, and the harmonized bootstrap analyses, calibration assessment, Cochran–Armitage trend tests, age and scanner sensitivity analyses, multiplicative interaction analyses, exploratory phenotype contrasts, Firth penalized logistic regression, separation and influence diagnostics, and updated reliability analyses were implemented in Python, version 3.12.14, using NumPy, version 2.3.5, SciPy, version 1.17.0, and scikit-learn, version 1.8.0. The Firth implementation was checked using numerical derivatives, an independent Fisher-scoring algorithm and a two-group example with a closed-form solution. All statistical tests were two-sided, and p < 0.05 was considered statistically significant.
3. Results
3.1. Patient Characteristics
A total of 219 patients with CT-confirmed acute colonic diverticulitis were screened for eligibility. After application of the predefined exclusion criteria, including exclusion of patients with diverticulitis outside the left colon, 164 patients with ALCD constituted the final study cohort (Figure 1). According to the predefined CT-derived muscle composition criteria, 49 patients had neither abnormality, 25 had CT-defined sarcopenia only, 39 had myosteatosis only, and 51 had both CT-defined abnormalities (Table 1).
Table 1.
Baseline characteristics by CT-defined muscle composition phenotype.
Admission inflammatory markers did not differ significantly across the four muscle composition phenotypes. Median WBC was 11.6 × 10⁹/L (IQR, 10.0–13.8) in patients with neither abnormality and 12.1 × 10⁹/L (IQR, 9.8–13.1) in those with both abnormalities (p = 0.928). Corresponding median CRP concentrations were 77.9 mg/L (IQR, 56.5–116.7) and 85.3 mg/L (IQR, 60.3–120.6), respectively (p = 0.415). Serum albumin differed significantly across the four groups (p < 0.001), with the lowest median concentration observed in patients with both abnormalities. Median L3 SMI and muscle attenuation reflected the predefined phenotype classification and were therefore not subjected to between-group significance testing.
3.2. CT Severity and Initial Management
Complicated diverticulitis, defined as WSES stage ≥ 1A on the index CT, was present in 93 of 164 patients (56.7%). Its prevalence increased across the muscle composition phenotypes, from 34.7% (17/49) in patients with neither abnormality to 48.0% (12/25) with CT-defined sarcopenia only, 61.5% (24/39) with myosteatosis only, and 78.4% (40/51) with both abnormalities (p < 0.001) (Table 2 and Figure 3).
Table 2.
Index CT severity and initial management by CT-defined muscle composition phenotype.
Figure 3.
Complicated acute left-sided colonic diverticulitis according to CT-defined muscle composition phenotype. Legend: Proportions of patients with complicated acute left-sided colonic diverticulitis across the four CT-defined muscle composition phenotypes. Complicated disease was defined as WSES CT stage ≥ 1A on the index CT examination. Open circles indicate observed proportions, and horizontal error bars indicate 95% confidence intervals. The numbers on the right indicate events/total patients (%). The overall difference across the four phenotypes was statistically significant (p < 0.001). This p value represents the overall four-group comparison; the separate trend analysis according to the number of muscle abnormalities is reported in Supplementary Table S2. Abbreviations: CT, computed tomography; WSES, World Society of Emergency Surgery.
When patients were grouped by the number of CT-defined muscle abnormalities, the proportions with WSES stage ≥ 1A were 34.7% (17/49), 56.3% (36/64) and 78.4% (40/51) for zero, one and two abnormalities, respectively. The additional unadjusted Cochran–Armitage analysis showed a positive trend across these ordered categories (Z = 4.414; two-sided p for trend <0.001) (Supplementary Table S2).
The overall distribution of WSES stages also differed significantly among the four phenotypes (p < 0.001). WSES stage 0 accounted for 65.3% of patients with neither abnormality but only 21.6% of those with both abnormalities. In the overall cohort, 71 patients (43.3%) had WSES stage 0, 18 (11.0%) stage 1A, 33 (20.1%) stage 1B, 20 (12.2%) stage 2A, and 22 (13.4%) stage 2B–4.
Percutaneous abscess drainage was required in 12 patients (7.3%), with no statistically significant difference among the four phenotypes (p = 0.201). Emergency surgery was performed in 19 patients (11.6%); the proportion ranged from 4.1% in patients with neither abnormality to 19.6% in those with both abnormalities, although the overall between-group difference did not reach statistical significance (p = 0.096). Median length of hospital stay was 6 days (IQR, 4–8) overall and differed significantly among the phenotypes (p = 0.033), ranging from 5 days (IQR, 4–7) in patients with neither abnormality to 7 days (IQR, 5–10) in those with both abnormalities.
3.3. Multivariable Associations with Complicated Diverticulitis
Multivariable logistic regression analyses are presented in Table 3.
Table 3.
Multivariable associations of CT-defined muscle composition phenotypes with complicated acute left-sided colonic diverticulitis (WSES stage ≥ 1A).
In Model 1, adjusted for chronological age, sex, BMI and ACCI, myosteatosis alone was associated with higher odds of complicated diverticulitis compared with neither CT-defined abnormality (adjusted OR [aOR], 2.73; 95% CI, 1.11–6.70; p = 0.029). The largest point estimate was observed in patients with both CT-defined abnormalities (aOR, 6.32; 95% CI, 2.36–16.95; p < 0.001). CT-defined sarcopenia alone was not significantly associated with complicated disease (aOR, 1.54; 95% CI, 0.55–4.32; p = 0.415). The individual coefficients for age, sex, BMI and ACCI were not statistically significant in this model.
After WBC and CRP were added in Model 2, myosteatosis alone and the combined phenotype remained independently associated with complicated diverticulitis. Compared with patients with neither CT-defined abnormality, the aOR was 3.19 (95% CI, 0.91–11.12; p = 0.069) for CT-defined sarcopenia only, 4.27 (95% CI, 1.34–13.62; p = 0.014) for myosteatosis only, and 9.27 (95% CI, 2.85–30.17; p < 0.001) for both abnormalities. WBC (aOR per 1 × 10⁹/L increase, 1.31; 95% CI, 1.10–1.57; p = 0.003) and CRP (aOR per 10 mg/L increase, 1.28; 95% CI, 1.14–1.44; p < 0.001) were also independently associated with complicated diverticulitis.
3.4. Incremental Discrimination of CT-Defined Muscle Composition
Incremental discrimination was evaluated against both inflammatory and clinical reference models (Table 4 and Figure 4).
Table 4.
Incremental discrimination of CT-defined muscle composition beyond inflammatory and clinical reference models for WSES stage ≥ 1A.
Figure 4.
Receiver operating characteristic curves using inflammatory and clinical reference models for WSES stage ≥ 1A. Legend: Panel (A) compares the WBC + CRP reference model with models adding CT-defined muscle phenotypes or continuous SMI and muscle attenuation. Panel (B) compares a clinical reference model containing age, sex, ASA class III–IV versus I–II, ACCI, WBC and CRP with the corresponding extended models. All curves represent apparent performance in the same 164 patients. Optimism-corrected AUCs are reported separately in Table 4. Solid, dashed and dash-dotted lines indicate the reference model, the model adding muscle phenotypes, and the model adding continuous SMI and attenuation, respectively. The dotted diagonal line indicates discrimination expected by chance. Abbreviations: ACCI, age-adjusted Charlson Comorbidity Index; ASA, American Society of Anesthesiologists; AUC, area under the receiver operating characteristic curve; CRP, C-reactive protein; SMI, skeletal muscle index; WBC, white blood cell count; WSES, World Society of Emergency Surgery.
The clinical reference model containing age, sex, ASA class, ACCI, WBC and CRP had an apparent AUC of 0.837 (95% CI, 0.772–0.896). Adding muscle phenotypes increased the apparent AUC to 0.877 (95% CI, 0.820–0.927), with an apparent ΔAUC of 0.040 (95% CI, 0.004–0.078). Optimism-corrected AUCs were 0.812 and 0.845, respectively, yielding a corrected ΔAUC of 0.033.
Adding continuous SMI and muscle attenuation produced an apparent AUC of 0.867 (95% CI, 0.809–0.919), with an apparent ΔAUC of 0.030 (95% CI, −0.006 to 0.066). Its optimism-corrected AUC was 0.838, with a corrected ΔAUC of 0.026. Thus, the interval for the categorical phenotype increment excluded zero, whereas that for the continuous-measure increment did not (Table 4, panel B).
The baseline WBC + CRP model had an apparent AUC of 0.804 (95% CI, 0.732–0.871) and an optimism-corrected AUC of 0.799. Adding the four-category CT-defined muscle composition phenotype increased the apparent AUC to 0.867 (95% CI, 0.807–0.920), corresponding to an apparent ΔAUC of 0.062 (95% CI, 0.015–0.113). The optimism-corrected AUC was 0.851, yielding a corrected ΔAUC of 0.052. Adding continuous L3 SMI and muscle attenuation produced an apparent AUC of 0.861 (95% CI, 0.801–0.916), with an apparent ΔAUC of 0.057 (95% CI, 0.009–0.108). Its optimism-corrected AUC was 0.849, with a corrected ΔAUC of 0.049. Both representations therefore provided additional discriminatory information beyond WBC and CRP in this cohort.
3.5. Sensitivity Analysis Using WSES Stage ≥ 1B
Using WSES stage ≥ 1B as the outcome, 75 of 164 patients (45.7%) were outcome-positive. The corresponding proportions were 16.3% (8/49) in patients with neither CT-defined abnormality, 36.0% (9/25) with CT-defined sarcopenia only, 53.8% (21/39) with CT-defined myosteatosis only, and 72.5% (37/51) with both abnormalities (overall Pearson χ2 = 33.839; df = 3; p < 0.001).
Across categories of zero, one and two muscle abnormalities, the corresponding proportions were 16.3% (8/49), 46.9% (30/64) and 72.5% (37/51), respectively, with a positive unadjusted trend (Cochran–Armitage Z = 5.638; two-sided p for trend <0.001) (Supplementary Table S2).
In Model 1, myosteatosis only (aOR, 5.39; 95% CI, 1.97–14.74; p = 0.001) and both abnormalities (aOR, 12.01; 95% CI, 4.14–34.81; p < 0.001) were associated with WSES stage ≥ 1B. These associations persisted in Model 2 after additional adjustment for WBC and CRP: the aOR was 6.99 (95% CI, 2.22–22.00; p < 0.001) for myosteatosis only and 14.76 (95% CI, 4.58–47.57; p < 0.001) for both abnormalities. CT-defined sarcopenia only did not meet the p < 0.05 threshold in Model 2 (aOR, 3.75; 95% CI, 0.998–14.11; p = 0.0503) (Supplementary Table S4).
The apparent AUC was 0.747 (95% CI, 0.671–0.818) for WBC and CRP, 0.860 (95% CI, 0.797–0.912) after adding muscle phenotypes, and 0.847 (95% CI, 0.781–0.904) after adding continuous SMI and muscle attenuation. The corresponding apparent ΔAUCs were 0.114 (95% CI, 0.050–0.184) and 0.101 (95% CI, 0.038–0.167). Optimism-corrected AUCs were 0.740, 0.845 and 0.834, respectively, yielding corrected ΔAUCs of 0.105 and 0.095 (Supplementary Table S5, panel A).
For the clinical reference comparison, the apparent AUC was 0.786 (95% CI, 0.717–0.852). Adding muscle phenotypes increased the AUC to 0.862 (95% CI, 0.800–0.914), with an apparent ΔAUC of 0.076 (95% CI, 0.025–0.131). Adding continuous SMI and muscle attenuation yielded an AUC of 0.853 (95% CI, 0.787–0.910), with an apparent ΔAUC of 0.068 (95% CI, 0.020–0.119). Optimism-corrected AUCs were 0.755, 0.830 and 0.825, respectively, with corrected increments of 0.075 and 0.070 (Supplementary Table S5, panel B).
3.6. Sensitivity Analyses Excluding BMI
Removing BMI as a separate covariate did not materially alter the estimates for myosteatosis only or both muscle abnormalities. For the primary WSES stage ≥ 1A outcome, Model 2 without BMI yielded an aOR of 4.20 (95% CI, 1.32–13.36; p = 0.015) for myosteatosis only and 9.33 (95% CI, 2.92–29.81; p < 0.001) for both abnormalities, compared with 4.27 and 9.27, respectively, in the BMI-adjusted model. The estimate for CT-defined sarcopenia only decreased from 3.19 to 2.65 (95% CI, 0.80–8.81; p = 0.112).
For the WSES stage ≥ 1B outcome, Model 2 without BMI yielded an aOR of 6.92 (95% CI, 2.21–21.72; p < 0.001) for myosteatosis only and 14.93 (95% CI, 4.64–48.01; p < 0.001) for both abnormalities. CT-defined sarcopenia only did not meet the p < 0.05 threshold (aOR, 3.54; 95% CI, 0.98–12.81; p = 0.0543). Results from both association models are presented in Supplementary Table S6.
Design-matrix VIFs ranged from 1.021 to 3.938 in Model 1 and from 1.022 to 3.963 in Model 2. The VIFs for BMI were 1.072 and 1.123, respectively; those for the phenotype indicators ranged from 1.394 to 1.775 across the two models (Supplementary Table S6).
3.7. Sensitivity Analyses of Age Adjustment
Age was associated with both outcomes in unadjusted analyses. The OR per 10-year increase was 1.39 (95% CI, 1.06–1.83; p = 0.017) for WSES stage ≥ 1A and 1.57 (95% CI, 1.19–2.08; p = 0.002) for WSES stage ≥ 1B.
Replacing linear age with a three-knot restricted cubic spline produced similar phenotype estimates. In Model 2 for WSES stage ≥ 1A, the aORs were 3.19 (95% CI, 0.92–11.14) for CT-defined sarcopenia only, 4.27 (95% CI, 1.34–13.62) for myosteatosis only and 9.23 (95% CI, 2.83–30.15) for both abnormalities. The overall age association was not statistically significant in this model (likelihood ratio p = 0.945), and there was no evidence of nonlinearity (p = 0.934).
For WSES stage ≥ 1B, the corresponding Model 2 aORs were 3.75 (95% CI, 0.998–14.10), 6.99 (95% CI, 2.22–22.01) and 14.79 (95% CI, 4.56–47.90), respectively. The overall age and nonlinearity tests yielded p = 0.816 and p = 0.973.
Age and ACCI were strongly correlated (Pearson r = 0.835), consistent with the inclusion of age in the score. When ACCI was omitted from the spline-adjusted Model 2, the estimates for myosteatosis and both abnormalities remained similar: 4.32 (95% CI, 1.36–13.77) and 8.92 (95% CI, 2.78–28.56), respectively, for WSES stage ≥ 1A, and 7.03 (95% CI, 2.23–22.09) and 14.49 (95% CI, 4.56–46.01) for WSES stage ≥ 1B (Supplementary Table S3).
3.8. Multiplicative Interaction and Exploratory Phenotype Contrasts
There was no statistically significant evidence of multiplicative interaction between CT-defined sarcopenia and myosteatosis. For WSES stage ≥ 1A, the interaction OR was 1.51 (95% CI, 0.38–6.06; likelihood ratio p = 0.562) in Model 1 and 0.68 (95% CI, 0.13–3.64; p = 0.653) in Model 2. For WSES stage ≥ 1B, the corresponding interaction ORs were 0.90 (95% CI, 0.21–3.88; p = 0.889) and 0.56 (95% CI, 0.11–2.98; p = 0.499).
In exploratory contrasts, the combined phenotype did not differ significantly from myosteatosis only. In Model 2, the aOR comparing both abnormalities with myosteatosis only was 2.17 (95% CI, 0.68–6.97; p = 0.192) for WSES stage ≥ 1A and 2.11 (95% CI, 0.74–6.06; p = 0.164) for WSES stage ≥ 1B (Supplementary Table S7).
3.9. Firth Penalized Regression and Influence Analyses
Firth penalization attenuated the phenotype estimates but preserved the associations for myosteatosis and both abnormalities. For WSES stage ≥ 1A, Model 2 yielded a Firth aOR of 3.80 (profile penalized likelihood 95% CI, 1.29–12.04; p = 0.015) for myosteatosis only and 7.80 (95% CI, 2.63–25.30; p < 0.001) for both abnormalities. CT-defined sarcopenia only was not statistically significant (aOR, 2.88; 95% CI, 0.89–9.77; p = 0.079).
For WSES stage ≥ 1B, the corresponding Model 2 estimates were 5.96 (95% CI, 2.08–18.73; p < 0.001) for myosteatosis only, 11.99 (95% CI, 4.13–38.72; p < 0.001) for both abnormalities and 3.35 (95% CI, 0.95–12.17; p = 0.059) for CT-defined sarcopenia only.
All four original association models and their Firth counterparts converged, and no complete or quasi-complete separation was detected. In Model 2, 12 observations exceeded the exploratory Cook’s distance threshold of 4/n for each outcome. No observations were excluded. Across all 164 leave-one-patient-out ordinary logistic refits, the associations for myosteatosis and both abnormalities remained positive and statistically significant at both thresholds. The statistical significance of CT-defined sarcopenia only varied across deletions.
For WSES stage ≥ 1A, the Model 2 point estimates across leave-one-patient-out refits ranged from 3.59 to 6.26 for myosteatosis and from 8.32 to 12.16 for both abnormalities under ordinary estimation, compared with 3.23–5.36 and 7.05–9.90 under Firth estimation. Detailed penalized estimates and case-deletion results are presented in Supplementary Table S8.
3.10. Sensitivity Analyses Accounting for CT Scanner
CT examinations were performed using the 256-slice scanner in 104 patients and the 16-slice scanner in 60 patients. Additional scanner adjustment yielded similar phenotype estimates. In Model 2, the scanner-adjusted aORs for myosteatosis only and both abnormalities were 4.50 (95% CI, 1.39–14.53) and 9.57 (95% CI, 2.92–31.36), respectively, for WSES stage ≥ 1A, and 7.91 (95% CI, 2.45–25.57) and 16.00 (95% CI, 4.83–52.98) for WSES stage ≥ 1B.
In exploratory analyses restricted to the 256-slice scanner, the corresponding Model 2 estimates were 3.43 (95% CI, 0.92–12.83) and 6.74 (95% CI, 1.80–25.23) for WSES stage ≥ 1A, and 10.10 (95% CI, 2.11–48.38) and 20.25 (95% CI, 4.24–96.60) for WSES stage ≥ 1B. Estimates were less precise in this restricted sample, and the confidence interval for isolated myosteatosis included 1 at the primary threshold. Results from both association models, including scanner-adjusted and single-scanner analyses at both outcome thresholds, are presented in Supplementary Table S9.
3.11. Calibration and Overall Probability Error
Apparent calibration intercepts were approximately 0 and slopes approximately 1, as expected for unpenalized logistic models evaluated in their development sample. Bootstrap correction identified residual optimism, particularly in the more extensive clinical models.
For WSES stage ≥ 1A, the clinical reference model had an optimism-corrected calibration slope of 0.859 and Brier score of 0.181. The corresponding values were 0.806 and 0.164 after adding muscle phenotypes and 0.826 and 0.167 after adding continuous SMI and attenuation. Corrected CITL estimates were −0.0020, 0.0009 and −0.0017, respectively. Thus, mean calibration was close to the ideal value, but slopes below 1 indicated overly extreme probability estimates.
For WSES stage ≥ 1B, corrected calibration slopes were 0.848, 0.819 and 0.840 for the clinical reference, phenotype-extended and continuous-measure models, respectively. Their corrected Brier scores were 0.205, 0.172 and 0.175. Complete calibration results for both model families and outcome thresholds are presented in Supplementary Table S10. Calibration plots for the primary clinical comparisons are shown in Figure 5; the remaining comparisons are provided in Supplementary Figure S1.
Figure 5.
Calibration of the clinical reference and extended models for WSES stage ≥ 1A. Legend: Panels (A–C) show the clinical reference model, the model adding muscle phenotypes, and the model adding continuous SMI and muscle attenuation, respectively. The reference model included age, sex, ASA class III–IV versus I–II, ACCI, WBC and CRP. Solid lines represent bootstrap-corrected spline calibration curves; dash-dotted lines represent apparent spline curves. Open circles indicate original-sample decile estimates, and dotted diagonal lines indicate perfect calibration. Curves are displayed over each model’s 5th–95th percentile prediction range. Rug marks show the distribution of original predictions. Reported slopes, CITL estimates and Brier scores are optimism-corrected using 1000 bootstrap resamples. Confidence bands are not shown. Abbreviations: ACCI, age-adjusted Charlson Comorbidity Index; ASA, American Society of Anesthesiologists; CITL, calibration-in-the-large; CRP, C-reactive protein; SMI, skeletal muscle index; WBC, white blood cell count; WSES, World Society of Emergency Surgery.
3.12. Twelve-Month CT-Confirmed Repeat Diverticulitis Attacks
Among the 145 patients who did not undergo emergency surgery during the index admission, 121 (83.4%) had an evaluable 12-month outcome and were included in the 12-month outcome analysis; 24 patients (16.6%) did not have sufficient information to establish 12-month outcome status (Figure 1). Follow-up completeness was similar across the four body composition phenotypes (83.0% for neither abnormality, 82.6% for CT-defined sarcopenia only, 82.4% for myosteatosis only, and 85.4% for both abnormalities; p = 0.984). During the first 12 months, 11 of 121 evaluable patients (9.1%) experienced at least one CT-confirmed repeat diverticulitis attack. The patient-level rates were 5.1% (2/39) in patients with neither CT-defined abnormality, 5.3% (1/19) in those with CT-defined sarcopenia only, 10.7% (3/28) in those with myosteatosis only, and 14.3% (5/35) in those with both abnormalities. The overall difference among the four phenotypes was not statistically significant (Fisher–Freeman–Halton exact test, p = 0.553) (Table 5).
Table 5.
Twelve-month CT-confirmed repeat diverticulitis attacks by CT-defined muscle composition phenotype.
3.13. Intraobserver and Interobserver Reproducibility
Reproducibility was assessed in the same 30 randomly selected patients. For the primary radiologist, mean initial and repeat SMI measurements were 40.61 ± 10.43 and 40.34 ± 10.18 cm2/m2, respectively, with an intraobserver ICC of 0.946 (95% CI, 0.890–0.974). Corresponding mean muscle attenuation measurements were 33.44 ± 6.22 and 33.07 ± 6.48 HU, with an intraobserver ICC of 0.921 (95% CI, 0.842–0.961).
The second radiologist’s mean SMI and muscle attenuation measurements were 40.48 ± 10.30 cm2/m2 and 33.24 ± 6.30 HU, respectively. Interobserver ICCs comparing the primary radiologist’s initial measurements with the second radiologist’s measurements were 0.943 (95% CI, 0.884–0.972) for SMI and 0.918 (95% CI, 0.835–0.960) for muscle attenuation.
Mean intraobserver differences were −0.27 cm2/m2 for SMI and −0.37 HU for muscle attenuation, with 95% limits of agreement of −7.00 to 6.45 cm2/m2 and −5.34 to 4.61 HU, respectively. Corresponding interobserver mean differences were −0.13 cm2/m2 and −0.20 HU, with 95% limits of agreement of −7.10 to 6.83 cm2/m2 and −5.23 to 4.84 HU, respectively.
CT-defined sarcopenia status, myosteatosis status and four-category phenotype assignment were identical in all 30 patients in both the intraobserver and interobserver comparisons. Percentage agreement was 100%, and unweighted Cohen’s kappa was 1.00 for each classification and comparison. The subset comprised six patients with neither abnormality, seven with isolated CT-defined sarcopenia, nine with isolated myosteatosis and eight with both abnormalities (Supplementary Table S1).
4. Discussion
The observed proportion of complicated acute left-sided colonic diverticulitis differed across CT-defined muscle composition phenotypes, from 34.7% in patients with neither abnormality to 48.0% with CT-defined sarcopenia only, 61.5% with myosteatosis only and 78.4% with both abnormalities. Because muscle composition and WSES severity were assessed on the same index CT examination, these findings describe a cross-sectional association with disease severity at presentation rather than prediction of subsequent deterioration. An additional unadjusted analysis supported a positive trend according to the number of muscle abnormalities: the proportions were 34.7%, 56.3% and 78.4% for zero, one and two abnormalities, respectively. A positive trend was also observed using WSES stage ≥ 1B. This count-based analysis does not establish a severity ordering between isolated CT-defined sarcopenia and isolated myosteatosis, which remained separate categories in the main analyses. In the multivariable models, myosteatosis and the combined phenotype remained associated with complicated disease after adjustment for demographic characteristics, comorbidity, WBC and CRP, with the largest point estimate observed for the combined phenotype.
The association between reduced muscle reserve and adverse outcomes in diverticulitis has been reported previously, although earlier studies have addressed different clinical settings and endpoints. Matsushima et al. evaluated 89 patients undergoing emergency surgery for acute diverticulitis and found that low psoas muscle mass was independently associated with major postoperative complications and surgical-site infection [22]. By contrast, Krebs et al. examined 148 patients undergoing elective colectomy for diverticulitis and found that sarcopenia, whether defined by SMI or PMI, was not associated with major postoperative outcomes; the main difference was a modest prolongation of hospital stay [23]. These apparently divergent observations are relevant to our findings. Body composition may carry greater clinical information during an acute inflammatory insult than in a selected elective surgical population, and its association may also depend on whether the outcome of interest is disease severity at presentation, postoperative morbidity, or longer-term recovery.
A more directly comparable study by Surov et al. examined body composition in 646 patients with acute colonic diverticulitis. Low muscle area was associated with complicated disease, whereas myosteatosis was associated with free perforation [13]. In our cohort, isolated CT-defined sarcopenia was not statistically conclusive after full adjustment, while myosteatosis and the combined phenotype remained associated with WSES-defined complicated disease. Differences in outcome definitions, patient selection and adjustment strategies limit direct comparison of effect estimates.
Our results further suggest that muscle quantity and muscle quality should not be considered interchangeable. Compared with patients with neither abnormality, myosteatosis only and the combined phenotype were associated with higher adjusted odds of complicated disease, whereas the association for isolated CT-defined sarcopenia was not statistically significant. This distinction is supported by broader evidence showing that myosteatosis represents a different biological dimension from loss of muscle mass. Ahn et al., in a systematic review and meta-analysis, emphasized that reduced muscle radiodensity reflects abnormal muscle composition and has prognostic implications across several disease states independent of muscle quantity [24]. Similarly, Giudici et al. recently reported in 242 patients undergoing emergency laparotomy that myosteatosis, rather than sarcopenia, was associated with severe complications, ICU admission, and prolonged hospitalization [25]. Although these populations are not directly comparable with patients hospitalized for diverticulitis, they support the concept that deterioration in muscle quality may capture physiological vulnerability not fully represented by muscle mass alone.
This concept also fits with the emerging literature on frailty in diverticulitis, while the two constructs should remain clearly distinguished. In a nationwide propensity-matched analysis, Rasheed et al. compared 21,720 frail older patients hospitalized with ACD with an equal number of non-frail patients and found higher rates of abscess, perforation, fistula, sepsis, intensive care requirement, mortality, and prolonged hospitalization among frail patients [26]. Laterza et al., in a multicenter cohort of 1127 patients aged ≥70 years with acute left-sided diverticulitis, similarly found that increasing Clinical Frailty Scale scores were independently associated with sepsis and 30-day mortality [27]. CT-defined muscle abnormalities cannot substitute for multidimensional frailty assessment, which also incorporates functional and other patient-level domains. Nevertheless, these data and our findings converge on the same broader point: the clinical expression of diverticulitis is influenced not only by local colonic inflammation but also by characteristics of the host in whom that inflammation occurs.
Adipose tissue distribution represents another component of this host phenotype. Ng et al. evaluated quantitative visceral adiposity in 352 patients with diverticulitis and found that a higher visceral-to-subcutaneous fat ratio was independently associated with complicated disease [28]. More recently, Ha et al. used automated CT-based body composition assessment in 6654 individuals and reported that greater visceral fat area was associated with incident diverticulitis, complicated diverticulitis, and recurrence requiring hospitalization, whereas skeletal muscle area was not significantly associated with these outcomes [29]. These observations are important because they argue against reducing body composition to a binary sarcopenia variable. Muscle mass, muscle attenuation, visceral adiposity, and subcutaneous adiposity represent different biological compartments, and their associations with diverticular disease may not be concordant. The body composition phenotype observed on routine CT is therefore better regarded as a multidimensional marker of host characteristics than as a single measure of nutritional status.
The stronger clinical reference model provides a more informative assessment of incremental discrimination than WBC and CRP alone. For WSES stage ≥ 1A, adding muscle phenotypes to age, sex, ASA class, ACCI, WBC and CRP increased the apparent AUC from 0.837 to 0.877, with an apparent increment of 0.040 (95% CI, 0.004–0.078) and an optimism-corrected increment of 0.033. This increment was smaller than that observed against the inflammatory reference, indicating that some of the discriminatory information overlapped with clinical characteristics. For continuous SMI and attenuation, the primary-outcome increment was less certain because its confidence interval included zero. At the WSES stage ≥ 1B threshold, the apparent increments for both representations had confidence intervals above zero. These results support additional discriminatory information from categorical muscle phenotypes beyond the examined clinical reference model, but do not demonstrate management benefit or prospective prediction of deterioration.
Associations for myosteatosis and the combined phenotype persisted when the outcome threshold was raised to WSES stage ≥ 1B, indicating that the findings were not confined to the inclusion of stage 1A. However, the wide confidence intervals preclude precise conclusions about effect magnitude, and the larger odds ratios do not establish a stronger underlying association. The association for isolated CT-defined sarcopenia remained statistically inconclusive.
Emergency surgery occurred in 19 patients. Although the observed proportion ranged from 4.1% in patients with neither muscle abnormality to 19.6% in those with both abnormalities, the overall between-group difference was not statistically significant (p = 0.096). The small number of surgical events limits the precision of this comparison, and the findings establish neither an association nor equivalence between phenotypes. Emergency surgery also represents a different endpoint from CT-defined complicated disease: treatment decisions incorporated clinical condition, hemodynamic status, collection characteristics and response to initial management, in addition to radiological severity. Classification as WSES stage ≥ 1A therefore did not itself imply a requirement for surgery, consistent with stage-specific management recommendations [17].
Puccioni et al. similarly reported no statistically significant differences in overall morbidity, mortality or nonoperative management failure according to sarcopenia status in their 237-patient cohort [12]. These outcomes differ from emergency surgery in our study, but the findings caution against assuming that an imaging phenotype associated with disease severity necessarily identifies a treatment strategy that improves outcomes.
The use of BMI-stratified phenotype thresholds [15] warrants consideration when BMI is also included as a covariate. Excluding BMI from the association models produced similar estimates for myosteatosis and the combined phenotype at both outcome thresholds, suggesting that these findings were not driven by the inclusion of BMI as an additional adjustment variable. Nevertheless, the estimate for isolated CT-defined sarcopenia changed more noticeably in the primary-outcome Model 2. Low VIFs for BMI indicated limited linear collinearity with the other model terms, but neither these diagnostics nor the sensitivity analyses eliminate the conceptual dependence of phenotype classification on BMI.
The attenuation of the age association after multivariable adjustment requires cautious interpretation. Age was associated with both outcomes in unadjusted analyses, whereas its conditional association was imprecisely estimated after adjustment. Because ACCI itself incorporates age, entering chronological age and ACCI simultaneously introduces overlapping age information and complicates interpretation of the separate age coefficient. Replacing linear age with a restricted cubic spline did not materially change the phenotype estimates. Omitting ACCI from the spline-adjusted model also yielded similar estimates for myosteatosis and the combined phenotype. However, this sensitivity analysis removes comorbidity adjustment as well as the age component of ACCI; it therefore does not replace a model incorporating chronological age and a separately verified, non-age-adjusted comorbidity score. These findings support stability under the specifications examined but do not exclude residual confounding.
The largest adjusted point estimate was observed in patients with both muscle abnormalities. However, a joint association relative to a common reference group is distinct from interaction on an additive or multiplicative scale [18]. Our product-term analyses did not identify statistically significant multiplicative interaction on the odds scale at either outcome threshold. Furthermore, exploratory contrasts did not demonstrate a statistically significant difference between the combined phenotype and myosteatosis only. These results distinguish the association of the combined phenotype with disease severity from evidence that the two abnormalities amplify each other’s association. The wide interaction confidence intervals indicate limited precision; therefore, absence of statistical significance does not establish absence of interaction. Additive interaction and biological synergy were not evaluated.
Firth’s penalized likelihood approach provides a means of examining sensitivity to small-sample bias in logistic regression [19]. In our study, these analyses provided additional information about estimation stability. Penalization reduced the point estimates for myosteatosis and the combined phenotype, while their associations remained statistically significant at both outcome thresholds. This attenuation supports caution when interpreting the magnitude of the ordinary logistic estimates. Although no separation was detected, the influence diagnostics identified observations warranting examination. Exact case-deletion analyses showed that the ordinary logistic associations for myosteatosis and both abnormalities were not dependent on the inclusion of any single patient. In contrast, the significance of isolated CT-defined sarcopenia varied across deletions. These findings support the persistence of the main associations under alternative estimation and case deletion, but the remaining wide confidence intervals preclude precise conclusions about effect size.
Calibration assessment further qualifies the interpretation of the discrimination results. Although corrected CITL estimates were close to zero, the clinical models had corrected slopes below 1, including 0.806 for the phenotype-extended model at the primary threshold. A calibration slope below 1 indicates overly extreme probability estimates, and satisfactory mean calibration does not establish calibration across the full probability range [30]. The lower corrected Brier score after adding phenotypes describes lower overall probability error in our internal validation analysis, but does not establish improved clinical decisions. Bootstrap validation addresses optimism within the development data [20]; performance and calibration in other settings remain to be established through external validation [30].
The potential relevance of such host phenotyping is supported by data from acute surgical populations. Evans et al., in 1090 emergency laparotomy patients, found that a low skeletal muscle gauge integrating muscle quantity and radiodensity was independently associated with 30- and 90-day mortality and prolonged hospitalization [31]. A recent systematic review and meta-analysis of CT-derived sarcopenia and myosteatosis in emergency abdominal surgery likewise concluded that adverse muscle quantity and quality are associated with mortality and severe postoperative complications, although substantial methodological heterogeneity remains [32]. These findings should not be directly extrapolated to nonoperative diverticulitis, but they strengthen the rationale for assessing muscle quantity and quality together rather than relying on muscle area alone.
The absence of a clear relationship with subsequent attacks is equally informative. Among patients managed without emergency surgery for whom the 12-month outcome could be established, 11 of 121 (9.1%) developed a new CT-confirmed diverticulitis attack, with no significant difference across the four body composition groups. Hejazi et al. recently examined 10,807 older patients managed nonoperatively for complicated diverticulitis and likewise found that frailty predicted mortality but not recurrent diverticulitis [33]. This parallels the earlier observation that muscle characteristics may relate more strongly to the consequences of an acute physiological stressor than to the probability that the inflammatory event will recur. In our study, this distinction is strengthened by requiring new CT evidence for the definition of a recurrent attack rather than relying on recurrent abdominal symptoms alone. Although the observed repeat-attack proportion increased numerically from 5.1% in patients with neither abnormality to 14.3% in those with both abnormalities, the overall between-group difference was not statistically significant. Although follow-up completeness was similar across the four body composition phenotypes, the small number of events and incomplete 12-month outcome ascertainment in 24 otherwise eligible patients warrant caution. These findings should therefore be interpreted as showing no demonstrable association rather than evidence of equivalence between phenotypes.
Taken together, the available literature remains heterogeneous, with substantial variation in patient selection, definitions of sarcopenia, CT acquisition and segmentation methods, cutoff values, and clinical endpoints. Amini et al. documented considerable methodological variability in CT-based assessment of both muscle mass and myosteatosis, despite L3 being the most commonly used abdominal level [34]. This heterogeneity probably explains part of the inconsistency among studies of diverticular disease and reinforces the need to report CT methodology and phenotype definitions precisely. The recent diverticulitis-specific literature likewise suggests that muscle assessment may provide additional information about patient characteristics, although its role in guiding management remains uncertain.
WSES staging characterizes the anatomical and radiological severity of the acute episode [17], whereas CT-derived muscle measurements characterize skeletal muscle quantity and attenuation. The present study demonstrates an association between these features, but does not establish that muscle assessment improves decisions once WSES stage is known. Potential applications for future investigation include whether muscle abnormalities can help identify patients who benefit from nutritional and functional assessment, multidisciplinary review or tailored follow-up. These applications remain hypotheses for future investigation. We did not evaluate treatment failure or subsequent deterioration within individual WSES stages, nor whether phenotype-guided monitoring or treatment improves outcomes. The present findings therefore do not establish a need for closer monitoring or more intensive treatment and do not support using muscle phenotype alone as an indication for drainage or surgery.
Decision curve analysis evaluates clinical net benefit across threshold probabilities that reflect the consequences of acting on a model estimate [35]. In this study, the outcome was already determined by the same index CT used for muscle assessment, and no distinct model-guided intervention was specified. We therefore did not estimate clinical net benefit or infer that the observed discrimination improvements would improve patient outcomes. Future impact studies should evaluate a clearly defined decision context, such as subsequent deterioration or treatment failure, before assessing model-guided management.
4.1. Strengths
Several aspects of this study strengthen the reliability and clinical relevance of the findings. First, body composition was assessed using the index CT examination obtained during the acute presentation, allowing host characteristics and disease severity to be evaluated from the same imaging study without additional imaging or radiation exposure. Skeletal muscle quantity and quality were evaluated separately using whole-L3 skeletal muscle measurements rather than relying solely on psoas area, and patients were additionally classified into four mutually exclusive phenotypes to distinguish isolated CT-defined sarcopenia, isolated myosteatosis, and their coexistence. Both intraobserver and interobserver assessments showed high agreement for SMI and muscle attenuation. Four-category phenotype assignment was also identical across readings in the 30-patient reproducibility subset.
Second, the primary endpoint was defined radiologically according to the WSES CT classification and was based exclusively on findings present on the index CT. Treatment escalation, percutaneous drainage, and emergency surgery were not incorporated into the definition of complicated diverticulitis, thereby reducing the influence of physician-dependent management decisions on outcome classification. The analyses separately evaluated associations, discrimination and calibration at presentation. Incremental discrimination was examined against both inflammatory and clinical reference models, and internal validation included optimism correction for AUC, calibration measures and Brier scores.
Finally, recurrent diverticulitis was defined conservatively by a new CT-confirmed episode rather than by recurrent abdominal symptoms alone, reducing the likelihood of misclassifying nonspecific symptoms as recurrent disease.
4.2. Limitations
This study has several limitations. Its retrospective, single-center design introduces potential selection bias and residual confounding. The cohort comprised adults hospitalized with acute left-sided colonic diverticulitis at a tertiary referral center who had index CT examinations suitable for body composition analysis and sufficiently complete clinical records. The observed proportion of complicated disease was 56.7%; this selected inpatient cohort should not be considered representative of the broader diverticulitis population, particularly patients managed entirely as outpatients. The findings should not be extrapolated directly to right-sided diverticulitis or populations with different admission criteria, referral patterns or disease severity distributions. Model-estimated probabilities and calibration may differ in other settings, requiring external validation before clinical application.
The modest sample size and the number of covariate parameters also limit estimation precision. The fully adjusted ordinary model included nine slope parameters, with 93 outcome-positive and 71 outcome-negative patients for the primary endpoint. Several phenotype estimates had wide confidence intervals. Firth penalization attenuated these estimates but did not eliminate their uncertainty, and some observations were flagged by influence diagnostics. Although the principal associations persisted in case-deletion analyses, these checks do not exclude overfitting, residual confounding or instability in other populations. Bootstrap-corrected calibration slopes below 1 indicated residual optimism in the model probabilities. The calibration measures remain internally validated point estimates without external validation, and no clinical net-benefit or impact analysis was undertaken.
CT examinations were acquired during routine clinical care over a relatively long period using two scanners, without prospective research standardization of acquisition parameters. Intravenous contrast enhancement can alter skeletal muscle attenuation, and enhancement depends on acquisition timing and patient-related factors [9]. Although portal venous-phase images were used, residual variation in enhancement and scanner-related measurement differences may have affected attenuation values and classification near the BMI-specific myosteatosis thresholds. Standardized retrospective segmentation and high reader agreement reduce reader-related variability but do not eliminate acquisition-related differences. Experimental work in six human cadavers also demonstrated that changes in tube voltage and iterative reconstruction settings can affect muscle area and attenuation measurements [36]. These findings support caution when comparing measurements across acquisition protocols, although their magnitude cannot be directly transferred to our clinical cohort. Additional scanner adjustment yielded similar phenotype estimates, whereas restriction to the more frequently used scanner produced less precise estimates; the confidence interval for isolated myosteatosis included 1 at the primary outcome threshold. These analyses examine sensitivity to scanner adjustment and sample restriction but do not establish equivalence between scanners or eliminate variation related to contrast enhancement and other acquisition conditions. In addition, CT-defined sarcopenia was based on low skeletal muscle mass using established sex- and BMI-specific SMI thresholds. Muscle strength, gait speed and other measures of physical performance were unavailable; therefore, this imaging classification does not establish a clinical diagnosis of sarcopenia [16].
The observational design also precludes determination of causality. Body composition abnormalities may reflect age, chronic disease burden, nutritional status, metabolic factors, or other unmeasured characteristics that are themselves related to disease severity. Although myosteatosis and the combined phenotype remained independently associated with complicated diverticulitis after multivariable adjustment, residual or unmeasured confounding remains possible. Chronological age and ACCI were entered simultaneously in the main association models, although ACCI already includes age-related points. This overlap may have reduced the precision and interpretability of their separate conditional associations. Flexible age adjustment and omission of ACCI produced similar phenotype estimates, but neither approach excludes residual age-related or comorbidity-related confounding. Importantly, because body composition and diverticulitis severity were assessed from the same index CT examination, the present analyses evaluate cross-sectional associations and discrimination at presentation rather than prospective prediction of subsequent disease severity. Accordingly, the observed associations should not be interpreted as evidence that body composition abnormalities causally contribute to the development or progression of complicated diverticulitis. Although both radiologists were blinded to WSES stage, subsequent treatment requirements, clinical course and outcomes during muscle measurement, the primary radiologist assessed both disease severity and body composition on the same index CT examinations. Blinding to recorded WSES stage could not eliminate contextual information visible on the images. Furthermore, reproducibility was assessed in only 30 patients by two experienced radiologists at the same institution. The complete classification agreement observed in this subset does not exclude threshold-related reclassification in other patients or establish reproducibility across centres, software platforms or readers with different levels of experience.
ASA physical status was routinely recorded by the admitting general surgeon at the beginning of the index hospitalization rather than assigned through a standardized research assessment. Potential variation between assessors and the influence of the acute illness on the admission classification should therefore be considered. Furthermore, improved discrimination beyond the clinical reference model does not establish added value beyond WSES classification itself, because the outcome was defined by WSES findings on the same CT examination.
Finally, follow-up was based on routinely available clinical records rather than a prospectively standardized surveillance protocol. Among the 145 patients eligible for the 12-month analysis, outcome status could be adequately established in 121 (83.4%), whereas 24 patients (16.6%) had insufficient follow-up information and were excluded from this analysis. Follow-up completeness was similar across the four body composition phenotypes, reducing concern for phenotype-dependent attrition; nevertheless, bias related to incomplete outcome ascertainment cannot be entirely excluded. In addition, only 11 CT-confirmed repeat diverticulitis events occurred, limiting statistical power to detect modest differences in 12-month repeat-attack rates among phenotypes. Longer prospective follow-up with standardized outcome assessment would be required to determine whether CT-derived muscle characteristics are associated with repeat diverticulitis attacks or other long-term outcomes.
5. Conclusions
CT-derived muscle composition was associated with the severity of acute left-sided colonic diverticulitis at presentation. An additional unadjusted analysis showed increasing proportions of more severe disease with a greater number of muscle abnormalities. Myosteatosis and the coexistence of CT-defined low muscle mass and myosteatosis remained associated with complicated disease after adjustment for demographic characteristics, ACCI, WBC and CRP. These associations were also observed using the more stringent WSES stage ≥ 1B threshold. However, there was no statistically significant evidence of multiplicative interaction between the two abnormalities. Categorical muscle phenotypes provided additional discriminatory information beyond a reference model containing clinical characteristics and inflammatory markers, with a smaller increment after bootstrap correction for optimism.
These findings support further evaluation of opportunistic CT-derived muscle phenotyping. Calibration assessment indicated residual overfitting, and neither clinical net benefit nor improved patient outcomes was demonstrated. External validation and prospective impact studies are required before incorporating these measurements into management decisions.
Supplementary Materials
The following supporting information can be downloaded at: https://www.mdpi.com/article/10.3390/medicina62112178/s1, Supplementary Table S1. Intraobserver and Interobserver Reproducibility of CT-Derived Muscle Measurements and Phenotype Classification in 30 Patients; Supplementary Table S2. Disease Severity According to the Number of CT-Defined Muscle Abnormalities and Cochran–Armitage Trend Analyses; Supplementary Table S3. Sensitivity Analyses Examining Age Adjustment and Omission of ACCI; Supplementary Table S4. Multivariable Associations Using WSES Stage ≥ 1B as the Sensitivity Outcome; Supplementary Table S5. Incremental Discrimination Using Inflammatory and Clinical Reference Models for WSES Stage ≥ 1B; Supplementary Table S6. Sensitivity Analyses Excluding BMI and Design-Matrix Collinearity Diagnostics; Supplementary Table S7. Multiplicative Interaction Between CT-Defined Sarcopenia and Myosteatosis and Exploratory Phenotype Contrasts; Supplementary Table S8. Firth Penalized Logistic Regression and Case-Deletion Sensitivity Analyses; Supplementary Table S9. Sensitivity Analyses Accounting for CT Scanner; Supplementary Table S10. Apparent and Bootstrap-Corrected Calibration and Brier Scores; Supplementary Figure S1. Calibration Plots for the Inflammatory Model Family and the WSES Stage ≥ 1B Clinical Comparisons.
Author Contributions
M.B.Y. conceived and designed the study, developed the methodology, coordinated and supervised the project, provided the resources required for the study, contributed to data acquisition and formal analysis, interpreted the results, prepared the study visualizations, and had primary responsibility for preparing the original draft of the manuscript. S.B. contributed to methodology, investigation, data curation, and critical revision of the manuscript. A.A. contributed to investigation, data curation, and critical revision of the manuscript. H.B. contributed to conceptualization, methodology, investigation, data curation, and critical revision of the manuscript. F.A. contributed to methodology, investigation, data curation, and critical revision of the manuscript. A.R.K. and O.O. contributed to investigation, data curation, and critical revision of the manuscript. A.Ö. contributed to formal analysis, validation, and critical revision of the manuscript. İ.D. performed the radiological evaluation, CT image analysis, body-composition measurements, reproducibility assessment, and preparation of the radiological visualizations, and contributed to data curation, validation, and critical revision of the manuscript. O.B. and B.B. contributed to supervision, validation, and critical revision of the manuscript. All authors have read and agreed to the published version of the manuscript.
Funding
This research received no external funding.
Institutional Review Board Statement
This study was conducted in accordance with the principles of the Declaration of Helsinki and was approved by the Van Yüzüncü Yıl University Non-Interventional Clinical Research Ethics Committee (Decision No. 2026/07-08; 14 August 2026).
Informed Consent Statement
Patient consent was waived by the Institutional Ethics Committee due to the retrospective design of the study and the use of fully anonymized clinical and imaging data.
Data Availability Statement
The datasets generated and/or analyzed during the current study are available from the corresponding author upon reasonable request, subject to institutional and ethical restrictions.
Conflicts of Interest
The authors declare no conflicts of interest.
References
- Brown, R.F.; Lopez, K.; Smith, C.B.; Charles, A. Diverticulitis: A Review. JAMA 2025, 334, 1180–1191. [Google Scholar] [CrossRef] [Scilit] [PubMed]
- Tursi, A.; Brandimarte, G.; Di Mario, F.; Ma, W.; Kupcinskas, J.; Regula, J.; Maconi, G.; Malfertheiner, P.; Barbara, G.; Stollman, N.; et al. Global guidelines on diverticular disease of the colon: The Fiesole Consensus report. Gut 2026, 75, 1654–1681. [Google Scholar] [CrossRef] [Scilit] [PubMed]
- Peery, A.F.; Strate, L.L.; Stollman, N.; Mankaney, G.; Chang, J.W.; Grover, S. ACG Clinical Guideline: Colonic Diverticulitis. Am. J. Gastroenterol. 2026, 121, 1549–1561. [Google Scholar] [CrossRef] [Scilit] [PubMed]
- Balk, E.M.; Adam, G.P.; Bhuma, M.R.; Konnyu, K.J.; Saldanha, I.J.; Beland, M.D.; Shah, N. Diagnostic Imaging and Medical Management of Acute Left-Sided Colonic Diverticulitis: A Systematic Review. Ann. Intern. Med. 2022, 175, 379–387. [Google Scholar] [CrossRef] [Scilit] [PubMed]
- Girardin, T.; Martin, D.; Lázaro-Fontanet, E.; Clerc, D.; Hübner, M.; Brügger, L.; Turina, M.; Brunner, W.; Christoforidis, D.; Ris, F.; et al. Swiss consensus on the management of acute diverticulitis. BJS Open 2024, 8, zrad165. [Google Scholar] [CrossRef] [Scilit] [PubMed]
- Qaseem, A.; Etxeandia-Ikobaltzeta, I.; Lin, J.S.; Fitterman, N.; Shamliyan, T.; Wilt, T.J. Clinical Guidelines Committee of the American College of Physicians. Diagnosis and Management of Acute Left-Sided Colonic Diverticulitis: A Clinical Guideline From the American College of Physicians. Ann. Intern. Med. 2022, 175, 399–415. [Google Scholar] [CrossRef] [Scilit] [PubMed]
- Sacks, O.A.; Hall, J. Management of Diverticulitis: A Review. JAMA Surg. 2024, 159, 696–703. [Google Scholar] [CrossRef] [Scilit] [PubMed]
- Anderson, M.A.; Kordbacheh, H.; Joseph, E.; Bennett, S.E.; Stanford, F.C.; Kambadakone, A. Computed tomography findings of metabolic syndrome in patients with acute colonic diverticulitis. J. Med. Imaging Radiat. Oncol. 2021, 65, 279–285. [Google Scholar] [CrossRef] [Scilit] [PubMed]
- Lortie, J.; Gage, G.; Rush, B.; Heymsfield, S.B.; Szczykutowicz, T.P.; Kuchnia, A.J. The effect of computed tomography parameters on sarcopenia and myosteatosis assessment: A scoping review. J. Cachexia Sarcopenia Muscle 2022, 13, 2807–2819. [Google Scholar] [CrossRef] [Scilit] [PubMed]
- Dahlbäck, C.; Karlsson, N.; Samuelsson, C.; Jörgren, F.; Buchwald, P. Muscle mass and quality as predictors for complications, recurrence and length of hospital stay in acute uncomplicated diverticulitis: A retrospective cohort study. Scand. J. Gastroenterol. 2023, 58, 375–379. [Google Scholar] [CrossRef] [Scilit] [PubMed]
- Schaffler-Schaden, D.; Mittermair, C.; Bittner, F.; Zintl, R.; Schaffler, G.; Weiss, H. Effects of sarcopenia and myosteatosis are alleviated in reduced port surgery for diverticulitis. Int. J. Colorectal Dis. 2023, 38, 202. [Google Scholar] [CrossRef] [Scilit] [PubMed]
- Puccioni, C.; Fransvea, P.; Rodolfino, E.; Cintoni, M.; Vacca, A.; Benedetto, D.; Mele, M.C.; Sganga, G. Clinical Impact of Sarcopenia in the Decision-Making Process for Patients with Acute Diverticulitis. J. Clin. Med. 2025, 14, 7. [Google Scholar] [CrossRef] [Scilit] [PubMed]
- Surov, A.; Hinnerichs, M.; Shahzadi, I.; Haag, N.P.; Kröger, J.R.; Gerdes, B.; Elhabash, S.; Borggrefe, J. Parameters of Body Composition Predict Clinical Course in Acute Colonic Diverticulitis. J. Cachexia Sarcopenia Muscle 2025, 16, e13864. [Google Scholar] [CrossRef] [Scilit] [PubMed]
- Beyazadam, D.; Eren, T.; Colapkulu Akgul, N.; Sagiroglu, S.J.; Gunduz, N.; Ekinci, O.; Alimoglu, O. Prospective analysis of adiposity metrics for complicated acute colonic diverticulitis: Should WSES Classification and visceral adiposity be integrated for predictive analyses? Eur. J. Trauma Emerg. Surg. 2025, 51, 207. [Google Scholar] [CrossRef] [Scilit] [PubMed]
- Martin, L.; Birdsell, L.; Macdonald, N.; Reiman, T.; Clandinin, M.T.; McCargar, L.J.; Murphy, R.; Ghosh, S.; Sawyer, M.B.; Baracos, V.E. Cancer cachexia in the age of obesity: Skeletal muscle depletion is a powerful prognostic factor, independent of body mass index. J. Clin. Oncol. 2013, 31, 1539–1547. [Google Scholar] [CrossRef] [Scilit] [PubMed]
- Kirk, B.; Cawthon, P.M.; Arai, H.; Ávila-Funes, J.A.; Barazzoni, R.; Bhasin, S.; Binder, E.F.; Bruyere, O.; Cederholm, T.; Chen, L.-K.; et al. The Conceptual Definition of Sarcopenia: Delphi Consensus from the Global Leadership Initiative in Sarcopenia (GLIS). Age Ageing 2024, 53, afae052. [Google Scholar] [CrossRef] [Scilit] [PubMed]
- Sartelli, M.; Weber, D.G.; Kluger, Y.; Ansaloni, L.; Coccolini, F.; Abu-Zidan, F.; Augustin, G.; Ben-Ishay, O.; Biffl, W.L.; Bouliaris, K.; et al. 2020 update of the WSES guidelines for the management of acute colonic diverticulitis in the emergency setting. World J. Emerg. Surg. 2020, 15, 32. [Google Scholar] [CrossRef] [Scilit] [PubMed]
- Knol, M.J.; VanderWeele, T.J. Recommendations for presenting analyses of effect modification and interaction. Int. J. Epidemiol. 2012, 41, 514–520. [Google Scholar] [CrossRef] [Scilit] [PubMed]
- Heinze, G.; Schemper, M. A solution to the problem of separation in logistic regression. Stat. Med. 2002, 21, 2409–2419. [Google Scholar] [CrossRef] [Scilit] [PubMed]
- Efthimiou, O.; Seo, M.; Chalkou, K.; Debray, T.; Egger, M.; Salanti, G. Developing clinical prediction models: A step-by-step guide. BMJ 2024, 386, e078276. [Google Scholar] [CrossRef] [Scilit] [PubMed]
- Koo, T.K.; Li, M.Y. A Guideline of Selecting and Reporting Intraclass Correlation Coefficients for Reliability Research. J. Chiropr. Med. 2016, 15, 155–163. [Google Scholar] [CrossRef] [Scilit] [PubMed]
- Matsushima, K.; Inaba, K.; Jhaveri, V.; Cheng, V.; Herr, K.; Siboni, S.; Strumwasser, A.; Demetriades, D. Loss of muscle mass: A significant predictor of postoperative complications in acute diverticulitis. J. Surg. Res. 2017, 211, 39–44. [Google Scholar] [CrossRef] [Scilit] [PubMed]
- Krebs, J.R.; Mazirka, P.; Fazzone, B.; Ault, T.; Read, T.E.; Terracina, K.P. Sarcopenia is a poor predictor of outcomes in elective colectomy for diverticulitis. Am. Surg. 2024, 90, 1309–1316. [Google Scholar] [CrossRef] [Scilit] [PubMed]
- Ahn, H.; Kim, D.W.; Ko, Y.; Ha, J.; Shin, Y.B.; Lee, J.; Sung, Y.S.; Kim, K.W. Updated systematic review and meta-analysis on diagnostic issues and the prognostic impact of myosteatosis: A new paradigm beyond sarcopenia. Ageing Res. Rev. 2021, 70, 101398. [Google Scholar] [CrossRef] [Scilit] [PubMed]
- Giudici, S.; Lanza, E.; Lofino, L.; Barison, A.; Ammirabile, A.; Mauri, G.; Zulian, D.; Ceolin, M.; Brocchi, A.; Del Fabbro, D. Sarcopenia and myosteatosis as a predictor of post-operative outcomes in patients undergoing laparotomy for abdominal emergencies. J. Clin. Med. 2025, 14, 6639. [Google Scholar] [CrossRef] [Scilit] [PubMed]
- Rasheed, W.; Dweik, A.; Dharmarpandi, G.; Saeed, A.; Sohail, A.H.; Shaikh, M.B.; Ali, H.; Elhanafi, S.E. Frailty in elderly patients with acute colonic diverticulitis is associated with worse in-hospital outcomes: A nationwide analysis. Ann. Gastroenterol. 2024, 37, 552–558. [Google Scholar] [CrossRef] [Scilit] [PubMed]
- Laterza, V.; Covino, M.; Schena, C.A.; Della Polla, D.; Russo, A.; Salini, S.; De’aNgelis, N.; Quero, G.; Recupero, C.; Fiorillo, C.; et al. Frailty is a prognostic marker of mortality and sepsis in patients ≥70 years with acute left-sided colonic diverticulitis. Int. J. Colorectal Dis. 2025, 40, 141. [Google Scholar] [CrossRef] [Scilit] [PubMed]
- Ng, Z.Q.; Wijesuriya, R.; Misur, P.; Tan, J.H.; Moe, K.S.; Theophilus, M. The role of quantitative radiological measures of visceral adiposity in diverticulitis. Surg. Endosc. 2021, 35, 636–643. [Google Scholar] [CrossRef] [Scilit] [PubMed]
- Ha, J.; Bridge, C.P.; Andriole, K.P.; Kambadakone, A.; Clark, M.J.; Narimiti, A.; Rosenthal, M.H.M.; Fintelmann, F.J.; Gollub, R.L.M.; Giovannucci, E.L.M.; et al. Visceral fat quantified by a fully automated deep-learning algorithm and risk of incident and recurrent diverticulitis. Dis. Colon. Rectum 2025, 68, 726–735. [Google Scholar] [CrossRef] [Scilit] [PubMed]
- Riley, R.D.; Archer, L.; Snell, K.I.E.; Ensor, J.; Dhiman, P.; Martin, G.P.; Bonnett, L.J.; Collins, G.S. Evaluation of clinical prediction models (part 2): How to undertake an external validation study. BMJ 2024, 384, e074820. [Google Scholar] [CrossRef] [Scilit] [PubMed]
- Evans, R.P.T.; Raveshia, D.; Liew, M.S.; Jackowski, A.; Kisiel, A.; Griffiths, E.A.; Tan, B.H.L. Evaluation of sarcopenia and myosteatosis to determine the impact on mortality after emergency laparotomy. BJS Open 2025, 9, zraf092. [Google Scholar] [CrossRef] [Scilit] [PubMed]
- Berro, A.M.; Dandashli, M.B.; Taha, H.M.H.; Alayasa, M.Y.; Souaid, M.H.; Mokhtar, A.E.; Ahmed, A. Associations of CT-detected sarcopenia and myosteatosis with postoperative outcomes after emergency abdominal surgery: A systematic review and meta-analysis. Cureus 2026, 18, e114647. [Google Scholar] [CrossRef] [Scilit] [PubMed]
- Hejazi, O.; Colosimo, C.; Khurshid, M.H.; Stewart, C.; Al Ma’ani, M.; Anand, T.; Diaz, F.C.; Castanon, L.M.; Magnotti, L.J.M.; Joseph, B.M. Does frailty predict readmission and mortality in diverticulitis? A nationwide analysis. J. Trauma Acute Care Surg. 2025, 99, 605–610. [Google Scholar] [CrossRef] [Scilit] [PubMed]
- Amini, B.; Boyle, S.P.; Boutin, R.D.; Lenchik, L. Approaches to assessment of muscle mass and myosteatosis on computed tomography: A systematic review. J. Gerontol. A Biol. Sci. Med. Sci. 2019, 74, 1671–1678. [Google Scholar] [CrossRef] [Scilit] [PubMed]
- Vickers, A.J.; Elkin, E.B. Decision curve analysis: A novel method for evaluating prediction models. Med. Decis. Mak. 2006, 26, 565–574. [Google Scholar] [CrossRef] [Scilit] [PubMed]
- Vedder, I.R.; Levolger, S.; El Moumni, M.; Greuter, M.J.W.; Bokkers, R.P.H.; Viddeleer, A.R. Influence of CT parameters upon the quantification of sarcopenia and myosteatosis: A study with human bodies. Sci. Rep. 2026, 16, 3954. [Google Scholar] [CrossRef] [Scilit] [PubMed]
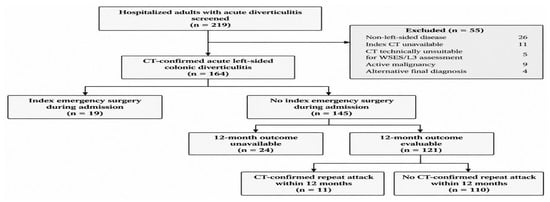
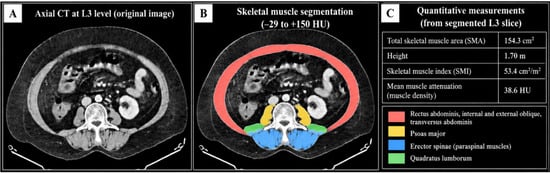
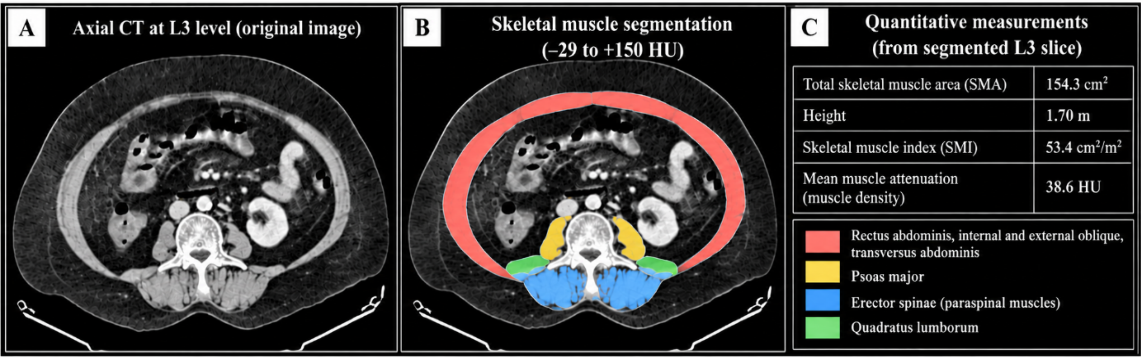
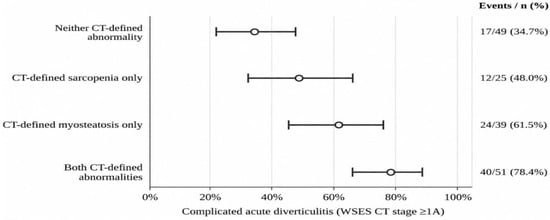
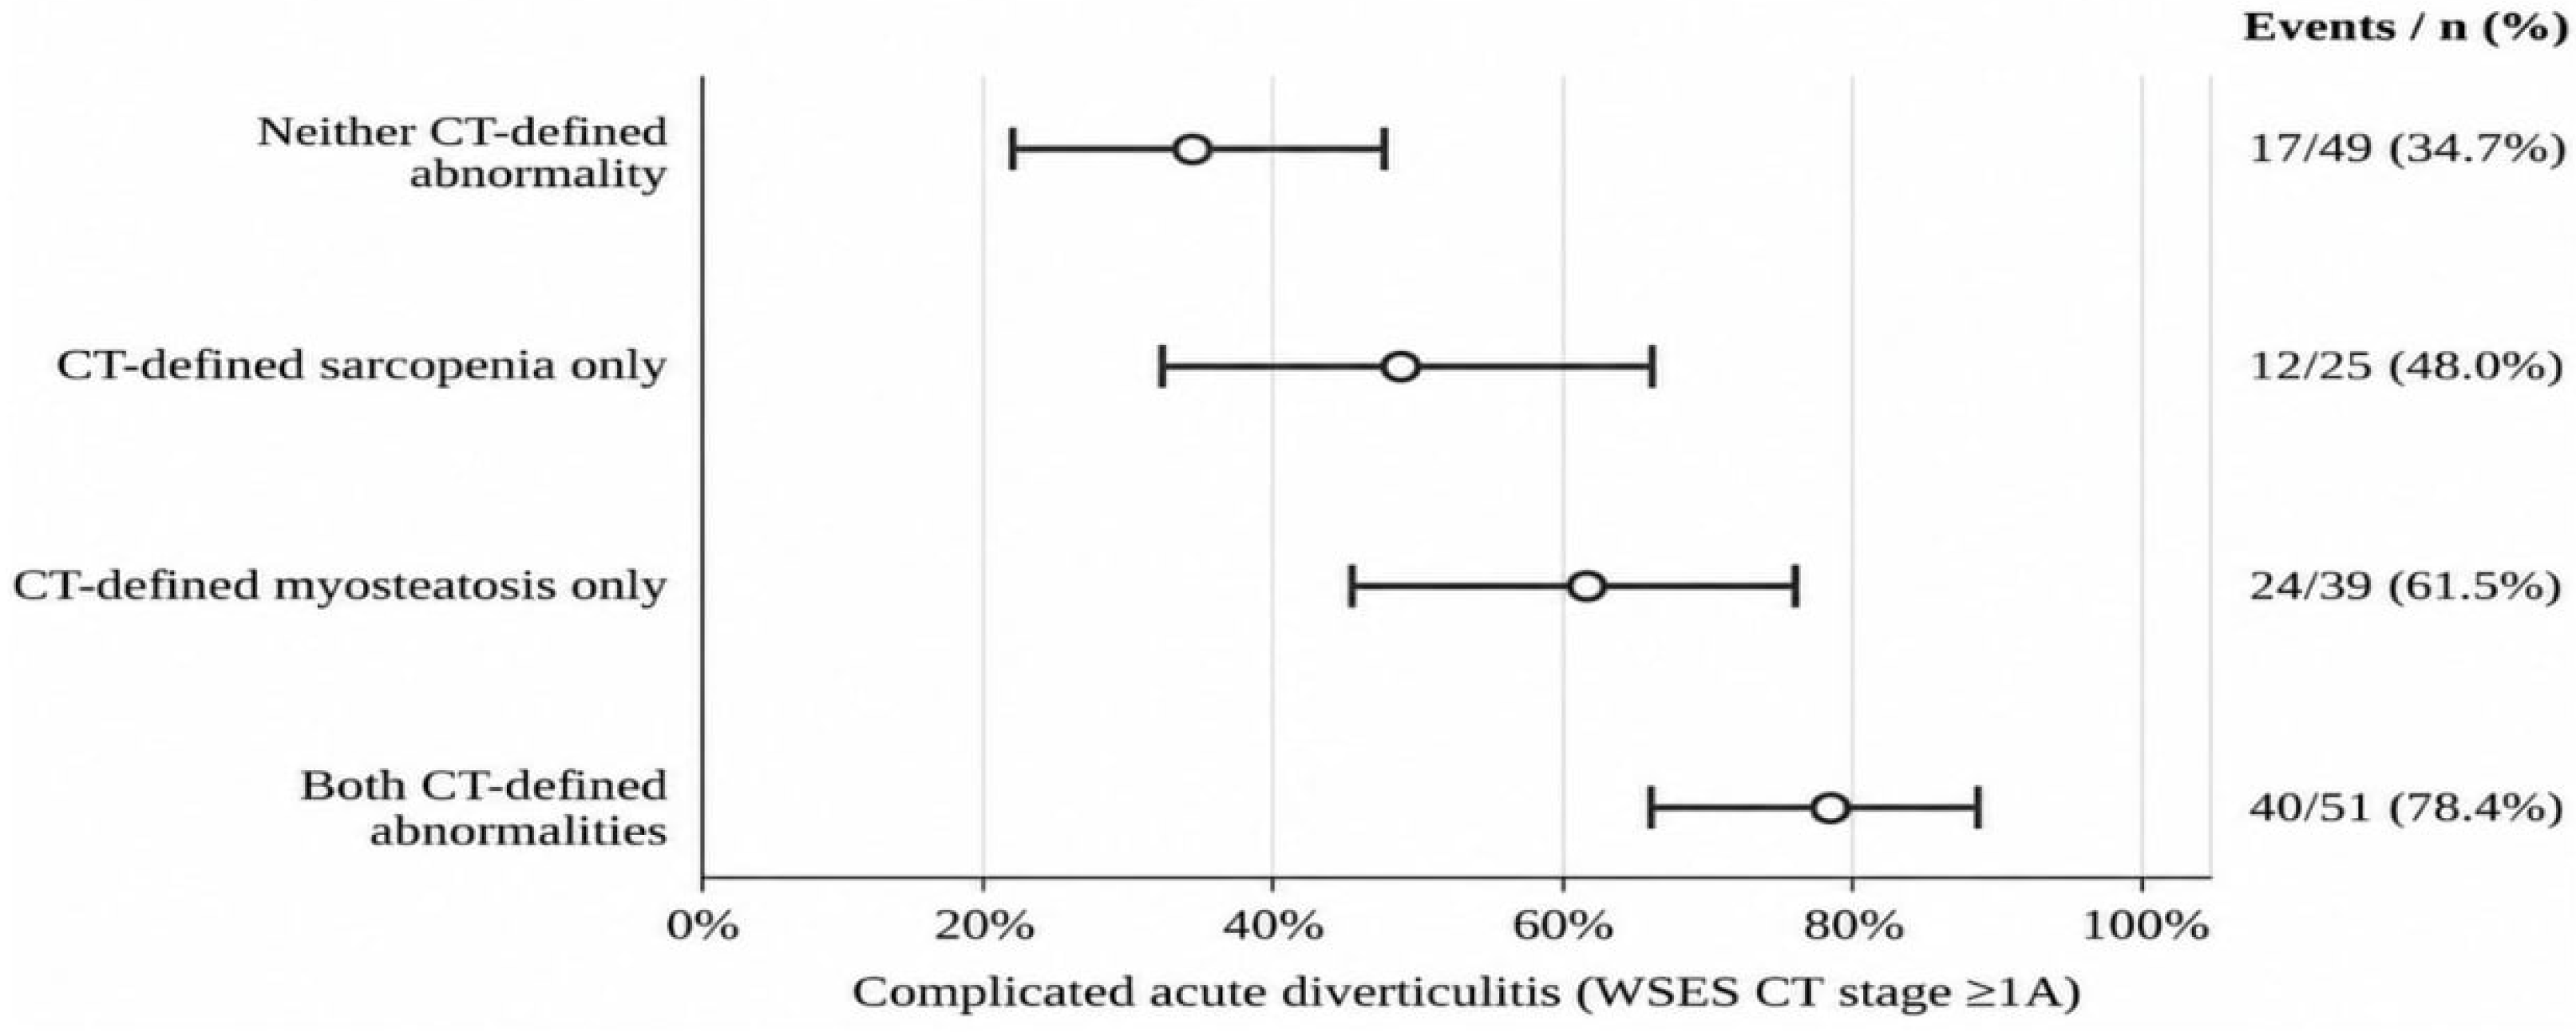
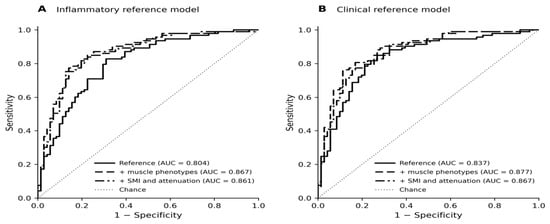
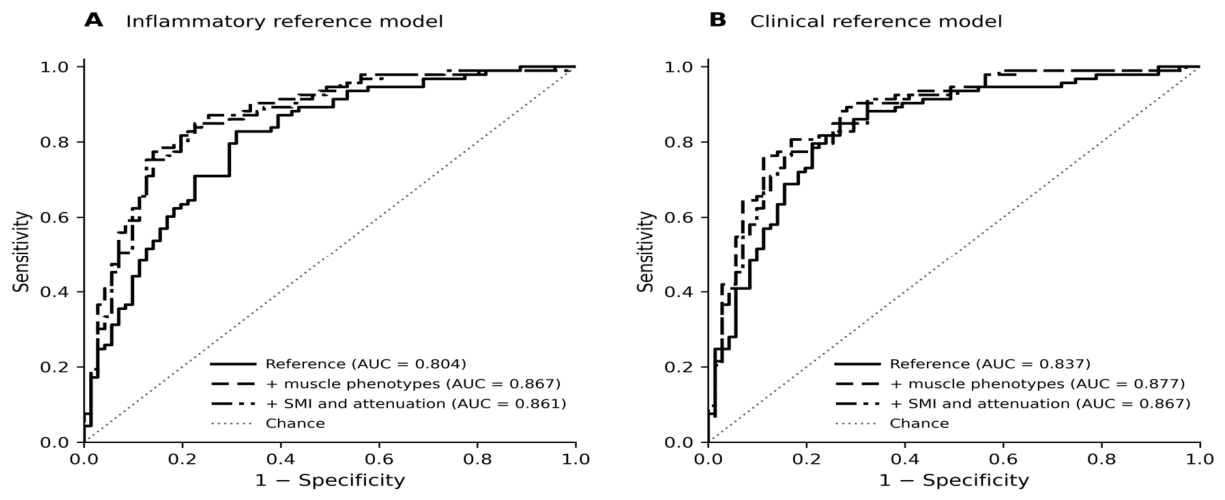
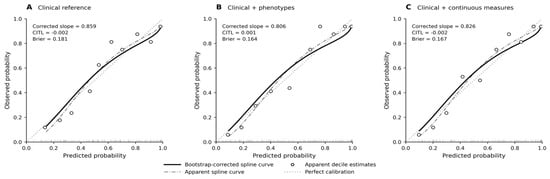
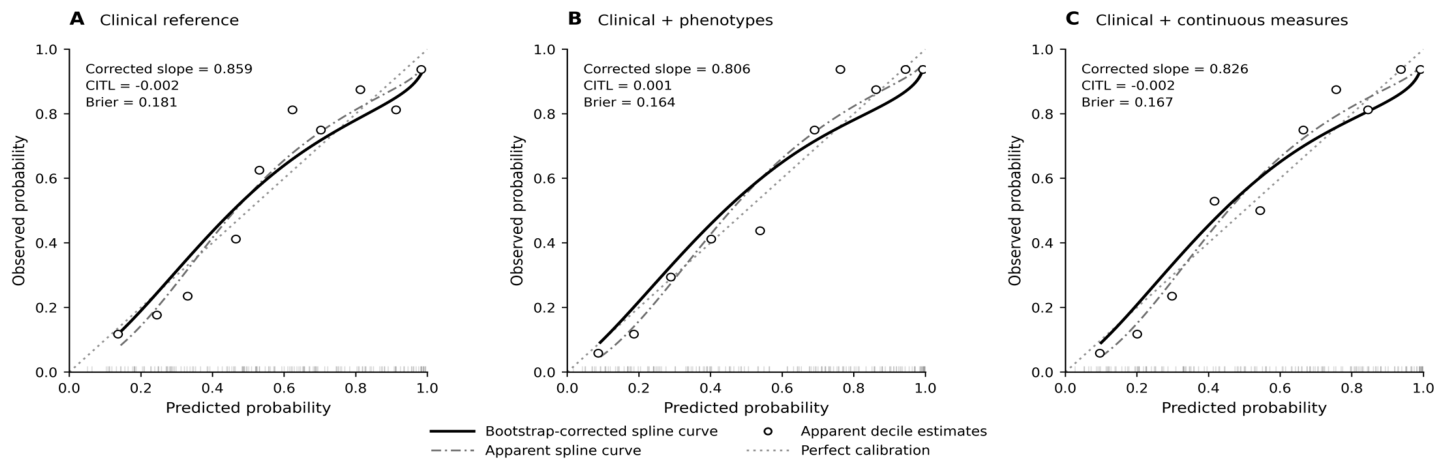

Disclaimer/Publisher’s Note: The statements, opinions and data contained in all publications are solely those of the individual author(s) and contributor(s) and not of MDPI and/or the editor(s). MDPI and/or the editor(s) disclaim responsibility for any injury to people or property resulting from any ideas, methods, instructions or products referred to in the content. |
© 2026 by the authors. Published by MDPI on behalf of the Lithuanian University of Health Sciences. Licensee MDPI, Basel, Switzerland. This article is an open access article distributed under the terms and conditions of the Creative Commons Attribution (CC BY) license.