


Abstract
Drought stress severely limits the growth and productivity of Morus alba, yet the molecular mechanisms underlying its adaptation remain poorly understood. Trehalose, an important osmoprotectant and signaling molecule, plays a key role in plant responses to abiotic stress, and its biosynthesis is primarily regulated by trehalose-6-phosphate synthase (TPS). However, the characteristics and potential functions of TPS genes in M. alba have not been systematically investigated. In this study, we identified 11 TPS genes (MaTPSs) in the M. alba genome and performed comprehensive analyses, including phylogenetic relationships, gene structures, conserved motifs, cis-regulatory elements, and expression profiles. Phylogenetic analysis classified MaTPSs into TPS I and TPS II subfamilies, with closer evolutionary relationships to Populus trichocarpa than to Arabidopsis thaliana. Promoter analysis revealed the presence of multiple stress- and hormone-responsive elements, suggesting their potential involvement in abiotic stress regulation. Physiological measurements showed that drought stress significantly increased trehalose accumulation, with a 1.6-fold increase in leaves and a 2.2-fold increase in roots. Expression profiling further demonstrated that six MaTPS genes were upregulated under drought stress, among which MaTPS4, MaTPS9, MaTPS10, and MaTPS11 exhibited significant induction (approximately 5-, 5-, 8-, and 10-fold, respectively). Correlation analysis further indicated that trehalose accumulation was positively associated with all upregulated MaTPS genes (p < 0.05). Taken together, these results suggest that MaTPS genes may be involved in drought-responsive regulation of trehalose metabolism in M. alba. This study provides a valuable foundation for future functional validation and the genetic improvement of drought tolerance in mulberry.
1. Introduction
As a non-reducing disaccharide (α-D-glucopyranosyl-α-D-glucopyranoside) trehalose is widely distributed in various biological systems such as bacteria, fungi, plants, and animals [1,2]. Trehalose effectively maintains the stability of biomacromolecules and tissues through water binding, water replacement, and vitrification [3,4]. Moreover, Trehalose is massively accumulated and functions as a protectant to preserve cell integrity and viability under cold, drought, heat and salt stresses [5]. In plants, trehalose biosynthesis occurs via the OtsA–OtsB pathway. Trehalose-6-phosphate (Tre6P), the intermediate product in the pathway catalyzed by trehalose-6-phosphate synthase (TPS) and trehalose-6-phosphate phosphatase (TPP), functions as a key signaling molecule modulating plant stress responses [6].
TPS and TPP constitute the major gene families regulating trehalose synthesis, mediating its biosynthesis and contributing to plant stress tolerance [7]. Genome-wide analyses have identified TPS gene families in several plants, including Arabidopsis thaliana [8], rice [9], wheat [10], sesame [11], Prunus mume [12], and Camellia sinensis [13], and have confirmed their widespread induction by abiotic stresses such as drought, high salinity, and low temperature. Recently, 38 MsTPS genes were systematically identified in Medicago sativa [14], and genome-wide studies in peach have highlighted potential roles of TPS genes in carbohydrate metabolism [15]. Functional studies on TPP genes in Solanum lycopersicum revealed that SlTPP3 mediates responses to salt stress [16].
TPS genes exhibit significant divergence in structure, evolution, and expression patterns, underpinning plant adaptation to complex environments. For instance, in Neolamarckia cadamba, Class I NcTPSs contain 14–18 exons, whereas Class II genes contain 2–5 exons [17]. Similarly, in Citrullus lanatus, class I ClTPSs contain 17 exons, while most Class II genes contain 3 exons [18]. Despite structural variation, plant TPS proteins typically contain two conserved domains [19]. Functional specialization is observed among TPS subfamilies: Class I TPS genes enhance stress tolerance, whereas Class II TPS genes act as negative regulators of trehalose content. Expression patterns are also tissue-specific and stress-inducible [15]. For example, in tomato, SlTPP2 and SlTPP3 are highly expressed in leaves, flowers, and fruits, while SlTPP8 is predominantly expressed in flowers and green fruits [16]. In sugarcane, ScTPSs display differential expression under drought, salt, and ABA treatments [20].
Genome-wide identification and functional characterization of TPS genes have been extensively performed in model and crop species such as Arabidopsis, rice, and wheat [8,9,10]. However, such a systematic analysis remains lacking in Morus alba, a woody plant of economic and ecological importance widely cultivated in China [21]. Among environmental challenges, drought stress critically limits the distribution and productivity of M. alba, particularly in arid and semi-arid regions, thereby constraining its industrial and ecological roles [22,23]. Trehalose accumulation can enhance plant growth and development under drought conditions [24,25,26]. Therefore, this study aims to identify the MaTPS gene family by genome-wide analysis and investigate their potential roles in drought tolerance through structural characterization, phylogenetic analysis, and expression profiling under drought stress. These analyses provide a comprehensive framework for understanding the structural features, evolutionary relationships, and stress-responsive expression patterns of MaTPS genes, thereby contributing to explore their potential involvement in trehalose-mediated drought adaptation in M. alba.
2. Materials and Methods
2.1. Plant Materials
One-year-old seedlings of Morus alba L. ‘Baiyu Wang’, obtained from Chengdu, China, were cultivated under field conditions at Chengdu University of Technology, China (104°08′ E, 30°40′ N). Thirty uniform and healthy plants (height: 65 ± 1 cm; basal diameter: 0.225 ± 0.025 cm) were randomly assigned to two groups: a control group (CK) and a drought-stress group (D). Plants in the CK group were irrigated regularly to maintain the soil water content between 50% and 70% relative to field capacity, simulating natural growth conditions. Drought stress was imposed by withholding irrigation in the D group. After 15 days of drought, plants in the D group were rewatered, and rehydration data were recorded on day 20 of the stress treatment.
Mature leaves, stems, and roots were collected from three randomly selected plants per group on days 0, 5, 10, and 15 of the drought treatment, and again on day 5 after rewatering (day 20). All samples were immediately frozen in liquid nitrogen and stored at −80 °C for subsequent analyses.
2.2. Trehalose Content Determination
Trehalose content was determined using a trehalose assay kit (A149-1-1; Jiancheng, Nanjing, China) according to the kit protocol. Samples included leaves, stems, and roots from CK and D groups, as well as leaves collected on days 0, 5, 10, and 15 of drought stress and after rewatering (RW). Plant tissues were ground in liquid nitrogen, and 0.05 g of powder was transferred to a centrifuge tube. Extraction was performed by adding 0.5 mL of extraction buffer and homogenizing on an ice-water bath. Samples were incubated at room temperature for 45 min with gentle shaking 3–5 times, then centrifuged at 8000× g for 10 min at 25 °C. After collecting the supernatant, blanks, standards, and samples were measured following the kit protocol. Each sample was analyzed in three biological replicates. Absorbance was measured at 620 nm using a spectrophotometer. Trehalose content was calculated as follows:
where Ablack, Astandard, and Asample are the OD values of the blank, standard, and sample, respectively; Cstandard is the standard concentration (0.04 μg/mL); Vsample is the total extract volume; W is the tissue weight (0.05 g); and N is the dilution factor of the sample before measurement.
2.3. MaTPS Gene Family Members Identification
The Pfam seed files containing the conserved protein domains (GT20/PF00982 and TPP/PF02358) of TPS were downloaded from the Pfam database (http://pfam-legacy.xfam.org/, accessed on 12 March 2024). These files were used as the source for identifying MaTPSs. The MaTPS gene family sequences were acquired from the NCBI (https://www.ncbi.nlm.nih.gov/, accessed on 12 March 2024). MaTPS gene family amino acid sequences were compared using BLASTP (v2.12.0, NCBI, Bethesda, MD, USA) to whole genome sequence and eligible sequences were selected. These selected sequences were further analyzed through HMMER v3.3.2 (http://hmmer.org/, accessed on 14 March 2024) searches to obtain the final target gene sequences. Redundant sequences and sequences without TPS domains were removed using Blast (https://blast.ncbi.nlm.nih.gov/Blast.cgi, accessed on 16 March 2024) [12].
2.4. Phylogenetic Tree Construction of MaTPS Gene Family
TPS protein sequences of M. alba, Arabidopsis thaliana, and Populus trichocarpa were analyzed by multiple sequence alignment using ClustalX v2.1 (EMBL, Heidelberg, Germany). In MEGA v7.0 (Kumar et al., Arizona State University, Tempe, AZ, USA), using the Poisson correction model and 1000 bootstrap replicates, a phylogenetic tree was constructed by the Neighbor-Joining (NJ) method. The visualization and optimization of the phylogenetic tree were performed using TBtools v2.027 (Chen et al., South China Agricultural University, Guangzhou, China).
2.5. Gene Features Analysis and Subcellular Localization of MaTPSs
Tbtools and ExPASy (https://www.expasy.org/, accessed on 21 September 2024) were employed to obtain the coding sequences (CDS), gene IDs, chromosomal locations, gene lengths, and subsequently physicochemical properties of MaTPSs. Structural and functional analyses were carried out using online tools: transmembrane structure was predicted by TMHMM; signal peptide was identified by SignalP (https://services.healthtech.dtu.dk/services/SignalP-6.0/, accessed on 19 September 2024) [27]; Structural modeling of the protein was conducted using Phyre2 website (https://www.sbg.bio.ic.ac.uk/phyre2/html/page.cgi?id=index, accessed on 2 November 2024); subcellular localization analysis was completed by Plant-mPLoc (http://www.csbio.sjtu.edu.cn/bioinf/plant-multi/, accessed on 13 November 2024); and phosphorylation site of MaTPS proteins was predicted by NetPhos Server (https://services.healthtech.dtu.dk/services/NetPhos-3.1/, accessed on 16 November 2024) [28]. These analyses systematically characterized the MaTPS gene family.
2.6. Gene Structures and Cis-Acting Elements Analysis of MaTPSs
MaTPSs structures were predicted by the Gene Structure Display Server (GSDS 2.0, https://gsds.gao-lab.org/Gsds_help.php, accessed on 16 November 2024) [29]. Based on the genome sequence, the sequences 2000 bp upstream of the ATG start codon of the MaTPSs was extracted as a candidate promoter region. Then, promoter cis-acting elements were predicted by PlantCARE online platform (http://bioinformatics.psb.ugent.be/webtools/plantcare/html/, accessed on 16 November 2024) [28,30], and prediction results were visualized and mapped by TBtools to systematically analyze MaTPS gene family regulatory features [31].
2.7. Protein Conserved Motifs, Domains and Collinearity Analysis of MaTPSs
Conserved structural motifs of MaTPSs were identified via MEME online website (https://meme-suite.org/meme/tools/meme, accessed on 17 November 2024). To further examine conserved structural domains of MaTPSs, TPS protein sequences were analyzed using online Conserved Domain Database (CDD) provided by the NCBI (https://www.ncbi.nlm.nih.gov/cdd, accessed on 17 November 2024). The collinearity analysis of TPS gene family members was performed via MCScanX function in TBtools. This analysis explored the homology of TPS gene family members among M. alba, Arabidopsis, and Populus.
2.8. MaTPSs Expression Patterns in Leaf Tissues Under Different Treatments
Total RNA was isolated from M. alba leaves using the RNAprep Pure Plant Kit (DP441, Tiangen, Beijing, China). RNA concentration and purity were measured using a spectrophotometer (NanoDrop 2000, Thermo Fisher Scientific, Waltham, MA, USA), and RNA integrity was assessed using a Bioanalyzer (Agilent 2100, Agilent Technologies, Santa Clara, CA, USA). FPKM values of MaTPSs in drought-stressed leaf tissues were obtained from 10 days unpublished transcriptome data, and the normal watering group was used as the control (Table S4). The values were normalized using TBtools, and a heatmap of expression patterns was generated.
First-strand cDNA was prepared from total RNA with gDNA removed according to the instructions of the FastKing RT kit (KR116, Tiangen, Beijing, China). The actin gene (M. alba_G0016411) was used as the internal reference because it exhibited stable expression under the experimental conditions. Specific primers for MaTPSs and actin gene were designed following quantitative real-time PCR (qRT-PCR) primer design principles with IDT PrimerQuest (https://sg.idtdna.com/Primerquest/Home/Index, accessed on 23 March 2025). All primer sequences are listed in Table 1. Each 10 µL reaction system consisted of 1 µL of cDNA, 0.2 µL of the forward primer, 0.2 µL of the reverse primer, 5 µL qPCR Master Mix (Lanyun, Beijing, China), and 3.2 µL RNase-free H2O. The reaction parameters of qPCR were 94 °C for 20 s, 40 cycles of 94 °C for 10 s and 56 °C for 20 s, and 56 °C for 60 s. The positive control used a known template containing the target gene, while the negative control included a no-template control (NTC) to detect any potential contamination or nonspecific amplification. All qPCR experiments were performed in three replications. Amplification curves were recorded for all samples following qPCR. Cycle threshold (Ct) values were subsequently determined. The 2−ΔΔCT method was employed to calculate relative expression of differentially expressed MaTPS genes (DEGs).
Table 1.
Primer sequences for qRT-PCR experiments.
2.9. Statistical Analysis
All data were organized in Microsoft Excel and analyzed using SPSS 22.0 (SPSS Inc., Chicago, IL, USA). Data are presented as the mean ± standard deviation (SD) of three biological replicates. Prior to analysis of variance, data were tested for normality (Shapiro–Wilk test) and homogeneity of variance (Levene’s test). Differences among treatment means were evaluated by one-way or two-way ANOVA, as appropriate, followed by Tukey’s multiple comparison test. Different lowercase letters indicate significant differences at p < 0.05. For correlation analysis, single and double asterisks indicate significant correlations at p < 0.05 and p < 0.01, respectively [32].
3. Results
3.1. Trehalose Content in Different Tissues and Drought Periods of M. alba
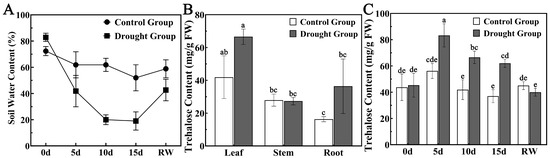
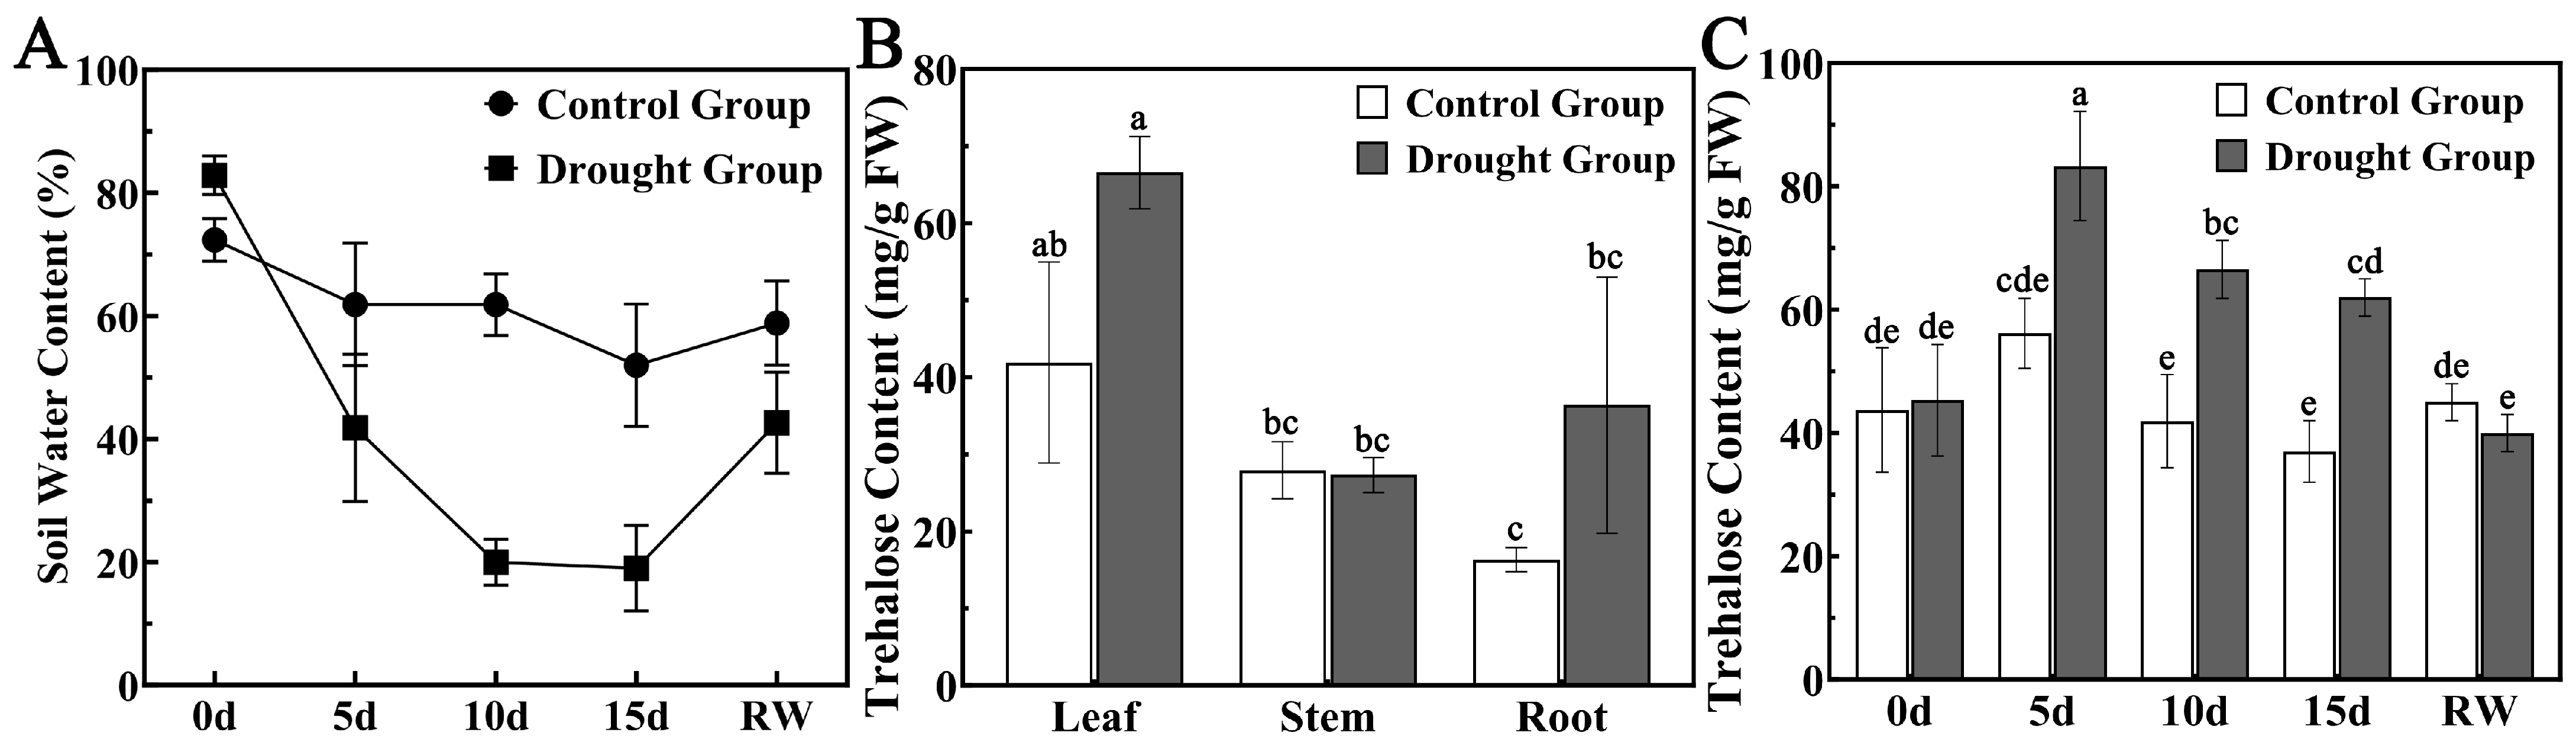
Under drought stress, the soil water content in the control group remained between 50% and 70%. On day 5 of drought stress, the soil water content decreased to approximately 40%, and on days 10 and 15, it remained at 20% (Figure 1A). Significant variation in trehalose content was observed across leaf, stem, and root tissues under drought stress. Drought-stressed M. alba plants exhibited significantly higher trehalose concentrations than the control group, with a 1.6-fold increase in leaf and a 2.2-fold increase in root tissue (Figure 1B). No significant changes were observed in stem tissue under drought stress. In leaf tissue, trehalose content increased continuously with drought stress duration, peaking at day 5 (1.5-fold), and then gradually decreasing (Figure 1C).
Figure 1.
Trehalose content and soil water content in M. alba under drought stress. (A) Soil water content. (B) Trehalose content in different tissues of M. alba. (C) Trehalose content in leaves under drought stress. Different lowercase letters (a, b, c, d, e) indicate significant differences at p < 0.05.
3.2. Identification and Chromosomal Location of MaTPSs
TPS is a key enzyme that catalyzes trehalose biosynthesis. All 11 MaTPS members were contain both PF00982 and PF02358 domains. Their lengths differ widely, and MaTPS5 is the longest at 24,333 bp, while MaTPS1 is the shortest at 3915 bp (Table S1). Physicochemical properties analysis of MaTPS proteins was performed, including isoelectric points (pI, 5.58 to 6.66) and molecular weights (MW, 96.146 to 105.357 kDa) (Table 2). Grand average of hydropathicity (GRAVY) of MaTPS proteins was −0.208, suggesting that all are hydrophilic proteins (Figure S1). They lack transmembrane domains and contain no signal peptides (Figure S2). Phosphorylation is a key regulatory mechanism for protein activity and stability in plants. Our analysis revealed greater sequence diversity in the N- and C-terminal regions of MaTPS proteins compared to the conserved central domain. Multiple phosphorylation sites, including serine, threonine, and tyrosine residues, were identified (Table S2).
Table 2.
Physicochemical Properties of MaTPS Proteins.
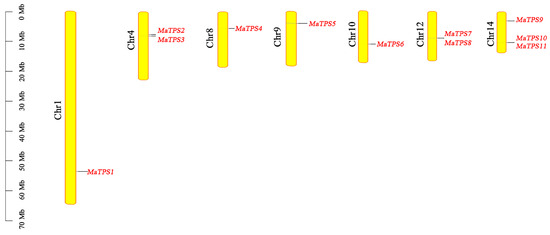
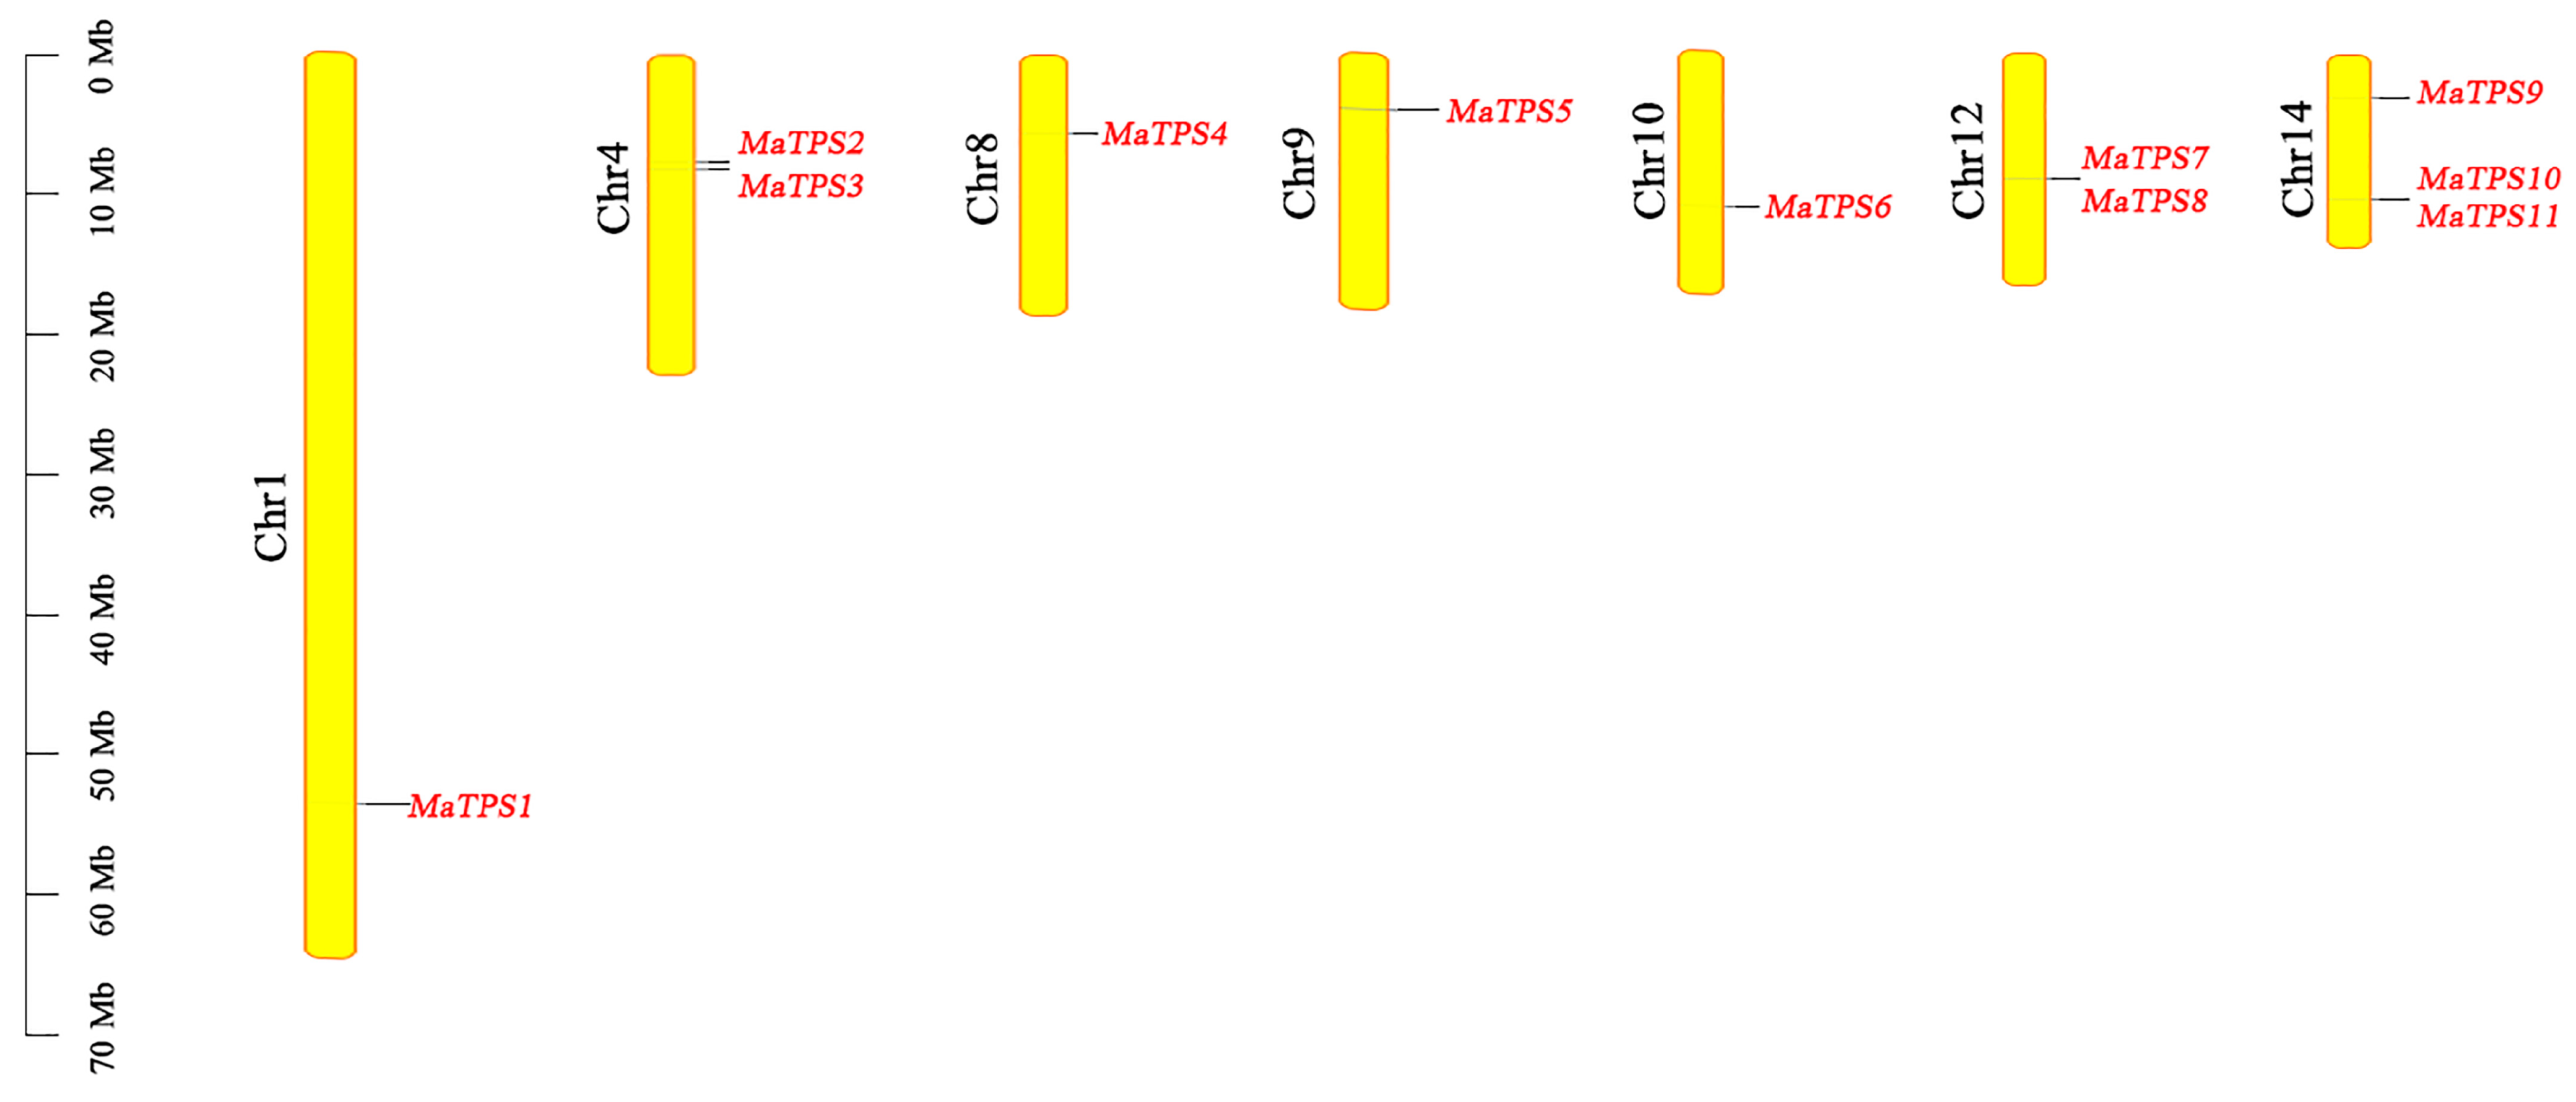
Subcellular localization prediction indicated that most MaTPSs were predicted to localize to vacuole and chloroplast, whereas MaTPS2 localized to cytoplasm (Table S3). These localization patterns suggest functional diversification among the MaTPS family members. Additionally, MaTPS proteins share conserved structural architectures, with particularly close superimposition observed between MaTPS7/MaTPS8 and MaTPS10/MaTPS11 (Figure S3). MaTPSs are distributed on chromosomes Chr1 (MaTPS1), Chr4 (MaTPS2,3), Chr8 (MaTPS4), Chr9 (MaTPS5), Chr10 (MaTPS6), Chr12 (MaTPS7,8), and Chr14 (MaTPS9,10,11) according to the M. alba genome information (Figure 2).
Figure 2.
Chromosomal localization of MaTPSs.
3.3. MaTPS Gene Family Phylogenetic Analysis
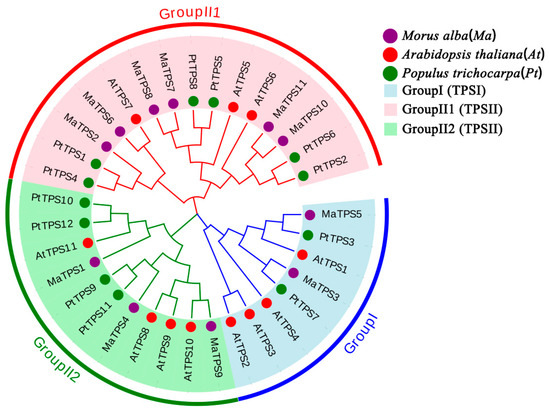
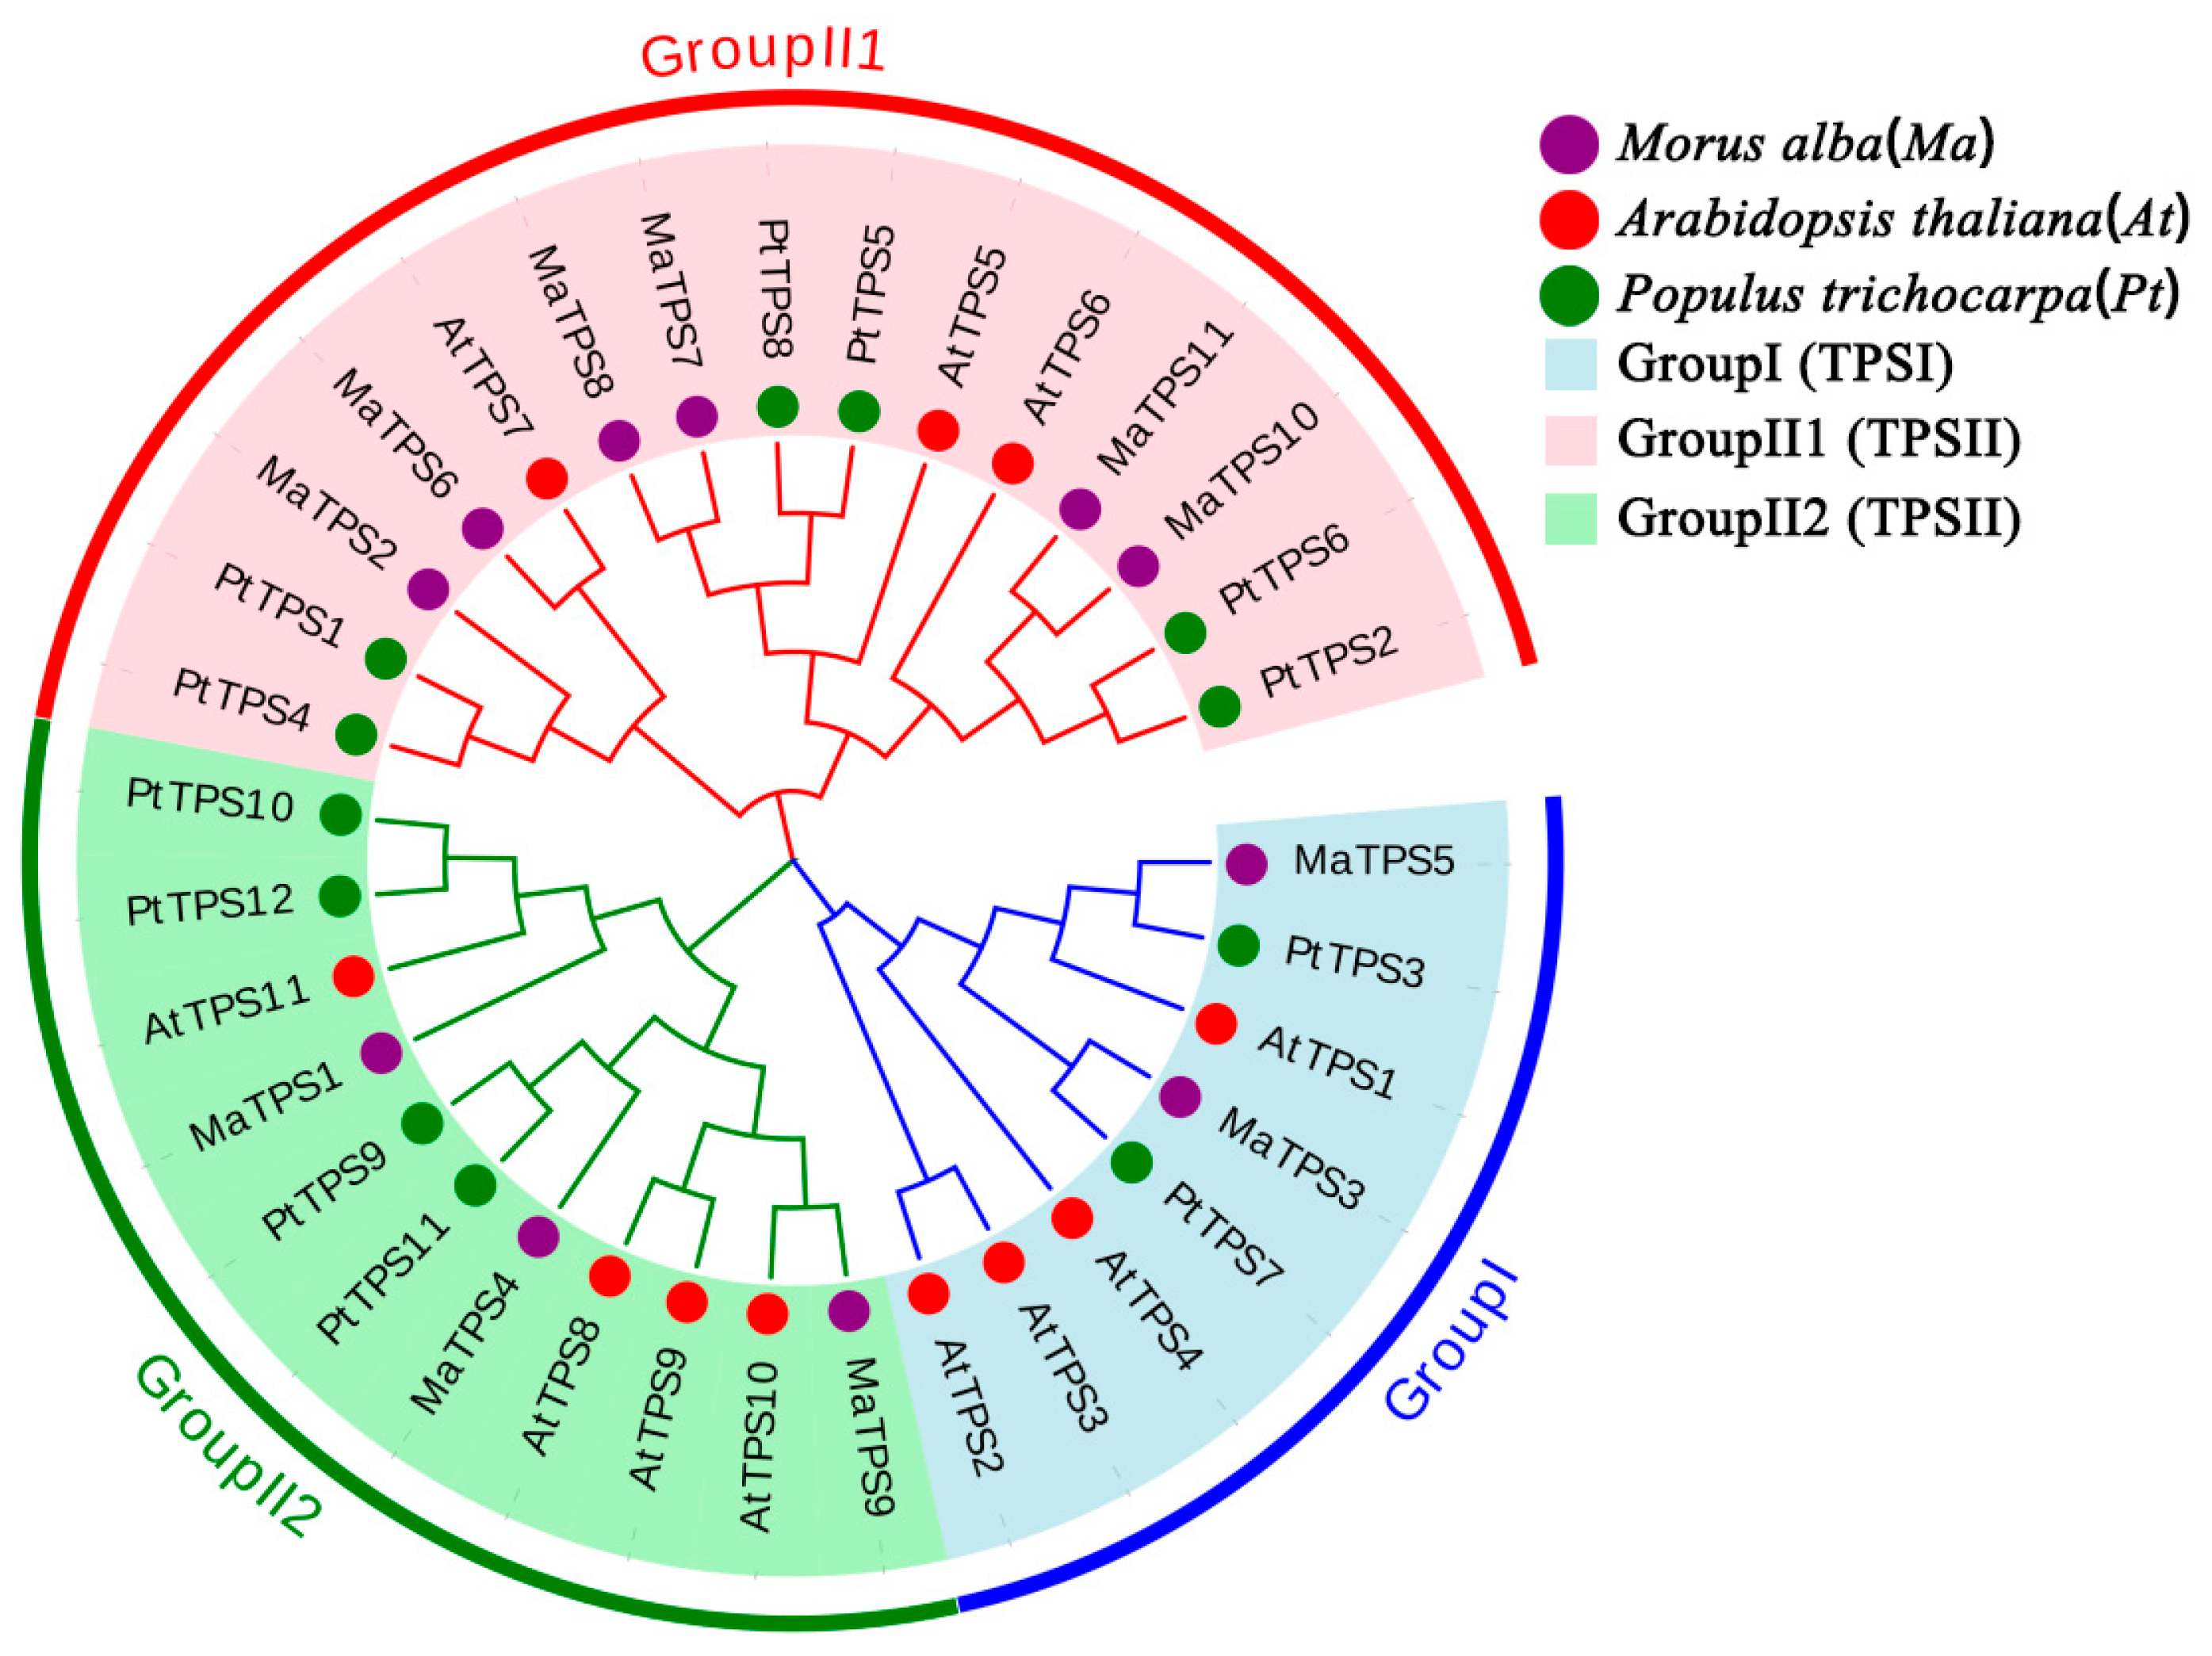
Multiple sequence alignments were performed for AtTPSs, PtTPSs and MaTPSs to characterize MaTPSs family evolutionary relationships. 34 TPSs could be classified into TPS I (Group I) and TPS II (Group II1 and Group II2) subfamilies (Figure 3). Specifically, TPS I included four AtTPSs, two PtTPSs, and two MaTPSs. TPS II consisted of seven AtTPSs, ten PtTPSs, and nine MaTPSs. TPS II was dominant subfamily with nine MaTPSs; TPS I contained only MaTPS3 and MaTPS5. The phylogenetic tree shows that most MaTPSs cluster with PtTPSs in the same branch, while they are more distantly related to AtTPSs.
Figure 3.
Phylogenetic trees of MaTPSs, AtTPSs, and PtTPSs. The tree is divided into three main groups: Group I (blue region), Group II1 (pink region), and Group II2 (green region). The purple, red, and green circles represent MaTPSs, AtTPSs, and PtTPSs, respectively.
3.4. Gene Structures and Cis-Acting Elements Analyses of MaTPSs
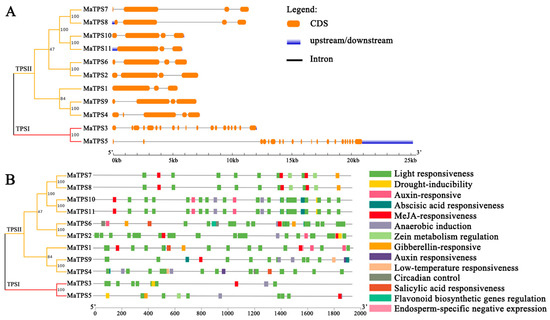
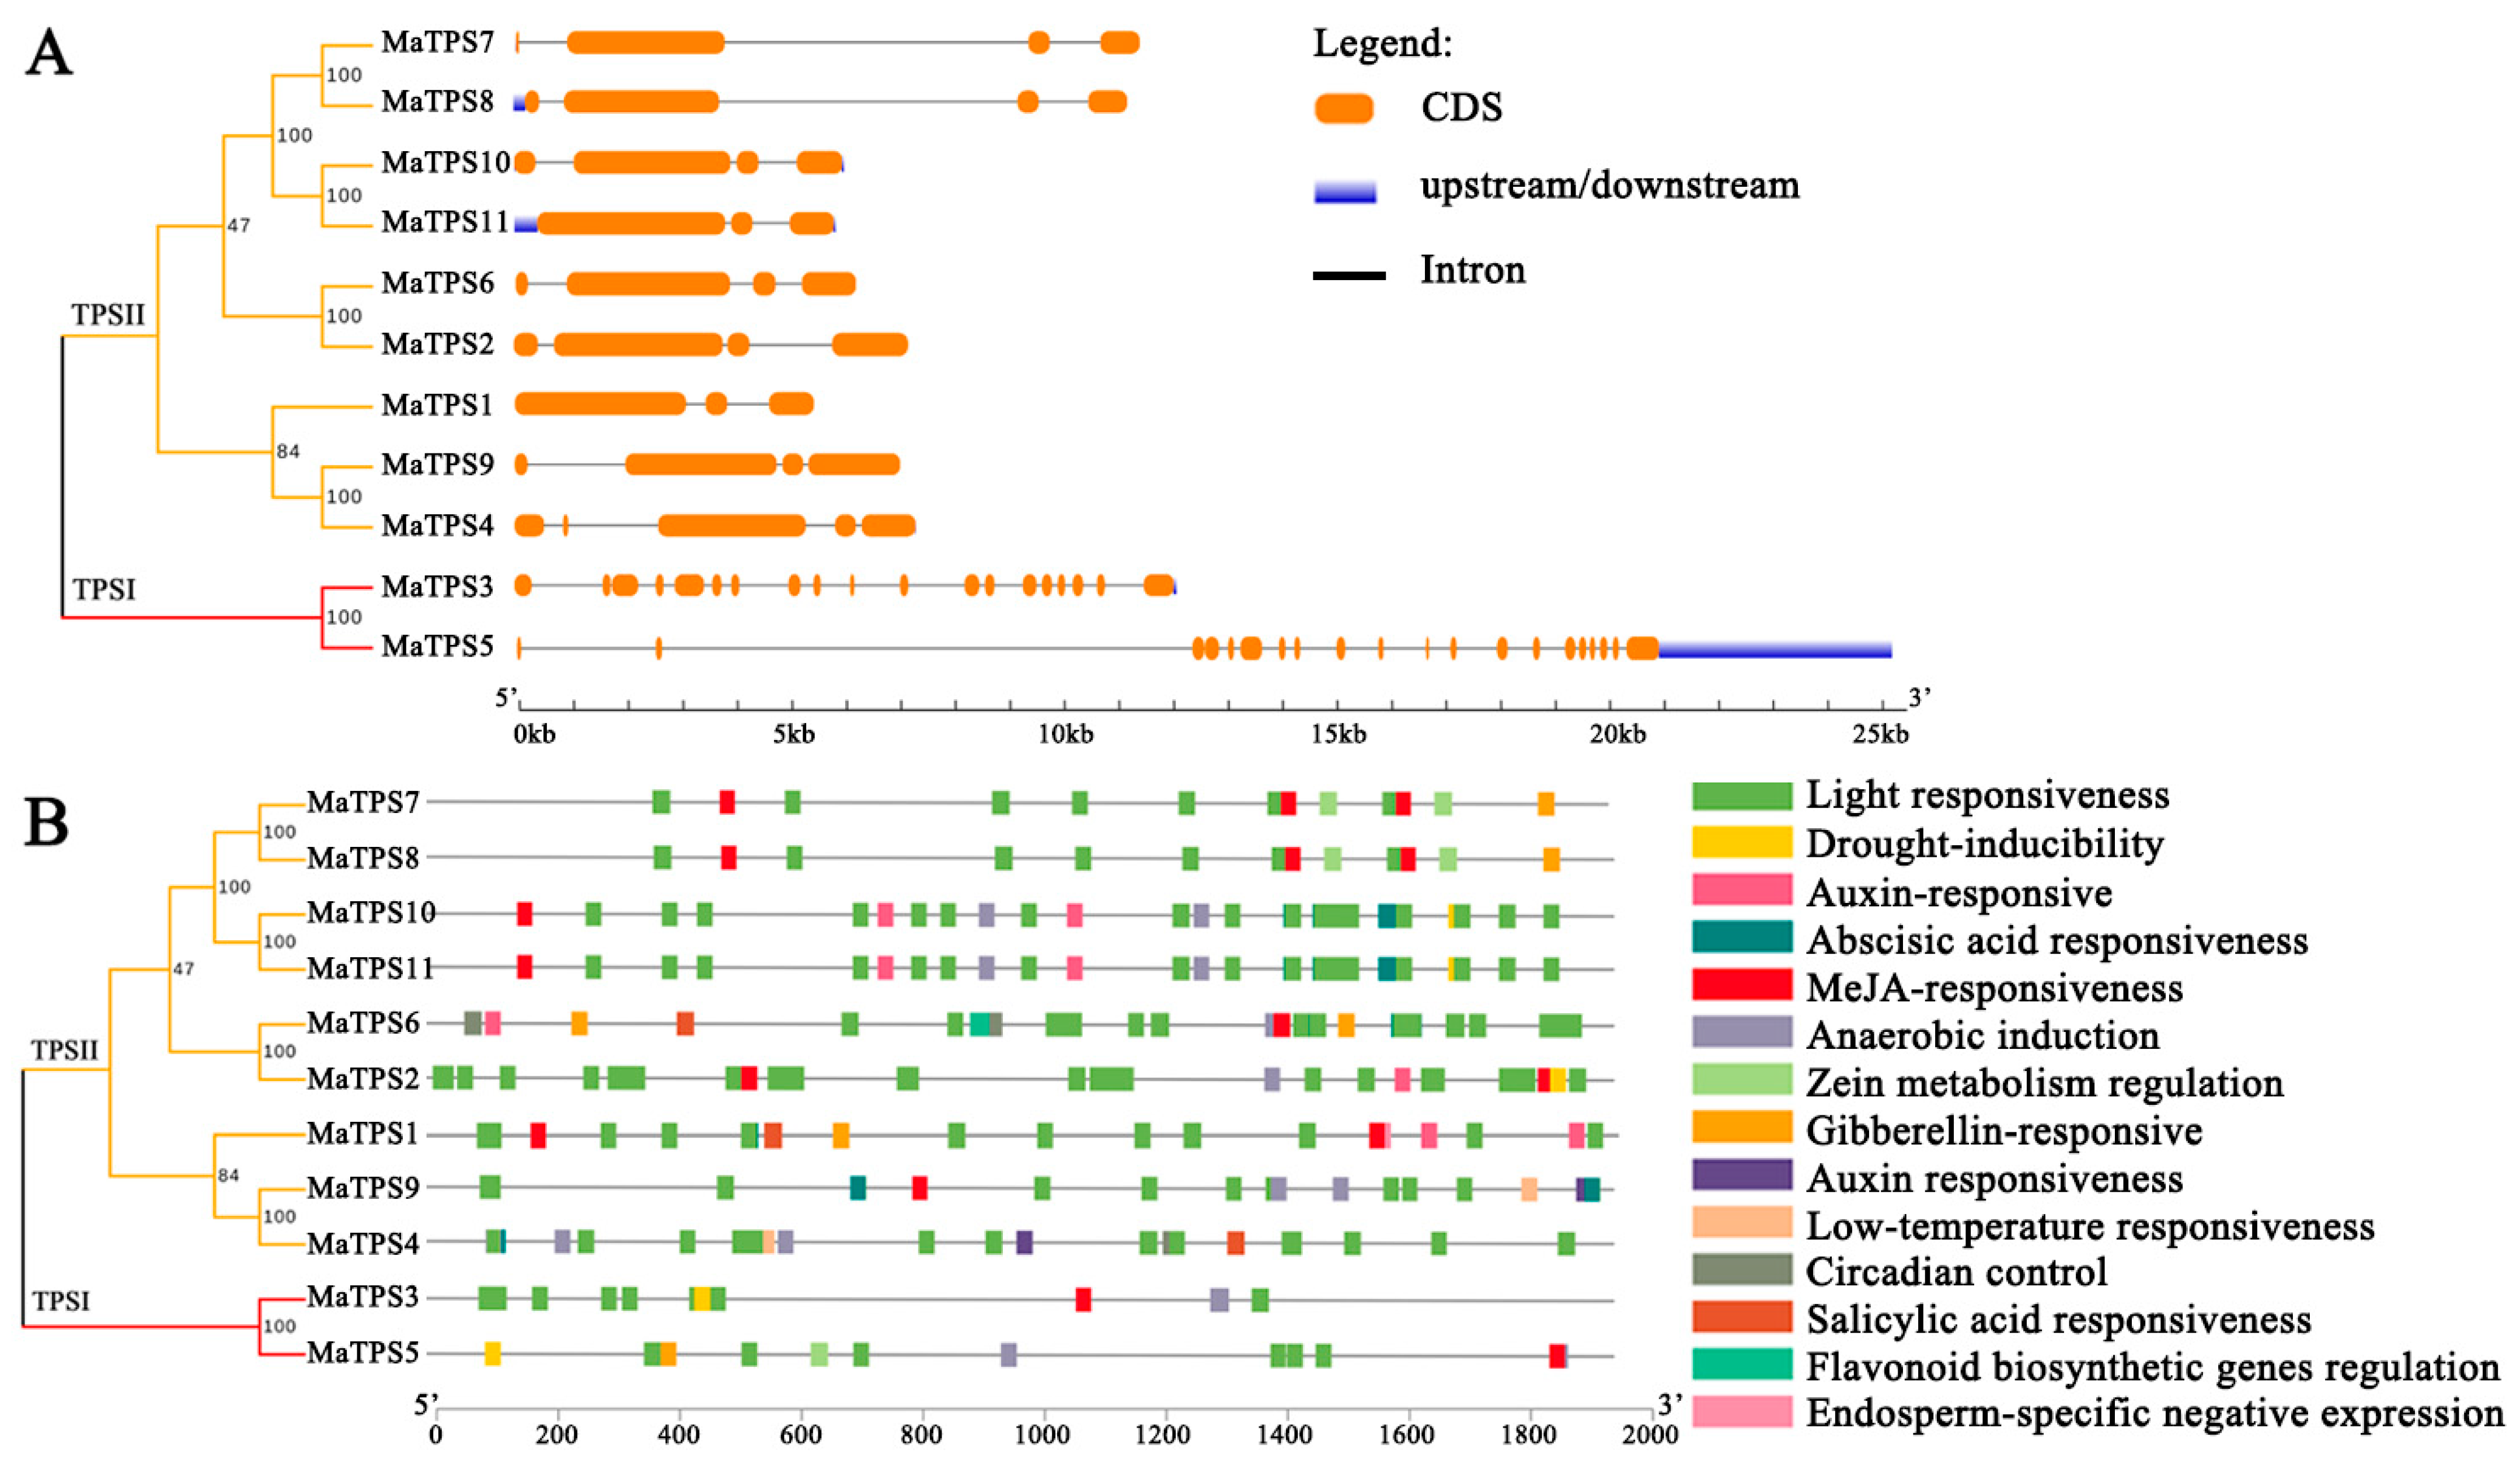
Analysis of intron-exon organization in MaTPSs revealed significant differences between TPS I and TPS II subfamilies, and members of same subfamily exhibited conserved gene structures in M. alba (Figure 4A). Most MaTPSs contain 4 exons, while MaTPS3 and MaTPS5 contain 19 and 20 exons, respectively. 14 types of cis-acting elements were identified in the promoters of MaTPSs, suggesting their involvement in multiple regulatory pathways, including stress responses, phytohormone signaling, circadian regulation, and growth and differentiation (Figure 4B). Notably, MaTPS4 and MaTPS9 contain low-temperature responsive cis-elements, while MaTPS10 and MaTPS11 have the most hormone-responsive elements.
Figure 4.
Gene structures and cis-acting elements of MaTPSs. (A) Organization of exons and introns in MaTPSs. Orange rounded rectangles denote exons, blue rectangles signify untranslated regions (UTRs), and black lines indicate introns. (B) Cis-acting elements in MaTPSs promoters. Distinct colored boxes represent different functional elements, such as light responsiveness (green), drought inducibility (yellow), auxin-responsive (pink), and so on.
3.5. Conserved Motifs, Structural Domains, and Multiple Sequence Alignment Analysis of MaTPSs
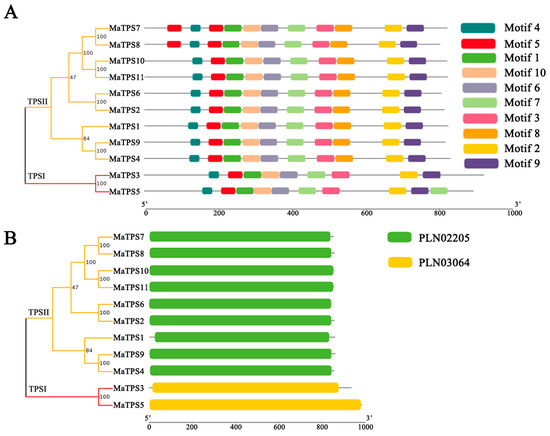
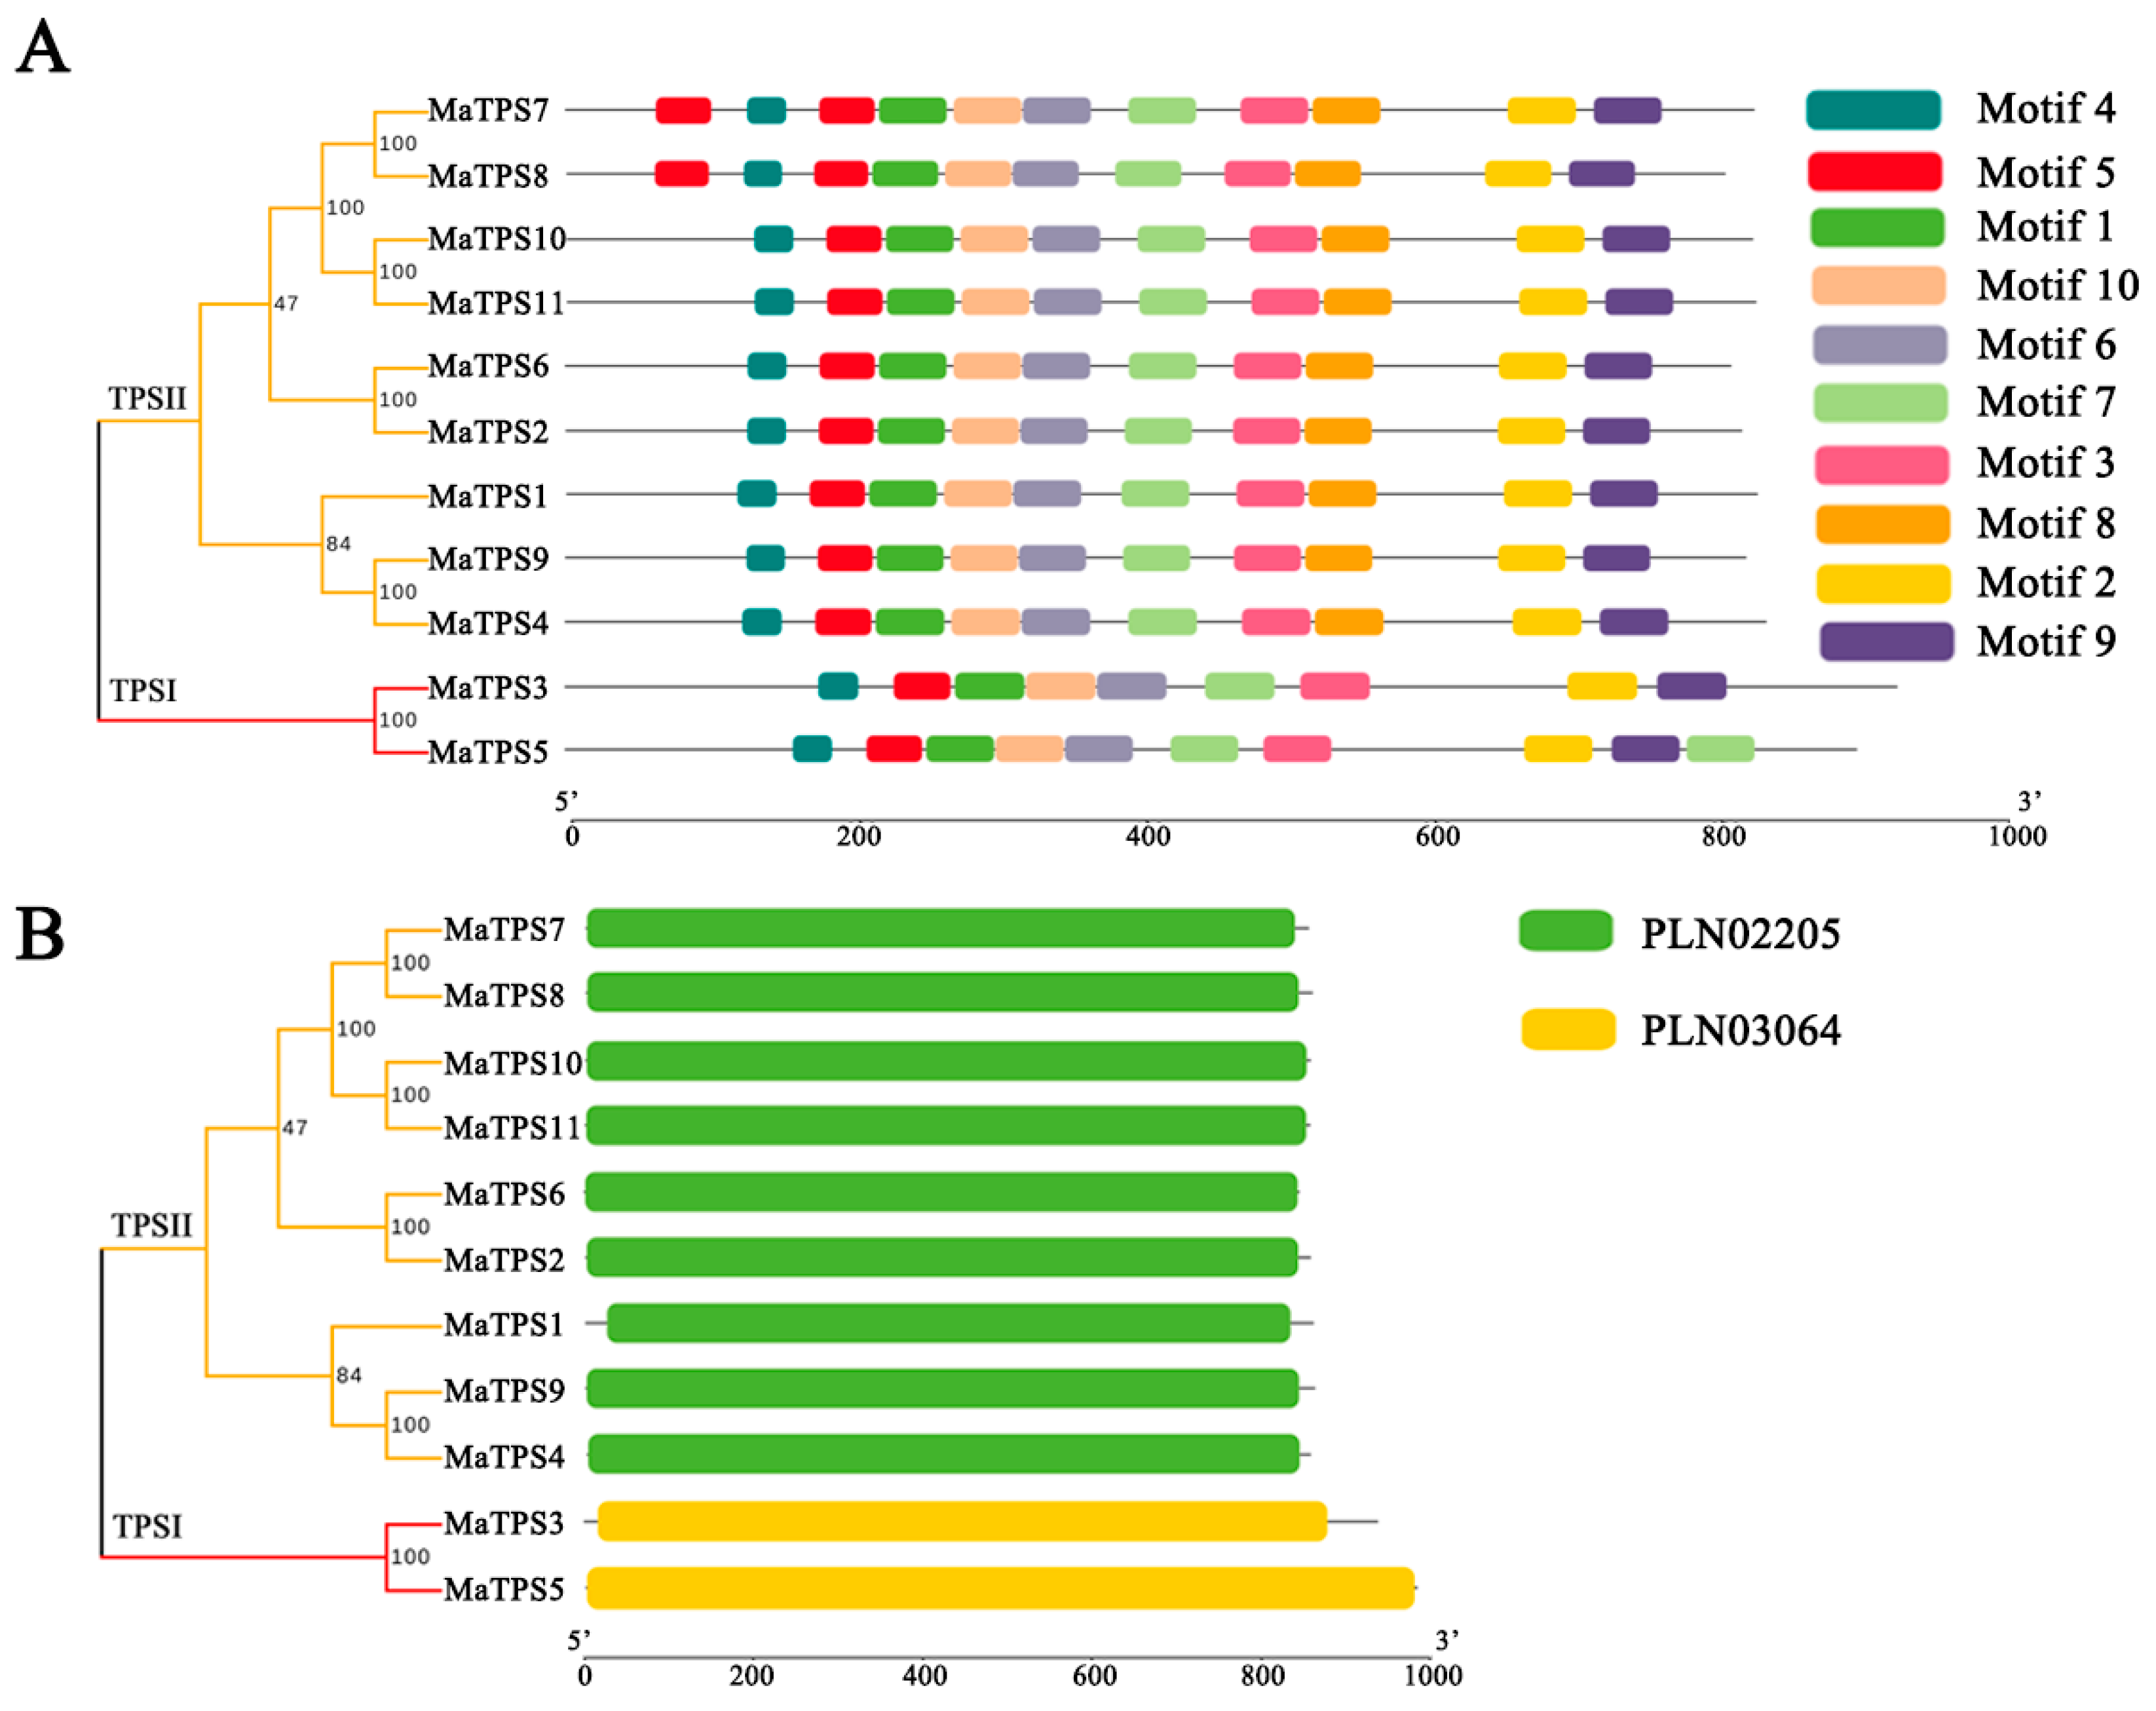
Ten conserved motifs, named Motif 1 to Motif 10, were identified in the MaTPS proteins, with lengths ranging from 29 to 50 amino acids (Figure S4). TPS II subfamily members exhibit similar motif arrangements, indicating their evolutionary conservation. In contrast, TPS I subfamily members lack motif 8 compared to TPS II, which may reflect functional differences between the two subfamilies (Figure 5A). MaTPS proteins contain a single structural domain, with TPS I subfamily members harboring the PLN03064 domain and TPS II subfamily members the PLN02205 domain, both belonging to the UDP-forming domain family (Figure 5B). Multiple sequence alignment of MaTPSs revealed that MaTPS7/MaTPS8 and MaTPS10/MaTPS11 pairs have complete sequence identity, and MaTPS3 and MaTPS5 shared 78.26% similarity (Figure S5).
Figure 5.
Motif distribution and conserved protein domains of MaTPSs. (A) Motif composition of MaTPS proteins. Distinct colored boxes are used to depict the 10 conserved motifs. (B) Protein domain architecture.
3.6. Collinearity Analysis of MaTPSs
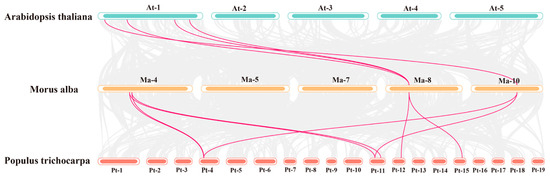
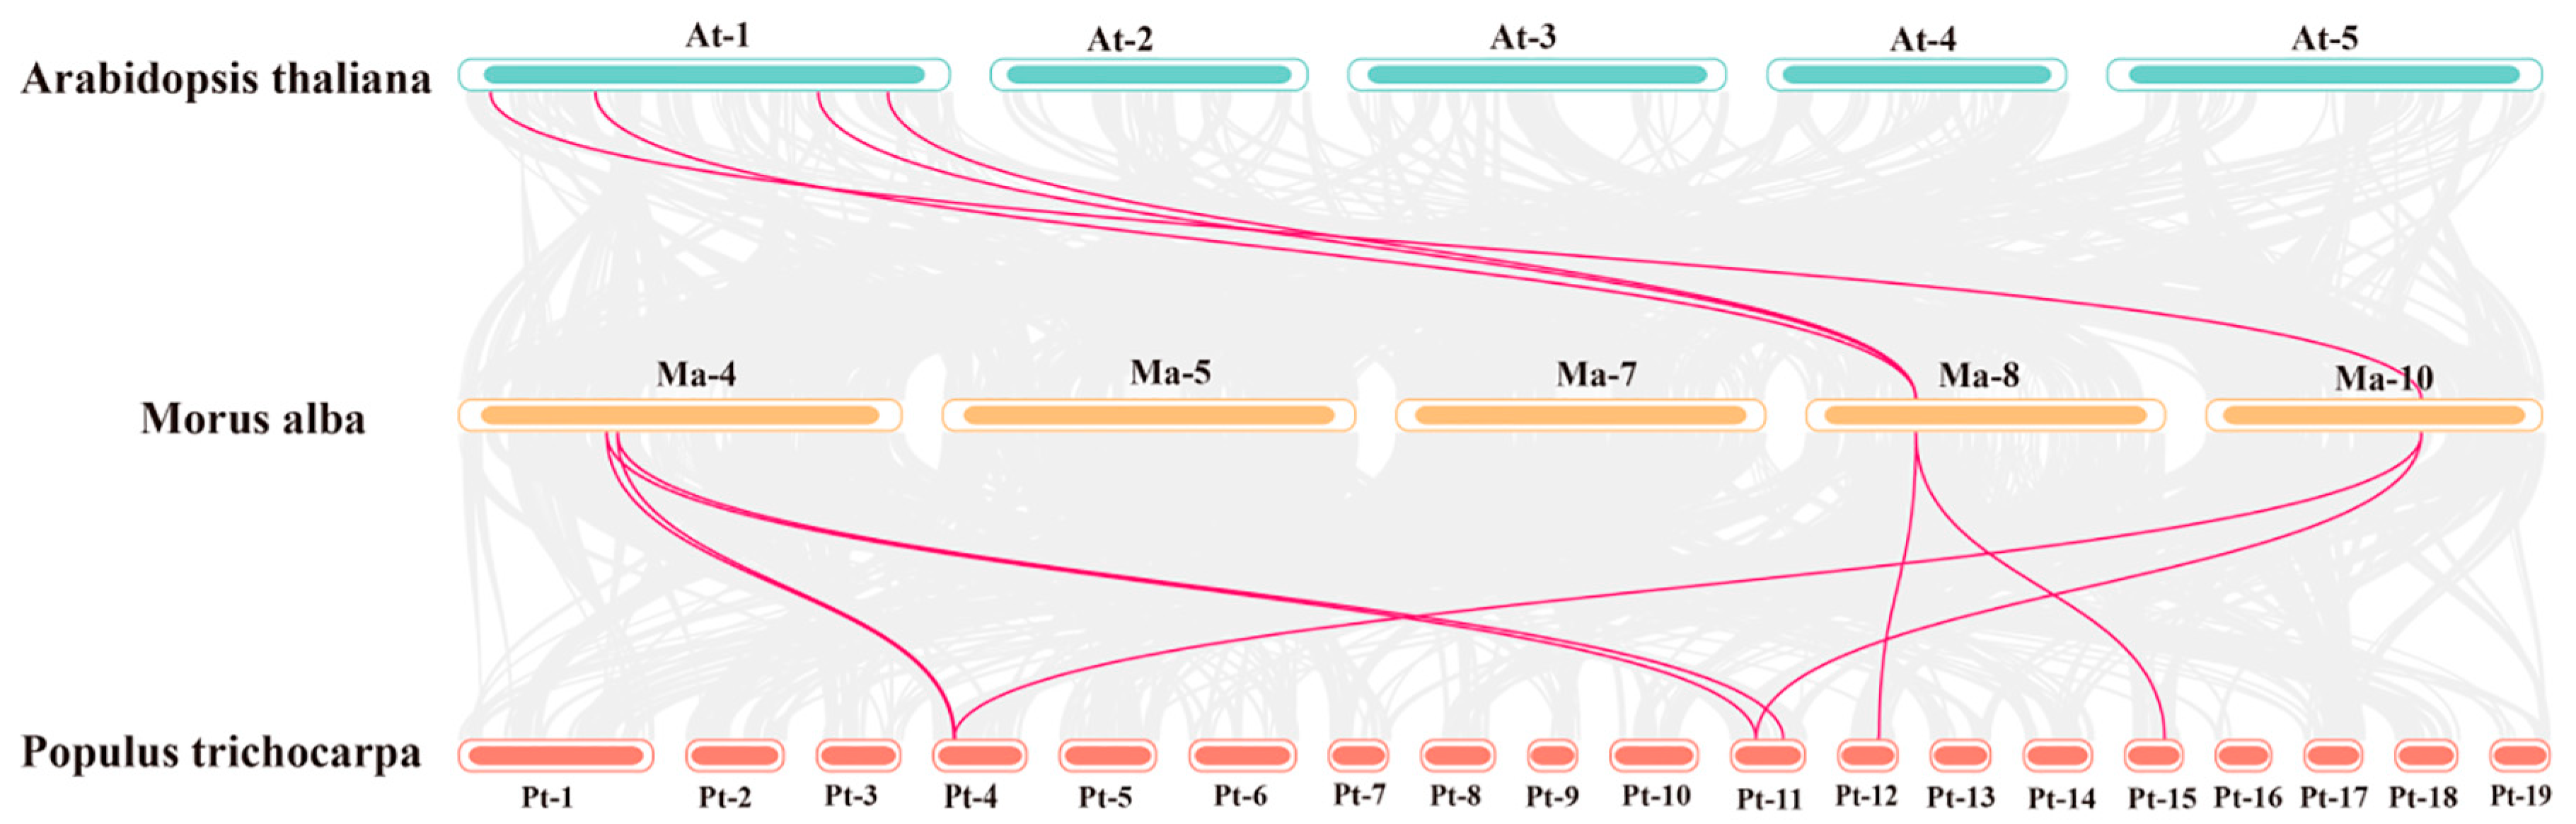
To explore the evolutionary conservation of the MaTPS gene family in M. alba, we performed collinearity analysis by comparing it with the herbaceous model plant Arabidopsis thaliana and the woody model plant Populus (Figure 6). Consistent with the phylogenetic relationships, M. alba is more closely related to Populus, as indicated by a greater number of collinear gene pairs. Specifically, 4 pairs of collinear genes were identified between 11 MaTPSs and 11 AtTPSs, while 8 pairs of collinear genes were detected between 11 MaTPSs and 12 PtTPSs.
Figure 6.
Collinearity Analysis of MaTPSs between Arabidopsis, Populus and M. alba.
3.7. Analysis of MaTPSs Expression Profiles in Leaves
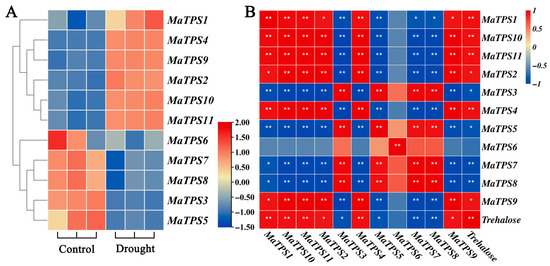
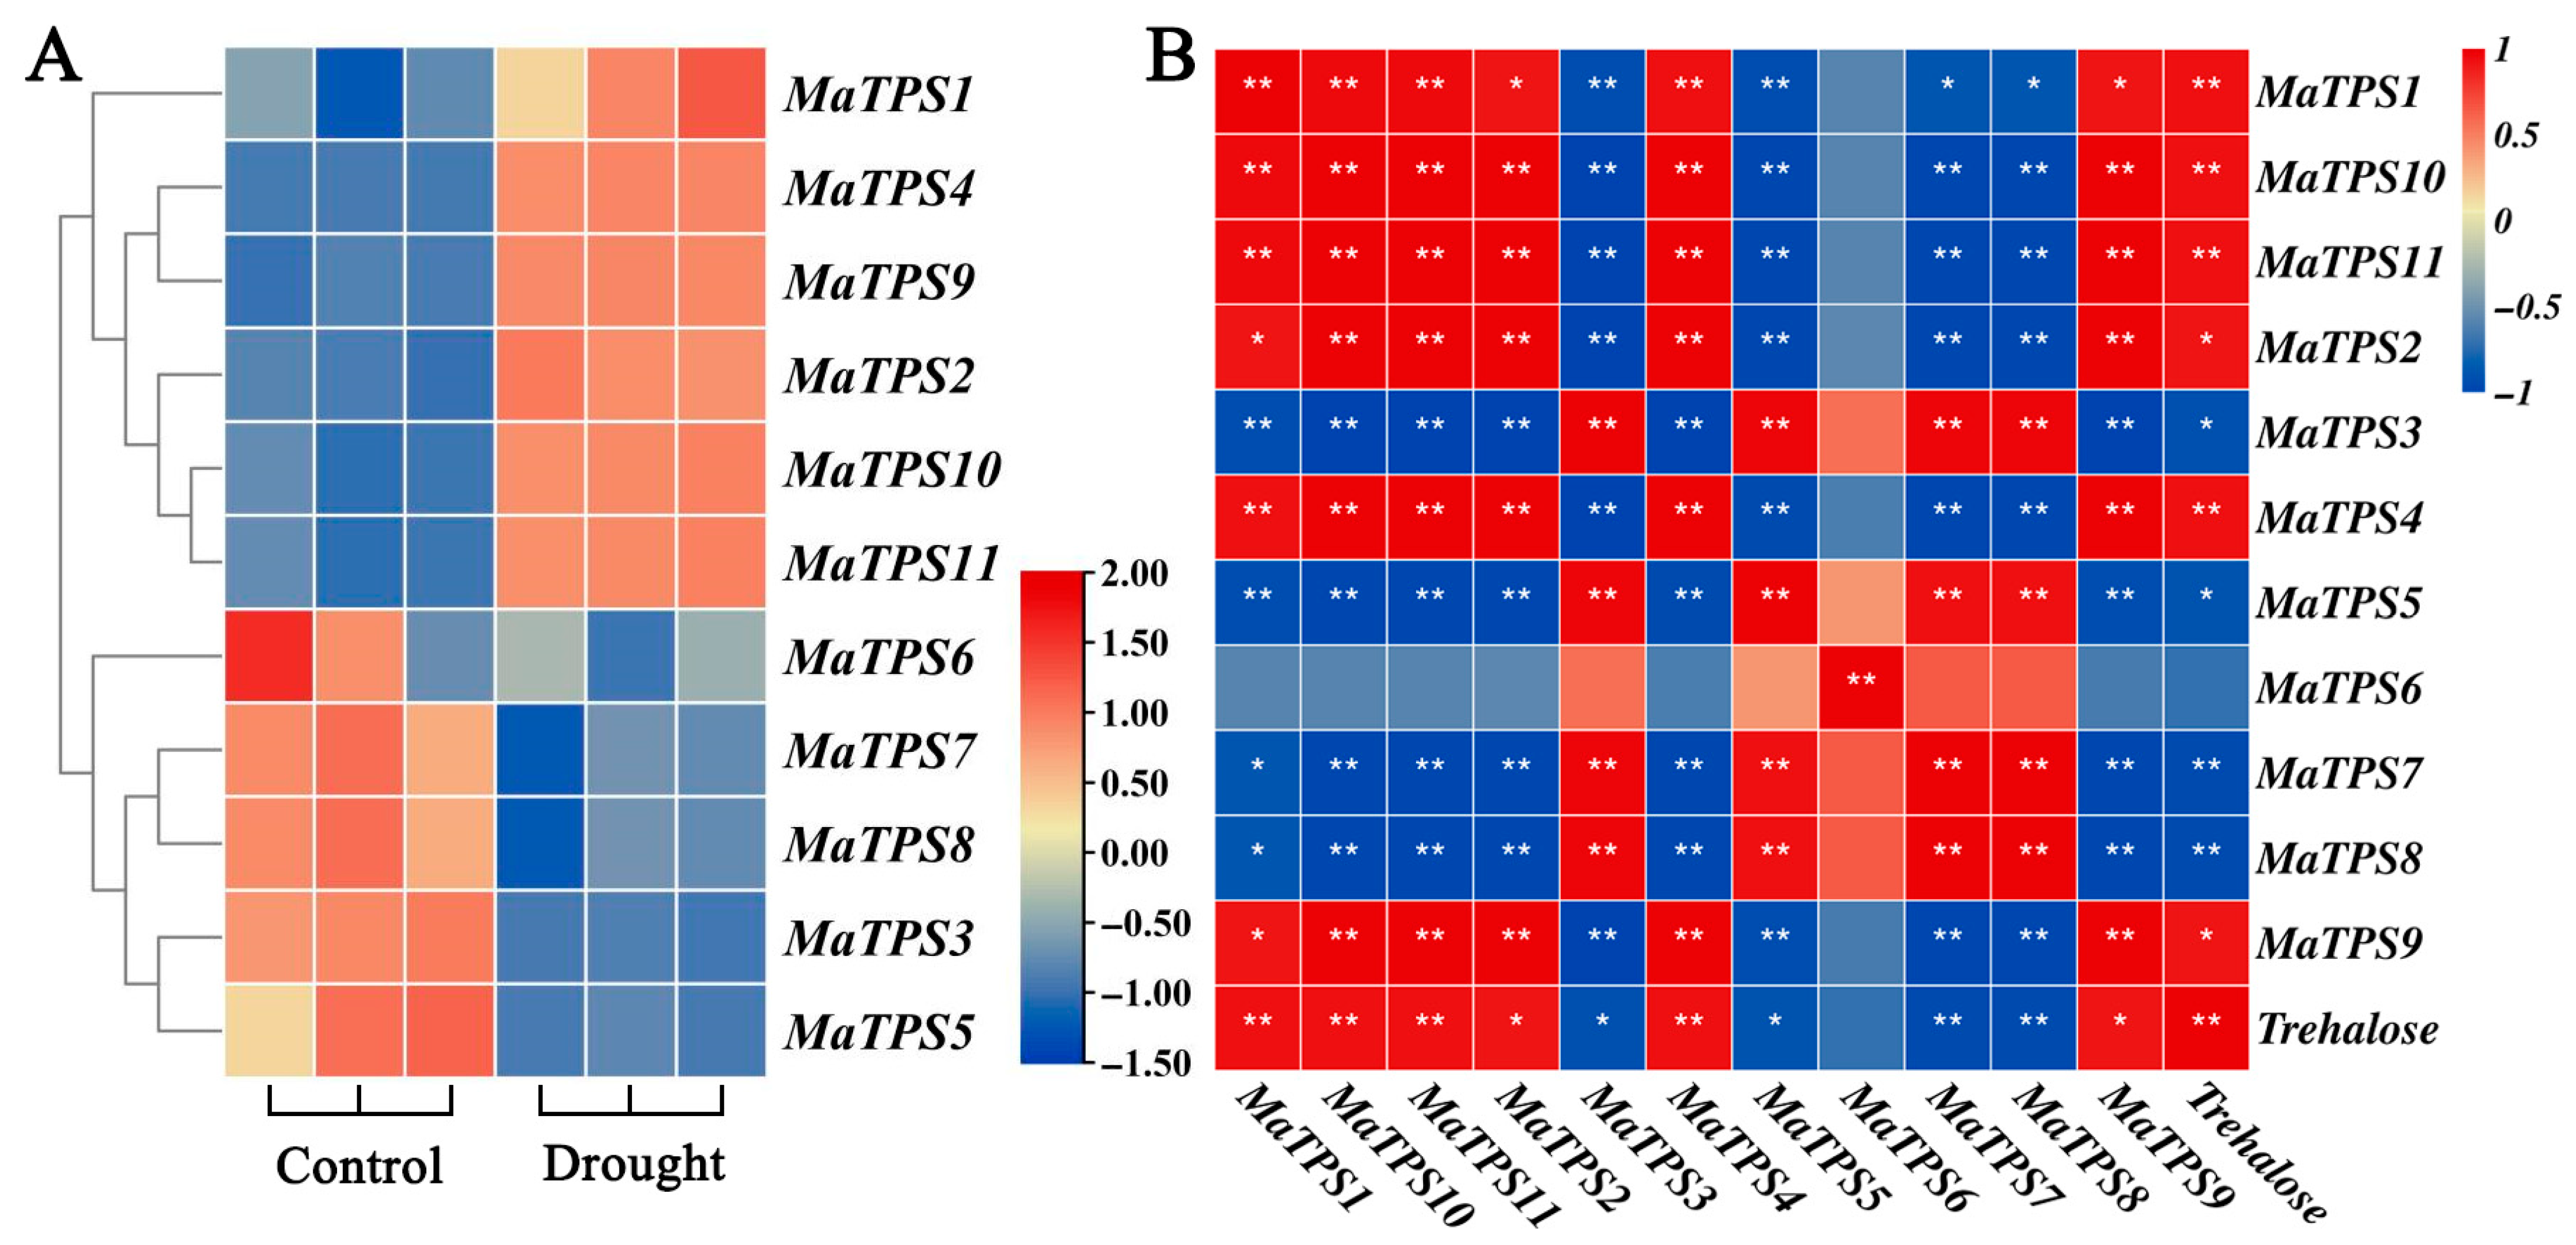
To explore MaTPSs functions under drought stress, expression patterns of MaTPSs in leaf tissues were analyzed (Figure 7A). MaTPS1, MaTPS2, MaTPS4, MaTPS9, MaTPS10, and MaTPS11 were upregulated under drought stress, with MaTPS4 showing the most prominent induction. In contrast, MaTPS3, 5, 6, 7, and 8 were downregulated on day 10 of drought stress, potentially participating in the dynamic regulation of stress responses. MaTPS7/8 and MaTPS10/11 exhibited similar expression change trends under both control and drought stress conditions. Such co-expressed gene pairs may indicate the existence of a coregulatory relationship within the gene regulatory network.
Figure 7.
Expression patterns of MaTPS genes in leaves under drought stress and their correlations with trehalose content. (A) Heatmap of the expression patterns of 11 MaTPS genes. (B) Correlation between trehalose content and the expression of 11 MaTPS genes. * and ** indicate significant correlations at p < 0.05 and p < 0.01, respectively.
To explore the relationship between trehalose accumulation and MaTPS gene expression, correlation analysis was performed between trehalose content and the expression levels of 11 MaTPS genes (Figure 7B). Trehalose content was significantly positively correlated with the expression of MaTPS1, MaTPS2, MaTPS4, MaTPS9, MaTPS10, and MaTPS11 (p < 0.05), with correlation coefficients all greater than 0.90. Particularly strong positive correlations were observed for MaTPS1, MaTPS4, MaTPS10, and MaTPS11 (p < 0.01). In contrast, trehalose content was significantly negatively correlated with the expression of MaTPS3, MaTPS5, MaTPS7, and MaTPS8 (p < 0.05), with particularly strong negative correlations for MaTPS7 and MaTPS8 (p < 0.01).
3.8. Analysis of MaTPSs Expression Patterns Under Drought Stress
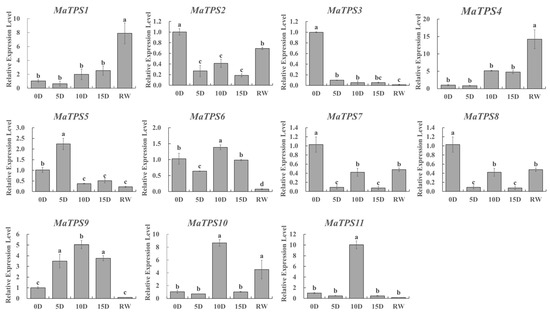
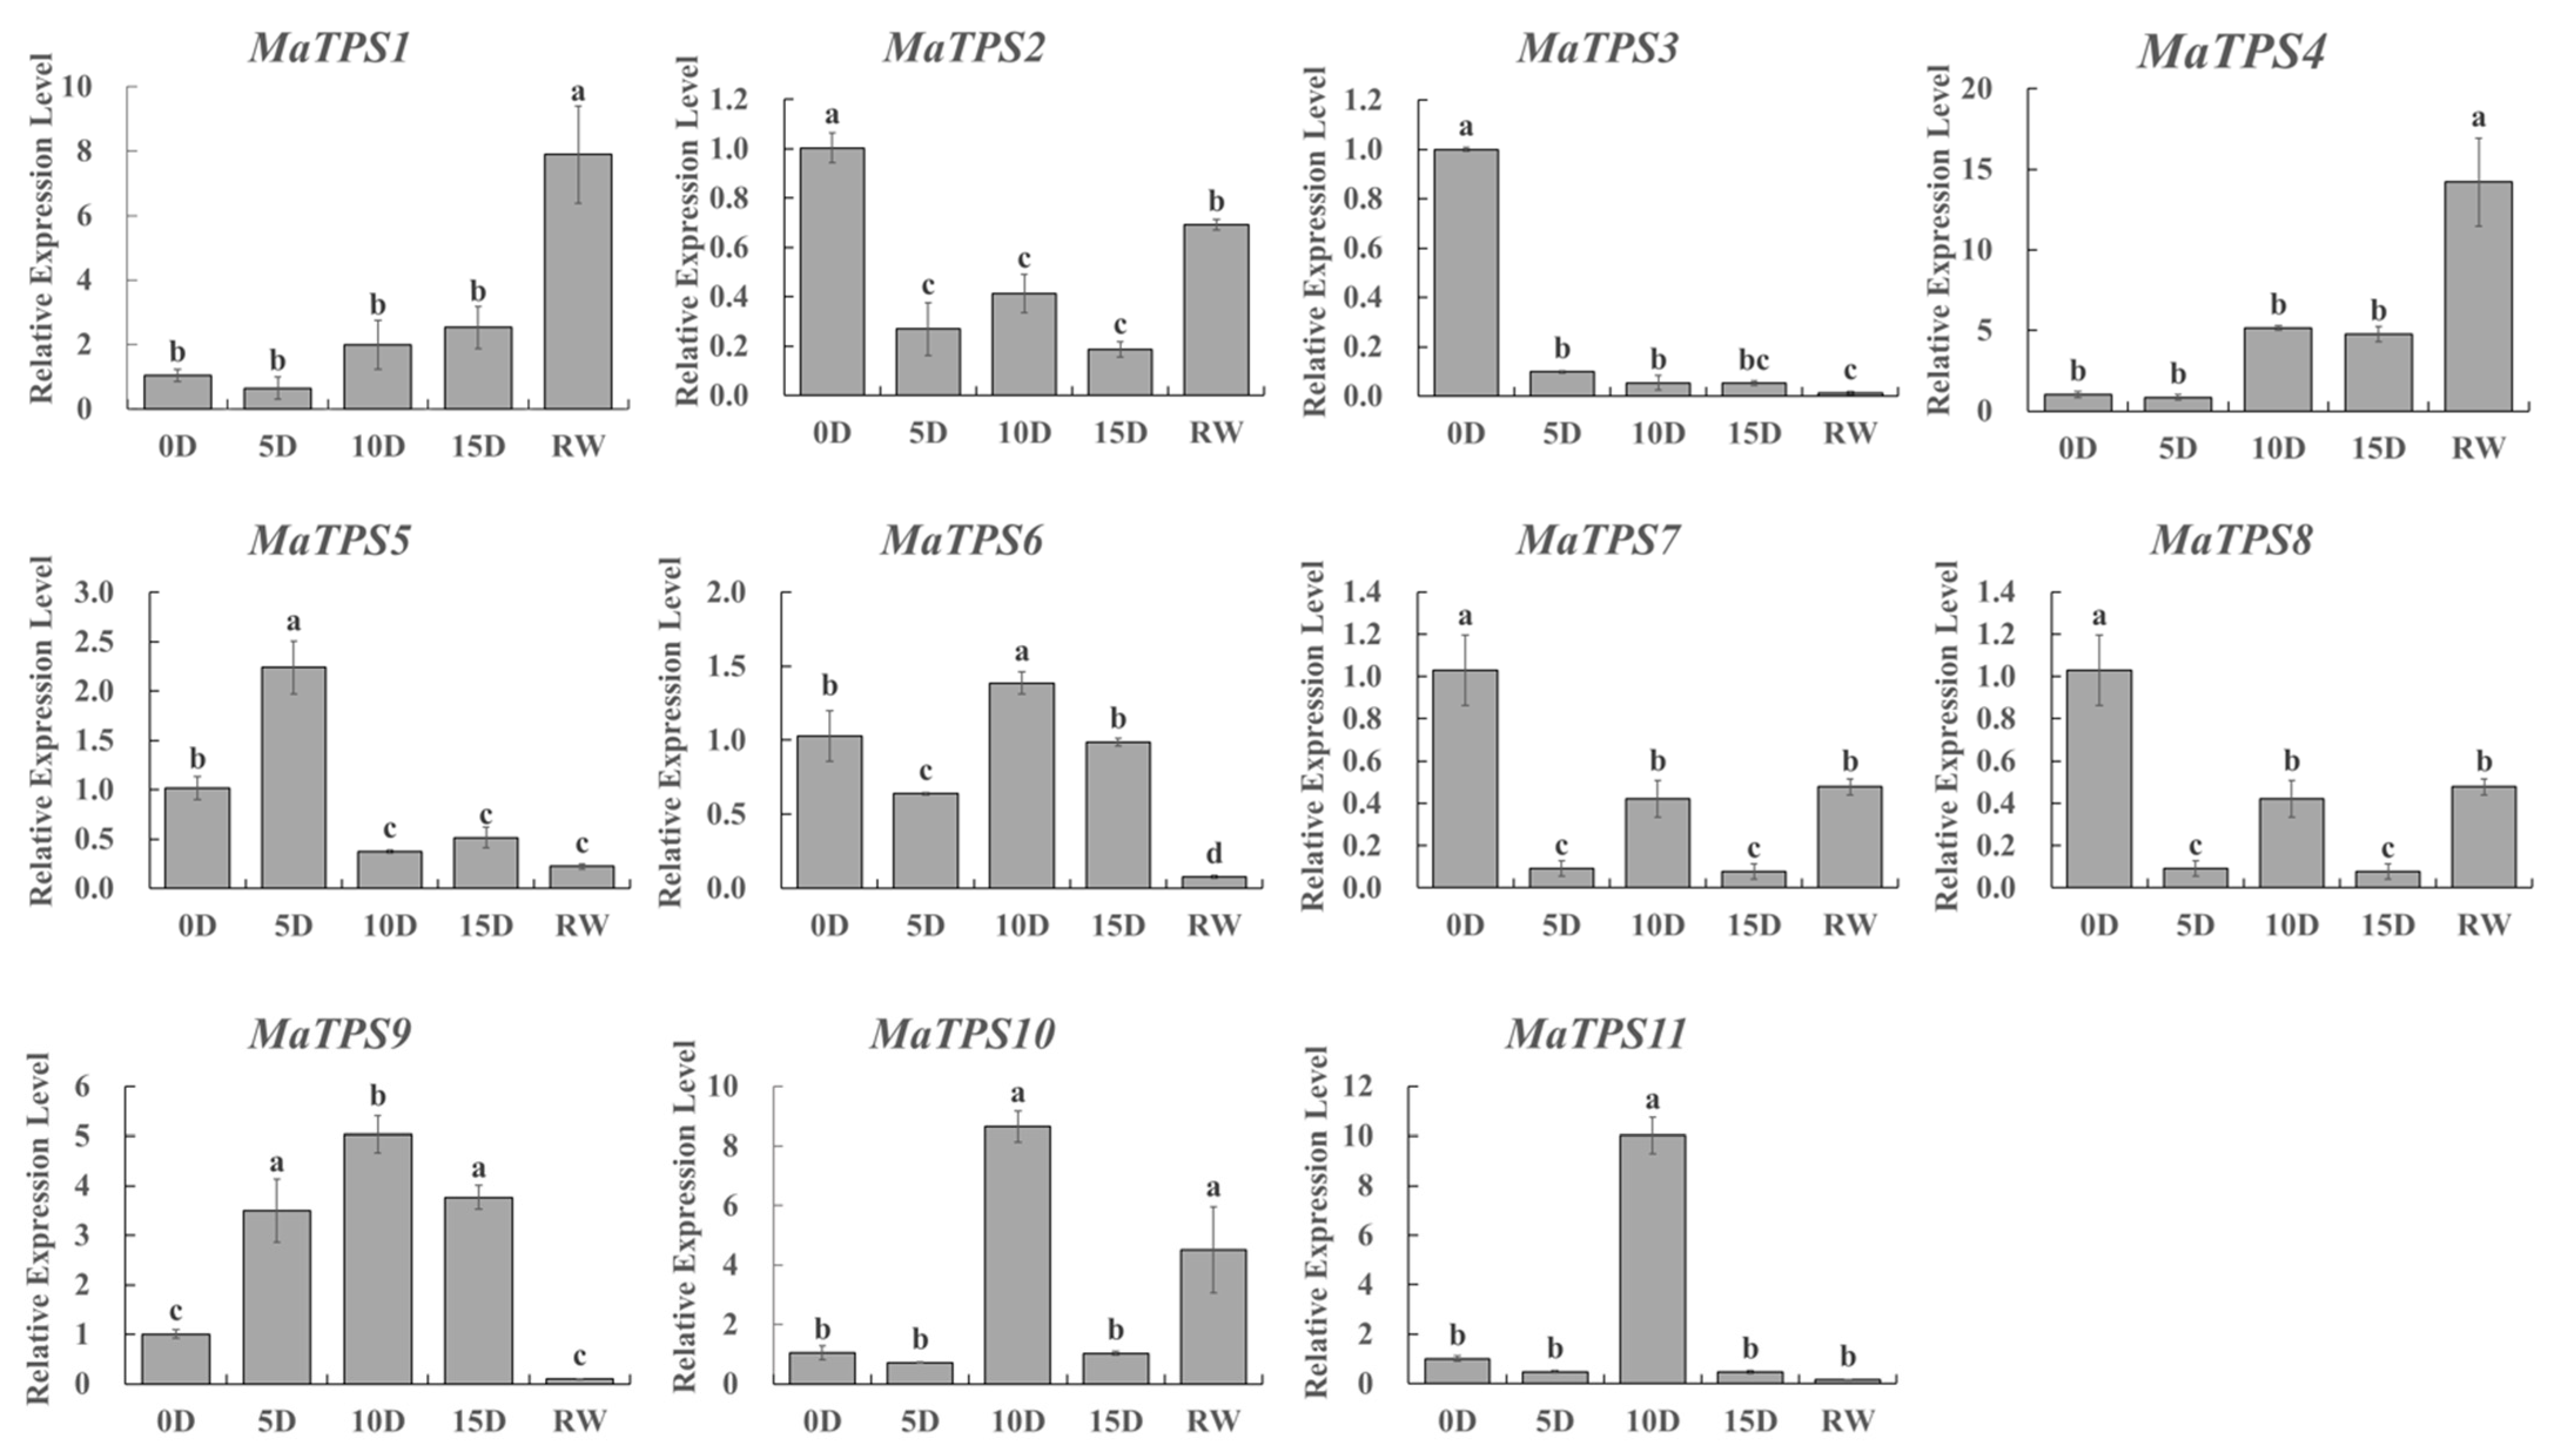
The role of MaTPSs during drought tolerance was investigated by qRT-PCR analysis of 11 MaTPSs expression profiles (Figure 8). Results indicated that the expression levels of TPS I member MaTPS3 and MaTPS5 were significantly downregulated under drought stress, with expression levels decreasing by 11.12-fold and 1.82-fold, respectively, on day 10 of drought. Most TPS II members showed an expression level change that first rose and then fell during drought stress. Specifically, expression levels of MaTPS4, MaTPS6, MaTPS9, MaTPS10, and MaTPS11 peaked on day 10, reaching 5.15-, 1.39-, 5.04-, 8.65-, and 10.02-fold compared to the control, respectively. MaTPS1 showed the highest expression level on day 15, which was 2.53-fold higher than control. Conversely, expression levels of MaTPS2, MaTPS7, and MaTPS8 were reduced to two-fifths of control levels on the 10th day of drought. Following rehydration, only MaTPS1, MaTPS4, and MaTPS10 recovered to control levels or higher.
Figure 8.
Expression patterns of MaTPSs in leaf tissues under drought stress. Different lowercase letters (a, b, c, d) indicate significant differences at p < 0.05.
4. Discussion
4.1. Trehalose Accumulation and Drought Response of MaTPS Genes in Morus alba
Trehalose is increasingly recognized as a critical metabolite that enhances plant tolerance to abiotic stress [24]. Under drought conditions, trehalose contributes to osmotic adjustment and stabilization of cellular structures, thereby protecting plants from dehydration-induced damage [26]. However, most plants maintain extremely low endogenous levels of trehalose, which are generally insufficient to confer effective osmotic protection [33]. In such cases, exogenous trehalose application has been shown to modulate metabolism and improve stress tolerance, as demonstrated in Rosa rugosa [34].
In the present study, trehalose accumulated significantly in the leaves and roots of M. alba under drought stress (27.324 to 66.557 mg/g FW), with levels markedly higher than those reported in Arabidopsis (37 ng/g DW) and transgenic Oryza sativa (1.076 mg/g FW) [35]. This substantial accumulation suggests that M. alba may possess an efficient trehalose-mediated drought adaptation mechanism. In addition to its osmoprotective role, trehalose metabolism is closely associated with signaling pathways, particularly through trehalose-6-phosphate (Tre6P), which functions as a key regulator of carbon metabolism and stress responses. Therefore, the observed increase in trehalose likely reflects both metabolic adjustment and broader regulatory responses to drought stress.
Consistent with trehalose accumulation, several MaTPS genes (MaTPS1, MaTPS2, MaTPS4, MaTPS9, MaTPS10, and MaTPS11) were upregulated under drought conditions, suggesting their involvement in trehalose biosynthesis (Figure 7). In contrast, MaTPS3, MaTPS5, MaTPS7, and MaTPS8 were downregulated, indicating functional differentiation within the TPS gene family. Variations in exon–intron organization were observed between TPS I and TPS II subfamilies, as well as within the TPS II group. Similar patterns of structural divergence have been reported in sugarcane and peach, suggesting that functional diversification of TPS genes is widespread in plants [15,20,36]. Notably, all significantly upregulated MaTPS genes in this study belonged to the TPS II subfamily, consistent with findings in Chenopodium quinoa, further supporting their potential regulatory roles in stress adaptation [7].
4.2. Evolutionary Conservation and Regulatory Complexity of the TPS Gene Family
Phylogenetic analysis revealed that TPS gene family members are generally conserved within taxonomic groups. For instance, leguminous species such as Arachis hypogaea and Medicago truncatula cluster closely with Glycine max, while Camphora longepaniculata groups with its congeners [37,38]. In this study, MaTPS proteins showed close phylogenetic relationships with TPS genes from the woody genus Populus, indicating evolutionary conservation among woody plants (Figure 3 and Figure 6).
Interestingly, the expression patterns of TPS genes in M. alba appear to differ from those reported in some herbaceous species. While TPS I genes in species such as Arabidopsis and maize are often upregulated under stress conditions, their expression in woody plants may be more tightly regulated [8,39,40]. This suggests that perennial species may adopt distinct regulatory strategies to maintain metabolic balance and avoid excessive accumulation of intermediates such as Tre6P [41].
Subcellular localization analysis further demonstrated that MaTPS proteins are distributed across chloroplasts, vacuoles, and the cytoplasm, similar to TPS proteins in Citrullus lanatus [18]. This diverse localization implies functional specialization across cellular compartments. In addition, promoter analysis identified multiple cis-acting elements related to drought, light, low temperature, flavonoid biosynthesis, and hormone responses, indicating that MaTPS genes are likely involved in complex regulatory networks integrating environmental signals and developmental processes [38,42,43,44].
This study has several limitations, as the functions of MaTPS genes were inferred mainly from expression and metabolite data without direct genetic or protein-level validation. Future work should focus on functional characterization of MaTPS4/9/10/11 candidate genes using gene editing and multi-omics approaches to clarify their roles in drought response. Overall, our results suggest that MaTPS genes may participate in drought adaptation through the regulation of trehalose metabolism, providing a basis for future studies on drought tolerance improvement in mulberry.
5. Conclusions
In this study, genome-wide identification and systematic analysis of the TPS gene family were performed in M. alba. A total of 11 MaTPS genes were identified and classified into two subfamilies, TPS I and TPS II. Analyses of gene structure, conserved motifs, phylogenetic relationships, and cis-acting regulatory elements indicated that the MaTPS gene family has maintained a certain degree of evolutionary conservation while also exhibiting considerable regulatory complexity. Drought stress significantly promoted trehalose accumulation and altered the expression of multiple MaTPS genes. Among them, MaTPS1, MaTPS2, MaTPS4, MaTPS9, MaTPS10, and MaTPS11 were upregulated, whereas MaTPS3, MaTPS5, MaTPS7, and MaTPS8 were downregulated, suggesting functional diversification within this gene family. Correlation analysis further indicated that trehalose accumulation was significantly positively correlated with the upregulated MaTPS genes and negatively correlated with several downregulated genes. Overall, this study provides a foundation for elucidating the potential roles of MaTPS genes in the drought response of M. alba and offers candidate gene resources for further functional validation and the genetic improvement of drought tolerance in mulberry.
Supplementary Materials
The following supporting information can be downloaded at https://www.mdpi.com/article/10.3390/cimb48040356/s1.
Author Contributions
All authors contributed to the study conception and design. Material preparation, data collection and analysis were performed by J.W.; L.D.; H.H.; S.Q.; M.T.; S.T.; H.J.; and D.X. The first draft of the manuscript was written by M.L.; X.W.; H.G.; and A.D. All authors commented on previous versions of the manuscript. All authors have read and agreed to the published version of the manuscript.
Funding
This research was supported by the Natural Science Foundation of Sichuan Province, China (No. 2024NSFSC1194) and the Young Scientists Fund of the National Natural Science Foundation of China (No. 32401658).
Institutional Review Board Statement
Not applicable.
Informed Consent Statement
Not applicable.
Data Availability Statement
The original contributions presented in this study are included in the article/Supplementary Materials. Further inquiries can be directed to the corresponding author.
Conflicts of Interest
The authors declare no conflicts of interest.
References
- Crowe, L.M.; Reid, D.S.; Crowe, J.H. Is trehalose special for preserving dry biomaterials? Biophys. J. 1996, 71, 2087–2093. [Google Scholar] [CrossRef] [Scilit] [PubMed]
- Onwe, R.O.; Onwosi, C.O.; Ezugworie, F.N.; Ekwealor, C.C.; Okonkwo, C.C. Microbial trehalose boosts the ecological fitness of biocontrol agents, the viability of probiotics during long-term storage and plants tolerance to environmental-driven abiotic stress. Sci. Total Environ. 2022, 806, 150432. [Google Scholar] [CrossRef] [Scilit]
- Chen, S.L.; Peng, Y.; Zhou, H.; Yu, B.; Dong, Y.J.; Teng, S. Research Advances in Trehalose Metabolism and Trehalose-6-Phosphate Signaling in Plants. Plant Physiol. J. 2014, 50, 233–242. [Google Scholar] [CrossRef]
- Wang, Y.W.; Quan, S.; Ma, H.; Liu, D.; Xie, F. Review on the Protective Mechanisms of Trehalose in Plant Tissues and Animal Cells. Jiangsu Agric. Sci. 2019, 47, 14–18. [Google Scholar] [CrossRef]
- Zhang, Z.; Xiong, T.; Li, K.; Huang, K.; Liao, C.; Liu, G. Evolution and amplification of the trehalose-6-phosphate synthase gene family in Theaceae. BMC Genom. 2025, 26, 273. [Google Scholar] [CrossRef] [Scilit]
- Liu, J.; Jiang, D.G. Research Advance on Trehalose Synthesis Related Genesin Crops. Genom. Appl. Biol. 2014, 33, 432–437. [Google Scholar] [CrossRef]
- Wang, X.; Wang, M.; Huang, Y.; Zhu, P.; Qian, G.; Zhang, Y.; Liu, Y.; Zhou, J.; Li, L. Genome-Wide Identification and Analysis of Stress Response of Trehalose-6-Phosphate Synthase and Trehalose-6-Phosphate Phosphatase Genes in Quinoa. Int. J. Mol. Sci. 2023, 24, 6950. [Google Scholar] [CrossRef] [Scilit]
- Vandesteene, L.; Ramon, M.; Le Roy, K.; Van Dijck, P.; Rolland, F. A single active trehalose-6-P synthase (TPS) and a family of putative regulatory TPS-like proteins in Arabidopsis. Mol. Plant 2010, 3, 406–419. [Google Scholar] [CrossRef] [Scilit]
- Zang, B.; Li, H.; Li, W.; Deng, X.W.; Wang, X. Analysis of trehalose-6-phosphate synthase (TPS) gene family suggests the formation of TPS complexes in rice. Plant Mol. Biol. 2011, 76, 507–522. [Google Scholar] [CrossRef] [Scilit]
- Xie, D.W.; Wang, X.N.; Fu, L.S.; Sun, J.; Zheng, W.; Li, Z.F. Identification of the trehalose-6-phosphate synthase gene family in winter wheat and expression analysis under conditions of freezing stress. J. Genet. 2015, 94, 55–65. [Google Scholar] [CrossRef] [Scilit] [PubMed]
- Zhou, W.; Sheng, C.; Dossou, S.S.K.; Wang, Z.; Song, S.; You, J.; Wang, L. Genome-wide identification of TPS genes in sesame and analysis of their expression in response to abiotic stresses. Oil Crop Sci. 2023, 8, 81–88. [Google Scholar] [CrossRef] [Scilit]
- Yang, Y.J.; Ma, K.F.; Zhang, T.X.; Li, L.L.; Wang, J.; Cheng, T.R.; Zhang, Q.X. Characteristics and expression analyses of trehalose-6-phosphate synthase family in Prunus mume reveal genes involved in trehalose biosynthesis and drought response. Biomolecules 2020, 10, 1358. [Google Scholar] [CrossRef] [Scilit]
- Gao, T.; Zhang, Y.C.; Wang, P.J.; Gu, M.Y.; Chen, X.J.; Hong, Y.P.; Hou, B.H.; Ye, N.X. Genome-wide identification and expression analysis of TPS gene family in Camellia sinensis. Chin. J. Appl. Environ. Biol. 2022, 28, 1485–1495. [Google Scholar] [CrossRef]
- Guo, W.; Sun, Y.; Chai, J.; Liu, L.; Li, J.; Guo, R.; Guo, C. Genome-wide identification of the trehalose-6-phosphate synthase gene family in alfalfa (Medicago sativa L.) reveals involvement of MsTPS16 in tolerance to saline-alkali stress. Gene 2025, 963, 149609. [Google Scholar] [CrossRef] [Scilit]
- Fan, S.; Wang, Z.; Xiao, Y.; Liang, J.; Zhao, S.; Liu, Y.; Peng, F.; Guo, J. Genome-Wide Identification of Trehalose-6-phosphate Synthase (TPS) Gene Family Reveals the Potential Role in Carbohydrate Metabolism in Peach. Genes 2023, 15, 39. [Google Scholar] [CrossRef] [Scilit] [PubMed]
- Wang, C.; Zhang, J.; Li, J.; Yang, Y.; Zhang, Z.; Chai, Q.; Xie, J. Genome-wide identification and functional analysis of the trehalose-6-phosphate phosphatase (TPP) gene family in tomato (Solanum lycopersicum L.) and the role of SlTPP3 under NaCl stress. Sci. Hortic. 2025, 345, 114161. [Google Scholar] [CrossRef] [Scilit]
- Zhang, L.S.; Gao, J.Y.; Long, J.M.; Peng, C.C. Identification and Expression Analysis of Trehalose 6-Phosphate Synthase (TPS) Gene Family in Neolamarckia cadamba. Mol. Plant Breed. 2025, 23, 353–361. [Google Scholar] [CrossRef]
- Yuan, G.; Liu, J.; An, G.; Li, W.; Si, W.; Sun, D.; Zhu, Y. Genome-Wide Identification and Characterization of the Trehalose-6-phosphate Synthetase (TPS) Gene Family in Watermelon (Citrullus lanatus) and Their Transcriptional Responses to Salt Stress. Int. J. Mol. Sci. 2021, 23, 276. [Google Scholar] [CrossRef] [Scilit]
- Xu, J.; Kong, L.; Ren, W.; Wang, Z.; Tang, L.; Wu, W.; Liu, X.; Ma, W.; Zhang, S. Identification and expression analysis of TPS family gene in Cannabis sativa L. Heliyon 2024, 10, e27817. [Google Scholar] [CrossRef] [Scilit]
- Hu, X.; Wu, Z.-D.; Luo, Z.-Y.; Burner, D.M.; Pan, Y.-B.; Wu, C.-W. Genome-Wide Analysis of the Trehalose-6-Phosphate Synthase (TPS) Gene Family and Expression Profiling of ScTPS Genes in Sugarcane. Agronomy 2020, 10, 969. [Google Scholar] [CrossRef] [Scilit]
- Li, R.; Fan, T.; Wang, T.; Dominic, K.; Hu, F.; Liu, L.; Zhang, L.; Fang, R.; Pan, G.; Li, L. Characterization and functional analysis of miR166f in drought stress tolerance in mulberry (Morus multicaulis). Mol. Breed. 2018, 38, 132. [Google Scholar] [CrossRef] [Scilit]
- Liu, Y.; Ji, D.; Turgeon, R.; Chen, J.; Lin, T.; Huang, J.; Luo, J.; Zhu, Y.; Zhang, C.; Lv, Z. Physiological and proteomic responses of mulberry trees (Morus alba. L.) to combined salt and drought stress. Int. J. Mol. Sci. 2019, 20, 2486. [Google Scholar] [CrossRef] [Scilit]
- Song, F.; Li, Y.; Huang, J.; Lu, W.; Guo, Z.; Deng, W. Integrated transcriptomic and proteomic analyses reveal the impact of drought and heat stress combination on Morus alba. Environ. Exp. Bot. 2024, 228, 105988. [Google Scholar] [CrossRef] [Scilit]
- Shao, J.; Wu, W.; Albishi, S.T.; Hu, Q.; U Hassan, M. Trehalose induced drought tolerance in plants: Physiological and molecular responses. Not. Bot. Horti Agrobot. Cluj-Napoca 2022, 50, 12584. [Google Scholar] [CrossRef] [Scilit]
- Hao, Y.; Zhai, Y.; Stevanato, P.; Li, R.; Yu, L.; Geng, G.; Wang, L.; Xu, Y.; Liu, J.; Wang, Y. Trehalose application mitigates drought stress in by enhancing photosynthesis, antioxidant activity, and osmolyte production in sugar beet (Betus vulgaris). Funct. Plant Biol. 2025, 52, FP24183. [Google Scholar] [CrossRef] [Scilit]
- Al Hinai, M.S.; Rehman, A.; Siddique, K.H.; Farooq, M. The Role of Trehalose in Improving Drought Tolerance in Wheat. J. Agron. Crop Sci. 2025, 211, e70053. [Google Scholar] [CrossRef] [Scilit]
- Ma, J.; Xu, G.; Wan, L.; Wang, N. Molecular cloning, sequence analysis and tissue-specific expression of Akirin2 gene in Tianfu goat. Gene 2015, 554, 9–15. [Google Scholar] [CrossRef] [Scilit]
- Wang, Z.M.; Wang, Y.; Wong, D.C.J. Editorial: Surviving and thriving: How crops perceive and respond to temperature stress. Front. Plant Sci. 2024, 15, 1550257. [Google Scholar] [CrossRef] [Scilit] [PubMed]
- Li, X.; Lulu, X.; Han, L.; Qu, P.; Zhao, H.; Luo, D.; Wang, X.; Huang, B.; Zhang, M.; Li, C.; et al. AhFAD3-A01 enhances α-linolenic acid content in Arabidopsis and peanut. Gene 2025, 949, 149336. [Google Scholar]
- Lescot, M.; Déhais, P.; Thijs, G.; Marchal, K.; Moreau, Y.; Van De Peer, Y.; Rouzé, P.; Rombauts, S. PlantCARE, a database of plant cis-acting regulatory elements and a portal to tools for in silico analysis of promoter sequences. Nucleic Acids Res. 2002, 30, 325–327. [Google Scholar] [CrossRef] [Scilit] [PubMed]
- Li, R.; Lei, C.; Zhang, Q.; Guo, X.; Cui, X.; Wang, X.; Li, X.; Gao, J. Pan-Genome-Based Characterization of the SRS Transcription Factor Family in Foxtail Millet. Plants 2025, 14, 1257. [Google Scholar] [CrossRef] [Scilit] [PubMed]
- Xiao, Y.; Tan, J.; Yu, Y.; Dong, J.; Cao, L.; Yao, L.; Zhang, Y.; Yan, Z. Phytotoxic Effects and Potential Allelochemicals from Water Extracts of Paulownia tomentosa Flower Litter. Agronomy 2024, 14, 367. [Google Scholar] [CrossRef] [Scilit]
- Choudhary, A.; Nepovimova, E.; Rajput, V.D.; Malik, T.; Choudhary, M.; Bhardwaj, N.; Peter, L.; Puri, S.; Kimta, N. Mechanistic understanding of GABA and trehalose in modulating plant response to drought stress. Plant Stress 2025, 16, 100838. [Google Scholar] [CrossRef] [Scilit]
- Bao, M.; Xi, Y.; Wang, R.; Ma, Y.; Bai, M.; Wei, G.; Xu, Y.; Wang, J.; Feng, L. Trehalose signaling regulates metabolites associated with the quality of rose flowers under drought stress. Environ. Exp. Bot. 2024, 224, 105813. [Google Scholar] [CrossRef] [Scilit]
- Eh, T.-J.; Jiang, Y.; Jiang, M.; Li, J.; Lei, P.; Ji, X.; Kim, H.-I.; Zhao, X.; Meng, F. The role of trehalose metabolism in plant stress tolerance. J. Adv. Res. 2024, 76, 57–72. [Google Scholar] [CrossRef] [Scilit]
- Singh, V. Evaluation of Sugarcane Genotypes and Genes Expression Associated with Drought Tolerance. SABRAO J. Breed. Genet. 2025, 57, 2402–2413. [Google Scholar] [CrossRef] [Scilit]
- Hendrickson, H.; Islam, M.; Wabo, G.F.; Mafu, S. Biochemical analysis of the TPS-a subfamily in Medicago truncatula. Front. Plant Sci. 2024, 15, 1349009. [Google Scholar] [CrossRef] [Scilit] [PubMed]
- Liu, X.; Shuai, Y.; Zhao, X.; Zhang, M.; Yan, Y.; Zhao, J.; Feng, R.; Wei, Q. Genome-wide identification and evolution-profiling analysis of tps gene family in Camphora longepaniculata and screening of key TPS genes. Front. Plant Sci. 2025, 16, 1546000. [Google Scholar] [CrossRef] [Scilit]
- Ramon, M.; De Smet, I.; Vandesteene, L.; Naudts, M.; Leyman, B.; Van Dijck, P.; Rolland, F.; Beeckman, T.; Thevelein, J.M. Extensive expression regulation and lack of heterologous enzymatic activity of the Class II trehalose metabolism proteins from Arabidopsis thaliana. Plant Cell Environ. 2009, 32, 1015–1032. [Google Scholar] [CrossRef] [Scilit] [PubMed]
- Dauda1, W.P.; Fasogbon, I.V.; Abraham, P.; Azameti, M.K. In-silico Characterization of the Structure of Trehalose-6-Phosphate Synthase Genes in Maize Reveals the Significant Expression of Unique ZmTPS1 Gene in Maize under Drought Stress. AGE J. Sci. 2025, 1, 0001. [Google Scholar]
- Fox, H.; Ben-Dor, S.; Doron-Faigenboim, A.; Goldsmith, M.; Klein, T.; David-Schwartz, R. Carbohydrate dynamics in Populus trees under drought: An expression atlas of genes related to sensing, translocation, and metabolism across organs. Physiol. Plant. 2023, 175, e14001. [Google Scholar] [CrossRef] [Scilit] [PubMed]
- Cao, Z.; Ma, Q.; Weng, Y.; Shi, J.; Chen, J.; Hao, Z. Genome-wide identification and expression analysis of TPS gene family in Liriodendron chinense. Genes 2023, 14, 770. [Google Scholar] [CrossRef] [Scilit] [PubMed]
- Cui, A.; Jin, Y.; Li, Y.; Nie, T.; Sun, L. Systematic identification of TPS genes in Gossypium and their characteristics in response to flooding stress. Front. Plant Sci. 2023, 14, 1126884. [Google Scholar] [CrossRef] [Scilit] [PubMed]
- Miao, Y.; Zhang, K. Genome-Wide Identification of Cucumber Lhc Genes’ Family and Their Expression Analysis. Horticulturae 2025, 11, 736. [Google Scholar] [CrossRef] [Scilit]

Disclaimer/Publisher’s Note: The statements, opinions and data contained in all publications are solely those of the individual author(s) and contributor(s) and not of MDPI and/or the editor(s). MDPI and/or the editor(s) disclaim responsibility for any injury to people or property resulting from any ideas, methods, instructions or products referred to in the content. |
© 2026 by the authors. Licensee MDPI, Basel, Switzerland. This article is an open access article distributed under the terms and conditions of the Creative Commons Attribution (CC BY) license.