


Abstract
Nipah virus (NiV) is a highly pathogenic zoonotic henipavirus that causes severe respiratory and neurological disease, yet no specific therapeutics are approved for human NiV infection. Because studies involving live NiV require biosafety level 4 containment and are technically demanding, computational host-directed drug repositioning provides a practical strategy for prioritizing candidates before experimental validation. Using the public NiV infection transcriptomic dataset GSE166707, we developed a time-resolved host-response drug-repositioning framework that integrated time-point differential expression analysis with time-series modeling. Core temporal genes were stratified into host dependency factors, host restriction factors and residual host-response genes using annotations from the Human–Virus Interaction DataBase. Candidate drugs were prioritized by combining Connectivity Map (CMap) reversal analysis, network proximity analysis, literature-curated NiV host-pathway directionality, pharmacological suitability and reported antiviral evidence. Suitable public drug-perturbation transcriptomic datasets were further analyzed by gene set enrichment analysis (GSEA) to evaluate their consistency with the predicted reversal directions. We identified 1116 genes differentially expressed at one or more time points and 1677 genes exhibiting significant temporal expression patterns, whose intersection defined a 516-gene core temporal host-response signature comprising 58 host dependency factors, 18 host restriction factors and 440 residual host-response genes. This signature captured a staged transition from early virus-associated recognition to inflammatory signaling, endoplasmic reticulum stress, increased protein-processing demands, and dysregulation of the cell cycle and DNA replication. Integrated screening yielded 38 candidate drugs, from which metformin, fenofibrate, lonafarnib and probenecid were prioritized as host-directed candidates warranting further experimental validation. Gene-level reversal and host-network analyses revealed drug-specific modulation of NiV-associated host programs, while external drug-perturbation GSEA supported selected host-factor reversal patterns for metformin and fenofibrate. Overall, this framework provides a reproducible strategy for prioritizing host-directed therapeutic candidates against NiV infection.
1. Introduction
Nipah virus (NiV), a highly pathogenic zoonotic henipavirus in the family Paramyxoviridae, emerged as a major public health threat after the 1998–1999 outbreaks in Malaysia and Singapore and has since caused recurrent outbreaks in South and Southeast Asia [1,2,3,4]. Human infection can result in severe encephalitis and acute respiratory disease, and human-to-human transmission has been documented in some outbreaks, with high case-fatality rates and substantial outbreak-control challenges [3,4]. Despite its epidemic potential and clinical severity, the management of NiV disease remains largely supportive, and no therapeutics or vaccines have been approved specifically for human NiV infection [5,6]. These unmet needs highlight the importance of developing rapid, rational and experimentally testable strategies for therapeutic candidate discovery.
The biology of NiV infection provides a strong rationale for host-directed therapeutic exploration. Viral entry is mediated by the interaction of the NiV attachment glycoprotein with ephrin-B2 or ephrin-B3, receptors expressed in vascular, respiratory and neural compartments that contribute to the endothelial, pulmonary and neurological manifestations of NiV disease [7,8,9,10]. Following entry, multiple NiV P-gene products antagonize interferon signaling by inhibiting or sequestering STAT1 and STAT2, thereby weakening canonical antiviral responses. Meanwhile, infected host cells mount inflammatory, interferon-related and stress-associated responses that may be incompletely protective and may also contribute to tissue injury [11,12,13]. NiV pathogenesis therefore reflects a dynamic interplay among viral exploitation of host dependency programs, host restriction responses and broader infection-associated inflammatory and stress-related processes.
Because studies involving live NiV require biosafety level 4 containment, large-scale drug screening in authentic infection systems is technically demanding [14]. Drug repositioning offers a practical upstream strategy for narrowing the candidate space before high-containment validation, particularly for emerging viral infections in which rapid prioritization, existing pharmacological knowledge and experimental feasibility are important [15,16]. Computational repositioning has already demonstrated value in viral disease research. For example, artificial intelligence (AI)-assisted analysis prioritized baricitinib for COVID-19, which was subsequently supported by randomized clinical evidence, while network-medicine approaches have identified experimentally testable candidates for SARS-CoV-2 infection [17,18,19]. However, existing strategies remain limited when applied to NiV. Many rely on static disease signatures despite the temporal evolution of host responses, treat infection-associated genes as a uniform set without accounting for their distinct functional roles, or prioritize candidates using a single analytical layer such as transcriptomic reversal or network proximity. These limitations may reduce biological interpretability and overlook candidates supported across multiple evidence sources.
To address these gaps, we analyzed the public NiV infection transcriptomic dataset GSE166707 from the Gene Expression Omnibus to characterize temporally organized host-response programs. We then stratified the resulting core temporal genes using host-factor annotations from the Human–Virus Interaction DataBase (HVIDB) [20]. We then integrated transcriptomic reversal, NiV host-pathway directionality, network proximity, pharmacological suitability and reported antiviral evidence to prioritize host-directed candidate drugs. For prioritized candidates with suitable publicly available drug-perturbation transcriptomic datasets, gene set enrichment analysis (GSEA) was performed to further evaluate the predicted reversal directions [21].
2. Materials and Methods
2.1. Study Design and Data Sources
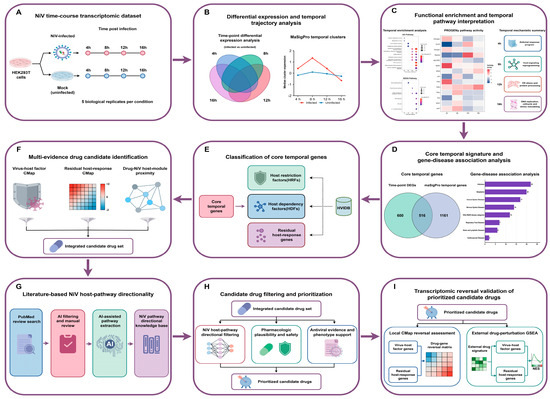
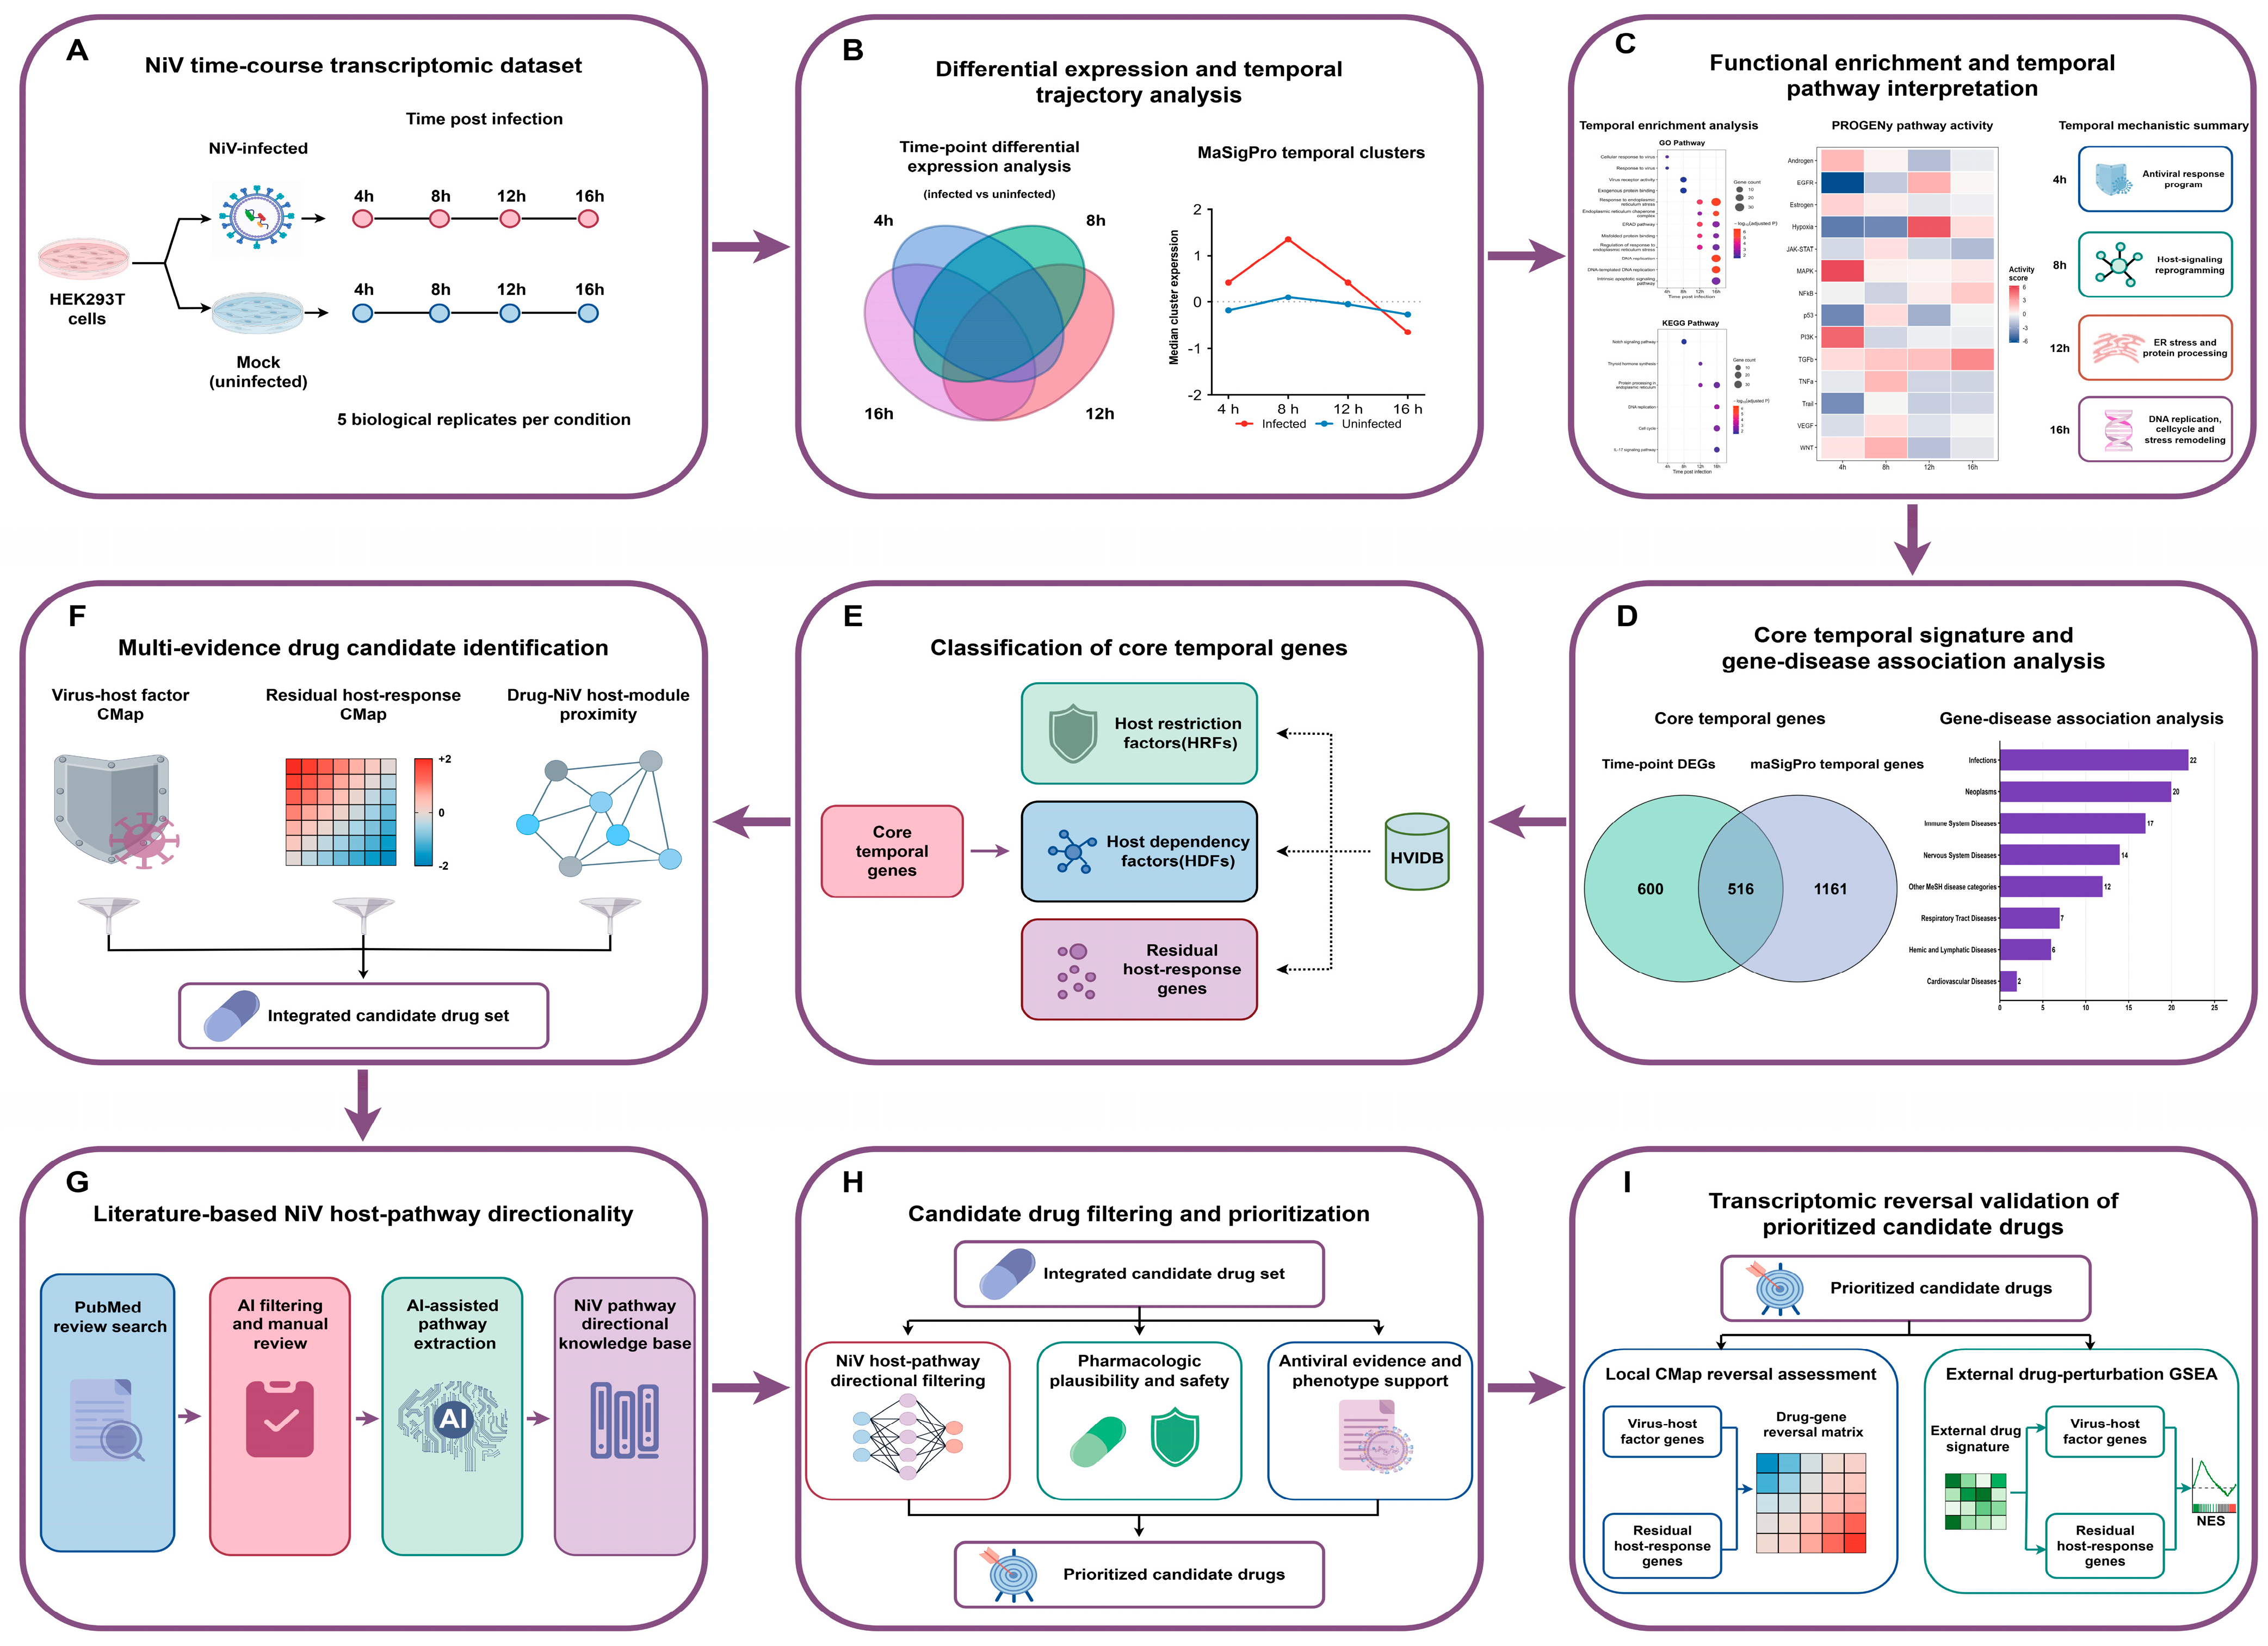
The overall study design is presented schematically (Figure 1). This study established a time-resolved host-response and multi-evidence drug-repositioning framework to connect NiV-induced transcriptional remodeling with host-directed therapeutic candidate prioritization. The discovery analysis was based on the publicly available NiV infection transcriptomic dataset GSE166707 from the Gene Expression Omnibus database. This dataset includes NiV-infected and mock-infected HEK293T cell samples collected at 4, 8, 12 and 16 h post-infection, with five biological replicates per condition. This dataset was selected because its four sampling points, time-matched controls, and biological replicates enabled consistent analysis of temporal transcriptional changes within a single experimental system. Previous studies have used HEK293T or 293T cells to investigate NiV replication, glycoprotein-mediated membrane fusion, and virus-like particle systems [22,23,24], while multi-platform analyses of NiV-infected HEK293T cells have further demonstrated the utility of this model for characterizing host responses [25]. The analysis focused on dynamic host transcriptional responses after NiV infection rather than viral genomic variation.
Figure 1.
Overall workflow of the integrative NiV host-response and drug-repositioning framework.
The analytical workflow consisted of time-point differential expression analysis, temporal trajectory modeling, functional enrichment analysis, identification and classification of core temporal genes, multi-evidence drug candidate discovery, literature-based host-pathway directionality assessment, pharmacological prioritization and transcriptomic reversal assessment.
2.2. Data Preprocessing and Differential Expression Analysis
The processed expression matrix and corresponding sample annotations were imported into R for downstream analysis. According to the GEO sample records, the microarray data had undergone background correction using a normal-exponential model with an offset of 50, followed by quantile normalization. Probe identifiers were mapped to gene symbols using the GPL13497 platform annotation. Values coded as −9999 were treated as missing, and probes with fewer than three valid measurements or without valid gene-symbol annotations were excluded. For probes annotated with multiple gene symbols, the first listed symbol was retained. When multiple probes mapped to the same gene symbol, the probe with the highest average expression across all samples was retained to generate a non-redundant gene-level expression matrix. Quality control included examination of expression distributions, sample-to-sample correlations, and principal component analysis.
Differential expression analysis was conducted independently at each time point by comparing NiV-infected samples with time-matched mock-infected controls using the limma package (version 3.64.3) in R 4.5.1. Linear models were fitted for each gene, followed by empirical Bayes moderation to estimate differential expression statistics. Differentially expressed genes (DEGs) were defined as genes with an absolute log2 fold change (|log2FC|) > 0.58 and nominal p < 0.05. Among the identified DEGs, genes with positive and negative log2FC values were classified as upregulated and downregulated, respectively, in NiV-infected samples relative to the time-matched mock-infected controls.
2.3. Time-Series Analysis and Core Temporal Gene Definition
NiV-associated temporal expression patterns were identified across the entire infection time course using the maSigPro package (version 1.80.0) in R 4.5.1 [26]. Second-order polynomial regression models were fitted for individual genes across the infection time course. p values were adjusted using the Benjamini–Hochberg method, and genes with Q < 0.05 were subjected to backward stepwise regression with a significance level of α = 0.05. Only genes with a coefficient of determination (R2) ≥ 0.60 were retained. The retained genes were grouped into six clusters using hierarchical clustering based on their model-fitted expression trajectories to characterize distinct dynamic host-response patterns.
The union of time-point differentially expressed genes was defined as all genes that met the differential expression criteria at one or more post-infection time points. Core temporal genes were defined as the intersection of the time-point DEG union and the temporal genes identified by maSigPro. This definition required evidence of both time-point differential expression and structured temporal variation, and the resulting core temporal genes were used as the primary NiV-associated temporal host-response signature for downstream analyses.
2.4. Functional Enrichment and Pathway Activity Inference
Gene Ontology (GO) and Kyoto Encyclopedia of Genes and Genomes (KEGG) enrichment analyses were performed separately for the DEG set from each time point and for the genes assigned to each maSigPro-derived temporal cluster. These analyses were conducted using the clusterProfiler package (version 4.16.0) in R 4.5.1 [27]. GO terms and KEGG pathways with nominal p < 0.05 were retained and summarized according to gene count and enrichment significance.
Signaling pathway activity was inferred using the progeny package (version 1.30.0) in R 4.5.1. PROGENy [28] estimates pathway activity from downstream transcriptional footprints. For each post-infection time point, pathway activity changes were summarized as the differences in pathway activity scores between NiV-infected samples and time-matched mock-infected controls. Literature-supported NiV life-cycle events were integrated with the transcriptome-informed pathway activity results to generate a schematic interpretation.
2.5. Disease-Signature Association Analysis
To evaluate the disease-context relevance of the NiV-associated temporal host-response signature, the core temporal genes were queried against disease-associated transcriptional signatures available in DiSignAtlas [29] (http://www.inbirg.com/disignatlas/, accessed on 15 April 2026). Positively associated disease signatures, defined by a fold change > 0 and a nominal hypergeometric p value < 0.05, were retained for downstream summarization. The associated disease terms were annotated and grouped into disease categories informed by the Medical Subject Headings (MeSH) classification system, including Infections, Respiratory Tract Diseases, Nervous System Diseases, Immune System Diseases, Cardiovascular Diseases, Hemic and Lymphatic Diseases, and Neoplasms.
For each disease category, representative disease associations were summarized according to the number of matched core temporal genes and the maximum reported fold change among the corresponding disease-associated transcriptional records. This analysis was used to assess whether the core temporal host-response signature was associated with disease contexts consistent with the known clinical and biological manifestations of NiV infection.
2.6. Virus–Host Factor Annotation and Connectivity Map Screening
The core temporal gene set was cross-referenced with HVIDB to identify genes previously annotated as host dependency factors (HDFs) or host restriction factors (HRFs). HDFs were considered host factors that may support viral infection or replication, whereas HRFs were considered host factors with potential antiviral restriction effects. Core temporal genes without an HDF or HRF annotation were classified as residual host-response genes.
Two screening branches were constructed using the Connectivity Map [30] (CMap; https://clue.io/query, accessed on 18 April 2026). In the virus–host factor branch, drug-induced transcriptional signatures were evaluated for their potential to downregulate HDFs and upregulate HRFs, based on their annotated functional roles. In the residual host-response branch, virus–host factor-labeled genes were removed from the core temporal gene set. Upregulated residual host-response genes were specified as genes to be downregulated, whereas downregulated residual host-response genes were specified as genes to be upregulated. The residual host-response signatures were queried against CMap to identify drugs with inverse connectivity to broader NiV-induced host programs.
Candidate drugs with normalized connectivity scores (norm_cs) < −1 were retained for downstream multi-evidence integration and were not considered final therapeutic candidates solely on the basis of the CMap results.
2.7. PrimeKG-Based Network Proximity Analysis
PrimeKG [31] was used to construct the network-based drug-repositioning layer. The NiV-associated host module was constructed from 76 curated NiV–human protein interaction records (Table S5), yielding 59 unique human proteins after Entrez Gene ID deduplication. No computational module expansion was performed. The PrimeKG-derived human protein–protein interaction (PPI) network was represented as an undirected, unweighted graph comprising 18,354 nodes and 321,075 edges. Its largest connected component contained 18,345 nodes (99.95%), and all 59 NiV-associated host proteins were successfully mapped to this component. Of 964 unique annotated drug targets, 947 (98.2%) were mapped to the network, corresponding to 2436 drugs with at least one mapped target. Human PPI edges and drug–target associations were then used to quantify the network proximity between each drug and the NiV-associated host module.
For a drug target node t and the NiV-associated host module D, the target-to-module distance was defined as:
where dist(t,v) denotes the shortest-path distance between drug target t and host-module node v in the human PPI network.
For a drug with target set T, the drug-to-module distance was calculated using the k drug targets closest to the NiV-associated host module:
where Tk denotes the subset containing the k drug targets with the shortest distances to the NiV-associated host module, and |T| denotes the total number of mapped targets for the drug.
For each drug, 1000 degree-aware randomizations were performed by sampling approximately degree-matched drug-target nodes while keeping the NiV-associated host module fixed. Targets with degrees at or below the 10th percentile (degree ≤ 2) were matched within an absolute degree difference of two, whereas other targets were matched using a 20% relative degree tolerance. When fewer than five eligible nodes were available, the 50 closest-degree nodes were used as a fallback sampling pool. The same top-k distance metric was applied to each randomized target set, and the observed distance was standardized against the resulting null distribution to calculate the network-proximity z-score. The network-proximity z-score, denoted by z, was calculated as:
where dobs denotes the observed drug-to-module distance, and μrand and σrand denote the mean and standard deviation of the randomized distance distribution, respectively. A more negative z_score indicates that the drug targets are located closer to the NiV-associated host module than expected by chance. Drugs with a network-proximity z_score < −1 were retained as network-proximity candidates for downstream integration.
2.8. Literature-Curated Reference for NiV Host-Pathway Directionality
To support pathway-informed drug prioritization, a literature-curated reference was constructed to summarize the reported regulatory direction and biological consequences of NiV-associated host pathways. PubMed (https://pubmed.ncbi.nlm.nih.gov/, accessed on 20 April 2026) was searched using the following strategy: (“Nipah virus”[MeSH Terms] OR “Nipah virus”[tiab] OR Nipah[tiab] OR NiV[tiab]) AND (“Signal Transduction”[MeSH Terms] OR signaling[tiab] OR pathway[tiab] OR “host signaling”[tiab] OR “molecular mechanism”[tiab]) AND (“Review”[Publication Type] OR “Systematic Review”[Publication Type]). The search yielded 60 records. Titles and abstracts were screened for relevance using DeepSeek V4 Pro via an application programming interface. All records excluded during AI-assisted screening were independently re-evaluated by the investigators, with full texts examined when necessary. Following manual verification, 40 reviews were retained for pathway extraction.
Each retained review was processed individually using predefined extraction and audit prompts (File S1). The extraction prompt restricted the output to explicitly reported NiV-associated host pathways or signaling processes and required the pathway name, experimental or cellular context, regulatory direction, core mechanism, associated phenotype, and biological function. The use of external knowledge and inference beyond the source text was prohibited. A separate audit prompt was applied to identify potentially unsupported, ambiguous, overstated, or incorrectly attributed records.
All extracted pathway records and audit flags were manually verified against the corresponding source articles. Final decisions regarding record inclusion, evidence attribution, pathway terminology, regulatory direction, and the resolution of conflicting or ambiguous information were made by the investigators. The resulting reference served as the biological basis for first-tier directionality filtering of candidate drugs. Candidate pharmacological effects were evaluated in the context of NiV pathobiology and considered directionally unfavorable when they were expected to aggravate infection-associated injury or impair antiviral signaling, cell survival, or tissue repair.
2.9. Integrated Candidate Identification and Evidence-Guided Prioritization
Candidate drug sets retained from the NiV host-factor CMap branch, the residual NiV host-response CMap branch, and the PrimeKG-based network-proximity analysis were intersected to define the integrated candidate drug set. Accordingly, integrated candidates were required to meet the predefined retention criteria in both CMap branches and the PrimeKG-based network-proximity analysis.
The integrated candidates were subsequently prioritized through the combined evaluation of quantitative and biological evidence. Quantitative evidence included the virus–host factor normalized connectivity score (virus_norm_cs), the residual host-response normalized connectivity score (residual_norm_cs), and the network-proximity z_score. More negative values of virus_norm_cs and residual_norm_cs indicated stronger predicted transcriptional reversal, whereas a more negative network-proximity z_score indicated closer-than-expected proximity to the NiV-associated host module. Pathway-directional compatibility was assessed separately using literature-curated evidence of NiV-associated host-pathway regulation, rather than inferred directly from individual gene-expression changes. Additional evidence included known pharmacological actions, toxicity and safety considerations, relevance to NiV-associated pathological phenotypes, and previously reported antiviral activity. These criteria were considered collectively to prioritize candidates for further transcriptomic validation and biological investigation (Figure S2).
2.10. Gene-Level CMap Reversal Analysis
Gene-level reversal analysis was performed using Level 5 compound-perturbation signatures from the Library of Integrated Network-Based Cellular Signatures (LINCS) CMap resource. For each prioritized compound, gene-level z-scores were extracted for genes included in the NiV-associated host-factor signature and the residual NiV host-response signature.
Each signature was divided into an up-direction set, Gup, and a down-direction set, Gdown, based on the predefined reversal criteria for the corresponding CMap screening branch. For the NiV-associated host-factor signature, HDFs were assigned to Gup, because their pharmacological reversal required compound-induced downregulation, whereas HRFs were assigned to Gdown, because their reversal required compound-induced upregulation. For the residual NiV host-response signature, Gup consisted of residual NiV-upregulated genes, whereas Gdown consisted of residual NiV-downregulated genes.
For gene i, zi denotes the gene-level z-score induced by the candidate compound. A positive zi indicates compound-induced upregulation, whereas a negative zi indicates compound-induced downregulation. The gene-level reversal value, ri, was defined as:
Thus, ri > 0 indicates that the compound-induced expression change is opposite to the predefined reference direction, whereas ri ≤ 0 indicates no favorable reversal under this definition. Gene-level reversal strength, si, was defined as the positive component of the reversal value:
For a given signature, N denotes the number of genes with available CMap gene-level z-score. The overall reversal score was calculated as the mean reversal strength across all evaluable genes:
The reversal proportion was calculated as the fraction of evaluable genes showing a positive reversal value:
where is the indicator function, which equals 1 when the specified condition is satisfied and 0 otherwise. The reversal score reflects the average magnitude of favorable reversal across the complete evaluable signature, whereas the reversal proportion reflects the fraction of genes reversed in the expected direction. These metrics were calculated separately for the NiV-associated host-factor signature and the residual NiV host-response signature for each prioritized compound.
2.11. External Drug-Perturbation Assessment Using Gene Set Enrichment Analysis
Public transcriptomic databases were searched for drug-perturbation datasets corresponding to the prioritized candidates. Suitable datasets were identified only for metformin and fenofibrate, namely GSE46263 and GSE15483, respectively. Drug-induced ranked gene lists were generated by comparing treated samples with their corresponding controls. The different fenofibrate treatment durations in GSE15483 were analyzed separately.
Preranked gene set enrichment analysis (GSEA) was performed using the fgsea package (version 1.37.4) in R 4.5.1 to assess whether drug-induced transcriptional changes were consistent with the predefined reversal directions for each signature. For the host-factor signature, HRFs were expected to be enriched toward the upregulated end of the drug-induced ranked list, whereas HDFs were expected to be enriched toward the downregulated end. For the residual NiV host-response signature, residual NiV-upregulated genes were expected to be enriched toward the downregulated end, whereas residual NiV-downregulated genes were expected to be enriched toward the upregulated end. The normalized enrichment score (NES) and false discovery rate (FDR) q values were used to summarize enrichment direction, magnitude and statistical significance.
2.12. Statistical Analysis and Visualization
All statistical and transcriptomic analyses were performed in R version 4.5.1. Network visualization was conducted using Gephi version 0.11.2. Time-point differentially expressed genes were defined using |log2FC| > 0.58 and nominal p < 0.05. GO terms and KEGG pathways with nominal p < 0.05 were retained. Compounds with norm_cs < −1 in each CMap screening branch and drugs with a network-proximity z_score < −1 were retained for subsequent integration. External GSEA results were summarized using NES and FDR q values. Where applicable, p values were adjusted using the Benjamini–Hochberg method to control the false discovery rate.
3. Results
3.1. NiV Infection Induces Temporally Structured Host Transcriptomic Remodeling
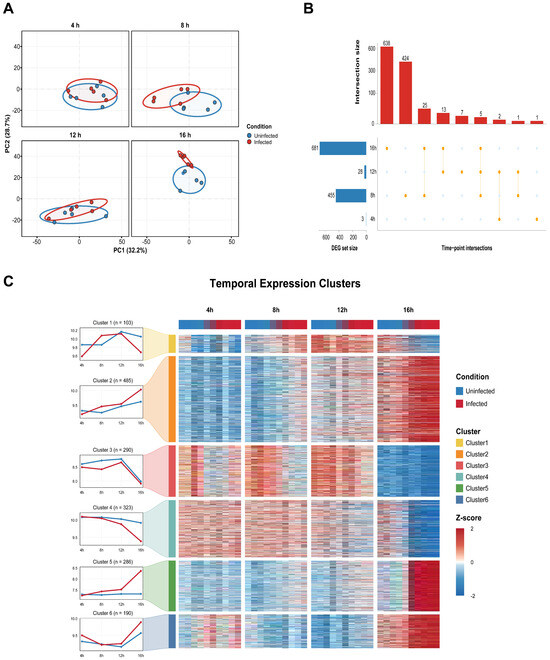
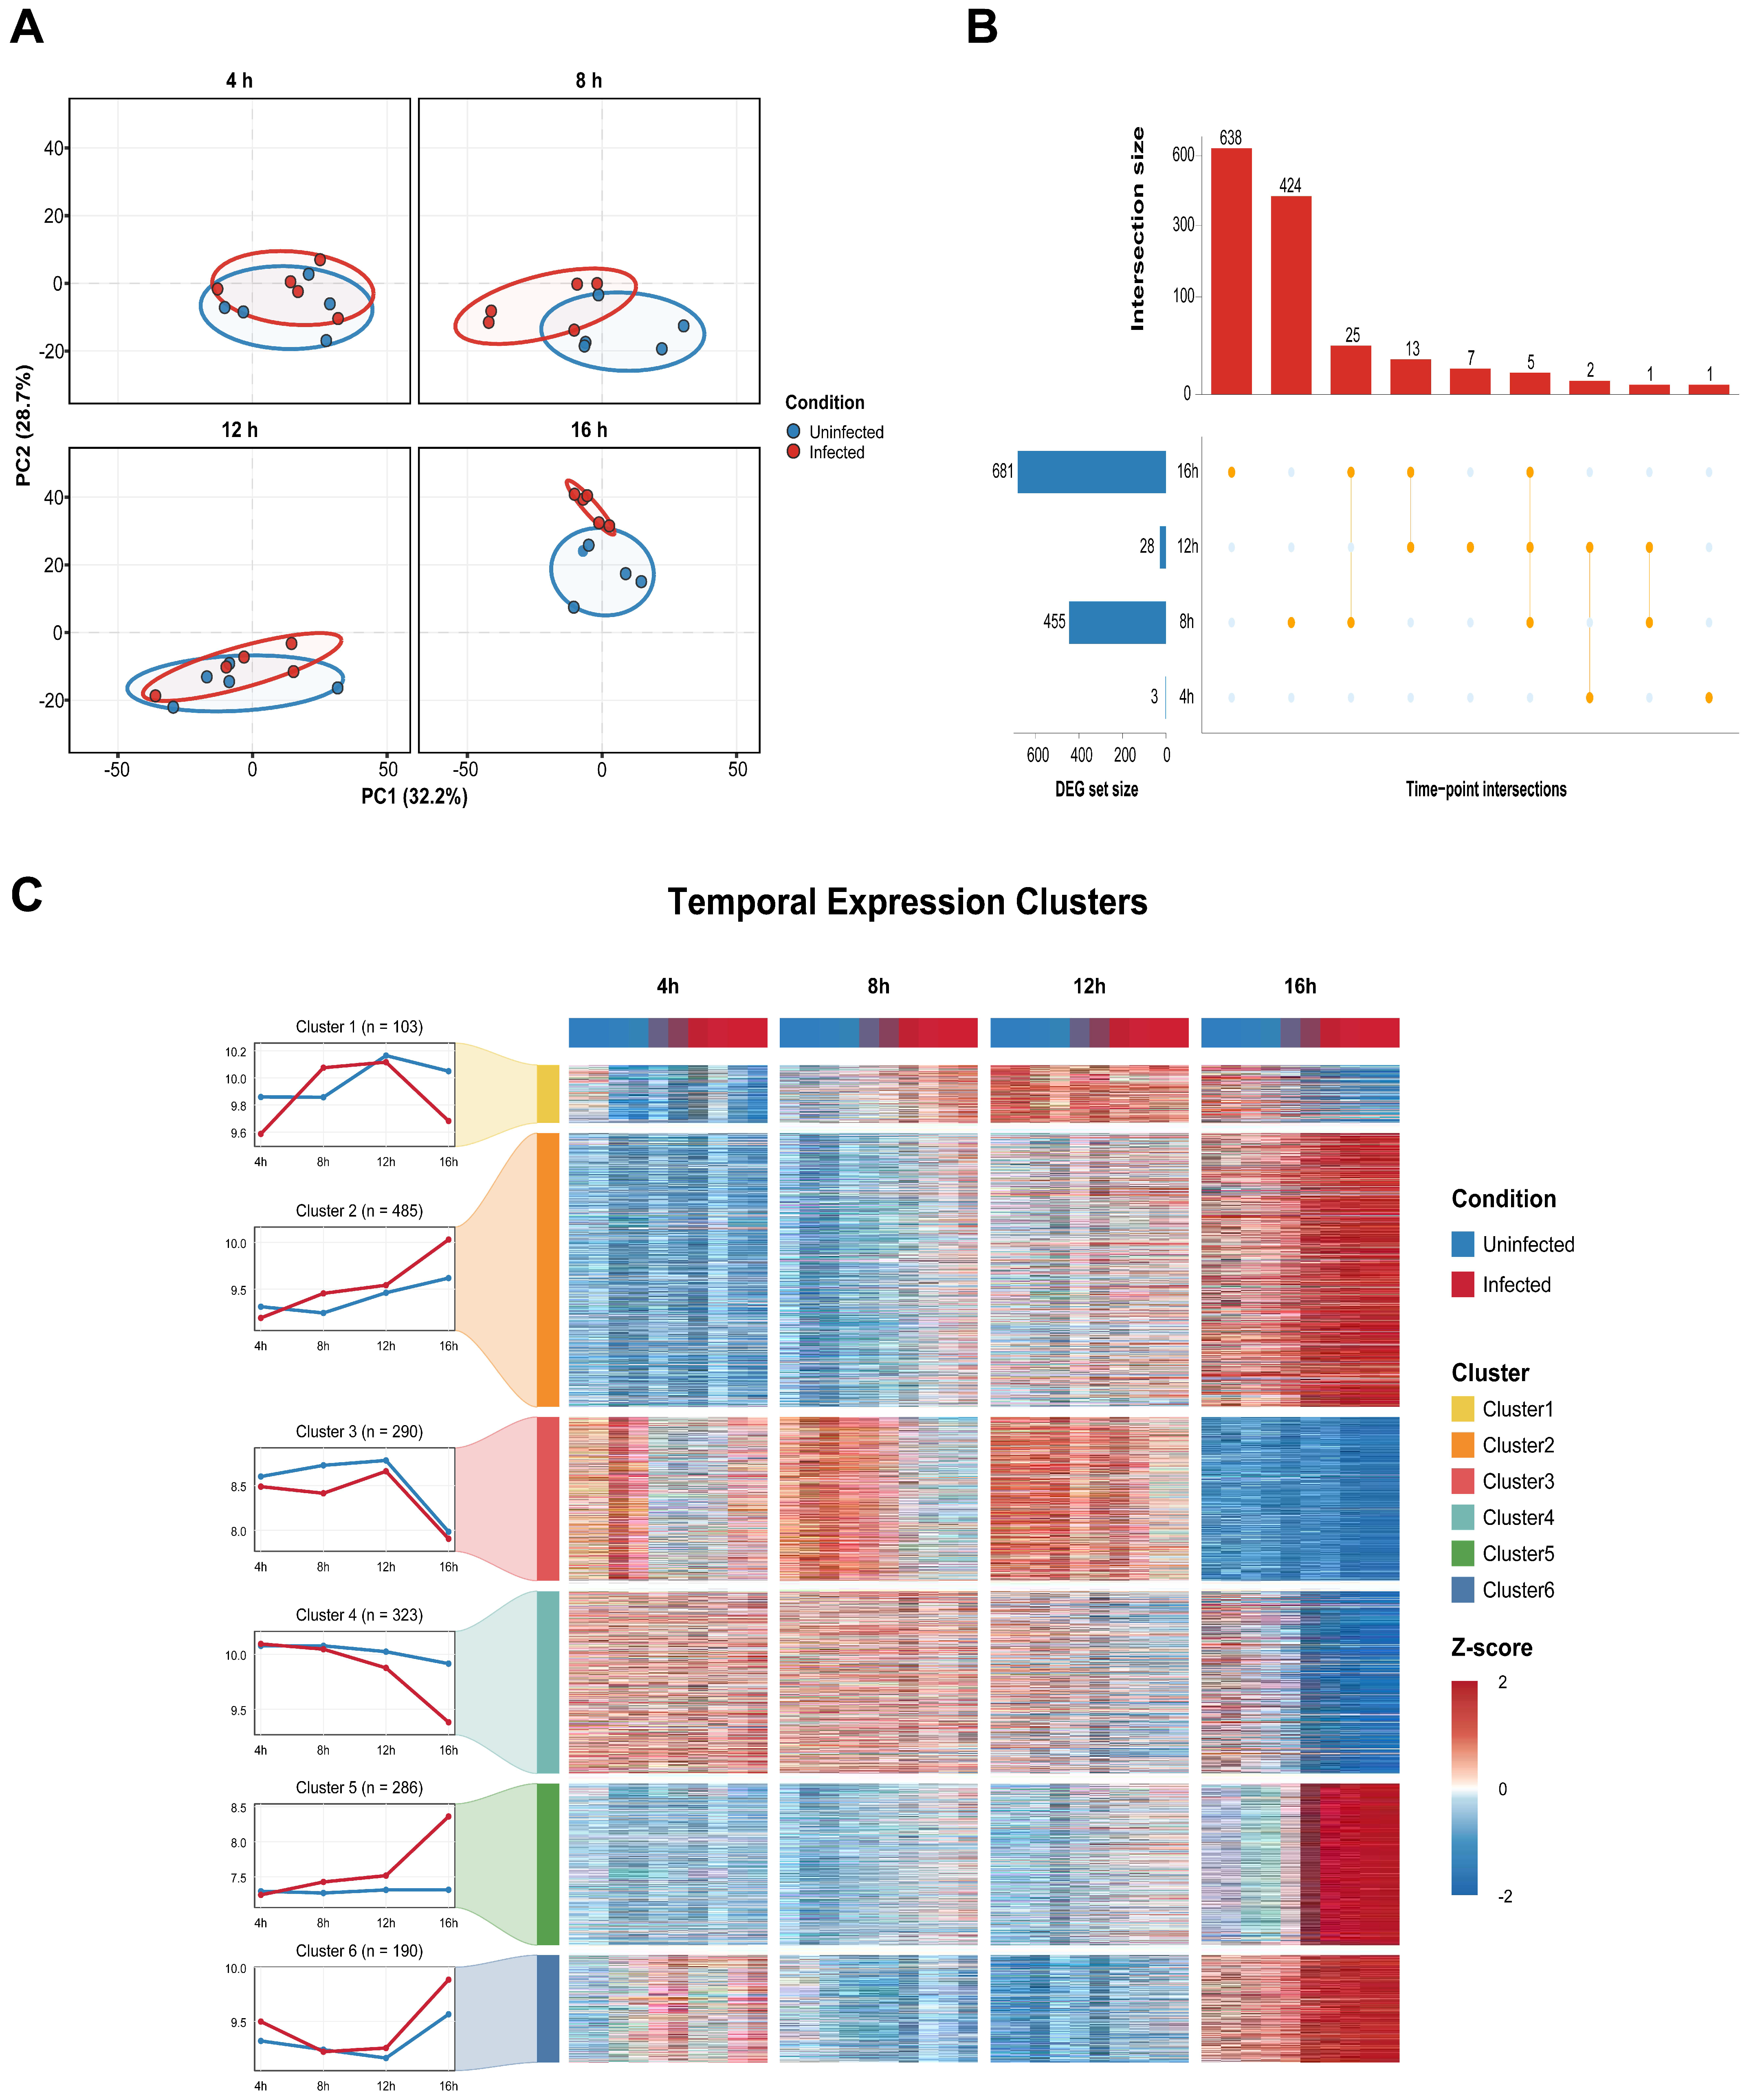
To characterize global transcriptional changes during NiV infection, we first examined sample-level expression patterns using principal component analysis. PC1 and PC2 explained 32.2% and 28.7% of the total variance, respectively, together accounting for 60.9% of the overall transcriptomic variation. The degree of separation between infected and uninfected samples varied across the infection time course and was most pronounced at 16 h post-infection, whereas partial overlap remained at earlier time points (Figure 2A). These findings indicate that the host transcriptional response to NiV infection was strongly time-dependent.
Figure 2.
Time-resolved host transcriptomic remodeling during NiV infection. (A) Principal component analysis of infected and uninfected samples collected at 4, 8, 12 and 16 h post-infection. (B) UpSet plot showing the sizes and intersections of the time-point DEG sets. (C) Temporal expression trajectories and row-scaled heatmaps of six NiV-associated gene clusters identified by time-series analysis. DEG, differentially expressed gene.
Using the predefined thresholds of |log2FC| > 0.58 and nominal p < 0.05, we identified 3, 455, 28 and 681 differentially expressed genes at 4, 8, 12 and 16 h post-infection, respectively (Table S1). UpSet analysis further showed that the 8 and 16 h comparisons contained the largest time-point-specific DEG sets, with 424 genes unique to 8 h and 638 genes unique to 16 h (Figure 2B). The marked variation in DEG numbers across the four time points indicates that NiV-induced transcriptional remodeling was not uniform throughout the infection course but was concentrated at distinct intermediate and late response stages.
Time-series analysis identified 1677 genes with significant NiV-associated temporal expression patterns. These genes were grouped into six clusters containing 103, 485, 290, 323, 286 and 190 genes, respectively (Figure 2C; Table S2). The six clusters exhibited distinct expression trajectories across the infection time course, with several clusters showing pronounced differences between infected and uninfected samples at 16 h. Collectively, these results demonstrate that NiV infection induces temporally organized host transcriptional programs and provide a structured basis for subsequent functional enrichment and pathway-level analyses.
3.2. Functional Enrichment and Pathway Activity Analyses Reveal Time-Dependent Host-Response Programs
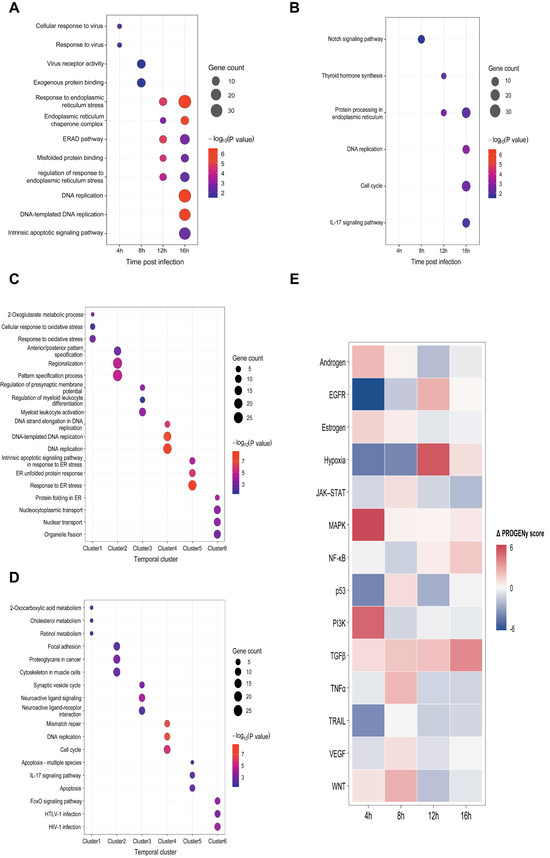
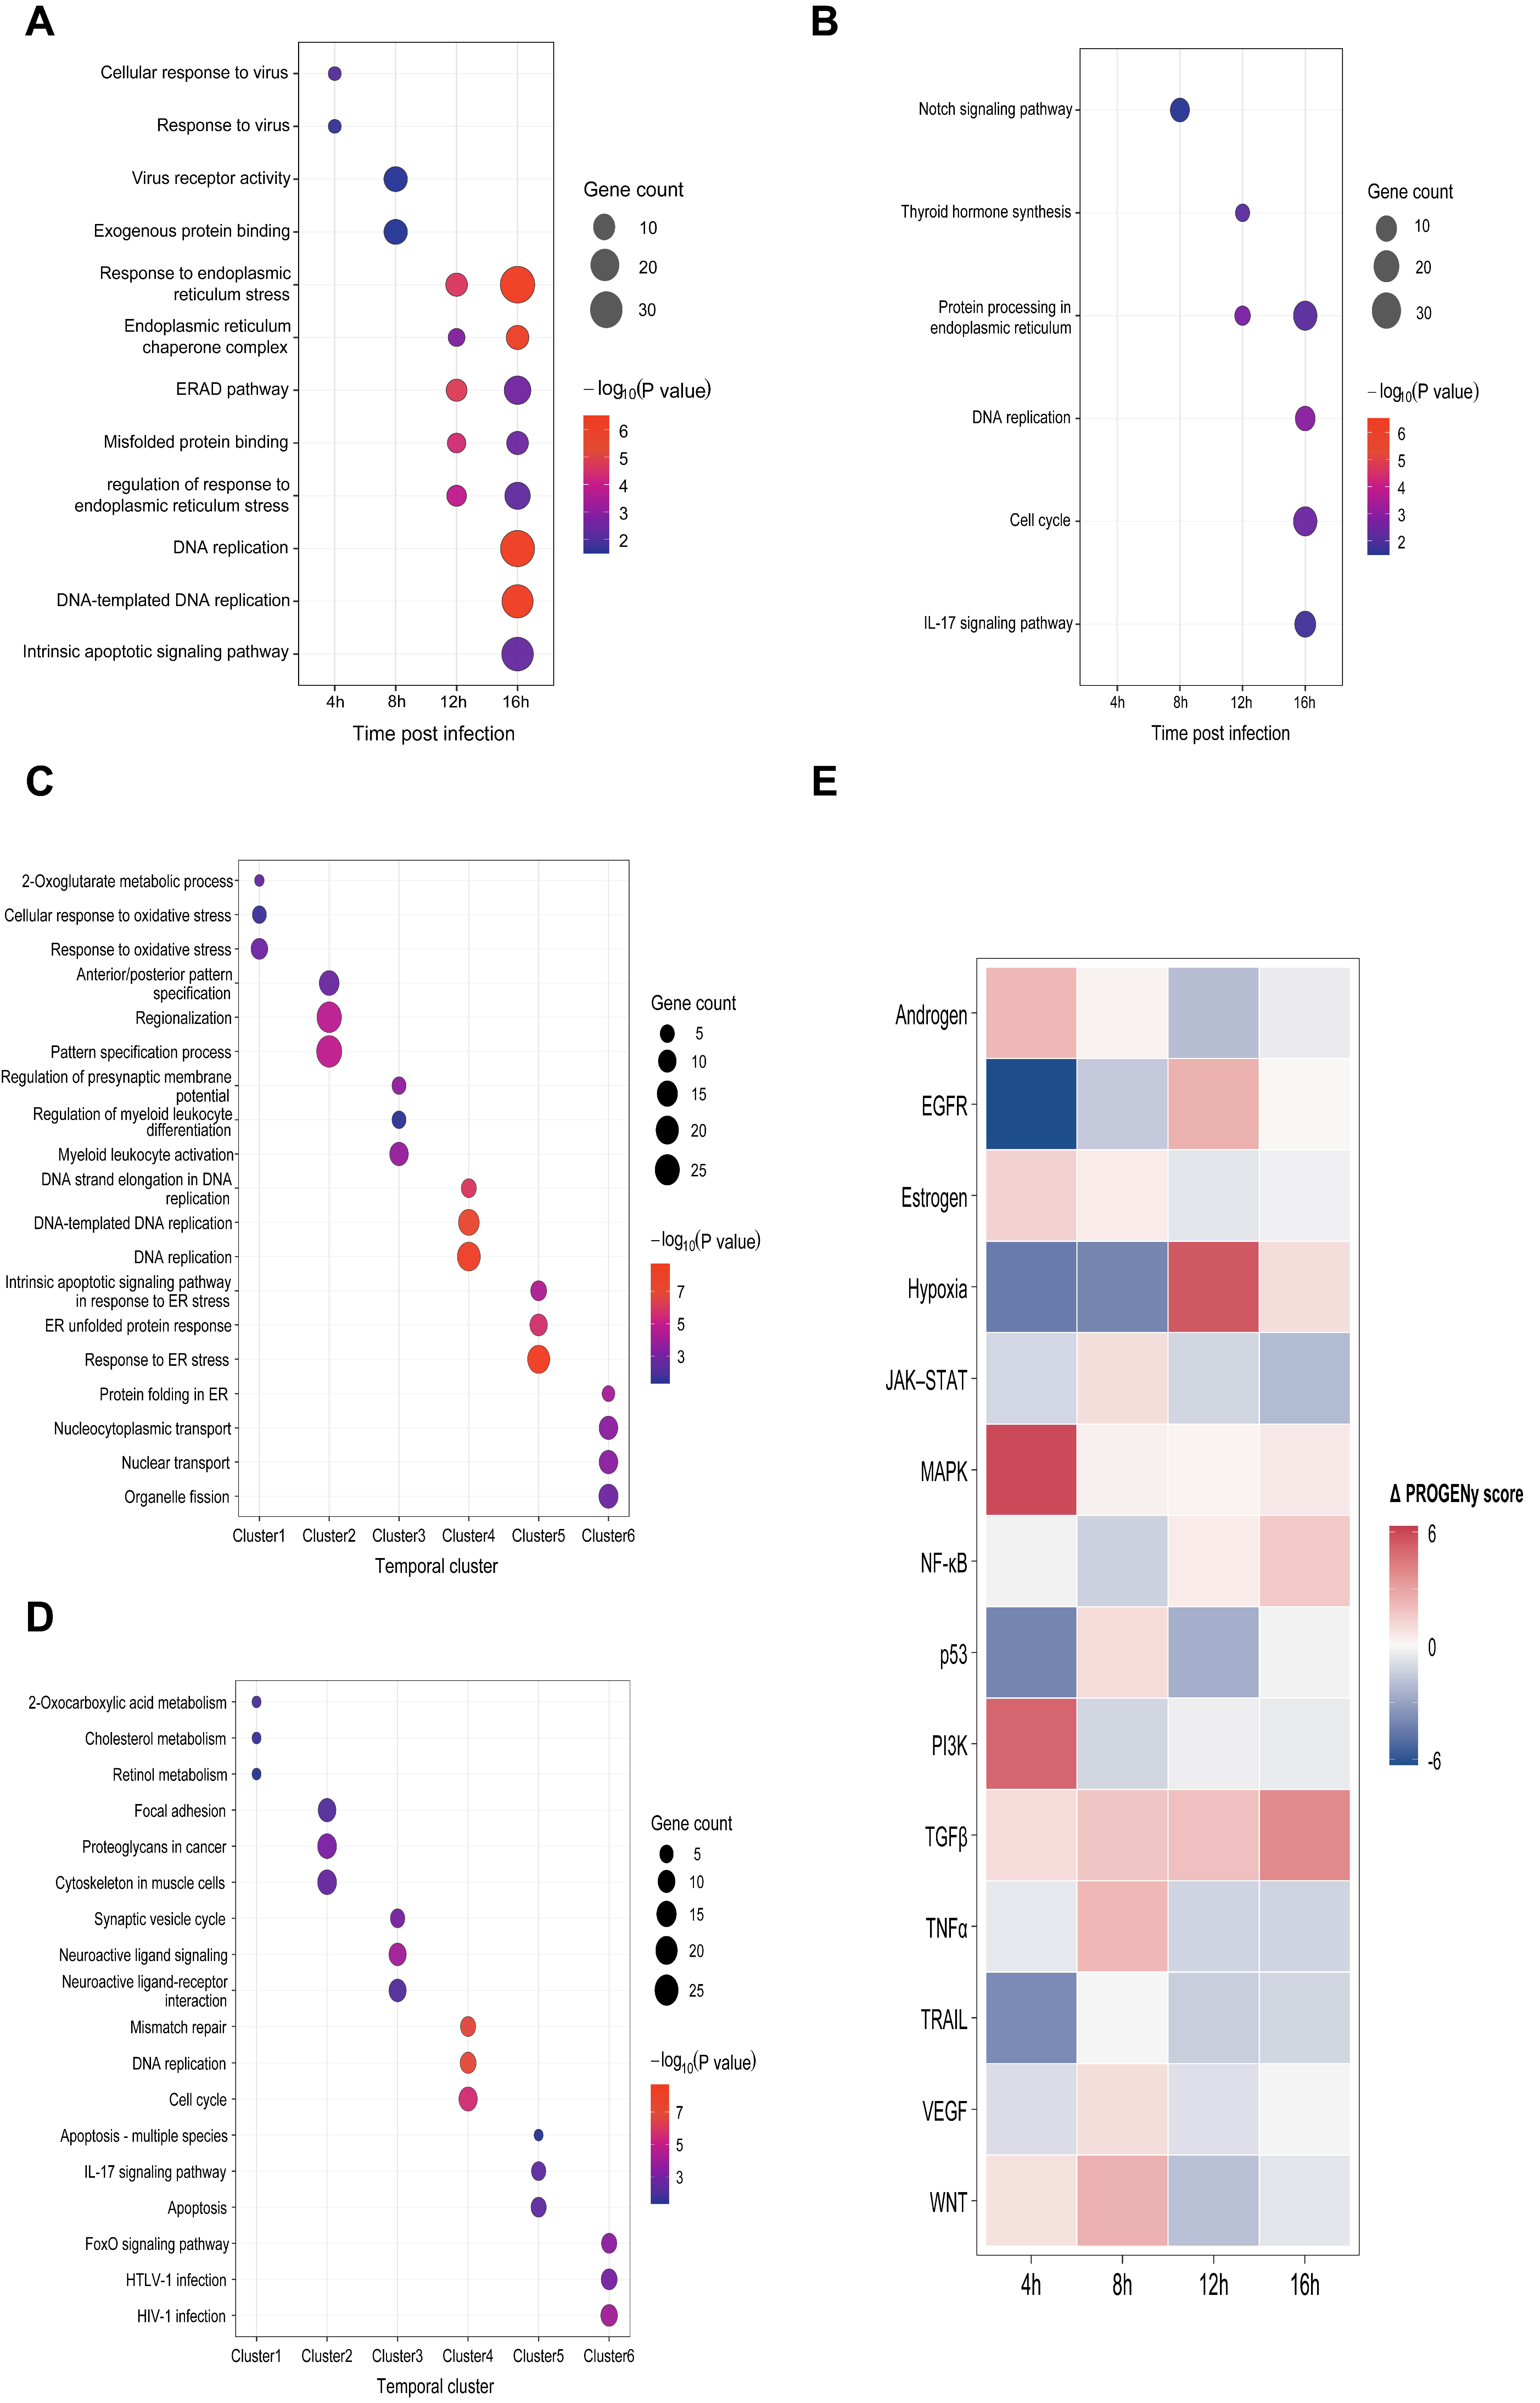
Functional enrichment of the time-point DEGs revealed a sequential reorganization of host responses over the infection course. At 4 h, the enriched GO terms were limited to cellular response to virus and response to virus. At 8 h, enrichment shifted toward virus receptor activity and exogenous protein binding, together with Notch signaling. By 12 h, endoplasmic reticulum (ER) stress and protein-quality-control processes became prominent, including response to ER stress, ER-associated degradation, misfolded protein binding and protein processing in the ER. At 16 h, these processes persisted and were accompanied by DNA replication, cell cycle, intrinsic apoptotic signaling and IL-17 signaling (Figure 3A,B). Together, these findings indicate a transition from early virus-related responses to ER proteostasis and, subsequently, to replication, cell-cycle and inflammation-associated programs.
Figure 3.
Time-resolved functional enrichment and inferred pathway activity during NiV infection. (A) GO enrichment of time-point differentially expressed genes (DEGs). (B) KEGG enrichment of time-point DEGs. (C) GO enrichment across the six temporal gene clusters. (D) KEGG enrichment across the six temporal gene clusters. In panels (A–D), bubble size indicates gene count, and color represents −log10(nominal p value). (E) Changes in canonical pathway activity inferred using PROGENy at each time point. The Δ PROGENy score was calculated as the difference between infected and uninfected samples, with positive and negative values indicating higher and lower inferred pathway activity in infected samples, respectively. DEG, differentially expressed gene.
Functional annotation of the six temporal gene clusters further resolved these changes into distinct biological modules. Across the GO and KEGG analyses, the clusters were associated with oxidative and metabolic stress, developmental patterning, membrane-potential and immune-related processes, DNA replication and cell-cycle control, ER stress and apoptosis, and protein folding and nuclear transport (Figure 3C,D). These results indicate that the distinct temporal expression trajectories represented functionally differentiated but interconnected components of the host response.
Pathway activity inference revealed a parallel shift in canonical signaling. Positive Δ PROGENy scores were dominated by MAPK and PI3K at 4 h, WNT, TNF-α and TGF-β at 8 h, and hypoxia, EGFR and TGF-β at 12 h. At 16 h, TGF-β showed the strongest positive change, accompanied by positive shifts in NF-κB, hypoxia and MAPK, whereas JAK–STAT, TNF-α, TRAIL and WNT showed negative changes (Figure 3E). These inferred activity patterns further suggest extensive time-dependent remodeling of stress-, inflammatory- and growth-factor-associated signaling during NiV infection (Table S3).
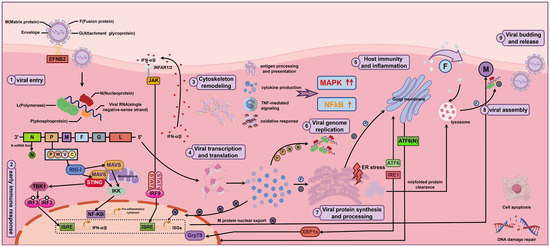
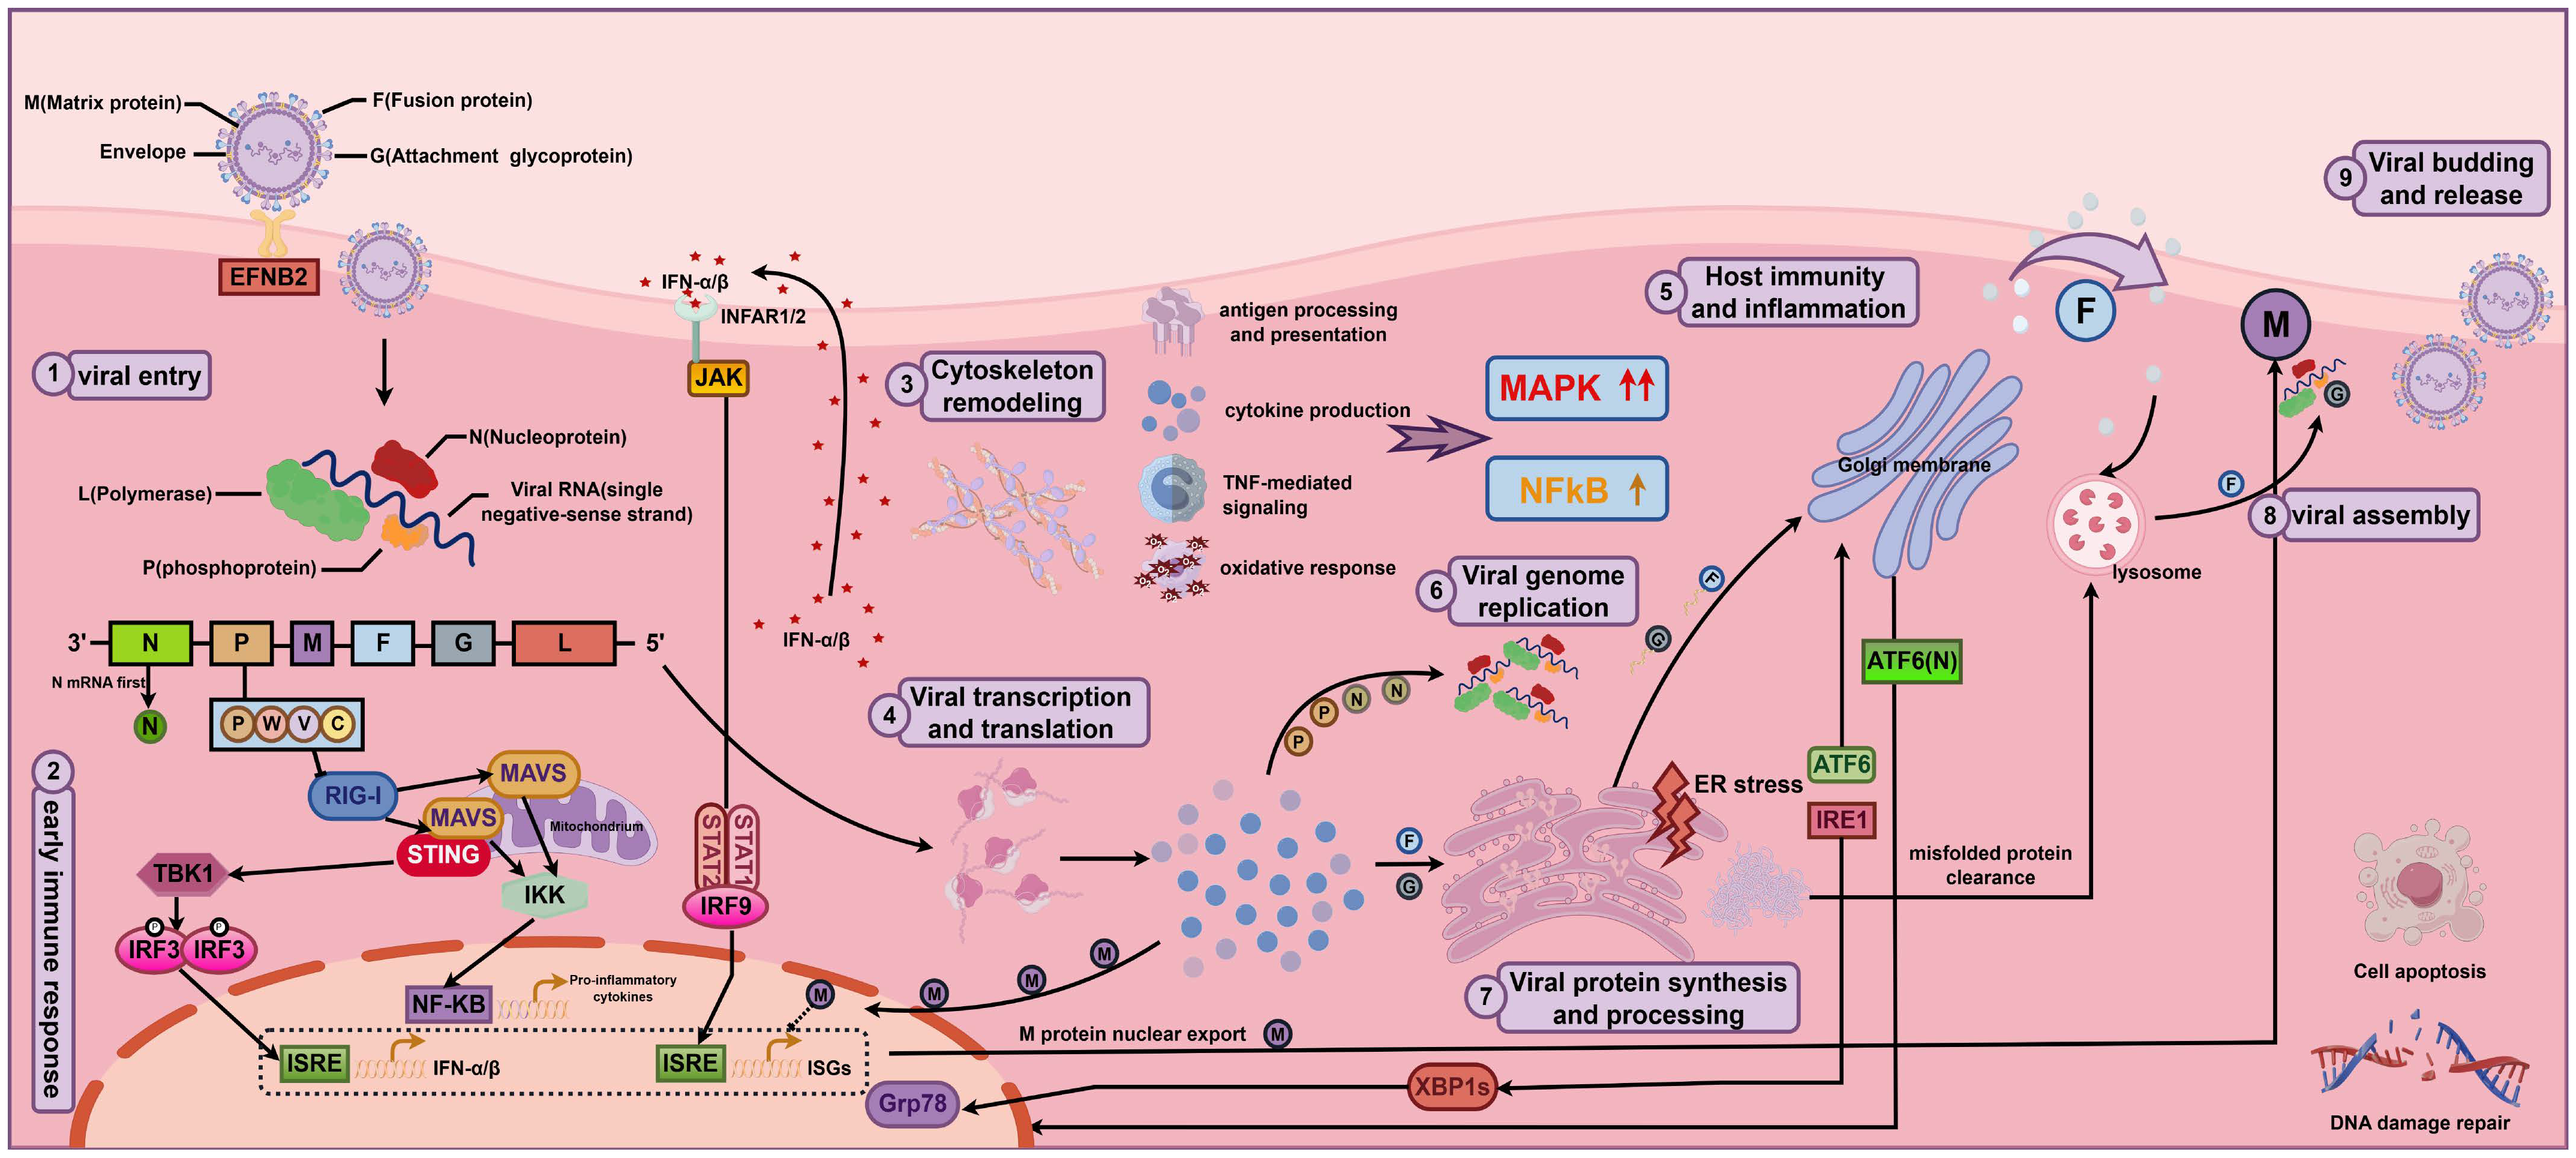
To facilitate interpretation of these findings in the context of infection progression, we integrated established knowledge of NiV genome organization, viral entry, innate immune antagonism, assembly and release with the time-resolved transcriptomic results to construct a schematic of NiV infection progression (Figure 4). The schematic places viral entry and early immune sensing, cytoskeletal remodeling, viral transcription and genome replication, ER stress and protein processing, and virion assembly, budding and release within a unified infection-progression framework. It provides an integrated view of the NiV infection process and biological context for the subsequent analyses.
Figure 4.
Integrated schematic of NiV infection progression and host responses. The numbered stages depict viral entry, early immune sensing, cytoskeletal remodeling, viral transcription and translation, host immunity and inflammation, genome replication, viral protein synthesis and processing, virion assembly, and budding and release. Host-response elements are informed by the time-resolved transcriptomic analyses, whereas the viral life-cycle framework is based on established NiV biology.
3.3. Core Temporal Genes Show Broad Similarity to Disease-Associated Transcriptional Signatures
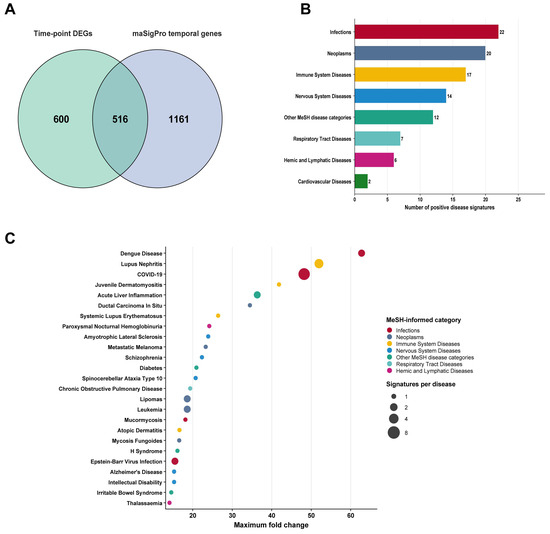
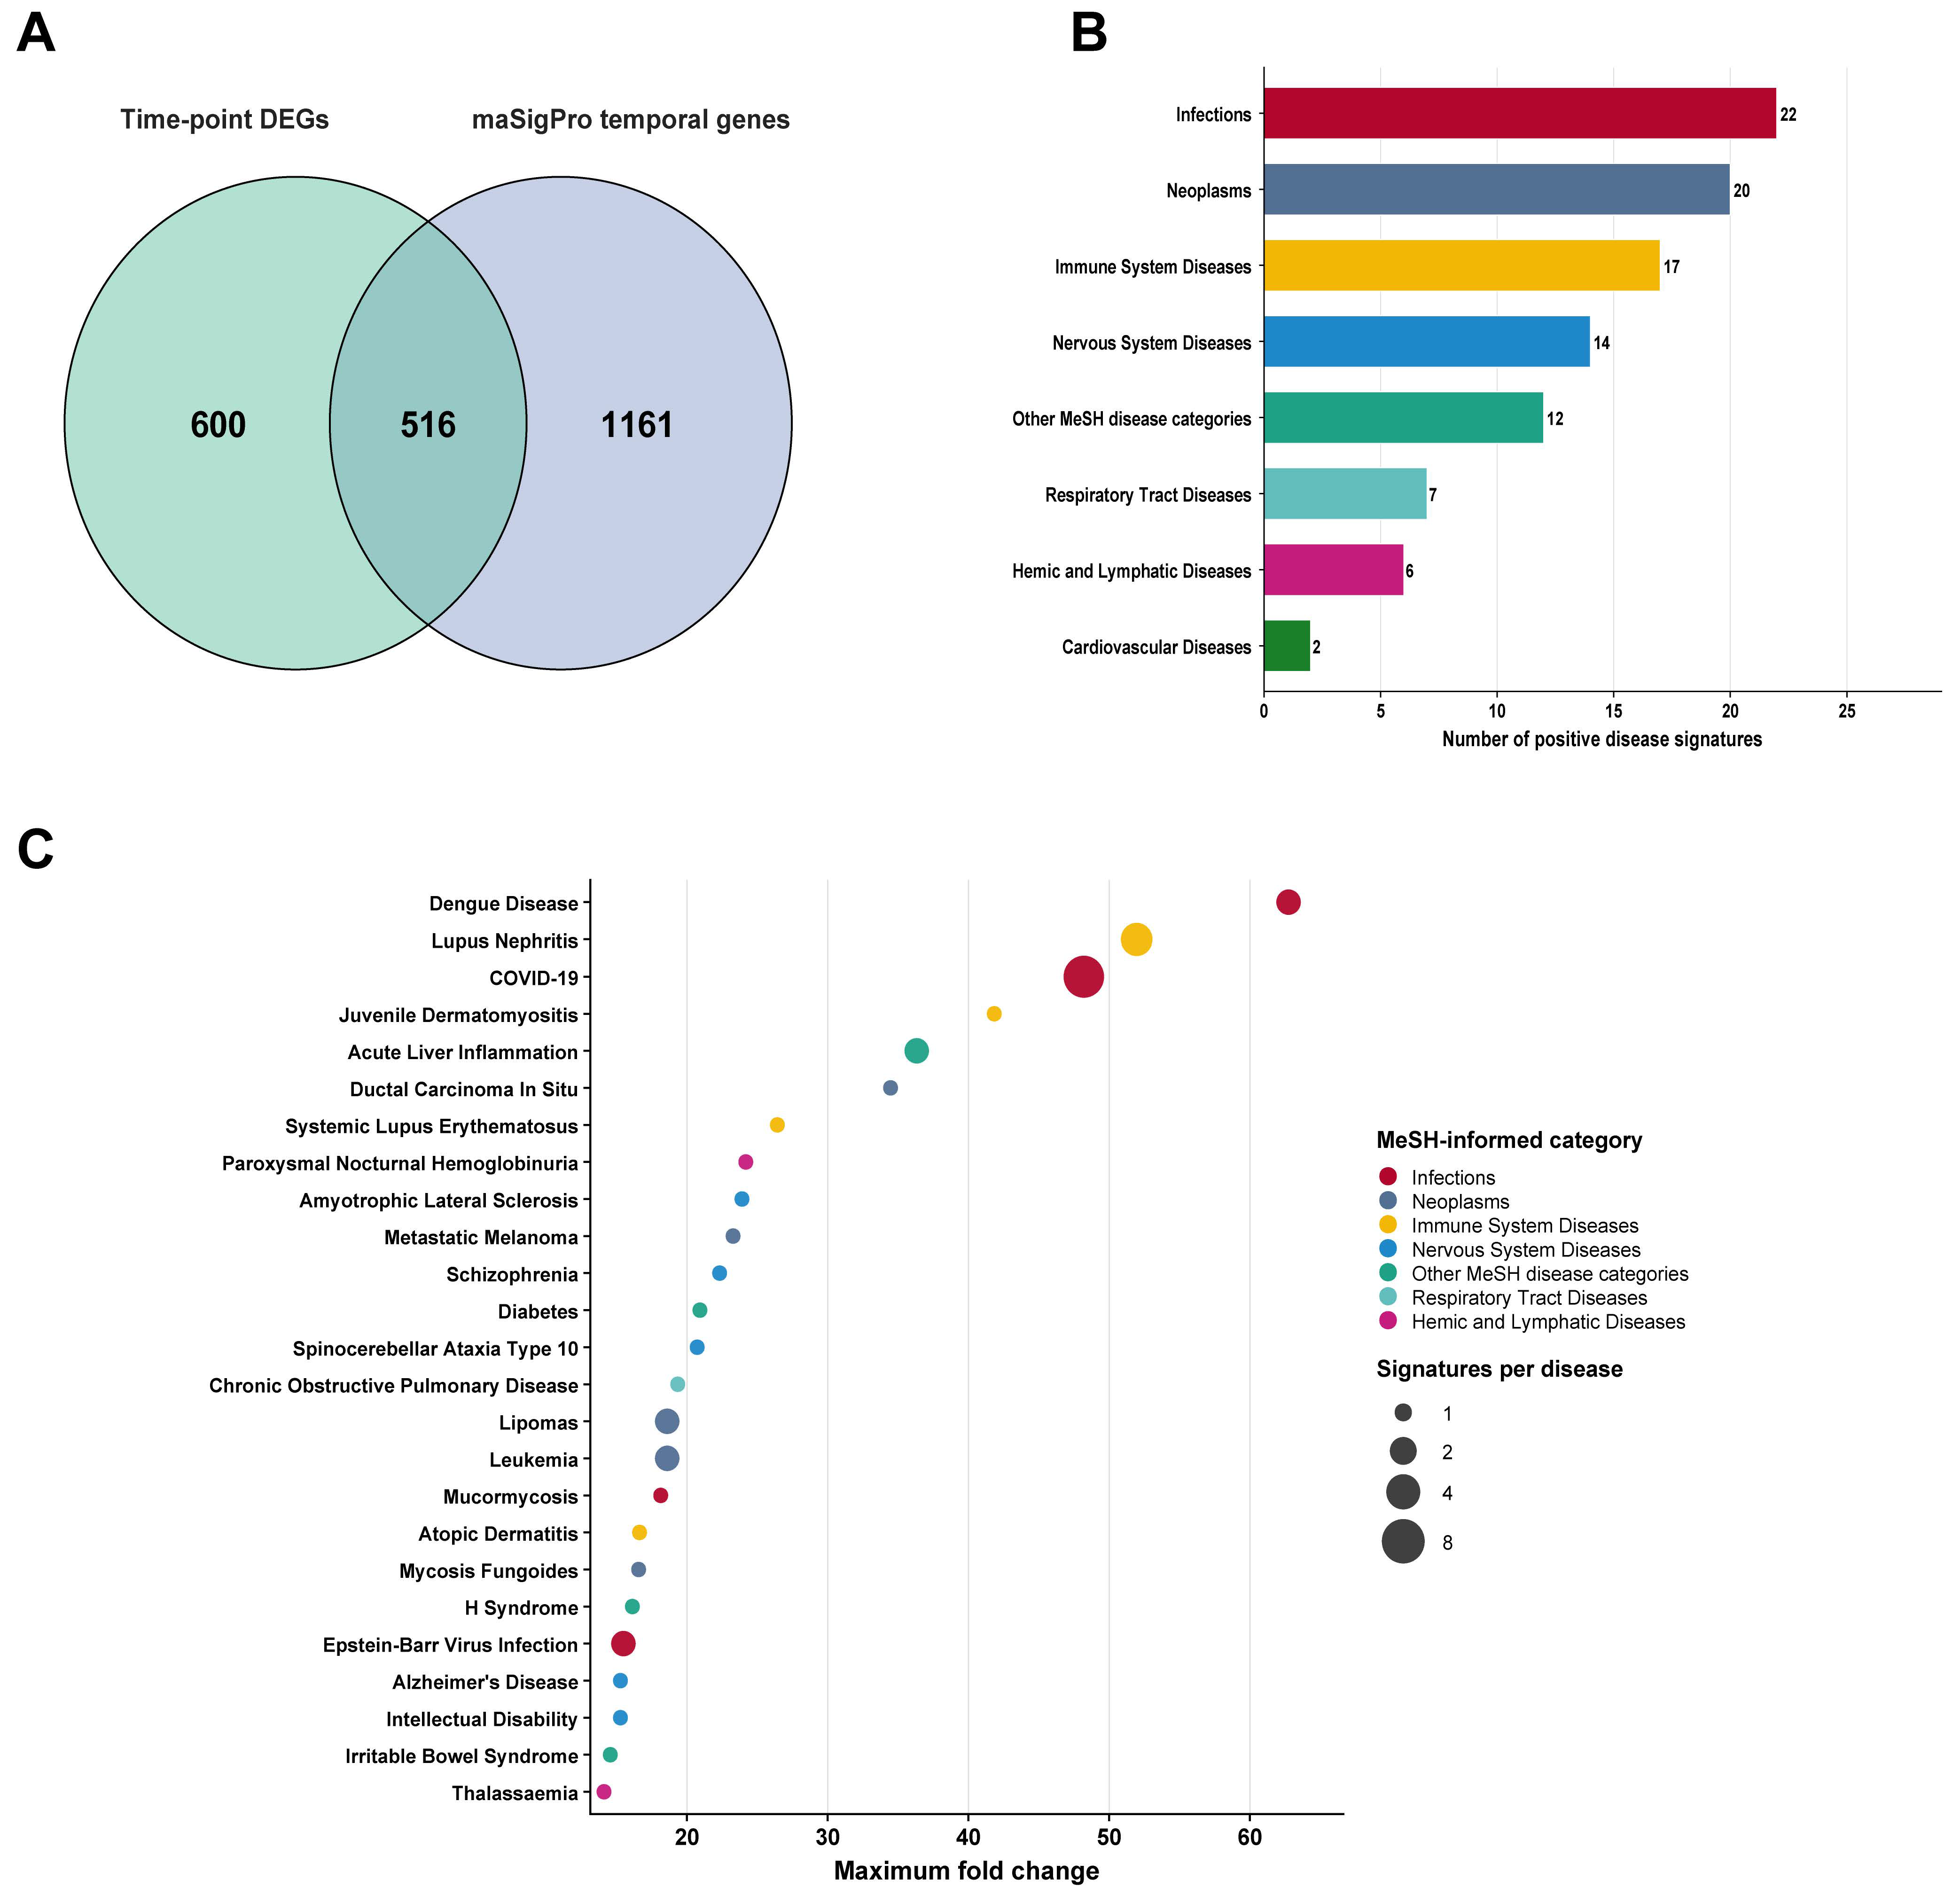
To obtain a focused gene set reflecting both time-point-specific differential expression and infection-associated temporal dynamics, we intersected the union of all time-point differentially expressed genes with the genes identified by time-series analysis. The union of time-point differentially expressed genes comprised 1116 genes, whereas 1677 genes exhibited significant temporal expression patterns. Their intersection contained 516 genes, which were defined as core temporal genes (Figure 5A; Table S4).
Figure 5.
Definition of core temporal genes and assessment of disease associations. (A) Selection of core temporal genes based on the intersection between the union of time-point differentially expressed genes and the genes identified by time-series analysis. (B) Distribution of the top 100 diseases showing positive transcriptional-signature associations with the core temporal genes across MeSH disease categories. (C) Top 25 positively associated diseases ranked by maximum fold change. Colors indicate the corresponding MeSH disease categories, and point size represents the number of positive association entries for each disease.
Disease-signature association analysis using DiSignAtlas was performed to characterize the disease-related biological context of the core temporal genes and evaluate their relevance as a NiV-associated host-response signature for downstream analyses.
Among the top 100 positively associated diseases and their corresponding MeSH disease classifications, Infections, Neoplasms, Immune System Diseases, and Nervous System Diseases were the four most frequently represented categories. These categories comprised 22, 20, 17 and 14 positively associated disease signatures, respectively (Figure 5B).
At the individual-disease level, the highest-ranked associations included dengue disease, lupus nephritis, COVID-19, juvenile dermatomyositis and acute liver inflammation (Figure 5C; Table S4). Importantly, these results reflect similarities between transcriptional signatures and should not be interpreted as evidence of causal relationships or direct clinical associations among these diseases.
Collectively, this analysis indicates that the core temporal genes contain broad disease-related transcriptional information and supports their use as a NiV-associated host-response signature for subsequent functional analyses and drug-repositioning studies.
3.4. Host-Factor Stratification and Multi-Evidence Integration Define an Integrated Candidate Drug Set
Based on HVIDB annotations, the 516 core temporal genes were classified into 58 host dependency factors, 18 host restriction factors, and 440 residual host-response genes.
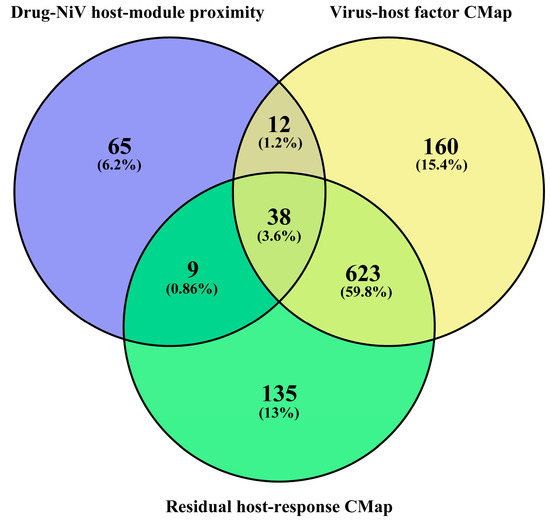
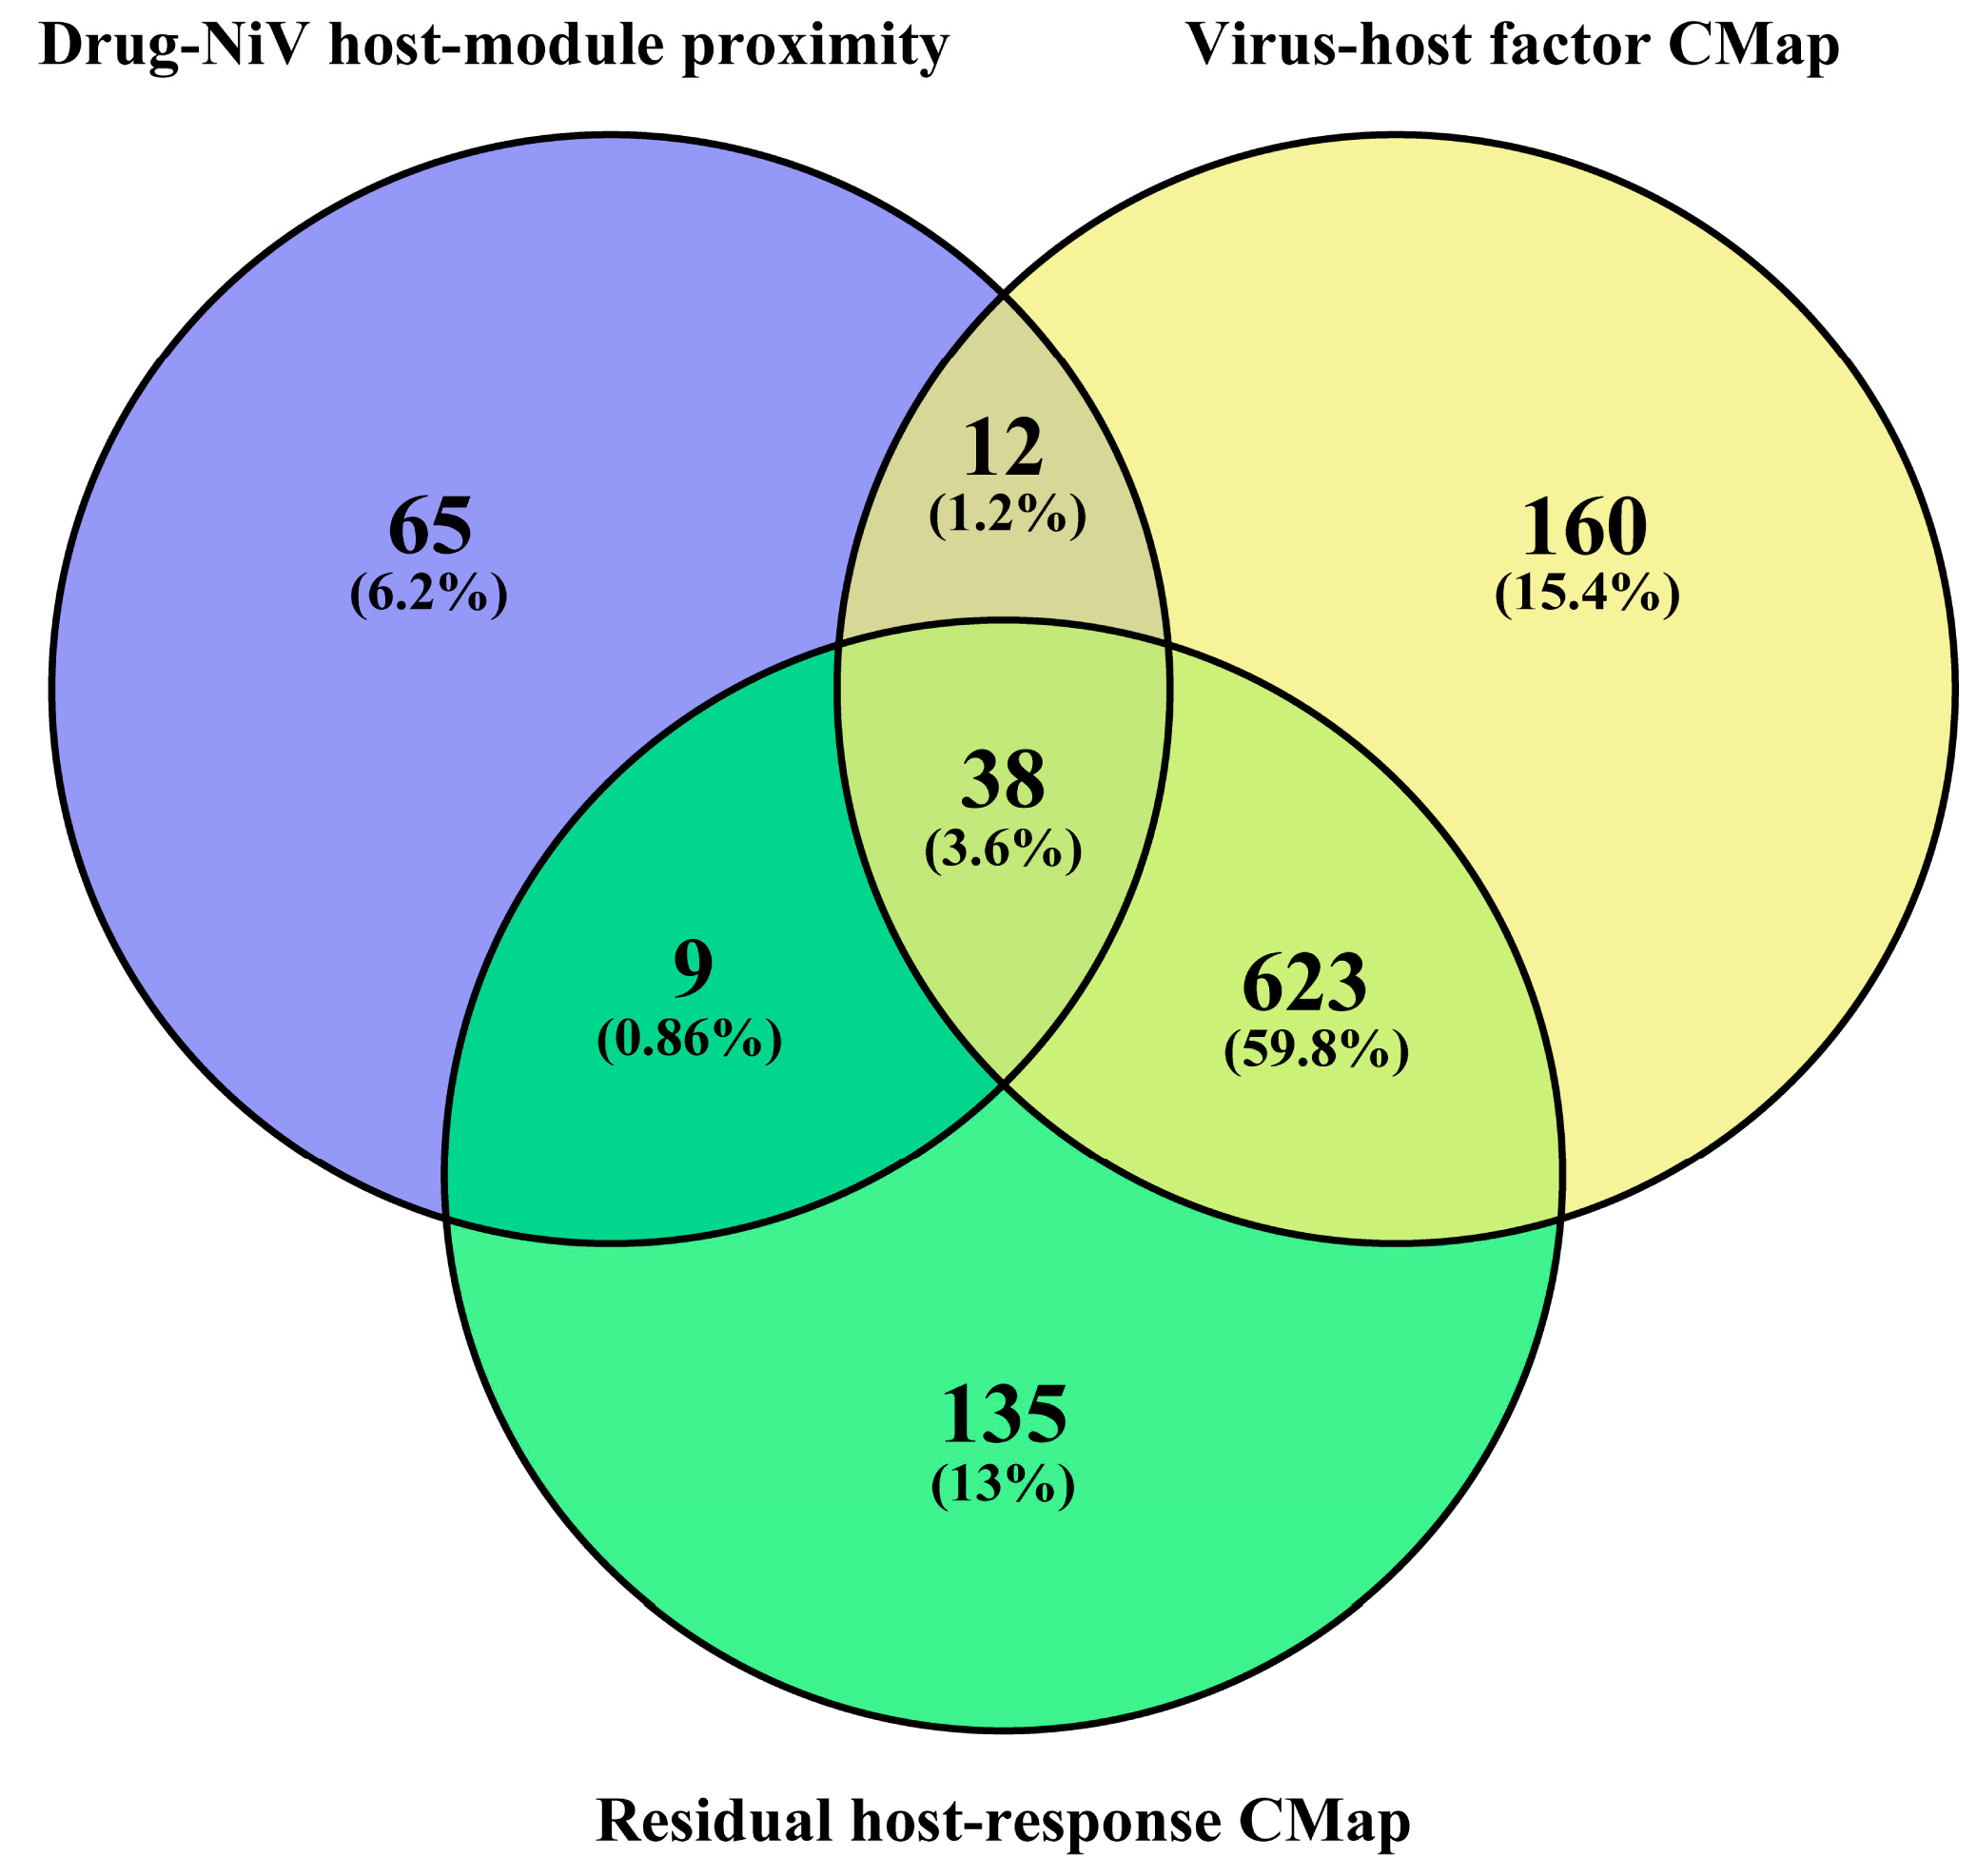
The virus–host factor CMap analysis, residual host-response CMap analysis, and PrimeKG-based network-proximity analysis identified 833, 805, and 124 candidate drugs approved by the U.S. Food and Drug Administration (FDA), respectively. The two transcriptomic-reversal branches showed considerable overlap. The three-way intersection of the candidate drug sets comprised 38 drugs, which were defined as the integrated candidate drug set (Figure 6; Table S6). This integrated set represents convergent computational evidence for host-directed drug repositioning.
Figure 6.
Overlap of candidate drug sets identified by three complementary drug-repositioning analyses. The Venn diagram shows the candidate drugs identified by the virus–host factor CMap analysis, residual host-response CMap analysis, and PrimeKG-based network-proximity analysis. The three-way intersection comprised 38 drugs and was defined as the integrated candidate drug set.
3.5. Evidence-Guided Prioritization of Host-Directed Candidate Drugs
The 38 drugs in the integrated candidate drug set were subjected to a first-tier pathway-direction filter. The literature-curated NiV host-pathway directionality reference summarized the reported regulation and biological consequences of NiV-associated host pathways and provided the biological basis for this assessment (Table S7). Each candidate drug was evaluated in the context of NiV pathobiology to determine whether its known pharmacological effects were broadly compatible with host-protective objectives. Drugs were excluded when their actions were expected to reinforce infection-associated injury or impair antiviral signaling, cell-survival, or tissue-repair processes. This filtering step excluded 24 drugs and retained 14 candidates for further prioritization (Table S8). The pharmacological and clinical characteristics of the 14 shortlisted candidates, including Anatomical Therapeutic Chemical (ATC) codes, mechanisms of action, targets, and clinical indications, are summarized (Table 1).
Table 1.
Pharmacological characteristics of the 14 candidate drugs.
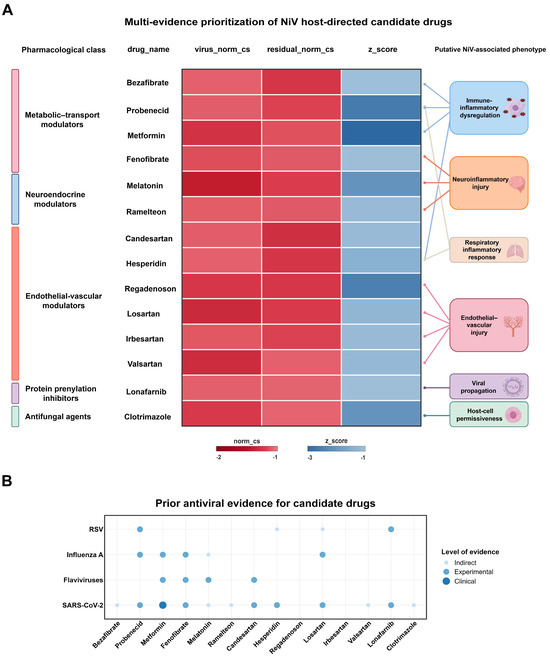
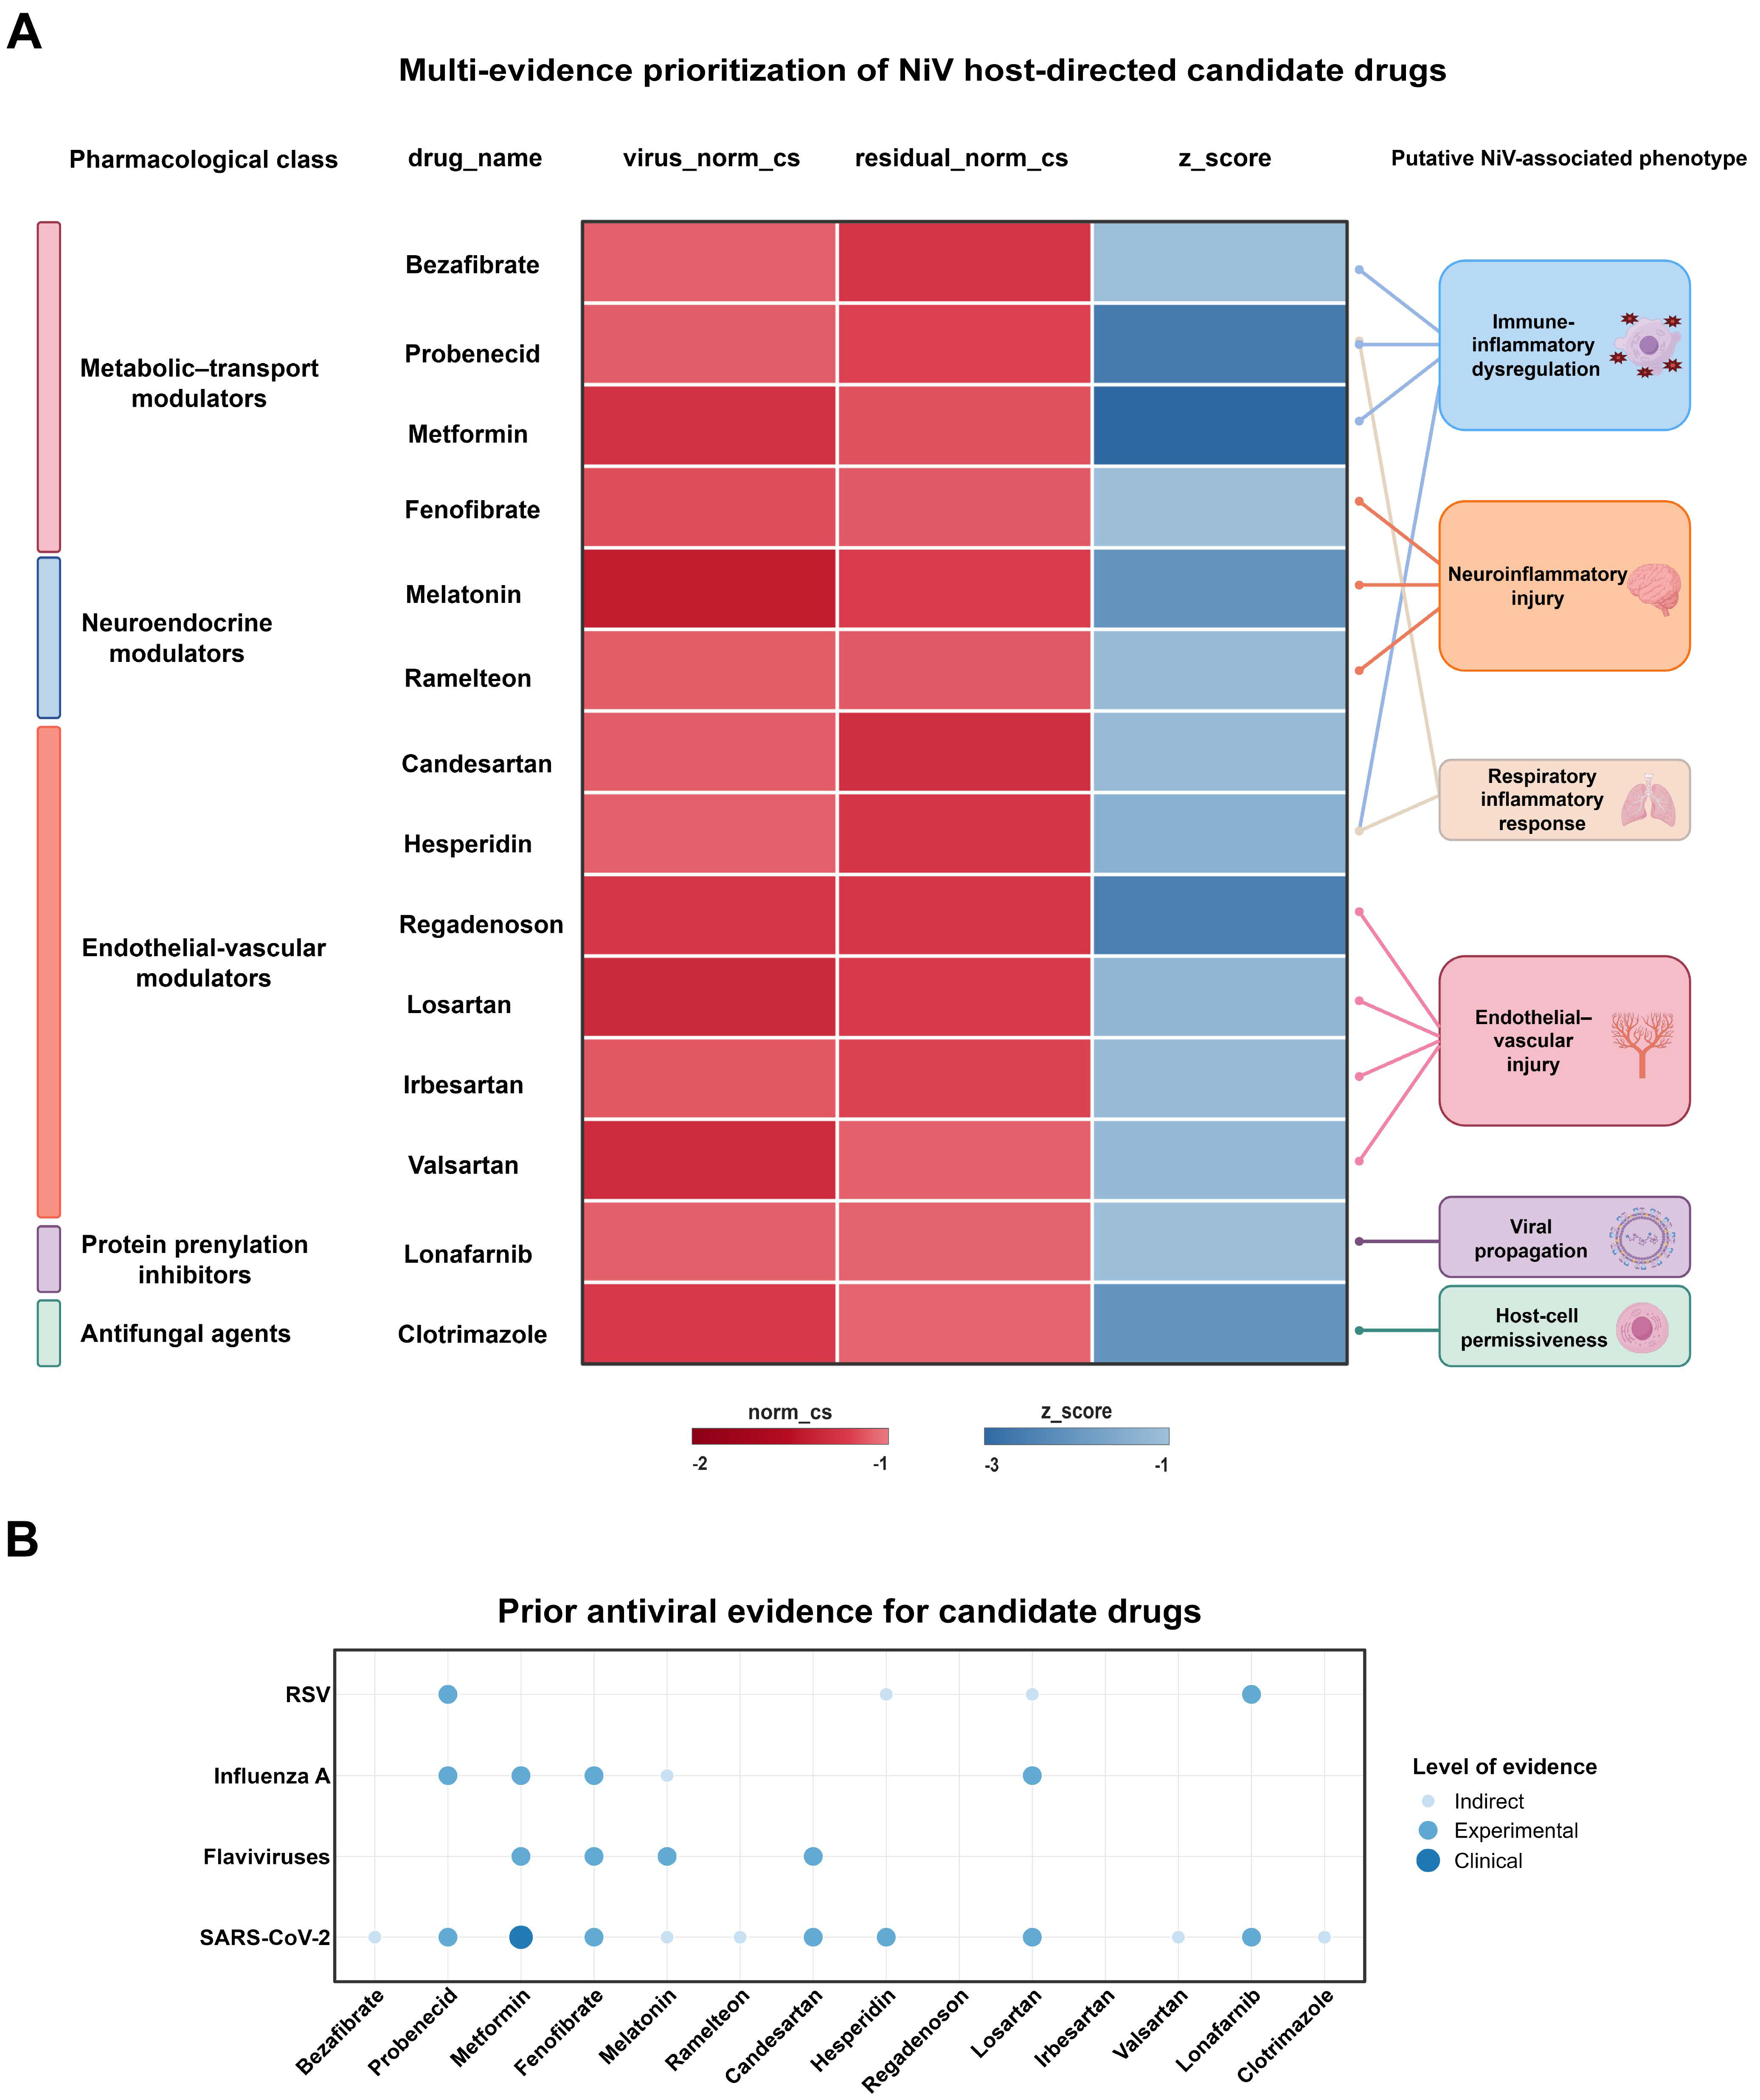
The 14 shortlisted candidates were subsequently compared using an integrated prioritization matrix comprising the virus–host factor normalized connectivity score (virus_norm_cs), the residual host-response normalized connectivity score (residual_norm_cs), the network-proximity z_score, and putative NiV-associated phenotype relevance (Figure 7A). More negative virus_norm_cs and residual_norm_cs values indicated stronger inverse connectivity with the corresponding transcriptional signatures, whereas a more negative network-proximity z_score indicated closer-than-expected proximity between drug targets and the NiV-associated host module.
Figure 7.
Candidate drug prioritization and prior antiviral evidence. (A) Integrated prioritization matrix of the 14 shortlisted candidates, showing pharmacological category, drug name, virus–host factor normalized connectivity score (virus_norm_cs), residual host-response normalized connectivity score (residual_norm_cs), network-proximity z_score, and putative NiV-associated phenotype relevance. More negative virus_norm_cs and residual_norm_cs values indicate stronger predicted transcriptional reversal, whereas a more negative network-proximity z_score indicates closer-than-expected proximity to the NiV-associated host module. (B) Prior antiviral or host-modulatory evidence for the shortlisted candidates across respiratory syncytial virus, influenza A virus, flaviviruses, and SARS-CoV-2. Point color indicates the level of evidence.
Prior antiviral or host-modulatory evidence for the shortlisted candidates was further summarized across respiratory syncytial virus, influenza A virus, flaviviruses, and SARS-CoV-2, with the available evidence categorized as indirect, experimental, or clinical (Figure 7B). Integration of pathway-directional consistency, pharmacological suitability, normalized connectivity scores, network proximity, phenotype relevance, and prior antiviral evidence prioritized metformin, fenofibrate, lonafarnib, and probenecid as four leading candidates for subsequent analysis.
3.6. Gene-Level Reversal Patterns and Host-Network Context of Prioritized Candidate Drugs
To interpret the transcriptional effects of metformin, fenofibrate, lonafarnib, and probenecid beyond the aggregate CMap connectivity scores, we interrogated the CMap results at the gene level. Gene-level reversal analysis was restricted to genes with available LINCS gene-level z-scores and included both NiV-associated host factors and residual host-response genes. For the host-factor signature, favorable reversal corresponded to compound-induced downregulation of host dependency factors (HDFs) or upregulation of host restriction factors (HRFs). Of the 76 annotated host-factor genes, 64 (84.2%) had available LINCS gene-level z-scores, whereas 231 of the 440 residual host-response genes (52.5%) were evaluable. For the residual host-response signature, favorable reversal was defined according to whether the compound-induced expression change opposed the corresponding NiV-associated expression direction.
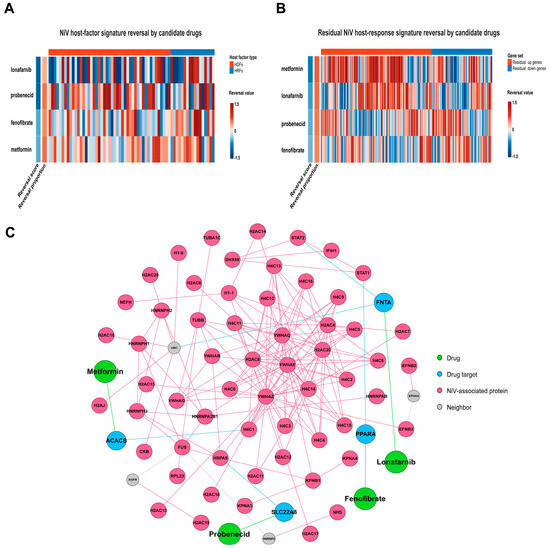
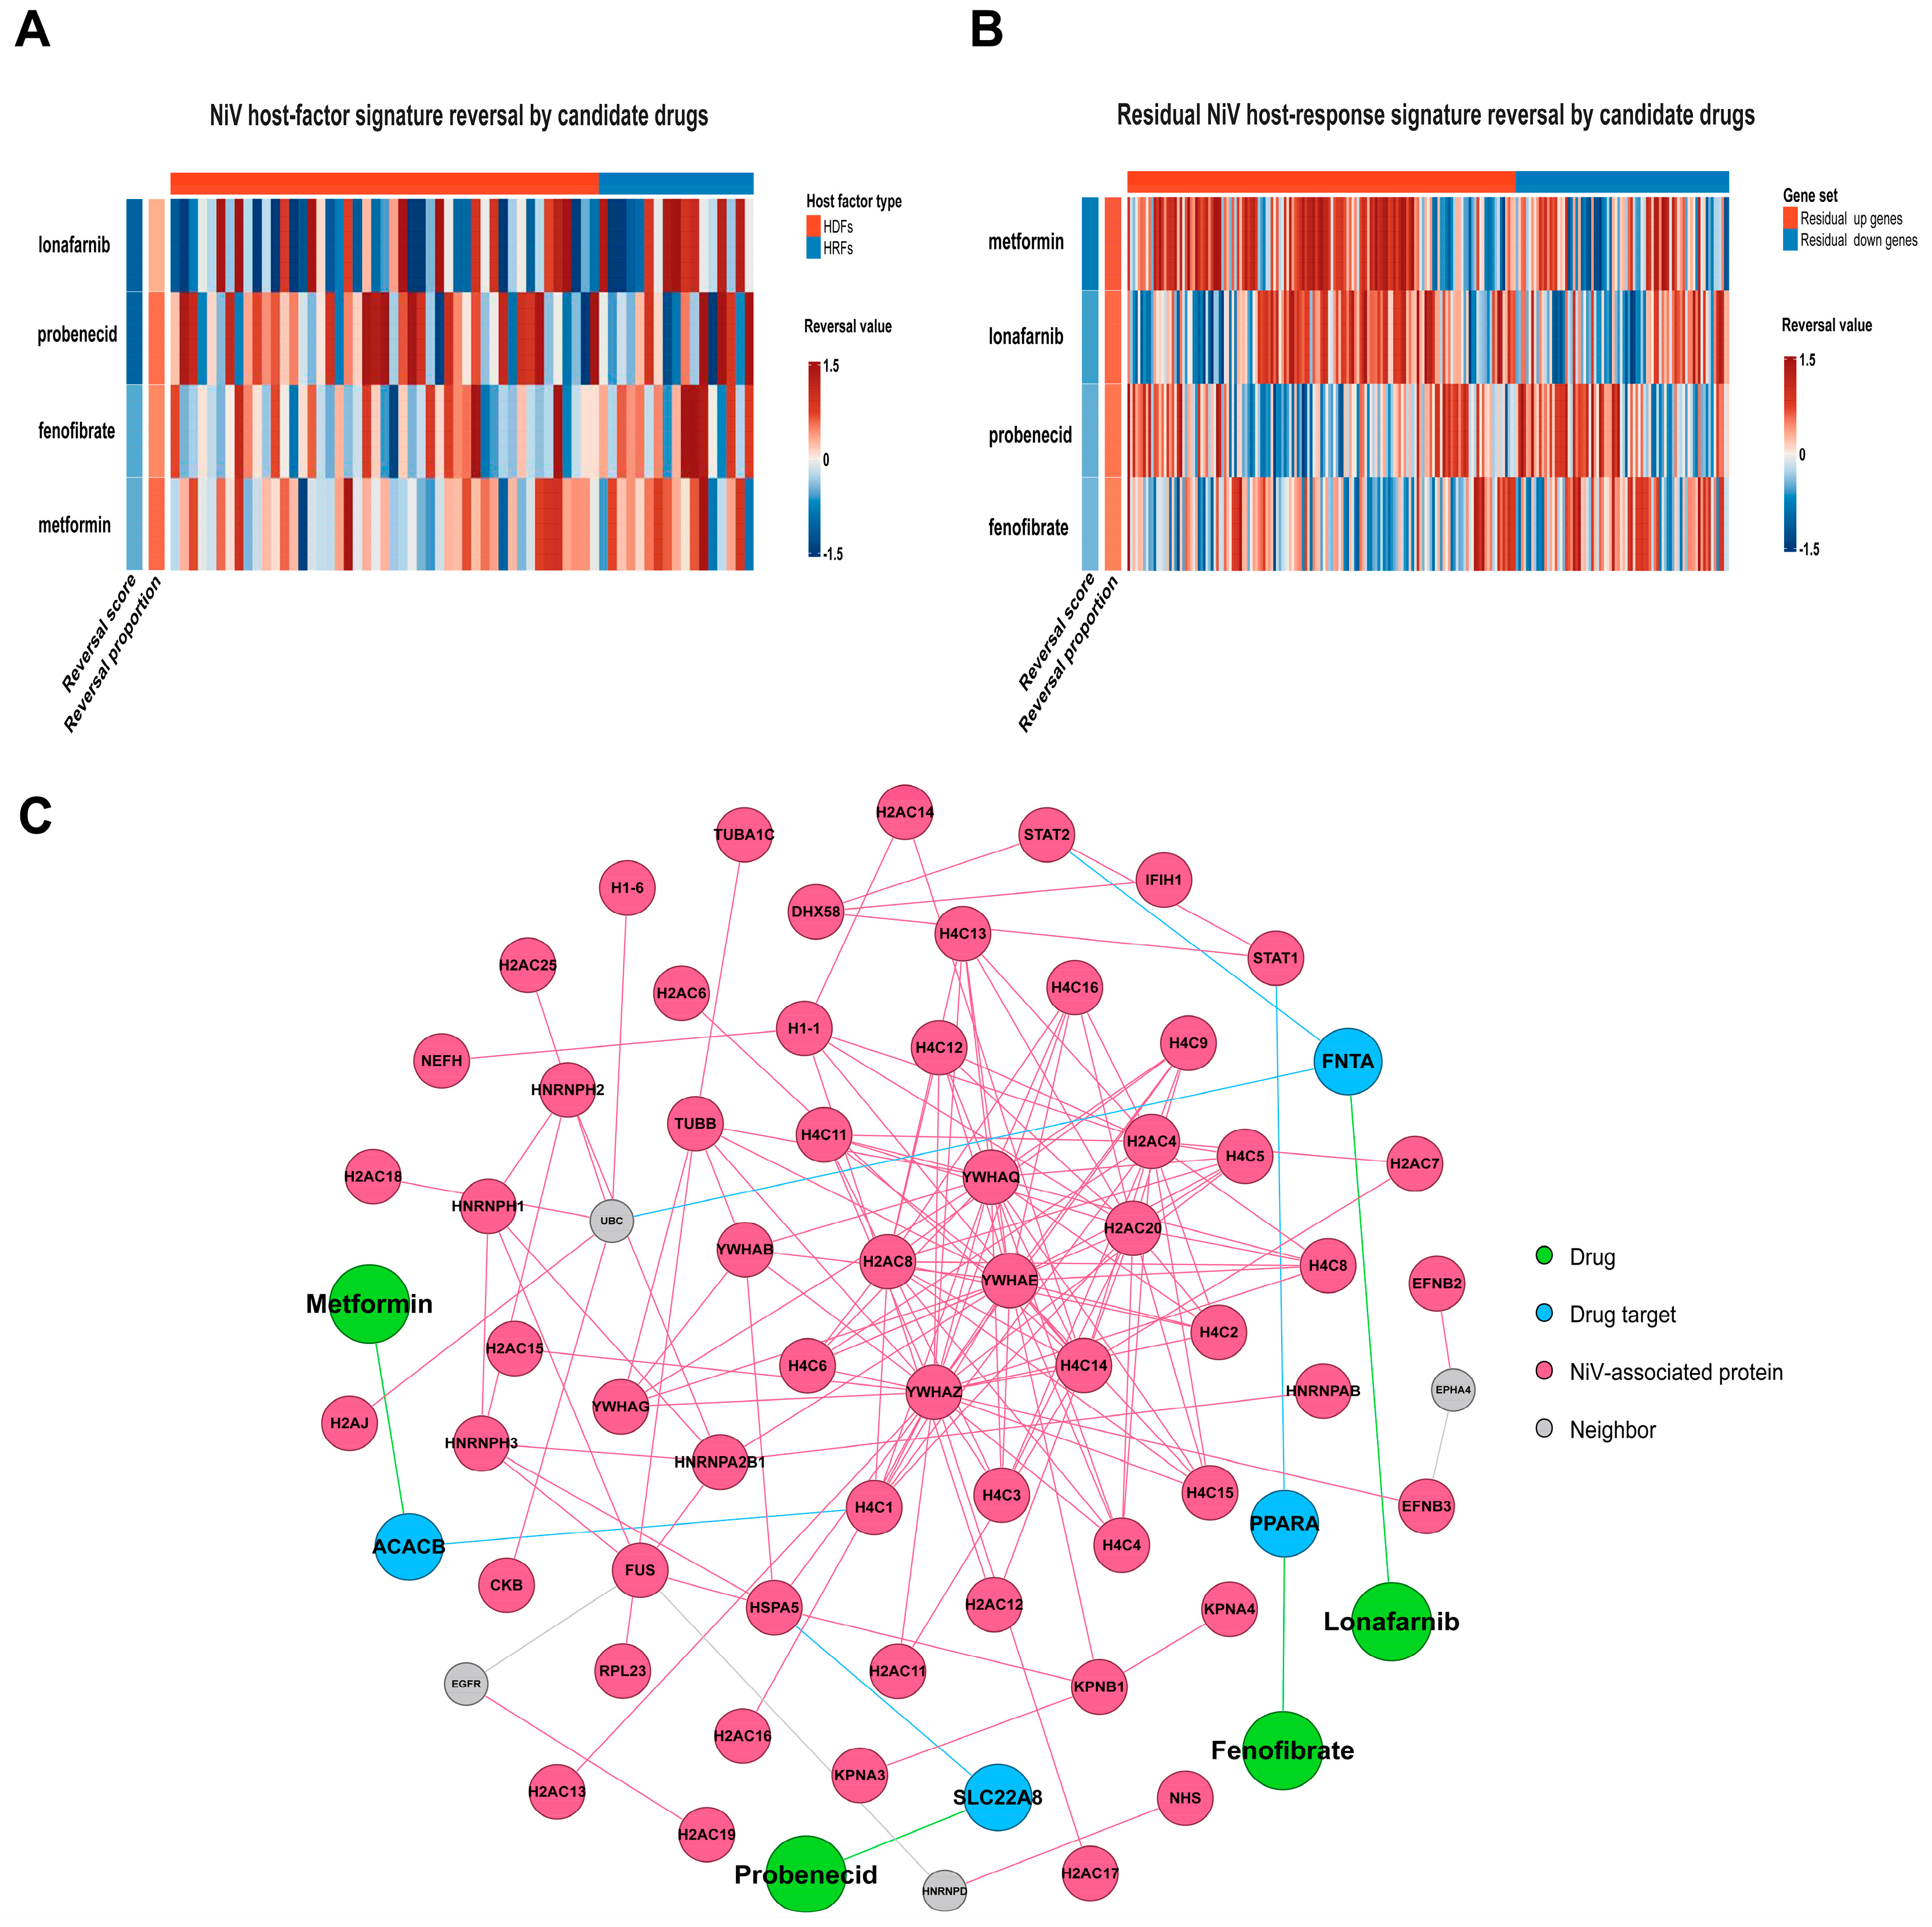
Within the host-factor signature, the four candidates showed distinct relationships between reversal magnitude and reversal breadth. Lonafarnib had the highest reversal score (0.595), with a reversal proportion of 35.9%, indicating stronger reversal magnitudes across a comparatively smaller fraction of host factors. Metformin showed the highest reversal proportion (60.9%) but a lower reversal score (0.319), consistent with broader but generally weaker directional reversal. Probenecid combined a high reversal score (0.587) with a high reversal proportion (59.4%), indicating a comparatively balanced profile of reversal magnitude and breadth, whereas fenofibrate exhibited an intermediate reversal profile (Figure 8A; Table S9).
Figure 8.
Gene-level CMap reversal and host-network context of prioritized candidate drugs. (A) Direction-aware gene-level reversal of the host-factor signature by metformin, fenofibrate, lonafarnib, and probenecid. (B) Gene-level reversal of the residual NiV host-response signature. Red and blue indicate positive and negative reversal values, respectively. (C) Network connections of the prioritized candidates to NiV-associated host proteins through annotated drug targets and neighboring host proteins. Network edges indicate database-supported drug–target or protein–protein interaction relationships, providing an association-based view of potential host-directed mechanisms in NiV infection.
Within the residual host-response signature, metformin showed the highest overall reversal score (0.515) and reversal proportion (65.8%), followed by lonafarnib. Further stratification according to the NiV-associated expression direction showed that metformin and lonafarnib more prominently reversed genes upregulated during NiV infection, whereas probenecid and fenofibrate showed relatively stronger reversal of genes downregulated during infection (Figure 8B; Table S9). These findings indicate that the four candidates did not uniformly reverse the entire NiV-associated transcriptional signature but instead showed drug-specific reversal across distinct subsets of the host response.
Network mapping based on NiV–host protein interactions and drug–target associations further illustrated how the four prioritized candidates were linked to NiV-associated host proteins through annotated drug targets and protein–protein interaction relationships (Figure 8C; Table S5). This pattern suggests that the candidates may influence NiV-associated biological processes indirectly by modulating host-network components proximal to the NiV-associated module. In addition, the four drugs were connected to different regions of the host network, indicating nonidentical network contexts consistent with the distinct reversal patterns observed in the CMap analyses.
3.7. External Drug-Perturbation GSEA Supports Partial Host-Factor Reversal Patterns for Metformin and Fenofibrate
Among the prioritized candidates, publicly available drug-perturbation transcriptomic datasets meeting the predefined analysis criteria were identified for metformin and fenofibrate. GSE46263 and GSE15483 were therefore used to assess whether independent drug-induced expression profiles were consistent with the predicted modulation of NiV-associated host-factor signatures. According to the predefined reversal framework, host dependency factors (HDFs) were expected to be enriched toward the downregulated end of the drug-perturbation profile, whereas host restriction factors (HRFs) were expected to be enriched toward the upregulated end.
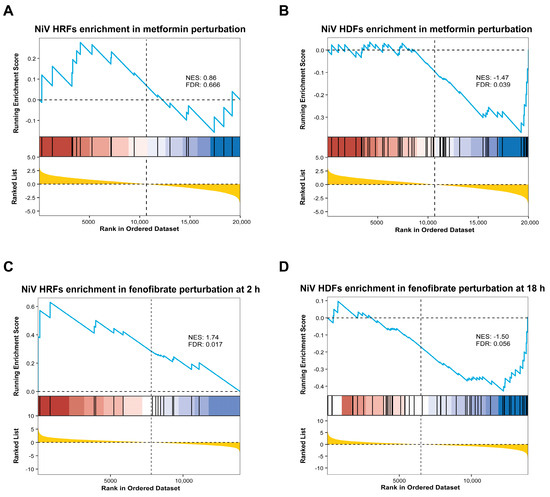
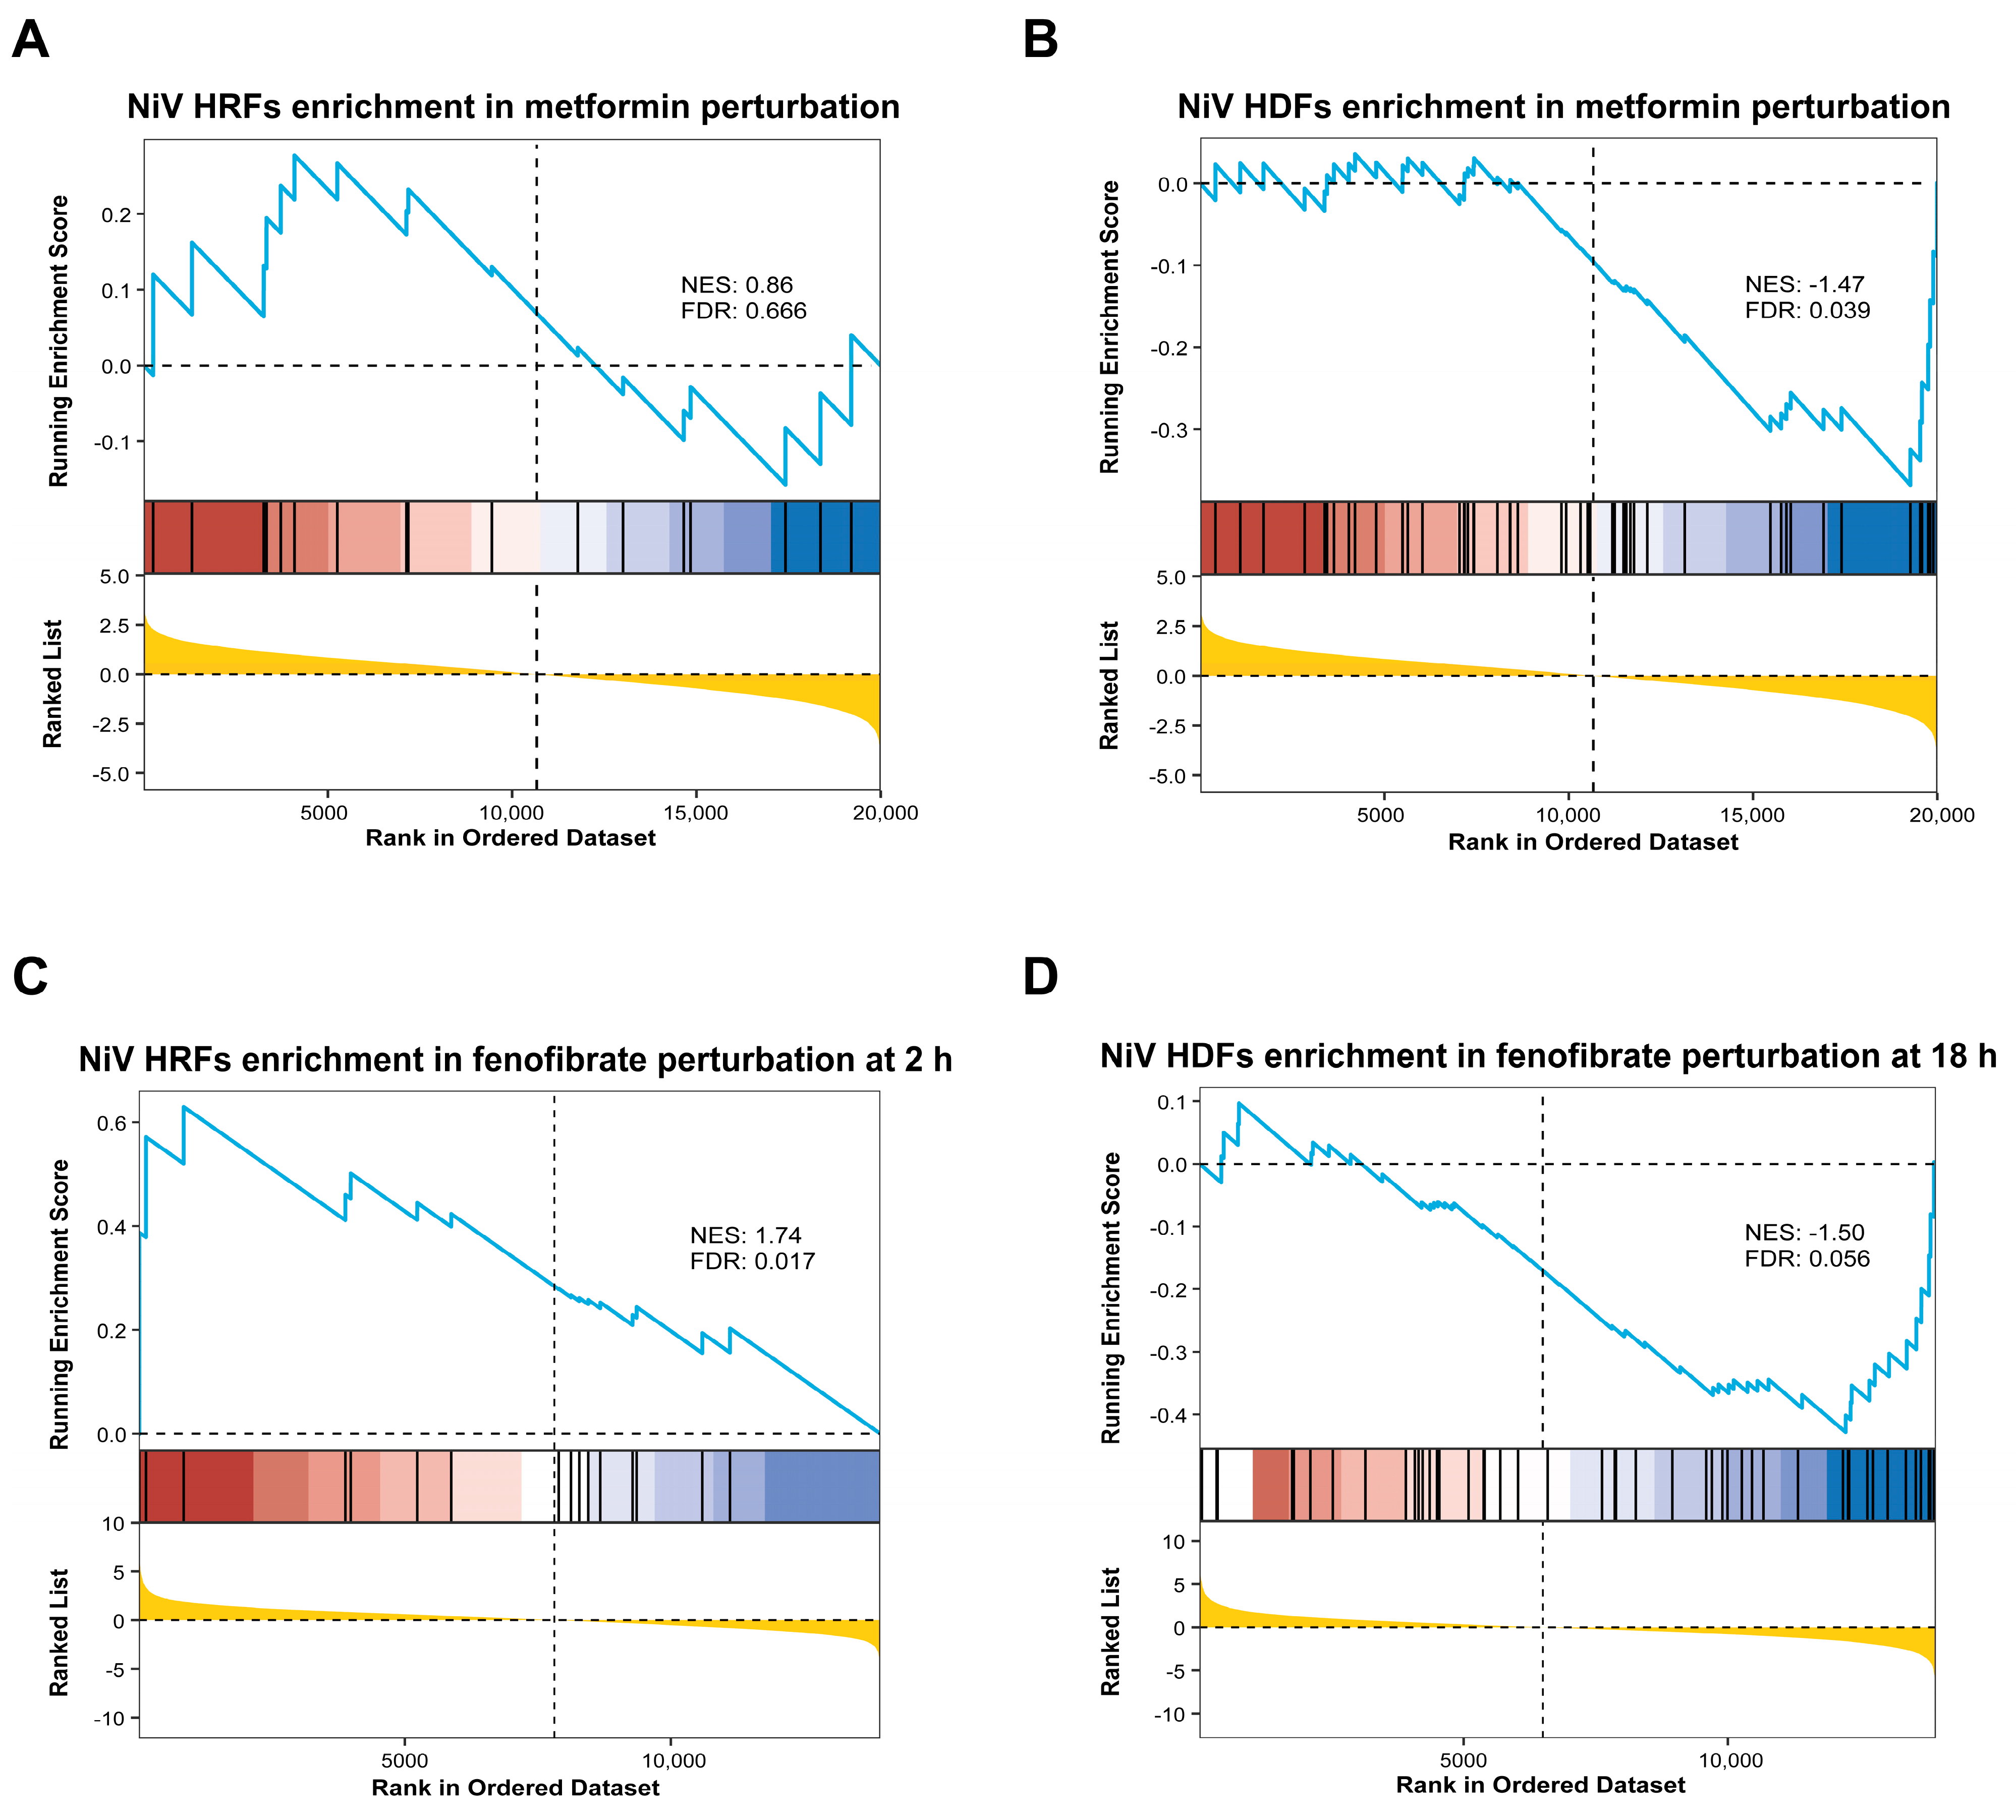
In the metformin perturbation dataset, HRFs showed positive enrichment but did not reach statistical significance (NES = 0.86, FDR = 0.666; Figure 9A). In contrast, HDFs were significantly enriched toward the downregulated end of the ranked expression profile (NES = −1.47, FDR = 0.039; Figure 9B), consistent with the predicted suppression of HDF-associated expression programs.
Figure 9.
External drug-perturbation GSEA of metformin and fenofibrate. (A) Enrichment of host restriction factors (HRFs) in the metformin-induced expression profile. (B) Enrichment of host dependency factors (HDFs) in the metformin-induced expression profile. (C) Enrichment of HRFs in the fenofibrate-induced expression profile at 2 h. (D) Enrichment of HDFs in the fenofibrate-induced expression profile at 18 h. Positive enrichment of HRFs and negative enrichment of HDFs correspond to the expected host-factor reversal directions. NES, normalized enrichment score; FDR, false discovery rate.
The time-resolved fenofibrate perturbation dataset enabled evaluation of host-factor signatures across different treatment durations (Figure S1). HRFs were significantly enriched toward the upregulated end at 2 h (NES = 1.74, FDR = 0.017; Figure 9C), supporting an early increase in HRF-associated expression. HDFs were enriched toward the downregulated end at 18 h (NES = −1.50, FDR = 0.056; Figure 9D), representing a late directional trend that approached but did not reach the predefined significance threshold.
The residual host-response gene set did not show a clear or consistent reversal pattern across the two drug-perturbation datasets. Accordingly, the external transcriptomic evidence primarily supported directional modulation of selected HDF- and HRF-associated programs, without indicating broad reversal of the overall NiV-associated host response.
Collectively, the external drug-perturbation analyses supported selected components of the predicted host-factor reversal framework, including downregulation of HDF-associated expression by metformin and early upregulation of HRF-associated expression by fenofibrate, together with a late trend toward HDF downregulation following fenofibrate treatment.
4. Discussion
This study demonstrates that NiV infection induces a temporally organized host transcriptional response in HEK293T cells, characterized by progressive remodeling of host-response programs across the sampled time course. By integrating time-point-specific differential expression analysis with temporal trajectory modeling, we identified 516 core temporal genes and further stratified them into putative host dependency factors, host restriction factors, and residual host-response genes according to their potential functional roles during NiV infection. This functional stratification enabled a direction-aware host-directed drug-prioritization framework integrating transcriptomic reversal analysis, drug–target network proximity assessment, and pharmacological evidence, leading to the prioritization of metformin, fenofibrate, lonafarnib, and probenecid as candidates for further experimental evaluation.
The temporal patterns observed in this study revealed distinct biological transitions across the sampled infection time course. Early time points were associated with antiviral sensing and signaling-related responses, whereas intermediate time points showed enrichment of immune-related and protein-interaction-related processes. At later time points, ER stress, proteostasis dysregulation, cell-cycle dysregulation, and apoptosis-associated programs became increasingly prominent, suggesting a transition toward cellular stress-associated states. Similar patterns of host-response remodeling have been reported in previous transcriptomic and proteomic analyses of NiV infection [25,32,33]. Consistent with these transcriptional changes, PROGENy analysis suggested time-dependent changes in the inferred activities of TGF-β, NF-κB, MAPK, and hypoxia-related pathways. Collectively, these findings indicate that the host response to NiV infection is a dynamic process shaped by the interplay among viral replication, immune evasion, and cellular stress responses [34].
These temporal patterns provide a biological rationale for distinguishing host genes according to their putative functional roles during infection. Host dependency factors and host restriction factors represent genes that may respectively support or limit viral infection, whereas residual host-response genes capture broader infection-induced cellular alterations [35,36]. Unlike direct-acting antiviral strategies, host-directed approaches seek to modulate cellular pathways that are exploited by the virus or contribute to infection-associated pathological responses. Incorporating these functional distinctions into drug prioritization therefore moves beyond global reversal of the NiV-induced transcriptional signature and enables candidate compounds to be evaluated according to the expected direction of modulation for each host-response component.
Mechanistic studies of NiV–host interactions provide experimental support for this concept by demonstrating that host factors participate directly in multiple stages of infection. Viral entry depends on the interaction of the NiV G glycoprotein with the ephrin-B2 and ephrin-B3 receptors, followed by F protein-mediated membrane fusion [9,37]. In addition, the NiV accessory proteins P, V, and W interfere with STAT1/STAT2-mediated antiviral signaling, highlighting the active subversion of host immune defenses by the virus [12,38]. During viral assembly and release, the NiV matrix protein M relies on host ubiquitination and intracellular trafficking mechanisms for appropriate localization and budding, and disruption of M-associated host interactions reduces viral particle release [39,40,41]. These findings demonstrate that host factors involved in viral entry, immune regulation, intracellular trafficking, and viral assembly are biologically relevant components of NiV infection and support the incorporation of virus–host interaction information into therapeutic candidate prioritization.
Within this framework, the therapeutic relevance of a candidate compound depends not only on its ability to reverse infection-associated transcriptional changes, but also on whether it modulates each host-response component in a biologically appropriate direction. NiV infection induces programs that may facilitate viral propagation, restrict infection, or reflect cellular stress and injury; consequently, global reversal of the entire infection-associated signature may obscure important functional differences among these responses. Integrating transcriptomic reversal analysis with drug–target network information enables candidate compounds to be evaluated from both regulatory and mechanistic perspectives. Application of these criteria yielded 38 candidates supported by multiple analytical branches. Subsequent evaluation of pathway regulation, pharmacological characteristics, safety considerations, relevance to NiV-associated pathological processes, and previous antiviral evidence ultimately prioritized four candidates for further experimental investigation. Their prioritization reflected multiple forms of evidence and distinct host-related mechanisms involving metabolic regulation, lipid homeostasis, protein prenylation, and transporter-associated processes.
Metformin is a widely used metabolic regulator with pleiotropic effects on AMPK-associated energy sensing, mitochondrial function, and inflammatory signaling. In our framework, metformin received convergent support from the virus–host factor CMap, residual host-response CMap, and network-proximity branches. Previous clinical and experimental studies have suggested antiviral potential in other viral infections; notably, the randomized placebo-controlled COVID-OUT trial reported a reduction in SARS-CoV-2 viral load following metformin treatment [42]. Together with its established effects on cellular energy metabolism and inflammatory regulation [43,44], these findings support further evaluation of metformin as a host-directed candidate against NiV.
Fenofibrate is a selective PPARα agonist used to regulate lipid metabolism and inflammatory signaling. Because membrane fusion, viral protein trafficking, replication-associated membrane remodeling, and budding of enveloped viruses depend on host lipid homeostasis, modulation of lipid metabolic pathways represents a potential strategy for influencing virus–host interactions [45,46]. In our analyses, fenofibrate was linked to a PPARα-centered regulatory module, while external drug-perturbation data showed significant enrichment of host restriction factors toward the upregulated end at 2 h and a trend toward enrichment of host dependency factors at the downregulated end at 18 h, indicating time-dependent host modulation. Fenofibrate pretreatment also reduced mortality and neurological impairment in a murine model of Japanese encephalitis virus infection through mechanisms associated with PPARα and inflammatory lipid mediators [47]. Given that encephalitis and neurological injury are major clinical manifestations of NiV infection [48], these findings support further evaluation of fenofibrate in NiV models, with explicit comparison of different treatment schedules.
Lonafarnib is a farnesyltransferase inhibitor that regulates protein prenylation, thereby affecting host protein membrane localization, intracellular trafficking, and cellular signaling. In our framework, its prioritization was supported by network proximity to an FNTA-associated module, linking lonafarnib to prenylation-related host processes. A randomized, double-blind, placebo-controlled phase IIa trial demonstrated that lonafarnib reduced hepatitis D virus RNA levels, supporting the antiviral potential of targeting prenylation-dependent processes [49]. More recently, lonafarnib was reported to inhibit respiratory syncytial virus infection through interaction with the viral F fusion protein, with antiviral activity demonstrated in cellular and animal models [50,51]. The shared virological features of RSV and NiV as enveloped, nonsegmented, negative-sense RNA viruses with class I fusion proteins further support experimental evaluation of lonafarnib against NiV.
Probenecid is an orally administered organic anion transporter inhibitor traditionally used to manage hyperuricemia. In our framework, probenecid was linked to an OAT3-related module, aligning the network signal with a host factor previously implicated in viral replication. An RNA interference screen identified OAT3 as a host factor required for influenza virus replication, while SLC22A8 silencing or treatment with probenecid reduced viral replication in cellular and mouse models [52]. Subsequent studies demonstrated antiviral activity against SARS-CoV-2 and RSV in cellular and animal models, further supporting the broad-spectrum antiviral potential of probenecid [53,54]. A randomized placebo-controlled phase II study in patients with mild-to-moderate COVID-19 also reported that probenecid shortened the time to viral clearance, providing clinical evidence of antiviral potential [55]. In addition, probenecid has been reported to modulate JNK/ERK signaling and PANX1 channel activity during viral infection, suggesting that its effects may extend to infection-associated inflammatory responses [56,57]. Together, the SLC22A8-associated network signal and the available experimental and clinical evidence support further evaluation of probenecid against NiV. Its long history of clinical use and well-characterized pharmacological properties may also facilitate future translational assessment [58].
Several limitations should be considered when interpreting these findings. The discovery analysis was based on a single publicly available transcriptomic dataset generated from NiV-infected HEK293T cells sampled between 4 and 16 h post-infection, thereby restricting the analysis to host transcriptional responses within an in vitro temporal window.
Moreover, HEK293T cells do not fully represent the respiratory epithelial, endothelial, or neuronal cells involved in human NiV infection. Consequently, the identified core temporal genes and transcriptional changes may vary across cellular contexts and experimental conditions, and their relevance to tissue-specific disease manifestations warrants further investigation. The drug-prioritization results also depend on existing resources, including HVIDB, CMap, PrimeKG, and publicly available drug-perturbation datasets, and may be influenced by differences in database coverage, cellular context, drug concentration, and treatment duration. The gene-level reversal analysis was limited to genes represented in the LINCS dataset, and incomplete coverage may influence the representation of certain biological pathways. Nevertheless, the use of a consistent evaluable gene set across candidate drugs supports comparative interpretation of their reversal patterns. The HDF and HRF annotations derived from HVIDB incorporate functional evidence from multiple viral systems, providing a broader biological context for interpreting NiV-associated temporal host responses and prioritizing host-directed drug candidates. Further studies in NiV infection models will help clarify the specific roles of these host factors. Network proximity was used to evaluate the relative topological proximity between drug targets and NiV-associated host proteins within the PrimeKG-derived PPI network. A z_score threshold of −1 was applied to identify compounds exhibiting relatively close network associations with the NiV-associated host module for subsequent integration with transcriptomic and pharmacological evidence.
Future studies should prioritize experimental validation of this direction-aware framework in cellular, organoid, and animal models. Denser temporal sampling, combined with transcriptomic, proteomic, metabolomic, and lipidomic profiling and direct virological and phenotypic measurements, would help clarify the temporal relationships among host dependency, host restriction, and residual host-response programs. Testing the prioritized drugs in these systems would allow assessment of whether they suppress host dependency-associated programs and reverse dysregulated host responses while preserving antiviral restriction pathways. Such studies would refine the temporal host-response map established here and provide the experimental evidence needed to assess the translational potential of these host-directed candidates.
5. Conclusions
This study established a time-resolved, multi-evidence integrative framework for host-directed drug repositioning against NiV. By combining time-point differential expression analysis with temporal trajectory modeling, we characterized the host transcriptional landscape of NiV infection, revealed a transition from early viral sensing to later states associated with endoplasmic reticulum stress, proteostasis disruption, and cellular injury, and identified 516 core temporal genes. By further distinguishing host dependency factors, host restriction factors, and residual host-response genes, and integrating stratified CMap reversal analyses, network-proximity analysis, external drug-perturbation transcriptomic data, and existing pharmacological and antiviral evidence, we prioritized metformin, fenofibrate, lonafarnib, and probenecid as host-directed candidate drugs warranting further experimental validation. Overall, this study provides a set of host-directed candidate drugs supported by multiple layers of biological evidence, together with a host-response molecular map for computational candidate prioritization. The biological and translational relevance of these candidates should be further evaluated in NiV pseudovirus systems, disease-relevant cellular models, and authentic NiV infection models.
Supplementary Materials
The following supporting information can be downloaded at: https://www.mdpi.com/article/10.3390/cimb48111246/s1.
Author Contributions
Conceptualization, X.S. (Xinwei Sun), H.Z., and X.L.; methodology, X.S. (Xinwei Sun), H.Z., and Y.X.; software, X.S. (Xinwei Sun), H.Z., P.L., and Y.X.; validation, X.S. (Xinwei Sun), H.Z., Y.T., X.S. (Xin Sun), and W.Z.; formal analysis, X.S. (Xinwei Sun), H.Z., Y.T., and X.S. (Xin Sun); investigation, X.S. (Xinwei Sun), H.Z., P.L., Y.T., X.S. (Xin Sun), H.L., C.H., B.G., and W.Z.; resources, X.L. and H.L.; data curation, X.S. (Xinwei Sun), H.Z., and P.L.; writing—original draft preparation, X.S. (Xinwei Sun) and H.Z.; writing—review and editing, X.L., P.Z., Y.X., H.L., and C.H.; visualization, X.S. (Xinwei Sun) and H.Z.; supervision, X.L., H.Z., P.Z., Y.X., and H.L.; project administration, X.S. (Xinwei Sun), X.L., P.Z., and H.L.; funding acquisition, X.L. All authors have read and agreed to the published version of the manuscript.
Funding
Financial support was received from the National Natural Science Foundation of China (No. 82450110) and the National Key Research and Development Program of China (No. 2021YFC2701704).
Institutional Review Board Statement
This study analyzed publicly available, non-identifiable transcriptomic data obtained from the NCBI Gene Expression Omnibus (GEO; accession numbers GSE166707, GSE46263, and GSE15483). No new human participants were recruited or contacted, and no new human biological samples were collected. In accordance with Article 32, Items (1) and (2), of the Measures for Ethical Review of Life Sciences and Medical Research Involving Humans (2023), issued by the National Health Commission of China and other relevant authorities, research using lawfully obtained publicly available or anonymized data that does not cause harm to individuals or involve sensitive personal information or commercial interests may be exempt from ethics review. Therefore, formal ethical approval was not required for this secondary data analysis. The study was conducted in accordance with applicable ethical guidelines and the principles of the Declaration of Helsinki.
Informed Consent Statement
Informed consent was not required for this study because it exclusively used publicly available and de-identified data and involved no direct recruitment of or interaction with human participants.
Data Availability Statement
The transcriptomic datasets analyzed in this study are publicly available in the NCBI Gene Expression Omnibus under accession numbers GSE166707, GSE46263, and GSE15483. Other publicly available resources are described in the Materials and Methods section. The processed data supporting the findings of this study are provided in the Supplementary Materials. The analysis code is publicly available at https://github.com/sxwstar/NiV_bioinformatics_analysis (accessed on 15 November 2026).
Conflicts of Interest
The authors declare no conflicts of interest.
References
- Chua, K.B.; Bellini, W.J.; Rota, P.A.; Harcourt, B.H.; Tamin, A.; Lam, S.K.; Ksiazek, T.G.; Rollin, P.E.; Zaki, S.R.; Shieh, W.-J.; et al. Nipah Virus: A Recently Emergent Deadly Paramyxovirus. Science 2000, 288, 1432–1435. [Google Scholar] [CrossRef] [Scilit] [PubMed]
- Chua, K.B. Nipah Virus Outbreak in Malaysia. J. Clin. Virol. 2003, 26, 265–275. [Google Scholar] [CrossRef] [Scilit] [PubMed]
- Luby, S.P.; Hossain, M.J.; Gurley, E.S.; Ahmed, B.-N.; Banu, S.; Khan, S.U.; Homaira, N.; Rota, P.A.; Rollin, P.E.; Comer, J.A.; et al. Recurrent Zoonotic Transmission of Nipah Virus into Humans, Bangladesh, 2001–2007. Emerg. Infect. Dis. 2009, 15, 1229–1235. [Google Scholar] [CrossRef] [Scilit] [PubMed]
- Ang, B.S.P.; Lim, T.C.C.; Wang, L. Nipah Virus Infection. J. Clin. Microbiol. 2018, 56, e01875-17. [Google Scholar] [CrossRef] [Scilit] [PubMed]
- Nipah Virus Fact Sheet. Available online: https://www.who.int/news-room/fact-sheets/detail/nipah-virus (accessed on 18 October 2026).
- About Nipah Virus|Nipah Virus|CDC. Available online: https://www.cdc.gov/nipah-virus/about/index.html (accessed on 18 October 2026).
- Wong, K.T.; Shieh, W.-J.; Kumar, S.; Norain, K.; Abdullah, W.; Guarner, J.; Goldsmith, C.S.; Chua, K.B.; Lam, S.K.; Tan, C.T.; et al. Nipah Virus Infection. Am. J. Pathol. 2002, 161, 2153–2167. [Google Scholar] [CrossRef] [Scilit] [PubMed]
- Negrete, O.A.; Levroney, E.L.; Aguilar, H.C.; Bertolotti-Ciarlet, A.; Nazarian, R.; Tajyar, S.; Lee, B. EphrinB2 Is the Entry Receptor for Nipah Virus, an Emergent Deadly Paramyxovirus. Nature 2005, 436, 401–405. [Google Scholar] [CrossRef] [Scilit] [PubMed]
- Bonaparte, M.I.; Dimitrov, A.S.; Bossart, K.N.; Crameri, G.; Mungall, B.A.; Bishop, K.A.; Choudhry, V.; Dimitrov, D.S.; Wang, L.-F.; Eaton, B.T.; et al. Ephrin-B2 Ligand Is a Functional Receptor for Hendra Virus and Nipah Virus. Proc. Natl. Acad. Sci. USA 2005, 102, 10652–10657. [Google Scholar] [CrossRef] [Scilit] [PubMed]
- Negrete, O.A.; Wolf, M.C.; Aguilar, H.C.; Enterlein, S.; Wang, W.; Mühlberger, E.; Su, S.V.; Bertolotti-Ciarlet, A.; Flick, R.; Lee, B. Two Key Residues in EphrinB3 Are Critical for Its Use as an Alternative Receptor for Nipah Virus. PLoS Pathog. 2006, 2, e7. [Google Scholar] [CrossRef] [Scilit] [PubMed]
- Rodriguez, J.J.; Parisien, J.-P.; Horvath, C.M. Nipah Virus V Protein Evades Alpha and Gamma Interferons by Preventing STAT1 and STAT2 Activation and Nuclear Accumulation. J. Virol. 2002, 76, 11476–11483. [Google Scholar] [CrossRef] [Scilit] [PubMed]
- Shaw, M.L.; García-Sastre, A.; Palese, P.; Basler, C.F. Nipah Virus V and W Proteins Have a Common STAT1-Binding Domain yet Inhibit STAT1 Activation from the Cytoplasmic and Nuclear Compartments, Respectively. J. Virol. 2004, 78, 5633–5641. [Google Scholar] [CrossRef] [Scilit] [PubMed]
- Satterfield, B.A.; Borisevich, V.; Foster, S.L.; Rodriguez, S.E.; Cross, R.W.; Fenton, K.A.; Agans, K.N.; Basler, C.F.; Geisbert, T.W.; Mire, C.E. Antagonism of STAT1 by Nipah Virus P Gene Products Modulates Disease Course but Not Lethal Outcome in the Ferret Model. Sci. Rep. 2019, 9, 16710. [Google Scholar] [CrossRef] [Scilit] [PubMed]
- Tigabu, B.; Rasmussen, L.; White, E.L.; Tower, N.; Saeed, M.; Bukreyev, A.; Rockx, B.; LeDuc, J.W.; Noah, J.W. A BSL-4 High-Throughput Screen Identifies Sulfonamide Inhibitors of Nipah Virus. Assay. Drug Dev. Technol. 2014, 12, 155–161. [Google Scholar] [CrossRef] [Scilit] [PubMed]
- Pushpakom, S.; Iorio, F.; Eyers, P.A.; Escott, K.J.; Hopper, S.; Wells, A.; Doig, A.; Guilliams, T.; Latimer, J.; McNamee, C.; et al. Drug Repurposing: Progress, Challenges and Recommendations. Nat. Rev. Drug Discov. 2019, 18, 41–58. [Google Scholar] [CrossRef] [Scilit] [PubMed]
- Mercorelli, B.; Palù, G.; Loregian, A. Drug Repurposing for Viral Infectious Diseases: How Far Are We? Trends Microbiol. 2018, 26, 865–876. [Google Scholar] [CrossRef] [Scilit] [PubMed]
- Richardson, P.; Griffin, I.; Tucker, C.; Smith, D.; Oechsle, O.; Phelan, A.; Rawling, M.; Savory, E.; Stebbing, J. Baricitinib as Potential Treatment for 2019-nCoV Acute Respiratory Disease. Lancet 2020, 395, e30–e31, Erratum in Lancet 2020, 395, 1906. https://doi.org/10.1016/S0140-6736(20)31376-3. [Google Scholar] [CrossRef] [Scilit] [PubMed]
- Abani, O.; Abbas, A.; Abbas, F.; Abbas, J.; Abbas, K.; Abbas, M.; Abbasi, S.; Abbass, H.; Abbott, A.; Abbott, A.; et al. Baricitinib in Patients Admitted to Hospital with COVID-19 (RECOVERY): A Randomised, Controlled, Open-Label, Platform Trial and Updated Meta-Analysis. Lancet 2022, 400, 359–368, Erratum in Lancet 2022, 400, 1102. https://doi.org/10.1016/S0140-6736(22)01866-9. [Google Scholar] [CrossRef] [Scilit] [PubMed]
- Morselli Gysi, D.; Do Valle, Í.; Zitnik, M.; Ameli, A.; Gan, X.; Varol, O.; Ghiassian, S.D.; Patten, J.J.; Davey, R.A.; Loscalzo, J.; et al. Network Medicine Framework for Identifying Drug-Repurposing Opportunities for COVID-19. Proc. Natl. Acad. Sci. USA 2021, 118, e2025581118. [Google Scholar] [CrossRef] [Scilit] [PubMed]
- Yang, X.; Lian, X.; Fu, C.; Wuchty, S.; Yang, S.; Zhang, Z. HVIDB: A Comprehensive Database for Human–Virus Protein–Protein Interactions. Brief. Bioinform. 2021, 22, 832–844. [Google Scholar] [CrossRef] [Scilit] [PubMed]
- Subramanian, A.; Tamayo, P.; Mootha, V.K.; Mukherjee, S.; Ebert, B.L.; Gillette, M.A.; Paulovich, A.; Pomeroy, S.L.; Golub, T.R.; Lander, E.S.; et al. Gene Set Enrichment Analysis: A Knowledge-Based Approach for Interpreting Genome-Wide Expression Profiles. Proc. Natl. Acad. Sci. USA 2005, 102, 15545–15550. [Google Scholar] [CrossRef] [Scilit] [PubMed]
- Ranadheera, C.; Proulx, R.; Chaiyakul, M.; Jones, S.; Grolla, A.; Leung, A.; Rutherford, J.; Kobasa, D.; Carpenter, M.; Czub, M. The Interaction between the Nipah Virus Nucleocapsid Protein and Phosphoprotein Regulates Virus Replication. Sci. Rep. 2018, 8, 15994. [Google Scholar] [CrossRef] [Scilit] [PubMed]
- Ortega, V.; Zamora, J.L.R.; Monreal, I.A.; Hoffman, D.T.; Ezzatpour, S.; Johnston, G.P.; Contreras, E.M.; Vilchez-Delgado, F.J.; Aguilar, H.C. Novel Roles of the Nipah Virus Attachment Glycoprotein and Its Mobility in Early and Late Membrane Fusion Steps. mBio 2022, 13, e03222-21. [Google Scholar] [CrossRef] [Scilit] [PubMed]
- Wang, Y.; Fan, L.; Ye, P.; Wang, Z.; Liang, C.; Liu, Q.; Yang, X.; Long, Z.; Shi, W.; Zhou, Y.; et al. Novel Transcription and Replication-Competent Virus-like Particles System Modelling the Nipah Virus Life Cycle. Emerg. Microbes Infect. 2024, 13, 2368217. [Google Scholar] [CrossRef] [Scilit] [PubMed]
- Johnston, G.P.; Aydemir, F.; Byun, H.; De Wit, E.; Oxford, K.L.; Kyle, J.E.; McDermott, J.E.; Deatherage Kaiser, B.L.; Casey, C.P.; Weitz, K.K.; et al. Multi-Platform Omics Analysis of Nipah Virus Infection Reveals Viral Glycoprotein Modulation of Mitochondria. Cell Rep. 2025, 44, 115411. [Google Scholar] [CrossRef] [Scilit] [PubMed]
- Nueda, M.J.; Tarazona, S.; Conesa, A. Next maSigPro: Updating maSigPro Bioconductor Package for RNA-Seq Time Series. Bioinformatics 2014, 30, 2598–2602. [Google Scholar] [CrossRef] [Scilit] [PubMed]
- Wu, T.; Hu, E.; Xu, S.; Chen, M.; Guo, P.; Dai, Z.; Feng, T.; Zhou, L.; Tang, W.; Zhan, L.; et al. clusterProfiler 4.0: A Universal Enrichment Tool for Interpreting Omics Data. Innovation 2021, 2, 100141. [Google Scholar] [CrossRef] [Scilit] [PubMed]
- Schubert, M.; Klinger, B.; Klünemann, M.; Sieber, A.; Uhlitz, F.; Sauer, S.; Garnett, M.J.; Blüthgen, N.; Saez-Rodriguez, J. Perturbation-Response Genes Reveal Signaling Footprints in Cancer Gene Expression. Nat. Commun. 2018, 9, 20. [Google Scholar] [CrossRef] [Scilit] [PubMed]
- Zhai, Z.; Lin, Z.; Meng, X.; Zheng, X.; Du, Y.; Li, Z.; Zhang, X.; Liu, C.; Zhou, L.; Zhang, X.; et al. DiSignAtlas: An Atlas of Human and Mouse Disease Signatures Based on Bulk and Single-Cell Transcriptomics. Nucleic Acids Res. 2024, 52, D1236–D1245. [Google Scholar] [CrossRef] [Scilit] [PubMed]
- Subramanian, A.; Narayan, R.; Corsello, S.M.; Peck, D.D.; Natoli, T.E.; Lu, X.; Gould, J.; Davis, J.F.; Tubelli, A.A.; Asiedu, J.K.; et al. A next Generation Connectivity Map: L1000 Platform and the First 1,000,000 Profiles. Cell 2017, 171, 1437–1452.e17. [Google Scholar] [CrossRef] [Scilit] [PubMed]
- Chandak, P.; Huang, K.; Zitnik, M. Building a Knowledge Graph to Enable Precision Medicine. Sci. Data 2023, 10, 67. [Google Scholar] [CrossRef] [Scilit] [PubMed]
- Lo, M.K.; Miller, D.; Aljofan, M.; Mungall, B.A.; Rollin, P.E.; Bellini, W.J.; Rota, P.A. Characterization of the Antiviral and Inflammatory Responses against Nipah Virus in Endothelial Cells and Neurons. Virology 2010, 404, 78–88. [Google Scholar] [CrossRef] [Scilit] [PubMed]
- Müller, M.; Fischer, K.; Woehnke, E.; Zaeck, L.M.; Prönnecke, C.; Knittler, M.R.; Karger, A.; Diederich, S.; Finke, S. Analysis of Nipah Virus Replication and Host Proteome Response Patterns in Differentiated Porcine Airway Epithelial Cells Cultured at the Air–Liquid Interface. Viruses 2023, 15, 961. [Google Scholar] [CrossRef] [Scilit] [PubMed]
- Eaton, B.T.; Broder, C.C.; Middleton, D.; Wang, L.-F. Hendra and Nipah Viruses: Different and Dangerous. Nat. Rev. Microbiol. 2006, 4, 23–35. [Google Scholar] [CrossRef] [Scilit] [PubMed]
- See, W.R.; Yousefi, M.; Ooi, Y.S. A Review of Virus Host Factor Discovery Using CRISPR Screening. mBio 2024, 15, e03205-23. [Google Scholar] [CrossRef] [Scilit] [PubMed]
- Lin, Y.; Zhu, Y.; Jing, L.; Lei, X.; Xie, Z. Regulation of Viral Replication by Host Restriction Factors. Front. Immunol. 2025, 16, 1484119. [Google Scholar] [CrossRef] [Scilit] [PubMed]
- Xu, K.; Broder, C.C.; Nikolov, D.B. Ephrin-B2 and Ephrin-B3 as Functional Henipavirus Receptors. Semin. Cell Dev. Biol. 2012, 23, 116–123. [Google Scholar] [CrossRef] [Scilit] [PubMed]
- Keiffer, T.R.; Ciancanelli, M.J.; Edwards, M.R.; Basler, C.F. Interactions of the Nipah Virus P, V, and W Proteins across the STAT Family of Transcription Factors. mSphere 2020, 5, e00449-20. [Google Scholar] [CrossRef] [Scilit] [PubMed]
- Ciancanelli, M.J.; Basler, C.F. Mutation of YMYL in the Nipah Virus Matrix Protein Abrogates Budding and Alters Subcellular Localization. J. Virol. 2006, 80, 12070–12078. [Google Scholar] [CrossRef] [Scilit] [PubMed]
- Sun, W.; McCrory, T.S.; Khaw, W.Y.; Petzing, S.; Myers, T.; Schmitt, A.P. Matrix Proteins of Nipah and Hendra Viruses Interact with Beta Subunits of AP-3 Complexes. J. Virol. 2014, 88, 13099–13110. [Google Scholar] [CrossRef] [Scilit] [PubMed]
- Wang, Y.E.; Park, A.; Lake, M.; Pentecost, M.; Torres, B.; Yun, T.E.; Wolf, M.C.; Holbrook, M.R.; Freiberg, A.N.; Lee, B. Ubiquitin-Regulated Nuclear-Cytoplasmic Trafficking of the Nipah Virus Matrix Protein Is Important for Viral Budding. PLoS Pathog. 2010, 6, e1001186. [Google Scholar] [CrossRef] [Scilit] [PubMed]
- Bramante, C.T.; Beckman, K.B.; Mehta, T.; Karger, A.B.; Odde, D.J.; Tignanelli, C.J.; Buse, J.B.; Johnson, D.M.; Watson, R.H.B.; Daniel, J.J.; et al. Favorable Antiviral Effect of Metformin on SARS-CoV-2 Viral Load in a Randomized, Placebo-Controlled Clinical Trial of COVID-19. Clin. Infect. Dis. 2024, 79, 354–363. [Google Scholar] [CrossRef] [Scilit] [PubMed]
- Rena, G.; Hardie, D.G.; Pearson, E.R. The Mechanisms of Action of Metformin. Diabetologia 2017, 60, 1577–1585. [Google Scholar] [CrossRef] [Scilit] [PubMed]
- Apostolova, N.; Iannantuoni, F.; Gruevska, A.; Muntane, J.; Rocha, M.; Victor, V.M. Mechanisms of Action of Metformin in Type 2 Diabetes: Effects on Mitochondria and Leukocyte-Endothelium Interactions. Redox Biol. 2020, 34, 101517. [Google Scholar] [CrossRef] [Scilit] [PubMed]
- Lorizate, M.; Krausslich, H.-G. Role of Lipids in Virus Replication. Cold Spring Harb. Perspect. Biol. 2011, 3, a004820. [Google Scholar] [CrossRef] [Scilit] [PubMed]
- Yang, L.J.; Tang, M.; Yang, L. Lipid Metabolism, Viral Infection, and Antiviral Immunity: A New Host-Pathogen Interface. Front. Cell. Infect. Microbiol. 2026, 16, 1765502. [Google Scholar] [CrossRef] [Scilit] [PubMed]
- Sehgal, N.; Kumawat, K.L.; Basu, A.; Ravindranath, V. Fenofibrate Reduces Mortality and Precludes Neurological Deficits in Survivors in Murine Model of Japanese Encephalitis Viral Infection. PLoS ONE 2012, 7, e35427. [Google Scholar] [CrossRef] [Scilit] [PubMed]
- Vindel-Zuñiga, C.; Salinas-Avalo, I.; Valencia-Ochoa, C.; Pérez-Dávila, M. A Systematic Review of Neurological Symptoms, Signs, and Neuroimaging Findings in Nipah Virus (NiV) Infection. Discov. Neurosci. 2026, 21, 12. [Google Scholar] [CrossRef] [Scilit]
- Koh, C.; Canini, L.; Dahari, H.; Zhao, X.; Uprichard, S.L.; Haynes-Williams, V.; Winters, M.A.; Subramanya, G.; Cooper, S.L.; Pinto, P.; et al. Oral Prenylation Inhibition with Lonafarnib in Chronic Hepatitis D Infection: A Proof-of-Concept Randomised, Double-Blind, Placebo-Controlled Phase 2A Trial. Lancet Infect. Dis. 2015, 15, 1167–1174. [Google Scholar] [CrossRef] [Scilit] [PubMed]
- Sake, S.M.; Zhang, X.; Rajak, M.K.; Urbanek-Quaing, M.; Carpentier, A.; Gunesch, A.P.; Grethe, C.; Matthaei, A.; Rückert, J.; Galloux, M.; et al. Drug Repurposing Screen Identifies Lonafarnib as Respiratory Syncytial Virus Fusion Protein Inhibitor. Nat. Commun. 2024, 15, 1173. [Google Scholar] [CrossRef] [Scilit] [PubMed]
- Yang, Q.; Xue, B.; Liu, F.; Lu, Y.; Tang, J.; Yan, M.; Wu, Q.; Chen, R.; Zhou, A.; Liu, L.; et al. Farnesyltransferase Inhibitor Lonafarnib Suppresses Respiratory Syncytial Virus Infection by Blocking Conformational Change of Fusion Glycoprotein. Signal Transduct. Target. Ther. 2024, 9, 144. [Google Scholar] [CrossRef] [Scilit] [PubMed]
- Perwitasari, O.; Yan, X.; Johnson, S.; White, C.; Brooks, P.; Tompkins, S.M.; Tripp, R.A. Targeting Organic Anion Transporter 3 with Probenecid as a Novel Anti-Influenza a Virus Strategy. Antimicrob. Agents Chemother. 2013, 57, 475–483. [Google Scholar] [CrossRef] [Scilit] [PubMed]
- Murray, J.; Hogan, R.J.; Martin, D.E.; Blahunka, K.; Sancilio, F.D.; Balyan, R.; Lovern, M.; Still, R.; Tripp, R.A. Probenecid Inhibits SARS-CoV-2 Replication in Vivo and in Vitro. Sci. Rep. 2021, 11, 18085. [Google Scholar] [CrossRef] [Scilit] [PubMed]
- Murray, J.; Bergeron, H.C.; Jones, L.P.; Reener, Z.B.; Martin, D.E.; Sancilio, F.D.; Tripp, R.A. Probenecid Inhibits Respiratory Syncytial Virus (RSV) Replication. Viruses 2022, 14, 912. [Google Scholar] [CrossRef] [Scilit] [PubMed]
- Martin, D.E.; Pandey, N.; Chavda, P.; Singh, G.; Sutariya, R.; Sancilio, F.; Tripp, R.A. Oral Probenecid for Nonhospitalized Adults with Symptomatic Mild-to-Moderate COVID-19. Viruses 2023, 15, 1508. [Google Scholar] [CrossRef] [Scilit] [PubMed]
- Jones, L.P.; Bergeron, H.C.; Martin, D.E.; Murray, J.; Sancilio, F.D.; Tripp, R.A. Probenecid Inhibits Extracellular Signal-Regulated Kinase and c-Jun N-Terminal Kinase Mitogen-Activated Protein Kinase Pathways in Regulating Respiratory Syncytial Virus Response. Int. J. Mol. Sci. 2024, 25, 12452. [Google Scholar] [CrossRef] [Scilit] [PubMed]
- Silverman, W.; Locovei, S.; Dahl, G. Probenecid, a Gout Remedy, Inhibits Pannexin 1 Channels. Am. J. Physiol. Cell Physiol. 2008, 295, C761–C767. [Google Scholar] [CrossRef] [Scilit] [PubMed]
- García-Rodríguez, C.; Mujica, P.; Illanes-González, J.; López, A.; Vargas, C.; Sáez, J.C.; González-Jamett, A.; Ardiles, Á.O. Probenecid, an Old Drug with Potential New Uses for Central Nervous System Disorders and Neuroinflammation. Biomedicines 2023, 11, 1516. [Google Scholar] [CrossRef] [Scilit] [PubMed]

Disclaimer/Publisher’s Note: The statements, opinions and data contained in all publications are solely those of the individual author(s) and contributor(s) and not of MDPI and/or the editor(s). MDPI and/or the editor(s) disclaim responsibility for any injury to people or property resulting from any ideas, methods, instructions or products referred to in the content. |
© 2026 by the authors. Licensee MDPI, Basel, Switzerland. This article is an open access article distributed under the terms and conditions of the Creative Commons Attribution (CC BY) license.