


Highlights
- Transcriptional and proliferation inhibitors have specific epigenetic profiles;
- Pmepa1 and Skil may play a role in early retina development;
- Pmepa1 and Skil work through Activin signaling and the Smad2/3 pathway.
Abstract
We characterized two groups of genes that participate in embryonic stages of retinal development by analyzing mouse retinal temporal whole-genome datasets for two histone modifications, H3K4me2 and H3K27me3, and DNase I hypersensitive sites (DHS). Epigenetic profiles for genes belonging to the first group demonstrate the disappearance of DHS and the active chromatin marker H3K4me2 from the gene body during development, and a dramatic increase in the accumulation of a chromatin inhibitory marker, H3K27me3. Using epigenetic profiles, this group could be easily divided into subgroups of early- and late-embryonic-stage genes of retinal development that mostly work as pioneering factors for early stages or as transcriptional factors for later stages. Epigenetic profiles for the second, smaller group were characterized by a decrease in the active marker H3K4me2 that was not accompanied by an increase in the inhibitory marker H3K27me3. Most members of this small group could be functionally annotated as transcriptional or proliferation inhibitors, but this group did not show specificity in DAVID, STRING, and IPA analyses. However, based on a literature search, 14 genes and two microRNAs were linked to the Smad/TGF-b pathway. By using ex vivo differentiation of mouse embryonic stem cells (ESCs), we have shown that two members of this group, Pmepa1 and Skil, participate in the early stages of mouse retina development in Activin signaling via the Smad2/3 pathway. This is the first time Pmepa1 and Skil have been proposed as candidate genes to regulate retinal development. Together, the results suggest that expression of functionally related groups of genes can be downregulated by changes in DNA accessibility caused by specific epigenetic changes.
1. Introduction
During development, changes in the expression of large groups of genes are a manifestation of progression from proliferating RPCs to terminally differentiated cells in mature tissue [1]. One major mechanism of controlling gene expression is regulation of DNA accessibility through histone post-translational modifications (PTMs). In previous studies, we investigated the PTMs of histones and the attendant changes in chromatin structure, and mapped histone modifications and nucleosome positions in the genome that correlate with gene specificity and function during retinal maturation [2,3,4]. One PTM, H3K4me2, is known to mark open promoters and enhancers. Additionally, our group and others have demonstrated that the H3K4me2 marker is accumulated on the gene bodies of tissue-specific highly transcribed genes [2,5,6].
There have been fewer studies of the equally important process by which precursor cells cease to proliferate, begin to form compact blocks of heterochromatin, and downregulate genes responsible for cell cycle progression and progenitor and cell fate specification.
The retina is a tissue ideally suited for developmental studies. It is compact, readily accessible, and supported by a large body of histological and molecular studies [7]. In addition, much of retinal development can be mimicked by in vitro experiments using pluripotent stem cells [8,9,10].
Here, we have examined changes in the epigenetic signatures of genes whose expression decreases as retinal development proceeds. By identifying changes in H3K4me2, H3K27me3, H3K9me2/3, and DHS, we have been able to classify two groups of genes. One group was characterized by a decrease in H3K4me2 and an increase in H3K27me3, and a second, smaller group by a decrease in H3K4me2 without a concomitant increase in H3K27me3. In addition to studies in the intact retina, we have taken advantage of the powerful in vitro differentiation of pluripotent stem cells. Even with the limited range of epigenetic modifications examined, our results suggest that there are multiple mechanisms controlling developmental downregulation of gene expression and argue for an active role for the epigenome in development.
2. Methods
2.1. Mice
This study was conducted in compliance with the National Research Council’s Guide for Care and Use of Laboratory Animals (8th edition), and experiments with animals were authorized by the Pennsylvania State University College of Medicine Institutional Animal Care and Use Committee (protocol #46993, approval date: 12 June 2024, and triennial approval date: 19 April 2025). C57BL/6j mice were purchased from the Jackson Laboratory (Bar Harbor, ME, USA) and are free of known retinal degeneration mutations. C3H/HeJ (rd1) mice were purchased from the Jackson Laboratory (Bar Harbor, ME, USA).
2.2. Tissue Collection
Animals were euthanized with an Euthanex Auto CO2 System (Euthanex Corp. Palmer, PA, USA). Whole retinas were dissected from mice of either gender by removal of the sclera, lens, visible ciliary margin, and RPE in Ultraculture serum-free medium (Lonza, Walkersville, MD, USA). Retinas were flash-frozen with liquid nitrogen for storage.
2.3. Reagents
All chemicals were purchased from Fisher Scientific (Pittsburgh, PA, USA), unless otherwise noted.
2.4. Chromatin Immunoprecipitation (ChIP)
Approximately 1 × 10⁷ cells were used for each sample or input. Three independent experiments with cell cultures treated with Activin or control cell cultures were carried out. ChIP was performed as previously described [2,10,11]. Briefly, cells were crosslinked with 1% formaldehyde and quenched with glycine. The cells were lysed in 500 μL lysis buffer and sonicated to generate 300–1000 bp fragments. Lysates were quantified using the DCA Protein Assay, and 0.35 mL of 1 mg/mL lysate was used per ChIP sample. Chromatin was immunoprecipitated with 10 ug of anti-SMAD2/3 (Santa Cruz Biotechnology, Santa Cruz, CA, USA) and Protein A + G magnetic beads (Millipore, Billerica, MA, USA). Beads were washed four times with low-salt buffer (0.1% SDS, 1% Triton X100, 2 mM EDTA pH 8.0, 20 mM Tris-HCl pH 8.0, 150 mM NaCl) and once with high-salt buffer (0.1% SDS, 1% Triton X100, 2 mM EDTA pH 8.0, 20 mM Tris-HCl pH 8.0, 500 mM NaCl). Immune complexes were eluted with elution buffer (1% SDS, 0.1 M NaHCO3) and reverse-crosslinked with Proteinase K (Roche, Penzberg, Germany) at 37 °C for 30 min and then at 65 °C overnight. DNA was then purified twice using phenol/chloroform extraction and once using chloroform only and phase lock gels (5 Prime, Hilden, Germany). DNA fragments were amplified using the iQ SYBR Green Supermix with targeted primers (see ChIP-qPCR Primer Table, Supplementary Experimental Procedures), and each sample was run in technical triplicates. Reactions were quantified using a genomic DNA standard as a ratio between immunoprecipitated DNA and input.
2.5. Quantitative Reverse-Transcription PCR (qRT-PCR)
Total RNA was extracted using the RNeasy Mini Kit (Qiagen, Hilden, Germany) from 3 independent cell culture experiments (control and treated with Activin) or 3 retinas from different animals for each developmental point, treated with DNase I (Qiagen, Hilden, Germany), and reverse transcription was carried out using random hexamers and Super-script II Reverse Transcriptase (Thermo Fisher Scientific, Waltham, MA, USA). Transcripts were amplified using iQ SYBR Green Supermix (Bio-Rad Laboratories, Hercules, CA, USA) with gene-specific primers (see Table S1) [12,13,14,15,16,17] on a C1000 Touch Thermal Cycler (Bio-Rad Laboratories, Hercules, CA, USA). Each sample was run in technical duplicate or triplicate. Samples collected at the same DIV (days in vitro) or retina developmental day were normalized to Gapdh and quantified using the ΔΔCt method.
PCR primer sequences were designed using UCSC Genome Browser (mouse NCBI37/mm9) and NCBI Primer-BLAST https://www.ncbi.nlm.nih.gov/tools/primer-blast/ (accessed on 9 September 2026) or from referenced studies. Primers were verified through amplification of cDNA from wild-type C57Bl6/J mouse retinas.
2.6. Retina Differentiation Protocol
The mouse ESC line BK3 was a gift from S. Bronson and was maintained as described [18]. It was differentiated in adherent conditions with the stepwise addition of Dkk1, noggin, IGF1, and bFGF, as in a previously published protocol [19] with modifications [8,9,10]. Briefly, ESCs were trypsinized and resuspended in DMEM/Ham’s F12 (DMEM/F12) containing N2, B27 without vitamin A, 1 ng/mL Dkk1 (R&D Systems, Minneapolis, MN, USA), 1 ng/mL noggin (R&D Systems, Minneapolis, MN, USA), 5 ng/mL IGF1 (Sigma-Aldrich, St. Louis, MO, USA), and 10% FBS, and grown on ultra-low-attachment dishes (VWR International, Radnor, PA, USA) to induce embryoid body (EB) formation. Cells were grown as EBs for 3 days before 20–30 EBs were plated per 1000 mm2 surface area on tissue-culture-treated dishes coated with poly-D-lysine (PDL) and growth factor reduced Matrigel (GFR Matrigel) (VWR International, Radnor, PA, USA) in DMEM/F12 medium containing N2, B27 without vitamin A, 10 ng/mL Dkk1/noggin/IGF1, and 5 ng/mL bFGF (R&D Systems, Minneapolis, MN, USA). At 11 DIV (days in vitro), B27 supplement without vitamin A was replaced with B27 supplement containing vitamin A. At 18 DIV, recombinant factors were removed from the supplemented medium. Cells were fed every other day throughout the protocol. Activin A (R&D Systems, Minneapolis, MN, USA), and was applied and replenished during medium changes. Activin A was applied to cells at 9 DIV at 50 ng/mL, and samples were collected every 3 days—12, 15, 18, 21, and 24 DIV. For anti-SMAD2/3 chromatin immunoprecipitation, we used 18 DIV samples.
2.7. Statistical Analysis
Statistical analysis was performed using Excel and GraphPad Prism 5–11 (GraphPad Software, La Jolla, CA, USA). An unpaired t-test with Welch’s correction was used to compare two groups. All data were generated from a minimum of three independent experiments and are represented as the mean ± SEM.
2.8. Genome-Wide Databases
Datasets were collected from the NCBI GEO data repository and visualized in the UCSC Genome Browser (www.genome.ucsc.edu) (accessed on 9 September 2026). As our and others’ important whole-genome datasets for mouse retinal development were mapped to NCBI37/mm9 [2,20,21,22,23], we continued to use the NCBI37/mm9 (July 2007) mouse genome assembly and data from RefSeq and ENCODE (annotation from March 2012, freeze). Datasets for H3K4me2 and H3K27me3 CHIP-Seq were from the mouse retina at E17 (embryonic day 17), PN1 (postnatal day 1), PN7, and PN15 from wild-type (WT) mice, and from the retina of mutant rd1 PN30 (GSE38500) [2]. H3K4me2 and H3K27me3 coverage levels (reads/bp) correspond to values normalized by the number of mapped reads, as they were in the GEO dataset. For tag distribution around the gene body, we used the RefSeq database of established transcription start sites (TSSs) and transcriptional end sites (TESs) [20]; the number of reads on the whole gene body was calculated in the window TSS − 1000 bp (1000 bp before TSS) and 1000 bp after TES. Mouse DNase1 hypersensitive sites were collected from the ENCODE project: mouse retina PN1 (1D), PN7 (1W), and PN56 (8W) (GSM1014188; GSM1014198; GSM1014175) [21].
2.9. Gene Functional Analysis
The Database for Annotation, Visualization and Integrated Discovery (DAVID) [22] v6.8 web-accessible program (https://davidbioinformatics.nih.gov/)(accessed on 9 September 2026) was used for GO functional analysis. To analyze and visualize relation between genes, we used the STRING 12.0 database that compiles scores and integrates protein–protein association information (https://string-db.org/) (accessed on 9 September 2026). The cluster analysis method is in the Supplementary Methods.
3. Results
3.1. Different Patterns of Histone Methylation Divide Downregulated Genes into Different Classes
We have hypothesized that specific epigenetic signatures accompany the downregulation of groups of genes during retinal development. To test this hypothesis, we followed changes in three epigenetic marks: the active chromatin histone modification H3K4me2 that accumulates on open promoters and active enhancers [2], the repressed chromatin histone modification H3K27me3 [2], and a marker of open chromatin—DNase hypersensitive sites (DHSs) [21]. Additionally, H3K4me2 marker accumulation on the gene body was used as a proxy for the level of gene transcription, as our group and others have demonstrated that the H3K4me2 marker is accumulated on the gene bodies of tissue-specific highly transcribed genes [2,5,6]. To choose retina genes that were downregulated during development, we compared the accumulation of H3K4me2 at two developmental stages, E17 and PN15, and additionally compared E17 WT and adult retina in rd1 mutant mice, where only inner-nuclear-layer retinal cells were present. For DHS comparisons, we used DHSs at PN1 and 8 weeks (8W). For each gene, we calculated the number of reads on the whole gene body: between 1000 bp before transcriptional start sites (TSS − 1000 bp) and 1000 bp after transcriptional end sites (TES + 1000 bp). For the final list, we chose genes that obeyed all of the following criteria:
- a.
- For H3K4me2: E17/PN15 > 2, or no H3K4me2 accumulation at PN15 on the whole gene body ± 1000 bp (for photoreceptors);
- b.
- For H3K4me2: E17/RD1 > 1.5, or no H3K4me2 accumulation in RD1 mice on the whole gene body ± 1000 bp (for other retina cells);
- c.
- For DHS: 1D/8W > 2 or no DHS at 8W on the whole gene body ± 1000 bp.
From this group of downregulated genes, we chose two extreme groups of genes according to the amount of inhibitory marker H3K27me3 accumulation during development; we calculated H3K27me3 accumulation across the whole gene body ± 1000 bp at developmental stages E17, PN1, PN7, and PN15. One group had maximum H3K27me3 accumulation, and another had no or very low H3K27me3 accumulation. For this, we calculated normalized H3K27me3 accumulation on genes (value A = reads/bp = (number of H3K27me3 reads on genomic region)/(length of genomic region between (TSS − 1000 bp) and (TES + 1000 bp)).
- The maximum value of A of all developmental stages for the gene is A > 1;
- The maximum value of A of all developmental stages for the gene is A ≤ 0.5.
We included only genes with a normalized H3K4me2 value at E17 of more than 1 (value B = reads/bp = (number of H3K4me2 reads)/(length of genomic region between (TSS − 1000 bp) and (TES + 1000 bp))) in the final list for both group 1 and group 2.
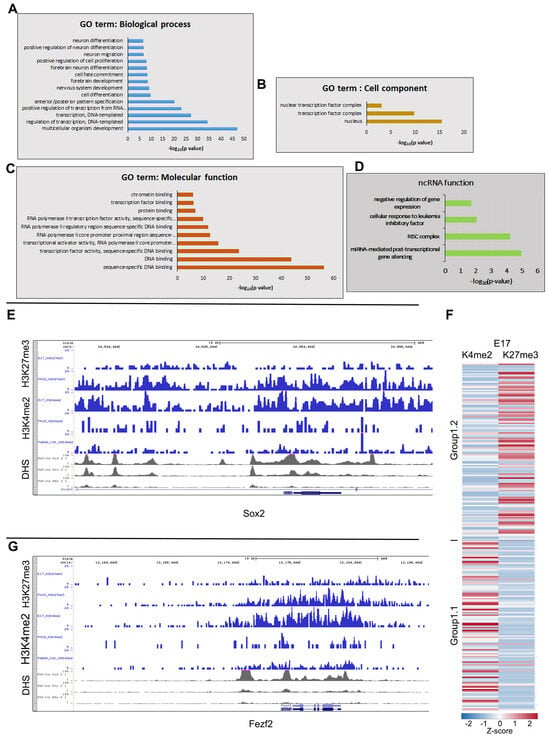
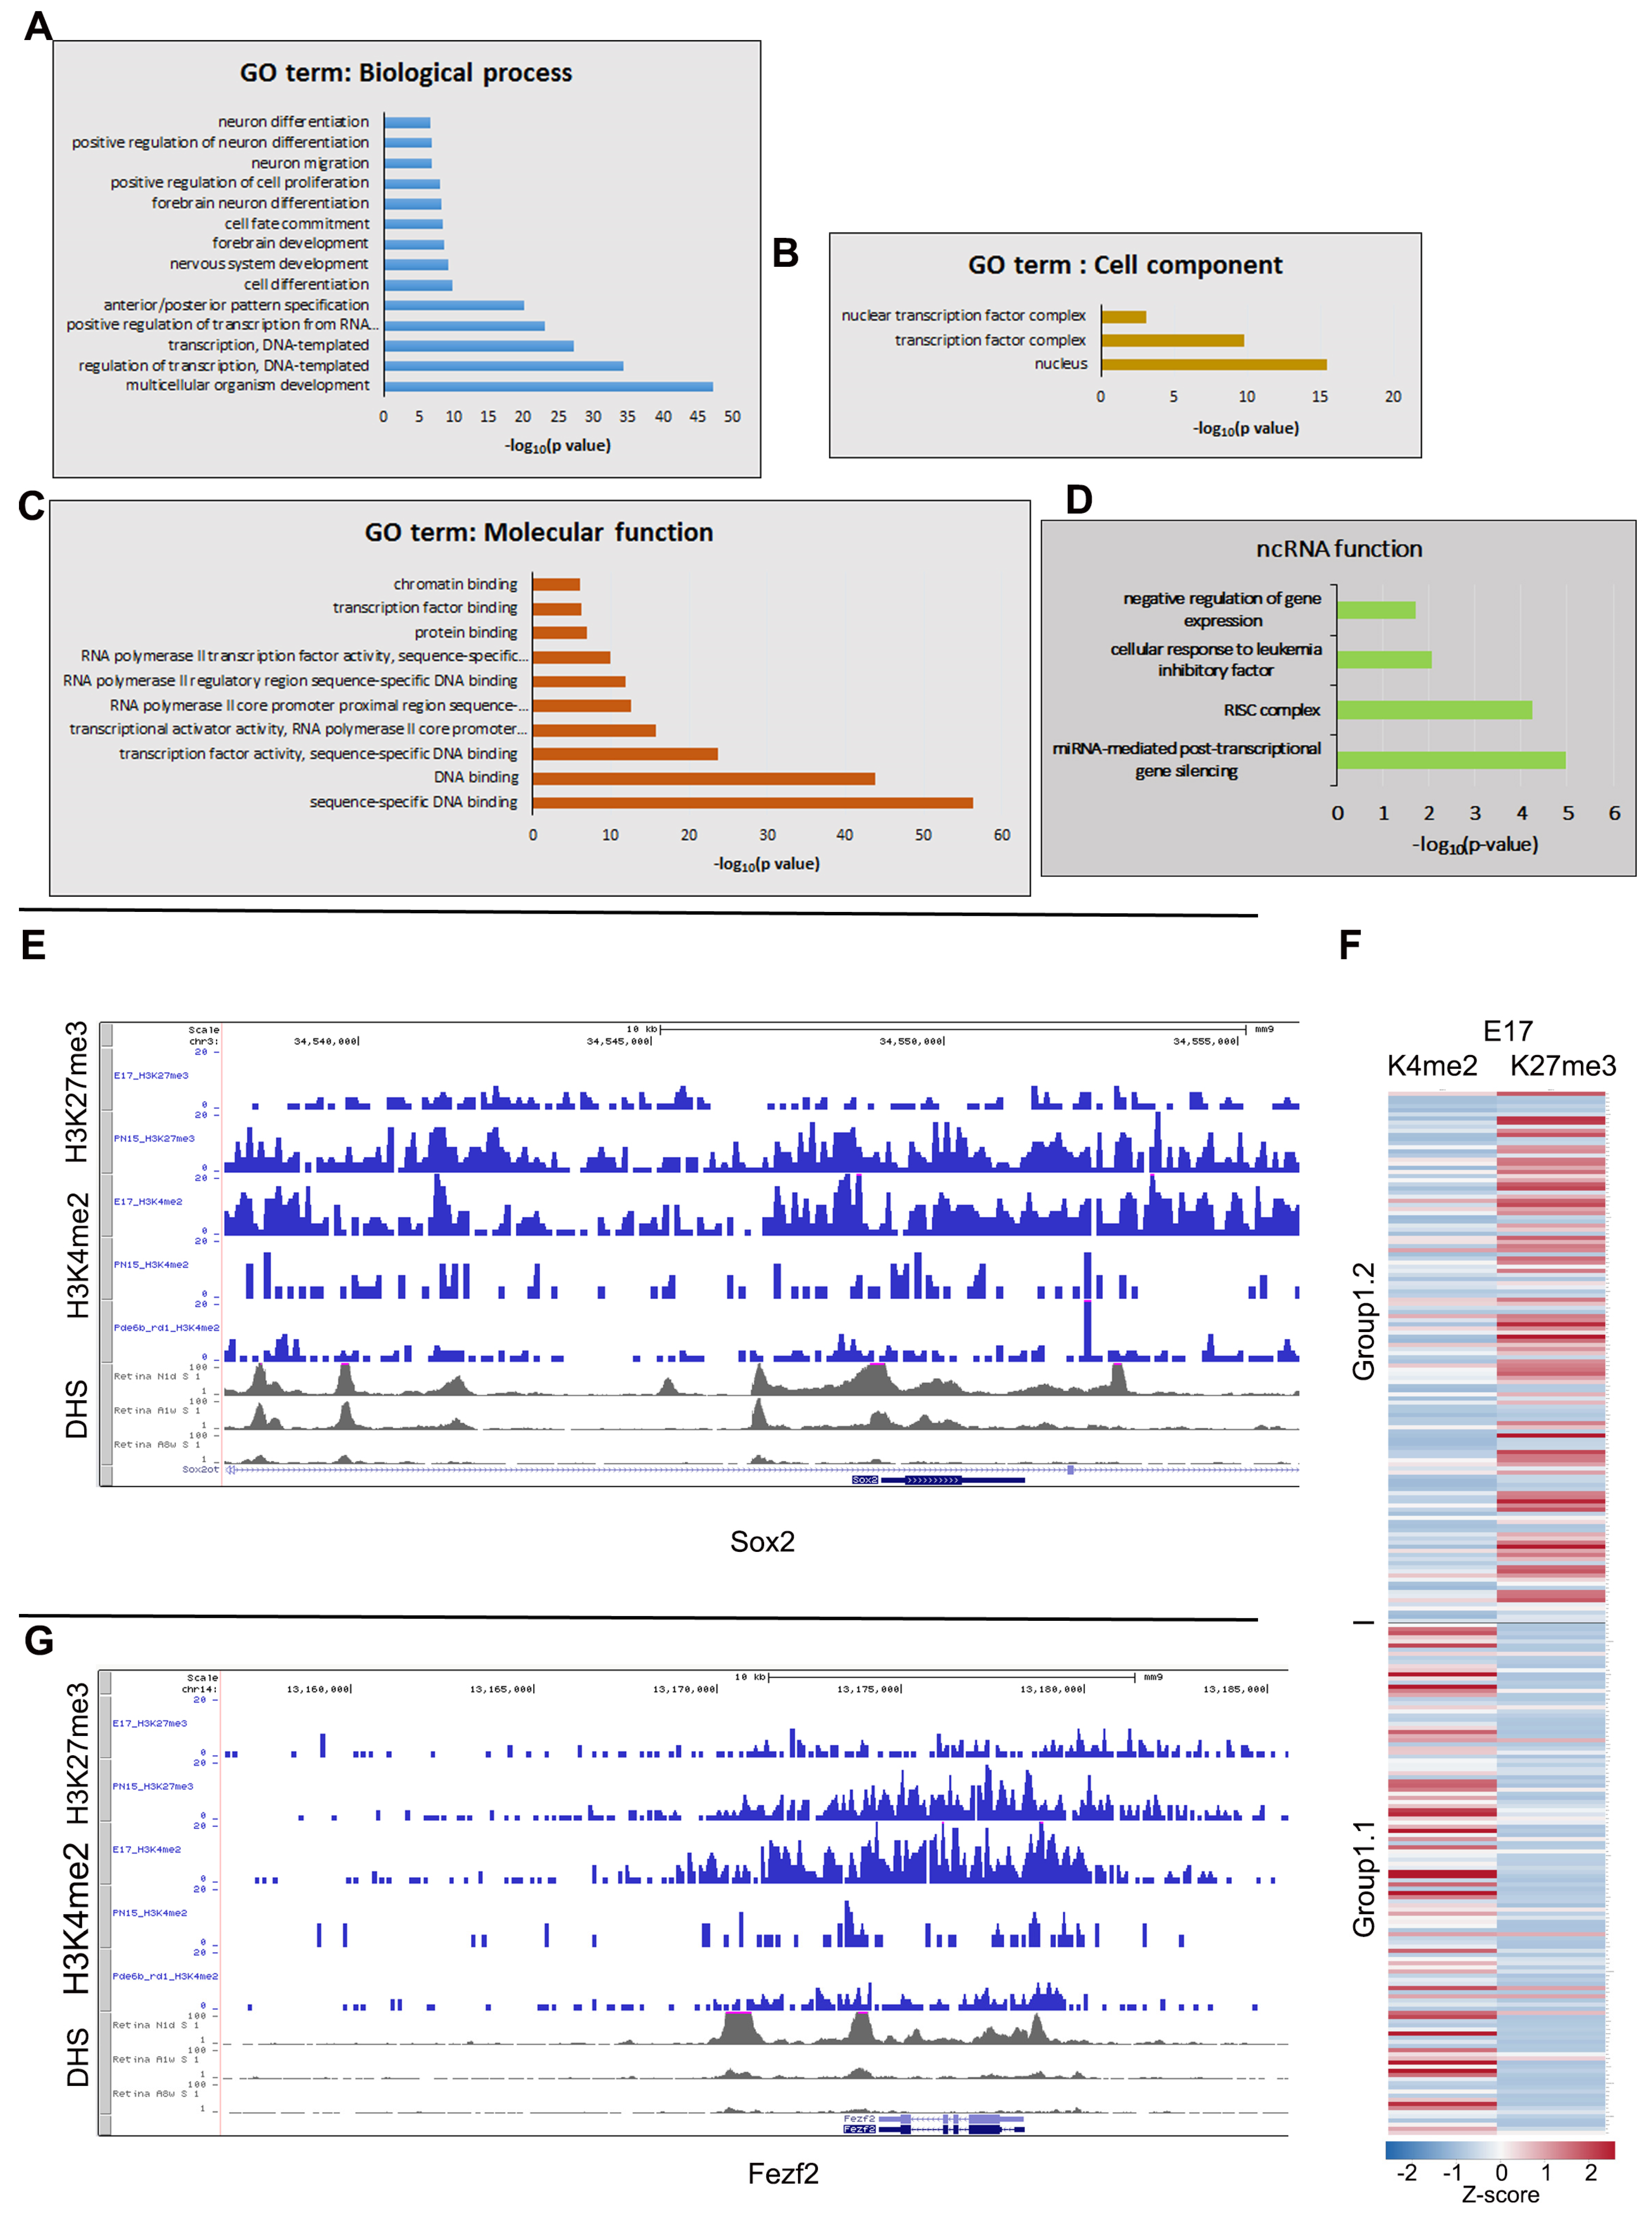
Group 1, with the maximum accumulation of H3K27me3, contained 252 genes and 93 ncRNAs (Table S2). We used DAVID analysis to identify the biological processes, cell components, and molecular functions that these genes participate in (Figure 1A–C; Table S2, sheet—DAVID GO analysis). They play a role in organism development, transcription and its regulation, and proliferation, as well as neuronal and embryonic development (Figure 1A). They are located in the nucleus and in transcription factor complexes (Figure 1B) and function as transcription factors (TF), DNA- and chromatin-binding proteins, and components in the RNA PolII complex (Figure 1C).
Figure 1.
Epigenetic signatures of genes (group 1) downregulated during retinal development show a decrease in the active marker H3K4me2, accompanied by an increase in the inhibitory marker H3K27me3 on their genomic loci. Using DAVID analysis, these genes participated in biological processes (A): development, forebrain development, transcription regulation, cell differentiation, neuron differentiation; cell components (B): nucleus and transcriptional complexes; and molecular functions (C): DNA binding, chromatin binding, transcriptional activation, and RNA polymerase II transcription activity. (D) DAVID analysis of the function of ncRNA from group 1. (E,G) Examples of epigenetic chromatin features for gene loci from group 1.2: Sox2 (E) and Fezf2 (G). Combined genome-wide tracking of H3K27me3 accumulation at E17 and PN15 in WT mouse retinas; H3K4me2 accumulation at E17 and PN15 in WT mouse retinas and PN30 in rd1 mouse retinas; DHS sites at day 1 (D1), 8 days (8D), and 8 weeks (8W) in WT mouse retinas. Y-axis is the number of reads in a 100 bp interval (F): Division of group 1 genes into subgroups 1.1 and 1.2. Clustered heatmap for group 1 genes based on accumulation at E17 for H3K4me2 and H3K27me3 reads/bp.
To confirm that this group of genes was downregulated during development, we first used the accumulation of H3K4me2 on the gene body as a proxy for gene expression and then checked the expression of genes from group 1 using available RNA-seq data for human and mouse retinal development [23,24]. Approximately half of the group 1 genes (group 1.1, late embryonic retinal genes) are highly expressed in the embryonic retina but are switched off in the mature retina (Table S2, [23]), and this downregulation coincides with the accumulation of the H3K27me3 inhibitory marker at their gene bodies. Examples of this group of genes, which are important in the late embryonic stages of retinal development, include well-known TFs for retinal development, such as Sox2 (Figure 1E), Fezf2 (Figure 1G), Id3, Pax6, Tbx2, Irx5, Ccnd1, and Sox8. Epigenetic profiles for these genes demonstrate the disappearance of the H3K4me2 chromatin active marker (from E17 to PN15) and DHSs (from 1D to 8W) from the gene body during development, and the dramatic increase in the accumulation of the chromatin inhibitory marker, H3K27me3, from E17 to PN15.
The other half of the group 1 genes (group 1.2) show the same general epigenetic changes during development as the first group, but they specifically have lower H3K4me2 accumulation on the gene body at E17 and higher H3K27me3 accumulation than group 1.1 (Figure 1F). Accordingly, these genes already have very low expression at E14.5, as measured by RNA-seq data. Several known early-development and pioneering TFs belong to this subgroup, such as Foxa1, Foxd3, Pax9, Sox1, and a large group of Hox genes (Table S2). Additionally, this group consists of some early markers and TFs that regulate the differentiation of individual early born retinal cell types, such as Pou4f2 (RGC), Lhx1 and Onecut1 (horizontal cells), and Dlx1 (amacrine).
To compare the subgroups of group 1, we used the STRING database, which tracks protein–protein interactions. For group 1.1, the majority of genes participate in cell fate commitment (Supplementary Figure S1), while group 1.2 genes are homeobox genes that participate in the formation of the primary germ layer (Supplementary Figure S2). Additionally, we separately analyzed these two subgroups for functional enrichment in Gene Ontology in STRING. For group 1.1, biological process enrichment is the development of specific organs and tissues: the forebrain, brain, head, and CNS, while for group 1.2, these are events that happen early in development: regionalization, pattern specification, and anterior/posterior specification (Supplementary Figure S3A,B). Molecular function enrichment for DNA-binding transcription factor activity and cis-regulatory and PolII-regulatory binding are similar for both subgroups, although group 1.1 additionally has receptor–ligand activity and G protein-coupled receptor binding functions (Supplementary Figure S3C,D). Tissue expression enrichment in genes from both subgroups is localized in the ectoderm and germ layers, but group 1.2 genes are also components of early embryo compartments, while group 1.1 genes are in ventricles and neuronal stem cells (Supplementary Figure S3E,D). Thus, data analysis using STRING supports our original description of group 1.1 as late embryonic genes and group 1.2 as early embryonic genes.
Although we have studied them in less detail, DAVID analysis of the function of ncRNAs from group 1 shows that some of these ncRNAs, mostly miRNAs (mir 130-a, 152, 219a-2, 219b, 330, 370, and 351), play a role in miRNA-mediated post-transcriptional gene silencing, in the negative regulation of gene expression, and in the RISC complex (Figure 1D). This suggests that the same mechanisms regulate ncRNA expression and coding genes.
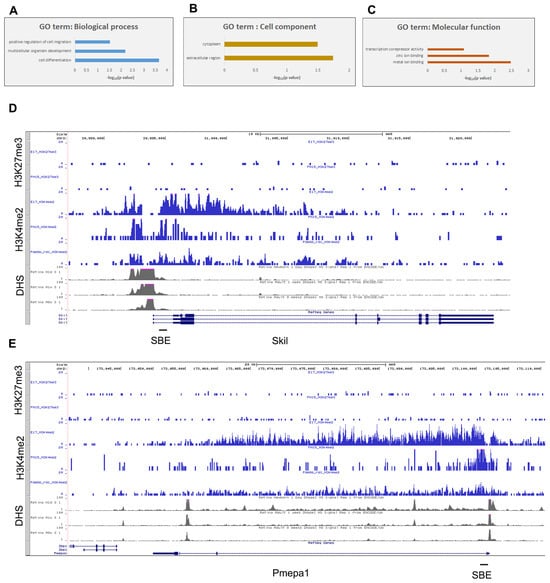
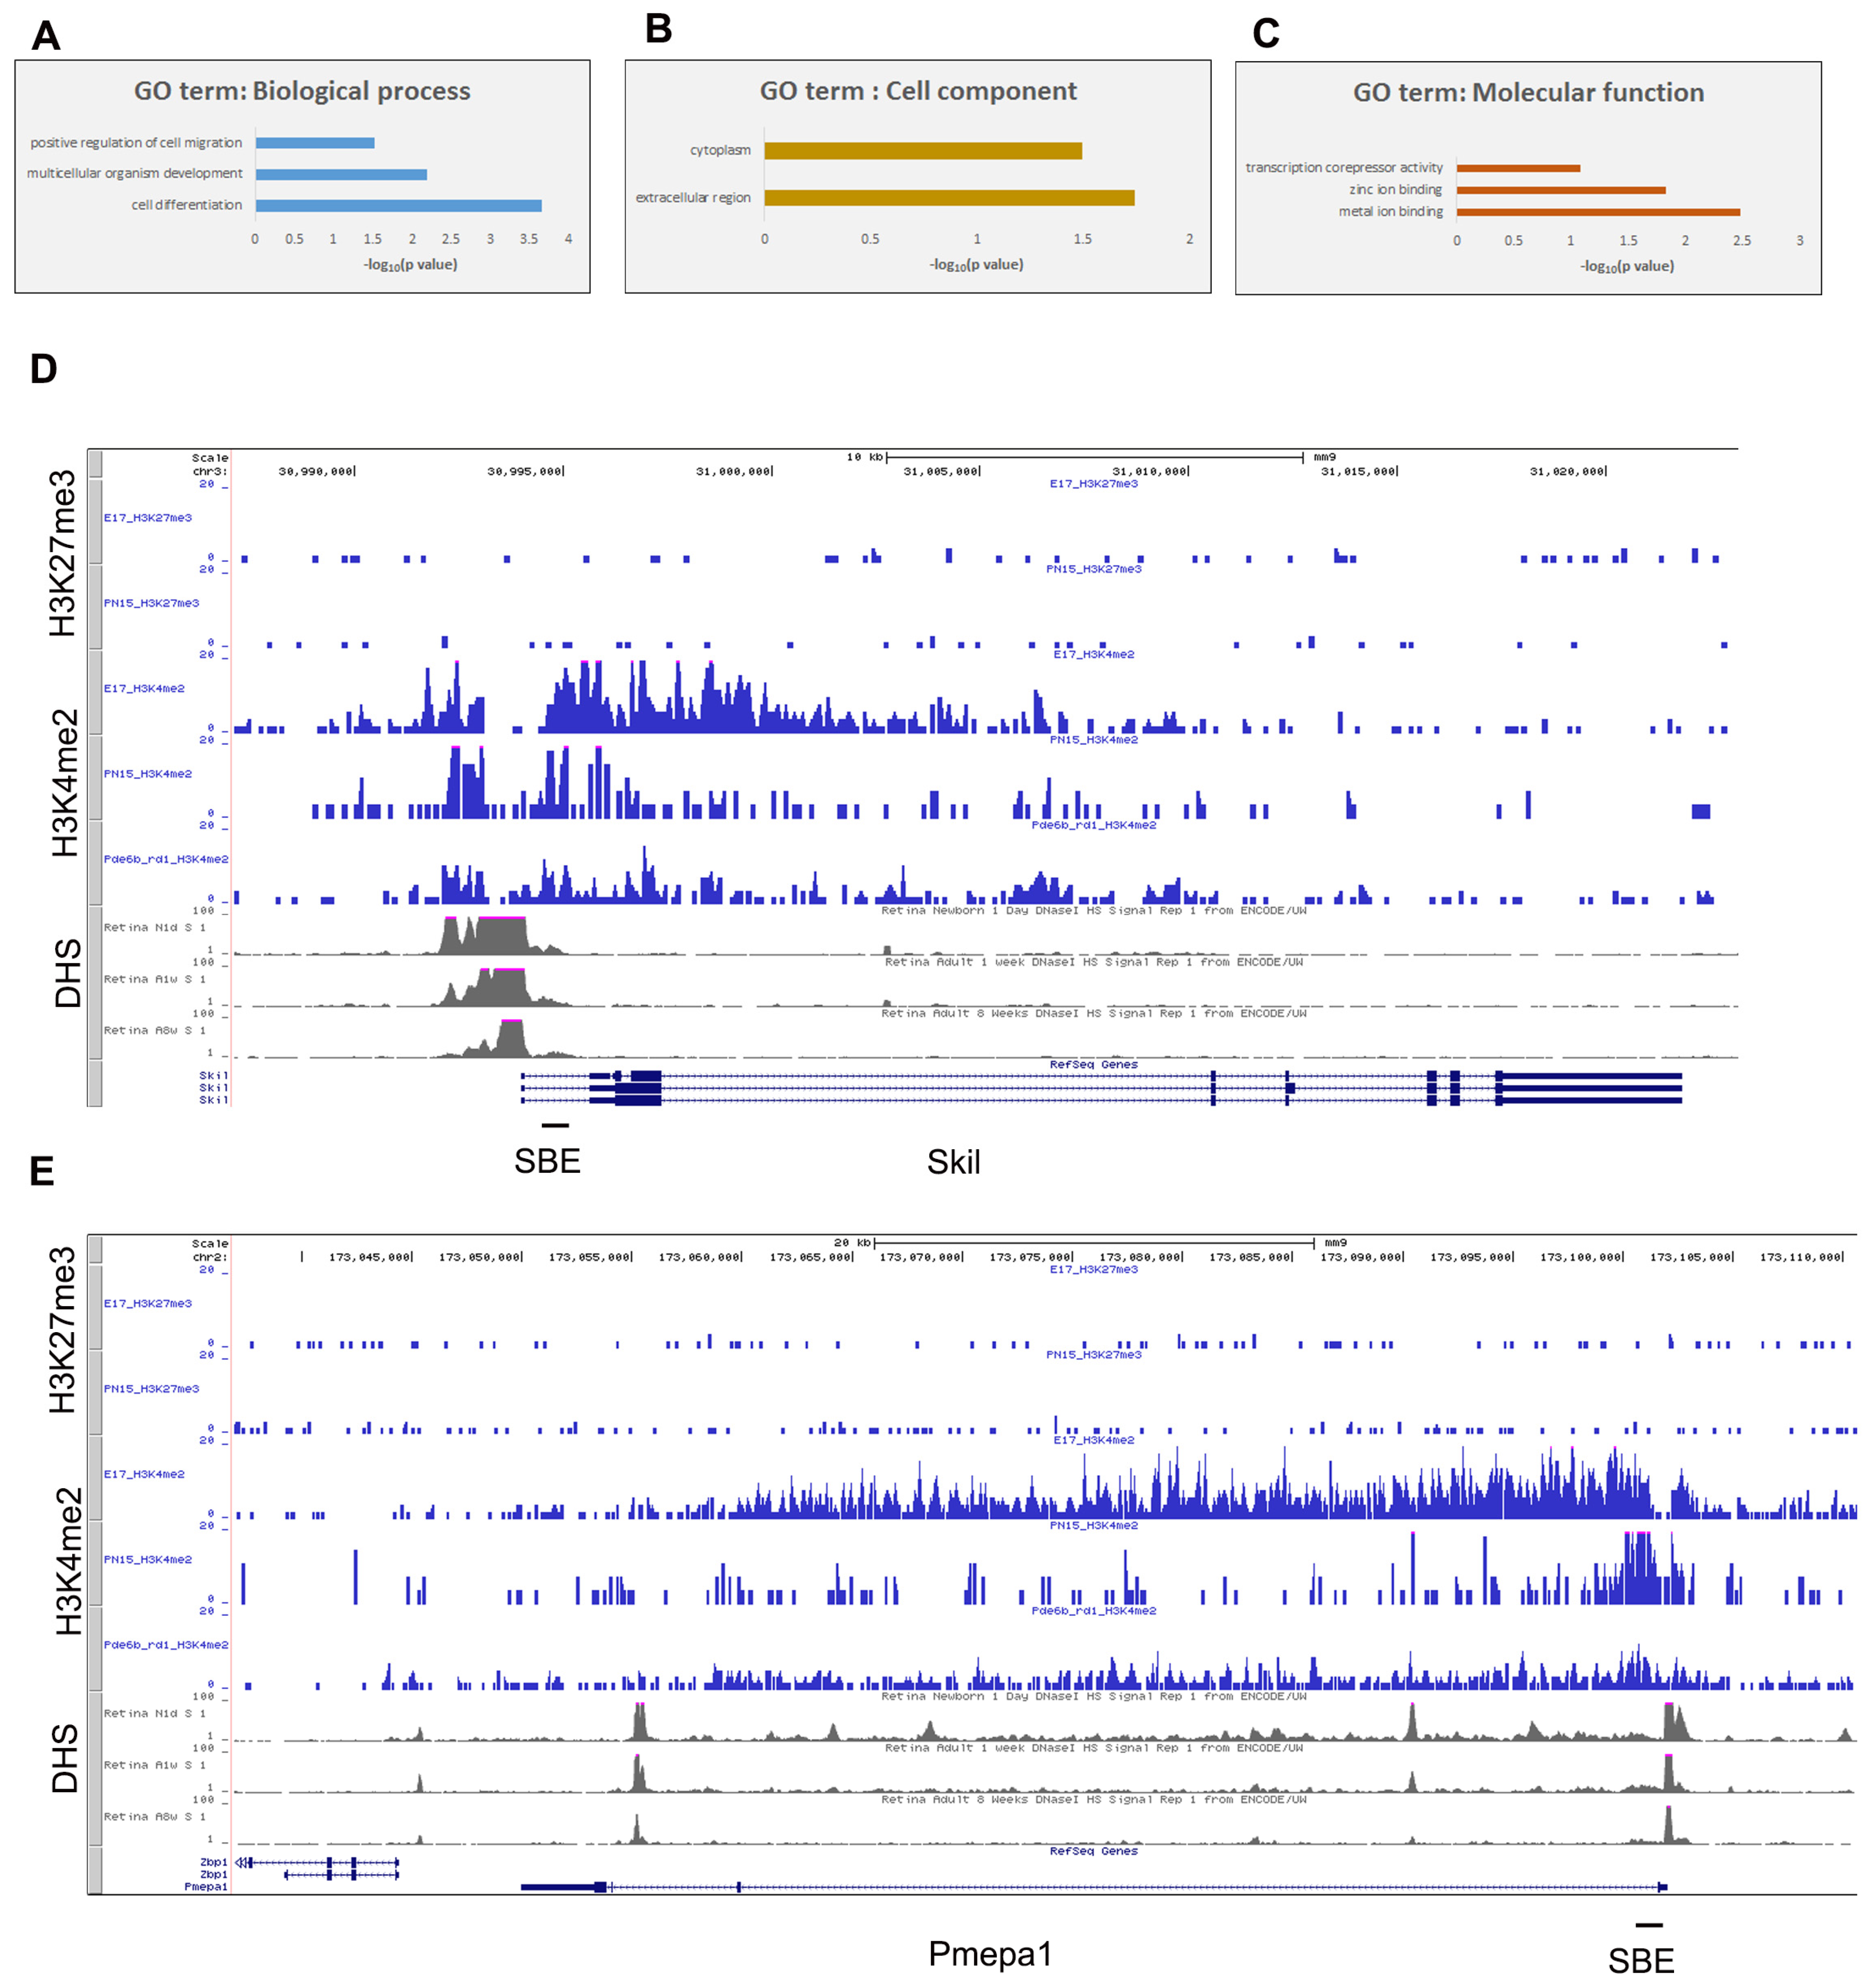
Group 2, with no accumulation of H3K27me3, contained only 67 genes and 23 ncRNAs (Table S3). Using available RNA-seq data for retinal development [23,24], more than 80% showed downregulation of expression during mouse and human retinal development (Table S3). DAVID analysis of this group shows that, similarly to group 1, these transcripts participate in biological processes such as cell differentiation, multicellular organism development, and cell migration (Figure 2A, Table S3, sheet—DAVID GO analysis), but in contrast to group 1, they are mostly located in the cytoplasm and extracellular regions (Figure 2B). They are associated with a variety of functions, including metal binding and transcriptional repression (Figure 2C). Several of the genes play a role in differentiation and development (Rara, Cdk1, Tmem176b, Cdc25b, Gnai, Vangl2, Myadm, Metrn, Tspan14, and Gli2), as well as the negative regulation of proliferation (Efna2, Adgrg, Kcnk1, Ptch2, Lst1, Ptprg, Spag8, Pdzrn3, and Dapl1).
Figure 2.
Epigenetic signatures of the genes (group 2) downregulated during retinal development show a decrease in the active marker H3K4me2 but no increase in the inhibitory marker H3K27me3 at their genomic loci. DAVID analysis shows that these genes participate in biological processes (A): development and cell differentiation; cell components (B): cytoplasm; and molecular functions (C): metal ion binding and transcriptional corepressor activity. (D, E) Examples of epigenetic chromatin features for gene loci from group B: Skil (D) and Pmepa1 (E). Combined genome-wide tracking of H3K27me3 accumulation at E17 and PN15 in WT mouse retinas; H3K4me2 accumulation at E17 and PN15 in WT mouse retinas and PN30 in rd1 mouse retinas; DHS sites at day 1 (D1), day 8 (8D), and 8 weeks (8W) in WT mouse retinas. The Y-axis is the number of reads in 100 bp intervals.
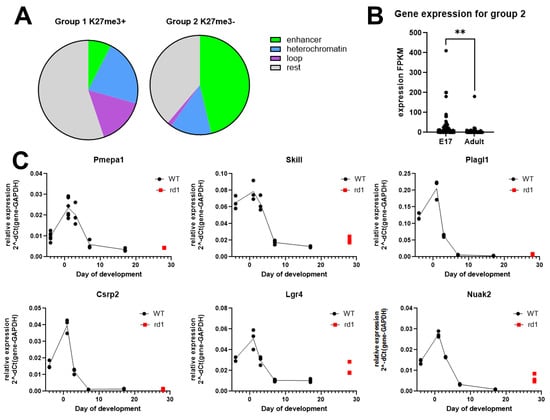
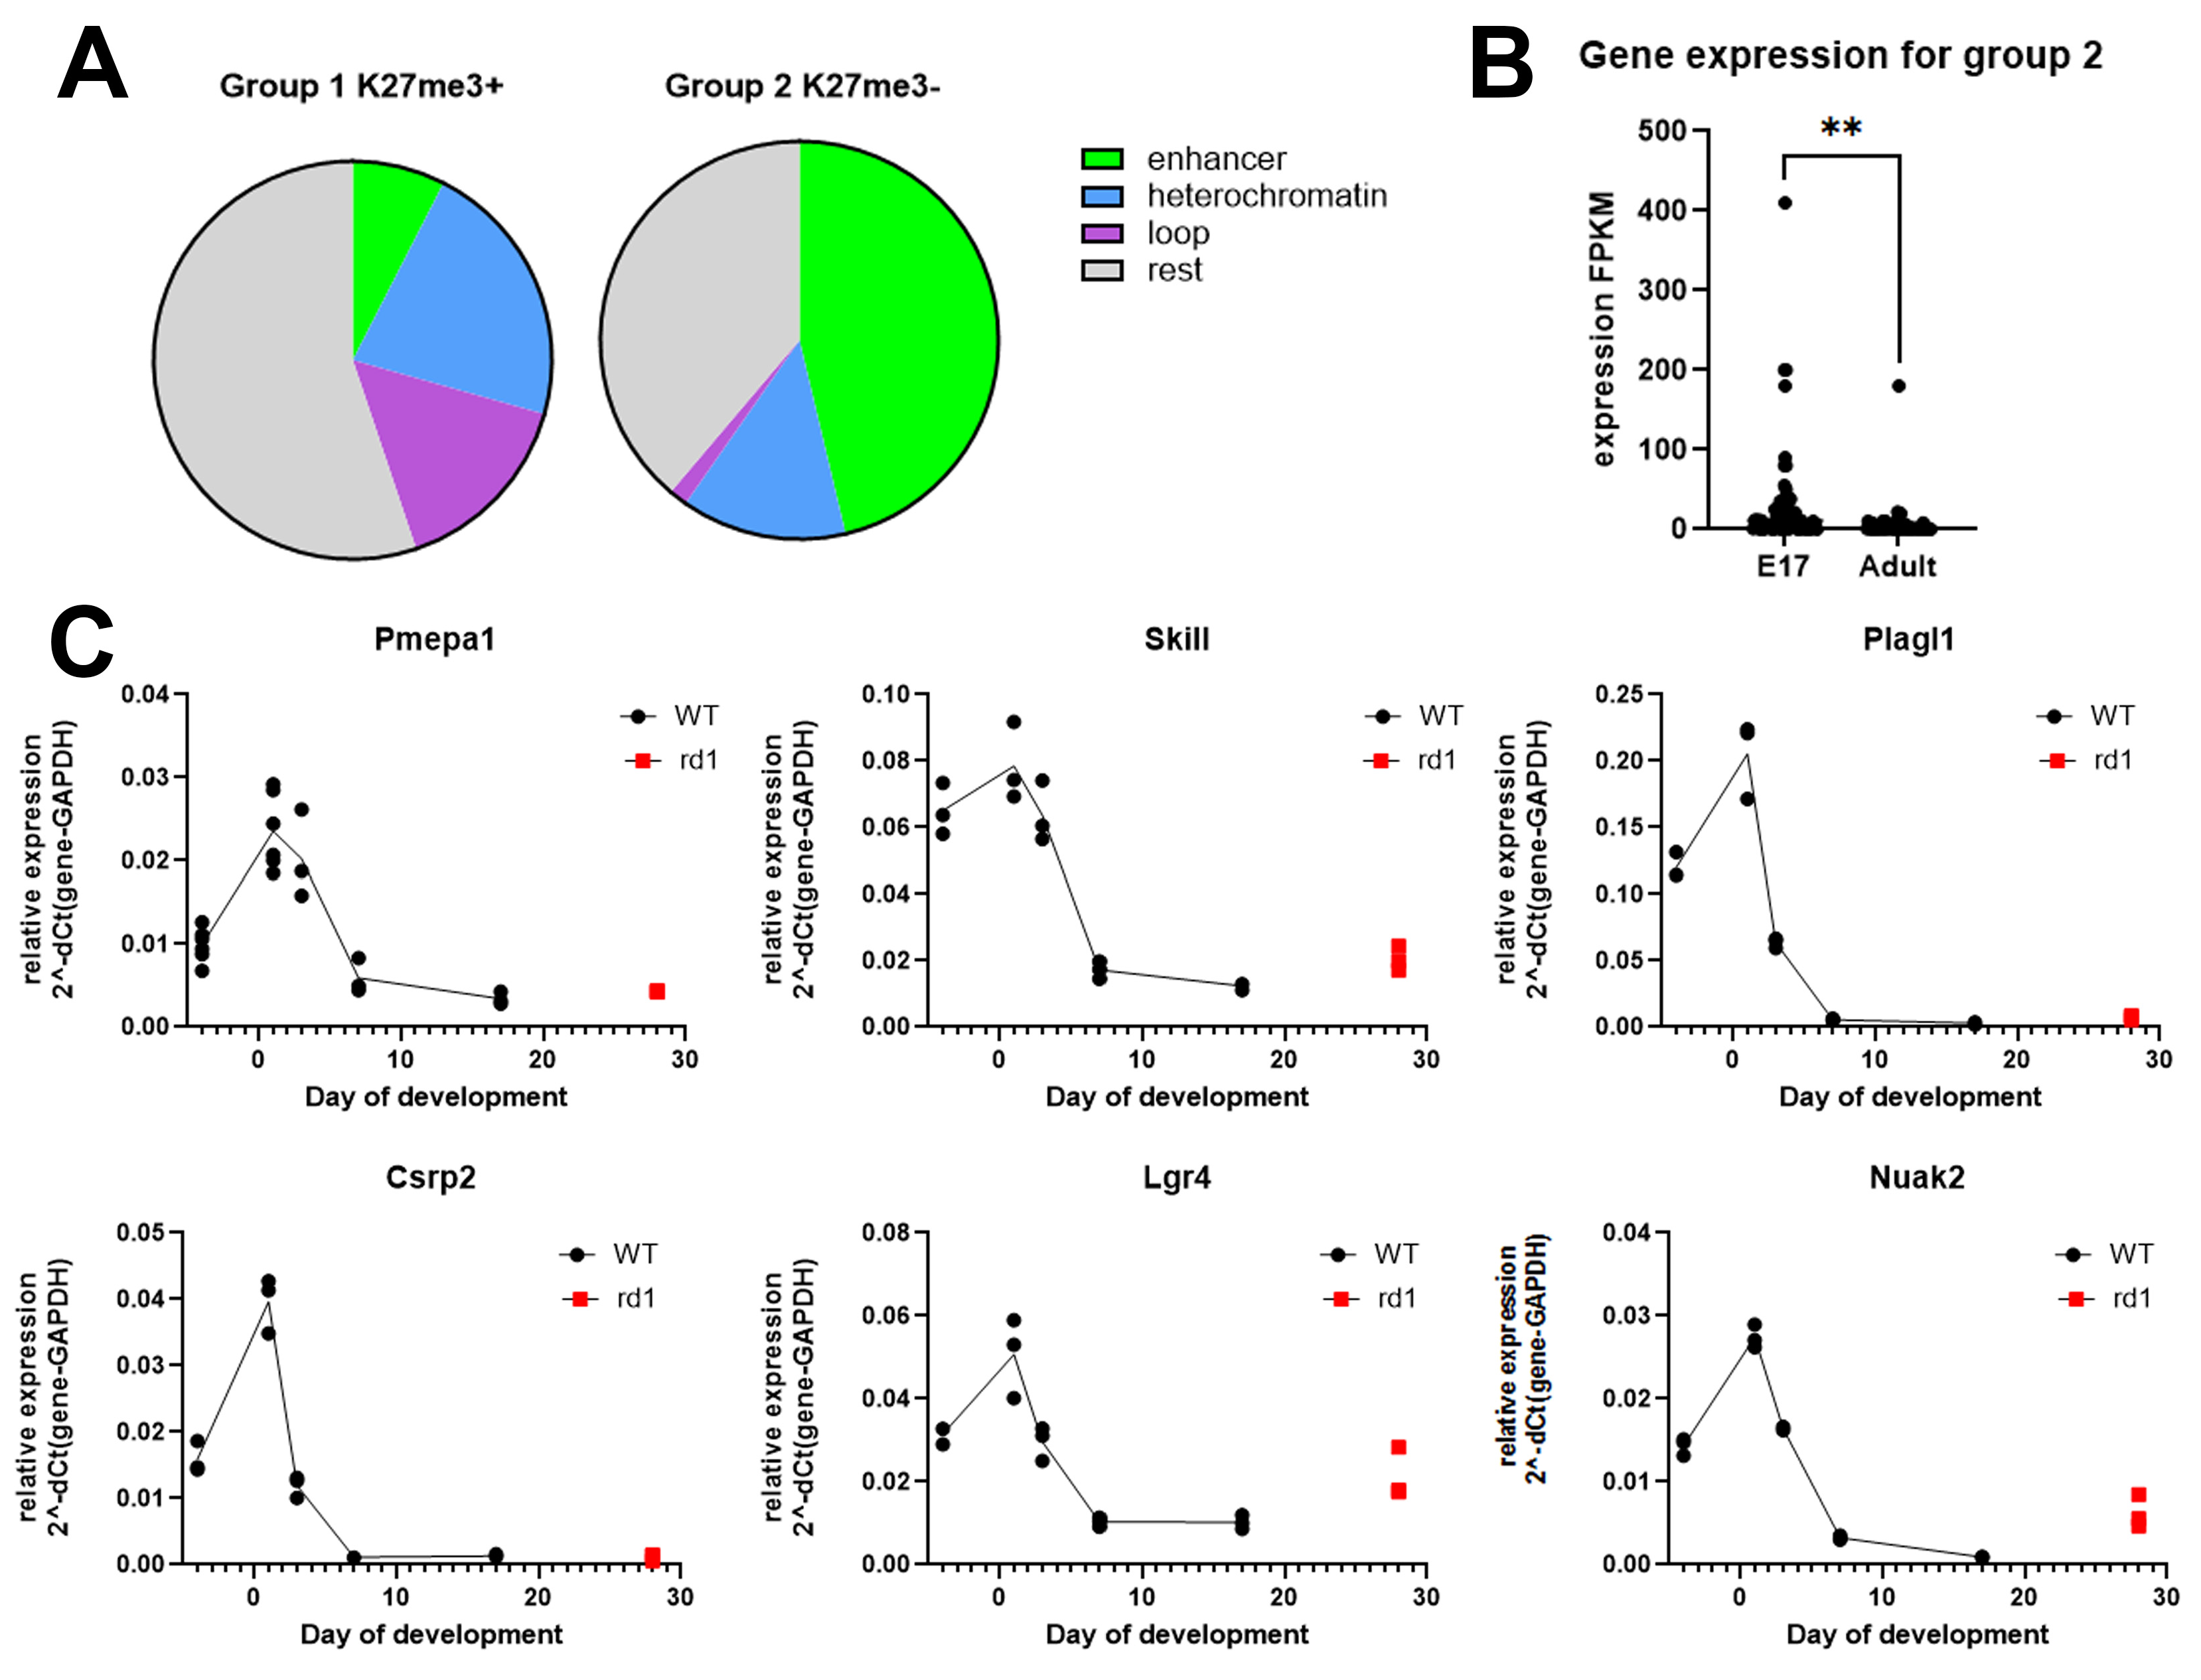
Other examples of this group of genes that are important in the development of the retina during embryonic stages include Skil (Figure 2D) and Pmepa1 (Figure 2E). Epigenetic profiles for these genes demonstrate the disappearance of the H3K4me2 active chromatin marker (from E17 to PN15) and DHSs (from 1D to 8W) from the gene body during development, and no accumulation of the chromatin inhibitory marker, H3K27me3, at any stage from E17 to PN15. By comparing the expression of these genes at E17 and in the adult retina [23], we confirmed that they are downregulated during development (Figure 3B).
Figure 3.
(A) Chromatin features for genes that are downregulated during mouse retinal development. (B). Changes in gene expression in group 2 during development according to [23]. Average expression at E17–29.9 and at adult–5.9. **, p < 0.01. (C) Expression of the genes from group 2 during mouse retinal development. qRT-PCR measuring the expression of genes from group 2: Pmepa1, Skil, Plagl1, Csrp2, Lgr4, and Nuak2 during retinal development at E15, PN1, PN3, PN7, and PN17 in WT mouse retinas and comparison with expression in rd1 mice at PN28 (red dot).
We used the STRING database to study the relationships between genes in group 2 (Supplementary Figure S4A). STRING divided the genes from group 2 into three clusters, with no specific description of the clusters. Additionally, we separately analyzed functional enrichment in the network for Gene Ontology in STRING. For group 2, biological process enrichments are cell differentiation, developmental process, and anatomical structure development (Supplementary Figure S4B). When we examined PPI networks and cluster analysis using STRING for group 2 and the subgroups of group 1, we saw much less confidence in the network for group 2 compared to group 1 (0.15 vs. 0.4), and a lower p-value for functional enrichment (0.0166 vs. < 1.0 × 10⁻¹⁶). This could simply indicate that group 2 genes have fewer common biological functions/pathways than group 1 genes, or it suggests that there is much less knowledge about the functions of these genes.
The functions of ncRNAs from group 2 are mostly unknown. There are some examples of known developmental roles of this group: Lockd positively regulates Cdkn1b, stimulates proliferation, and impairs differentiation; Mir24-2 and the Mir23a cluster are known to promote osteocyte differentiation by regulating TGF-β signaling in osteoblasts (Table S3, [25,26,27,28,29,30]).
We used data from [23] to compare which chromatin features, such as developmental enhancers, heterochromatin, and genomic loops, occur on genes from groups 1 and 2 (Figure 3A). More than half of the genes in group 1 with the maximum accumulation of H3K27me3 have no specific chromatin features, and a large percentage have heterochromatin on the gene. Almost half of the genes in group 2 coincide with developmental enhancers, which could point to the importance of these genes for retinal development.
3.2. Functional Annotation for the Group of Downregulated Genes Without H3K27me3 Accumulation
We then focused on functional annotations for group 2 genes. Group 2 is smaller and comprises 63 genes that are much less studied than the genes in group 1 in terms of retinal development. Accordingly, our attempts to find common pathways and functions for this group by searching databases such as DAVID, STRING, and IPA did not show any specificity. We showed that, in group 2, 37 genes participate in general biological processes such as cell differentiation and development (Figure 2A and Figure S4B), and almost half have developmental enhancers in the vicinity of the gene’s loci (Figure 3A). To search for more information regarding genes in group 2, we did our own literature search. This search to understand the functions and possible mechanisms of the decrease in the transcription of group 2 genes during retinal development demonstrates that this group contains several genes known to work as inhibitors of cell proliferation. Specifically, 14 of 67 (21%) genes and two microRNAs in group 2 are involved in the TGFb/Activin/Smad pathway in several tissues and cell lines, including genes such as Pmepa1, Dkk3, Nuak2, Gnai2, Skil, Vgll4, and Lgr4 (Table S3 and the referenced literature [12,13,14,15,16,17,31,32,33,34,35,36,37,38,39,40]).
We verified expression at several developmental stages of the mouse retina by using RT-PCR for some of the genes belonging to group 2 that could play a role in the Smad/TGF-b pathway (Figure 3B,C, Figures S5 and S6B). All of them (Pmepa1, Skil, Plagl1, Csrp2, Lgr4, Vgll4, and Nuak2) showed a similar pattern, with maximum gene expression around birth and dramatic downregulation after PN7. To examine whether the developmental decrease in gene expression occurs only in rod photoreceptors or in the whole retina, we used retinas of rd1 mutants at PN28, when all rod photoreceptors are lost, and demonstrated a similar decrease in expression (red dots in Figure 3C) in other, non-photoreceptor retinal cells. Additionally, we supplemented our study of the developmental expression of genes from group 2 with data from NEI Commons [24; Brooks, MJ and Swaroop, A, unpublished data] (Supplementary Figure S6A) and data from our laboratory microarray (Supplementary Figure S6C–G) [1]. We then analyzed scRNA-seq data from a recent resource paper [41] and found that genes from group 2 in adult mouse retinas were residually expressed only in Muller glia, microglia, endothelial cells, and astrocytes, but not in rods (Supplementary Figures S5 and S6). These data support our original assumption that epigenetic patterns of H3K4me2 on the body/loci of the gene predict its expression patterns during development and could be used for exploring the function of the genes.
In our previous work [10], we demonstrated that subsequent steps of differentiation of mouse ESCs closely resemble in vivo retinal development and examined the role of Activin signaling during the transition of retinal precursor cells (RPCs) into photoreceptor precursors. We showed that Activin signaling through Smad2/3 promotes photoreceptor lineage specification.
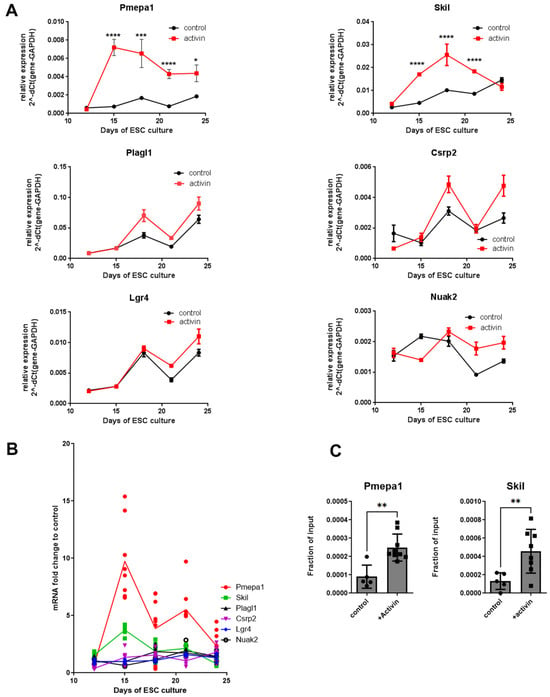
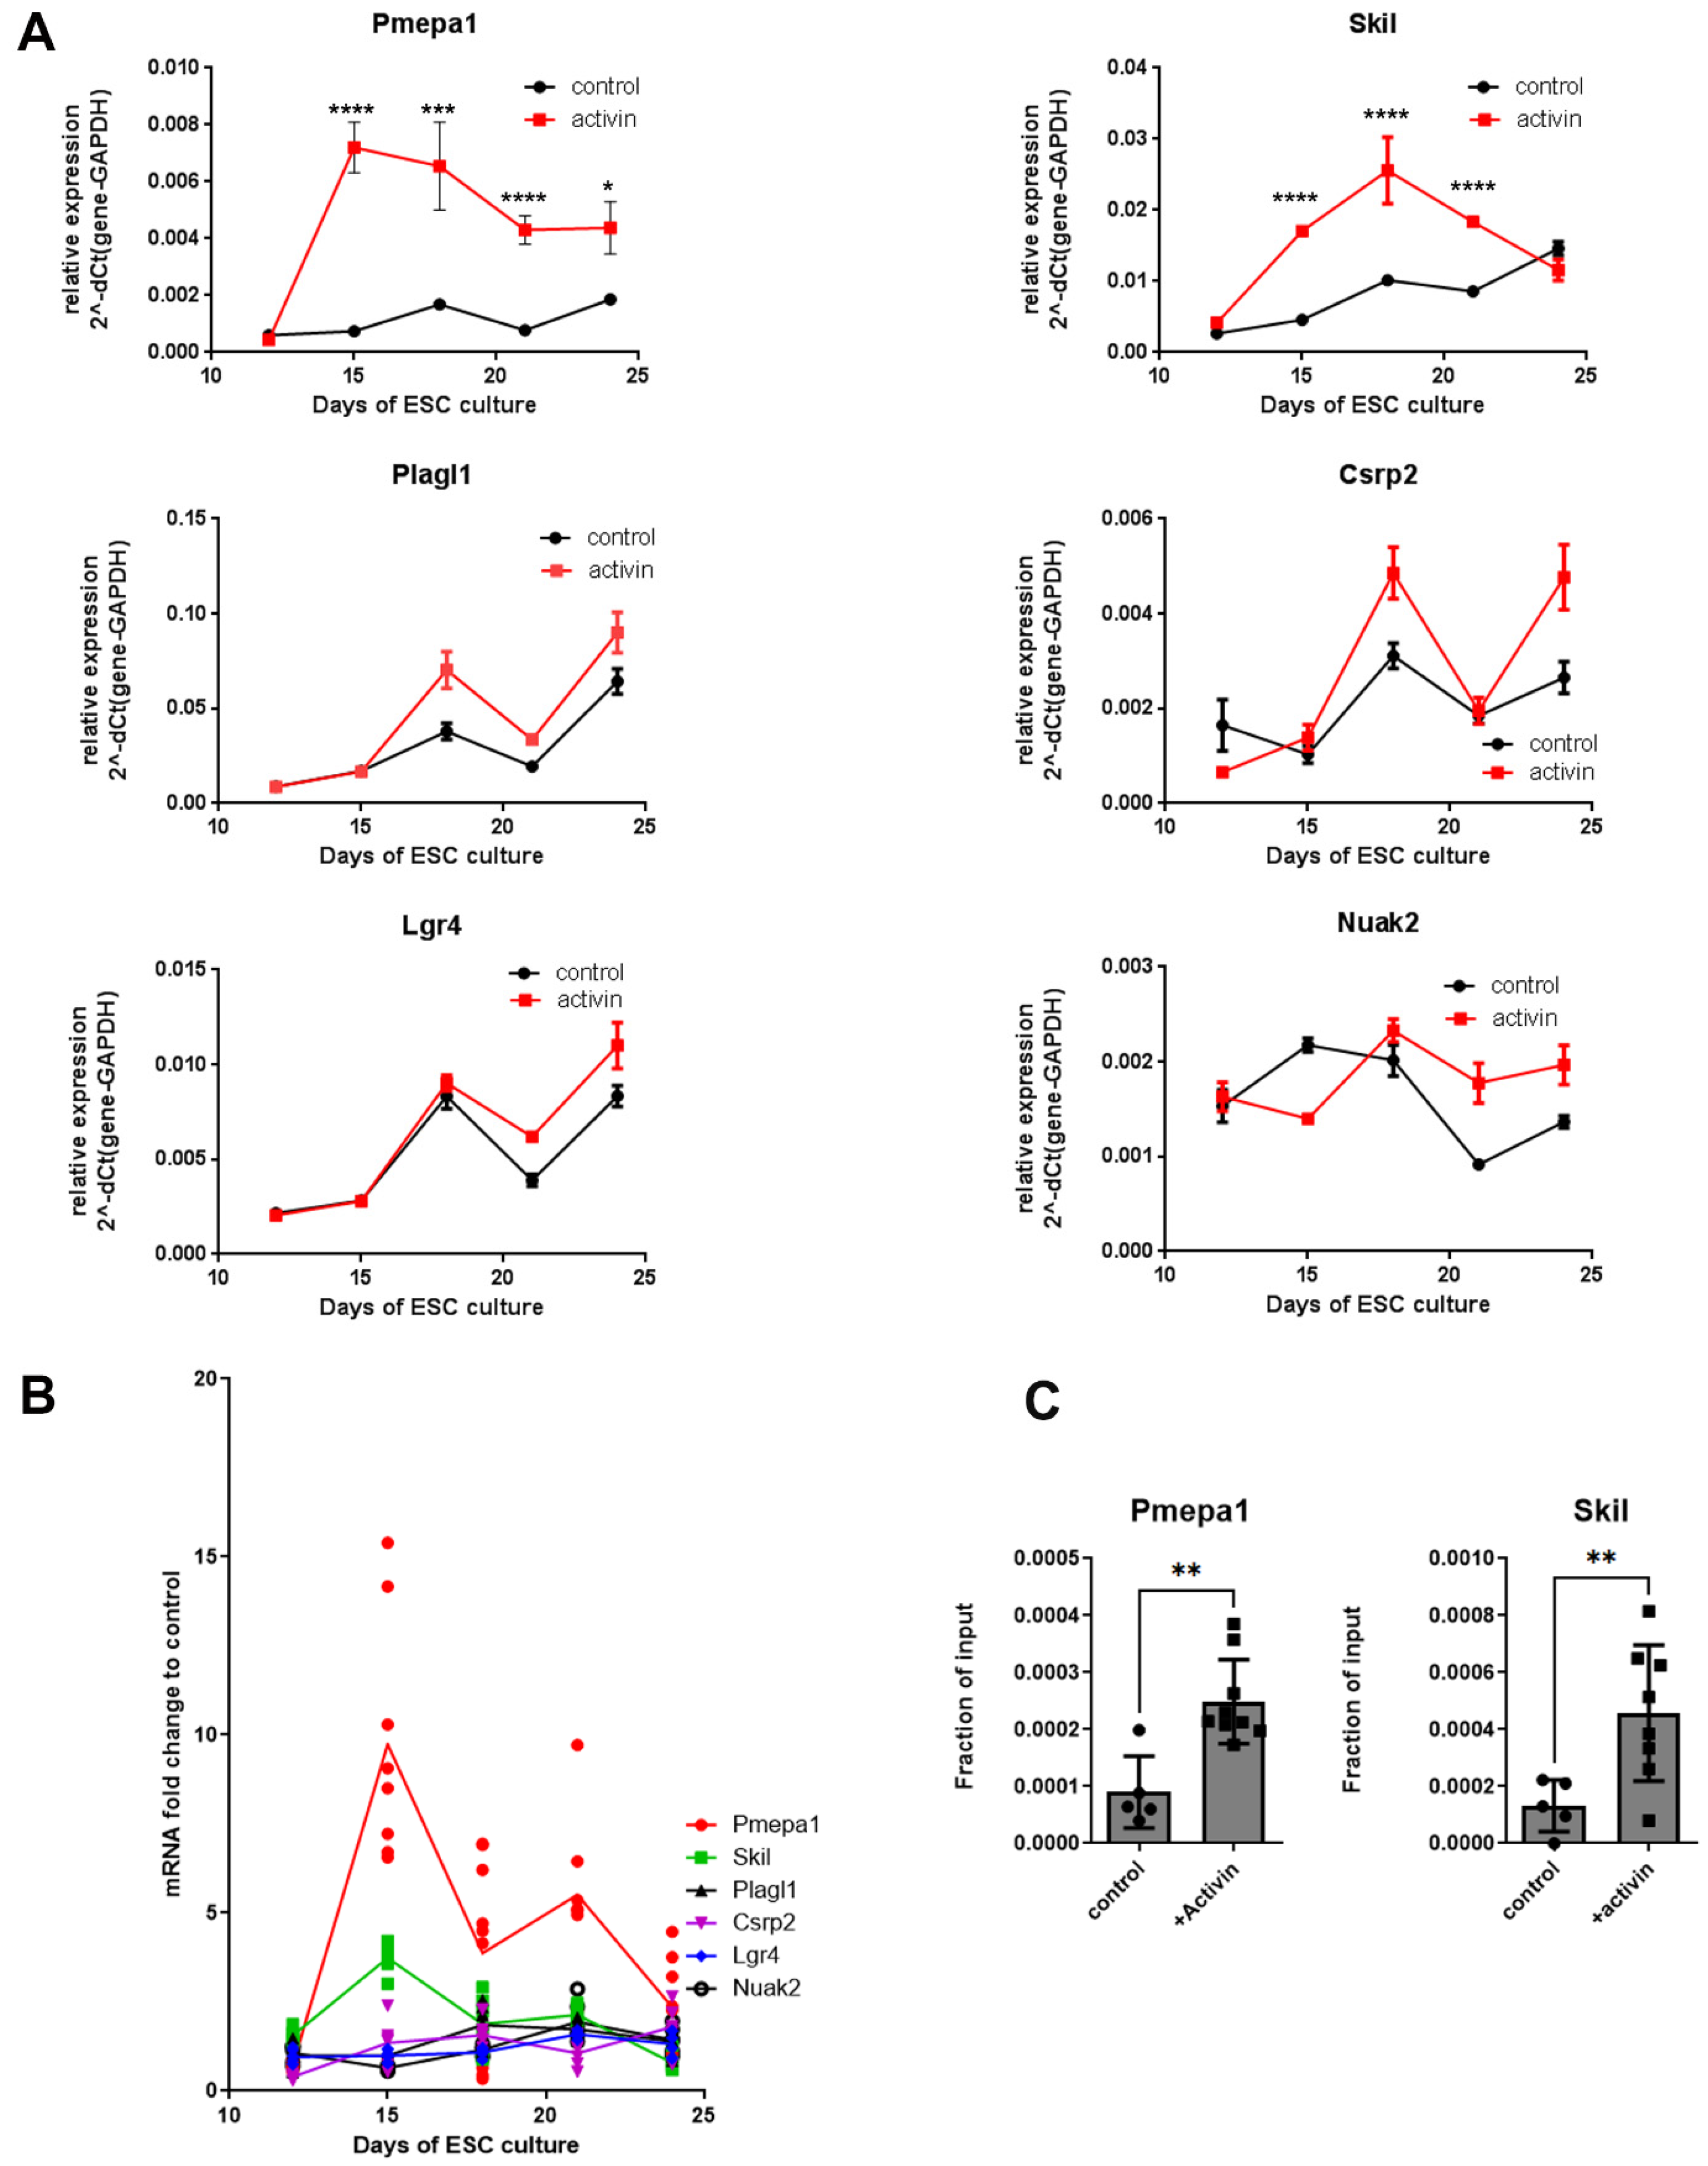
To find out if genes from group 2 work through the Activin/Smad pathway during early retinal development, we used our in vitro protocol for the direct differentiation of mouse ESCs into retinal lineages [8,10]. The mouse ESC line BK3 was differentiated in adherent conditions [10,18] and treated with 50 ng/mL Activin A beginning at 9 DIV, with samples collected every 3 days. We then assessed changes in the expression of several genes from group 2 by using RT-PCR (Figure 4A and Figure S7). Only Pmepa1 and Skil were upregulated in response to Activin A treatment, while changes in Plagl1, Csrp2, and Lgr4 expression during ESC differentiation were not dependent on Activin, and Nuak2 expression was unchanged. Normalization of gene expression in Activin A-treated samples over control untreated samples demonstrated upregulation upon Activin A treatment of Pmepa1 (by almost 10-fold) and Skil genes (by almost 4-fold) after 15 DIV of ESC culture (Figure 4B).
Figure 4.
(A,B) Changes in expression of genes from group 2 following Activin A treatment. qRT-PCR of ESC samples treated with Activin A, beginning at 9 DIV and collected every 3 days. (A) Relative expression normalized to GAPDH expression; (B) relative expression compared to control samples without Activin A treatment. (C) Smad2/3 binding to the promoter regions of Pmepa1 and Skil genes increases upon Activin A treatment. Cells were treated with Activin A at 9 DIV and harvested at 18 DIV for ChIP-qPCR. 3 independent experiments. *, p < 0.05; **, p < 0.01; ***, p < 0.001; ****, p < 0.0001.
We next asked if Pmepa1 and Skil transcriptional activation during early retinal development is Smad-dependent. Both of these genes have several Smad-binding sites (SBEs) in their promoter regions (Figure 2D,E). We analyzed, in differentiated ESCs, Smad2/3 binding to SBEs that were shown to be important for Pmepa1 and Skil gene regulation in other tissues or cell lines [12,17] by using anti-Smad2/3 ChIP and qRT-PCR.
We found a significant increase in Smad2/3 binding to SBE after Activin A treatment for both genes (Figure 4C). These data demonstrated that two genes from group 2, Pmepa1 and Skil, are direct targets of Activin-induced Smad2/3 signaling, which is important for retinal development. Both are known targets for transcriptional regulation by the Smad pathway in other tissues and were additionally suggested to act as feedback inhibitors [17] and negative regulators of the Activin/Smad pathway [42,43,44].
4. Discussion
Tissue development requires the coordinated transition from a proliferating precursor population to a mature structure. This has frequently been monitored by the de novo expression of tissue-specific genes found in the mature tissue. The controlled downregulation of genes functioning in the precursors is just as important. Epigenetic transitions play an important role in all these changes in gene expression. In this study, we identified epigenetic changes on the loci of genes that participate in early mouse retinal development and become downregulated during retinal maturation. We found several classes of downregulated genes that have different developmental patterns of histones PTMs histones, even though they all showed a similar decrease in expression over time. Importantly, this indicates that histone modifications are correlated with specific functional gene classes rather than simply with levels of expression. For the larger group (group 1) of genes downregulated during retinal development, the decrease in expression was not only accompanied by a decrease in active PTM H3K4me2 accumulation, but also by a dramatic increase in the inhibitory PTM H3K27me3 marker, indicating that transcription of these genes shuts down through changes in chromatin status [45] from active (H3K4me2) to reversibly silent (H3K27me3) [23]. This group of genes could be divided into two subgroups, early and later embryonic retinal genes, by comparing H3K4me2 and H3K27me3 accumulation at E17 (Figure 1), where early pioneering transcriptional factors such as Pax9, Sox1, and Hox genes have low H3K4me2 but high H3K27me3 accumulation at the gene body (with correspondingly low expression), while later embryonic retinal TFs such as Sox2, Pax6, Irx5, and Ccnd1 have higher H3K4me2 and lower accumulation in the gene body (higher expression at E17).
The downregulation of genes in group 2 is accompanied by a decrease in H3K4me2 but no H3K27me3 accumulation. We have focused on group 2 genes because they are much less studied in retinal development. There are several possible explanations for why genes from group 2 have no H3K27me3 marker and how they become silent at the end of development. First, these genes move to a silent state of chromatin not through H3K27me3 accumulation but through another repressive heterochromatin marker, such as H3K9me2/3. We used our preliminary data for H3K9me2 ChIP-seq to compare accumulation of this PTM on genes from group 2 (Table S3) between E17 and PN56, and showed that the accumulation of H3K9me2 is increased during retinal maturation in 70% of these genes.
Second, some of these genes could have biological functions that are not harmful to the mature cell and therefore do not need to be completely silenced. In support of this is the observation that in adult retinas, the only types of cells that have residual expression of some of these genes are cells with maintained proliferative potential, such as Muller glia, microglia, endothelial cells, and astrocytes.
The small size of group 2 did not allow significance by DAVID, STRING, and IPA analyses, although most could be annotated as transcription or proliferation inhibitors. Almost half of the genes from group 2 are located in/near genome developmental enhancers that are decommissioned during retinal tissue maturation. Little is known about how retinal enhancers turn off during development, but it was shown recently for other sensory cells that enhancer decommissioning imposes an epigenetic barrier to sensory hair cell regeneration [46].
A literature search identified 14 genes and two microRNAs in group 2 that are linked to the Smad/TGF-b pathway. Morphogens that work through the TGF-b signaling pathway to regulate pleiotropic processes during development are also involved in the maintenance of tissue homeostasis [12,43,44,47]. A recent paper demonstrated the role of TGF-b signaling in retinal cell fate and showed that the knockout of one TGF-b receptor increased the number of retinal ganglion cells but reduced the number of photoreceptors [48]. Interestingly, it was shown that after retinal injury in zebrafish, upregulation of the canonical TGFb pathway through Smad/Activin leads to retinal regeneration, while in mice, injury upregulates the noncanonical TGFb pathway through MAPK, leading to retinal fibrosis [49].
In experiments on ex vivo retinal differentiation in PSCs, we found that expression of two group 2 genes, Pmepa1 and Skil, is upregulated under Activin treatment. For both of these genes, Smad binding to their promoter SBE sites is increased with Activin treatment. This suggests that Pmepa1 and Skil may play roles in early retinal development. Additional functional validation is needed to demonstrate that Pmepa1 and Skil participate directly in retinal differentiation. It has previously been shown in different cell culture models, primarily in oncology, that Pmepa1 and Skil gene expression is tightly regulated by the TGFb/Activin/Smad pathway, and that Smad complexes bind to their promoters. Both Pmepa1 and Skil proteins are inhibitors of TGF-b signaling [44,47,50,51], indicating that this feedback loop may play an important role in development.
5. Conclusions
In summary, our results indicate that decreased expression of precursor genes occurs in multiple ways during retinal development, and that epigenetic mechanisms may play an important role in these processes. Our data suggest commonality in the functions of genes showing particular epigenetic changes, and that this is likely to become even more pronounced as additional epigenetic markers are studied. Defining changes in epigenetic profiles is a useful method of finding and grouping genes whose downregulation is essential for retinal development. What remains to be discovered, however, are the molecular mechanisms by which specific epigenetic pathways are directed to decrease the expression of these groups.
Supplementary Materials
The following supporting information can be downloaded at: https://www.mdpi.com/article/10.3390/cimb48111155/s1.
Author Contributions
Conceptualization—E.Y.P., J.T.-T. and C.J.B.; methodology—E.Y.P., A.Q.L. and A.C.S.; software—A.C.S.; validation—E.Y.P. and A.Q.L.; formal analysis and investigation—E.Y.P. and A.Q.L.; writing—original draft preparation—E.Y.P. and C.J.B.; writing—review and editing—all; funding acquisition—C.J.B. and J.T.-T. All authors have read and agreed to the published version of the manuscript.
Funding
This work was supported by the Macular Vision Research Foundation, PA Tobacco Settlement Fund, and an RPB Stein Innovation award to C.J.B.; PA Lions Sight Conservation and Eye Research Foundation to A.G.L. and STTR NIH R41 EY035180-01 to J.T.-T. and E.Y.P.
Institutional Review Board Statement
This study was conducted in compliance with the National Research Council’s Guide for Care and Use of Laboratory Animals (eighth edition), and experiments with animals were authorized by the Pennsylvania State University College of Medicine Institutional Animal Care and Use Committee (protocol #46993, approval date: 12 June 2024 and triennial approval date: 19 April 2025).
Informed Consent Statement
Not applicable.
Data Availability Statement
The original contributions presented in this study are included in the article/Supplementary Material. Further inquiries can be directed to the corresponding author.
Conflicts of Interest
Author Joyce Tombran-Tink was employed by the company Skyran Biologics. The remaining authors declare that the research was conducted in the absence of any commercial or financial relationships that could be construed as potential conflicts of interest.
References
- Zhang, S.S.; Xu, X.; Liu, M.G.; Zhao, H.; Soares, M.B.; Barnstable, C.J.; Fu, X.Y. A biphasic pattern of gene expression during mouse retina development. BMC Dev. Biol. 2006, 6, 48. [Google Scholar] [CrossRef] [Scilit] [PubMed]
- Popova, E.Y.; Xu, X.; DeWan, A.T.; Salzberg, A.C.; Berg, A.; Hoh, J.; Zhang, S.S.; Barnstable, C.J. Stage and gene specific signatures defined by histones H3K4me2 and H3K27me3 accompany mammalian retina maturation in vivo. PLoS ONE 2012, 7, e46867. [Google Scholar] [CrossRef] [Scilit]
- Popova, E.Y.; Salzberg, A.C.; Yang, C.; Zhang, S.S.; Barnstable, C.J. Identification and prediction of alternative transcription start sites that generate rod photoreceptor-specific transcripts from ubiquitously expressed genes. PLoS ONE 2017, 12, e0179230. [Google Scholar] [CrossRef] [Scilit]
- Kable, B.; Portillo-Ledesma, S.; Popova, E.Y.; Jentink, N.; Swulius, M.; Li, Z.; Schlick, T.; Grigoryev, S.A. Compromised two-start zigzag chromatin folding in immature mouse retina cells driven by irregularly spaced nucleosomes with short DNA linkers. Nucleic Acids Res. 2025, 53, gkaf457. [Google Scholar] [CrossRef] [Scilit] [PubMed]
- Soares, L.M.; He, P.C.; Chun, Y.; Suh, H.; Kim, T.; Buratowski, S. Determinants of Histone H3K4 Methylation Patterns. Mol. Cell 2017, 68, 773–785.e776. [Google Scholar] [CrossRef] [Scilit] [PubMed]
- Pekowska, A.; Benoukraf, T.; Ferrier, P.; Spicuglia, S. A unique H3K4me2 profile marks tissue-specific gene regulation. Genome Res. 2010, 20, 1493–1502. [Google Scholar] [CrossRef] [Scilit] [PubMed]
- Cepko, C. Intrinsically different retinal progenitor cells produce specific types of progeny. Nat. Rev. Neurosci. 2014, 15, 615–627. [Google Scholar] [CrossRef] [Scilit] [PubMed]
- Lu, A.Q.; Barnstable, C.J. Generation of Photoreceptor Precursors from Mouse Embryonic Stem Cells. Stem Cell Rev. 2018, 14, 247–261. [Google Scholar] [CrossRef] [Scilit] [PubMed]
- Lu, A.Q.; Barnstable, C.J. Pluripotent Stem Cells as Models of Retina Development. Mol. Neurobiol. 2019, 56, 6056–6070. [Google Scholar] [CrossRef] [Scilit] [PubMed]
- Lu, A.Q.; Popova, E.Y.; Barnstable, C.J. Activin Signals through SMAD2/3 to Increase Photoreceptor Precursor Yield during Embryonic Stem Cell Differentiation. Stem Cell Rep. 2017, 9, 838–852. [Google Scholar] [CrossRef] [Scilit] [PubMed]
- Popova, E.Y.; Pinzon-Guzman, C.; Salzberg, A.C.; Zhang, S.S.; Barnstable, C.J. LSD1-Mediated Demethylation of H3K4me2 Is Required for the Transition from Late Progenitor to Differentiated Mouse Rod Photoreceptor. Mol. Neurobiol. 2016, 53, 4563–4581. [Google Scholar] [CrossRef] [Scilit] [PubMed]
- Link, A.S.; Kurinna, S.; Havlicek, S.; Lehnert, S.; Reichel, M.; Kornhuber, J.; Winner, B.; Huth, T.; Zheng, F.; Werner, S.; et al. Kdm6b and Pmepa1 as Targets of Bioelectrically and Behaviorally Induced Activin A Signaling. Mol. Neurobiol. 2016, 53, 4210–4225. [Google Scholar] [CrossRef] [Scilit]
- Ohmura, T.; Shioi, G.; Hirano, M.; Aizawa, S. Neural tube defects by NUAK1 and NUAK2 double mutation. Dev. Dyn. 2012, 241, 1350–1364. [Google Scholar] [CrossRef] [Scilit] [PubMed]
- Zhang, W.; Gao, Y.; Li, P.; Shi, Z.; Guo, T.; Li, F.; Han, X.; Feng, Y.; Zheng, C.; Wang, Z.; et al. VGLL4 functions as a new tumor suppressor in lung cancer by negatively regulating the YAP-TEAD transcriptional complex. Cell Res. 2014, 24, 331–343, Correction in Cell Res. 2021, 31, 1137. https://doi.org/10.1038/s41422-021-00551-4. [Google Scholar] [CrossRef] [Scilit]
- Wu, M.L.; Chen, C.H.; Lin, Y.T.; Jheng, Y.J.; Ho, Y.C.; Yang, L.T.; Chen, L.; Layne, M.D.; Yet, S.F. Divergent signaling pathways cooperatively regulate TGFβ induction of cysteine-rich protein 2 in vascular smooth muscle cells. Cell Commun. Signal. 2014, 12, 22. [Google Scholar] [CrossRef] [Scilit] [PubMed]
- Silvestri, C.; Narimatsu, M.; von Both, I.; Liu, Y.; Tan, N.B.; Izzi, L.; McCaffery, P.; Wrana, J.L.; Attisano, L. Genome-wide identification of Smad/Foxh1 targets reveals a role for Foxh1 in retinoic acid regulation and forebrain development. Dev. Cell 2008, 14, 411–423, Erratum in Dev Cell. 2008, 14, 633. https://doi.org/10.1016/j.devcel.2008.04.001. [Google Scholar] [CrossRef] [Scilit] [PubMed]
- Lee, K.L.; Lim, S.K.; Orlov, Y.L.; Yit le, Y.; Yang, H.; Ang, L.T.; Poellinger, L.; Lim, B. Graded Nodal/Activin signaling titrates conversion of quantitative phospho-Smad2 levels into qualitative embryonic stem cell fate decisions. PLoS Genet. 2011, 7 e1002130. [Google Scholar] [CrossRef] [Scilit] [PubMed]
- Woll, N.L.; Bronson, S.K. Analysis of embryonic stem cell-derived osteogenic cultures. Methods Mol. Biol. 2006, 330, 149–159. [Google Scholar] [CrossRef] [Scilit] [PubMed]
- La Torre, A.; Lamba, D.A.; Jayabalu, A.; Reh, T.A. Production and transplantation of retinal cells from human and mouse embryonic stem cells. Methods Mol. Biol. 2012, 884, 229–246. [Google Scholar] [CrossRef] [Scilit] [PubMed]
- Pruitt, K.D.; Tatusova, T.; Klimke, W.; Maglott, D.R. NCBI Reference Sequences: Current status, policy and new initiatives. Nucleic Acids Res. 2009, 37, D32–D36. [Google Scholar] [CrossRef] [Scilit] [PubMed]
- Wilken, M.S.; Brzezinski, J.A.; La Torre, A.; Siebenthall, K.; Thurman, R.; Sabo, P.; Sandstrom, R.S.; Vierstra, J.; Canfield, T.K.; Hansen, R.S.; et al. DNase I hypersensitivity analysis of the mouse brain and retina identifies region-specific regulatory elements. Epigenet. Chromatin 2015, 8, 8. [Google Scholar] [CrossRef] [Scilit] [PubMed]
- Huang, D.W.; Sherman, B.T.; Lempicki, R.A. Systematic and integrative analysis of large gene lists using DAVID bioinformatics resources. Nat. Protoc. 2009, 4, 44–57. [Google Scholar] [CrossRef] [Scilit] [PubMed]
- Aldiri, I.; Xu, B.; Wang, L.; Chen, X.; Hiler, D.; Griffiths, L.; Valentine, M.; Shirinifard, A.; Thiagarajan, S.; Sablauer, A.; et al. The Dynamic Epigenetic Landscape of the Retina During Development, Reprogramming, and Tumorigenesis. Neuron 2017, 94, 550–568.e510. [Google Scholar] [CrossRef] [Scilit] [PubMed]
- Kim, J.W.; Yang, H.J.; Brooks, M.J.; Zelinger, L.; Karakülah, G.; Gotoh, N.; Boleda, A.; Gieser, L.; Giuste, F.; Whitaker, D.T.; et al. NRL-Regulated Transcriptome Dynamics of Developing Rod Photoreceptors. Cell Rep. 2016, 17, 2460–2473. [Google Scholar] [CrossRef] [Scilit] [PubMed]
- Lu, Y.; Ruan, X.; Xiao, G.; Dai, Y.; Li, G.; Cai, G.; Zheng, L.; Guan, Z.; Sun, W.; Wang, H. Lockd Enhances Mandibular Mesenchymal Stem Cell Proliferation While Inhibiting Osteogenic Capability via Binding With SUZ12 in the Inflammatory Microenvironment. Clin. Periodontol. 2025, 52, 171–185. [Google Scholar] [CrossRef] [Scilit] [PubMed]
- Xu, H.; Jiang, Y.; Xu, X.; Su, X.; Liu, Y.; Ma, Y.; Zhao, Y.; Shen, Z.; Huang, B.; Cao, X. Inducible degradation of lncRNA Sros1 promotes IFN-γ-mediated activation of innate immune responses by stabilizing Stat1 mRNA. Nat. Immunol. 2019, 20, 1621–1630, Correction in Nat Immunol 2020, 21, 477-478. https://doi.org/10.1038/s41590-020-0630-8. [Google Scholar] [CrossRef] [Scilit] [PubMed]
- Chen, Y.; Z. Wei, Z.; Liu, J.; Xie, H.; Wang, B.; Wu, J.; Zhu, Z.; Fan, Y. Long noncoding RNA ZFAS1 aggravates spinal cord injury by binding with miR-1953 and regulating the PTEN/PI3K/AKT pathway. Neurochem Int. 2021, 147, 104977. [Google Scholar] [CrossRef] [Scilit] [PubMed]
- Tang, C.Z.; Zhang, D.F.; Yang, J.T.; Liu, Q.H.; Wang, Y.R.; Wang, W.S. Overexpression of microRNA-301b accelerates hippocampal microglia activation and cognitive impairment in mice with depressive-like behavior through the NF-κB signaling pathway. Cell Death Dis. 2019, 10, 316. [Google Scholar] [CrossRef] [Scilit] [PubMed]
- Zeng, H.C.; Bae, Y.; Dawson, B.C.; Chen, Y.; Bertin, T.; Munivez, E.; Campeau, P.M.; Tao, J.; Chen, R.; Lee, B.H. MicroRNA miR-23a cluster promotes osteocyte differentiation by regulating TGF-β signalling in osteoblasts. Nat. Commun. 2017, 8, 15000. [Google Scholar] [CrossRef] [Scilit] [PubMed]
- Castro, N.E.; Kato, M.; Park, J.T.; Natarajan, R.J. Transforming growth factor β1 (TGF-β1) enhances expression of profibrotic genes through a novel signaling cascade and microRNAs in renal mesangial cells. Biol. Chem. 2014, 289, 29001–29013. [Google Scholar] [CrossRef] [Scilit] [PubMed]
- Gratchev, A.; Kzhyshkowska, J.; Kannookadan, S.; Ochsenreiter, M.; Popova, A.; Yu, X.; Mamidi, S.; Stonehouse-Usselmann, E.; Muller-Molinet, I.; Gooi, L.; et al. Activation of a TGF-beta-specific multistep gene expression program in mature macrophages requires glucocorticoid-mediated surface expression of TGF-beta receptor II. Immunol. 2008, 180, 6553–6565. [Google Scholar] [CrossRef] [Scilit] [PubMed]
- Pinho, S.; Niehrs, C. Dkk3 is required for TGF-beta signaling during Xenopus mesoderm induction. Differentiation 2007, 75, 957–967. [Google Scholar] [CrossRef] [Scilit] [PubMed]
- Gomes Fernandes, M.; Dries, R.; Roost, M.S.; Semrau, S.; de Melo Bernardo, A.; Davis, R.P.; Ramakrishnan, R.; Szuhai, K.; Maas, E.; Umans, L.; et al. BMP-SMAD Signaling Regulates Lineage Priming, but Is Dispensable for Self-Renewal in Mouse Embryonic Stem Cells. Stem Cell Rep. 2016, 6, 85–94. [Google Scholar] [CrossRef] [Scilit] [PubMed]
- Sun, R.; Sun, Y.C.; Ge, W.; Tan, H.; Cheng, S.F.; Yin, S.; Sun, X.F.; Li, L.; Dyce, P.; Li, J.; et al. The crucial role of Activin A on the formation of primordial germ cell-like cells from skin-derived stem cells in vitro. Cell Cycle 2015, 14, 3016–3029. [Google Scholar] [CrossRef] [Scilit] [PubMed]
- Wu, J.Y.; Jin, Y.; Edwards, R.A.; Zhang, Y.; Finegold, M.J.; Wu, M.X. Impaired TGF-beta responses in peripheral T cells of G alpha i2-/- mice. J. Immunol. 2005, 174, 6122–6128. [Google Scholar] [CrossRef] [Scilit] [PubMed]
- Goto, K.; Lin, W.; Zhang, L.; Jilg, N.; Shao, R.X.; Schaefer, E.A.; Zhao, H.; Fusco, D.N.; Peng, L.F.; Kato, N.; et al. The AMPK-related kinase SNARK regulates hepatitis C virus replication and pathogenesis through enhancement of TGF-β signaling. J. Hepatol. 2013, 59, 942–948. [Google Scholar] [CrossRef] [Scilit] [PubMed]
- Barrios-Rodiles, M.; Brown, K.R.; Ozdamar, B.; Bose, R.; Liu, Z.; Donovan, R.S.; Shinjo, F.; Liu, Y.; Dembowy, J.; Taylor, I.W.; et al. High-throughput mapping of a dynamic signaling network in mammalian cells. Science 2005, 307, 1621–1625. [Google Scholar] [CrossRef] [Scilit] [PubMed]
- Ma, L.; Cantrup, R.; Varrault, A.; Colak, D.; Klenin, N.; Götz, M.; McFarlane, S.; Journot, L.; Schuurmans, C. Zac1 functions through TGFbetaII to negatively regulate cell number in the developing retina. Neural Dev. 2007, 2, 11. [Google Scholar] [CrossRef] [Scilit] [PubMed]
- Liu, J.; Liang, C.; Guo, B.; Wu, X.; Li, D.; Zhang, Z.; Zheng, K.; Dang, L.; He, X.; Lu, C.; et al. Increased PLEKHO1 within osteoblasts suppresses Smad-dependent BMP signaling to inhibit bone formation during aging. Aging Cell 2017, 16, 360–376. [Google Scholar] [CrossRef] [Scilit] [PubMed]
- Nakano, N.; Itoh, S.; Watanabe, Y.; Maeyama, K.; Itoh, F.; Kato, M. Requirement of TCF7L2 for TGF-beta-dependent transcriptional activation of the TMEPAI gene. J. Biol. Chem. 2010, 285, 38023–38033. [Google Scholar] [CrossRef] [Scilit] [PubMed]
- Li, J.; Choi, J.; Cheng, X.; Ma, J.; Pema, S.; Sanes, J.R.; Mardon, G.; Frankfort, B.J.; Tran, N.M.; Li, Y.; et al. Comprehensive single-cell atlas of the mouse retina. iScience 2024, 27, 109916. [Google Scholar] [CrossRef] [Scilit] [PubMed]
- Link, A.S.; Zheng, F.; Alzheimer, C. Activin Signaling in the Pathogenesis and Therapy of Neuropsychiatric Diseases. Front. Mol. Neurosci. 2016, 9, 32. [Google Scholar] [CrossRef] [Scilit] [PubMed]
- Watanabe, Y.; Itoh, S.; Goto, T.; Ohnishi, E.; Inamitsu, M.; Itoh, F.; Satoh, K.; Wiercinska, E.; Yang, W.; Shi, L.; et al. TMEPAI, a transmembrane TGF-beta-inducible protein, sequesters Smad proteins from active participation in TGF-beta signaling. Mol. Cell 2010, 37, 123–134. [Google Scholar] [CrossRef] [Scilit] [PubMed]
- Tecalco-Cruz, A.C.; Sosa-Garrocho, M.; Vázquez-Victorio, G.; Ortiz-García, L.; Domínguez-Hüttinger, E.; Macías-Silva, M. Transforming growth factor-β/SMAD Target gene SKIL is negatively regulated by the transcriptional cofactor complex SNON-SMAD4. J. Biol. Chem. 2012, 287, 26764–26776. [Google Scholar] [CrossRef] [Scilit] [PubMed]
- Bintu, L.; Yong, J.; Antebi, Y.E.; McCue, K.; Kazuki, Y.; Uno, N.; Oshimura, M.; Elowitz, M.B. Dynamics of epigenetic regulation at the single-cell level. Science 2016, 351, 720–724. [Google Scholar] [CrossRef] [Scilit] [PubMed]
- Tao, L.; Yu, H.V.; Llamas, J.; Trecek, T.; Wang, X.; Stojanova, Z.; Groves, A.K.; Segil, N. Enhancer decommissioning imposes an epigenetic barrier to sensory hair cell regeneration. Dev. Cell 2021, 56, 2471–2485.e2475. [Google Scholar] [CrossRef] [Scilit] [PubMed]
- Tecalco-Cruz, A.C.; Ríos-López, D.G.; Vázquez-Victorio, G.; Rosales-Alvarez, R.E.; Macías-Silva, M. Transcriptional cofactors Ski and SnoN are major regulators of the TGF-β/Smad signaling pathway in health and disease. Signal Transduct. Target. Ther. 2018, 3, 15. [Google Scholar] [CrossRef] [Scilit] [PubMed]
- Chen, C.Y.; Liu, C.C.; Stavropoulos, D.; Liu, P.K.; Chen, Y.C.; Wang, S.; Rao, M.; Sun, C.; Zhu, Y.; Luo, Z.; et al. The distinct roles of TGF-β signaling in retinal development. iScience 2025, 28, 113737. [Google Scholar] [CrossRef] [Scilit] [PubMed]
- Conedera, F.M.; Quintela Pousa, A.M.; Presby, D.M.; Mercader, N.; Enzmann, V.; Tschopp, M. Diverse Signaling by TGFβ Isoforms in Response to Focal Injury is Associated with Either Retinal Regeneration or Reactive Gliosis. Cell Mol. Neurobiol. 2021, 41, 43–62. [Google Scholar] [CrossRef] [Scilit] [PubMed]
- Luo, K. Ski and SnoN: Negative regulators of TGF-beta signaling. Curr. Opin. Genet. Dev. 2004, 14, 65–70. [Google Scholar] [CrossRef] [Scilit] [PubMed]
- Itoh, S.; Itoh, F. TMEPAI family: Involvement in regulation of multiple signalling pathways. J. Biochem. 2018, 164, 195–204. [Google Scholar] [CrossRef] [Scilit] [PubMed]
Disclaimer/Publisher’s Note: The statements, opinions and data contained in all publications are solely those of the individual author(s) and contributor(s) and not of MDPI and/or the editor(s). MDPI and/or the editor(s) disclaim responsibility for any injury to people or property resulting from any ideas, methods, instructions or products referred to in the content. |
© 2026 by the authors. Licensee MDPI, Basel, Switzerland. This article is an open access article distributed under the terms and conditions of the Creative Commons Attribution (CC BY) license.