


Abstract
Coronary artery disease (CAD) remains a major global health burden and targeted therapeutic strategies are limited. We integrated two-sample Mendelian randomization (MR) using blood-based expression quantitative trait loci with Bayesian colocalization, external GWAS validation, meta-analysis, single-cell RNA sequencing, cell–cell communication analysis, and phenome-wide MR (Phe-MR). Among the 2460 genes with a significant cis-eQTL, MR identified 26 targets, of which six (PTPN11, FES, VAMP8, LIPA, GGCX and ERP29) were replicated in both cohorts and the meta-analysis. Colocalization supported four (LIPA, GGCX, FES and VAMP8; posterior probability of a shared causal variant (PP.H4) ≥ 0.80 in both cohorts; Tier A), whereas ERP29 (H3-dominant in both cohorts) and PTPN11 (H3-dominant in the discovery cohort; inconclusive in the external cohort) did not reach that threshold (Tier B, MR-replicated without colocalization support). LIPA, GGCX and ERP29 were positively associated with CAD risk (ORs 1.05, 1.12, 1.28); PTPN11, FES and VAMP8 were inversely associated (ORs 0.83, 0.90, 0.90). These genes showed distinct expression across cellular clusters in CAD tissue. Phe-MR across 4698 gene–phenotype combinations identified 24 Bonferroni-significant and 132 false discovery rate (FDR)-significant associations, reported as potential safety signals. The absence of a genetic association does not establish drug safety, and lifelong genetically predicted expression does not estimate transient drug exposure. This study provides genetic evidence for six candidate therapeutic targets for CAD at two clearly different levels of evidence.
1. Introduction
Coronary artery disease (CAD) remains a major cause of global mortality and disability worldwide. As of 2024, epidemiological studies indicate that 7.1% of Americans aged over 20 are affected by CAD, with a 3.2% lifetime risk of myocardial infarction [1]. This age-associated condition has escalated into a significant public health crisis, further exacerbated by the rapid aging of the global population and its increasing impact on low- to middle-income regions [2]. Despite remarkable progress in medical interventions and clinical research, the burden of cardiovascular disease continues to increase in several regions. Moreover, complications associated with CAD management and revascularization procedures, including ischemia–reperfusion injury, in-stent restenosis, and contrast-induced nephropathy, emphasize the need for innovative therapeutic targets for CAD and its associated complications [3].
Current pharmacological strategies for CAD management target the renin–angiotensin system (RAS), sympathetic nervous system, cholesterol metabolism, and antiplatelet mechanisms [4]. Nevertheless, emerging evidence highlights the potential of targeting cardiovascular inflammation and oxidative stress to improve clinical outcomes [5], reflecting the multifactorial nature of CAD pathogenesis. These pathways may provide a rationale for combination therapies that address multiple pathological processes. Therefore, the identification of novel therapeutic targets, development of cardioprotective agents, and elucidation of their molecular mechanisms remain paramount in advancing CAD treatment.
Recent advances in genomic research have transformed the discovery and validation of therapeutic targets for CAD through several complementary approaches. Genome-wide association studies (GWAS) have uncovered numerous CAD-associated single-nucleotide polymorphisms (SNPs) [6]. Expression quantitative trait loci (eQTLs), which link genetic variation to differences in gene expression, provide mechanistic insights relevant to pharmacological development [7]. Mendelian randomization (MR) uses genetic variants as instrumental variables to establish causal relationships between biological exposures and clinical outcomes [8]. The integration of GWAS data with eQTL mapping [9] has enabled systematic validation of drug targets through MR analysis, effectively facilitating both drug repurposing and the identification of novel therapeutic targets [10].
Single-cell RNA sequencing (scRNA-seq) technology has emerged as a powerful tool for high-throughput characterization of cellular transcriptomes, offering unprecedented resolution to investigate cellular heterogeneity and intercellular interactions in various diseases [11]. The combination of MR with scRNA-seq provides a transformative approach to elucidate disease pathogenesis and identify potential therapeutic targets [12].
In this study, we integrated large-scale GWAS and scRNA-seq data to identify and characterize potential therapeutic targets for CAD. Our approach comprised three strategies. First, we conducted a two-sample MR analysis incorporating potential therapeutic target genes to establish the causal effects of genetically predicted expression of potential therapeutic genes using blood eQTLs on CAD, followed by validation using an external GWAS dataset and meta-analysis. Second, we performed scRNA-seq analysis to delineate the cell-type-specific expression patterns of potential therapeutic genes. Third, we evaluated potential adverse effects of the identified potential therapeutic genes for CAD treatment through phenome-wide MR. Our analyses identified six genetically supported therapeutic targets for CAD, providing a molecular basis for further mechanistic investigation and therapeutic development.
2. Materials and Methods
The analytical framework of this study is illustrated in Figure 1, which summarizes the major analytical steps and their relationships.
Figure 1.
Workflow of the study. Data sources: DGIdb 4.0.5 [13] and Finan et al. [14]. eQTL, expression quantitative trait loci. GWAS, genome-wide association study.
2.1. Identification of Potential Therapeutic Genes Using eQTL Data
To identify genes with potential therapeutic relevance to CAD, we used eQTL data (Supplementary Table S1). Specifically, we extracted gene symbols for potential therapeutic targets from the Drug–Gene Interaction Database (DGIdb, version 4.0.5; February 2023 release; Supplementary Table S2) [13], supplemented with additional data from the study of Finan et al. (Supplementary Table S3) [14]. The whole blood cis-eQTL data were retrieved from the eQTLGen consortium [15], encompassing 31,684 blood samples from individuals of European ancestry and covering 19,960 genes.
We applied stringent filtering criteria to ensure reliable associations, selecting significant cis-eQTLs with a p-value threshold of <5 × 10⁻⁸ and genes demonstrating an expression level of >0.1 fragments per kilobase in at least 10 samples. By intersecting these filtered eQTLs with the list of potential therapeutic genes, we obtained a refined dataset of eQTLs specifically associated with potential therapeutic targets. The resulting genes and their associated cis-eQTL variants were subsequently used as genetic instruments for Mendelian randomization analyses.
2.2. CAD GWAS Dataset
The primary outcome data for CAD were obtained from the FinnGen Consortium (R11 release), comprising 51,098 cases and 402,635 controls. To independently validate the findings, additional CAD summary statistics were obtained from the IEU OpenGWAS project (dataset identifier: ieu-a-7; CARDIoGRAMplusC4D cohort; 60,801 cases and 123,504 controls) [16], ensuring exclusion of proxy SNPs to maintain data integrity. Effect estimates from the FinnGen and CARDIoGRAMplusC4D datasets were subsequently combined with the metafor package [17] in a meta-analysis of the log odds ratios and their standard errors, i.e., on the log scale with inverse-variance weights. Pooled estimates and their confidence intervals were computed on the log(OR) scale and then back-transformed to odds ratios for reporting. The primary analysis used a fixed-effect inverse-variance model, which estimates a single common effect; because only two cohorts were combined and the between-cohort variance is therefore poorly estimated, a random-effects model (REML) is reported alongside as a sensitivity analysis (Supplementary Table S14). The Bonferroni denominator is the number of genes analyzed against each outcome dataset: 2418 for FinnGen R11 I9_CHD (inverse variance weighted (IVW) 1995 + Wald ratio 423) and 2420 for CARDIoGRAMplusC4D (IVW 1998 + Wald ratio 422). The difference arises because harmonization against the two outcome datasets leaves slightly different numbers of analyzable genes.
2.3. Instrumental Variable Selection
To ensure the selection of strong instrumental variables (IVs), we retained SNPs exhibiting genome-wide significance (p < 5 × 10⁻⁸). To address potential linkage disequilibrium (LD) among SNPs, we performed clumping using the TwoSampleMR package (v0.5.7) [18] in R (v4.2.3). Specifically, European ancestry reference data from the 1000 Genomes Project were utilized, with an LD threshold of r2 < 0.03 within a 500 kb window of the transcription start site [19].
To further minimize potential horizontal pleiotropy and confounding, we screened the instrument variants for associations with other phenotypes using FastTraitR (v1.0.0), which queries the GWAS Catalog [20]. The complete look-up is given in Supplementary Table S4, and the records that triggered an exclusion are in Supplementary Table S5. The exclusion criterion was that the returned trait begin with “coronary artery disease”, and the default significance threshold of p ≤ 1 × 10⁻⁵ was used. Fifteen records were returned, covering 12 unique rsIDs in 12 genes at p from 2 × 10⁻⁶ to 9 × 10−116, one of them reporting coronary artery disease together with a factor VII measurement. These 12 variants were removed from the instrument set (22,752 → 22,740 variants). Supplementary Table S5 lists them, the records that triggered their exclusion and the complete look-up.
2.4. MR Analysis
To evaluate the potential causal relationships, we conducted MR analyses using the TwoSampleMR R package. Potential therapeutic gene eQTL data were employed as exposure variables, harmonized with CAD GWAS data as outcomes.
The validity of these analyses rests on three instrumental-variable assumptions: that each instrument is associated with the exposure (relevance), that it is independent of confounders of the exposure–outcome relationship (independence), and that it affects the outcome only through the exposure (exclusion restriction). Relevance is assessed directly by the first-stage F statistic, and the exclusion restriction is probed indirectly by the MR-Egger intercept. Cochran’s Q describes heterogeneity among the instrument-specific estimates and is consistent with, but does not by itself establish, a violation of the exclusion restriction.
For genes associated with one SNP, causal effect estimates were derived using the Wald ratio method. For genes instrumented by two or more independent SNPs, the primary estimator was the inverse variance weighted (IVW) method as implemented in TwoSampleMR, which fits a weighted linear regression of the outcome effect on the exposure effect with weights 1/se_out2. The coefficient standard error is scaled by the residual dispersion, so this estimator corresponds to a fixed-effect estimate when there is no over-dispersion and to a multiplicative random-effects estimate when heterogeneity is present. The per-cohort estimates for the prioritized targets are given in Supplementary Tables S10–S13, and their pooled estimates in Supplementary Table S14. To assess pleiotropy, MR Egger regression was applied for genes with three or more SNPs, with significance determined by whether the intercept deviated significantly from zero (p < 0.05), indicating potential horizontal pleiotropy.
Additionally, heterogeneity among instruments was evaluated using Cochran’s Q test [21], reported together with its degrees of freedom and its p value. Where a diagnostic requires more instruments than are available (Q requires ≥ 2, MR-Egger ≥ 3), the table records “not applicable” rather than a value. MR-PRESSO was additionally applied to the prioritized targets, both to test for pleiotropy globally and to identify outlying instruments. The absence of detected heterogeneity is described as such and is not taken as proof of homogeneity, and heterogeneity was in fact present for 18.5% of the multi-variant genes (Results; Supplementary Table S6). To account for multiple testing, significance thresholds were adjusted using the Bonferroni correction, ensuring stringent control of type I error rates. This multi-faceted approach provided a rigorous assessment of causal relationships between potential therapeutic genes and CAD risk.
2.5. Steiger Filtering
To assess the directionality of the inferred causal relationships, Steiger filtering was performed [22]: each instrument is tested for explaining more variance in the exposure (genetically predicted expression of the potential therapeutic genes) than in the outcome (coronary artery disease), and variants failing this test are removed. Because the outcome is binary, the variance explained in the outcome was computed from the log odds ratio, the effect-allele frequency and the cohort-specific case and control counts. The test was performed in both outcome cohorts and covered all 2418 genes in the discovery cohort and all 2420 in the external cohort. In both, every variant tested showed a stronger correlation with the exposure than with the outcome, and no variant was removed. Per-gene results are given in Supplementary Table S7.
2.6. Colocalization Analysis
To further assess the robustness of our MR findings, we conducted colocalization analysis using the “coloc” package [23] with the approximate Bayesian factor (ABF) algorithm. This approach aimed to identify shared genetic variants between the exposure (potential therapeutic gene eQTLs) and outcome (CAD) datasets. The region was defined around the lead cis-eQTL (the variant with the lowest p value for that gene) ±100 kb, rather than around the transcription start site.
The colocalization method calculates posterior probabilities (PP) for five hypotheses: PP.H0: No association between the traits. PP.H1: Association with gene expression only. PP.H2: Association with disease only. PP.H3: Association with both traits but driven by distinct causal variants. PP.H4: Association with both traits due to shared causal variants.
Colocalization was assessed using PP.H4 as the primary criterion, with PP.H4 ≥ 0.80, adopted here as the threshold denoting strong support for a shared causal variant. This threshold was applied to both outcome cohorts independently, so a target had to reach it twice; because that joint requirement is itself stringent, we additionally examined PP.H4 ≥ 0.90 as a stricter sensitivity criterion and report which targets survive it. PP.H3 was not combined with PP.H4, because PP.H3 is the posterior probability of two distinct causal variants and therefore constitutes evidence against a shared causal variant; PP.H3 is reported separately.
2.7. scRNA-Seq Analysis
scRNA-seq data (accession GSE233870) from the Gene Expression Omnibus (GEO) [24] included 6 coronary atherosclerosis samples (3 non-obstructive and 3 obstructive) and 4 non-atherosclerotic controls, with the four control samples excluded from downstream analyses. Processing was performed using scanpy (v1.10.3) [25] in Python (v3.12), with the omicverse framework (v1.6.7) [26] enabling efficient preprocessing and visualization.
Low-quality cells were removed using standard quality-control metrics applied with the SciPy library [27]: only cells with a mitochondrial read proportion below 0.15, more than 500 UMIs and more than 250 detected genes were retained, and genes detected in fewer than three cells were discarded. Preprocessing included normalization, selection of the top 2000 highly variable genes, scaling, and principal component analysis (50 components). Batch effects were corrected using scVI, a variational autoencoder-based probabilistic framework implemented in scvi-tools (v1.2.0) [28].
Neighbour graphs were computed on the scVI latent space (30 principal components, 15 neighbours). Clusters were identified with the Leiden algorithm (resolution 2.0) and merged into 13 annotated populations using SCSA [29]. UMAP was used for visualization only. Differential expression was compared for each annotated cell population with all remaining cells within the atherosclerotic samples, grouped by annotated cell type, and was computed on the normalized expression matrix. Raw counts were retained alongside it, and fold changes therefore depend on the expression values used. The comparison is therefore not disease versus control, and results are reported as higher or lower expression relative to the other populations. Visualizations were generated using omicverse, and bar plots were created using the ggplot2 package in R.
To further investigate cell–cell communication, we used the CellPhoneDB v5 implementation provided by the omicverse package. The minimum cell fraction was set at 0.001, the number of permutations at 1000, the expression threshold at 0.1, the minimum number of genes per cell type at 200, and the minimum number of cells per cell type at 3. The analysis used the final 13-population annotation.All results are model-based inference from a ligand–receptor database and do not constitute evidence that the interactions occur in vivo. Visualization was performed with omicverse.
2.8. External Validation
For external validation, we repeated the MR analysis using CARDIoGRAMplusC4D CAD summary statistics as the outcome, applying the same instrument-selection and MR procedures used in the discovery analysis. Statistical significance was assessed using the cohort-specific Bonferroni threshold described above. Effect estimates from FinnGen and CARDIoGRAMplusC4D were subsequently combined on the log(OR) scale using inverse-variance weighting with the metafor package (v4.6) to assess the consistency of the associations across the two CAD datasets.
To validate the impact of genes on CAD across different tissues, tissue-specific eQTLs were obtained from the Genotype-Tissue Expression (GTEx) database (https://www.gtexportal.org/). Aorta and adipose tissue were selected for tissue-specific MR analysis due to their direct pathophysiological relevance to atherosclerosis and the availability of robust eQTL data in GTEx. Heart tissue eQTLs were excluded from the primary analysis due to limited sample sizes, which reduced statistical power. Instrumental variable selection and MR analysis were performed following the same procedures used for whole-blood eQTLs. The “forestploter” package (v1.1.2) was employed for result visualization.
2.9. Phenome-Wide MR
To evaluate potential adverse effects associated with the six potential therapeutic genes, we conducted a phenome-wide MR analysis. Genetically predicted gene expression was used as exposure. Disease-associated SNPs were sourced from the SAIGE repository [30], and disease summary statistics for 783 UK Biobank traits (≥500 cases per trait; n ≤ 408,961) [31] served as outcomes. GWAS analyses were performed using the SAIGE method (v0.29) to address unbalanced case–control ratios. MR analyses employed the IVW method with blood-derived eQTLs. The testing family was prespecified as 6 genes × 783 phenotypes = 4698 tests, giving a Bonferroni threshold of α = 0.05/4698 = 1.064 × 10⁻⁵ (equivalent to −log10 p = 4.97); the Benjamini–Hochberg FDR is reported as a secondary analysis. All associations meeting the primary threshold are reported, together with gene–phenotype combinations for which no estimate could be obtained and the reason. Additional methodological details are available in the accompanying publication. MR analyses employed the IVW method with blood-derived eQTLs. The testing family was prespecified as 6 genes × 783 phenotypes = 4698 tests, giving a Bonferroni threshold of α = 0.05/4698 = 1.064 × 10⁻⁵ (equivalent to −log10 p = 4.97); Benjamini–Hochberg FDR is reported as a secondary analysis. All associations meeting the primary threshold are reported, together with the gene–phenotype combinations for which no estimate could be obtained and the reason. Additional methodological details are available in the accompanying publication.
3. Results
3.1. Identification of Potential Therapeutic Genes for CAD Using eQTL Data
Initially, 4463 potential therapeutic genes were obtained from the Drug–Gene Interaction Database (DGIdb) (Supplementary Table S2), and an additional 4479 potential therapeutic genes were sourced from a study of Finan et al. (Supplementary Table S3) [13]. The source file contains two independent gene-symbol columns that are not row-aligned with one another. The union of the two columns, rather than a pairwise gene-name/HGNC-name mapping, is therefore the appropriate summary, giving 4488 unique symbols for further analysis.
The whole-blood cis-eQTL data, comprising 19,960 genes, were retrieved from the eQTLGen consortium. Strong instrumental variables were selected with a stringent threshold of p < 5 × 10⁻⁸, and LD clumping procedures (r2 < 0.03 within a 500-kb window) were applied to ensure independence among SNPs. The F-statistics for all genetic instruments exceeded 10 (minimum 29.7), confirming their substantial strength, so the instrument-strength filter removed no gene. Requiring a significant cis-eQTL retained 2460 genes and LD clumping retained 2446; the exposure set taken forward therefore also comprised 2446 genes. Of these, 2418 could be analyzed against FinnGen R11 I9_CHD and 2420 against CARDIoGRAMplusC4D (Supplementary Table S9). The complete cascade is shown in Figure S1. No gene was lost by this exclusion, because every affected gene retained at least two further instruments, and none of the six prioritized targets was affected. CAD summary statistics from the FinnGen database were used as the outcome for MR analysis, employing either the Wald ratio or the IVW method.
A total of 2418 associations involving potential therapeutic genes were identified (Figure 2A and Supplementary Table S10), with 384 genes demonstrating a nominally significant association with CAD (p < 0.05). After applying the Bonferroni correction for multiple testing, 26 potential therapeutic genes remained significantly associated with CAD (p adj. < 0.05; Supplementary Table S11). These included 12 genes associated with increased disease risk (IL20RB, LRP8, PSMB10, ERP29, ADAM9, LGR6, GGCX, MAP3K8, CYP4F12, CAPN1, DSTYK, LIPA) and 14 genes linked to decreased disease risk (LAMC1, HLA-DRB5, ACP2, PARP1, P4HTM, MCHR1, LPAR5, VAMP8, FES, TMEM9B, MAPKAPK5, GGT7, PTPN11, AGRP).
Figure 2.
Mendelian randomization analysis of the associations between potential therapeutic genes and CAD. (A) Volcano plot showing the associations between potential therapeutic genes and CAD risk. The vertical line indicates an effect estimate of 0.0, and the horizontal line indicates the Bonferroni-adjusted significance threshold (p < 0.05/2418 = 2.07 × 10⁻⁵). (B) Bar plot showing PP.H4 from the colocalization analysis in the discovery cohort (FinnGen R11 I9_CHD); the dashed line marks the PP.H4 ≥ 0.80 threshold used as the primary criterion. PP.H3 is not combined with PP.H4, because a high PP.H3 is evidence against a shared causal variant; PP.H3 is reported separately in Supplementary Table S8. Genes are ordered by PP.H4. (C) Volcano plot of druggable genes and risk of CAD. The vertical line marks a beta estimate of 0.0, and the horizontal line marks the Bonferroni-adjusted significance threshold (p < 0.05/2420 = 2.07 × 10⁻⁵). (D) Forest plot showing the meta-analysis results combining MR estimates from two independent databases, presented as odds ratios (ORs); estimates were pooled on the log(OR) scale by inverse-variance weighting with a fixed-effect model (a random-effects model is reported as a sensitivity analysis in Supplementary Table S14). (E) Heatmap showing the beta coefficients from MR analyses based on the two independent databases.
Among the genes increasing CAD risk, the top three were IL20RB (OR: 1.65, 95% CI: 1.35–2.02), LRP8 (OR: 1.36, 95% CI: 1.19–1.55), and PSMB10 (OR: 1.33, 95% CI: 1.20–1.49). Conversely, the top three genes associated with decreased CAD risk were AGRP (OR: 0.78, 95% CI: 0.71–0.86), PTPN11 (OR: 0.84, 95% CI: 0.79–0.89), and GGT7 (OR: 0.85, 95% CI: 0.80–0.89). These findings provide genetic evidence for associations between genetically predicted expression of these genes and CAD risk, thereby prioritizing candidates for further validation.
3.2. Sensitivity Analysis of Potential Therapeutic Genes for CAD
To further assess the robustness of the MR findings for the potential therapeutic targets, sensitivity analyses and colocalization analysis were performed. A subset of 26 potential therapeutic genes with available eQTL instruments was further evaluated using complementary analytical approaches. Three analyses were performed. Using PP.H4 ≥ 0.80 as the primary criterion, eight genes were supported by a shared causal variant in the discovery cohort (Supplementary Table S8; the regional association plots for the prioritized genes are shown in Figure S2). Four of them, LIPA (PP.H4 = 0.992), GGCX (0.942), VAMP8 (0.930) and FES (0.842), also met the criterion in the independent CARDIoGRAMplusC4D cohort (0.994, 0.916, 0.970 and 0.983, respectively). Four further genes (MAP3K8, HLA-DRB5, DSTYK and ADAM9) reached PP.H4 ≥ 0.80 in the discovery cohort only and are reported as single-cohort findings. Under the stricter PP.H4 ≥ 0.90 criterion, three of the four two-cohort targets remained supported in both cohorts (LIPA 0.992/0.994, GGCX 0.942/0.916 and VAMP8 0.930/0.970; discovery/external), whereas fell below the threshold in the discovery cohort (PP.H4 = 0.842, external 0.983) and is therefore supported at the ≥0.80 but not at the ≥0.90 level. The additional column of Supplementary Table S8 reports this criterion for every gene. By contrast, ERP29 was H3-dominant in both cohorts (FinnGen PP.H4 = 0.003, PP.H3 = 0.997; CARDIoGRAMplusC4D PP.H4 = 0.031, PP.H3 = 0.959), and PTPN11 was H3-dominant in the discovery cohort (PP.H4 = 0.001, PP.H3 = 0.999) but was inconclusive in the external cohort, where neither hypothesis reached 0.80 (PP.H4 = 0.295, PP.H3 = 0.651). For ERP29 and PTPN11, the expression and disease signals were not supported as sharing a causal variant. We note that ERP29 and MAPKAPK5 share the same CAD signal (rs17696736, 12q24), a known pleiotropic locus, whereas their eQTL signals arise from gene-local regulatory variants.
Steiger filtering was performed in both outcome cohorts and covered all 2418 genes with a harmonised instrument set in the discovery cohort and all 2420 genes in the external cohort (Supplementary Table S7); in both cohorts every variant tested showed the correct direction of effect and no variant was removed. In the external cohort, all instruments of the six prioritized targets were directionally correct (LIPA, 49 variants; FES, 25; VAMP8, 22; GGCX, 14; and 3 each for PTPN11 and ERP29); in the discovery cohort the corresponding counts were LIPA, 48; FES, 25; VAMP8, 22; GGCX, 12; and 3 each for PTPN11 and ERP29.
Heterogeneity was present in a substantial minority of genes: among the 1995 genes instrumented by two or more variants, Cochran’s Q was significant (p < 0.05) for 369 genes (18.5%), and the MR-Egger intercept was significant (p < 0.05) for 40 genes (Supplementary Table S6). For the six prioritized targets, the three estimators (IVW, weighted median and MR-Egger) were concordant for LIPA, GGCX, FES and VAMP8, whereas the MR-Egger estimate lost significance for ERP29 (OR 1.01, p = 0.97) and PTPN11 (OR 0.42, p = 0.65), consistent with their small number of instruments (three variants each) (Figure S3). For LIPA the MR-Egger intercept was significant in the discovery cohort (p = 0.001) and the MR-PRESSO global test was also significant (p = 0.019), indicating directional pleiotropy. This target therefore does not pass this sensitivity analysis in the discovery cohort. No single outlying instrument was identified, and the external cohort showed no evidence of pleiotropy (intercept p = 0.95; MR-PRESSO p = 0.13). The direction and significance of the association are nevertheless unchanged.
3.3. External Validation of MR-Identified Therapeutic Targets
To further validate the reliability of these therapeutic targets, CARDIoGRAMplusC4D summary statistics for CAD were used as the outcome. The same blood eQTL data and MR procedures were applied. Ten genes showed significant associations with CAD after Bonferroni correction, six of which (PTPN11, FES, VAMP8, LIPA, GGCX, and ERP29) were also identified in the FinnGen analysis. The complete MR results are presented in Figure 2C and Supplementary Tables S12 and S13. A meta-analysis was subsequently performed to combine the two MR estimates (Figure 2D,E and Supplementary Table S14). Taken together, three of the six genes were positively associated with CAD risk (OR > 1)—LIPA (combined OR 1.05, 95% CI 1.04–1.07; 1.06 in CARDIoGRAMplusC4D and 1.04 in FinnGen), GGCX (1.13, 95% CI 1.09–1.17; 1.13 and 1.13) and ERP29 (1.28, 95% CI 1.21–1.36; 1.27 and 1.29)—and three were inversely associated with CAD risk (OR < 1)—PTPN11 (0.83, 95% CI 0.79–0.87; 0.81 and 0.84), FES (0.90, 95% CI 0.88–0.92; 0.91 and 0.89) and VAMP8 (0.90, 95% CI 0.88–0.92; 0.89 and 0.90). The meta-analyzed estimates were obtained by inverse-variance weighting on the log(OR) scale with a fixed-effect model (Figure 2D,E). A random-effects model (REML) gave the same estimates to four decimal places for five of the six targets and differed only for LIPA (OR 1.05, 95% CI 1.03–1.07; Supplementary Table S14). The six targets are reported in two tiers of evidence. Tier A (colocalization-supported in both cohorts) comprises LIPA, GGCX, FES and VAMP8: each was Bonferroni-significant in both MR analyses and reached PP.H4 ≥ 0.80 in both cohorts. Tier B (MR-replicated without colocalization support) comprises ERP29 and PTPN11: both were Bonferroni-significant in both MR analyses, but neither reached PP.H4 ≥ 0.80: ERP29 was H3-dominant in both cohorts, whereas PTPN11 was H3-dominant in the discovery cohort and inconclusive in the external cohort (Table S8). For ERP29 the eQTL instruments therefore do not tag the CAD causal variant in that region. For PTPN11 the external cohort was inconclusive, so its instruments cannot be confirmed to tag that variant.
3.4. Tissue-Specific MR Analysis
To directly address the potential limitation of blood-derived eQTLs for a vascular disease, we repeated our MR analyses using tissue-specific eQTLs from two relevant tissues: subcutaneous adipose tissue and aorta, obtained from the GTEx database.
Notably, the direction and significance of the causal effects for three of the six genes (LIPA, GGCX, and FES) pointed in the same direction across blood, adipose, and arterial tissues (Figure 3). Effect estimates are per 1-SD of genetically predicted expression within each tissue and are therefore not directly comparable between tissues, because the cis-eQTL effect scales differ between datasets. For instance, the protective association of FES was observed in all three (blood, OR = 0.90; adipose, OR = 0.75; aorta, OR = 0.86). However, VAMP8 showed an opposite direction of effect in the tissue-specific analyses (aorta OR = 1.04, p = 1.0 × 10⁻⁶; subcutaneous adipose tissue OR = 1.12, p = 2.5 × 10−45) despite its protective effect in whole blood (OR = 0.90).
Figure 3.
Mendelian randomization analysis of tissue-specific cis-eQTL gene expression and CAD risk in two tissues. (A) Forest plot of MR result for aortic tissue; (B) forest plot of MR result about subcutaneous adipose tissue. Odds ratios are per 1−SD of genetically predicted expression within each tissue and are not directly comparable between tissues. OR, odds ratio; CI, confidence interval; se, standard error; p, p value.
An exception was observed for PTPN11. While it exhibited a protective effect using blood eQTLs (OR = 0.84), the direction of effect was reversed in aortic tissue (OR = 1.11, p = 0.04). These findings suggest that the association of PTPN11 with CAD risk may be tissue-context-dependent. Its protective association may be related to its expression and function in immune cells, whereas its effects in vascular tissues may differ. These findings highlight the importance of tissue-specific analysis.
Our tissue-specific analysis was directionally concordant with the blood-based findings for three targets (FES, LIPA and GGCX) but not for PTPN11 or VAMP8. We interpret the tissue results as tissue-dependent directions of effect rather than as cross-tissue validation. Notably, PTPN11 and VAMP8 exhibited tissue-dependent associations (PTPN11 showing a protective association in whole blood but an association with increased CAD risk in aortic tissue, whereas VAMP8 showed a protective association in whole blood but associations with increased CAD risk in both aortic and adipose tissues), highlighting the importance of tissue-specific investigation.
3.5. Distribution of Potential Therapeutic Genes Across Different Cell Types
To investigate the cell type-specific expression patterns of the potential therapeutic genes in CAD, we conducted a single-cell expression analysis using scRNA-seq data from GEO. The GSE233870 dataset, generated using the Illumina NovaSeq 6000 platform, comprises six coronary atherosclerosis samples and four non-atherosclerotic control samples. The four non-atherosclerotic control samples were excluded from downstream analyses. After quality control, 57,196 cells from the six coronary atherosclerosis samples were retained for downstream analysis. A total of 50 Leiden clusters were identified at a resolution of 2.0 and merged into 13 annotated populations. Cell numbers per population and their composition across the six samples are given in Supplementary Table S15, the top markers defining each population in Supplementary Table S16, and the clustering and annotation in Figure 4A and Supplementary Table S17.
Figure 4.
Single-cell RNA sequencing analysis of coronary atherosclerosis. (A) UMAP plot of the CAD samples showing the identified clusters and annotated cell types. (B) Expression of the six potential therapeutic genes across cell types, shown as the average log2 fold change. (C) Mean expression levels and the percentage of expressing cells for the same six genes across cell types.
Differential expression analysis was performed to characterize the expression heterogeneity of the potential therapeutic genes across cell types (Figure 4B and Supplementary Table S19). Expression is reported as higher or lower relative to the other annotated populations. No disease-versus-control comparison was performed. All six genes showed lower expression in cardiomyocytes than in the remaining cells, and VAMP8 showed lower expression in fibroblasts (average logFC = −2.703). In contrast, VAMP8 (average logFC = 1.899), ERP29 (average logFC = 1.078), and PTPN11 (average logFC = 0.837) were higher in plasmacytoid dendritic cells (pDCs) than in the remaining populations; this observation is exploratory, because the pDC population comprises only 65 cells (0.11% of the dataset). Beyond pDCs, VAMP8 expression was also higher in macrophages (average logFC = 1.596), natural killer (NK) cells (average logFC = 1.338), and other cell types, while PTPN11 expression was higher in macrophages (average logFC = 0.687), natural killer T (NKT) cells (average logFC = 0.634), among others. Additionally, LIPA expression (average logFC = 2.143) was higher in macrophages, while FES expression was higher in monocytes (average logFC = 1.564) and macrophages (average logFC = 1.279), and GGCX expression was higher in fibroblasts (average logFC = 1.189). Among the coronary atherosclerosis samples, VAMP8 and ERP29 showed relatively high expression in pDCs, while LIPA exhibited elevated expression in macrophages. The other three genes, FES, GGCX and PTPN11, showed more limited cell type-specific expression patterns (Figure 4C). These findings demonstrate substantial heterogeneity in the cellular distribution of the six potential therapeutic genes and provide a cell type-specific context for further investigation of their potential roles in CAD.
One population required re-annotation. The cells assigned to astrocytes by the automated annotation (217 cells, 0.38%) express the complete adipocyte program (ADIPOQ 69%, PLIN1 83%, PLIN4 75%, FABP4 100%, LEP 37%, LIPE 54%, GPD1 75%, CIDEA/CIDEC 65%, THRSP 59%, LPL 71%, PPARG 48%, CFD 94%) while expressing no astrocyte or Schwann-cell marker (SLC1A2 0%, SOX10 0%, MPZ 0.9%, PLP1 0.9%); GFAP and AQP4 are not present in the expression matrix and could not be evaluated. The population is therefore annotated as adipocyte, and most plausibly represents perivascular/epicardial adipose tissue, which is expected in coronary artery specimens and is itself implicated in atherogenesis (Figure S4; Supplementary Table S18).
Cell numbers are reported for every population in Supplementary Table S15. Two populations central to the mechanistic discussion are small: plasmacytoid dendritic cells, 65 cells (0.11%), and the adipocyte population, 217 cells (0.38%). Cluster 39 draws 63% of its cells from a single sample. All cell-type-level statements are accompanied by the number of cells, and no mechanistic inference is based on populations of this size.
3.6. Cell–Cell Communication Analysis
To map signaling pathways in coronary lesions, we used cell–cell communication analysis of the clustered scRNA-seq data. Global networks showed dense interactions between cardiac, vascular, and stromal cells (cardiomyocytes, endothelial cells, fibroblasts, and smooth muscle cells) and immune populations (macrophages, monocytes, pDCs, T/NK cells) (Figure 5A–D). Stromal and endothelial cells showed prominent signaling activity, while macrophages and pDCs exhibited strong sender and receiver activity (Figure 5A,B); the pDC population comprises only 65 cells (0.11% of the dataset), so all pDC-related statements are exploratory. Adhesion (ICAM/fibronectin), Annexin, amyloid-beta precursor protein and HLA signaling are among the pathways detected, and the three pathways illustrated in Figure 6 are presented as illustrative examples rather than as the dominant signaling programmes. When the 136 annotated pathways are ranked by the number of significant ligand–receptor interactions, HLA ranks 15th (8 interactions), amyloid-beta precursor protein 19th (6) and Annexin 46th (3), whereas collagen/integrin adhesion (84), WNT signaling (40) and chemokine signaling (36) are the most prominent (Supplementary Table S20). All results in this section are model-based inference from a ligand–receptor database and do not constitute evidence that the interactions occur in vivo.
Figure 5.
(A) Network of aggregated interaction weights/strengths among annotated cell types. Node size reflects the total outgoing + incoming interaction strength for each cell type; edge color and thickness indicate direction and magnitude of interaction strength. (B) Network of number of interactions between cell types. Nodes represent cell types as defined in the scRNA-seq atlas, but edges are scaled by the count of significant ligand–receptor links rather than by aggregated strength. (C) Outgoing signaling heatmap. Outgoing signaling represents the aggregate strength of ligands expressed by the sender cells. Rows are the top signaling pathways ranked by outgoing activity; columns are annotated cell types. Tile color intensity indicates relative outgoing signaling activity of each pathway from each cell type; the bar above shows pathway-level activity. (D) Incoming signaling heatmap. Incoming signaling represents the aggregate strength of receptors expressed by the receiver cells. Rows are the same top pathways ranked by incoming activity; columns are cell types.
Figure 6.
(A–C) Network diagrams showing the topology of signaling for three exemplar pathways: (A) Annexin signaling, (B) amyloid-beta precursor protein signaling, and (C) HLA (antigen-presentation) signaling. Nodes represent cell types (same annotations as in Figure 4). (D–F) Top ligand–receptor contributors and activity summaries for each pathway (bar plots and activity bubbles). These panels report model-based inference from a ligand–receptor database and do not establish that the interactions occur in vivo. Macrophages contributed substantially to Annexin and amyloid-beta precursor protein signaling, whereas the pDC contribution was smaller and exploratory (65 cells, 0.11% of the dataset). HLA signaling involves prominent interactions between antigen-presenting cells and T-cell populations.
Network maps for each pathway (Figure 6A–C) showed that macrophages contributed substantially, and pDCs (65 cells, 0.11%) contributed to a lesser and exploratory extent, to Annexin and amyloid-beta precursor protein signaling, with interactions involving T/NK cells, smooth muscle cells, and endothelial cells. The ligand–receptor contribution plots (Figure 6D–F) revealed that a small number of ligand–receptor pairs accounted for most of the pathway activity (high contribution percentage) and were also associated with high activity/significance in the bubble plots. HLA displayed a distinct topology consistent with antigen presentation: endothelial cells and macrophages contributed to substantial HLA-mediated signals that target T cell subsets. Together, these results are consistent with innate immune–vascular/stromal crosstalk via adhesion, Annexin, Galectin and HLA pathways contributing to the cellular communication network in coronary atherosclerosis, and suggest, but do not establish, a cellular context for the six genetically prioritized therapeutic targets.
3.7. Phenome-Wide MR for CAD Potential Therapeutic Genes
The 783 phenotypes analyzed are listed in Supplementary Table S21, and the phenome-wide MR results are given in Supplementary Tables S22–S24 (Bonferroni-significant, FDR-significant and complete). Of the 4698 planned gene–phenotype combinations, 4636 yielded a usable estimate. The 62 combinations without an estimate and their causes are listed in Supplementary Table S25. Twenty-four associations reached the prespecified threshold (ERP29, 17; FES, 5; PTPN11, 2) and 132 reached a Benjamini–Hochberg FDR < 0.05. The strongest associations were higher ERP29 with hypothyroidism (OR = 1.47, p = 1.61 × 10⁻⁸), higher FES with a lower risk of hypercholesterolaemia (OR = 0.90, p = 2.03 × 10⁻¹³) and higher PTPN11 with a lower risk of essential hypertension (OR = 0.83, p = 3.41 × 10⁻⁶). Because ERP29, now a Tier B target, accounted for 17 of the 24 associations, the discussion of safety signals is centered on FES and PTPN11 rather than on ERP29. The five phenotypes for which no gene produced an estimate are all CAD-related (ischaemic heart disease 411, unstable angina 411.1, myocardial infarction 411.2, angina pectoris 411.3, coronary atherosclerosis 411.4); the screen therefore does not re-test the primary outcome (Figure 7 and Figure S5; Supplementary Tables S22–S25).
Figure 7.
Phenome-wide MR association plot of the six potential therapeutic genes. The x-axis represents the six potential therapeutic gene targets, and the y-axis represents the −log10(p) values of their associations with phenotypic outcomes. The horizontal blue line indicates the prespecified Bonferroni threshold for the testing family, −log10(0.05/4698) = 4.97. All 24 associations meeting this threshold are labeled. This is a phenome-wide association and safety-signal screen: the absence of a genetic association does not establish the safety of pharmacological modulation, and lifelong genetically predicted expression does not estimate the consequences of transient drug exposure.
No associations for GGCX, LIPA, or VAMP8 met the prespecified Bonferroni significance threshold. The lowest p values observed for these genes were for diseases of pulp and periapical tissues for GGCX (OR = 1.39, p = 6.32 × 10⁻⁵), crushing or internal injury to organs for LIPA (OR = 1.23, p = 9.19 × 10⁻⁵), and missed abortion/hydatidiform mole for VAMP8 (OR = 1.37, p = 2.58 × 10⁻⁴); these associations did not meet the primary significance threshold and should be considered exploratory.
This phenome-wide MR analysis provides genetically predicted insights into the potential phenotypic consequences of these therapeutic targets. These findings are based on lifelong genetic modulation and may not fully capture the effects of short-term pharmacological inhibition or activation, which may have distinct on-target toxicities. This analysis should be understood as a phenome-wide association and safety-signal screen, not as an assessment of drug safety: the absence of a genetic association does not establish the safety of pharmacological modulation of the target, and lifelong genetically predicted expression does not estimate the consequences of transient pharmacological exposure.
4. Discussion
Of the 4488 candidate genes assembled from the druggable genome, 2460 had a significant cis-eQTL and 2446 were retained after LD clumping; the instrument-strength filter (F > 10) removed no gene (minimum F = 29.7), so the exposure set also comprised 2446 genes. Of these, 2418 could be analyzed against FinnGen R11 I9_CHD and 2420 against CARDIoGRAMplusC4D. This study utilized blood eQTL and GWAS data to investigate the potential causal effects of genetically predicted gene expression on CAD risk, offering preclinical insights for therapeutic development. Through MR analyses, six genes (PTPN11, FES, VAMP8, LIPA, GGCX, and ERP29) showed genetically supported associations with CAD that were replicated in the external GWAS and supported by meta-analysis. Tissue-specific MR provided additional context, showing concordant directions for LIPA, GGCX, and FES but tissue-dependent associations for PTPN11 and VAMP8. We report these targets in two tiers of evidence: Tier A (colocalization-supported in both cohorts; LIPA, GGCX, FES and VAMP8) and Tier B (MR-replicated without colocalization support; ERP29 and PTPN11, whose colocalization does not reach PP.H4 ≥ 0.80 (H3-dominant in both cohorts for ERP29; H3-dominant in the discovery cohort and inconclusive in the external cohort for PTPN11) and whose MR estimates therefore carry the caveat that the instrument may not act on CAD solely through the target gene). Cell-type-specific expression patterns were mapped using scRNA-seq, cell–cell communication analysis characterized intercellular signaling networks, and phenome-wide MR analyses screened for potential phenotypic consequences and safety signals. These analyses provide cellular context and phenotypic leads; they do not independently validate causality or mechanism. To our knowledge, this study represents one of the initial efforts to integrate scRNA-seq-based cell–cell communication analysis with Mendelian randomization for the prioritization of CAD therapeutic targets. By complementing traditional genetic association analyses with high-resolution cellular interactions, we aim to bridge the gap between genetic causality and the complex intercellular signaling mechanisms underlying CAD pathogenesis.
PTPN11 (SHP2), a protein tyrosine phosphatase, catalyzes the removal of phosphate groups from tyrosine residues and enhances RTK/RAS/ERK signaling [32]. Muscle-specific deletion of PTPN11 leads to dilated cardiomyopathy via Erk/MAPK and RhoA signaling [33]. Our results suggest, but do not establish, a role for PTPN11 in immune-cell signaling. PTPN11 is a Tier B target: although it was replicated in both MR analyses, its colocalization is H3-dominant in the discovery cohort (PP.H4 = 0.001; PP.H3 = 0.999) but inconclusive in the external cohort (PP.H4 = 0.295; PP.H3 = 0.651), so its MR estimate carries the caveat that the instrument may not act on CAD solely through PTPN11. We identified a protective association between genetically predicted PTPN11 expression and CAD risk (OR: 0.84) in whole blood. scRNA-seq analysis showed that PTPN11 was expressed in macrophages and natural killer T (NKT) cells, key effectors in the ANXA1-FPR2 signaling axis, a well-established pathway for inflammation resolution [31,34]. PTPN11 may therefore participate in protective, anti-inflammatory signaling within immune cells in the atherosclerotic plaque, although the present data cannot establish such a role. However, in aortic tissue, PTPN11 showed a potential risk effect (OR: 1.11). This discrepancy likely reflects context-dependent biology. While the protective effect in blood aligns with its immune-modulatory role, in the aortic wall, SHP2 is known to promote vascular smooth muscle cell proliferation and neointima formation, which are pro-atherogenic processes [35]. This discrepancy may stem from the distinct roles of PTPN11 in different cellular contexts: specifically, its anti-inflammatory role in myeloid cells versus its potentially different function in vascular resident cells. A more detailed evaluation of this tissue-specific divergence is provided in the Limitations Section. Thus, the tissue-specific risk signal warrants further investigation using healthy arterial models. SHP2 inhibitors such as TNO155 are in clinical trials for solid tumours, which shows that the target is pharmacologically tractable; however, repurposing to cardiovascular inflammation remains speculative, would require tissue-selective delivery, and is not supported by the present data [35].
FES, a member of the protein tyrosine kinase family, regulates cellular processes such as proliferation, differentiation, and survival [36]. Our study provides genetic evidence supporting a protective association of FES with CAD risk (OR = 0.90), with a consistent direction of effect observed in the aorta (OR = 0.86) and subcutaneous adipose tissue (OR = 0.75). FinnGen showed significant between-instrument heterogeneity (Cochran’s Q p = 1.40 × 10⁻⁴), but the MR-Egger intercept was not significant (p = 0.282). This heterogeneity warrants caution when interpreting the estimate but does not by itself demonstrate directional pleiotropy. Recent colocalization studies in human coronary artery smooth muscle cells have identified FES as a significant locus in CAD GWAS analyses [37]. Additionally, GWAS studies link the FES gene at 15q26.1 to elevated CAD risk [38], with mutations in this region increasing monocyte/macrophage abundance in atherosclerotic plaques [39]. High FES expression was found in monocytes and macrophages, which is consistent with its role in tumor-associated angiogenesis and metastasis in breast cancer [40]. Phenome-wide MR analysis revealed associations between FES and reduced risks of hypercholesterolemia and hyperlipidemia, though Fes−/-−/Apoe−/− mice showed no significant change in total plasma cholesterol [39]. As a protein kinase, FES belongs to a highly druggable target class. Existing kinase inhibitor libraries offer a valuable resource for screening and identifying specific modulators for CAD prevention.
LIPA, encoding lysosomal acid lipase, hydrolyzes cholesteryl esters (CEs) and triglycerides (TGs) within lysosomes [41]. Our MR analysis identified a positive association between genetically predicted LIPA expression and CAD risk (OR: 1.04 in blood; OR: 1.13 in aorta; OR: 1.21 in subcutaneous adipose). The FinnGen diagnostics showed heterogeneity (Cochran’s Q p = 0.0202) and potential directional pleiotropy (MR-Egger intercept p = 0.00101; MR-PRESSO global p = 0.019), although no single outlier was identified. These FinnGen findings lower confidence in a causal interpretation; the LIPA MR estimate should therefore be interpreted cautiously as a possible association with sensitivity-analysis concerns, rather than as an unqualified causal estimate. While this appears contradictory to the severe atherosclerosis observed in lysosomal acid lipase deficiency (LAL-D), recent functional genomic evidence resolves this paradox [42]. Li et al. demonstrated that CAD-associated risk alleles increase LIPA expression specifically in monocytes, which enhances atherogenesis via altered lipid handling and increased integrin signaling [43]. In particular, our scRNA-seq results provide further cellular support for this mechanism by identifying high LIPA enrichment specifically in plaque macrophages. This supports a model where higher LIPA expression in myeloid cells may contribute to CAD risk in the general population. Consequently, unlike in LAL-D, any therapeutic implication for common CAD would point towards modulating LIPA within the myeloid compartment rather than systemically; this remains a long-term hypothesis that depends both on confirmation of the myeloid-specific mechanism and on cell-type-selective delivery that has not been demonstrated. The MR effect size is modest. Whether modulating LIPA activity would alter CAD risk in any patient subset has not been tested, and the present analyses provide no evidence on that point. The therapeutic direction suggested above is therefore a question for experimental work rather than a recommendation, and it is not supported by the data reported here.
ERP29, a 29 kDa chaperone protein in the endoplasmic reticulum, regulates protein folding, cellular stress responses, and calcium homeostasis [44]. A positive association was noted between ERP29 and CAD risk in whole blood (OR: 1.28) and in subcutaneous adipose (OR: 1.40). In the single-cell data ERP29 expression was higher in plasmacytoid dendritic cells (pDCs) than in the remaining populations; this observation is exploratory, because the pDC population comprises only 65 cells (0.11%). ERP29 is a Tier B target: although it was replicated in both MR analyses, its colocalization is H3-dominant (PP.H4 = 0.003; PP.H3 = 0.997), so this estimate should be interpreted with the caveat that the instrument may not act on CAD solely through ERP29. Its role in cardiovascular diseases remains unexplored, though ERP29 is involved in cystic fibrosis transmembrane conductance regulator trafficking [45] and neural regeneration [46]. Based on the results of MR and cell–cell communication analysis in our study, ERP29 expression was highest in pDCs, a pattern that would be consistent with ERP29’s role in endoplasmic reticulum stress [47] and protein handling [48]. This pattern, if reproduced in larger datasets with sufficient pDC numbers, would point to a possible link between ER stress response and immune activation in CAD; the present data cannot establish such a link. While the precise mechanism remains to be elucidated, we hypothesize that ERP29 may influence plaque stability by modulating the secretory capacity of immune cells. Future experimental studies are needed to verify this novel association. Whether chemical chaperones that modulate ERP29 function could affect plaque stability is an untested possibility that would first require independent confirmation of the association reported here.
GGCX, an essential protein for vitamin K-dependent clotting factor biosynthesis, was positively associated with CAD risk in whole blood (OR: 1.12), aorta (OR: 1.10) and subcutaneous adipose (OR: 1.19), with high GGCX expression in fibroblasts. FinnGen also showed between-instrument heterogeneity (Cochran’s Q p = 0.00194), while the MR-Egger intercept was not significant (p = 0.179); this warrants caution in interpreting the estimate but does not by itself establish directional pleiotropy. Mutations in GGCX lead to bleeding disorders and cardiovascular symptoms, including cardiac diastolic dysfunction [49]. GGCX is a candidate gene for CAD and large artery stroke, potentially contributing to atherosclerotic disease pathogenesis [50]. In the cell–cell communication analysis, fibroblasts interact with macrophages through the ANXA1 molecule within the Annexin A1 pathway. Relevant studies indicate that dysregulation of GGCX may contribute to ectopic mineralization and tissue fibrosis [51]. In the cell–cell communication analysis, fibroblasts interacted with macrophages through the ANXA1 molecule within the Annexin A1 pathway. This molecule exhibits anti-inflammatory effects on macrophages [52]. These processes provide a hypothesis for how GGCX might act, which requires experimental testing. Phenome-wide MR revealed no significant associations for GGCX, although these findings require further validation. Translating this finding remains challenging given GGCX’s role in coagulation. It nevertheless highlights the need for agents that can specifically modulate its vascular calcification effects without disrupting the vitamin K-dependent clotting cascade.
VAMP8, a soluble N-ethylmaleimide-sensitive factor activating protein receptor (SNARE) protein mediating autophagosomal–lysosomal fusion, was negatively associated with CAD risk (OR: 0.90). VAMP8 expression was higher in macrophages and in pDCs; the pDC observation is exploratory given the small size of that population (65 cells, 0.11%), and together these patterns are consistent with, but do not establish, a role in autophagy-related processes in atherosclerosis [53,54]. In the cell–cell communication analysis, APP-CD74 was the highest-contributing ligand–receptor pair in the amyloid-beta precursor protein pathway. Prior work implicates APP-CD74, and the migrasomes it induces on endothelial cells, in amplifying the inflammatory cascade [55]; our analysis is inferential and does not establish this interaction in vivo. Given that CD47 acts as an antiphagocytic signal that inhibits clearance of necrotic debris, and that VAMP8 regulates vesicle trafficking and exocytosis, we hypothesize that VAMP8 may facilitate CD47 turnover [56]. If validated, this could limit necrotic core expansion and enhance plaque stability. Whether modulating this pathway has therapeutic value is untested, and any combination with anti-CD47 approaches such as magrolimab would rest on two unverified steps: that VAMP8 regulates CD47 turnover in the relevant cell type, and that such modulation can be achieved selectively in vivo [57].
Our phenome-wide MR analysis identified several significant associations for ERP29, FES, and PTPN11, whereas no associations for GGCX, LIPA, or VAMP8 met the Bonferroni significance threshold. These findings should nevertheless be interpreted cautiously. The analysis assesses the lifelong consequences of genetically predicted gene expression levels, which may differ fundamentally from the effects of therapeutic pharmacological modulation. MR can only simulate the long-term effects of genetic variation on targets, whereas it cannot directly reflect the short-term or dynamic effects of pharmacological intervention. Therefore, although these genetic associations may highlight potential safety signals, they cannot establish the safety or adverse effects of pharmacological modulation, and rigorous preclinical and clinical safety assessments remain indispensable for evaluating the therapeutic potential of these targets.
Limitations
Despite the insights gained, this study has several limitations. First, our analysis was confined to cis-eQTLs, excluding trans-eQTLs, which may provide additional regulatory insights. Second, phenome-wide MR assesses lifelong genetic liability, which differs biologically from the transient effects of pharmacological interventions. Third, while we utilized tissue-specific eQTLs from GTEx, the availability of robust eQTL data for specific heart and coronary artery tissues remains limited compared to whole blood, which may reduce statistical power for detecting tissue-specific effects. Fourth, our scRNA-seq data came only from coronary atherosclerotic lesions. Consequently, these data primarily capture the immune-rich inflammatory milieu of the lesion and may fail to reflect the baseline expression patterns of healthy vascular smooth muscle cells (VSMCs) in non-diseased arteries. This methodological constraint may partly explain the observed discrepancies in our MR results, such as for PTPN11, where a protective association was observed using blood eQTLs, whereas a potential risk association was observed in aortic tissue. Future studies utilizing single-cell data from early-stage lesions or healthy vascular tissues are necessary to validate these tissue-specific effects. Fifth, the colocalization analysis uses the approximate Bayes factor model, which assumes a single causal variant per locus and depends on the prior settings. A second causal variant, or a shared variant below the resolution of the available LD reference, cannot therefore be excluded. In addition, the regional eQTL input is a significance-filtered set rather than full regional summary statistics, which can affect the posterior probabilities. Some genes were instrumented by a single variant, precluding heterogeneity and MR-Egger analyses, and potential sample overlap between the GWAS cohorts and the eQTL reference panel cannot be excluded. The small size and donor imbalance of some single-cell populations, the inferential nature of ligand–receptor-based cell–cell communication analysis, and variable statistical power across phenotypes in the phenome-wide analysis may also limit interpretation. Moreover, while the identified SNPs demonstrated significant statistical associations, the generalizability of our findings to broader or diverse populations is limited. More extensive clinical and experimental studies in the future are warranted to confirm and extend these results, ensuring their reliability and applicability in diverse contexts.
5. Conclusions
This study prioritizes six candidate therapeutic targets for CAD at two clearly different levels of evidence. Four (LIPA, GGCX, FES and VAMP8; Tier A) are supported by colocalization in both cohorts as well as by MR and meta-analysis. The remaining two (ERP29 and PTPN11; Tier B) were replicated in both MR analyses but did not reach PP.H4 ≥ 0.80: ERP29 was H3-dominant in both cohorts, whereas PTPN11 was H3-dominant in the discovery cohort and inconclusive in the external cohort. ERP29 accounted for 17 of the 24 Bonferroni-significant phenome-wide associations, and substantially more evidence is therefore needed before it can be considered a therapeutic target. The analyses establish genetic association and prioritization, not mechanism or causality of pharmacological modulation. The tissue-specific results are directionally discordant for two targets and do not constitute cross-tissue validation, and the cell–cell communication results are database-derived inference. The experimental directions implied are tissue-relevant perturbation of the Tier A targets, functional characterization of the 12q24 locus underlying the Tier B results, and independent single-cell validation with disease and control tissue. Clinical trials are needed to test whether these targets have any therapeutic effect and whether they can be modulated safely.
Supplementary Materials
The following supporting information can be downloaded at: https://www.mdpi.com/article/10.3390/cimb48111108/s1.
Author Contributions
Conceptualization, H.H. and J.M.; Methodology, H.H.; Software, H.H.; Formal analysis, H.H.; Data curation, J.M. and W.H.; Visualization, J.M.; Writing—original draft, J.M.; Validation, W.H.; Writing—review and editing, W.H.; Supervision, H.W. and Q.Y.; Funding acquisition, H.W. All authors have read and agreed to the published version of the manuscript.
Funding
This work was supported by the National Natural Science Foundation of China (No. 82405355), National Students’ Platform for Innovation and Entrepreneurship Training Program (S202410542075, 202510542104).
Institutional Review Board Statement
Ethical review and approval were waived for this study because all analyses were based on legally obtained, publicly available summary-level and/or anonymized data, and no participants were directly recruited or subjected to any intervention by the authors. This exemption is in accordance with Article 32 of the Measures for Ethical Review of Life Science and Medical Research Involving Human Subjects (Guo Wei Ke Jiao Fa [2023] No. 4), issued by the National Health Commission, Ministry of Education, Ministry of Science and Technology, and National Administration of Traditional Chinese Medicine of the People’s Republic of China. Article 32 provides that research using legally obtained publicly available data or anonymized information may be exempt from ethical review, provided that it causes no harm to human participants and does not involve sensitive personal information or commercial interests.
Informed Consent Statement
Patient consent was waived since this study involved secondary analyses of publicly available summary-level and/or anonymized data and did not involve direct recruitment, contact, or intervention with human participants by the authors. Informed consent requirements for the original data collection were addressed by the respective source studies in accordance with their applicable ethical and institutional requirements.
Data Availability Statement
The datasets analyzed in this study were sourced from the following repositories: eQTL data were obtained from the eQTLGen Consortium (available at https://eqtlgen.org/, accessed on 5 March 2025); disease GWAS data were retrieved from the IEU OpenGWAS project (available at https://gwas.mrcieu.ac.uk/, accessed on 5 March 2020); summary GWAS data for 783 disease traits (traits with ≥500 cases) used in the phenome-wide Mendelian randomization analysis were sourced from the Lee Lab (available at https://www.leelabsg.org/resources, accessed on 8 May 2025); and single-cell sequencing data were accessed through the Gene Expression Omnibus (GEO) of the National Center for Biotechnology Information under accession number GSE233870.
Acknowledgments
The authors appreciate the participants and investigators for sharing public summary statistics.
Conflicts of Interest
The authors declare no conflicts of interest.
References
- Martin, S.S.; Aday, A.W.; Almarzooq, Z.I.; Anderson, C.A.M.; Arora, P.; Avery, C.L.; Baker-Smith, C.M.; Gibbs, B.B.; Beaton, A.Z.; Boehme, A.K.; et al. 2024 Heart Disease and Stroke Statistics: A Report of US and Global Data from the American Heart Association. Circulation 2024, 149, e347–e913, Correction in Circulation 2024, 151, e1095. [Google Scholar] [CrossRef] [Scilit] [PubMed]
- Safiri, S.; Karamzad, N.; Singh, K.; Carson-Chahhoud, K.; Adams, C.; Nejadghaderi, S.A.; Almasi-Hashiani, A.; Sullman, M.J.M.; Mansournia, M.A.; Bragazzi, N.L.; et al. Burden of ischemic heart disease and its attributable risk factors in 204 countries and territories, 1990–2019. Eur. J. Prev. Cardiol. 2022, 29, 420–431. [Google Scholar] [CrossRef] [Scilit] [PubMed]
- Mensah, G.A.; Fuster, V.; Murray, C.J.L.; Roth, G.A. Global Burden of Cardiovascular Diseases and Risks, 1990–2022. J. Am. Coll. Cardiol. 2023, 82, 2350–2473. [Google Scholar] [CrossRef] [Scilit] [PubMed]
- Virani, S.S.; Newby, L.K.; Arnold, S.V.; Bittner, V.; Brewer, L.C.; Demeter, S.H.; Dixon, D.L.; Fearon, W.F.; Hess, B.; Johnson, H.M.; et al. 2023 AHA/ACC/ACCP/ASPC/NLA/PCNA Guideline for the Management of Patients with Chronic Coronary Disease: A Report of the American Heart Association/American College of Cardiology Joint Committee on Clinical Practice Guidelines. Circulation 2023, 148, e9–e119, Correction in Circulation 2023, 148, e148. [Google Scholar] [CrossRef] [Scilit] [PubMed]
- Sarnak, M.J.; Amann, K.; Bangalore, S.; Cavalcante, J.L.; Charytan, D.M.; Craig, J.C.; Gill, J.S.; Hlatky, M.A.; Jardine, A.G.; Landmesser, U.; et al. Chronic Kidney Disease and Coronary Artery Disease: JACC State-of-the-Art Review. J. Am. Coll. Cardiol. 2019, 74, 1823–1838. [Google Scholar] [CrossRef] [Scilit] [PubMed]
- Chasman, D.I. Peering into the Future of CAD Genomics. Circ. Res. 2018, 122, 391–393. [Google Scholar] [CrossRef] [Scilit] [PubMed]
- Hodonsky, C.J.; Turner, A.W.; Khan, M.D.; Barrientos, N.B.; Methorst, R.; Ma, L.; Lopez, N.G.; Mosquera, J.V.; Auguste, G.; Farber, E.; et al. Multi-ancestry genetic analysis of gene regulation in coronary arteries prioritizes disease risk loci. Cell Genom. 2024, 4, 100465. [Google Scholar] [CrossRef] [Scilit] [PubMed]
- O’Connor, L.J.; Price, A.L. Distinguishing genetic correlation from causation across 52 diseases and complex traits. Nat. Genet. 2018, 50, 1728–1734, Correction in Nat. Genet. 2018, 50, 1753. [Google Scholar] [CrossRef] [Scilit] [PubMed]
- Walker, V.M.; Davey Smith, G.; Davies, N.M.; Martin, R.M. Mendelian randomization: A novel approach for the prediction of adverse drug events and drug repurposing opportunities. Int. J. Epidemiol. 2017, 46, 2078–2089. [Google Scholar] [CrossRef] [Scilit] [PubMed]
- The Interleukin-6 Receptor Mendelian Randomisation Analysis (IL6R MR) Consortium; Swerdlow, D.I.; Holmes, M.V.; Kuchenbaecker, K.B.; Engmann, J.E.; Shah, T.; Sofat, R.; Guo, Y.; Chung, C.; Peasey, A.; et al. The interleukin-6 receptor as a target for prevention of coronary heart disease: A mendelian randomisation analysis. Lancet 2012, 379, 1214–1224. [Google Scholar] [CrossRef] [Scilit] [PubMed]
- Yang, S.; Guo, J.; Kong, Z.; Deng, M.; Da, J.; Lin, X.; Peng, S.; Fu, J.; Luo, T.; Ma, J.; et al. Causal effects of gut microbiota on sepsis and sepsis-related death: Insights from genome-wide Mendelian randomization, single-cell RNA, bulk RNA sequencing, and network pharmacology. J. Transl. Med. 2024, 22, 10. [Google Scholar] [CrossRef] [Scilit] [PubMed]
- Van de Sande, B.; Lee, J.S.; Mutasa-Gottgens, E.; Naughton, B.; Bacon, W.; Manning, J.; Wang, Y.; Pollard, J.; Mendez, M.; Hill, J.; et al. Applications of single-cell RNA sequencing in drug discovery and development. Nat. Rev. Drug Discov. 2023, 22, 496–520. [Google Scholar] [CrossRef] [Scilit] [PubMed]
- Freshour, S.L.; Kiwala, S.; Cotto, K.C.; Coffman, A.C.; McMichael, J.F.; Song, J.J.; Griffith, M.; Griffith, O.L.; Wagner, A.H. Integration of the Drug-Gene Interaction Database (DGIdb 4.0) with open crowdsource efforts. Nucleic Acids Res. 2021, 49, D1144–D1151. [Google Scholar] [CrossRef] [Scilit] [PubMed]
- Finan, C.; Gaulton, A.; Kruger, F.A.; Lumbers, R.T.; Shah, T.; Engmann, J.; Galver, L.; Kelley, R.; Karlsson, A.; Santos, R.; et al. The druggable genome and support for target identification and validation in drug development. Sci. Transl. Med. 2017, 9, eaag1166. [Google Scholar] [CrossRef] [Scilit] [PubMed]
- Võsa, U.; Claringbould, A.; Westra, H.J.; Bonder, M.J.; Deelen, P.; Zeng, B.; Kirsten, H.; Saha, A.; Kreuzhuber, R.; Yazar, S.; et al. Large-scale cis- and trans-eQTL analyses identify thousands of genetic loci and polygenic scores that regulate blood gene expression. Nat. Genet. 2021, 53, 1300–1310. [Google Scholar] [CrossRef] [Scilit] [PubMed]
- Nikpay, M.; Goel, A.; Won, H.H.; Hall, L.M.; Willenborg, C.; Kanoni, S.; Saleheen, D.; Kyriakou, T.; Nelson, C.P.; Hopewell, J.C.; et al. A comprehensive 1000 Genomes-based genome-wide association meta-analysis of coronary artery disease. Nat. Genet. 2015, 47, 1121–1130. [Google Scholar] [CrossRef] [Scilit] [PubMed]
- Viechtbauer, W. Conducting meta-analyses in R with the metafor package. J. Stat. Softw. 2010, 36, 1–48. [Google Scholar] [CrossRef] [Scilit]
- Hemani, G.; Zheng, J.; Elsworth, B.; Wade, K.H.; Haberland, V.; Baird, D.; Laurin, C.; Burgess, S.; Bowden, J.; Langdon, R.; et al. The MR-Base platform supports systematic causal inference across the human phenome. eLife 2018, 7, e34408. [Google Scholar] [CrossRef] [Scilit] [PubMed]
- The 1000 Genomes Project Consortium; Auton, A.; Brooks, L.D.; Durbin, R.M.; Garrison, E.P.; Kang, H.M.; Korbel, J.O.; Marchini, J.L.; McCarthy, S.; McVean, G.A.; et al. A global reference for human genetic variation. Nature 2015, 526, 68–74. [Google Scholar] [CrossRef] [Scilit] [PubMed]
- Sollis, E.; Mosaku, A.; Abid, A.; Buniello, A.; Cerezo, M.; Gil, L.; Groza, T.; Güneş, O.; Hall, P.; Hayhurst, J.; et al. The NHGRI-EBI GWAS Catalog: Knowledgebase and deposition resource. Nucleic Acids Res. 2023, 51, D977–D985. [Google Scholar] [CrossRef] [Scilit] [PubMed]
- Greco M, F.D.; Minelli, C.; Sheehan, N.A.; Thompson, J.R. Detecting pleiotropy in Mendelian randomisation studies with summary data and a continuous outcome. Stat. Med. 2015, 34, 2926–2940. [Google Scholar] [CrossRef] [Scilit] [PubMed]
- Hemani, G.; Tilling, K.; Davey Smith, G. Orienting the causal relationship between imprecisely measured traits using GWAS summary data. PLoS Genet. 2017, 13, e1007081, Correction in PLoS Genet. 2017, 13, e1007149. [Google Scholar] [CrossRef] [Scilit] [PubMed]
- Giambartolomei, C.; Vukcevic, D.; Schadt, E.E.; Franke, L.; Hingorani, A.D.; Wallace, C.; Plagnol, V. Bayesian Test for Colocalisation between Pairs of Genetic Association Studies Using Summary Statistics. PLoS Genet. 2014, 10, e1004383. [Google Scholar] [CrossRef] [Scilit] [PubMed]
- Barrett, T.; Wilhite, S.E.; Ledoux, P.; Evangelista, C.; Kim, I.F.; Tomashevsky, M.; Marshall, K.A.; Phillippy, K.H.; Sherman, P.M.; Holko, M.; et al. NCBI GEO: Archive for functional genomics data sets—Update. Nucleic Acids Res. 2012, 41, D991–D995. [Google Scholar] [CrossRef] [Scilit] [PubMed]
- Wolf, F.A.; Angerer, P.; Theis, F.J. SCANPY: Large-scale single-cell gene expression data analysis. Genome Biol. 2018, 19, 15. [Google Scholar] [CrossRef] [Scilit] [PubMed]
- Zeng, Z.; Ma, Y.; Hu, L.; Tan, B.; Liu, P.; Wang, Y.; Xing, C.; Xiong, Y.; Du, H. OmicVerse: A framework for bridging and deepening insights across bulk and single-cell sequencing. Nat. Commun. 2024, 15, 5983. [Google Scholar] [CrossRef] [Scilit] [PubMed]
- Virtanen, P.; Gommers, R.; Oliphant, T.E.; Haberland, M.; Reddy, T.; Cournapeau, D.; Burovski, E.; Peterson, P.; Weckesser, W.; Bright, J.; et al. SciPy 1.0: Fundamental algorithms for scientific computing in Python. Nat. Methods 2020, 17, 261–272, Correction in Nat. Methods 2020, 17, 352. [Google Scholar] [CrossRef] [Scilit] [PubMed]
- Lopez, R.; Regier, J.; Cole, M.B.; Jordan, M.I.; Yosef, N. Deep generative modeling for single-cell transcriptomics. Nat. Methods 2018, 15, 1053–1058. [Google Scholar] [CrossRef] [Scilit] [PubMed]
- Cao, Y.; Wang, X.; Peng, G. SCSA: A Cell Type Annotation Tool for Single-Cell RNA-seq Data. Front. Genet. 2020, 11, 490. [Google Scholar] [CrossRef] [Scilit] [PubMed]
- Zhou, W.; Nielsen, J.B.; Fritsche, L.G.; Dey, R.; Gabrielsen, M.E.; Wolford, B.N.; LeFaive, J.; VandeHaar, P.; Gagliano, S.A.; Gifford, A.; et al. Efficiently controlling for case-control imbalance and sample relatedness in large-scale genetic association studies. Nat. Genet. 2018, 50, 1335–1341. [Google Scholar] [CrossRef] [Scilit] [PubMed]
- Sudlow, C.; Gallacher, J.; Allen, N.; Beral, V.; Burton, P.; Danesh, J.; Downey, P.; Elliott, P.; Green, J.; Landray, M.; et al. UK Biobank: An Open Access Resource for Identifying the Causes of a Wide Range of Complex Diseases of Middle and Old Age. PLoS Med. 2015, 12, e1001779. [Google Scholar] [CrossRef] [Scilit] [PubMed]
- Neel, B.G.; Gu, H.; Pao, L. The ‘Shp’ing news: SH2 domain-containing tyrosine phosphatases in cell signaling. Trends Biochem. Sci. 2003, 28, 284–293. [Google Scholar] [CrossRef] [Scilit] [PubMed]
- Kontaridis, M.I.; Yang, W.; Bence, K.K.; Cullen, D.; Wang, B.; Bodyak, N.; Ke, Q.; Hinek, A.; Kang, P.M.; Liao, R.; et al. Deletion of Ptpn11 (Shp2) in cardiomyocytes causes dilated cardiomyopathy via effects on the extracellular signal-regulated kinase/mitogen-activated protein kinase and RhoA signaling pathways. Circulation 2008, 117, 1423–1435, Correction in Circulation 2008, 117, e314. [Google Scholar] [CrossRef] [Scilit] [PubMed]
- Babaeijandaghi, F.; Paiero, A.; Long, R.; Tung, L.W.; Smith, S.P.; Cheng, R.; Smandych, J.; Kajabadi, N.; Chang, C.K.; Ghassemi, A.; et al. TNFα and IFNγ cooperate for efficient pro- to anti-inflammatory transition of macrophages during muscle regeneration. Proc. Natl. Acad. Sci. USA 2022, 119, e2209976119. [Google Scholar] [CrossRef] [Scilit] [PubMed]
- López Moreno, S.F.; Lenz, S.A.; Casso-Chapa, B.; Paniagua-Bojorges, A.; Kim, J.H.; Palaskas, N.L.; Nead, K.T.; Samanthapudi, V.S.K.; Mejia, G.; Hoang, O.; et al. SHP2: A Redox-Sensitive Regulator Linking Immune Checkpoint Inhibitor Therapy to Cancer Treatment and Vascular Risk. Antioxidants 2025, 14, 1388. [Google Scholar] [CrossRef] [Scilit] [PubMed]
- Voisset, E.; Lopez, S.; Dubreuil, P.; De Sepulveda, P. The tyrosine kinase FES is an essential effector of KITD816V proliferation signal. Blood 2007, 110, 2593–2599. [Google Scholar] [CrossRef] [Scilit] [PubMed]
- Liu, B.; Pjanic, M.; Wang, T.; Nguyen, T.; Gloudemans, M.; Rao, A.; Castano, V.G.; Nurnberg, S.; Rader, D.J.; Elwyn, S.; et al. Genetic Regulatory Mechanisms of Smooth Muscle Cells Map to Coronary Artery Disease Risk Loci. Am. J. Hum. Genet. 2018, 103, 377–388. [Google Scholar] [CrossRef] [Scilit] [PubMed]
- The CARDIoGRAMplusC4D Consortium; Deloukas, P.; Kanoni, S.; Willenborg, C.; Farrall, M.; Assimes, T.L.; Thompson, J.R.; Ingelsson, E.; Saleheen, D.; Erdmann, J.; et al. Large-scale association analysis identifies new risk loci for coronary artery disease. Nat. Genet. 2013, 45, 25–33. [Google Scholar] [CrossRef] [Scilit] [PubMed]
- Karamanavi, E.; McVey, D.G.; van der Laan, S.W.; Stanczyk, P.J.; Morris, G.E.; Wang, Y.; Yang, W.; Chan, K.; Poston, R.N.; Luo, J.; et al. The FES Gene at the 15q26 Coronary-Artery-Disease Locus Inhibits Atherosclerosis. Circ. Res. 2022, 131, 1004–1017. [Google Scholar] [CrossRef] [Scilit] [PubMed]
- Zhang, S.; Chitu, V.; Stanley, E.R.; Elliott, B.E.; Greer, P.A. Fes tyrosine kinase expression in the tumor niche correlates with enhanced tumor growth, angiogenesis, circulating tumor cells, metastasis, and infiltrating macrophages. Cancer Res. 2011, 71, 1465–1473. [Google Scholar] [CrossRef] [Scilit] [PubMed]
- Korbelius, M.; Kuentzel, K.B.; Bradić, I.; Vujić, N.; Kratky, D. Recent insights into lysosomal acid lipase deficiency. Trends Mol. Med. 2023, 29, 425–438. [Google Scholar] [CrossRef] [Scilit] [PubMed]
- Arnaboldi, L.; Ossoli, A.; Giorgio, E.; Pisciotta, L.; Lucchi, T.; Grigore, L.; Pavanello, C.; Granata, A.; Pasta, A.; Arosio, B.; et al. LIPA gene mutations affect the composition of lipoproteins: Enrichment in ACAT-derived cholesteryl esters. Atherosclerosis 2020, 297, 8–15. [Google Scholar] [CrossRef] [Scilit] [PubMed]
- Li, F.; Flynn, E.; Ha, P.; Zebak, M.N.; Cheng, H.; Xue, C.; Shi, J.; Wu, X.; Wang, Z.; Meng, Y.; et al. LIPA, a risk locus for coronary artery disease: Decoding the variant-to-function relationship. Eur. Heart J. 2025, 46, 5273–5288. [Google Scholar] [CrossRef] [Scilit] [PubMed]
- Li, J.; Hui, Y.; Xu, Z.; Tan, J.; Yin, K.; Kuang, L.; Tang, Y.; Wei, J.; Zhong, Q.; Zheng, T. Non-canonical function of DPP4 promotes cognitive impairment through ERp29-associated mitochondrial calcium overload in diabetes. iScience 2023, 26, 106271. [Google Scholar] [CrossRef] [Scilit] [PubMed]
- Suaud, L.; Miller, K.; Alvey, L.; Yan, W.; Robay, A.; Kebler, C.; Kreindler, J.L.; Guttentag, S.; Hubbard, M.J.; Rubenstein, R.C. ERp29 regulates DeltaF508 and wild-type cystic fibrosis transmembrane conductance regulator (CFTR) trafficking to the plasma membrane in cystic fibrosis (CF) and non-CF epithelial cells. J. Biol. Chem. 2011, 286, 21239–21253. [Google Scholar] [CrossRef] [Scilit] [PubMed]
- Zhang, Y.H.; Belegu, V.; Zou, Y.; Wang, F.; Qian, B.J.; Liu, R.; Dai, P.; Zhao, W.; Gao, F.B.; Wang, L.; et al. Endoplasmic Reticulum Protein 29 Protects Axotomized Neurons from Apoptosis and Promotes Neuronal Regeneration Associated with Erk Signal. Mol. Neurobiol. 2015, 52, 522–532. [Google Scholar] [CrossRef] [Scilit] [PubMed]
- Lu, T.; Xie, F.; Huang, C.; Zhou, L.; Lai, K.; Gong, Y.; Li, Z.; Li, L.; Liang, J.; Cong, Q.; et al. ERp29 Attenuates Nicotine-Induced Endoplasmic Reticulum Stress and Inhibits Choroidal Neovascularization. Int. J. Mol. Sci. 2023, 24, 15523. [Google Scholar] [CrossRef] [Scilit] [PubMed]
- Brecker, M.; Khakhina, S.; Schubert, T.J.; Thompson, Z.; Rubenstein, R.C. The Probable, Possible, and Novel Functions of ERp29. Front. Physiol. 2020, 11, 574339. [Google Scholar] [CrossRef] [Scilit] [PubMed]
- Ghosh, S.; Kraus, K.; Biswas, A.; Muller, J.; Buhl, A.L.; Forin, F.; Singer, H.; Honing, K.; Hornung, V.; Watzka, M.; et al. GGCX mutations show different responses to vitamin K thereby determining the severity of the hemorrhagic phenotype in VKCFD1 patients. J. Thromb. Haemost. 2021, 19, 1412–1424. [Google Scholar] [CrossRef] [Scilit] [PubMed]
- Campens, L.; Vanakker, O.M.; Trachet, B.; Segers, P.; Leroy, B.P.; De Zaeytijd, J.; Voet, D.; De Paepe, A.; De Backer, T.; De Backer, J. Characterization of cardiovascular involvement in pseudoxanthoma elasticum families. Arterioscler. Thromb. Vasc. Biol. 2013, 33, 2646–2652. [Google Scholar] [CrossRef] [Scilit] [PubMed]
- Gusdorf, L.; Mitcov, M.; Maradeix, S.; Cunat, S.; Martin, L.; Cribier, B. Pseudoxanthoma elasticum-like disease with deficiency of vitamin K-dependent clotting factors and cutis laxa features. Ann. Dermatol. Venereol. 2016, 143, 279–283. [Google Scholar] [CrossRef] [Scilit] [PubMed]
- McArthur, S.; Juban, G.; Gobbetti, T.; Desgeorges, T.; Theret, M.; Gondin, J.; Toller-Kawahisa, J.E.; Reutelingsperger, C.P.; Chazaud, B.; Perretti, M.; et al. Annexin A1 drives macrophage skewing to accelerate muscle regeneration through AMPK activation. J. Clin. Investig. 2020, 130, 1156–1167. [Google Scholar] [CrossRef] [Scilit] [PubMed]
- Haitjema, S.; Meddens, C.A.; van der Laan, S.W.; Kofink, D.; Harakalova, M.; Tragante, V.; Foroughi Asl, H.; van Setten, J.; Brandt, M.M.; Bis, J.C.; et al. Additional Candidate Genes for Human Atherosclerotic Disease Identified Through Annotation Based on Chromatin Organization. Circ. Cardiovasc. Genet. 2017, 10, e001664. [Google Scholar] [CrossRef] [Scilit] [PubMed]
- Tian, X.; Teng, J.; Chen, J. New insights regarding SNARE proteins in autophagosome-lysosome fusion. Autophagy 2021, 17, 2680–2688. [Google Scholar] [CrossRef] [Scilit] [PubMed]
- Zhang, K.; Chen, J.; Zhu, Z.; Hu, H.; Zhang, Q.; Jia, R.; Wang, N.; Xiang, S.; Zhou, Y.; Wang, Y.; et al. CD74 Blockade Disrupts Endothelial Migrasome Signaling to Prevent Inflammatory Macrophage Differentiation and Inhibit Atherosclerotic Progression. Adv. Sci. 2025, 12, e02838. [Google Scholar] [CrossRef] [Scilit] [PubMed]
- Yu, J.; Li, S.; Chen, D.; Liu, D.; Guo, H.; Yang, C.; Zhang, W.; Zhang, L.; Zhao, G.; Tu, X.; et al. SIRPα-Fc fusion protein IMM01 exhibits dual anti-tumor activities by targeting CD47/SIRPα signal pathway via blocking the “don’t eat me” signal and activating the “eat me” signal. J. Hematol. Oncol. 2022, 15, 167. [Google Scholar] [CrossRef] [Scilit] [PubMed]
- Lakhotia, R.; Melani, C.; Pittaluga, S.; Gordon, M.J.; Phelan, J.D.; Muppidi, J.R.; Tadese, A.; Evans, S.; Jaffe, E.S.; Staudt, L.M.; et al. The anti-CD47 antibody magrolimab with obinutuzumab and venetoclax in relapsed or refractory indolent B-cell lymphomas. Br. J. Haematol. 2025, 207, 612–618. [Google Scholar] [CrossRef] [Scilit] [PubMed]
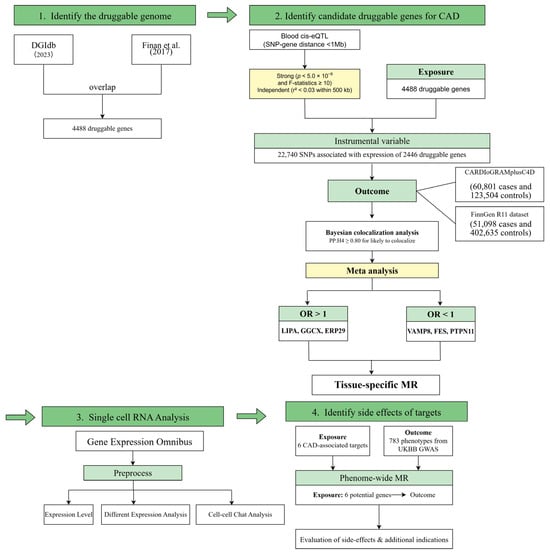
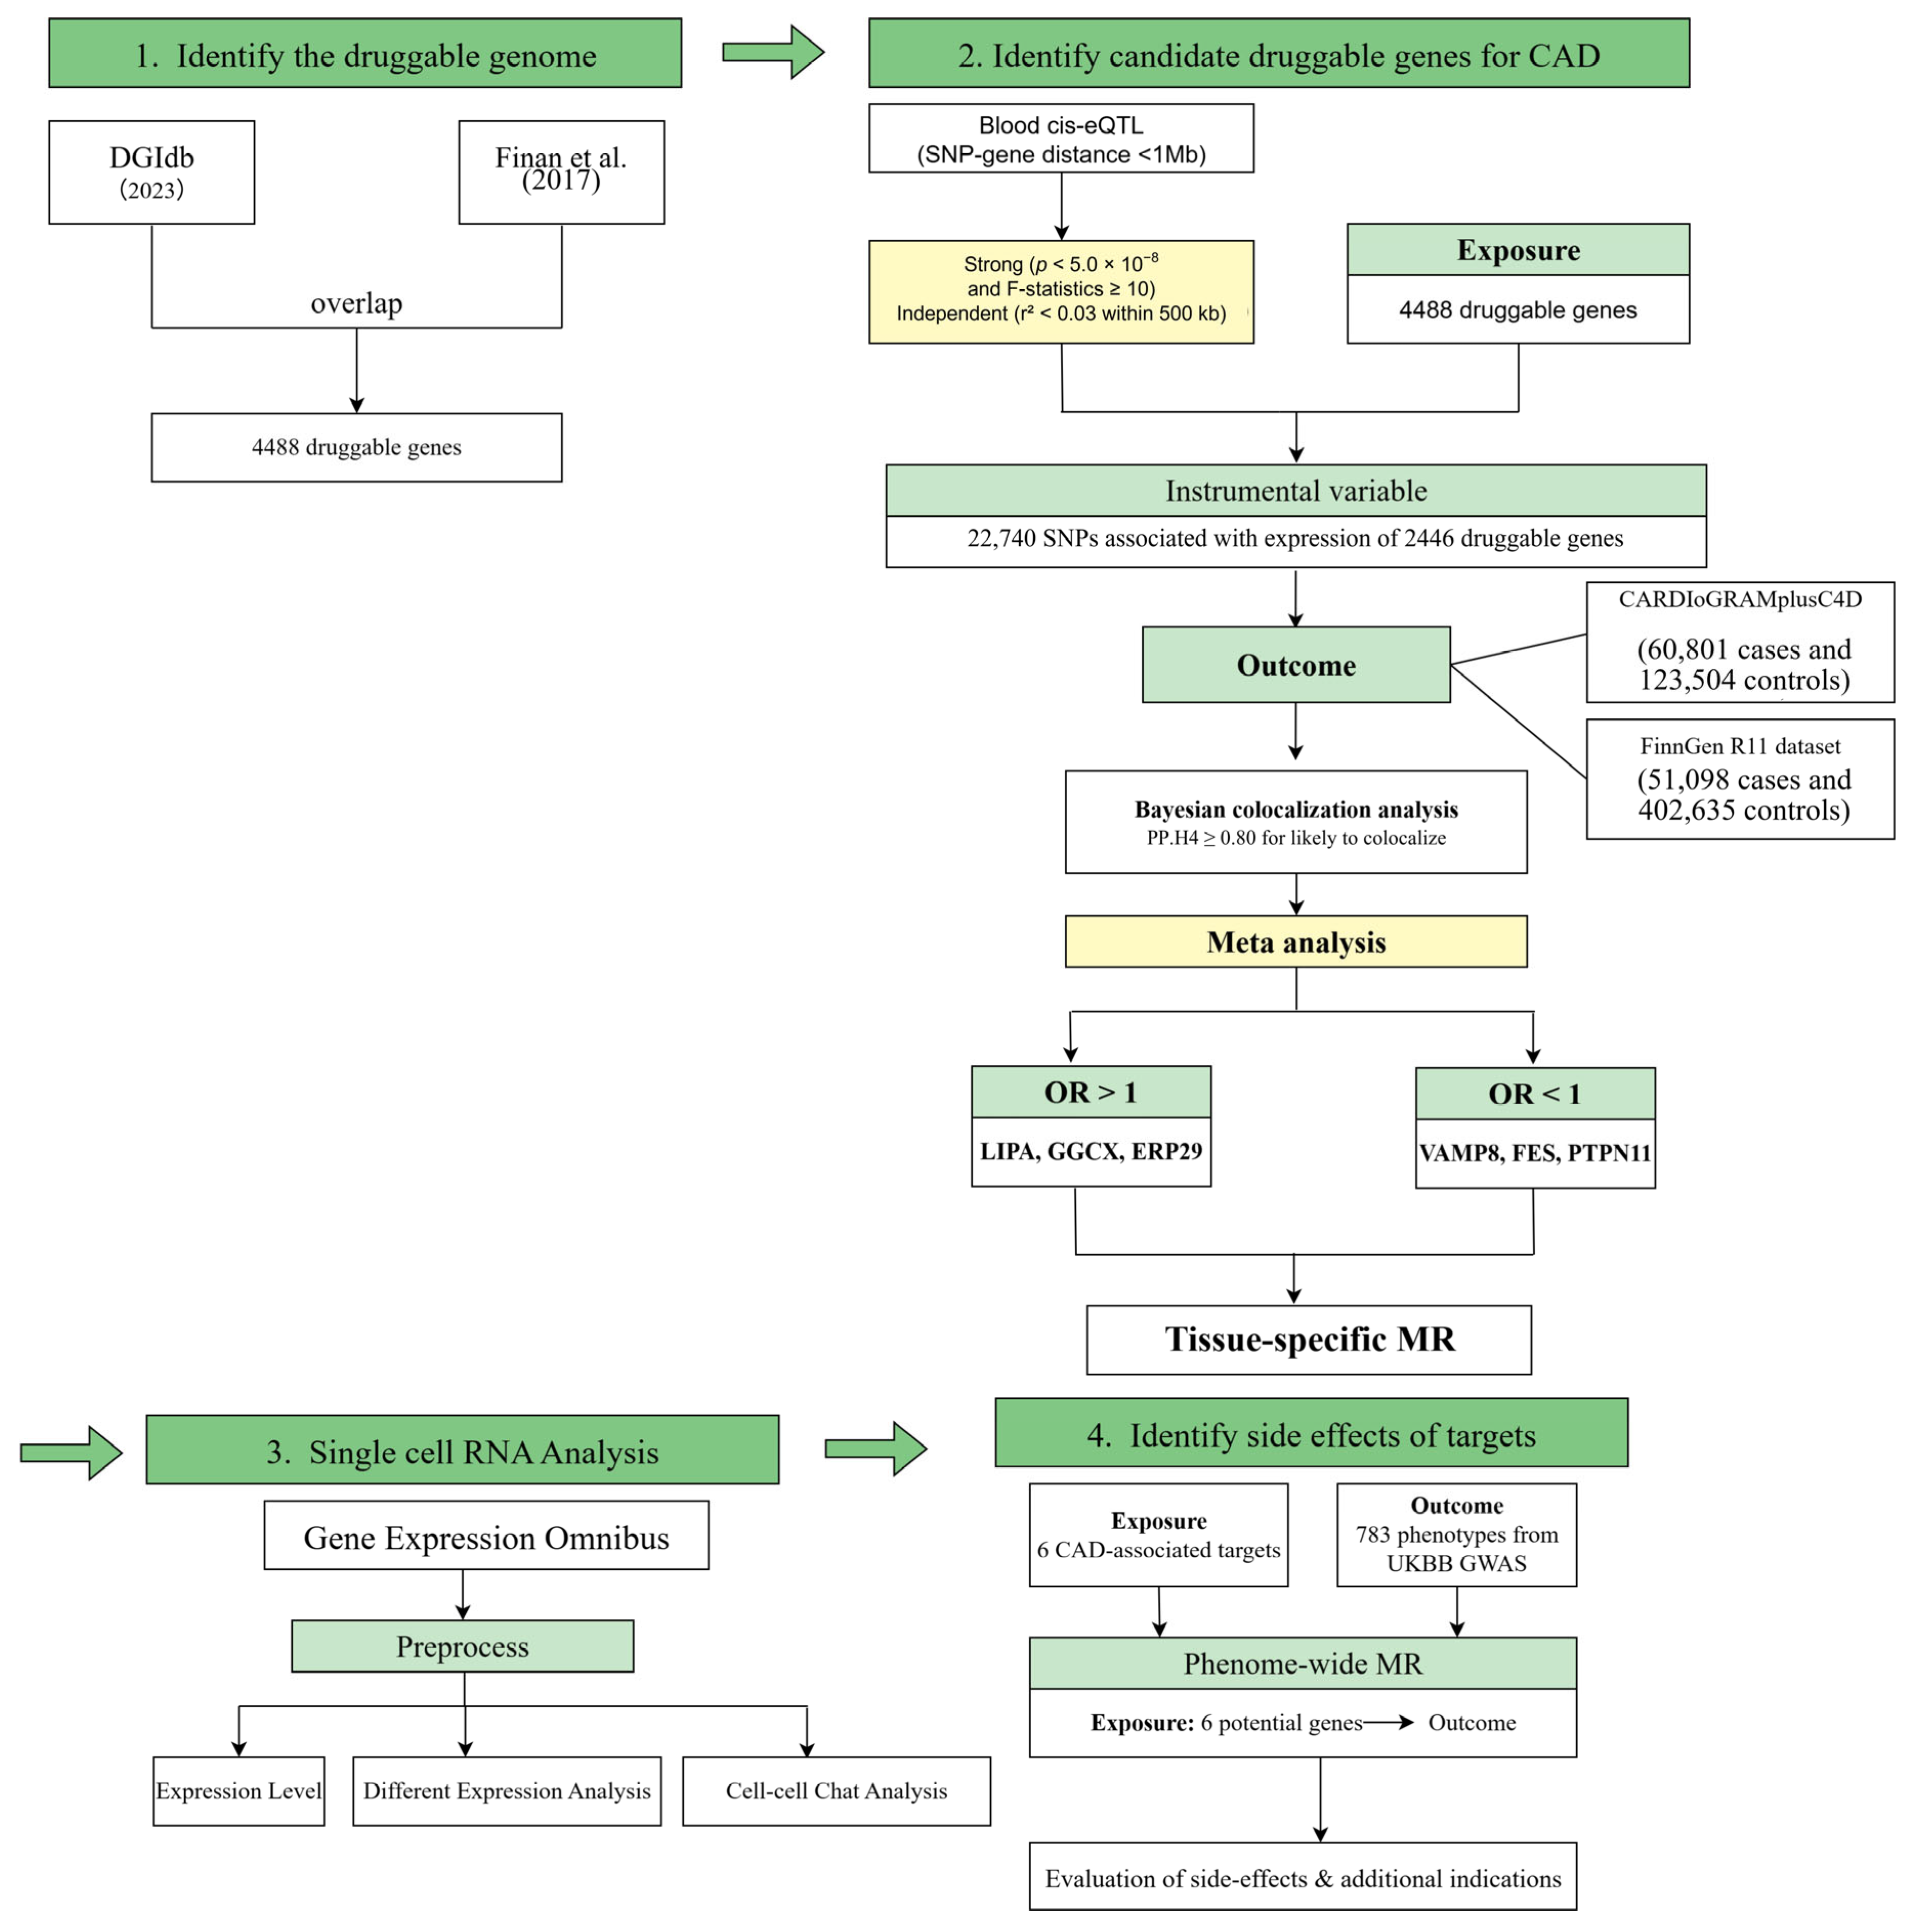
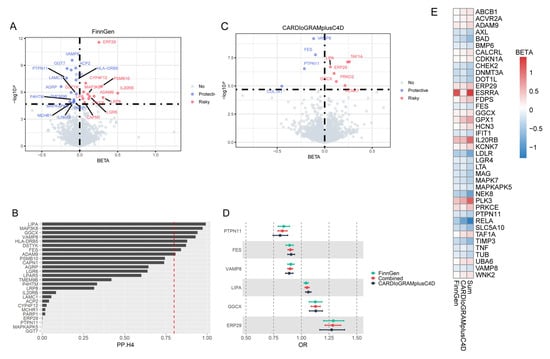
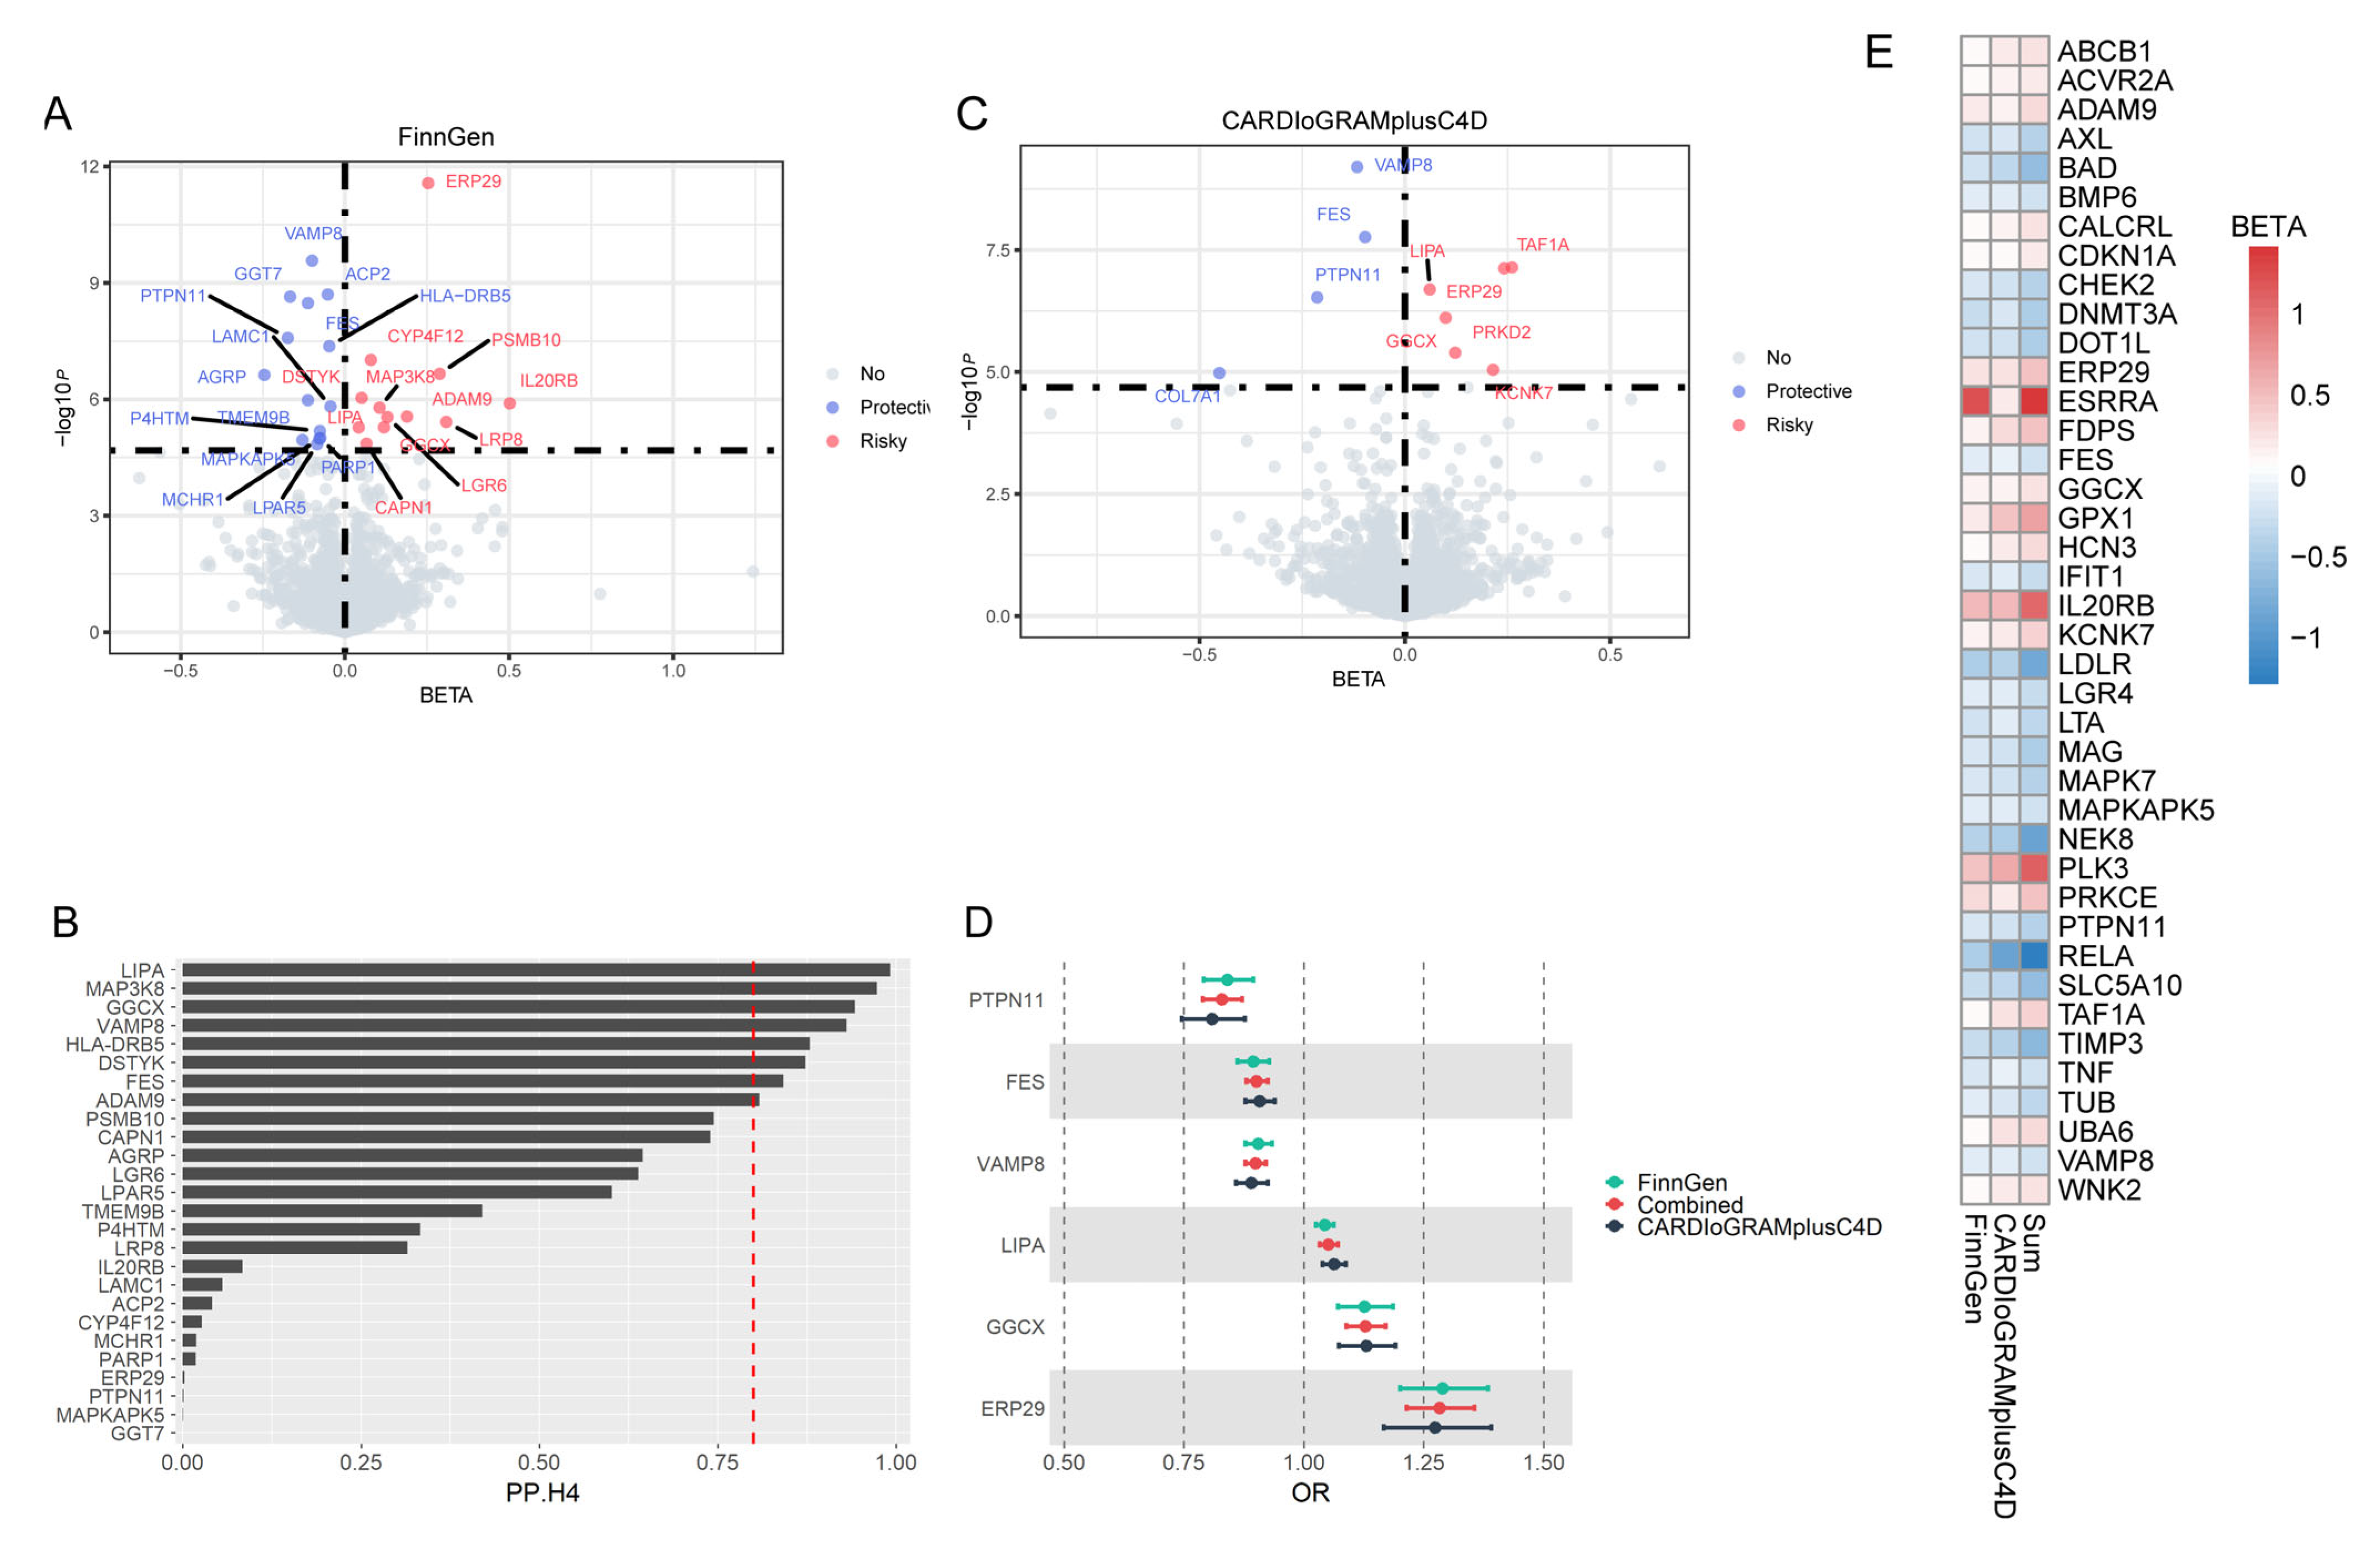
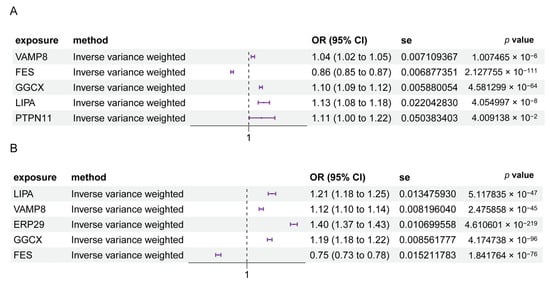
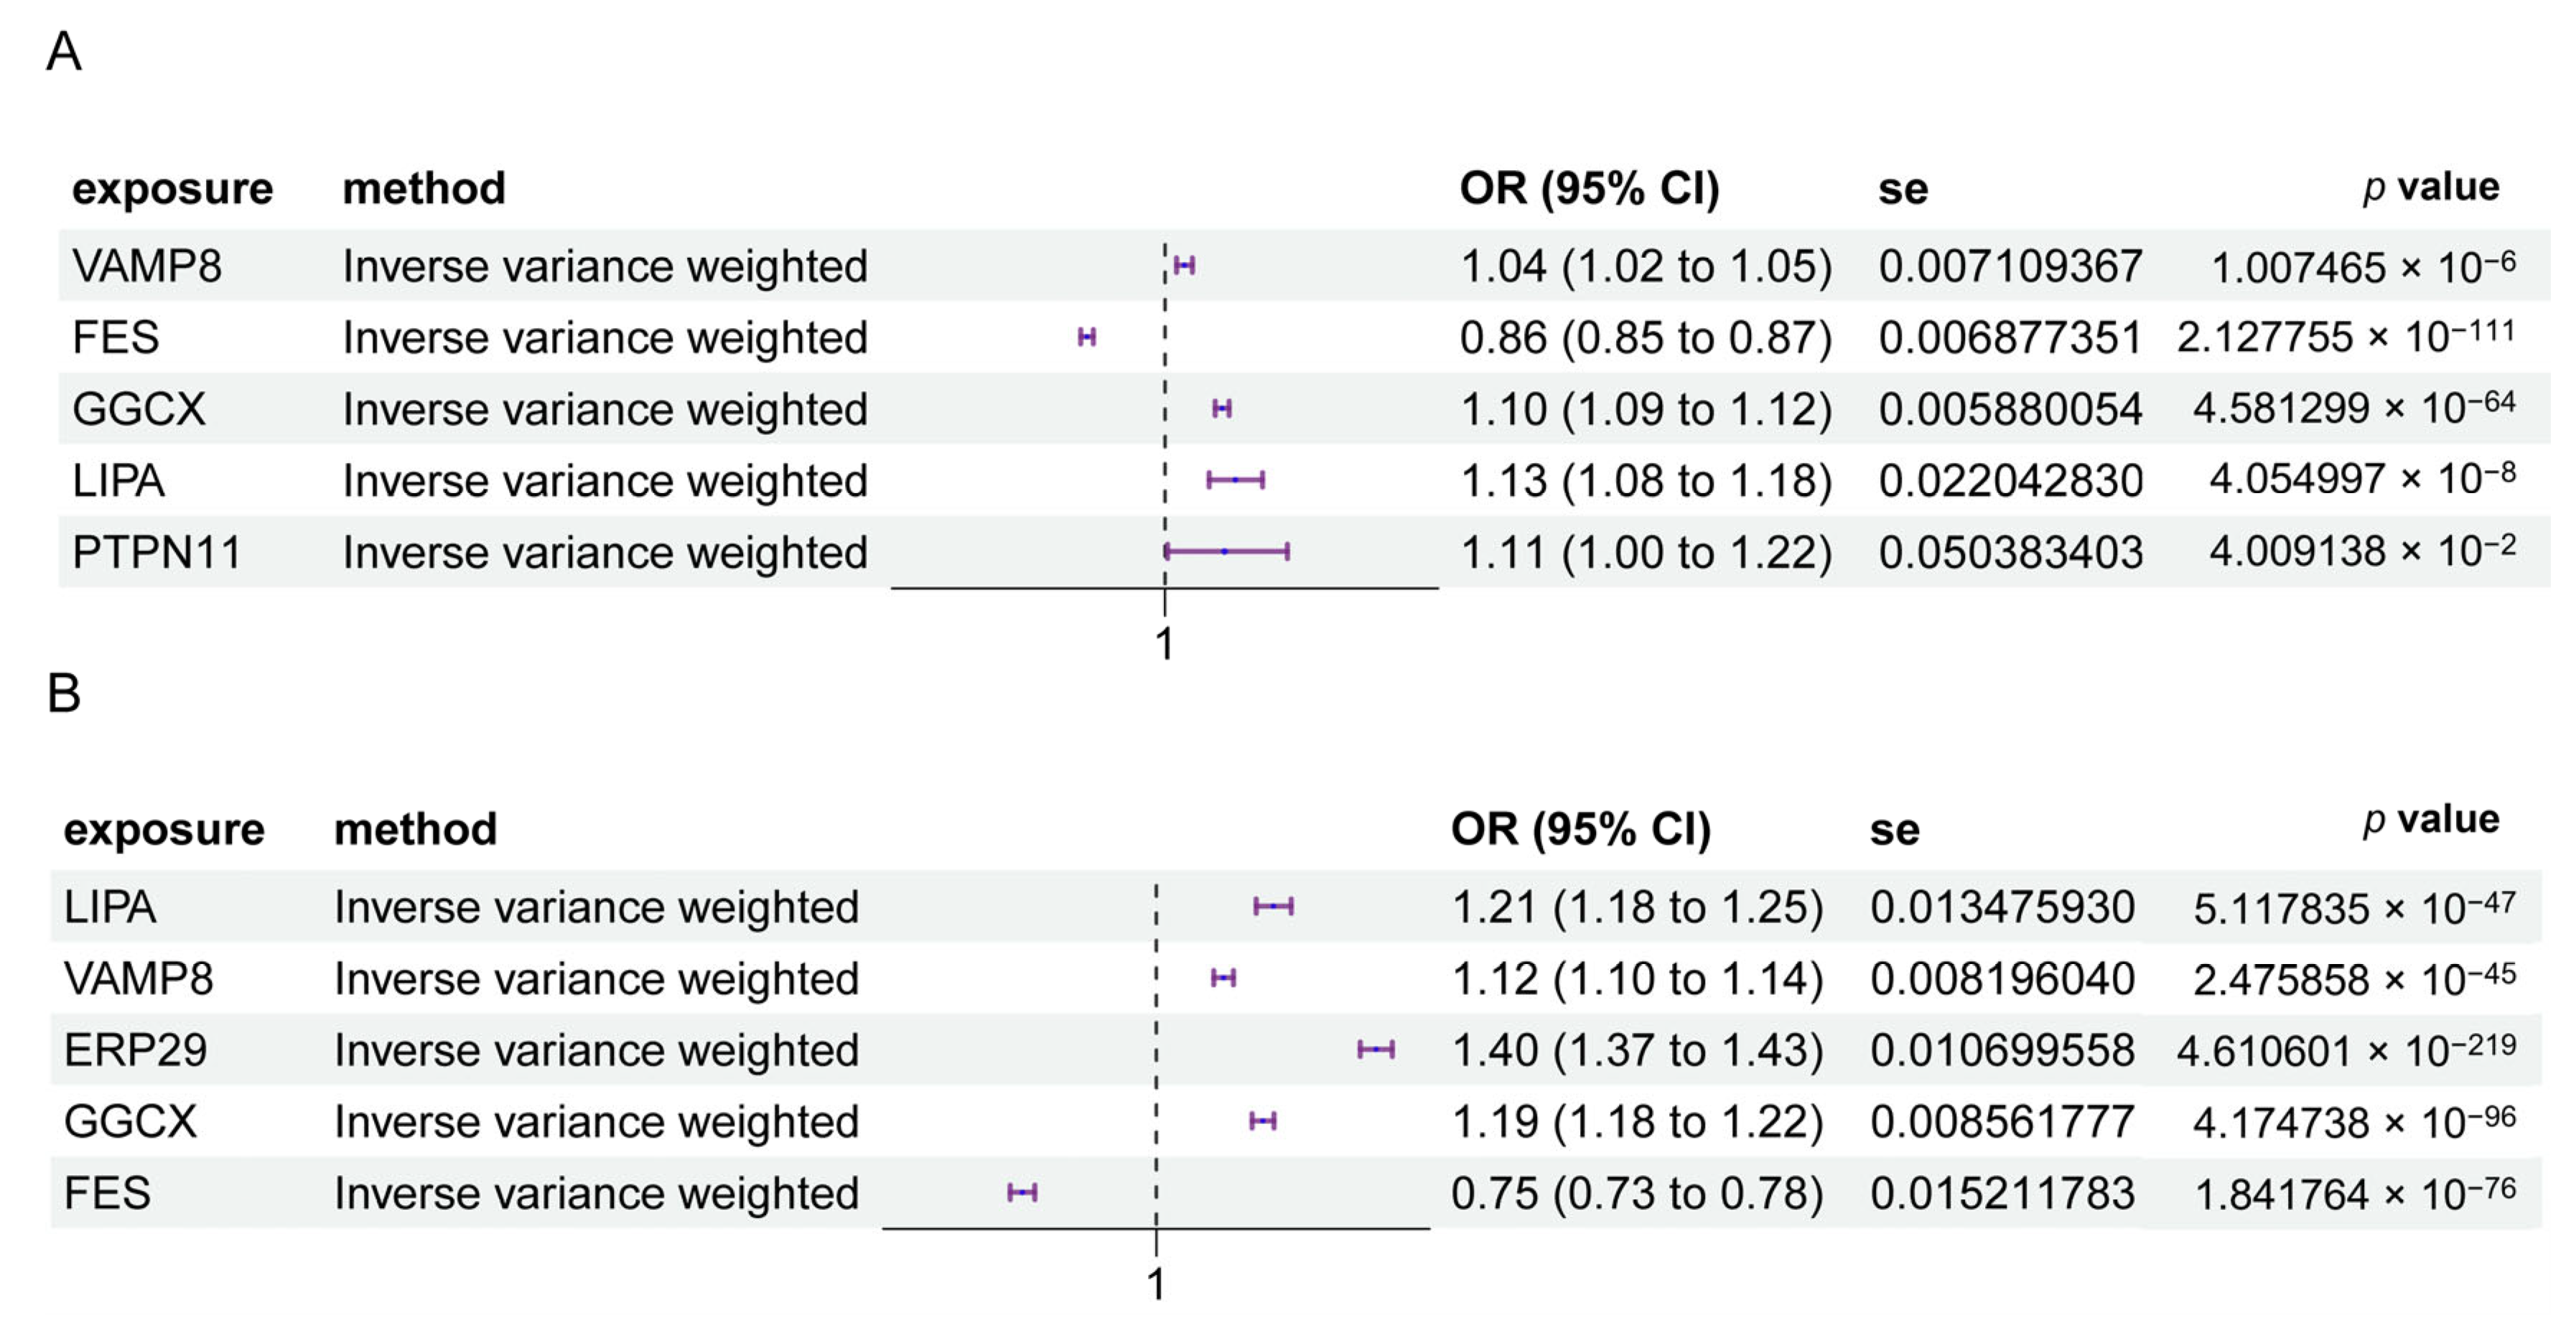
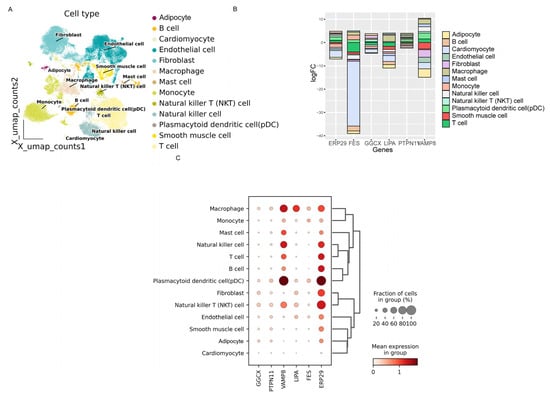
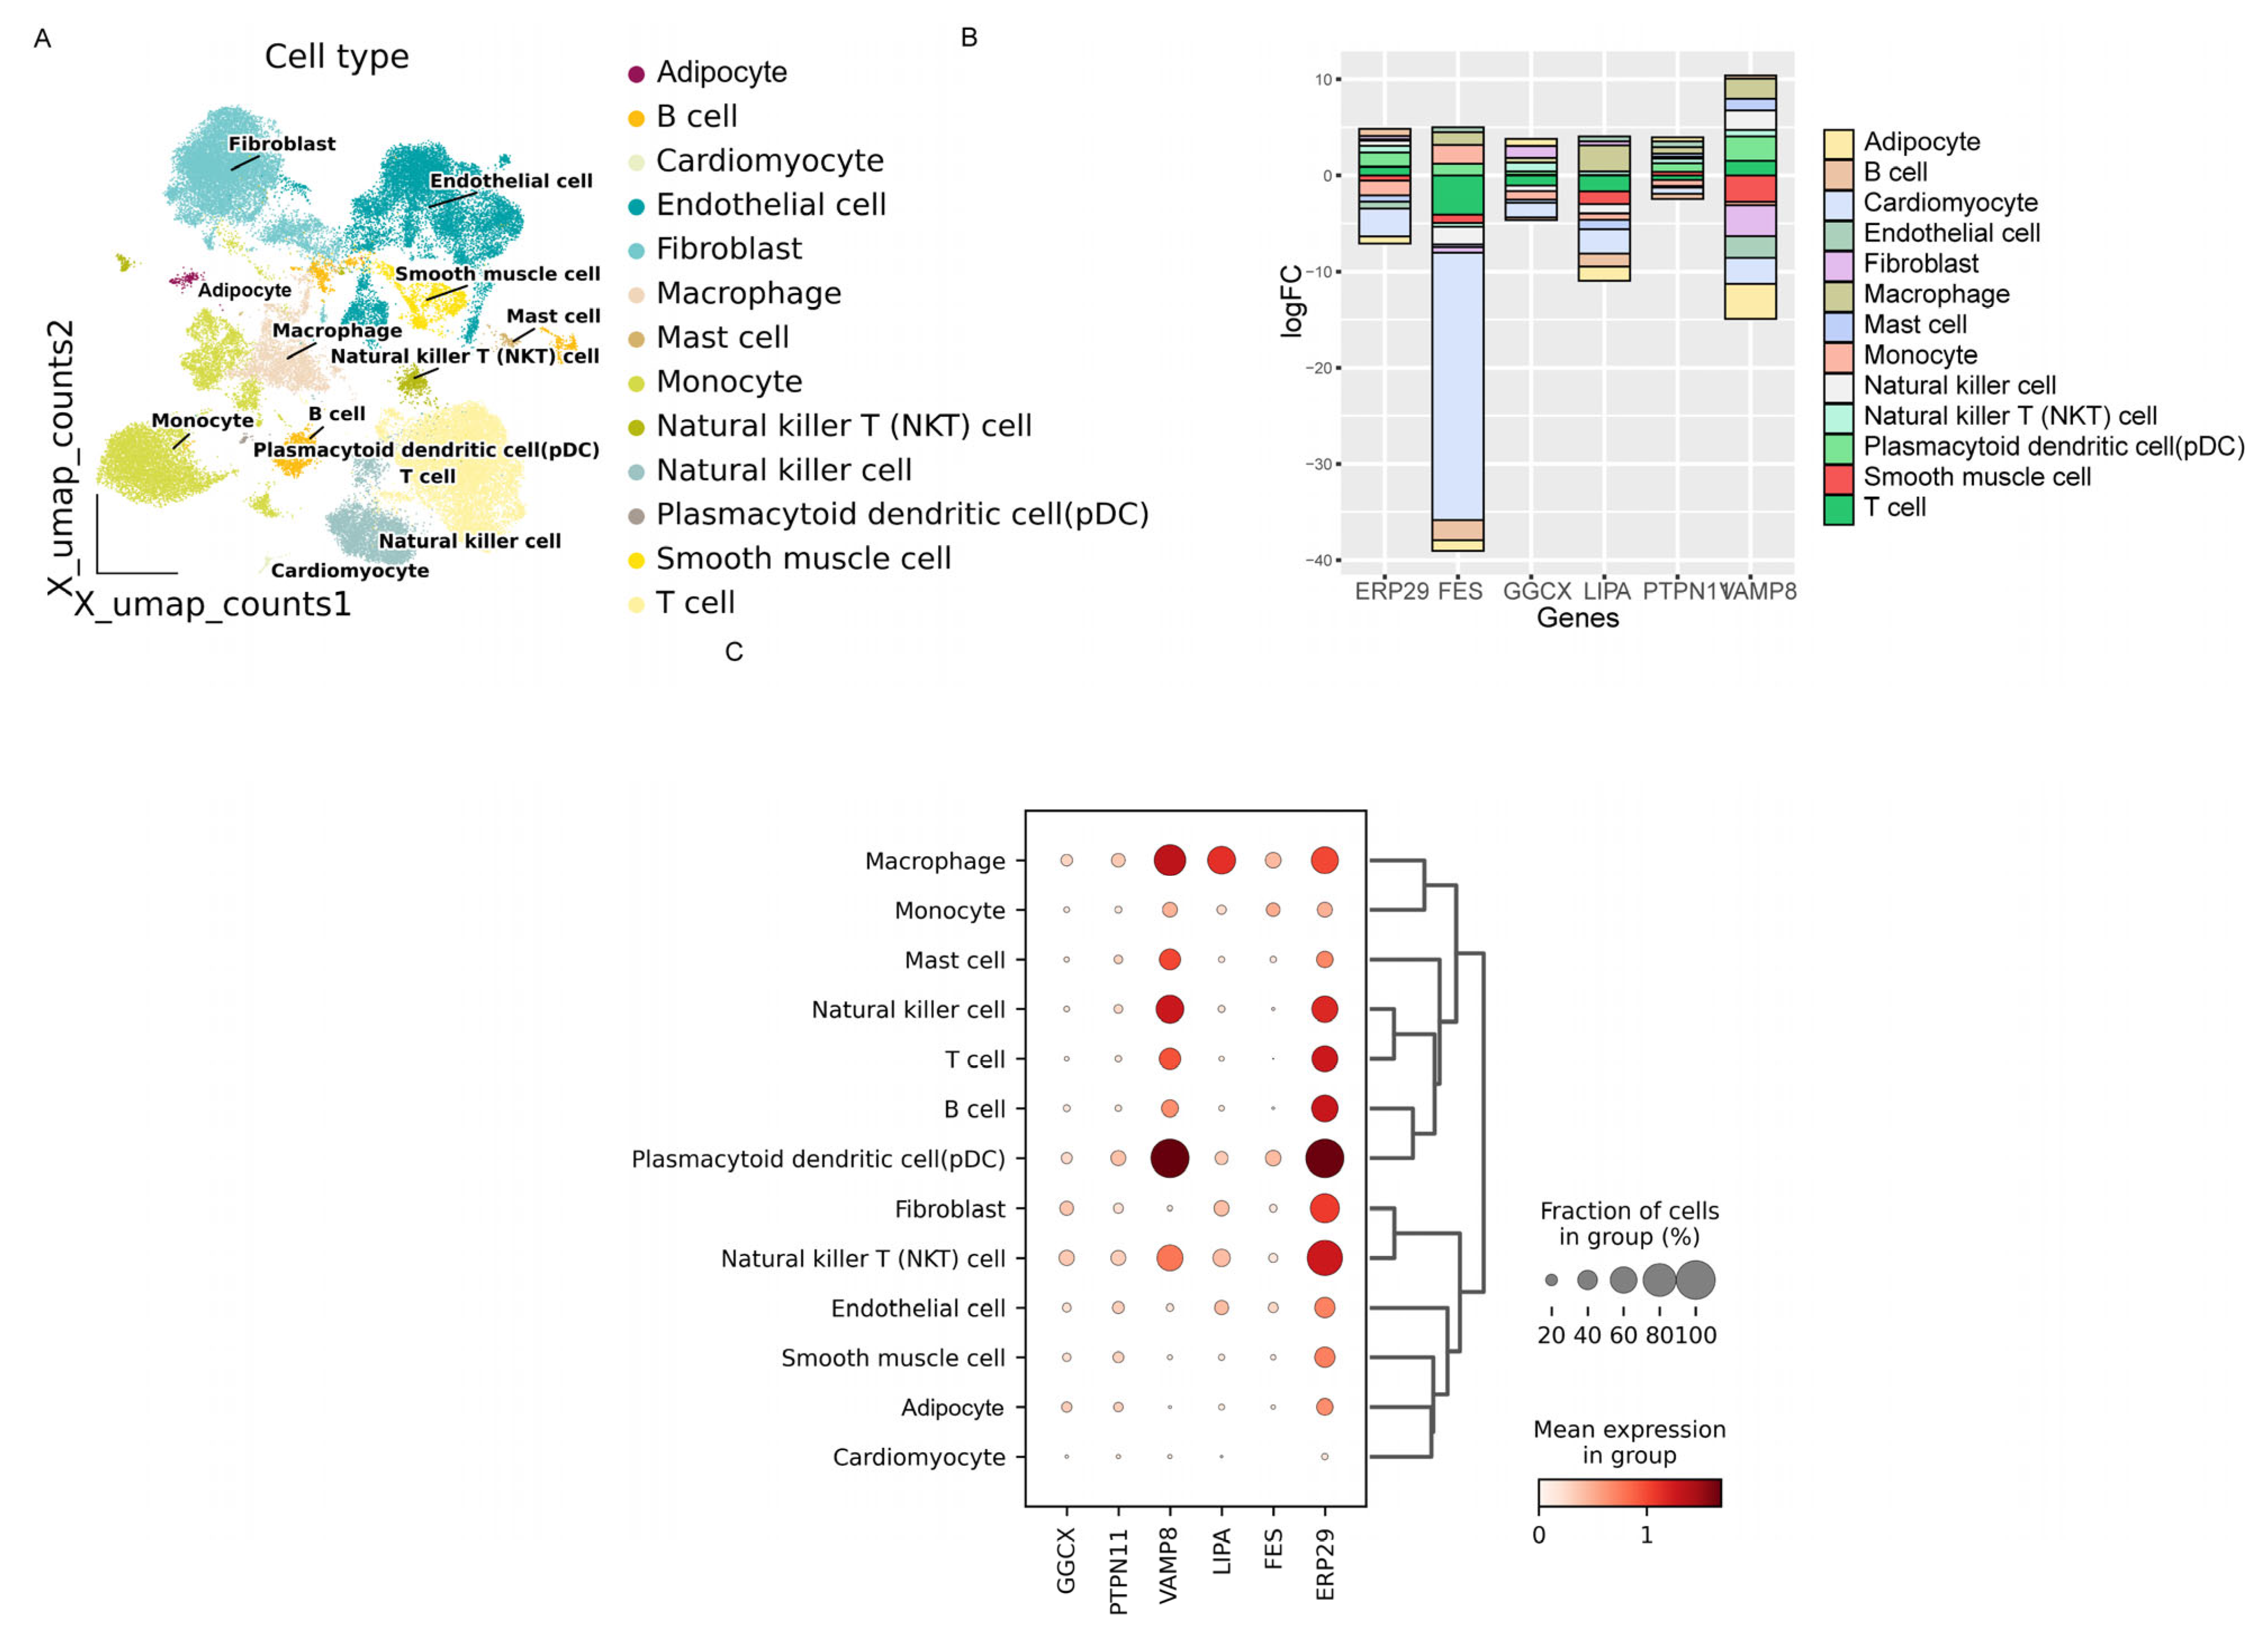
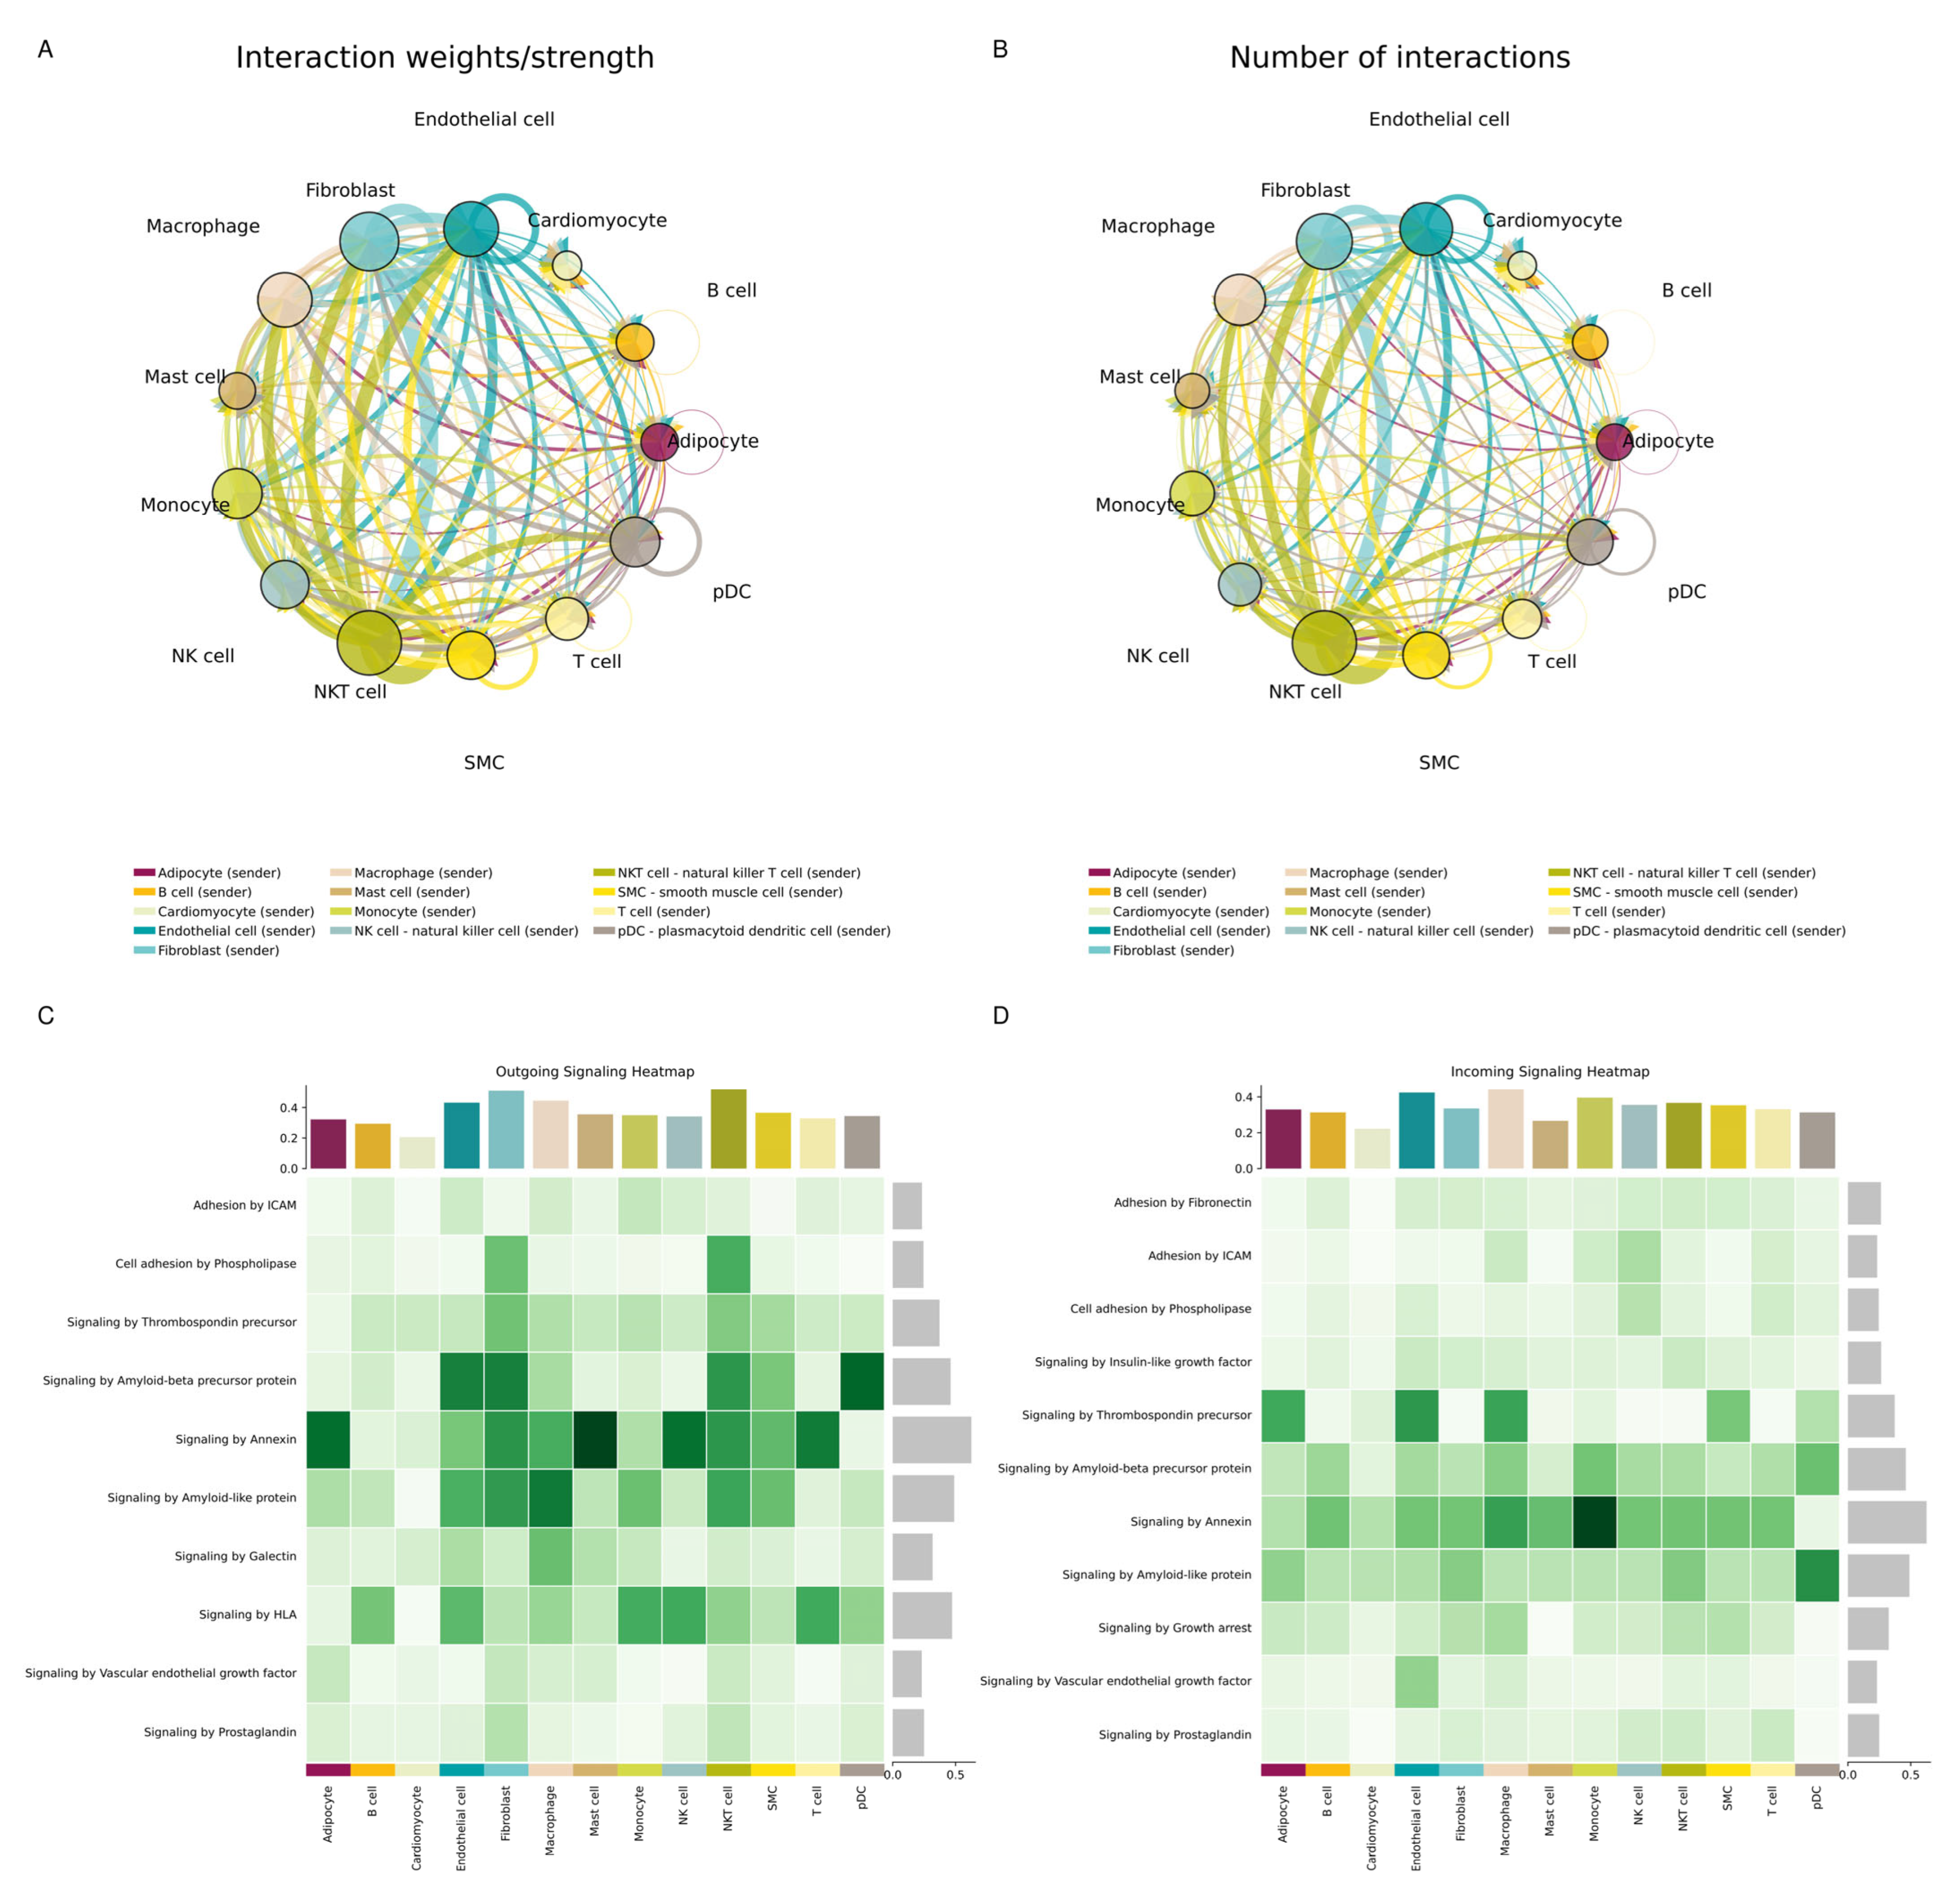
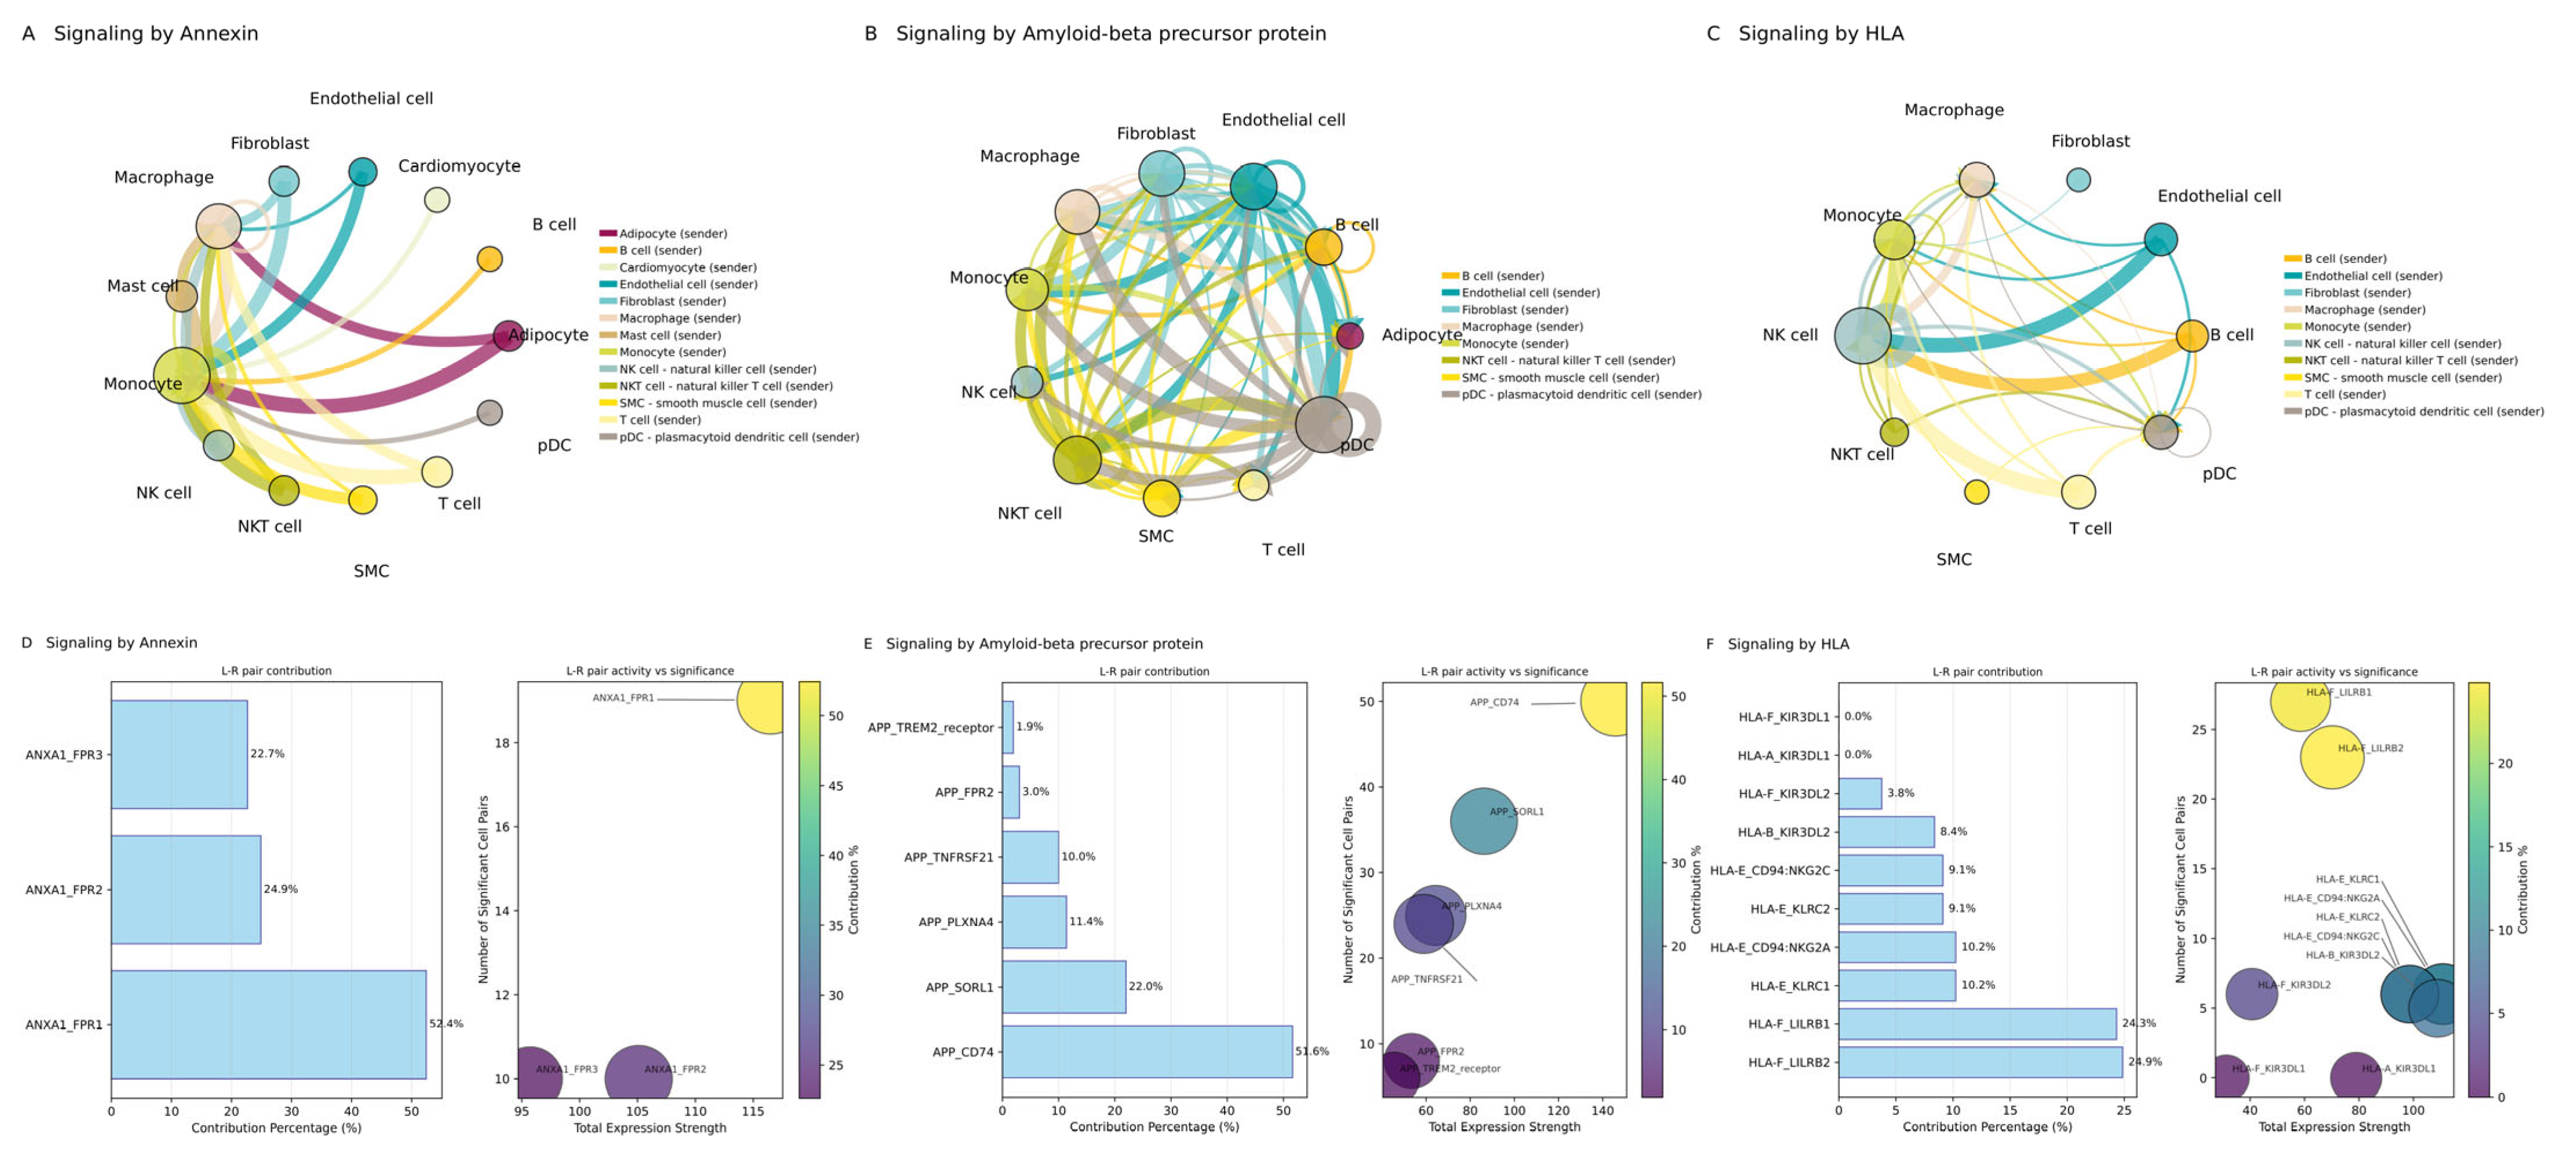
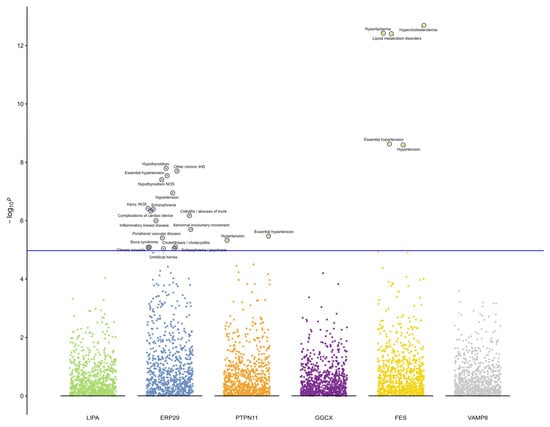
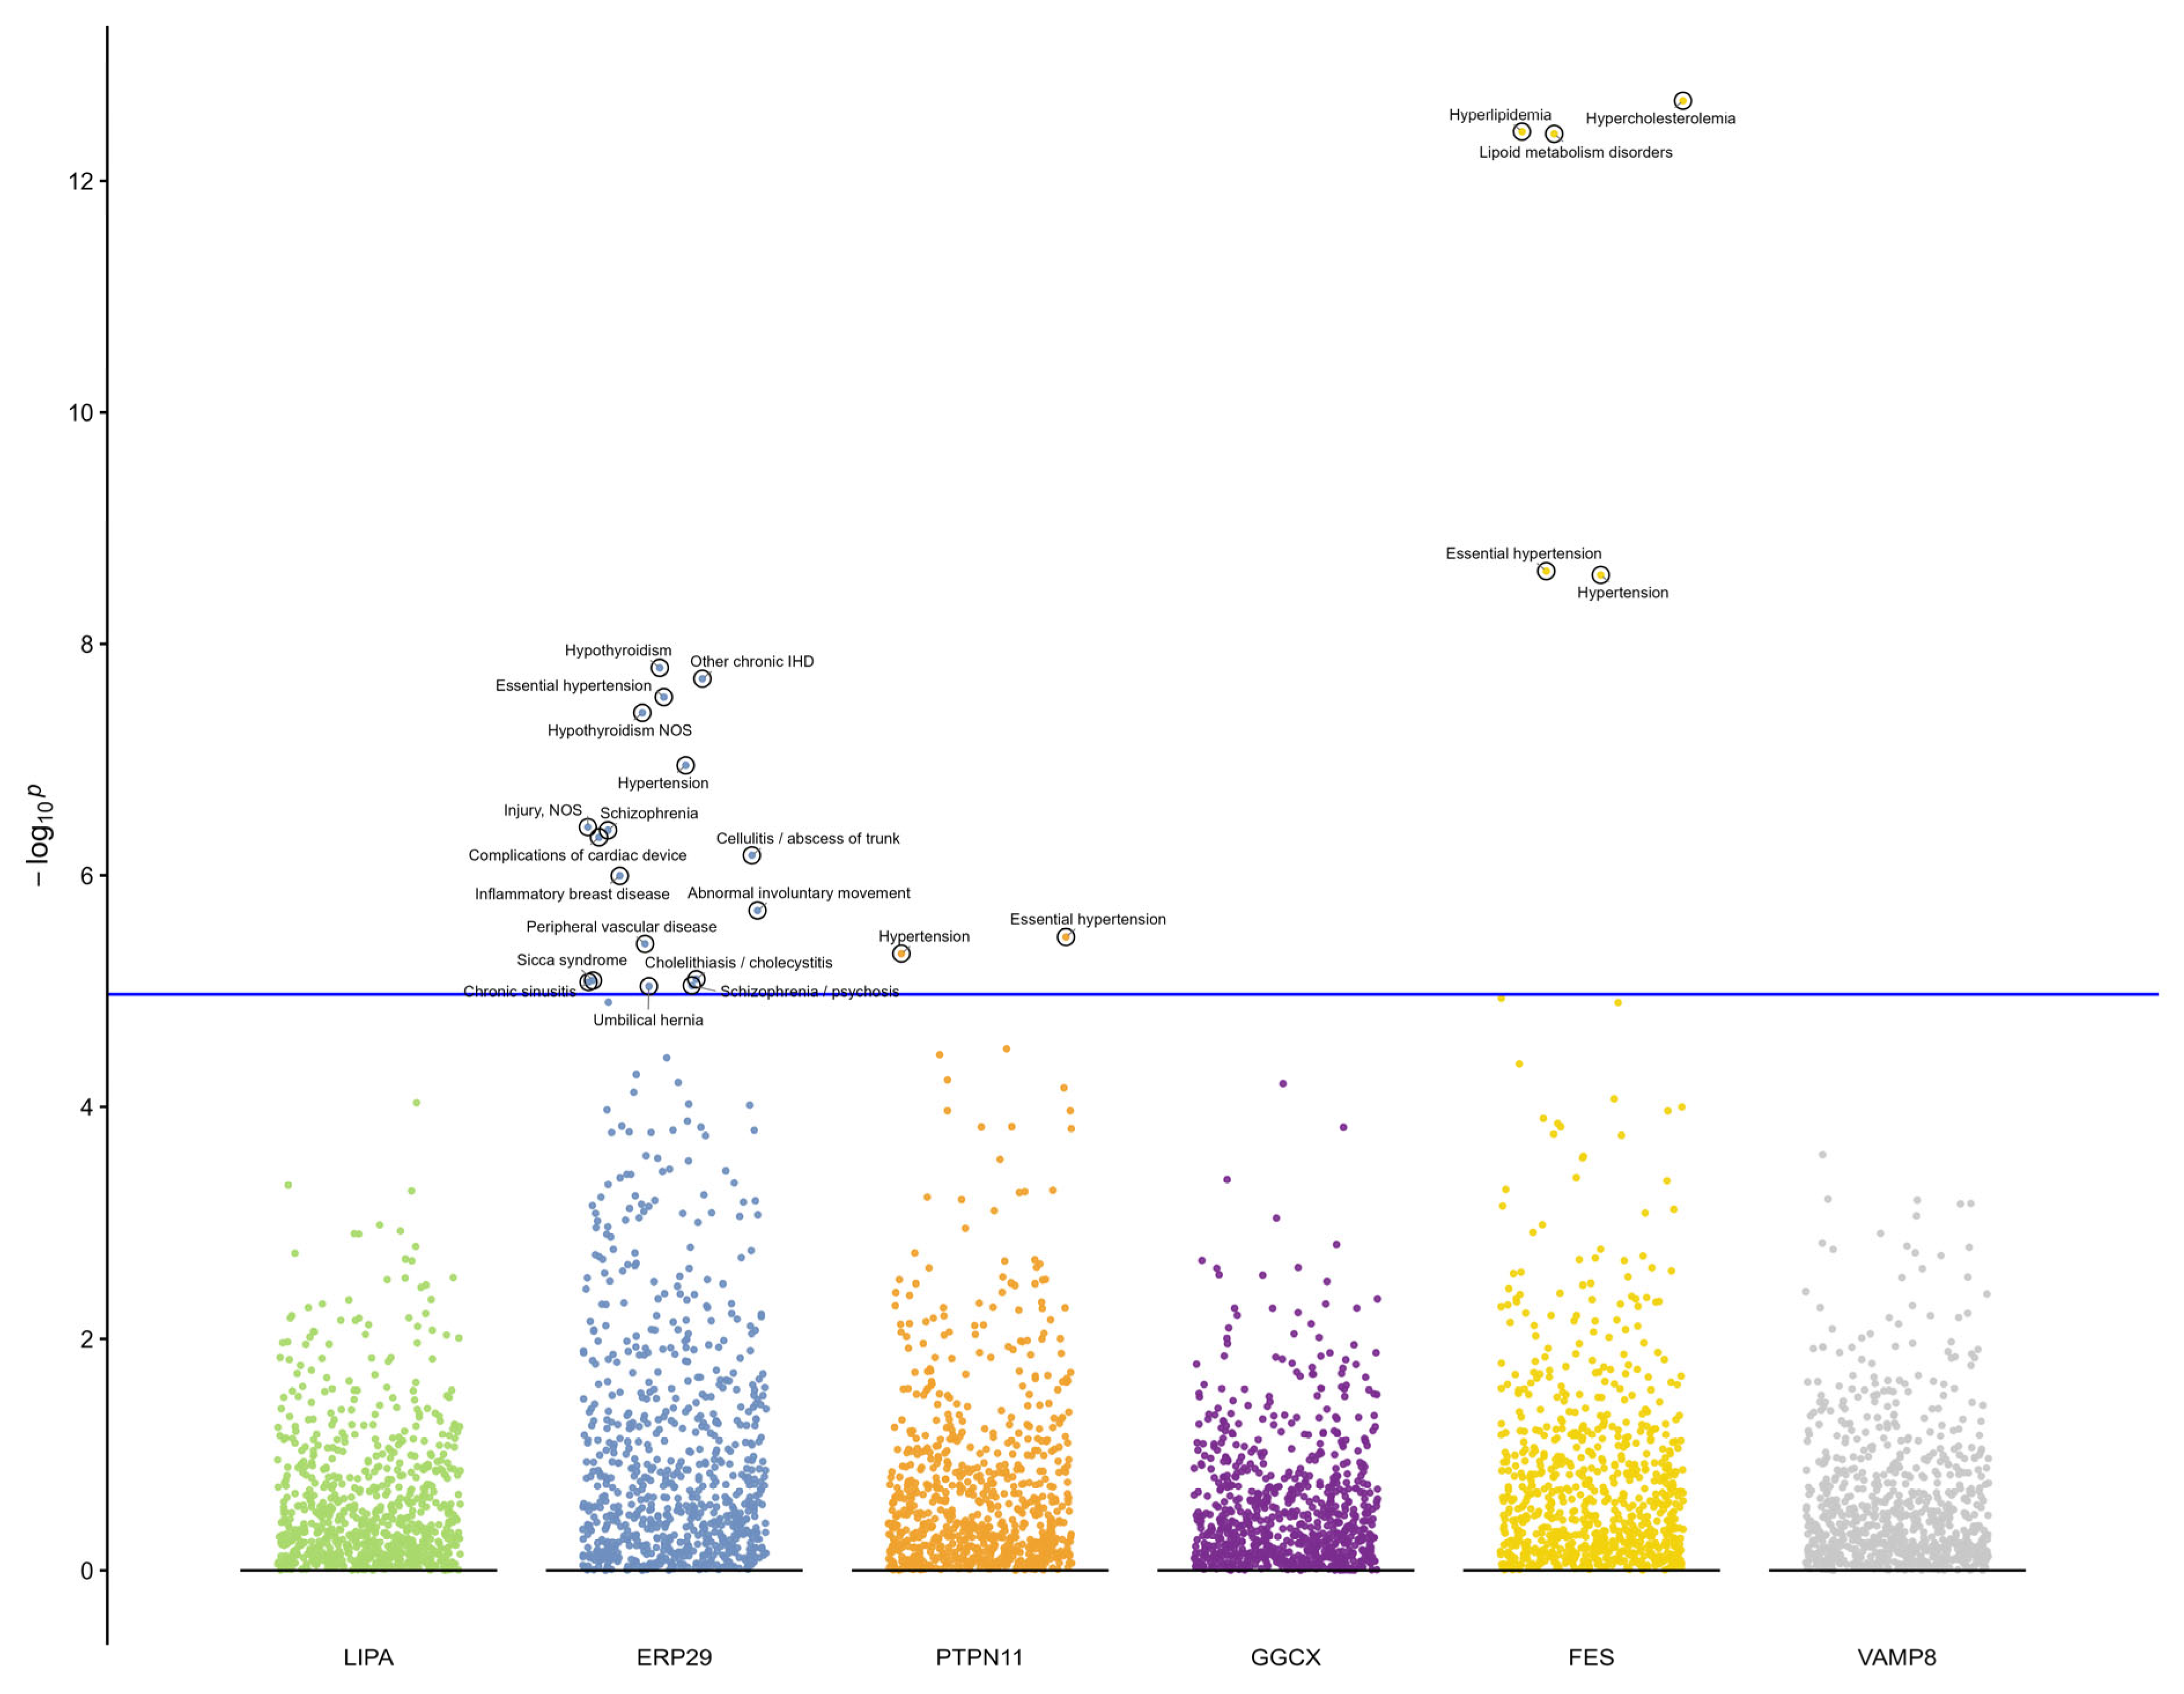
Disclaimer/Publisher’s Note: The statements, opinions and data contained in all publications are solely those of the individual author(s) and contributor(s) and not of MDPI and/or the editor(s). MDPI and/or the editor(s) disclaim responsibility for any injury to people or property resulting from any ideas, methods, instructions or products referred to in the content. |
© 2026 by the authors. Licensee MDPI, Basel, Switzerland. This article is an open access article distributed under the terms and conditions of the Creative Commons Attribution (CC BY) license.