


Abstract
Background: Hyperuricemia is an adverse effect frequently observed during favipiravir treatment. The time course, from uric acid elevation to recovery, and quantitative relationship between drug exposure and changes in serum uric acid levels remain insufficiently characterized. We investigated the pharmacodynamic mechanism of uric acid elevation and described its time course by population pharmacokinetic and pharmacodynamic modelling. Methods: Patients who received favipiravir for coronavirus disease 2019 or severe fever with thrombocytopenia syndrome were retrospectively evaluated. The pharmacokinetics of favipiravir were described by a one-compartment model with first-order absorption and elimination. Metabolite concentrations were predicted based on previously reported values. Changes in serum uric acid levels were described by a turnover model with zero-order production and first-order elimination. The drug effect was implemented as inhibition of the uric acid elimination process. Simulations based on the final model were performed for 10 consecutive days after the clinical regimen, with a 21-day follow-up. Results: The final model supported the inhibition of uric acid elimination by favipiravir and its metabolite. Regarding simulations, serum uric acid levels reached a median peak of 6.93 mg/dL at 6.7 days after treatment initiation and returned to pre-treatment levels within 4.0 days after treatment discontinuation. Conclusions: This combined population pharmacokinetic and pharmacodynamic turnover model quantified favipiravir-associated increases in serum uric acid levels and showed a transient profile with rapid recovery after drug discontinuation. These findings underscore the need for monitoring serum uric acid levels during favipiravir treatment, particularly in patients at a higher risk of gout.
1. Introduction
Favipiravir (FPV) is a broad-spectrum antiviral agent that inhibits the RNA-dependent RNA polymerase of RNA viruses [1,2,3]. As the catalytic domain of RNA-dependent RNA polymerase is conserved among multiple RNA viruses, FPV exhibits antiviral activity against a wide range of RNA viruses [1]. In Japan, FPV was approved in 2014 for treating novel or re-emerging influenza virus infections, limited to cases in which other anti-influenza agents are ineffective or insufficient [4,5]. During the coronavirus disease 2019 (COVID-19) pandemic, FPV was administered in clinical and observational studies in Japan and other countries [2]. In 2024, FPV was approved in Japan as an antiviral agent for severe fever with thrombocytopenia syndrome (SFTS) [4].
FPV is well absorbed from the gastrointestinal tract after oral administration [5]. It is primarily metabolized to the favipiravir hydroxide (metabolite 1; M1) by hepatic aldehyde oxidase with partial contribution of xanthine oxidase, followed by renal excretion [5]. FPV alters its pharmacokinetics via aldehyde oxidase auto-inhibition. As a result, exposure may vary depending on dose and duration [5]. Interindividual differences in aldehyde oxidase activity may contribute to the variability in plasma FPV concentrations. Pharmacokinetic studies in patients with COVID-19 reported substantial interindividual variability in FPV exposure [6,7]. In severe cases, the trough concentrations were frequently below the lower limit of quantification. Patients with mild-to-moderate disease exhibited marked decreases in trough concentrations and area under the curve (AUC) between days 2 and 4 after treatment initiation [6,7].
Serum uric acid homeostasis is maintained by a balance between urate production and excretion, and urate is mainly eliminated via the kidneys [8,9,10]. Particularly, multiple transporters in the renal proximal tubule contribute to urate reabsorption and secretion, including reabsorption via urate transporter 1 and transport via organic anion transporters 1 and 3, which are involved in regulation of serum uric acid levels [8,10,11]. Hyperuricemia is frequently observed as a common adverse effect of FPV treatment [4,12]. As a potential mechanism, FPV and M1 have been reported to affect urate transporters such as urate transporter 1 and organic anion transporters 1 and 3, potentially reducing urate excretion [5,12]. In clinical studies including patients with COVID-19, baseline serum uric acid level (UAbase) and steady-state FPV concentrations were associated with uric acid elevation [13,14]. However, the longitudinal time course of uric acid elevation and recovery after FPV administration has not been well characterized, and quantitative pharmacokinetic and pharmacodynamic analysis linking FPV exposure to changes in serum uric acid levels remains limited. The aims of the present study were (i) to perform a population pharmacokinetic and pharmacodynamic analysis of FPV and evaluate the association between exposure and changes in serum uric acid levels and (ii) to characterize the time course of elevation of serum uric acid levels and recovery after FPV administration.
2. Results
2.1. Patients and Data Sources
A summary of patient characteristics is presented in Table 1. A total of 23 patients, consisting of 12 male and 11 female patients, who received FPV and 92 observed FPV concentrations were included in the final analysis. The median age, total body weight, and administration period were 69 years, 68 kg, and 13 days, respectively.
Table 1.
Demographics and clinical data of patients receiving favipiravir.
2.2. Population Pharmacokinetics
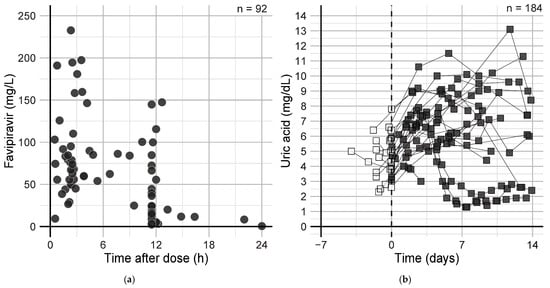
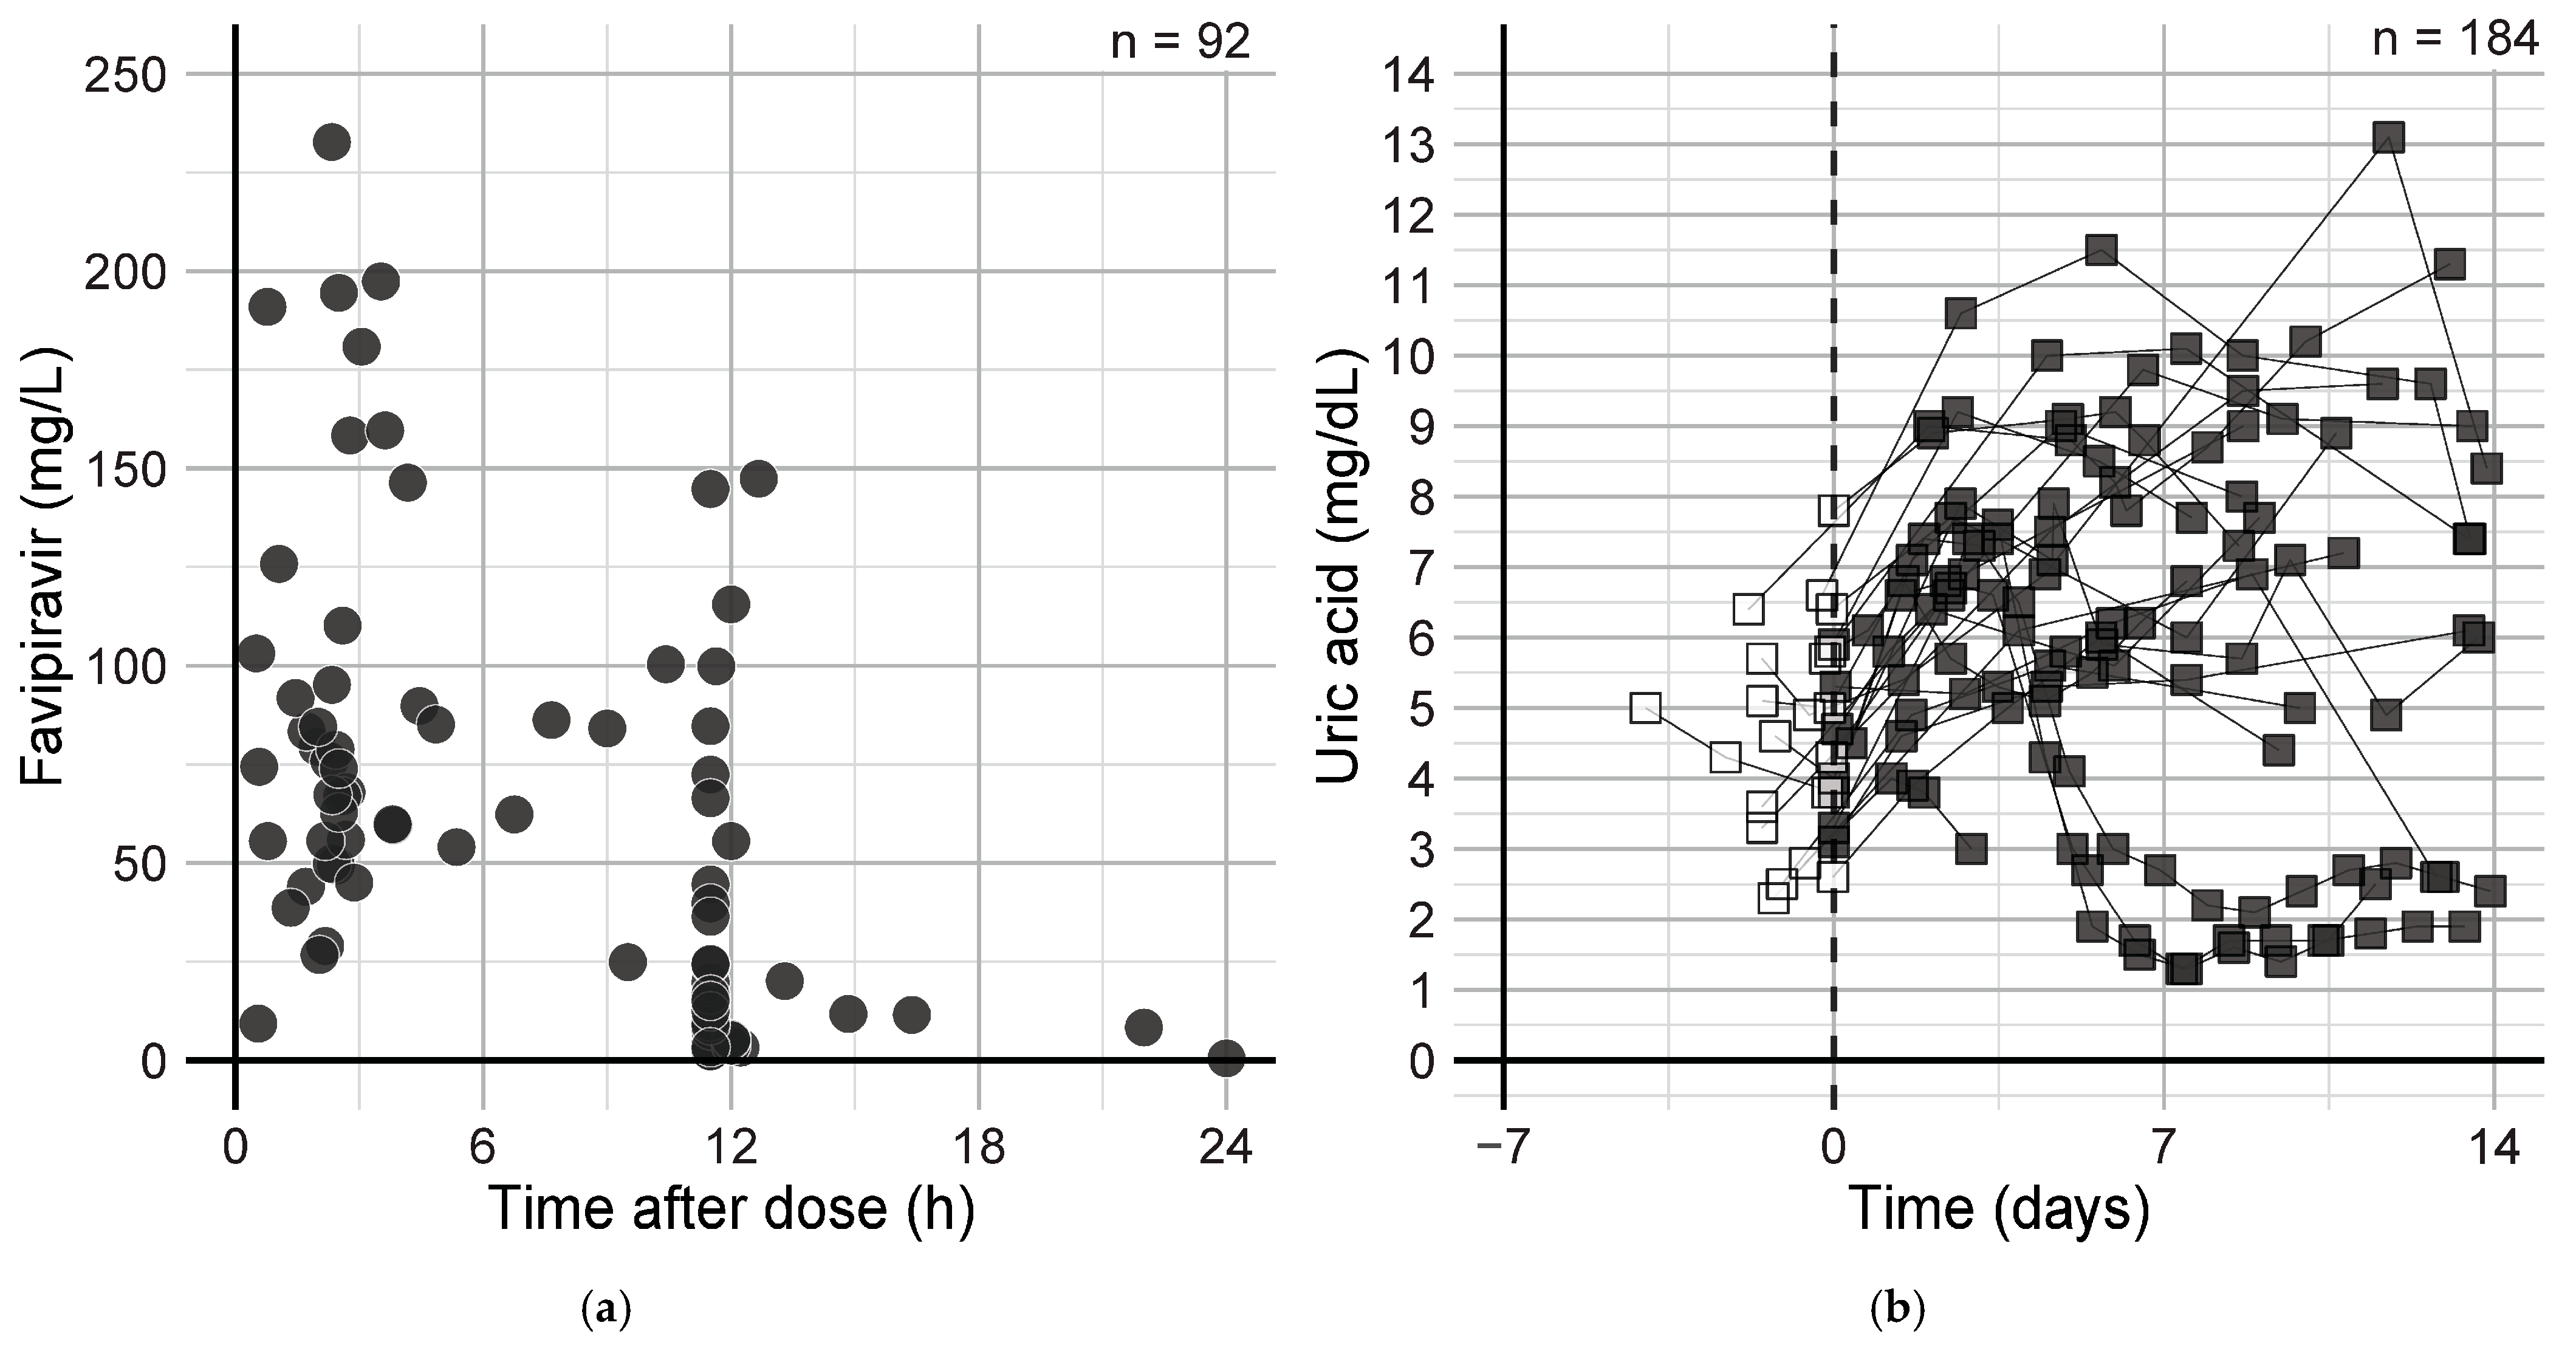
The time course of observed FPV concentrations before and after dosing is shown in Figure 1a. Alanine aminotransferase was evaluated as a covariate on CLFPV/F. However, no statistically significant improvement was observed (ΔOFV = 0.631, df = 1, p = 0.427). Similarly, age was not statistically significant (ΔOFV = 0.004, df = 1, p = 0.950). The final pharmacokinetic model parameters are shown in Equation (1).
Figure 1.
Observed favipiravir concentrations and longitudinal uric acid profiles before and after treatment initiation: (a) Scatter plot of observed favipiravir concentrations (mg/L) versus time after dose (h) (n = 92). (b) Individual patient uric acid measurements (mg/dL) plotted against time (days) (n = 184). Day 0 (dashed line) indicates treatment initiation. Open and filled squares represent pre-treatment and post-treatment values, respectively. Repeated measurements from the same patient are connected by lines to depict within-patient trajectories across treatment initiation.
Goodness-of-fit plots based on the final pharmacokinetic model are shown in Supplementary Figure S1. Predicted FPV concentrations were consistent with observed concentrations (Figure S1a,b), and the plots were distributed close to the trend line at y = x. R2 values for these plots were 0.505 (a) and 0.788 (b). Most conditional weighted residuals fall within ±3 and were evenly distributed around y = 0 (Figure S1c,d) [15]. η-shrinkage for the final model was 5.37% for CLFPV/F.
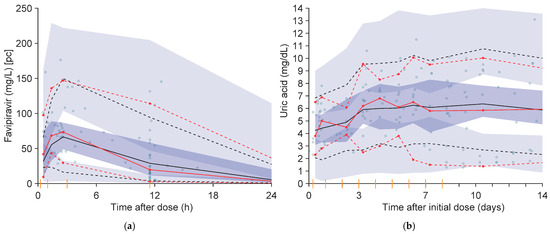
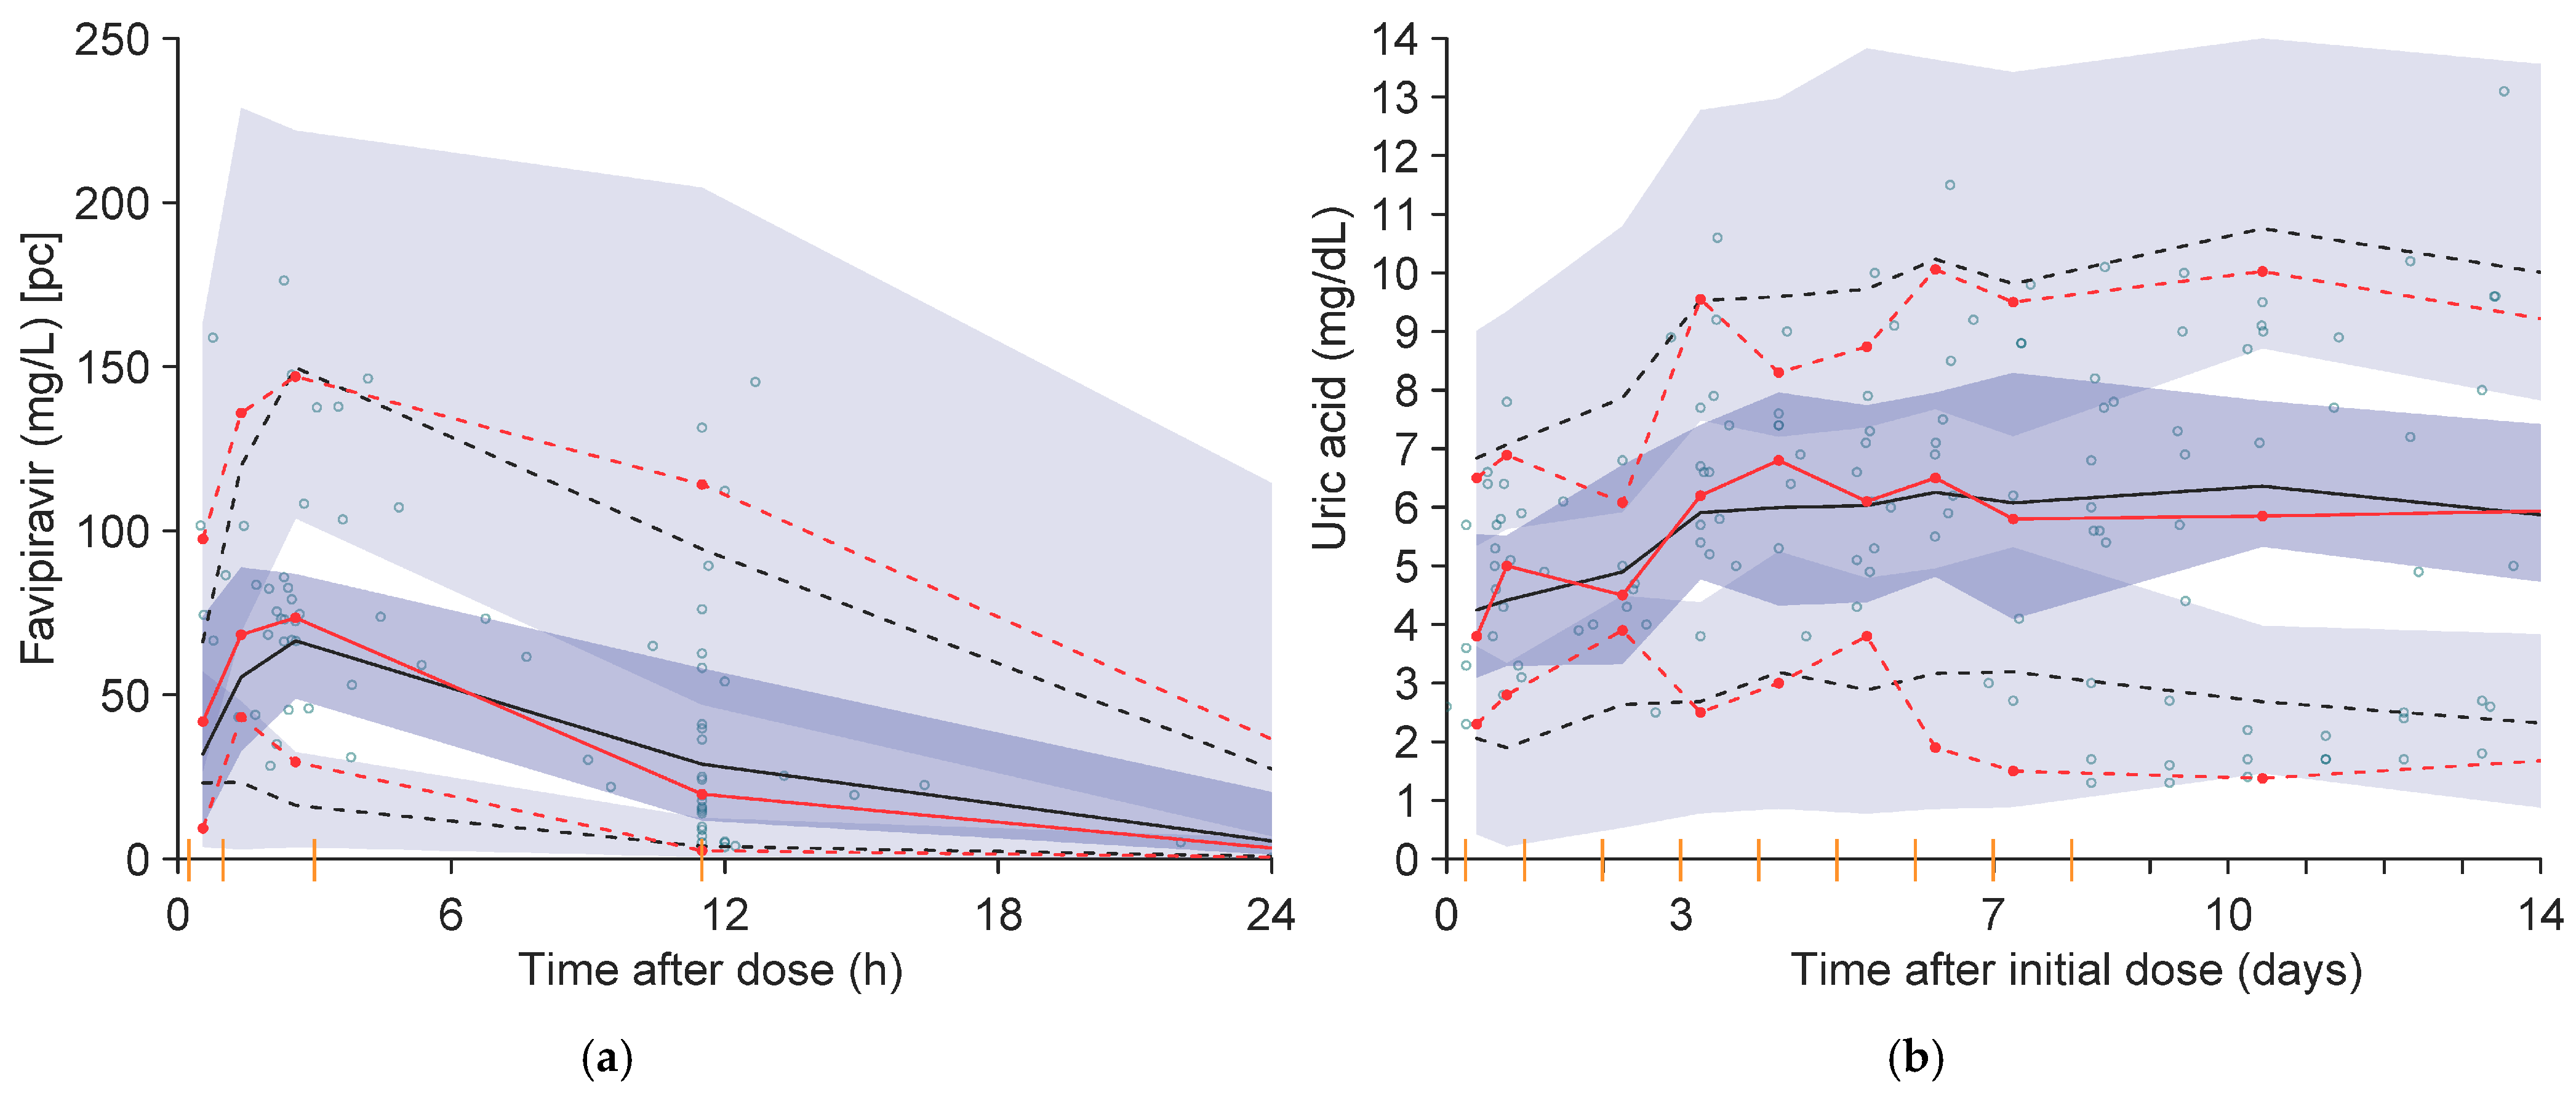
The bootstrap results are shown in Table 2. All final pharmacokinetic parameter estimates were similar to the average of the bootstrap distributions and fell within the empirical bootstrap 95th percentiles. No marked imprecision was found in the RSE%. Model evaluation by pcVPC also confirmed acceptable agreement between the observed data and the model-based simulated values (Figure 2a). The median of the observed values was within the 95% CI of the predicted values.
Table 2.
Comparison of population pharmacokinetic and pharmacodynamic parameter estimates for the final model with estimates from 500 bootstrap samples.
Figure 2.
Visual predictive check (VPC) based on the final population parameter estimates: (a) Prediction-corrected VPC (pcVPC) for favipiravir concentrations. (b) Standard VPC for uric acid. Circles represent observations. Solid lines show the observed (red) and simulated (black) medians. Dashed lines show the 5th and 95th percentiles (central 90% interval) of the observations (red) and simulations (black). Shaded areas indicate the 95% confidence intervals of the simulated percentiles. The yellow lines on the x-axis show the mid-point of data bins used in the construction of the VPC.
2.3. Population Pharmacokinetic and Pharmacodynamic Modelling
The time course of serum uric acid levels is shown in Figure 1b. A total of 184 serum uric acid levels were available. UAbase was available for 18 of 23 patients, with a median value of 4.43 mg/dL. Only one patient had a pre-treatment serum uric acid level above the reported urate crystallization threshold (6.8 mg/dL) [16,17].
The Imax model was selected to describe inhibition of the uric acid elimination process. The linear model did not provide a significant improvement in model fit. The coefficient α was estimated to assess a potential synergistic contribution and was greater than zero. The model was then refitted with α fixed to 0 to assume additivity. The synergistic model did not provide a statistically significant improvement over the additive model (ΔOFV = 2.78, df = 1, p = 0.095), and the additive model was therefore retained.
The bootstrap results are shown in Table 2. The final pharmacodynamic parameter estimates were consistent with the bootstrap mean estimates and fell within the empirical 95% bootstrap percentile range. No marked imprecision was found in the %RSE. The standard VPC showed acceptable agreement between the observed data and model-based simulations (Figure 2b). The median of the observed values fell within the 95% CI of the predictions.
2.4. Simulation
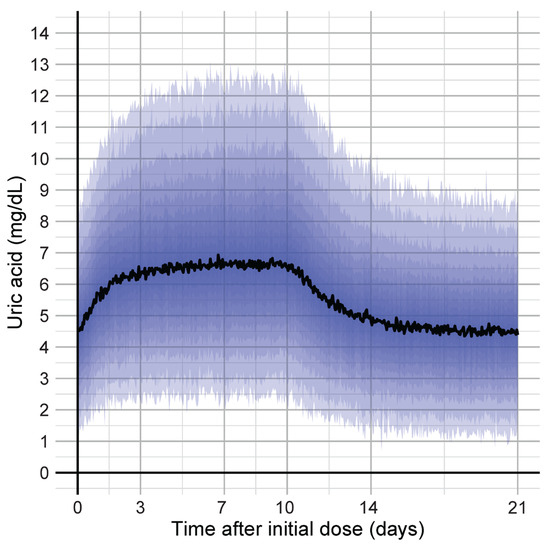
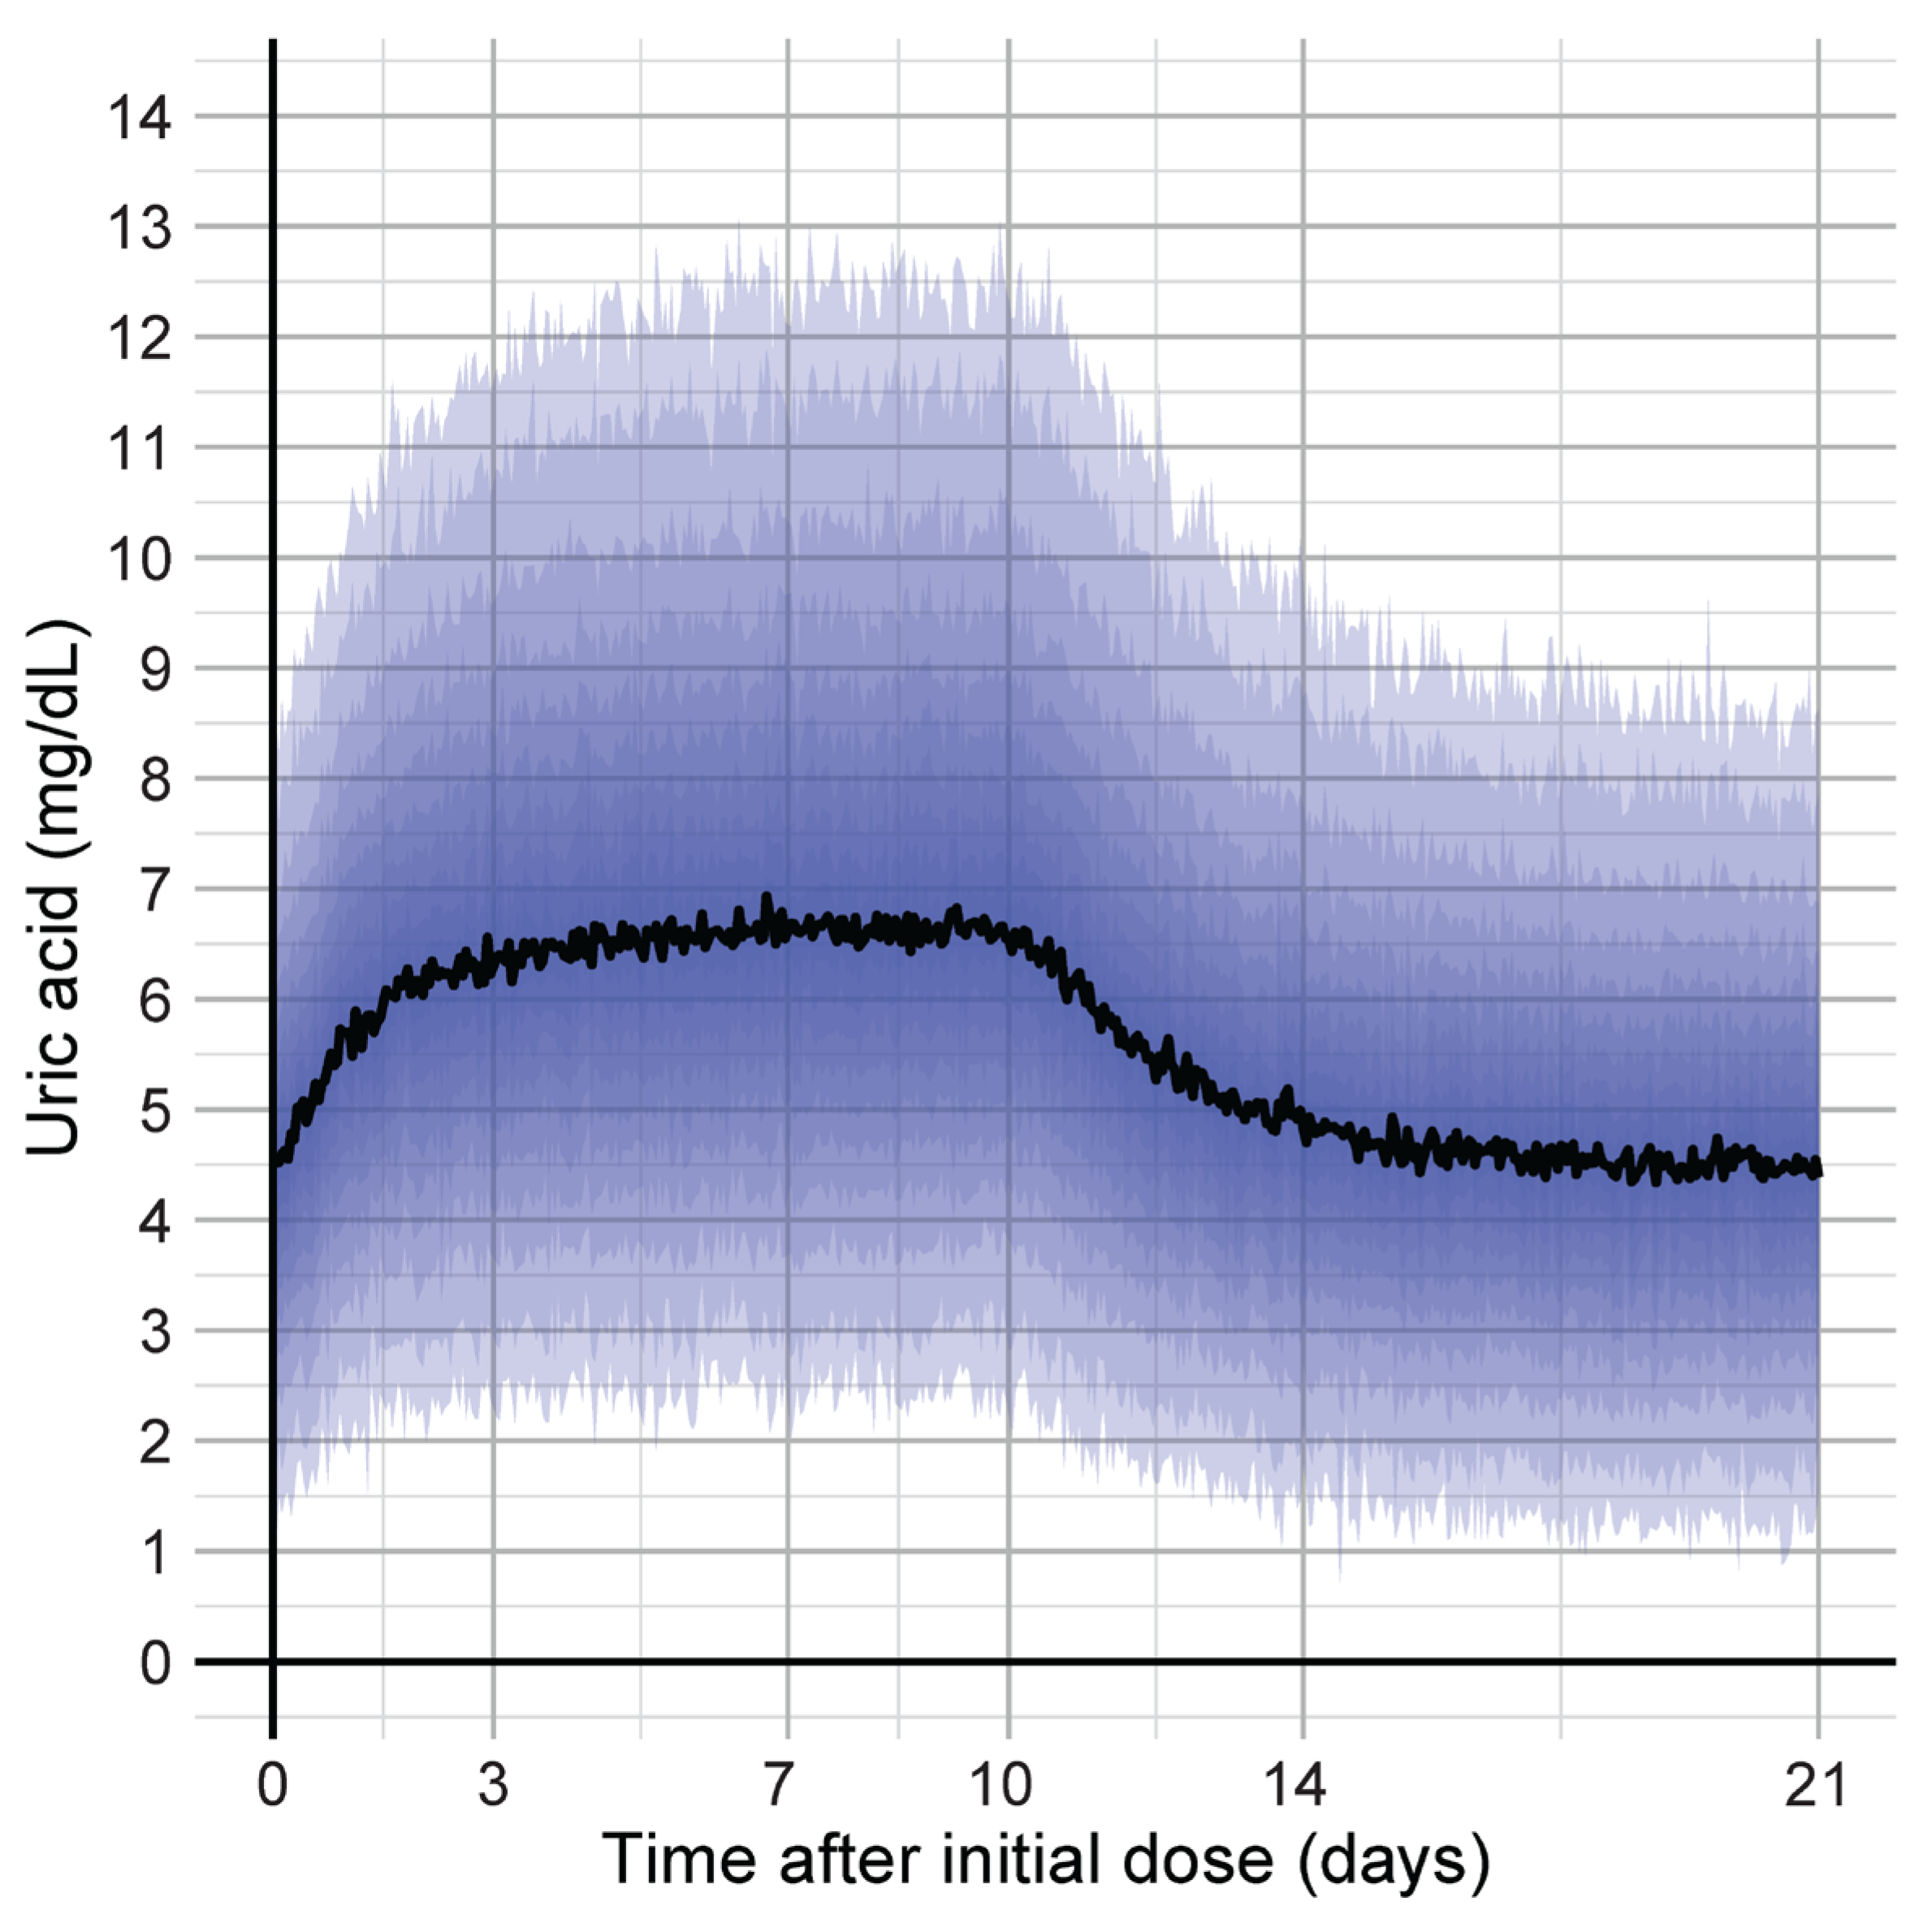
The simulated time course of serum uric acid levels following FPV administration based on the final model is shown in Figure 3. The serum uric acid level reached its maximum at 6.7 days after treatment initiation, with a median peak value of 6.93 mg/dL. The time required for the serum uric acid level to return to UAbase after treatment discontinuation was 4.0 days.
Figure 3.
Simulated time course of uric acid after standard-dose favipiravir based on the final model. The solid black line represents the median prediction. Purple shaded bands represent prediction percentiles in 10% increments (from the 10th to the 90th percentile), with darker shading indicating more central percentiles.
3. Discussion
In this study, a population pharmacokinetic and pharmacodynamic analysis was performed in patients treated with FPV to quantitatively evaluate the relationship between FPV exposure and changes in serum uric acid levels. The increase in serum uric acid levels associated with FPV administration was adequately described as inhibition of the uric acid elimination process. Consistent with previous reports, the model supported the contribution of M1 exposure to elevation of serum uric acid levels. Regarding the simulation analysis, the serum uric acid level reached a maximum at approximately 7 days after treatment initiation and returned to UAbase approximately 4 days after treatment discontinuation. This study characterized the longitudinal time course of changes in serum uric acid levels during and after FPV treatment and provides information relevant to monitoring and management of serum uric acid levels in clinical practice.
Regarding the analysis population, at the time of the ethics committee review during the early phase of the COVID-19 pandemic, knowledge and evidence on background factors to be considered for exclusion criteria were limited. Therefore, an inclusive approach was adopted to incorporate clinical data as comprehensively as possible, and all cases in the analysis population were included.
FPV pharmacokinetics have been reported using noncompartmental analysis and one-compartment models [5,18,19,20,21,22,23]. In this study, the pharmacokinetics of FPV were described by a one-compartment model. This structural model is consistent with previously reported population pharmacokinetic analyses and is considered to reflect the basic disposition characteristics of FPV [22,23]. The number of patients (n = 23) and FPV concentration samples (n = 92) were limited, which may constrain the power to detect covariate effects and the precision of BSV estimates. Accordingly, a parsimonious pharmacokinetic model was constructed, avoiding overestimation of random effects and excessive inclusion of covariates. No major discrepancies were observed in the goodness-of-fit plots, bootstrap analysis, or VPC and pcVPC, supporting the robustness and adequacy of the final model within this dataset.
Considering FPV, previously reported values for CLFPV/F and VdFPV range from 0.47 to 19.6 L/h and from 4.85 to 41.6 L, respectively [5,18,19,20,21,22,23]. In this study, the estimated CLFPV/F and VdFPV were 1.31 L/h and 10.4 L, respectively, which were within the ranges reported in previous pharmacokinetic analyses [22,23]. The elimination half-life calculated based on CLFPV/F and VdFPV was 5.46 h, which was comparable to that reported in previous population pharmacokinetic analyses [22,23]. Previous studies in COVID-19 populations indicate that severe inflammation and physiological changes related to the disease may influence drug exposure [22,24]. In this cohort, C-reactive protein levels showed mild elevations, whereas white blood cell counts were generally within the normal range, and albumin levels did not show substantial decreases (Table 1) [25,26]. Therefore, within the clinical range represented in this study, the influence of disease status on favipiravir pharmacokinetics was unlikely to be substantial, and we did not incorporate covariates related to disease status into the model.
In this study, a turnover model was used to describe uric acid kinetics, with zero-order production and first-order elimination [27]. The FPV-associated increase in serum uric acid levels was modelled as inhibition of the uric acid elimination process. This modelling approach has also been used in population pharmacokinetic and pharmacodynamic analyses of other drugs affecting uric acid and was considered appropriate for describing physiological uric acid homeostasis in the present analysis [28,29].
The proposed mechanisms for serum uric acid elevation include inhibition of tubular urate secretion and enhanced urate reabsorption in the proximal tubule. However, the underlying mechanisms remain unclear [12]. As separately quantifying the contributions of secretion inhibition and enhanced reabsorption from the present data was difficult, the effect was modelled parsimoniously as inhibition of the overall uric acid elimination process. The inhibitory effects of FPV and M1 were not supported as synergistic in this analysis, and the model assuming additive effects provided an adequate fit.
As serum uric acid levels ≤7 mg/dL are generally considered below the upper limit of normal, the UAbase estimate (4.43 mg/dL) was reasonable for evaluating FPV-associated increases in serum uric acid levels [30]. The T1/2UA estimate was 17.6 h, which was comparable to the T1/2UA values reported in previous population pharmacokinetic and pharmacodynamic analyses of other drugs (15.9–21.2 h) [28,29].
In the simulation based on the final model (Figure 3), the serum uric acid level was simulated to increase early after treatment initiation and reached a maximum at 6.7 days (6.93 mg/dL). Although the diagnostic threshold for hyperuricemia is 7 mg/dL, the solubility of monosodium urate is reported to be approximately 6.8 mg/dL, above which the risk of monosodium urate crystal formation and precipitation increases [16,17]. In patients with a history of hyperuricemia, even a modest increase in serum uric acid level may increase the risk of crystal formation. A case of an acute gout flare triggered by FPV has been reported in a patient with a history of hyperuricemia whose serum uric acid level had been well controlled with urate-lowering therapy [31]. Therefore, in patients with a history of hyperuricemia, careful attention should be paid not only to changes in serum uric acid levels during treatment but also to clinical symptoms. In contrast, the serum uric acid level was predicted to return to UAbase within 4.0 days after treatment discontinuation, suggesting that FPV-associated uric acid elevation may be transient. This finding is consistent with previous reports showing a rapid recovery of serum uric acid levels after FPV discontinuation [13,14].
A limitation of this study is that serum M1 concentrations were not measured. As the analysis used model-predicted M1 concentrations based on a previously reported population pharmacokinetic model, the individual quantitative contributions of FPV and M1 to the increase in serum uric acid levels could not be strictly separated. In addition, the effects of BSV in M1 exposure and potential interactions between FPV and M1 on uric acid changes could not be directly evaluated.
4. Materials and Methods
4.1. Ethics
This study was approved by the Institutional Review Boards of the University of Toyama Hospital (approval numbers: R2020146 and R2012133) and Nihon University School of Pharmacy (approval number: 20-013). This study was conducted in accordance with the Declaration of Helsinki, and patient confidentiality was maintained. Serum FPV concentrations were determined using residual serum samples collected during routine clinical care, which were no longer required for clinical testing.
4.2. Patients and Data Sources
This was a retrospective observational study. Patients who received FPV (Avigan®, FUJIFILM Toyama Chemical, Tokyo, Japan) for treatment of COVID-19 or SFTS at the University of Toyama Hospital between April 2020 and July 2025 were included. No exclusion criteria were defined. Patient characteristics, including age, sex, body weight, renal function, concomitant medications, dosing times, blood sampling times, and treatment duration were collected from medical records. The dosing regimen was 1800 mg twice daily on day 1, followed by 800 mg twice daily from day 2 onward. The treatment duration was determined by the attending physician according to the patients’ clinical conditions.
4.3. Determination of FPV Concentrations and Uric Acid Levels
Serum samples for measurement of FPV concentrations were stored at −80 °C until analysis. Serum FPV concentrations were determined using an absolute calibration method by high-performance liquid chromatography based on a previous report [32]. A reference standard of FPV (CAS No. 259793-96-9) was purchased from Med Chem Express (MCE; Med Chem Express LLC, Monmouth Junction, NJ, USA). Chromatographic separation was performed using an aminopropyl column (Unison UK-Amino, 150 × 3 mm, 3 µm; Imtakt, Kyoto, Japan). The mobile phase consisted of 0.1% acetic acid in water. The flow rate was 0.4 mL/min, the column temperature was 60 °C, and ultraviolet detection was performed at 360 nm. The linearity of the calibration curve was confirmed over the range of 0.1–200 mg/L (R2 = 0.999). The lower limit of quantification (LLOQ) and limit of detection were both 0.1 mg/L (coefficient of variation < 10%). Samples below the LLOQ were excluded from the analysis [33].
Serum uric acid levels were measured using the uricase–peroxidase method (Quick Auto Neo UA II; Shino-Test, Kanagawa, Japan). The measurable range was 0.2–200 mg/dL (coefficient of variation < 10%).
4.4. Population Pharmacokinetics and Pharmacodynamics of FPV
Population pharmacokinetics and pharmacodynamics analysis was performed using the population pharmacokinetic parameters and data (PPP and D) method [34,35], using the first-order conditional estimation method with interaction (FOCE-I) in the nonlinear mixed-effect modelling software NONMEM® version 7.6.0 (ICON Development Solutions, Gaithersburg, MD, USA). Model execution, bootstrap analyses, visual predictive checks (VPCs), simulations, and result management were performed using Wings for NONMEM. Statistical analyses and graphical processing were performed using R version 4.3.2 (R Foundation for Statistical Computing, Vienna, Austria).
4.5. Population Pharmacokinetics
The population pharmacokinetic model for FPV was evaluated using a one-compartment model with first-order absorption and elimination (ADVAN 13, TOL = 9). Based on a previously published model, FPV was assumed to be completely converted to M1 [23]. The estimated pharmacokinetic parameters were clearance of FPV (CLFPV/F), volume of distribution of FPV (VdFPV), and absorption half-life (Tabs). The absorption rate constant (ka) was calculated by dividing the natural logarithm of 2 by Tabs. The absolute bioavailability (F) was fixed to 1 [5,36]. As serum M1 concentrations were not measured in this study, clearance of M1 (CLM1) and volume of distribution of M1 (VdM1) were fixed to previously reported values [23]. Between-subject variability (BSV) was estimated for CLFPV/F, whereas VdFPV and Tabs were described using typical values only. BSV was modelled with a log-normal distribution (Equation (2)).
Pi is the individual parameter value, Ppop is the population typical value, and ηi is a random variable with mean 0 and variance ω2.
The residual unidentified variability (RUV) was modelled with combined proportional and additive errors (Equation (3)).
Yij is the jth observed concentration for the ith patient, and Ypredij is the corresponding model-predicted concentration. RUVPROP and RUVADD are the combined proportional and additive error model components, respectively, with mean 0 and variances σ2. For M1, previously reported values were used [23].
4.6. Covariate Model
The factor for size (FSIZE) was applied to standardize the pharmacokinetic parameters, with an assumption of standard total body weight (TBW) of 70 kg (Equation (4)) [37,38].
The allometric exponent (PWR) of FSIZE was fixed to 0.75 for CLFPV/F and CLM1, and 1 for VdFPV and VdM1.
Creatinine clearance (CLcr) was calculated using the Cockcroft–Gault formula standardized to a TBW of 70 kg (Equation (5)).
For FPV, alanine aminotransferase and age were evaluated as covariates on CLFPV/F. These covariates were modelled with a power function and standardized to the median values in this study population. For M1, renal function (RF) was included as a covariate on CLM1 as previously reported (Equations (6) and (7)) [23].
RF was defined as a function of the deviation from the standard CLcr (CLcrSTD, 100 mL/min/70 kg) and the RF effect coefficient (TRF). This coefficient was fixed to the previously reported value [23]. Candidate covariates were limited to patient characteristics and standard laboratory test results that could be systematically extracted from medical records, including renal function measures.
4.7. Population Pharmacokinetic and Pharmacodynamic Modelling
The time course of changes in serum uric acid levels following FPV administration was described with a turnover model with zero-order production and first-order elimination (Supplementary Figure S2). The estimated pharmacodynamic parameters were UAbase and the uric acid elimination half-life (T1/2UA). The uric acid elimination rate constant (kout) was calculated by dividing the natural logarithm of 2 by T1/2UA.FPV-induced elevation of serum uric acid levels was modelled as inhibition of the uric acid elimination process (PDI) (Equation (8)).
4.8. Model Evaluation and Validation
To test the significance of various factors that influenced the pharmacokinetic and pharmacodynamic parameters, the objective function value (OFV) determined in the NONMEM® fitting routine was used. The difference in OFV (ΔOFV) obtained by comparing each model was asymptotically distributed according to the chi-squared test, with the number of degrees of freedom (df) being equal to the difference in the number of parameters between the two models. The significance level was set at p < 0.05 (ΔOFV = 3.84).
Goodness-of-fit plots were used for pharmacokinetic model evaluation. Population mean values were assessed using plots of observations versus population predictions (PRED), and BSV for each pharmacokinetic parameter was evaluated using plots of observations versus individual predictions (IPRED) based on Bayesian estimation. Model fit was further assessed using plots of conditional weighted residuals (CWRES) versus PRED and CWRES versus time after the previous dose. η-shrinkage was evaluated for the final model to assess the reliability of empirical Bayes estimate-based diagnostics [40].
A nonparametric bootstrap was used to estimate uncertainty [41]. The final model was fit repeatedly to 500 additional bootstrap datasets. The average, standard deviation, relative standard error (%RSE) and 95% confidence intervals (CIs) were calculated from the empirical bootstrap distribution and compared with the estimates from the original dataset. A VPC was used to check the distribution of observed and predicted percentiles. The VPC was evaluated by comparing the observed concentrations with 90% percentile intervals (PIs) and 95% CIs simulated from the final parameters. Prediction-corrected VPC (pcVPC) was performed for serum FPV concentrations, and standard VPC was performed for serum uric acid levels.
4.9. Simulation
Based on the final model, serum uric acid levels were simulated for 21 days from FPV initiation. The scenario assumed 10 consecutive days of dosing, corresponding to the maximum approved treatment duration for SFTS. The clinical regimen was 1800 mg twice daily on day 1, followed by 800 mg twice daily from day 2 onward. Simulations were performed using the $SIMULATION option in NONMEM® with 500 replicates. The time to peak serum uric acid level and time required for the serum uric acid level to return to baseline after treatment discontinuation were evaluated. Return to baseline was defined as the first time point at which the simulated serum uric acid level fell within ±5% of UAbase.
5. Conclusions
This study quantitatively evaluated FPV-associated increases in serum uric acid levels, including the time course from treatment initiation through recovery after treatment discontinuation, using a population pharmacokinetic and pharmacodynamic analysis incorporating the pharmacokinetics of FPV and M1. The analysis reaffirmed that FPV treatment increases serum uric acid levels. However, the magnitude of the increase was not excessive from a clinical perspective, and serum uric acid levels were predicted to recover rapidly after treatment discontinuation. Nevertheless, in patients with a history of hyperuricemia who are at higher risk of gout, serum uric acid levels should be monitored during FPV treatment.
Supplementary Materials
The following supporting information can be downloaded at: https://www.mdpi.com/article/10.3390/ph19071008/s1, Figure S1: Goodness-of-fit plots based on the final population pharmacokinetic model; Figure S2: Structural pharmacokinetic model for favipiravir and favipiravir hydroxide and pharmacodynamic model for uric acid.
Author Contributions
Conceptualization, T.Y. and Y.T.; methodology, T.Y., C.O. and M.K.; software, T.Y. and T.A.; validation, C.H., D.Y. and S.I.; formal analysis, T.Y., C.H., S.I., T.A. and Y.T.; investigation, T.Y. and H.K.; resources, H.K. and M.K.; data curation, T.Y., M.K. and H.K.; writing—original draft preparation, T.Y.; writing—review and editing, T.Y., H.K., C.O., C.H., M.K., D.Y., S.I., T.A., Y.Y. and Y.T.; visualization, T.Y. and Y.T.; supervision, Y.Y. and Y.T.; project administration, H.K., M.K. and Y.Y.; funding acquisition, Y.T. All authors have read and agreed to the published version of the manuscript.
Funding
This work was supported by the research grant of Nihon University.
Institutional Review Board Statement
The study was conducted in accordance with the Declaration of Helsinki and approved by the Institutional Review Board of the University of Toyama Hospital (approval numbers: R2020146 and R2012133 [approved 29 October 2020 and 6 September 2025]) and Nihon University School of Pharmacy (approval numbers: 20-013 [approved 30 November 2020]).
Informed Consent Statement
Patient consent was waived due to the retrospective nature of the study, which used leftover clinical specimens and de-identified clinical data. Information about the study was disclosed publicly, and participants were provided with an opportunity to opt out, in accordance with the approved study protocol. Written informed consent for publication was not applicable because no individual participant can be identified in this study.
Data Availability Statement
The data presented in this study are available from the corresponding author upon reasonable request. The underlying raw clinical data are stored in a secure database with restricted access and are not publicly available because public data sharing was not approved under the ethics approval and to protect patient privacy. Requests will be considered on a case-by-case basis, subject to institutional and ethical regulations.
Conflicts of Interest
T.Y., H.K., M.K., S.I., T.A., Y.Y. and Y.T. have no conflicts of interest to declare. C.O. is an employee of Chugai Pharmaceutical Co., Ltd. (Tokyo, Japan) and owns company stock. C.H. is an employee of MSD K.K. (Tokyo, Japan) and owns stock and/or stock options in Merck & Co., Inc. (Rahway, NJ, USA). D.Y. is an employee of Shionogi & Co., Ltd. (Osaka, Japan) and owns stock and/or stock options in Shionogi & Co., Ltd. The above companies had no role in the study design; data collection, analysis, or interpretation; manuscript preparation; or the decision to publish. No commercial funding was received for this study.
Abbreviations
The following abbreviations are used in this manuscript:
| AUC | Area under the curve |
| BSV | Between-subject variability |
| CI | Confidence interval |
| CLcr | Creatinine clearance |
| CLcrSTD | Standard CLcr |
| CLFPV/F | Clearance of favipiravir |
| CLM1 | Clearance of favipiravir hydroxide |
| COVID-19 | Coronavirus disease 2019 |
| C50FPV | Protein unbound concentration of favipiravir producing 50% of the maximum inhibition effect |
| C50M1 | Protein unbound concentration of favipiravir hydroxide producing 50% of the maximum inhibition effect |
| df | Degrees of freedom |
| Edrug | Pharmacodynamic model for favipiravir |
| FOCE-I | First-order conditional estimation method with interaction |
| FPV | Favipiravir |
| F | Absolute bioavailability |
| FSIZE | Factor for size |
| GAMMAFPV | Hill coefficient of turnover Imax model on favipiravir |
| GAMMAM1 | Hill coefficient of turnover Imax model on favipiravir hydroxide |
| Imax | The maximum extent of inhibition effect |
| ka | Absorption rate constant |
| kout | Uric acid elimination rate constant |
| LLOQ | Lower limit of quantification |
| M1 | Favipiravir hydroxide |
| OFV | Objective function value |
| pcVPC | Prediction-corrected visual predictive check |
| PDI | Inhibition of the uric acid elimination process |
| PI | Percentile interval |
| PPP and D | Population pharmacokinetic parameters and data method |
| PWR | Allometric exponent |
| RF | Renal function |
| Rin | Zero-order production rate (uric acid) |
| RUV | Residual unidentified variability |
| SFTS | Severe fever with thrombocytopenia syndrome |
| Tabs | Absorption half-life |
| TBW | Total body weight |
| TRF | Renal function effect coefficient |
| T1/2UA | uric acid elimination half-life |
| UA | Uric acid |
| UAbase | Baseline serum uric acid level |
| VdFPV | Volume of distribution of favipiravir |
| VdM1 | Volume of distribution of favipiravir hydroxide |
| VPC | Visual predictive check |
| ΔOFV | Difference in OFV |
| %RSE | Relative standard error |
References
- Furuta, Y.; Komeno, T.; Nakamura, T. Favipiravir (T-705), a Broad Spectrum Inhibitor of Viral RNA Polymerase. Proc. Jpn. Acad. Ser. B Phys. Biol. Sci. 2017, 93, 449–463. [Google Scholar] [CrossRef] [Scilit] [PubMed]
- Agrawal, U.; Raju, R.; Udwadia, Z.F. Favipiravir: A New and Emerging Antiviral Option in COVID-19. Med. J. Armed Forces India 2020, 76, 370–376. [Google Scholar] [CrossRef] [Scilit] [PubMed]
- Li, S.; Li, H.; Lian, R.; Xie, J.; Feng, R. New Perspective of Small-Molecule Antiviral Drugs Development for RNA Viruses. Virology 2024, 594, 110042. [Google Scholar] [CrossRef] [Scilit] [PubMed]
- Fujifilm Toyama Chemical Co., Ltd. Avigan® (Favipiravir) Package Insert; Fujifilm Toyama Chemical Co., Ltd.: Tokyo, Japan, 2024. [Google Scholar]
- Pharmaceuticals and Medical Devices Agency (PMDA). Report on the Deliberation Results: Avigan; Pharmaceuticals and Medical Devices Agency (PMDA): Tokyo, Japan, 2014. [Google Scholar]
- Irie, K.; Nakagawa, A.; Fujita, H.; Tamura, R.; Eto, M.; Ikesue, H.; Muroi, N.; Tomii, K.; Hashida, T. Pharmacokinetics of Favipiravir in Critically Ill Patients with COVID-19. Clin. Transl. Sci. 2020, 13, 880–885. [Google Scholar] [CrossRef] [Scilit] [PubMed]
- Gülhan, R.; Eryüksel, E.; Oğlu, M.G.İ.; Çulpan, Y.; Toplu, A.; Kocakaya, D.; Tigen, E.; Şengel, B.E.; Sili, U.; Yıldızeli, Ş.O.; et al. Pharmacokinetic Characterization of Favipiravir in Patients with COVID-19. Br. J. Clin. Pharmacol. 2022, 88, 3516–3522. [Google Scholar] [CrossRef] [Scilit] [PubMed]
- Adomako, E.A.; Moe, O.W. Uric Acid Transport, Transporters, and Their Pharmacological Targeting. Acta Physiol. 2023, 238, e13980. [Google Scholar] [CrossRef] [Scilit] [PubMed]
- Fathallah-Shaykh, S.A.; Cramer, M.T. Uric Acid and the Kidney. Pediatr. Nephrol. 2014, 29, 999–1008. [Google Scholar] [CrossRef] [Scilit] [PubMed]
- Chung, S.; Kim, G.H. Urate Transporters in the Kidney: What Clinicians Need to Know. Electrolytes Blood Press. 2021, 19, 1–9. [Google Scholar] [CrossRef] [Scilit] [PubMed]
- Kim, S.H.; Shin, J.; Son, H.-E.; Kang, D.-H. Role of Urate Transporters in the Kidneys and Intestine in Uric Acid Homeostasis. Kidney Res. Clin. Pract. 2025, 45, 296–313. [Google Scholar] [CrossRef] [Scilit] [PubMed]
- Mishima, E.; Anzai, N.; Miyazaki, M.; Abe, T. Uric Acid Elevation by Favipiravir, an Antiviral Drug. Tohoku J. Exp. Med. 2020, 251, 87–90. [Google Scholar] [CrossRef] [Scilit] [PubMed]
- Hanai, Y.; Yoshizawa, S.; Matsuo, K.; Uekusa, S.; Miyazaki, T.; Nishimura, K.; Mabuchi, T.; Ohashi, H.; Ishii, Y.; Tateda, K.; et al. Evaluation of Risk Factors for Uric Acid Elevation in COVID-19 Patients Treated with Favipiravir. Diagn. Microbiol. Infect. Dis. 2022, 102, 115640. [Google Scholar] [CrossRef] [Scilit] [PubMed]
- Koseki, T.; Nakajima, K.; Iwasaki, H.; Yamada, S.; Takahashi, K.; Doi, Y.; Mizuno, T. Baseline Uric Acid Levels and Steady-State Favipiravir Concentrations Are Associated with Occurrence of Hyperuricemia Among COVID-19 Patients. Int. J. Infect. Dis. 2022, 115, 218–223. [Google Scholar] [CrossRef] [Scilit] [PubMed]
- Hooker, A.C.; Staatz, C.E.; Karlsson, M.O. Conditional Weighted Residuals (CWRES): A Model Diagnostic for the FOCE Method. Pharm. Res. 2007, 24, 2187–2197. [Google Scholar] [CrossRef] [Scilit] [PubMed]
- Terkeltaub, R.; Bushinsky, D.A.; Becker, M.A. Recent Developments in Our Understanding of the Renal Basis of Hyperuricemia and the Development of Novel Antihyperuricemic Therapeutics. Arthritis Res. Ther. 2006, 8, S4. [Google Scholar] [CrossRef] [Scilit] [PubMed]
- Liebman, S.E.; Taylor, J.G.; Bushinsky, D.A. Uric Acid Nephrolithiasis. Curr. Rheumatol. Rep. 2007, 9, 251–257. [Google Scholar] [CrossRef] [Scilit] [PubMed]
- Bendas, E.R.; Rezk, M.R.; Badr, K.A. Does the Ethnic Difference Affect the Pharmacokinetics of Favipiravir? A Pharmacokinetic Study in Healthy Egyptian Volunteers and Development of Level C In-Vitro In-Vivo Correlation. Drug Res. 2023, 73, 349–354. [Google Scholar] [CrossRef] [Scilit] [PubMed]
- Priyanto, P.; Widiastuti, E.; Wahyono, B.H.; Susilo, M.J.; Yunica, N.T.; Kurniawan, A.; Meisy, S.R.S.; Karyati, T.; Maidina, S.V. Pharmacokinetics and Bioequivalence Study of Two Formulations of Favipiravir 200 Mg Film-Coated Tablet in Healthy Indonesian Volunteers. Bioequivalence Bioavailab. Int. J. 2023, 7, 1–5. [Google Scholar] [CrossRef] [Scilit]
- Yoosakul, E.; Sunhem, A.; Khaowroongrueng, V.; Saeaue, L.; Karachot, B.; Techatanawat, I.; Puranajoti, P.; Surawattanawan, P. Bioequivalence Study of Favipiravir 200 Mg Tablets in Healthy Thai Volunteers under Fasting Conditions. J. Bioequivalence Bioavailab. 2021, 13, 1000436. [Google Scholar] [CrossRef]
- Saǧlam, O.; Güney, B.; Saraner, N.; Sevici, G.; Doǧan-Kurtoǧlu, E.; Ulusoy, M.G.; Demiray, G.; Nacak, M.; Erenmemişoǧlu, A.; Ozbek, M.; et al. Bioequivalence Study of Two Favipiravir Tablet Formulations in Healthy Male Subjects. Int. J. Clin. Pharmacol. Ther. 2021, 59, 409–416. [Google Scholar] [CrossRef] [Scilit] [PubMed]
- Irie, K.; Nakagawa, A.; Fujita, H.; Tamura, R.; Eto, M.; Ikesue, H.; Muroi, N.; Fukushima, S.; Tomii, K.; Hashida, T. Population Pharmacokinetics of Favipiravir in Patients with COVID-19. CPT Pharmacomet. Syst. Pharmacol. 2021, 10, 1161–1170. [Google Scholar] [CrossRef] [Scilit] [PubMed]
- Wang, Y.; Zhong, W.; Salam, A.; Tarning, J.; Zhan, Q.; Huang, J.; Weng, H.; Bai, C.; Ren, Y.; Yamada, K.; et al. Phase 2a, Open-Label, Dose-Escalating, Multi-Center Pharmacokinetic Study of Favipiravir (T-705) in Combination with Oseltamivir in Patients with Severe Influenza. EBioMedicine 2020, 62, 103125. [Google Scholar] [CrossRef] [Scilit] [PubMed]
- Favié, L.M.A.; Murk, J.L.; Meijer, A.; Nijstad, A.L.; Van Maarseveen, E.M.; Sikma, M.A. Pharmacokinetics of Favipiravir During Continuous Venovenous Haemofiltration in a Critically Ill Patient with Influenza. Antivir. Ther. 2018, 23, 457–461. [Google Scholar] [CrossRef] [Scilit] [PubMed]
- Qu, G.; Huang, G.; Zhang, M.; Yu, H.; Song, X.; Zhu, H.; Chen, L.; Wang, Y.; Pei, B. Features of C-Reactive Protein in COVID-19 Patients with Different Ages, Clinical Types and Outcomes: A Cohort Study. medRxiv 2020. 2020.10.26.20220160. [Google Scholar] [CrossRef] [Scilit]
- Shrestha, A.; Shah, G.J.; Neupane, S.; Shrestha, R. C-Reactive Protein as a Prognostic Marker in Hospitalized Patients with COVID-19. J. Nepalgunj Med. Coll. 2022, 20, 70–73. [Google Scholar] [CrossRef] [Scilit]
- Dayneka, N.L.; Garg, V.; Jusko, W.J. Comparison of Four Basic Models of Indirect Pharmacodynamic Responses. J. Pharmacokinet. Biopharm. 1993, 21, 457–478. [Google Scholar] [CrossRef] [Scilit] [PubMed]
- An, G.; Liu, W.; Duan, W.R.; Nothaft, W.; Awni, W.; Dutta, S. Population Pharmacokinetics and Exposure-Uric Acid Analyses After Single and Multiple Doses of ABT-639, a Calcium Channel Blocker, in Healthy Volunteers. AAPS J. 2015, 17, 416–426, Erratum in AAPS J. 2015, 17, 481–492. https://doi.org/10.1208/s12248-015-9725-9. [Google Scholar] [CrossRef] [Scilit] [PubMed]
- Hirai, T.; Kimura, T.; Echizen, H. Modeling and Simulation for Estimating the Influence of Renal Dysfunction on the Hypouricemic Effect of Febuxostat in Hyperuricemic Patients Due to Overproduction or Underexcretion of Uric Acid. Biol. Pharm. Bull. 2016, 39, 1013–1021. [Google Scholar] [CrossRef] [Scilit] [PubMed]
- Hisatome, I.; Ichida, K.; Mineo, I.; Ohtahara, A.; Ogino, K.; Kuwabara, M.; Ishizaka, N.; Uchida, S.; Kurajoh, M.; Kohagura, K.; et al. Japanese Society of Gout and Uric & Nucleic Acids 2019 Guidelines for Management of Hyperuricemia and Gout 3rd Edition. Gout Uric Nucleic Acids 2020, 44, sp-1–sp-40. [Google Scholar] [CrossRef]
- Hase, R.; Kurata, R.; Ishida, K.; Kurita, T.; Muranaka, E.; Mito, H. Acute Gouty Arthritis During Favipiravir Treatment for Coronavirus Disease 2019. Intern. Med. 2020, 59, 2327–2329. [Google Scholar] [CrossRef] [Scilit] [PubMed]
- Nguyen, T.H.T.; Guedj, J.; Anglaret, X.; Laouénan, C.; Madelain, V.; Taburet, A.M.; Baize, S.; Sissoko, D.; Pastorino, B.; Rodallec, A.; et al. Favipiravir Pharmacokinetics in Ebola-Infected Patients of the JIKI Trial Reveals Concentrations Lower than Targeted. PLoS Negl. Trop. Dis. 2017, 11, e0005389. [Google Scholar] [CrossRef] [Scilit] [PubMed]
- Beal, S.L. Ways to Fit a PK Model with Some Data below the Quantification Limit. J. Pharmacokinet. Pharmacodyn. 2001, 28, 481–504. [Google Scholar] [CrossRef] [Scilit] [PubMed]
- Zhang, L.; Beal, S.L.; Sheiner, L.B. Simultaneous vs. Sequential Analysis for Population PK/PD Data II: Robustness of Methods. J. Pharmacokinet. Pharmacodyn. 2003, 30, 405–416. [Google Scholar] [CrossRef] [Scilit] [PubMed]
- Zhang, L.; Beal, S.L.; Sheiner, L.B. Simultaneous vs. Sequential Analysis for Population PK/PD Data I: Best-Case Performance. J. Pharmacokinet. Pharmacodyn. 2003, 30, 387–404. [Google Scholar] [CrossRef] [Scilit] [PubMed]
- Łagocka, R.; Dziedziejko, V.; Kłos, P.; Pawlik, A. Favipiravir in Therapy of Viral Infections. J. Clin. Med. 2021, 10, 273. [Google Scholar] [CrossRef] [Scilit] [PubMed]
- Anderson, B.J.; Holford, N.H.G. Mechanistic Basis of Using Body Size and Maturation to Predict Clearance in Humans. Drug Metab. Pharmacokinet. 2009, 24, 25–36. [Google Scholar] [CrossRef] [Scilit] [PubMed]
- Holford, N.; Heo, Y.A.; Anderson, B. A Pharmacokinetic Standard for Babies and Adults. J. Pharm. Sci. 2013, 102, 2941–2952. [Google Scholar] [CrossRef] [Scilit] [PubMed]
- Greco, W.R.; Bravo, G.; Parsons, J.C. The Search for Synergy: A Critical Review from a Response Surface Perspective. Pharmacol. Rev. 1995, 47, 331–385. [Google Scholar] [CrossRef] [Scilit]
- Savic, R.M.; Karlsson, M.O. Importance of Shrinkage in Empirical Bayes Estimates for Diagnostics: Problems and Solutions. AAPS J. 2009, 11, 558–569. [Google Scholar] [CrossRef] [Scilit] [PubMed]
- Parke, J.; Holford, N.H.G.; Charles, B.G. A Procedure for Generating Bootstrap Samples for the Validation of Nonlinear Mixed-Effects Population Models. Comput. Methods Programs Biomed. 1999, 59, 19–29. [Google Scholar] [CrossRef] [Scilit] [PubMed]

Disclaimer/Publisher’s Note: The statements, opinions and data contained in all publications are solely those of the individual author(s) and contributor(s) and not of MDPI and/or the editor(s). MDPI and/or the editor(s) disclaim responsibility for any injury to people or property resulting from any ideas, methods, instructions or products referred to in the content. |
© 2026 by the authors. Licensee MDPI, Basel, Switzerland. This article is an open access article distributed under the terms and conditions of the Creative Commons Attribution (CC BY) license.