1. Introduction
Viticulture represents an important segment of Montenegrin agriculture, especially considering its role in regional wine production and the development of wine tourism [
1]. The production of grapes and wine contributes noticeably to the agricultural economy and the broader alcohol sector, which carries measurable fiscal and economic effects in Montenegro [
2]. Vine production has long been one of Montenegro’s key agricultural export sectors, accounting for approximately
of total agricultural exports [
3]. In addition, viticulture and winemaking remain closely tied to Montenegro’s long-standing cultural and historical traditions, particularly within its established wine regions [
1]. In 2024, vineyards in Montenegro covered a total area of
ha, producing 16,869.3 tons of grapes, a figure that has been steadily declining in recent years [
4]. There were 511 registered vineyards and 109 wineries in 2024 producing approximately
hl of wine, with Plantaže as the largest producer [
3,
5]. Plantaže are not only the biggest vineyard in Montenegro but also the largest single complex vineyard in Europe, spanning over 2300 ha, making up over
of the total Montenegrin production [
6]. Viticulture in Montenegro is deeply embedded in the cultural identity of the country, with traditional winemaking techniques being passed down through generations and autochthonous grape varieties such as Vranac and Krstač, which are vastly planted, representing a unique genetic heritage [
7].
The global wine sector has been facing important challenges due to global warming; specifically due to changes in climate involving a whole set of factors such as changes in the spatial patterns and temporal regimes of precipitation, temperature and humidity [
8]. Rising temperatures induce long-term alterations in viticultural systems, potentially rendering entire regions unsuitable for grape cultivation [
9]. Furthermore, common extreme climatic events can cause damage to a harvest or field. For example, shifts in precipitation patterns combined with temperature increase can change the frequency and intensity of droughts, potentially increasing the risk of grape stress, reducing yield and wine quality [
10,
11,
12]. Additionally, Wu et al. [
13] identified in the climate data analysis for 1961–2023 that more than
of Earth’s surface has been affected by heat waves. All of the mentioned factors represent essential variables in grape production, and any changes in them have a substantial impact on the final output [
14]. These changes have particular impacts on yield, grape quality, wine quality and acidity [
15]. Moreover, these changes hinder effective vine protection. Warmer winters favour the development of pests and diseases and accelerate vine phenological phases, leading to earlier harvests and potential challenges in meeting pre-harvest interval requirements [
16]. Furthermore, climatic shifts not only impact grape yield and quality but also increase production costs due to higher irrigation needs, more frequent pest and disease treatments and others.
Alert systems supplied to viticulturists can prevent such problems by allowing them to apply appropriate adaptation measures. For example, timely pest or disease warnings could prevent significant yield losses and improve grape quality across multiple microclimates. Decrease in the yield trend and noticeable phenophases shifts require immediate action that enables the contribution of vinegrowers, policymakers, and researchers. Delivering this support requires an integrated system that gathers all three parties. Several countries have already developed dedicated decision-support platforms to address these challenges, including VitiMeteo [
17,
18] in Central Europe and mySense [
19] in Portugal. VitiMeteo provides well-established forecasting models primarily focused on plant protection based on meteorological observations and biological disease-risk simulations, while mySense integrates IoT sensing, satellite observations, and UAV-based monitoring to support irrigation management and crop-status assessment at a regional scale. In contrast, the MONTEVITIS DSP was developed for operational deployment across Montenegro, where pronounced terrain heterogeneity and strong microclimatic variability over short spatial distances require dense in-field monitoring and localized alert-generation strategies, enabling stakeholder-oriented decision support adapted to region-specific environmental conditions. In contrast, the absence of a comparable platform in Montenegro limits the capacity of local viticulturists to respond effectively to these challenges. In the context of fast-paced climate change, the absence of a systematic framework that connects stakeholders and guides adaptation highlights key gaps in the implementation of precision viticulture. These gaps may limit the future development of viticulture and winemaking in Montenegro.
The importance of developing such a framework was further confirmed through the analysis of a survey conducted during one of the workshops within the scope of the MONTEVITIS project [
20]. The questionnaire aimed to explore perceptions of climate change and its potential effects on viticulture by professionals and stakeholders in Montenegro. Respondents were carefully selected based on their direct or indirect engagement with the sector, including viticulture, enology and related research activities. According to the questionnaire results presented in
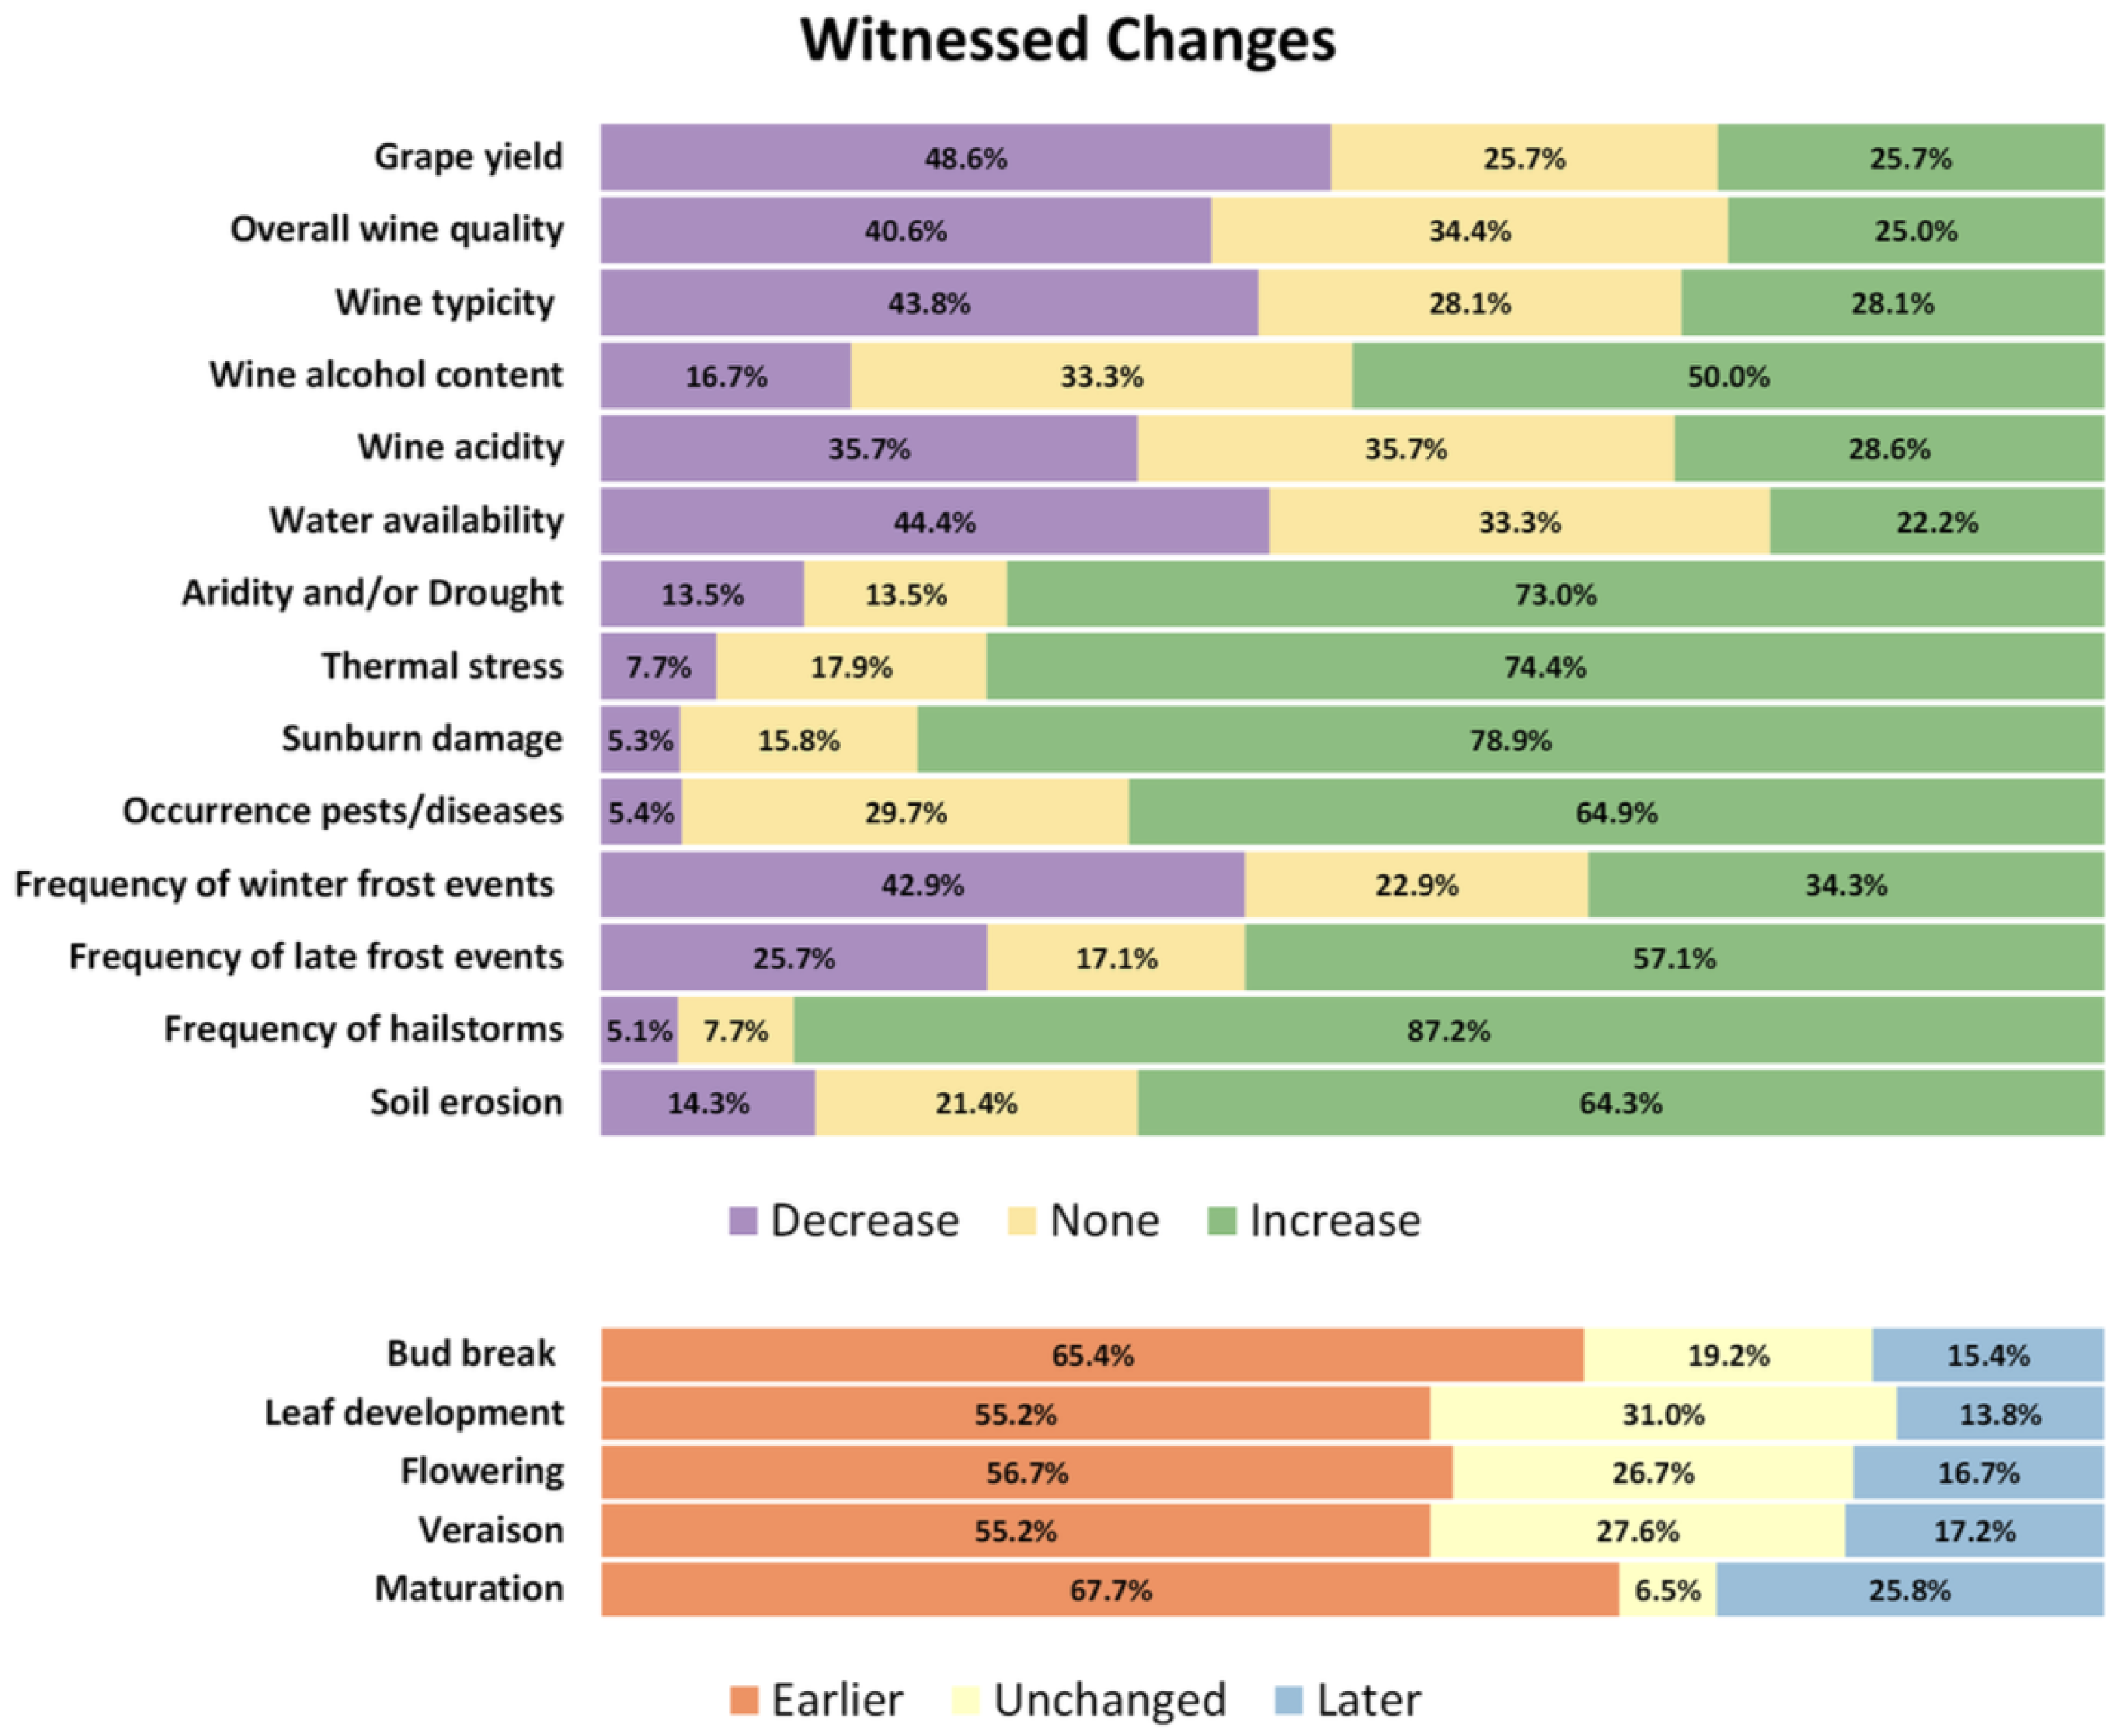
Figure 1, it is evident that the viticulture sector is already experiencing the impacts of climate change. The majority of responses align with theoretical expectations, indicating perceived decreases in grape yield, wine quality and water availability, alongside increases in frequency and intensity of extreme weather events and temperature-related damage. Among responses, the effects associated with rising temperatures and climatic extremes were the most consistently recognised by participants.
The survey analysis reinforces the need for adaptation measures in Montenegro. The usage of a decision platform is already an adaptation measure since it allows planning from the short to the long term. Such a platform would mostly help winegrowers to better understand local climate dynamics, assess potential risks and adopt strategies to safeguard the sector’s long-term sustainability. By integrating data, knowledge and tools, it could serve as a bridge between scientific research and on-the-ground decision making, promoting more resilience.
A conceptual preview of such a framework was developed within the scope of the ongoing Horizon Europe MONTEVITIS [
20,
21,
22] project and introduced in our previous paper [
23] as the first structured decision support platform (DSP) for viticulture in Montenegro. It aims at providing timely, localised viticultural scientific decision support based on real-time weather observations, historical climate data and climate projections in high resolution. Since Montenegro is a country with a very small area of 13,812 km
2 [
24], yet complex topography with several microclimates [
25] and a sparse weather station network, it is important to include multiple point-sources. The sources proposed in this context are IoT sensor data, weather stations, the gridded future climate data CHELSA [
26] (Climatologies at High Resolution for Earth’s Land Surface Areas) and observational data E-OBS [
27]. The MONTEVITIS platform addresses the current fragmentation of agro-meteorological data sources by integrating information from multiple observational and modelling datasets into a unified decision-support framework.
To address these gaps, we proposed an integrated DSP structured around three main architectural layers: (i) Data Integration Layer combining local sensor data with external datasets; (ii) Decision Support Module using statistical and model-based approaches for prediction; and (iii) Interface Layer that presents results in a user-friendly format. Although thoroughly designed, this initial DSP model remained theoretical, and its functionality and impact under real-world conditions were yet to be validated. Without implementation, the continuous connection between the three parties that take an interest in viticulture and whose collaboration is one of the baselines for an efficient strategy, planning cannot be sustained. Rapid weather changes due to global warming and its significant consequences in the viticulture sector serve as a predominant motivation for prompt and actionable attempts to put this theoretical concept into action.
The DSP was established and implemented within the MONTEVITIS project, building upon the conceptual framework proposed in our previous work. It represents the first operational decision support system developed for viticulture in Montenegro. The platform introduces an integrated system architecture, organised around three functional pillars, that connects winegrowers, researchers and policy institutions through a shared data and decision support environment. As part of this framework, vineyard-level IoT weather stations were deployed at representative vineyard sites, establishing the first sensor-based microclimatic monitoring infrastructure for viticulture in Montenegro. These observations are integrated with national meteorological records and climate datasets derived from global repositories. The system harmonises these heterogeneous data sources within a single analytical framework adapted to the small spatial scale and strong microclimatic variability of Montenegro. This implementation establishes an integrated monitoring and decision support infrastructure for viticulture in Montenegro, combining vineyard-level sensor observations, national climate data and global climate datasets while enabling structured data exchange among stakeholders.
This study has three main objectives: (i) to demonstrate the platform’s technical functionality; (ii) to assess the platform’s dashboard design and role-specific outputs; (iii) to examine the potential role of the DSP in supporting climate-informed decision-making in Montenegrin viticulture. By addressing these objectives, the study provides empirical insights into the platform’s capabilities and lays the groundwork for its broader adoption across viticultural regions facing similar climatic challenges.
The paper is organised as follows.
Section 2 focuses on the stakeholders and describes the characteristics of the partners’ vineyards.
Section 3 presents the platform deployment, structured around three main pillars.
Section 4 explains how decision support is delivered through alert systems for phenology, irrigation, and disease management, with additional functionality for yield simulation.
Section 5 discusses the challenges encountered and lessons learned during the project, while
Section 6 outlines future work and the platform’s potential for scalability.
2. Pilot Sites and Stakeholders
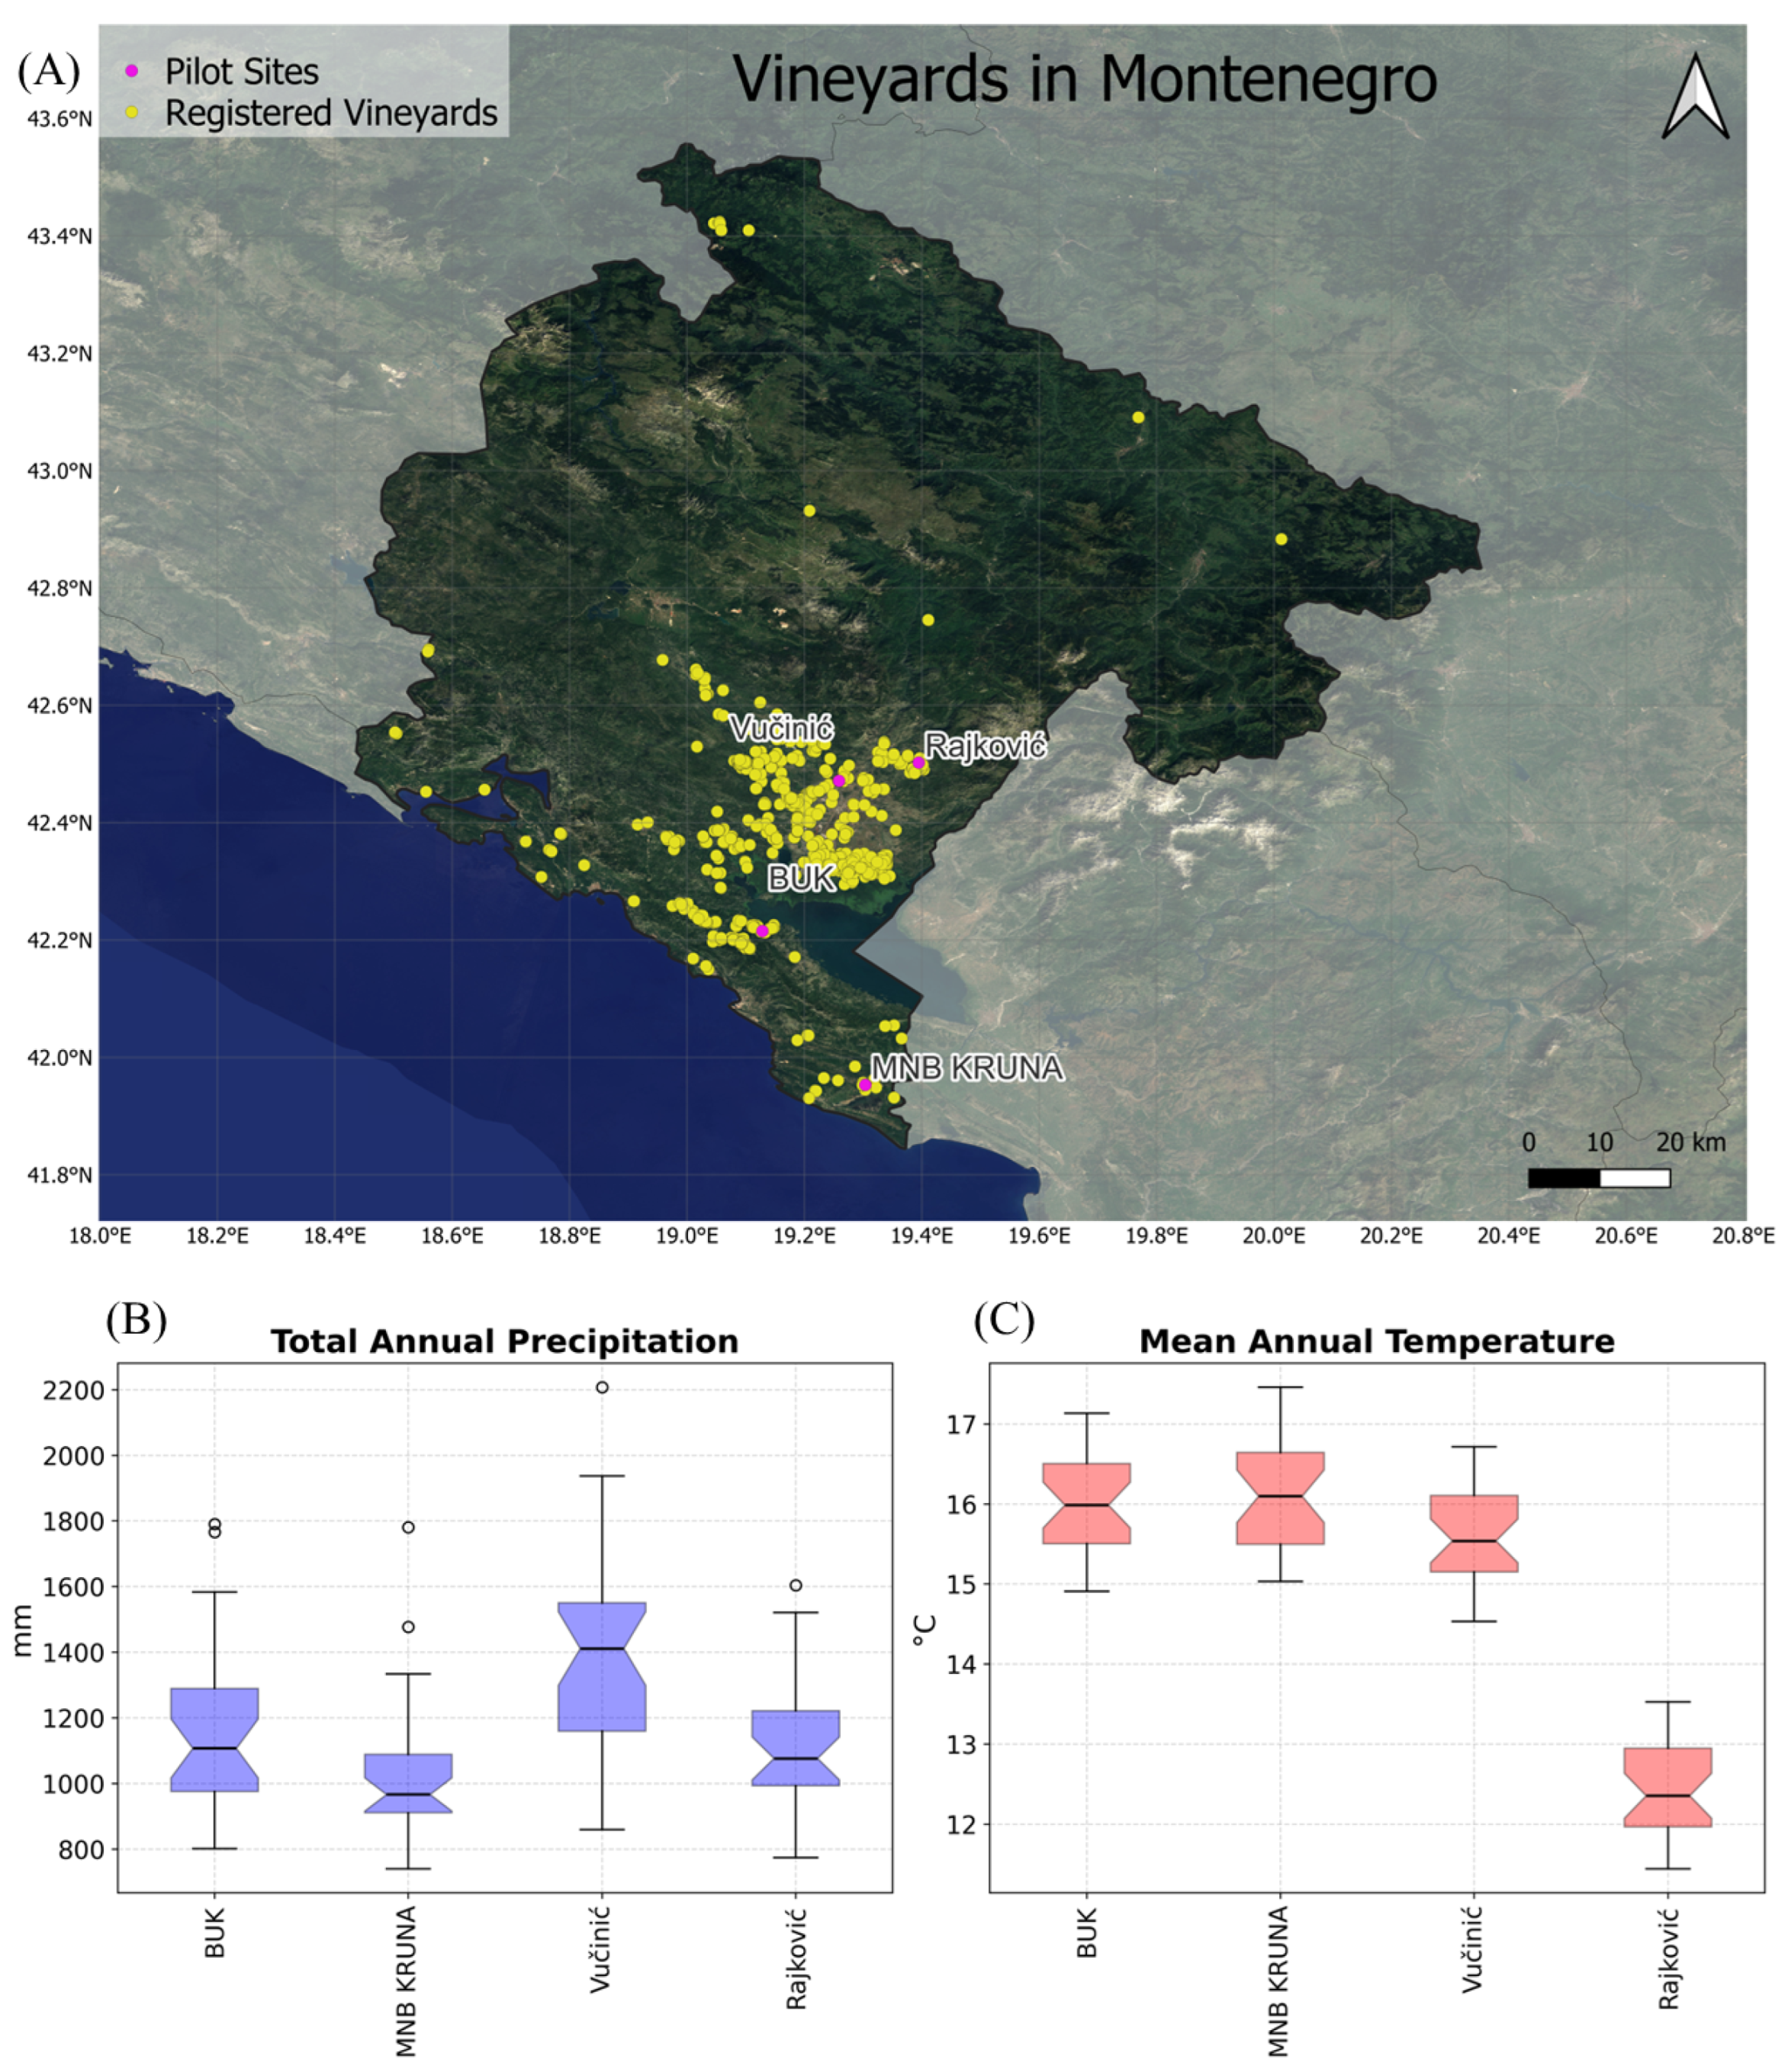
Registered vineyards in Montenegro are distributed across a highly heterogeneous landscape, encompassing Mediterranean coastal and karst zones, sub-Mediterranean lowlands, and cooler mountainous regions. This geographical and climatological diversity results in markedly different grape growing conditions, climate impacts, and management requirements across vineyards. As a consequence, effective decision support in this context requires site-specific analysis and adaptation measures rather than uniform recommendations. Within this framework, four partner vineyards were incorporated as pilot sites to capture this variability and evaluate the platform’s capacity to support parcel-level, climate-informed decision-making. The selected family-operated vineyards are Vučinić, Rajković, BUK, and MNB KRUNA [
28,
29,
30]. These four wineries are distributed across the central and southern regions of Montenegro, primarily within the Skadar Lake basin. The locations of the pilot sites and the rest of the cadastral registered vineyards [
31] are represented in
Figure 2, alongside climate normals for 1981–2010 from EOBS—mean annual average temperature and total annual precipitation. Mean annual temperature (normally distributed in all groups) differed significantly among stations (one-way ANOVA,
p < 0.001); BUK did not differ from MNB KRUNA (Tukey HSD,
p = 0.8854) or Vučinić (
p = 0.0671). Total annual precipitation (non-normal in BUK and MNB KRUNA) also differed among stations (Kruskal–Wallis,
p < 0.001); only BUK and Rajković did not differ (Mann–Whitney,
p = 0.784460).
The selected pilot sites differ in vineyard size and grape varieties, introducing further dimensions of variability for evaluating site-specific impacts and management strategies. The range of terrain, microclimates and grape varieties shown in
Table 1 illustrates the diversity of Montenegrin viticultural settings, supporting the platform to deliver site-specific functionalities and recommendations tailored to heterogeneous vineyard conditions across the country.
MNB KRUNA is located in Briska gora nearby Ulcinj in the south of Montenegro, with approximately
ha covered in grape vines. Rajković vineyards are nestled on the outskirts of Duklja in the mountain Kuči, located northwest of Podgorica. Accordingly, Rajković vineyards are the pilot site of the greatest elevation of 455 m [
28]. BUK is a vineyard in the Crmnica area, specifically Bukovik village in the Skadar Lake basin, with 7500 grapevines [
30]. Winery Vučinić is settled in the area of Rogami, near Podgorica, and it cultivates a large number of grape varieties. The diversity of locations, from the warm Mediterranean coastal–karst conditions of Briska Gora to the cooler, more humid sub-Mediterranean mountain climate of Kuči, and the terraced Mediterranean hillsides of Crmnica, ensures that the platform captures climatic variability across vineyards. These different conditions lead to distinct climate impacts on grape development, water stress and disease risk.
Autochthonous varieties Vranac and Kratošija are cultivated across all sites, representing a cornerstone of Montenegrin viticultural heritage. Alongside these, international varieties such as Cabernet Sauvignon, Chardonnay, and Marselan introduce additional diversity, highlighting the importance of considering varietal-specific responses within the platform. All the wineries have a long family tradition of vinegrowing passed down through generations.
These smaller family-run businesses, which represent the foundation of Montenegrin viticulture, could benefit from the DSP tools when it comes to optimisation of vineyard management on a parcel-by-parcel basis. Beyond the implemented pilot sites, additional users are anticipated, including large-scale producers such as Plantaže, which could benefit from coordinated production management under changing environmental conditions. This is particularly important as Plantaže is the predominant wine producer in Montenegro and one of the largest in the Balkans, focusing on both domestic and foreign wine markets.
While winegrowers represent the primary end users of the platform, additional user groups are anticipated, particularly researchers and institutional stakeholders. Researchers can utilise the continuously growing database for both academic and applied studies, including the analysis of long-term climatic trends, phenological shifts, and the development of data-driven approaches to grape variety sustainability. The platform is designed to support extensibility, enabling researchers to integrate new datasets, analytical methods, and modelling components, thereby expanding its functionality beyond the initial decision-support use cases. In this context, it may also serve as a centralised repository at the Centre for Climate Change, Natural Resources and Energy at UDG, facilitating the systematic integration of Montenegrin climatic observations with global climate datasets [
34].
Another key stakeholder and end user is the Ministry of Agriculture, Forestry, and Water Management, operating at the national policy level. By integrating localised vineyard-level observations with regional and global climatic datasets, the platform provides a structured evidence base to support strategic planning and targeted policy interventions. Within this framework, researchers contribute scientific analyses of anticipated climate impacts and adaptation options, while winegrowers supply high-resolution field data and operational feedback. This bidirectional exchange allows winegrowers to ground regulatory and support requests in scientifically supported evidence, and enables policymakers to design climate-responsive agricultural policies and assistance programs based on empirically validated, multi-source information.
3. Platform Deployment
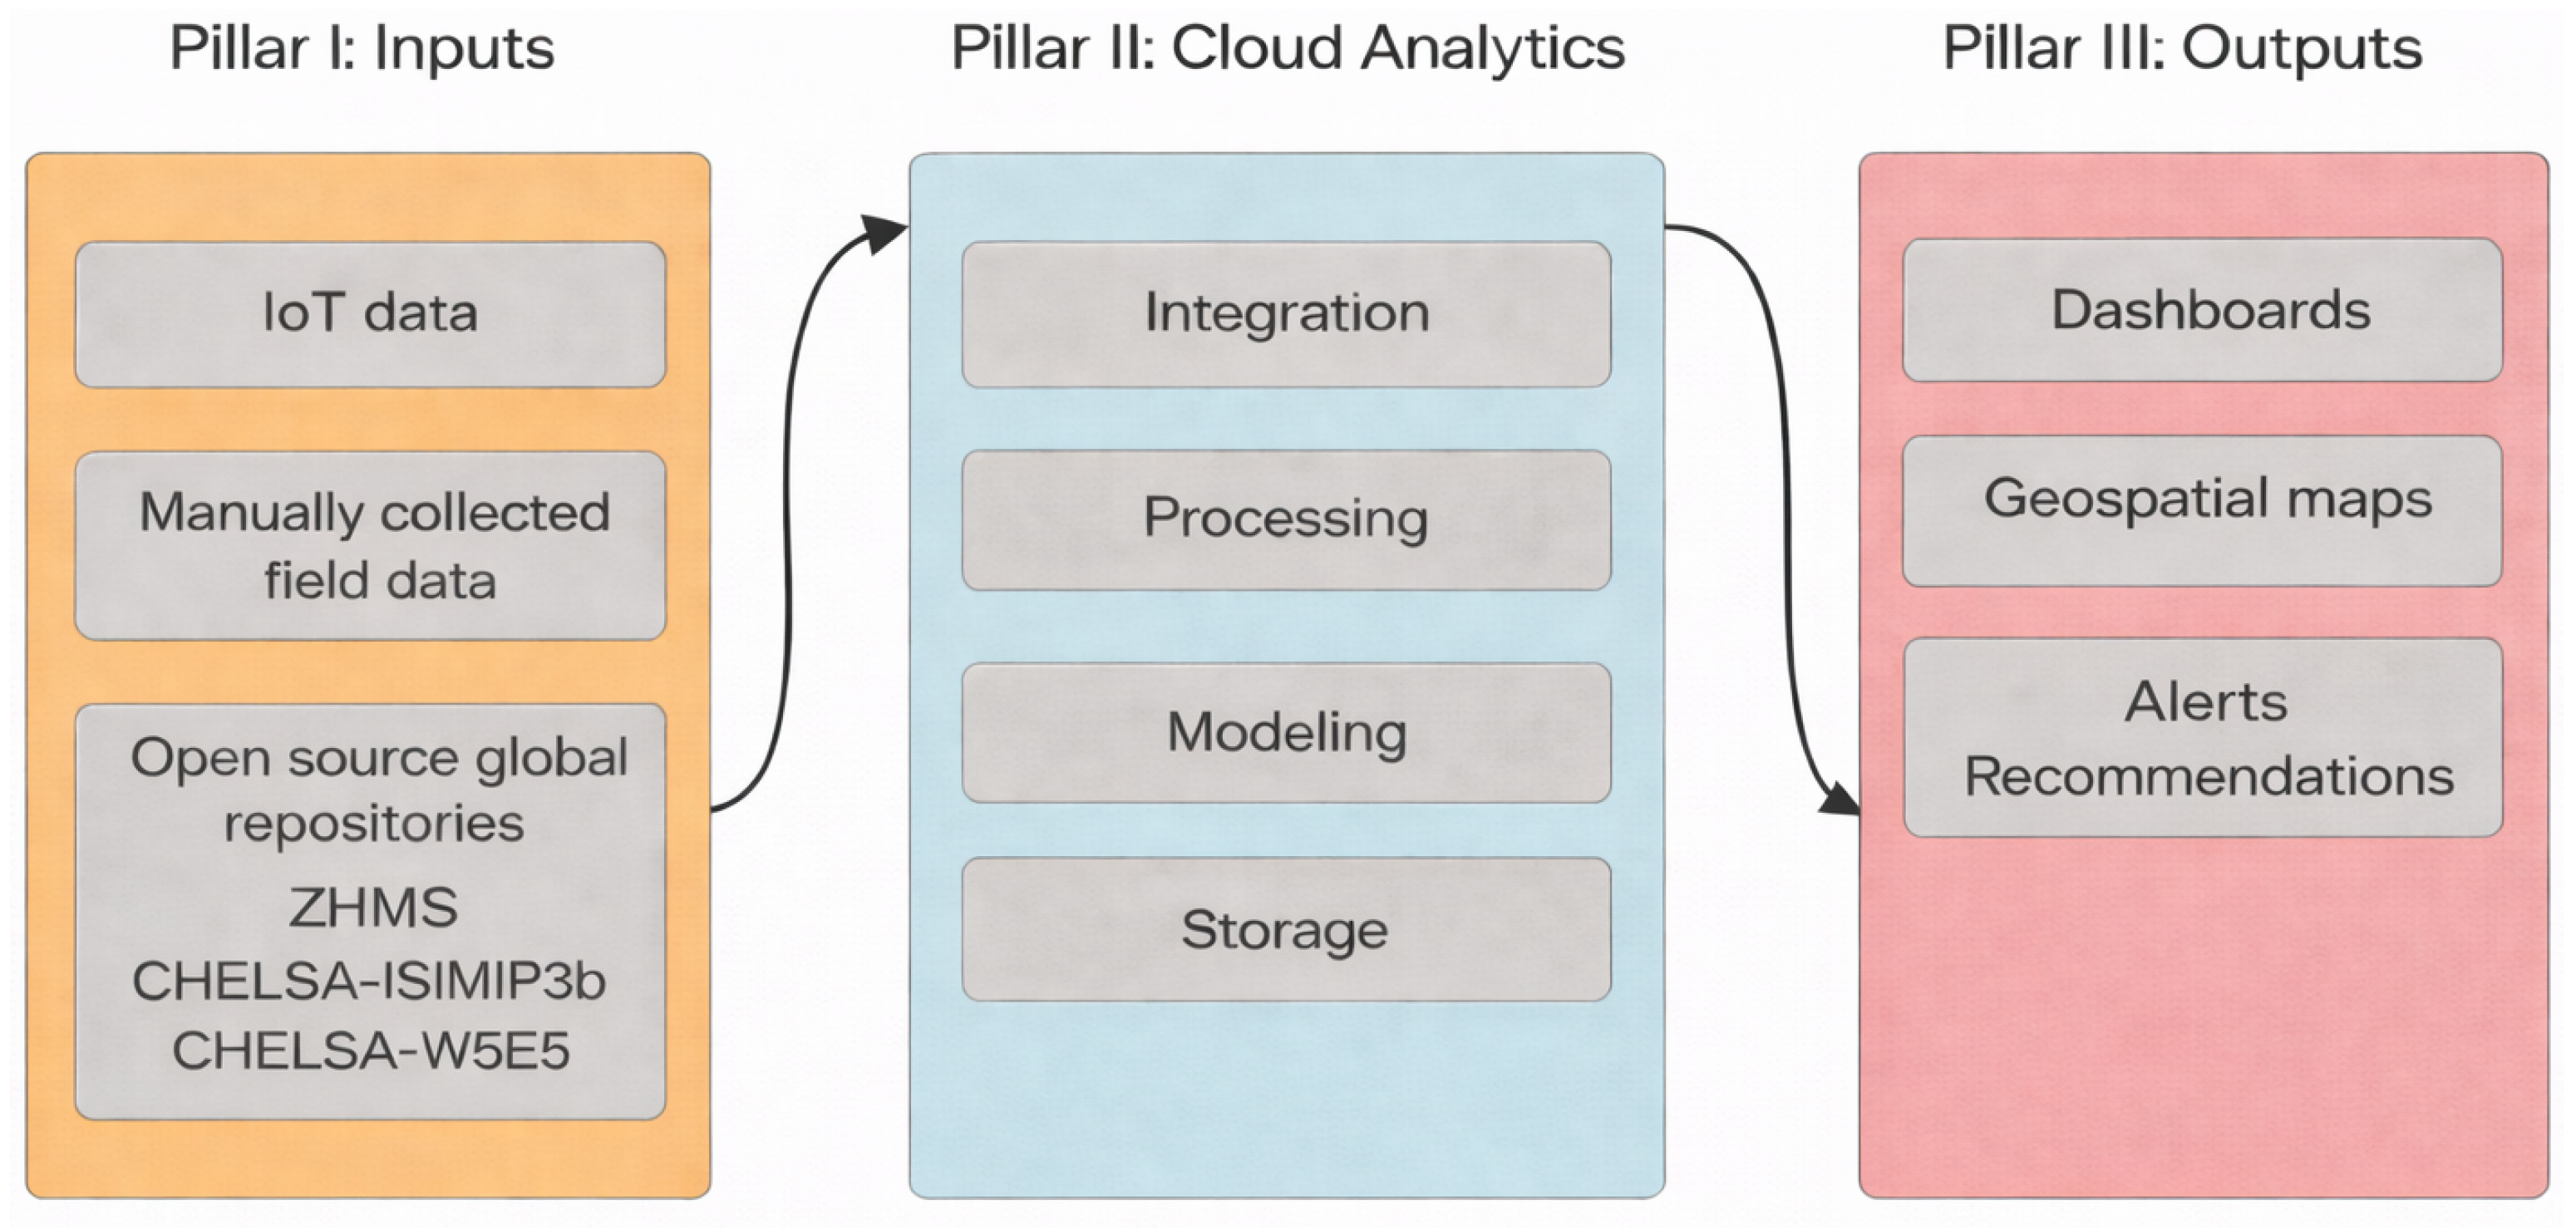
The DSP presented in this study is implemented as a three-pillar architecture comprising data acquisition (Pillar I), cloud-based analytics and modelling (Pillar II), and a decision support delivery layer (Pillar III), which translates analytical outputs into actionable information for heterogeneous stakeholder groups. The global and local data path to the dashboard is represented in the data flow diagram in
Figure 3.
While the three pillars are described sequentially, their functionality is inherently interlinked, with data acquisition and cloud analytics continuously informing the decision support layer, which operationalises these processes into spatially and temporally contextualised guidance for end users.
For the purpose of data acquisition, multiple data sources are employed, including IoT systems, field-collected data, weather stations and global repositories. The following paragraph focuses specifically on IoT-based data. Multiple sensors are installed at four project partners’ vineyard sites as IoT nodes, which operate as local in-field weather stations. There are several types of sensors that are collecting different data at high frequencies. The availability of particular sensor types across the vineyards is described in
Table 2.
IoT sensors (WS3) record temperature, air humidity, wind speed, direction and strength, air pressure and precipitation. The sensors capture these readings at a 30 min interval, providing 48 daily measurements. This enables complete near real-time insight into weather conditions locally for timely decision making. Furthermore, CO
2 sensor measures carbon concentration fluctuations that directly impact photosynthesis, resulting in physiological plant changes and phenology shifts [
35]. A capacitive sensor measures relative humidity. This parameter directly affects vine health as high humidity supports fungal diseases (downy mildew, powdery mildew and
Botrytis cinerea) and grape bursting [
36,
37]. The LTR390 is a digital sensor that detects UV-A (315–400 nm) or UV-B (280–315 nm) light. In viticulture it helps track solar UV exposure, which is important for plant growth, disease risk assessment, and sunburn prevention on grapes [
38]. All data gathered through sensors are collected in IoT nodes via a wireless network. An overview of the sensors’ key characteristics is presented in
Table 3.
Although IoT-based localized weather stations provide high-resolution, real-time data, certain limitations in data availability, such as missing values or deviations caused by periodic sensor failures, have been observed. To address these constraints, and to provide a more dense weather station network, data from national weather stations operated by the Montenegrin Institute for Hydrology and Seismology (ZHMS) is integrated [
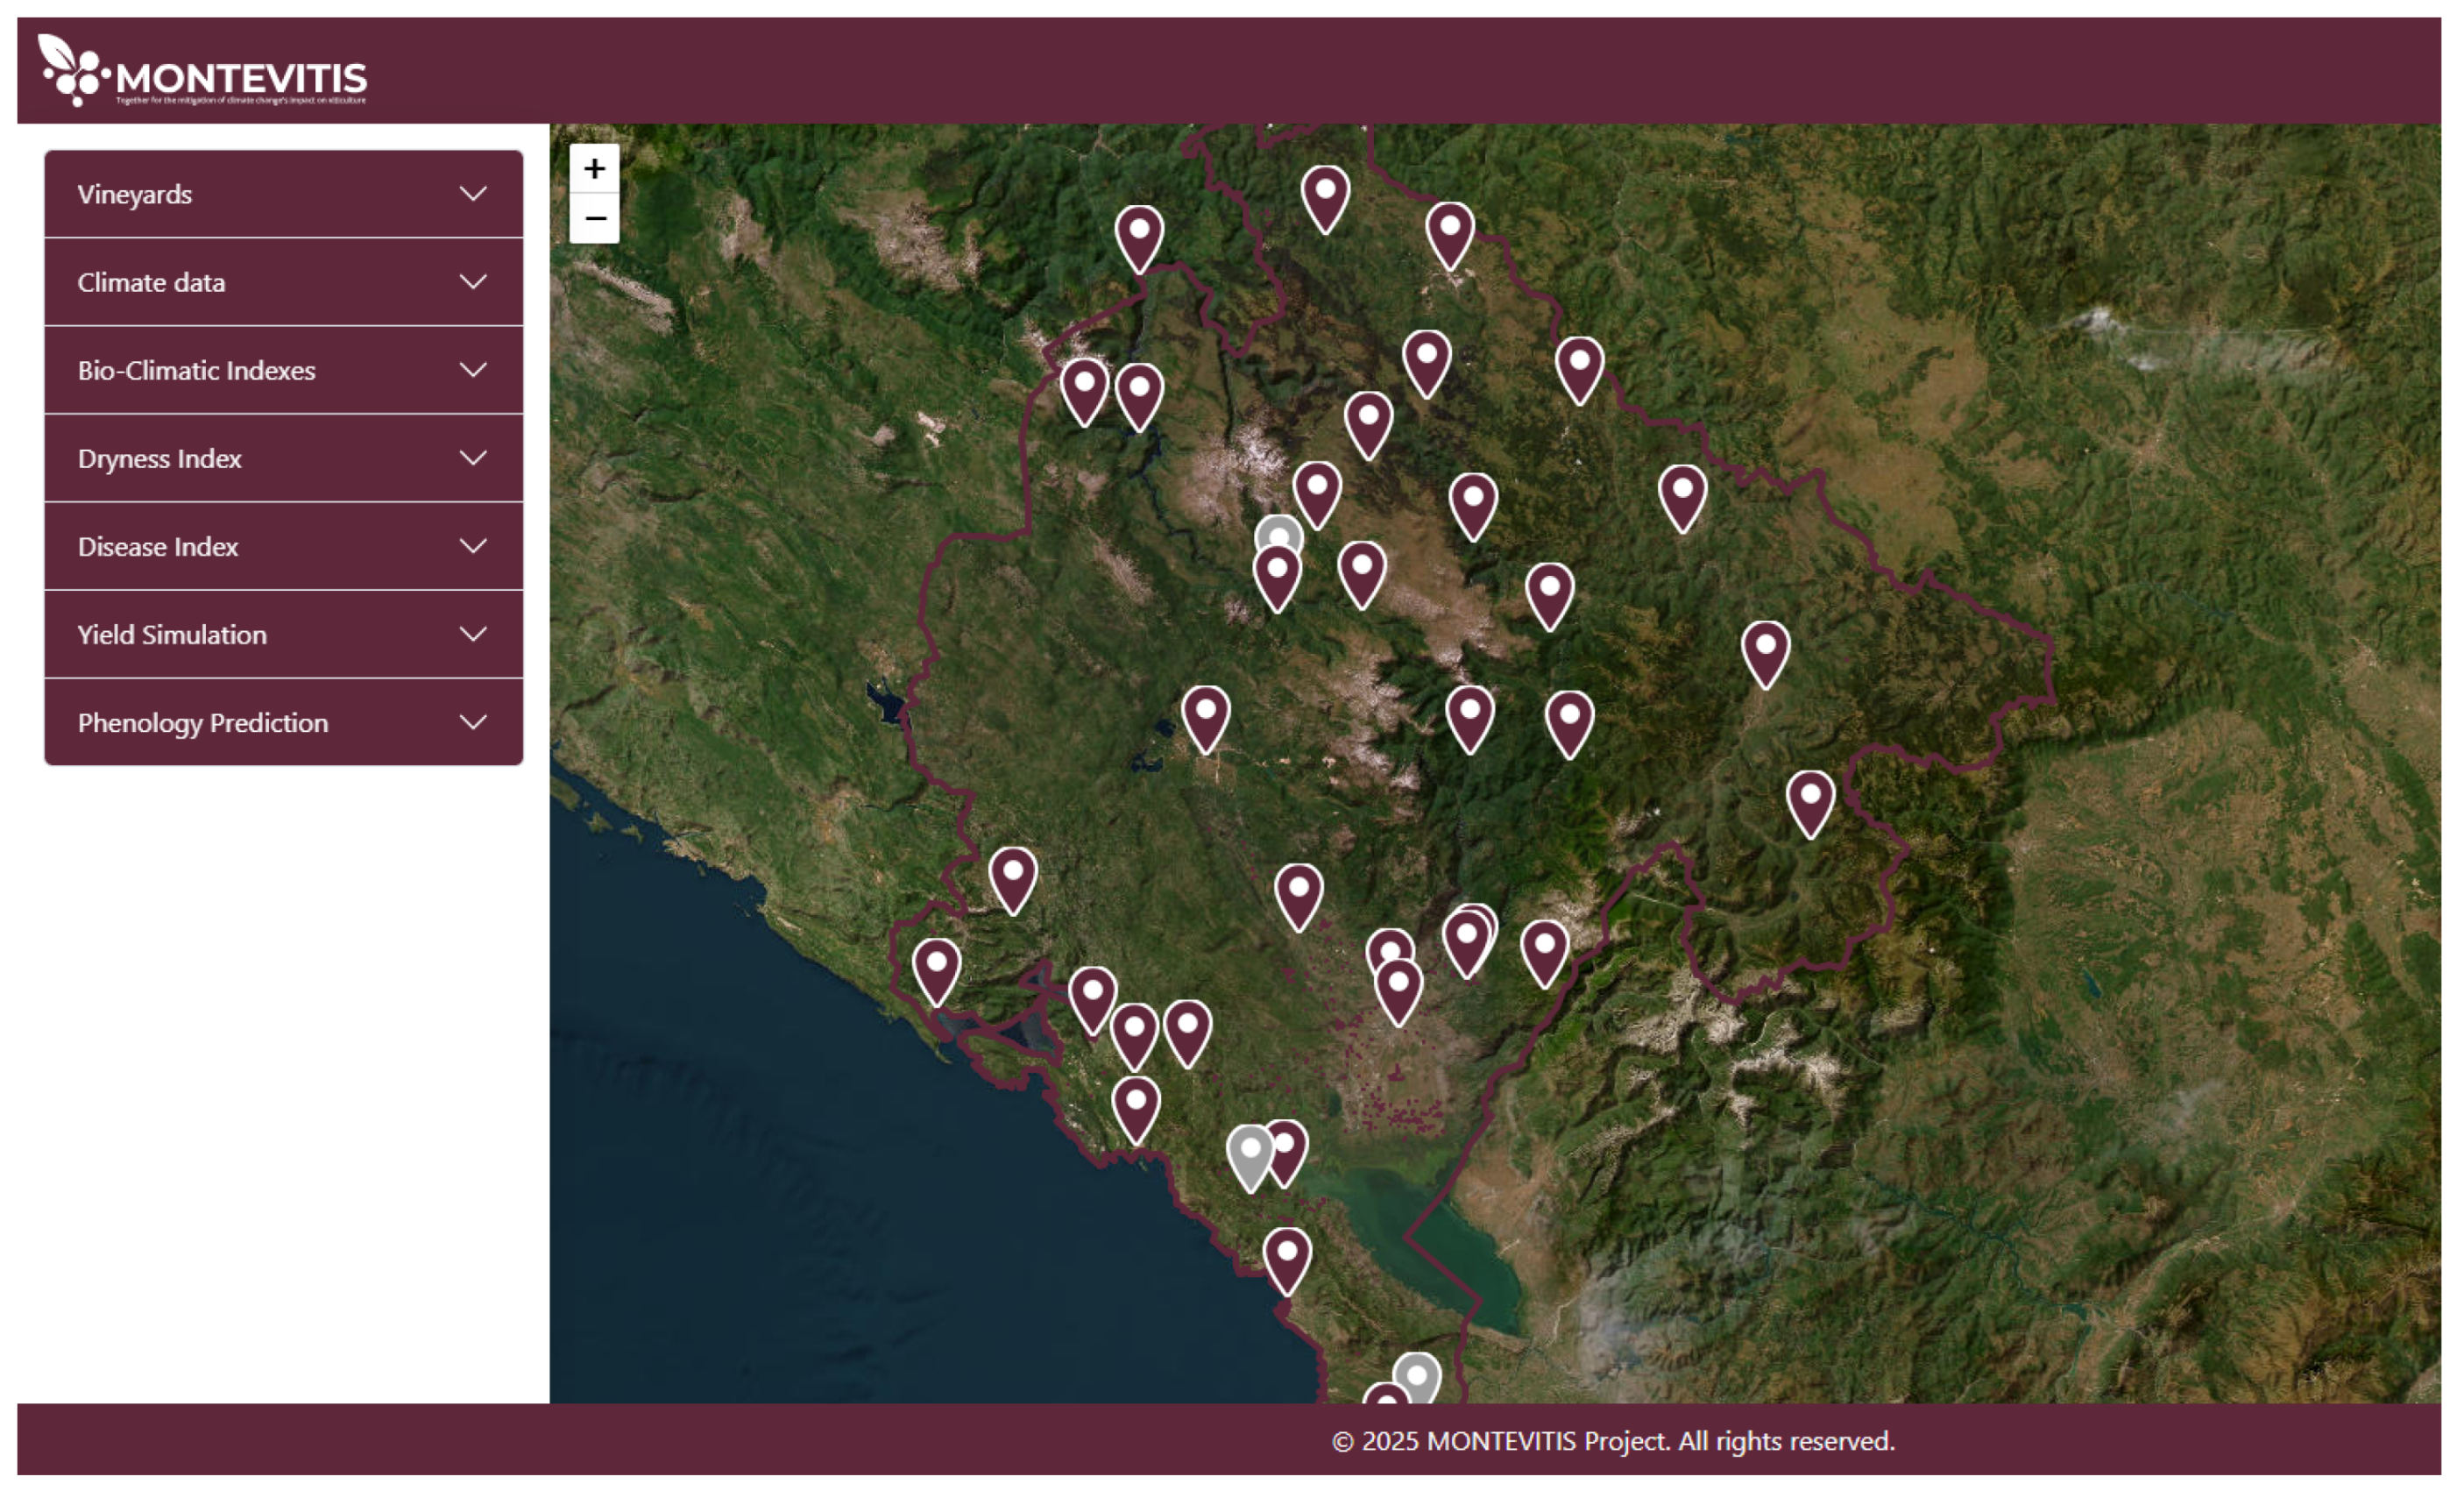
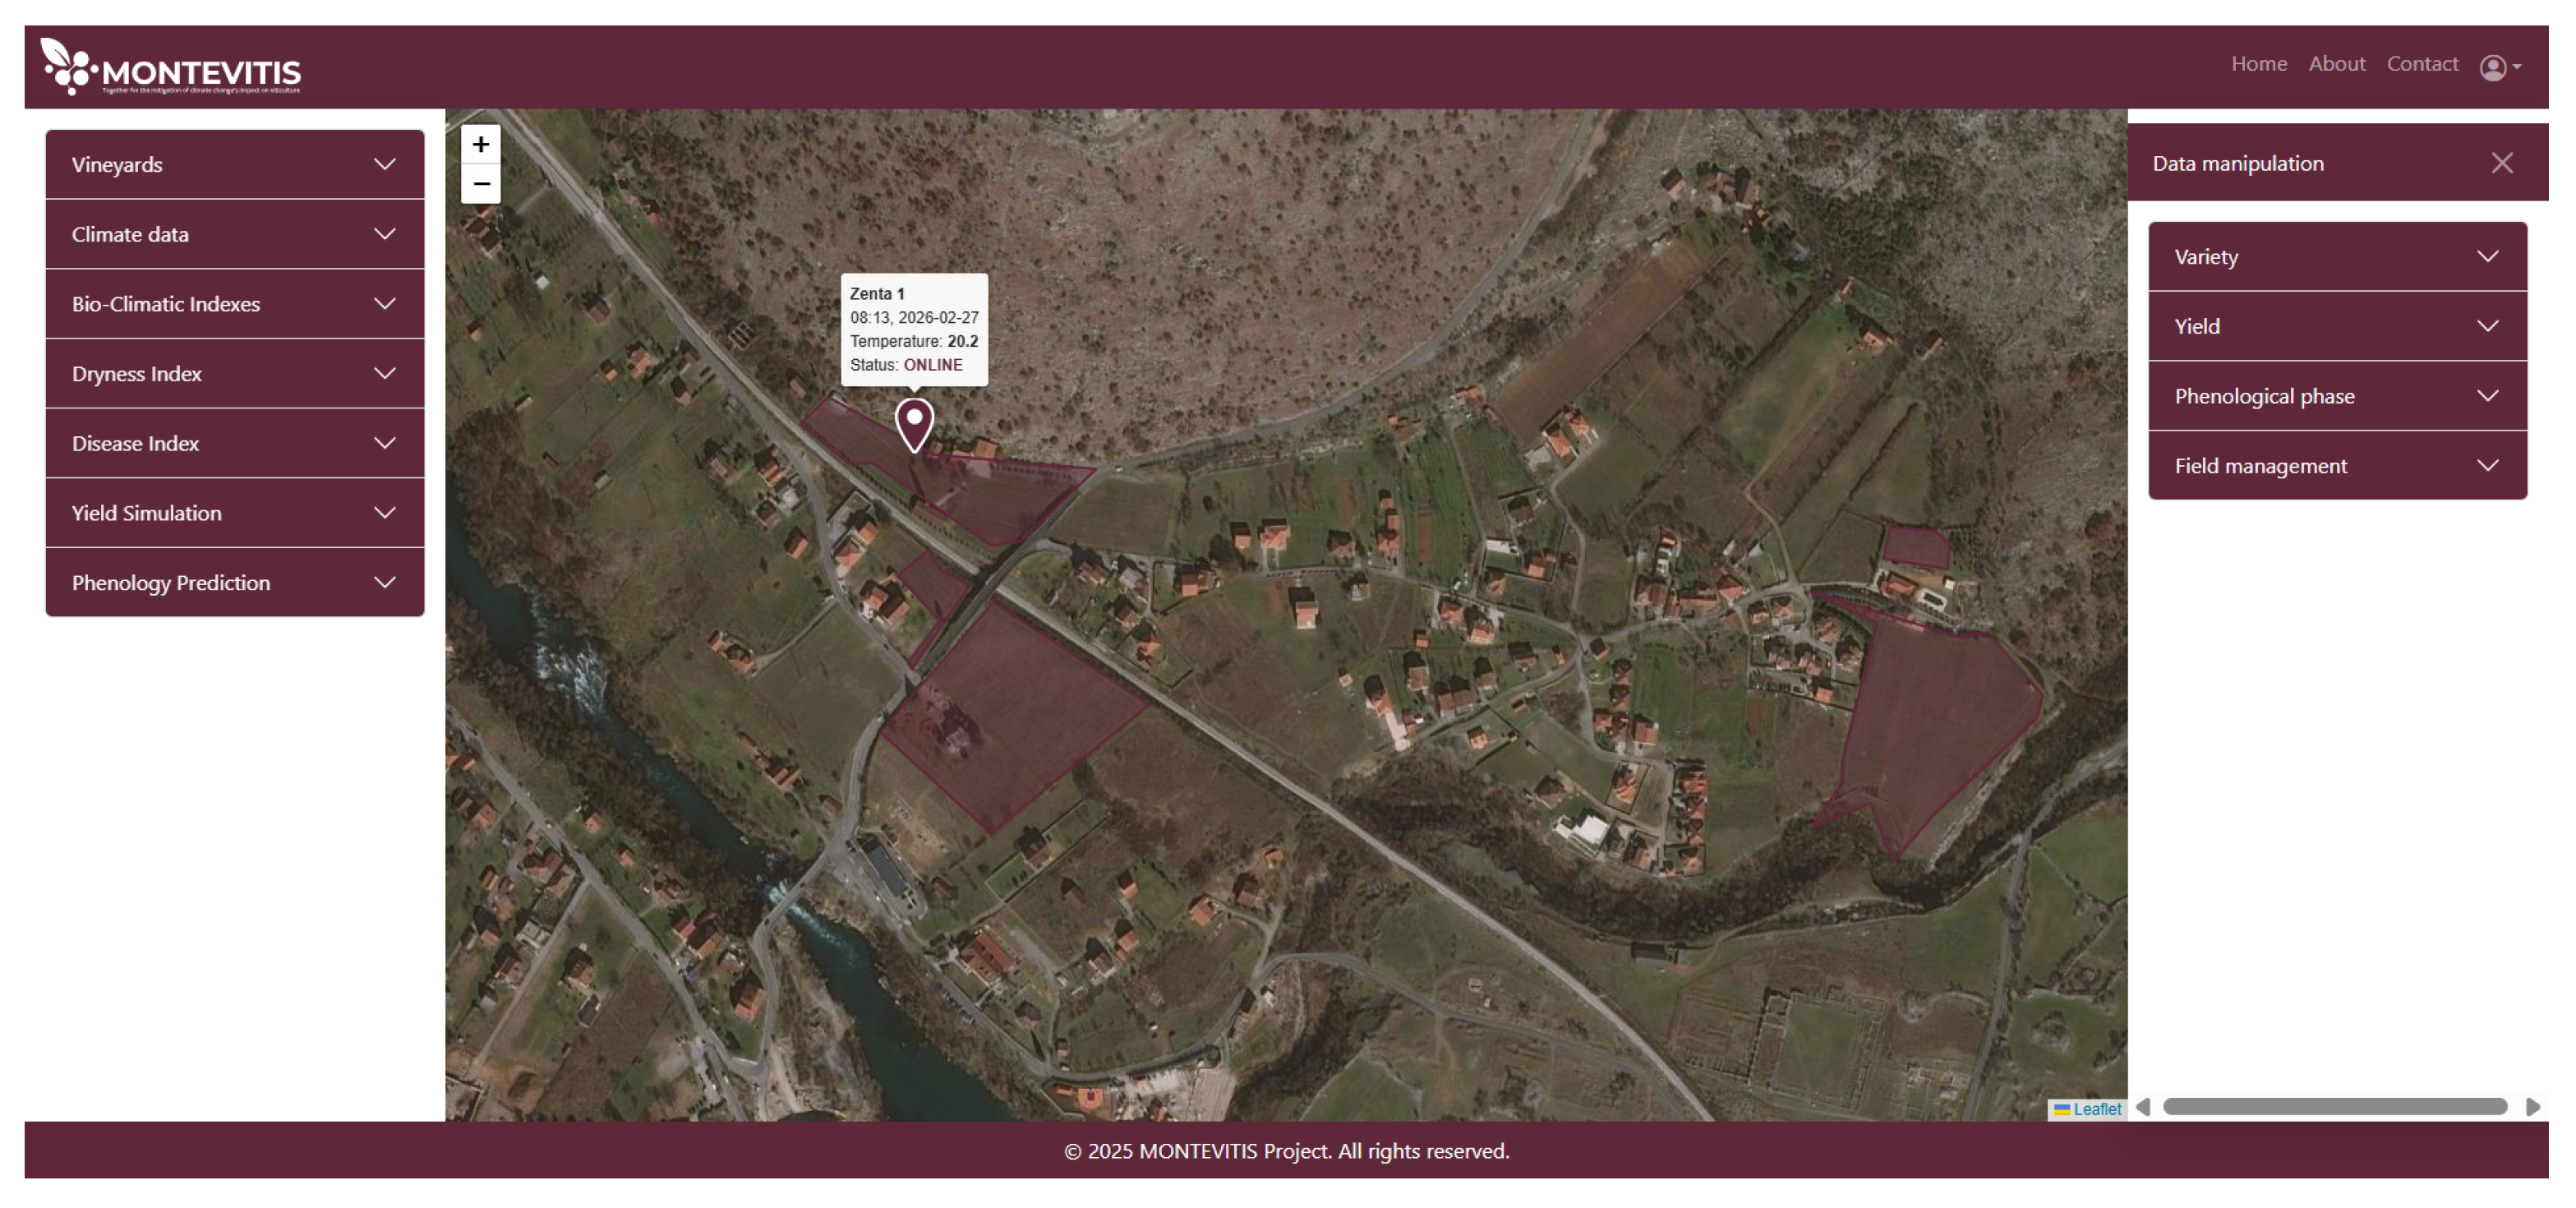
39]. Initially, the project included four weather stations located in Podgorica, Cetinje, Bar, and Ulcinj; however, since 2026, the platform has been receiving data from the complete network of ZHMS weather stations. IoT vineyard stations are used as the primary source of localized meteorological observations. In cases where IoT measurements are unavailable due to temporary sensor failures or missing values, the system automatically substitutes the corresponding observations with data from the nearest available national meteorological station operated by ZHMS. Additionally, for vineyards without installed IoT sensors, the platform automatically assigns meteorological inputs from the nearest ZHMS station based on the digital vineyard atlas, while informing the end user about the distance between the selected station and the vineyard location. A comprehensive overview of all available Vineyard IoT and national meteorological stations is provided within the platform, including real-time information on their operational status. This functionality is illustrated in
Figure 4.
To support evidence-based policy making and the generation of timely decision-support alerts, the platform integrates multiple data streams directly provided by viticulturists. The platform is designed to ensure simplified and user-friendly data input for viticulturists, as illustrated in
Figure 5. For the purpose of detailed crop monitoring and robust model development, the occurrence of phenological events is systematically recorded through the platform interface. Users can upload georeferenced photographic documentation of the current phenological stage, accompanied by its corresponding phenological code according to the BBCH scale (Leaf development 11–29, Inflorescence emergence 53–57, Flowering 60–69, Fruit development 71–79, Ripening of berries 81–89, Senescence 91–99), together with the observation date, grape variety, and parcel identifier [
40]. These records are aggregated into a structured historical phenological database, which serves as a foundation for the calibration and forecasting of phenological phase models.
Beyond phenological monitoring, the platform facilitates informed vineyard management by enabling the systematic recording of field operations. Documented management practices include treatment type (e.g., winter pruning of grapevines, removal of vine canes, basic fertilisation, herbicide application), date of application, and the associated grape variety and parcel. In addition, viticulturists report annual yield by variety, as well as detailed planting characteristics, including row spacing and intra-row planting distance. These variables collectively support the optimisation of yield and grape quality through improved data-driven management.
Additionally, upon authentication, users are provided with a geospatial overview of Montenegro displaying all pilot vineyard parcels, spatially referenced using cadastral geographic coordinates (
Figure 5). This spatial framework establishes a location-based structure for linking vineyard management records to specific parcels. In addition to pilot sites, the platform incorporates registered vineyards from the Geoportal of the Cadastre and State Property Administration of Montenegro [
32], thereby extending the spatial coverage and enabling parcel-level data association within a broader regional analytical context. The spatial representation of the registered vineyards, as displayed on the platform’s geospatial interface, constitutes a unique digital Montenegrin viticultural atlas.
To ensure a broader analytical perspective and to incorporate global data repositories beyond the IoT-derived measurements, the platform also integrates climate datasets, including both observational records and simulated projections. The Observations module within the Climate Data section is based on the CHELSA-W5E5 v1.0 dataset [
41], which represents W5E5 reanalysis data (WFDE5 merged with ERA5) downscaled using the CHELSA v2.0 framework to approximately 1 km spatial resolution. The dataset provides gridded historical climate fields (1981–2010) and serves as the observational baseline within the platform. Detailed methodological information on W5E5 bias adjustment and the CHELSA downscaling procedure is available in Lange (2019) [
42], Cucchi et al. (2020) [
43], and Karger et al. (2021) [
44].
For long-term decision making based on climate projections, the CHELSA downscaling framework [
44,
45] was used to produce a high-resolution database (hereinafter referred to as CHELSA-ISIMIP3b). The employed dataset on the platform originates from bias-adjusted climate projections of the Inter-Sectoral Impact Model Intercomparison Project (ISIMIP3b; 0.5°
km resolution) [
46,
47], derived from the Coupled Model Intercomparison Project Phase 6 (CMIP6) [
48,
49]. Daily outputs from nine GCMs were processed for both historical (1981–2014) and future (2015–2100) periods. The selected GCMs were: CanESM5, CNRM-CM6-1, CNRM-ESM2-1, EC-Earth3, IPSL-CM6A-LR, MIROC6, MPI-155 ESM1-2-LR, MRI-ESM2-0, and UKESM1-0-LL. To explore different future scenarios, three Shared Socio-Economic Pathways (SSPs) were processed for the future period: SSP1-
, representing a sustainability-oriented future (lower GHG emissions); SSP3-
, a moderately pessimistic trajectory; and SSP5-
, a high-emission, fossil-fuel-intensive scenario [
50]. The dataset includes daily minimum, mean, and maximum temperature and precipitation downscaled to 30 arc-second resolution (approximately 1 km). These data sets are integrated into the platform’s modelling component, allowing users to visualise both historical baselines and projected future conditions at vineyard scale.
Daily data served as input for the calculation of bioclimatic indices, calculated for each GCM, scenario and year. Indices related to viticulture reported in the literature as relevant for decision making were computed: total annual precipitation [
51]; growing season precipitation [
52]; annual average temperature [
53]; growing season temperature [
51]; growing degree days for a base of 10° [
54]; Winkler index [
55]; biologically effective degree days [
56]; hydrothermal index of Branas; Huglin index [
57]; cool night index [
57]; dryness index [
57] and De Martonne Index [
58]. Additionally, temperature and precipitation extremes indices were computed to display the future potential risk of extreme events [
59]. These indices are relevant in the context of decision-making; for example, the Winkler index classifies wine-growing regions and wine types based on the accumulation of temperature [
55]. Another example is the average growing season temperature, which allows for selecting the most suitable grape varieties [
60].
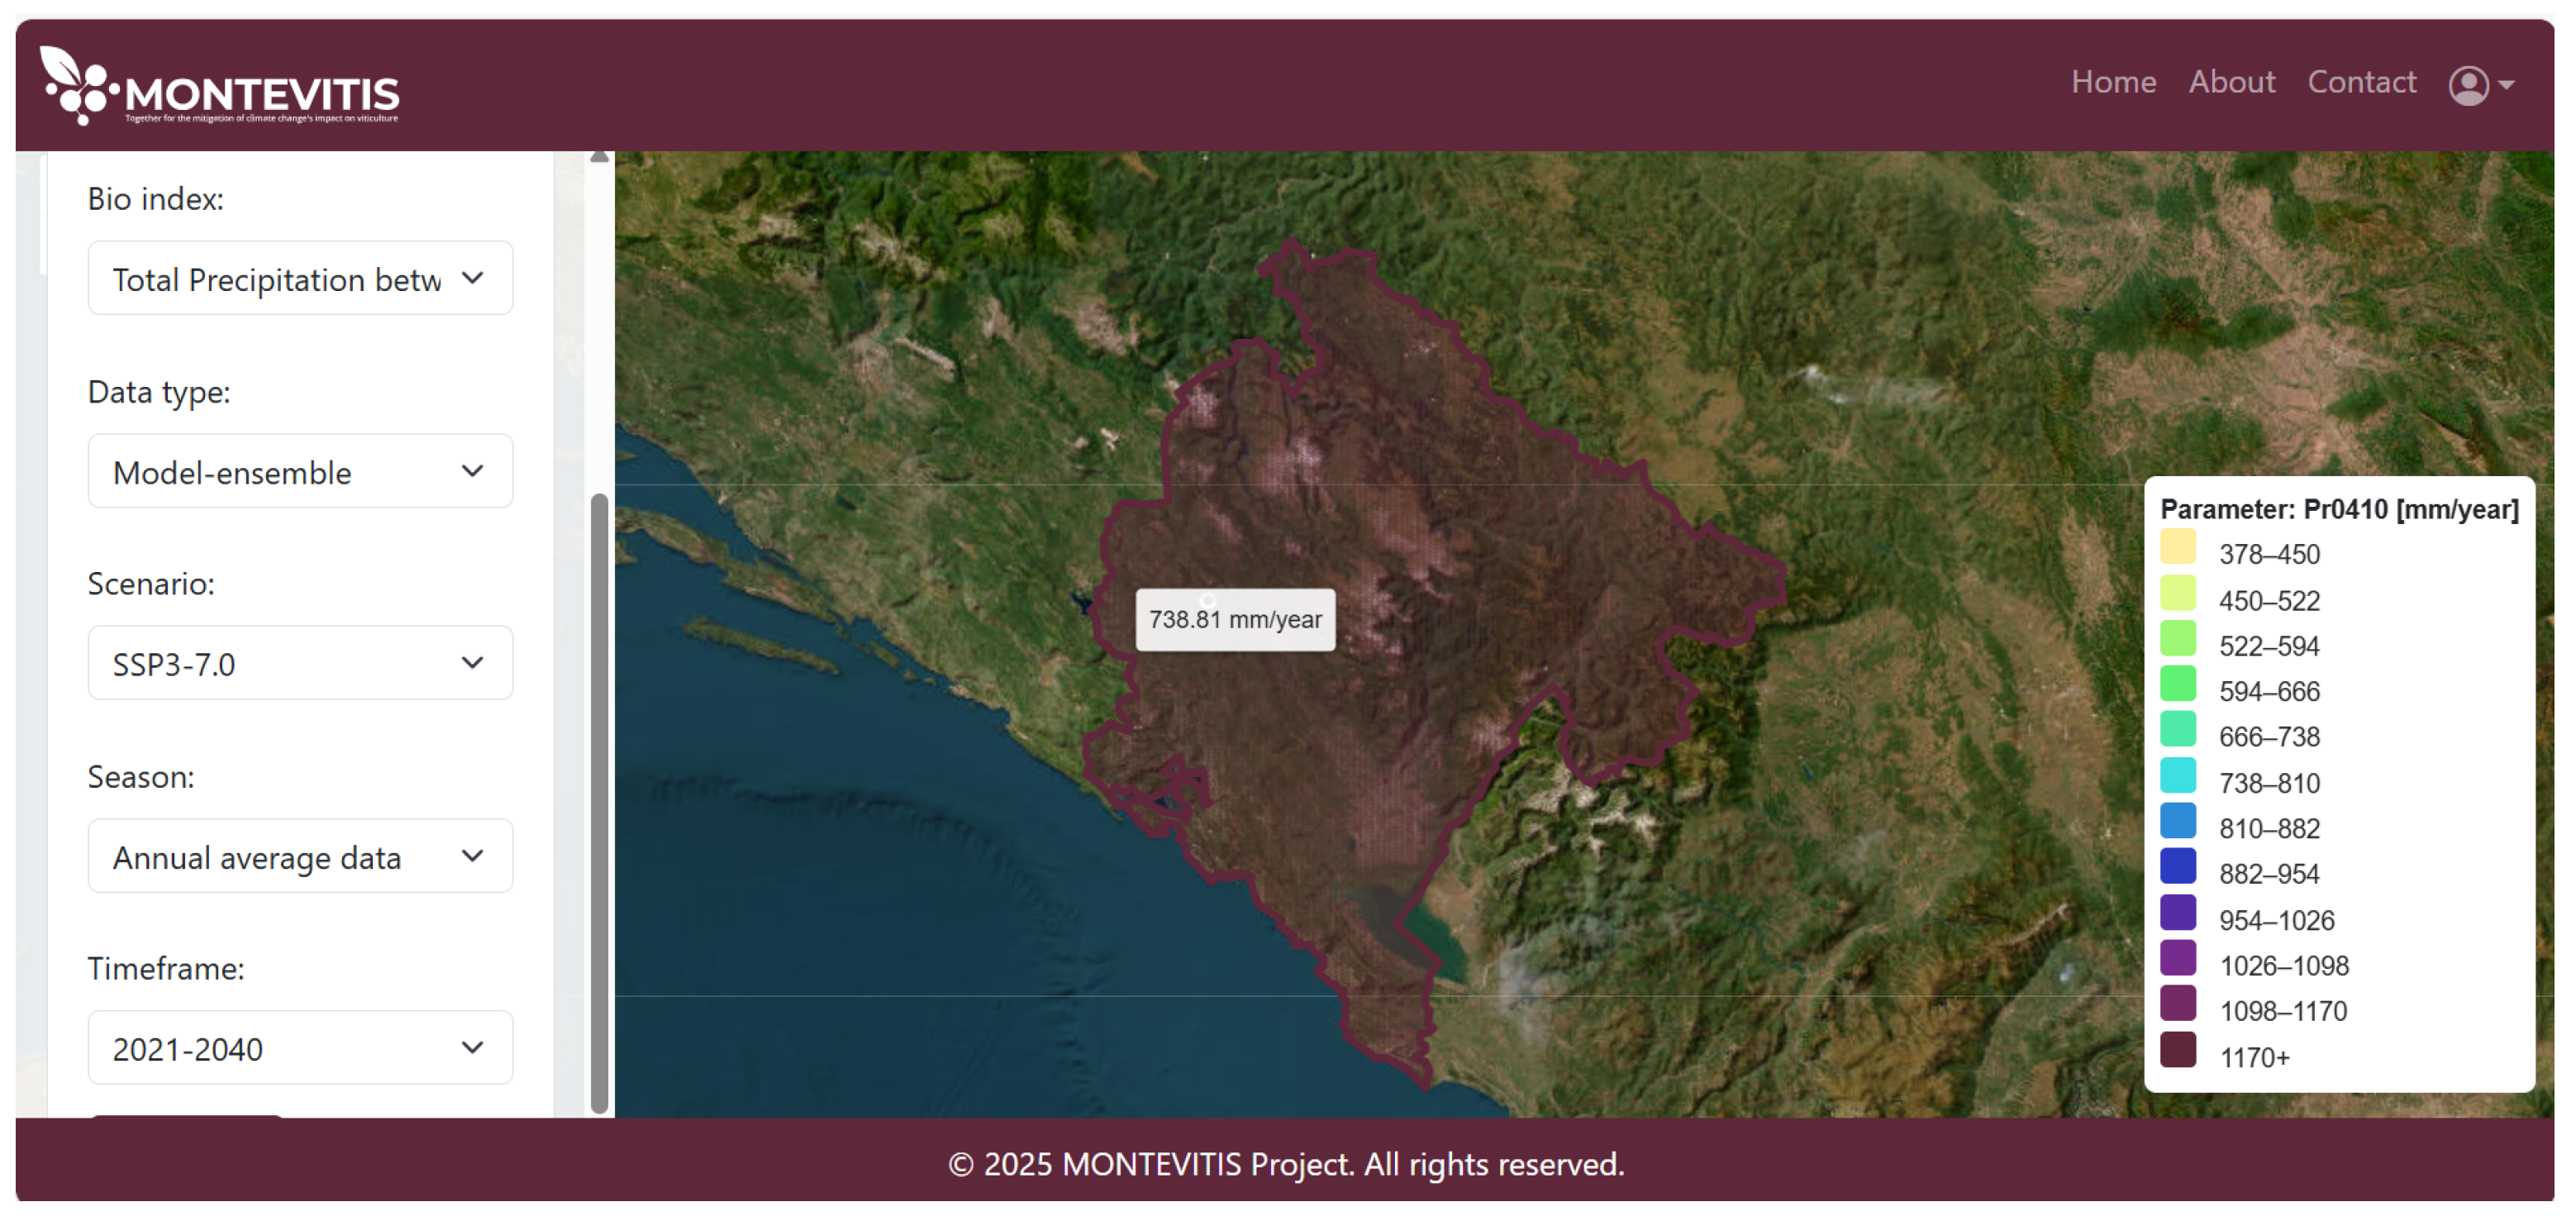
For the bioclimatic indices (annual time steps), the nine-member ensemble mean was calculated for each scenario for periods of 20 or 30 years (e.g., 2041–2060, 2041–2070), for the time range 1981–2100. Climate normals of bioclimatic indices are subsequently operationalised within the decision support delivery layer (Pillar III) through geospatial representations on the platform, enabling interpretation of long-term climate change. In contrast, the annual bioclimatic indices and daily data are available upon request. These two groups are not directly accessible on the platform, as this data requires higher computing capacity and expertise to interpret. To ensure the platform remains user-friendly, only multi-model ensemble means of bioclimatic climate normals are directly accessible. For example, the platform representation of the climate normal (2021–2040) of total precipitation between April and October under SSP3 is presented in
Figure 6.
Building on the heterogeneous data streams described in Pillar I, the cloud-based analytics layer (Pillar II) operates on preprocessed, validated, and harmonized datasets to perform data integration, aggregation, and modeling, thereby transforming curated observations and climate projections into decision-relevant indicators. Within this module, IoT data are verified and complemented through gap-filling procedures using ZHMS meteorological records to ensure input reliability and consistency. ZHMS observations, originally collected at a 30 min temporal resolution, are subsequently aggregated to derive daily summary statistics.
The platform architecture is centred on a cloud-based infrastructure that supports data ingestion, processing, and storage. This modular, cloud-deployed design ensures scalability and facilitates the efficient integration of heterogeneous datasets. Data from IoT and ZHMS sources are transmitted to the cloud through a standardised RESTful API [
61]. IoT nodes communicate with the cloud in real time via GSM or LoRa [
62] wireless uplinks, with data formatted in JSON and delivered through secure HTTPS requests. Both IoT and ZHMS data are automatically ingested and stored in a centralised database. Once ingested, the data is processed within the cloud-based processing layer. Additional aggregation and derivation steps are performed, such as the computation of hourly (1 h) and daily (24 h) precipitation totals, as well as minimum, maximum, and mean temperature values. Weather data can be aggregated at hourly, daily, or annual temporal scales, depending on end-user requirements, and are presented through user-friendly graphical visualisations for selected time periods. Although system-level performance metrics such as low-latency response times, strict uptime guarantees, or zero data-loss rates are commonly used in real-time control systems, their relevance in the context of climate-driven decision support platforms is inherently limited. The MONTEVITIS DSP operates on aggregated temporal scales (e.g., 30-min sampling intervals and daily model updates), where minor delays in data transmission or processing do not significantly affect the validity of generated indicators or alerts. Similarly, short-term data gaps caused by IoT sensor interruptions do not critically impact system outputs, as the platform integrates multiple data sources and implements automatic gap-filling procedures using national meteorological observations (ZHMS), thereby preserving temporal continuity and analytical robustness.
From an operational perspective, system performance is therefore better characterised in terms of data availability, redundancy, and robustness rather than strict latency or loss minimisation. The distributed IoT infrastructure provides near real-time environmental monitoring, while the cloud-based architecture ensures scalable data ingestion, processing, and storage. The combination of heterogeneous data streams and fallback mechanisms enables stable platform operation under real-world conditions, even in the presence of connectivity limitations and partial data loss, which are typical for agricultural IoT deployments.
The MONTEVITIS platform implements a distributed data storage and retention architecture designed to ensure long-term data availability, integrity, and system resilience. All collected data are retained permanently, as no deletion policy is applied, enabling longitudinal climate analyses, model calibration, and retrospective evaluation of vineyard management practices. Raw high-resolution IoT observations are stored on a primary server in their original 30-min temporal resolution, while aggregated and processed datasets (e.g., hourly and daily summaries and derived indicators) are stored on a secondary geographically dislocated server, providing an additional redundancy layer. Both servers are subject to periodic backup procedures, with full system backups performed on a 15-day cycle and optional incremental backups between cycles to reduce potential data-loss windows. This architecture enables recovery of datasets in the event of hardware failure, data corruption, or connectivity disruptions and provides baseline disaster-recovery capability appropriate for agricultural decision-support applications. Additional safeguards include secure HTTPS-based RESTful API communication and structured validation during data ingestion to ensure consistency and reliability of incoming data streams.
Within the modelling layer, deterministic bioclimatic indices, such as the Goidanich [
63] and Dryness indices [
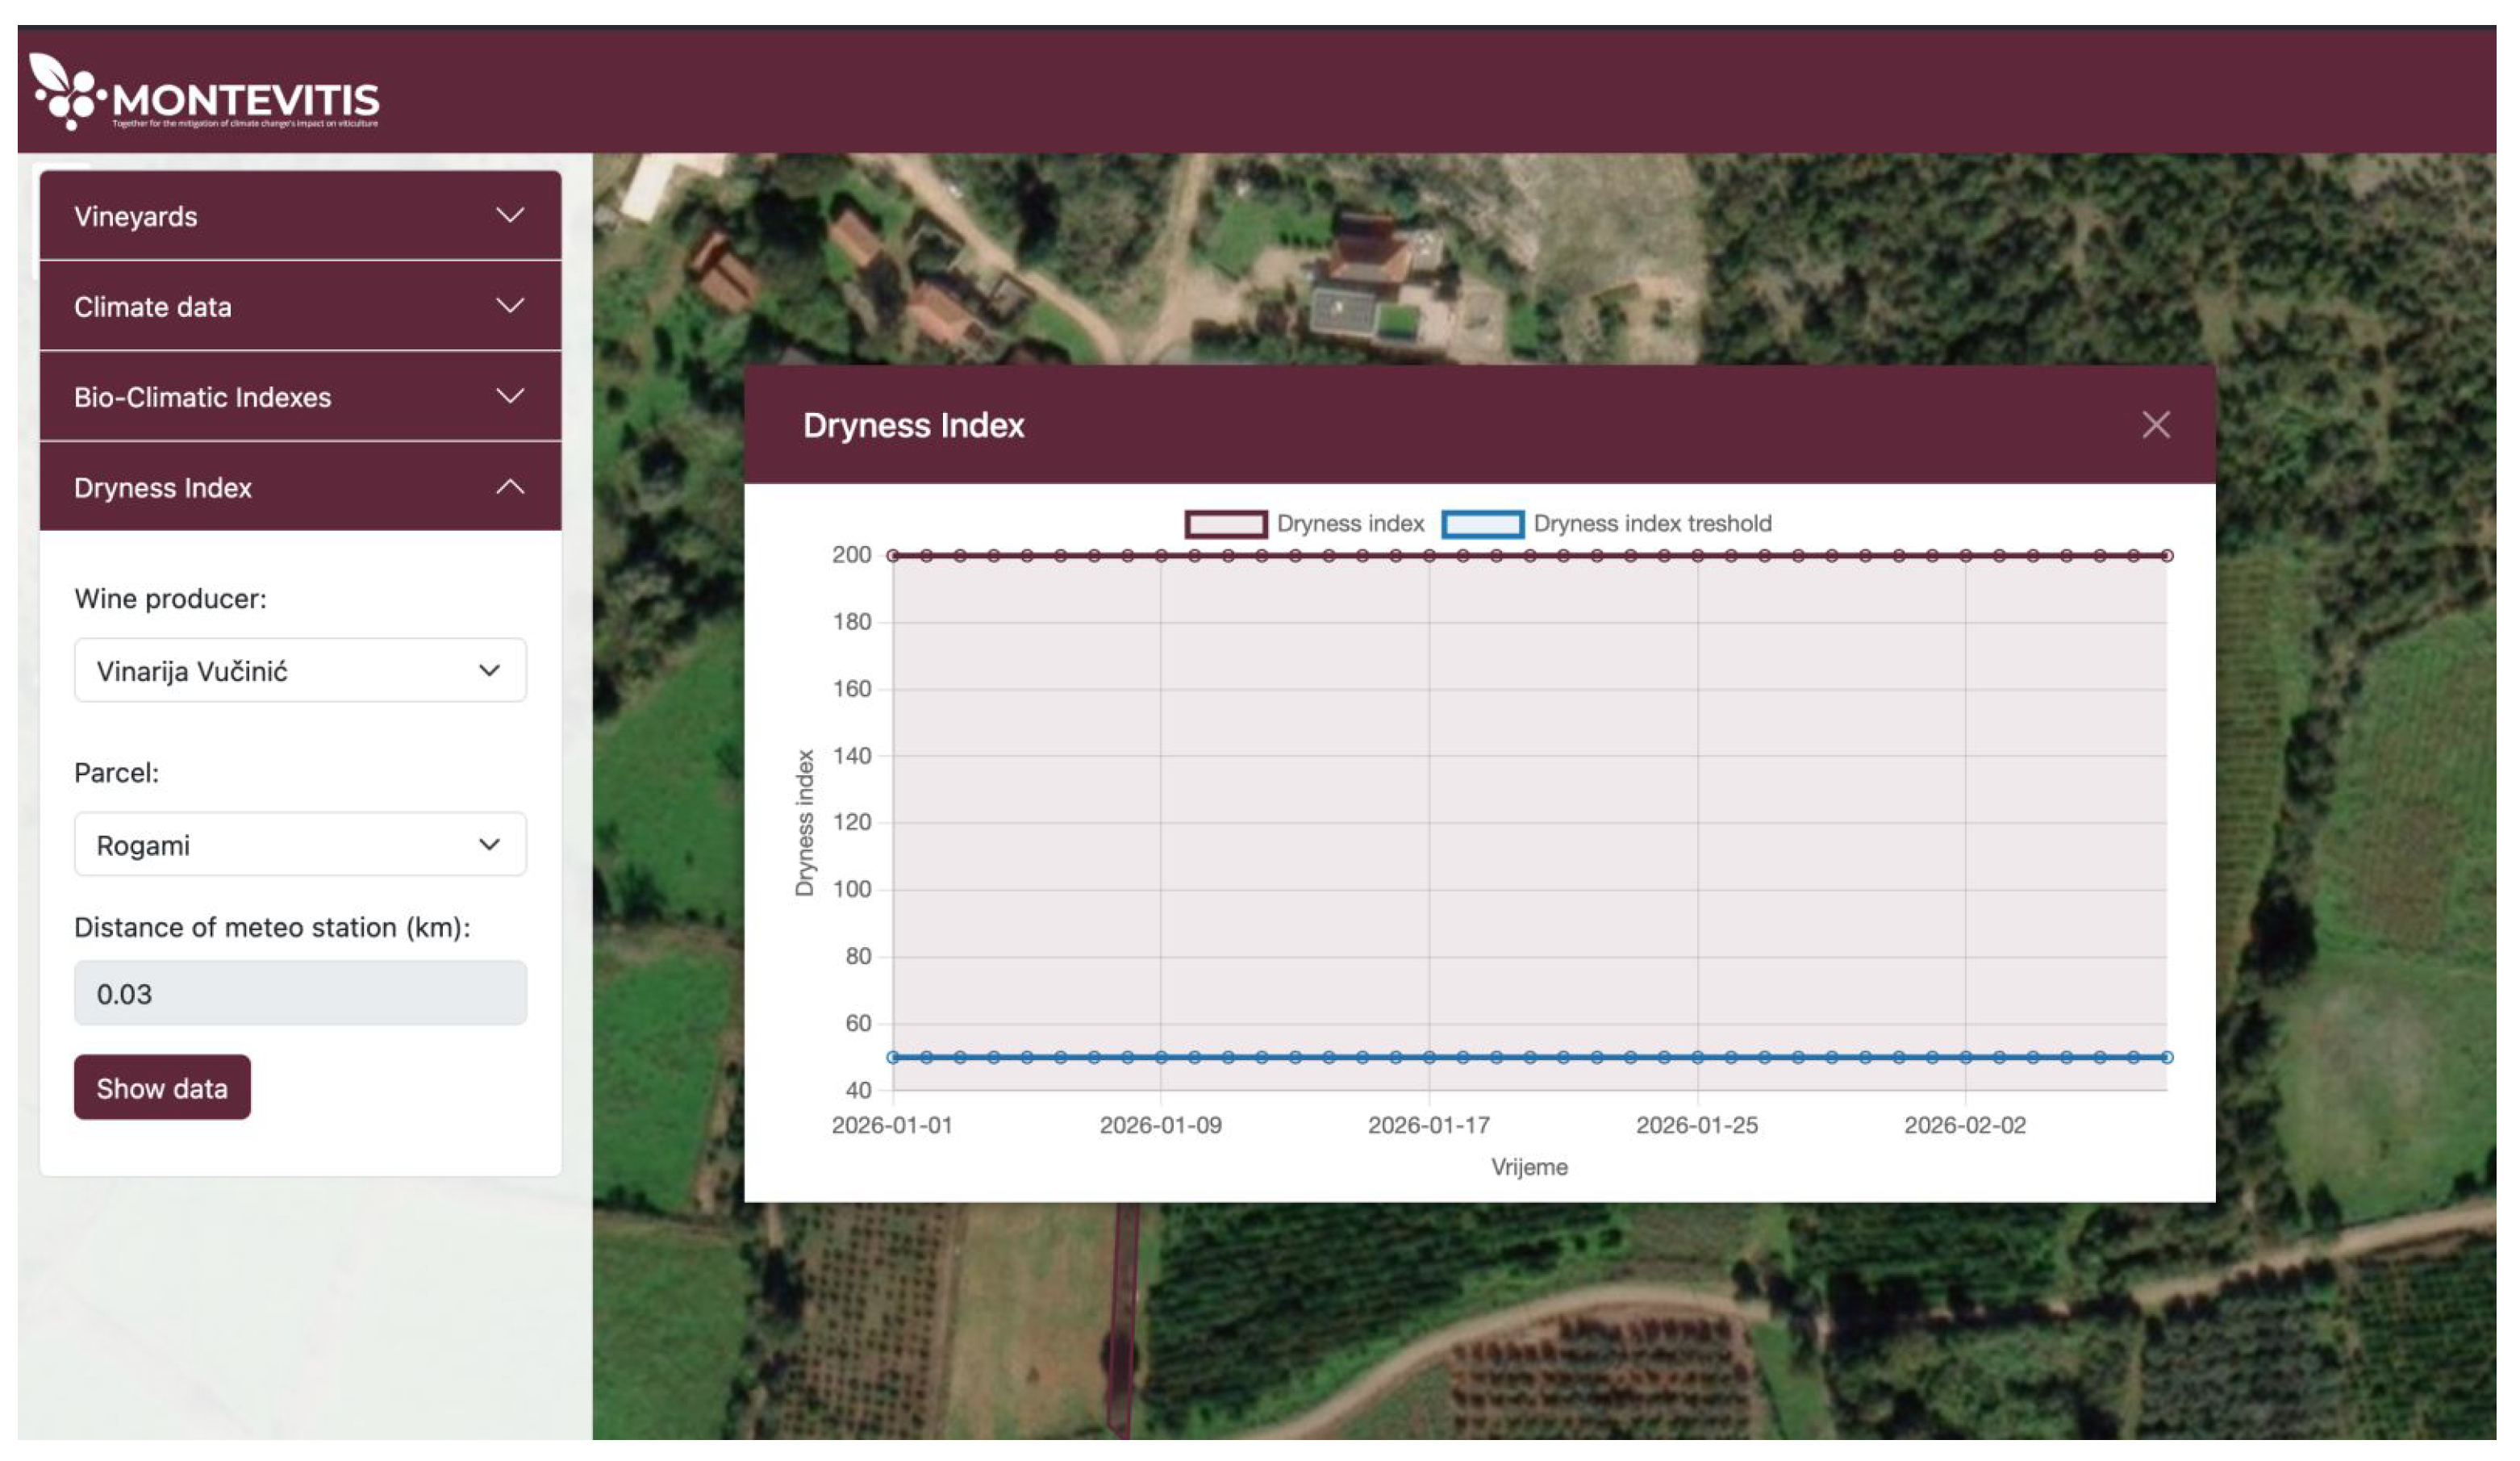
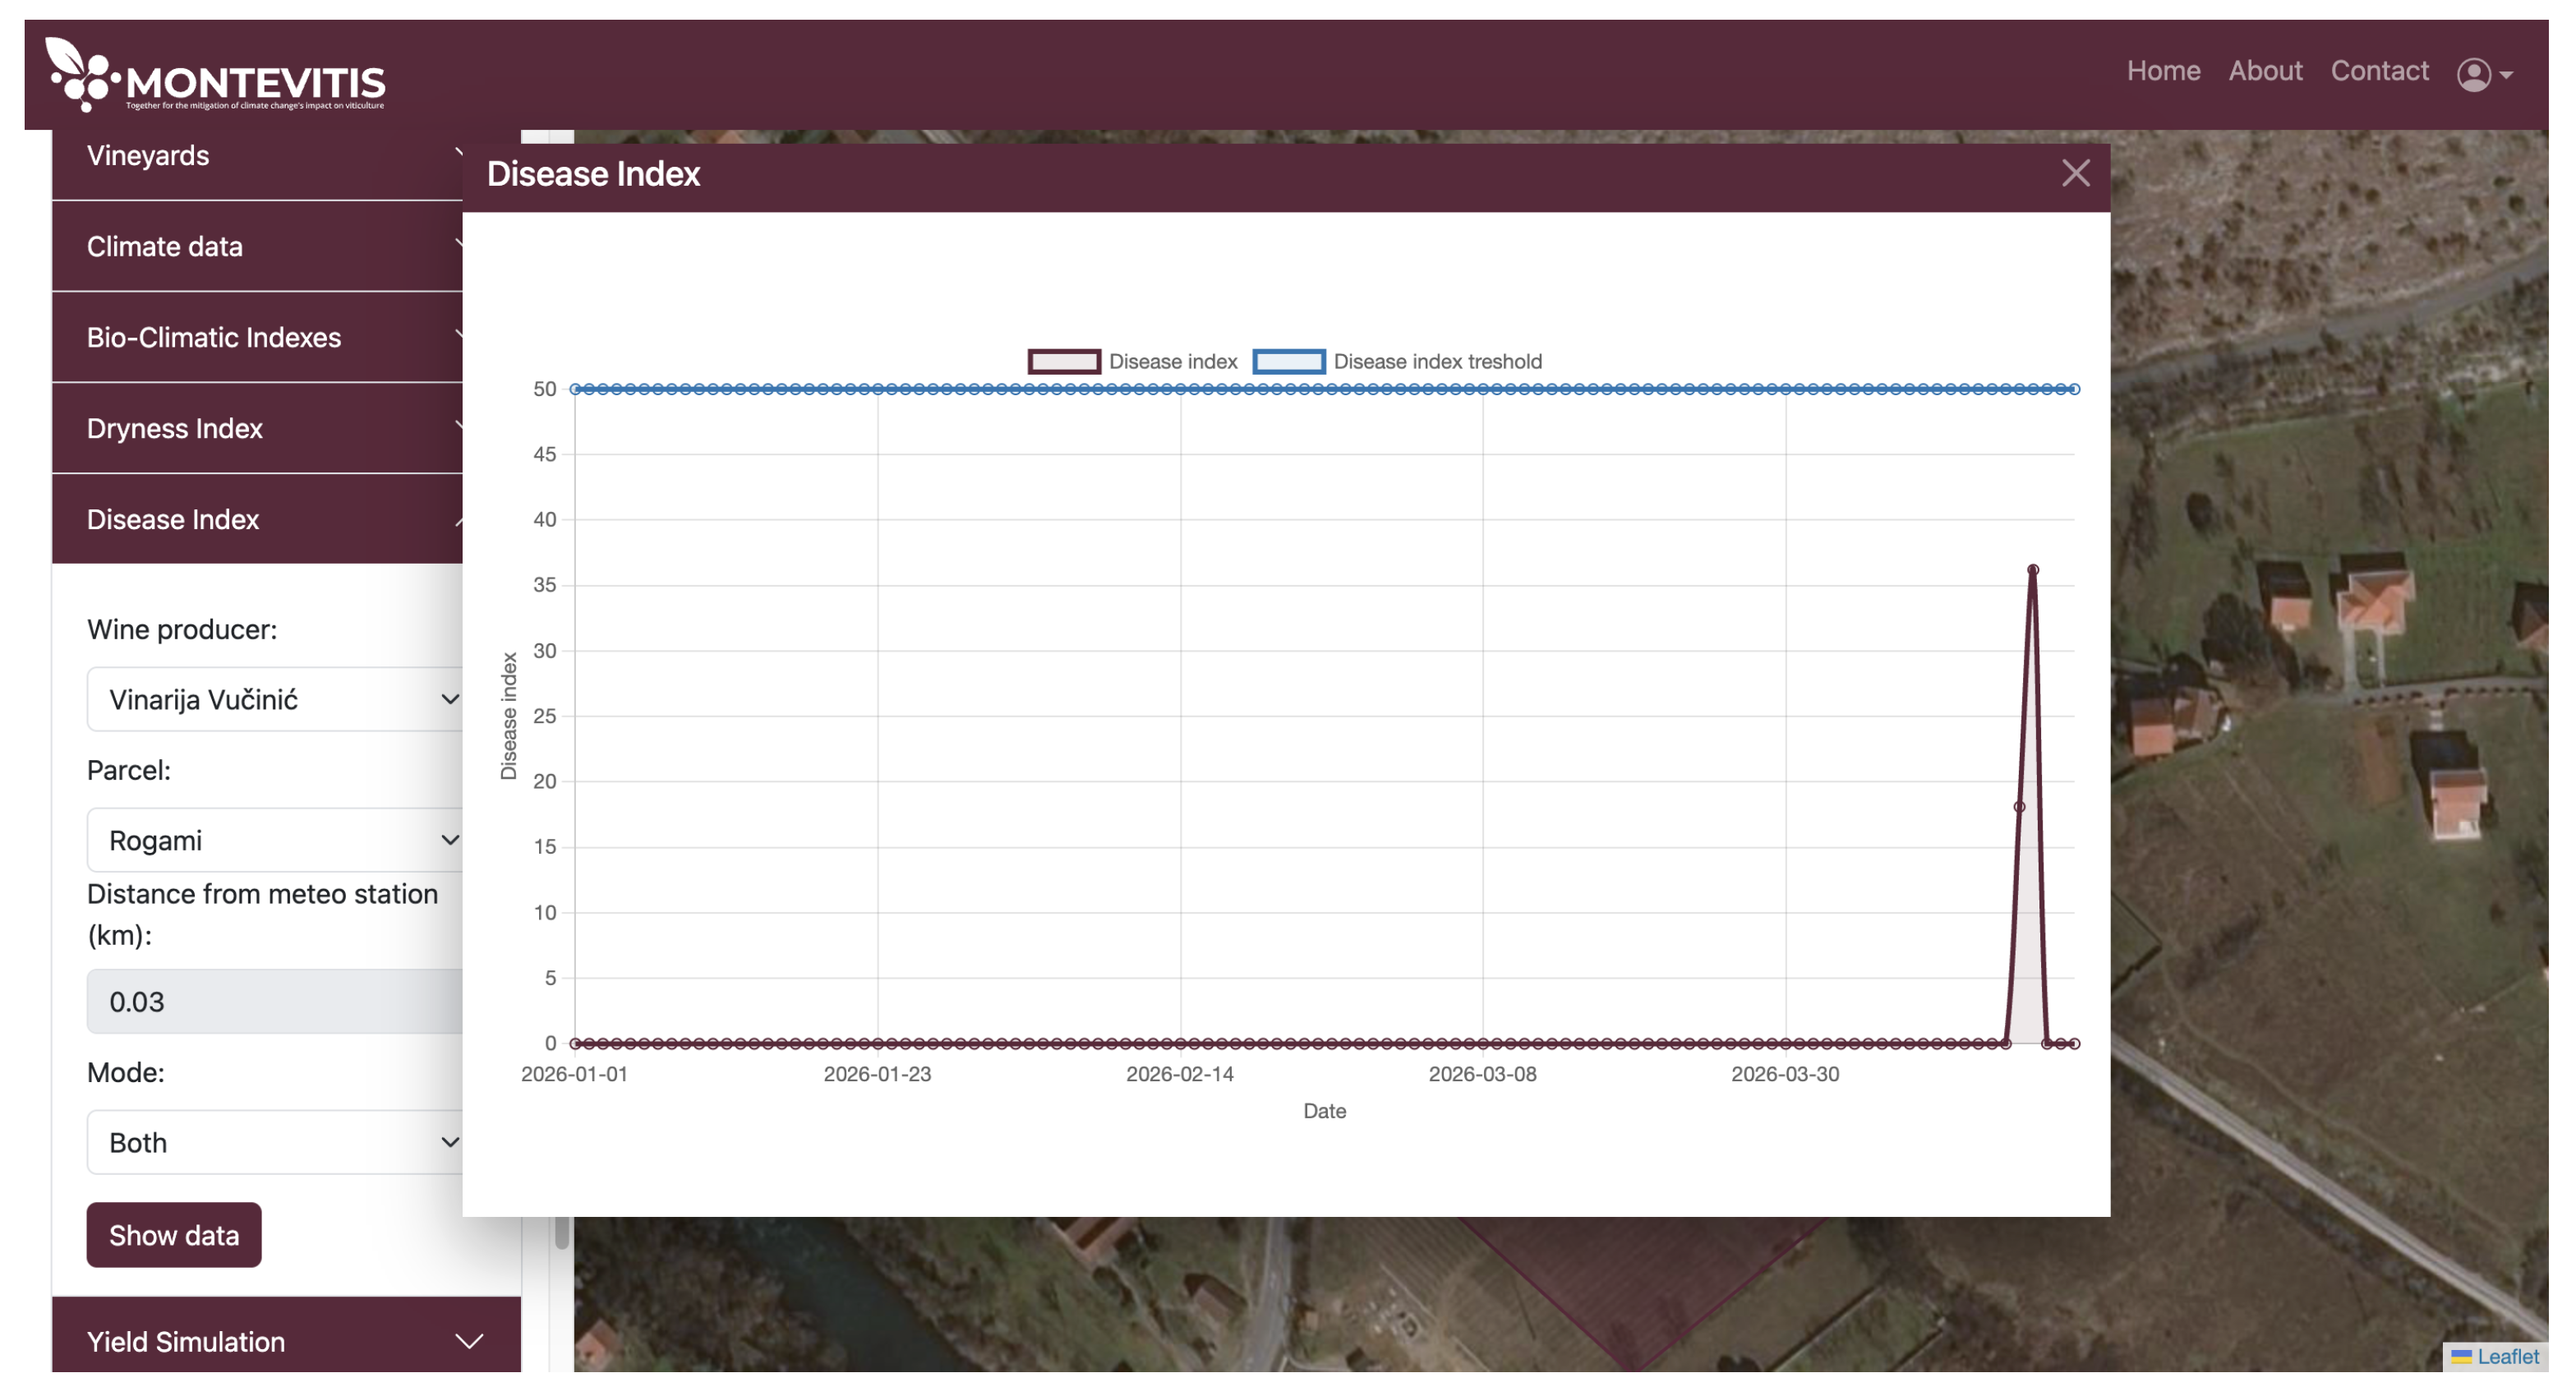
64], are operationalised as part of a continuous analytical pipeline to generate risk-based indicators and support automated alert generation. The Goidanich index is computed using hourly temperature and precipitation data to derive a cumulative risk metric reflecting the progressive development of disease-favourable conditions. The Dryness index relies primarily on hourly precipitation measurements to characterise short-term soil moisture deficits and surface wetness conditions relevant to vineyard water stress assessment. These are examined in detail through application-specific use cases in subsequent sections.
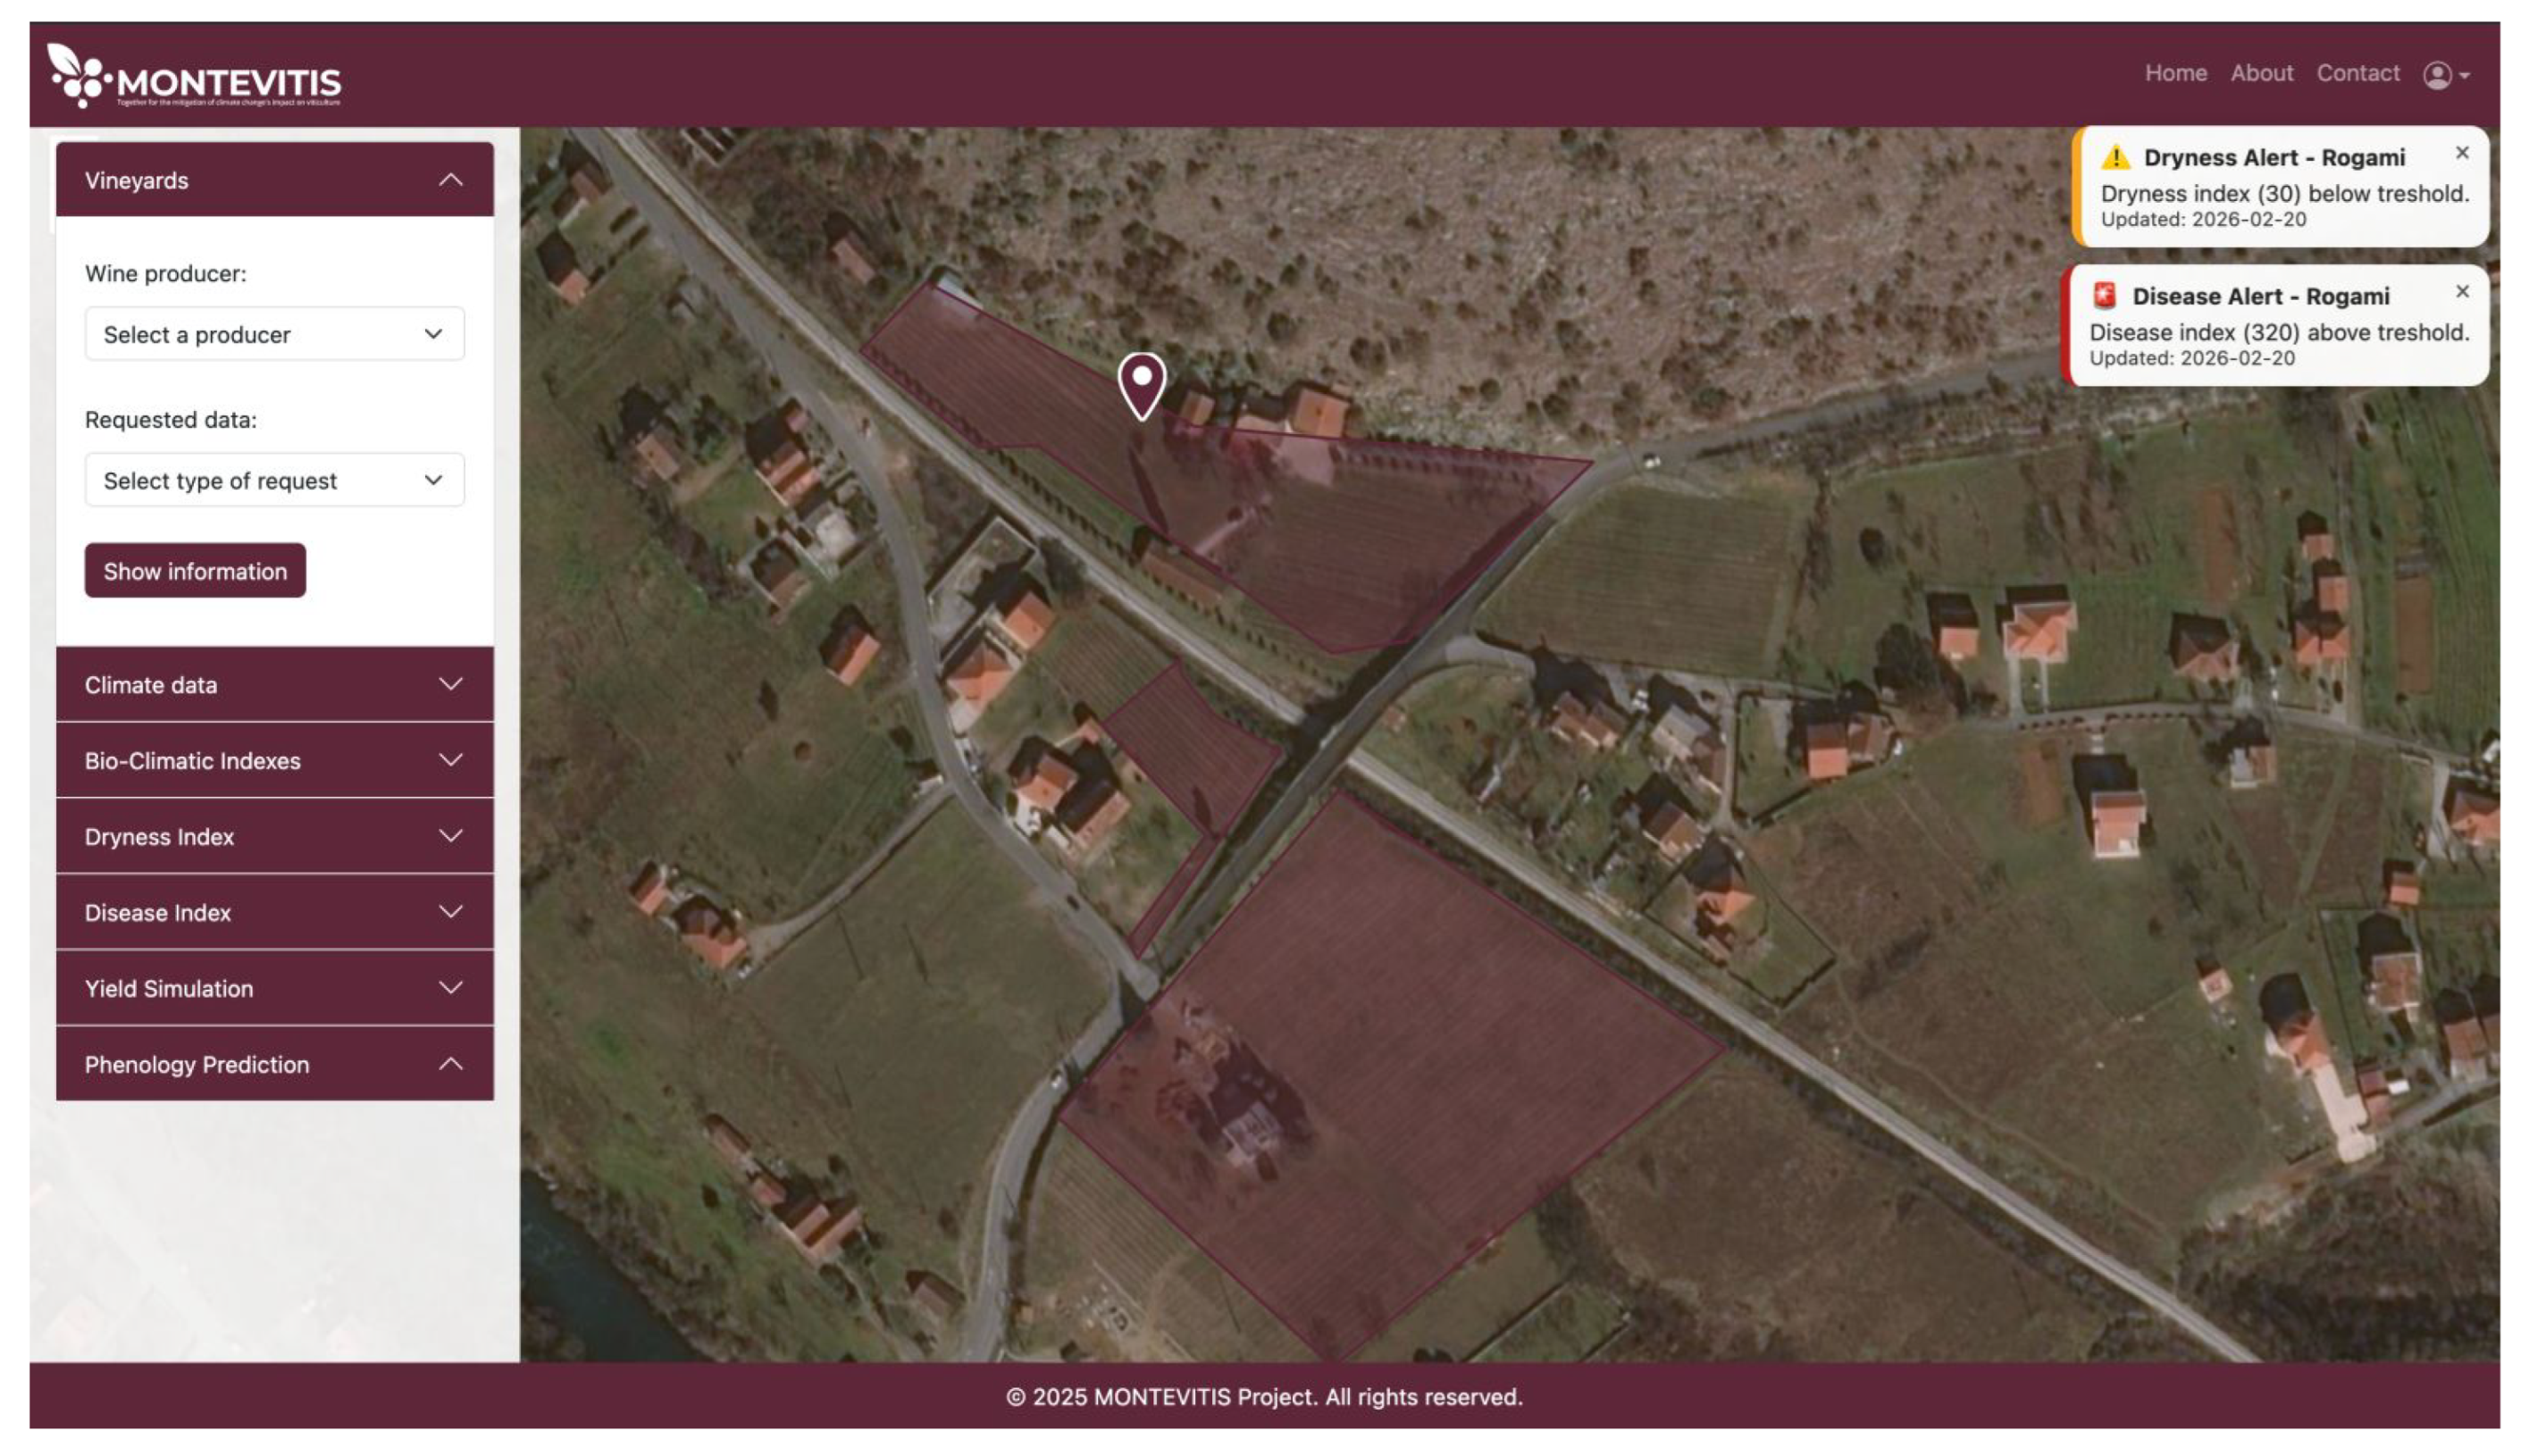
Pillar III constitutes the decision support delivery layer that operationalises the analytical outputs of Pillar II by providing role-specific access to climate indicators, modelled risk metrics, and historical trends. Rather than serving solely as a visualisation interface, this layer supports situational awareness, spatial reasoning, and coordination among heterogeneous stakeholder groups, thereby facilitating operational planning and longer-term adaptation strategies. Detailed examples of alert-driven and management-oriented workflows are presented in the subsequent use-case section.
The delivery layer is designed to present complex, multi-source data in a user-centred and accessible format, ensuring interpretability across stakeholder groups with varying levels of technical expertise. The outputs illustrated in
Figure 3 represent end-user products of the platform, highlighting the role of interface customisation in translating analytical and processed data into actionable information. Within this framework, the platform provides geospatial visualisations of gridded climate normals and historical and future climate projections derived from the CHELSA dataset, enabling spatially explicit interpretation of long-term precipitation and temperature patterns across vineyard regions.
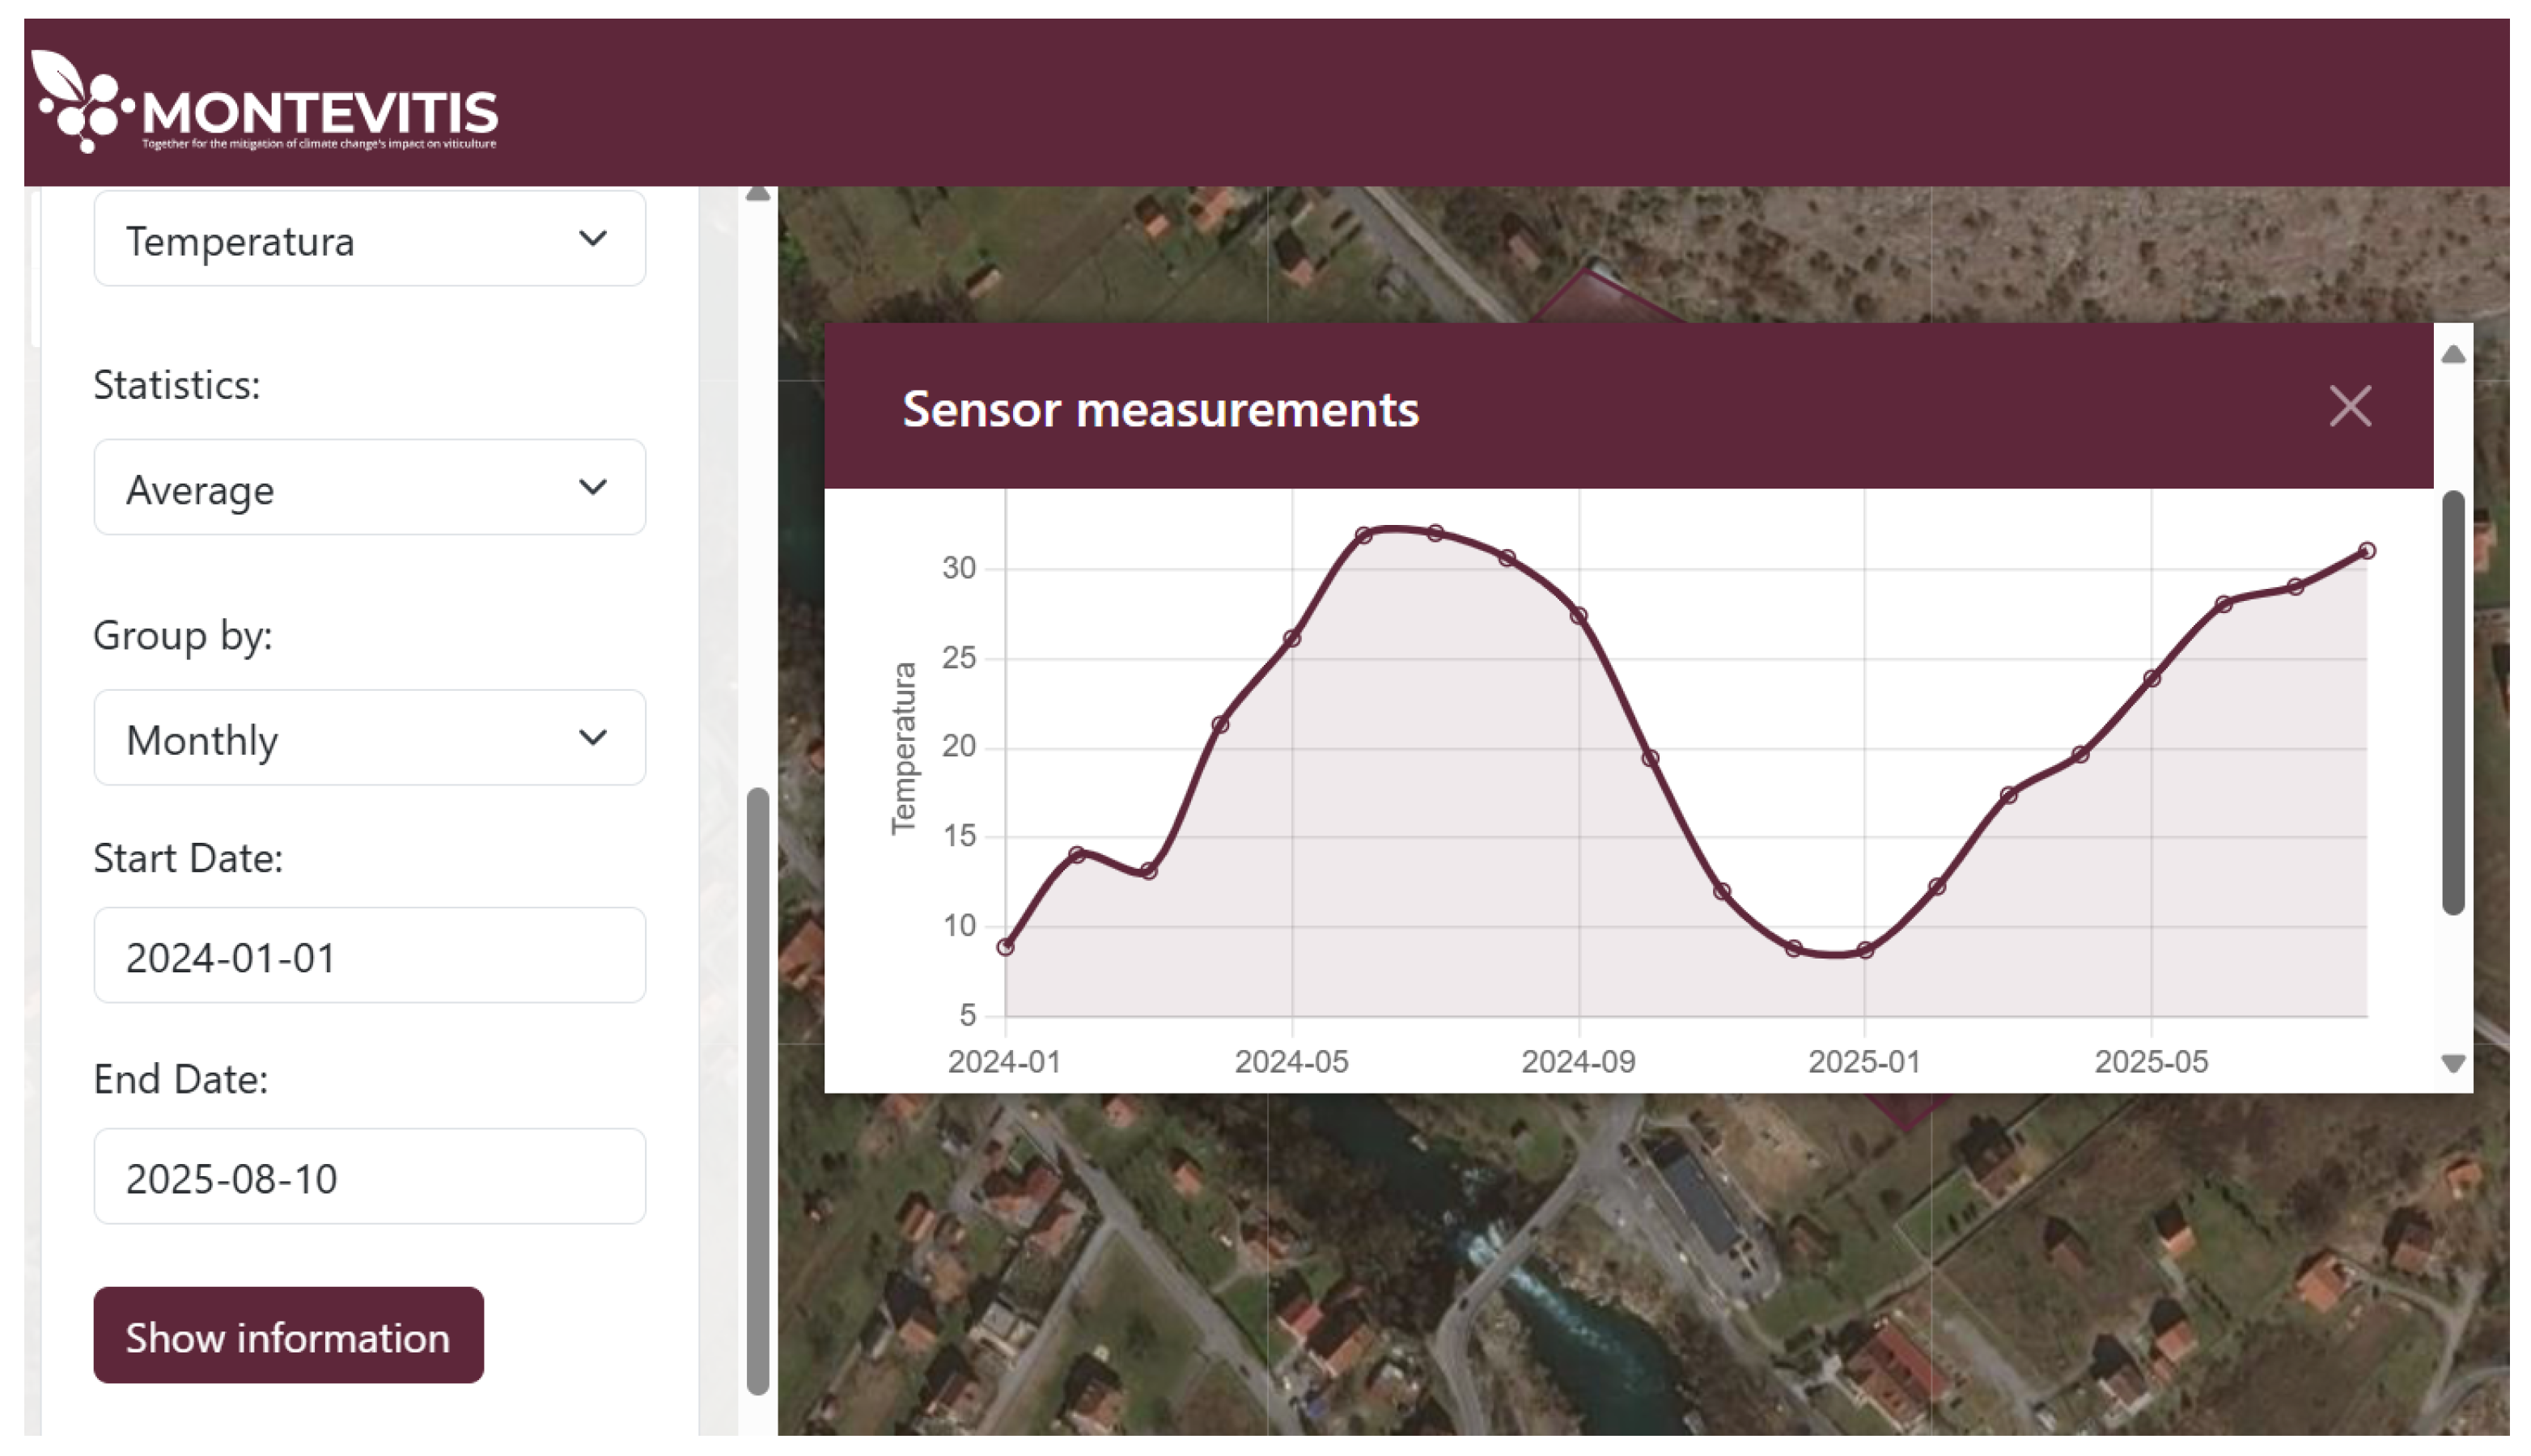
At the vineyard scale, the dashboard exposes real-time and historical IoT observations alongside parcel-level information, including vineyard boundaries, parcel number and area by grape variety, registered phenological records, and vineyard management data. Users can explore temporal variability through descriptive statistics (minimum, maximum, and mean values) and multiple temporal aggregation levels (daily, monthly, and annual), enabling comparative assessment of recent conditions and longer-term trends. A representative example of average monthly and daily temperature dynamics for the Vučinić vineyard is shown in
Figure 7, illustrating how localised climate information can support site-specific decision-making. Additionally, phenological records can be provided in PDF or XLSX formats for user-defined time frames to facilitate documentation and further analysis.
5. Challenges and Lessons Learned
The real-world deployment of the MONTEVITIS platform across heterogeneous vineyard environments revealed a set of technical, operational and institutional challenges that extend beyond system architecture and model implementation. These challenges provided important insights into the conditions required for the long-term sustainability and transferability of climate-informed decision support systems in agricultural practice. The result represents years of coordinated work, combining technical innovation with field experience.
The operation of distributed IoT nodes in field conditions resulted in recurring gaps and inconsistencies in the local readings, primarily associated with connectivity constraints, power supply interruptions and occasional sensor malfunctions. Addressing these disruptions required the implementation of a dedicated preprocessing workflow to validate, harmonize and reconstruct the affected time series prior to their integration into the platform, as described in
Section 3. A key lesson learned was that the reliability of alert-based decision support outputs depends fundamentally on the continuity and comparability of the data streams. The integration of heterogeneous sources, including local sensors, national meteorological stations and gridded climate, necessitated systematic data quality management as a foundational component of system operation.
Beyond technical performance, platform utilization was strongly influenced by user engagement, digital literacy and institutional context. Winegrowers were required to contribute field-level observations, such as phenological stages and basic management actions, through the platform interface. In practice, variability in the timeliness and consistency of these inputs introduced additional uncertainty into model-based estimates and alerts. Targeted training and continued technical support emerged as essential measures for improving data completeness and ensuring sustained platform use. This experience highlights that decision support systems in traditional agricultural sectors are socio-technical systems in which model performance and data quality are closely coupled with user practices and institutional capacity.
At the governance level, questions related to data ownership, access rights, and the role of public institutions in maintaining and scaling the platform underscored the need for formal institutional engagement. Without long-term support structures, digital platforms risk remaining project-based prototypes rather than operational components of agricultural decision-making frameworks.
Ongoing technical support represents a core requirement for the long-term operation of the platform. Beyond user assistance, this includes the continuous monitoring, maintenance and restoration of IoT nodes in cases of power supply interruptions, connectivity outages, or hardware-related failures. The timely recovery of these components is essential for preserving the continuity and reliability of local measurement records and, by extension, the validity of the associated decision support outputs.
These operational requirements highlight the need for a strategically planned financial sustainability framework. While initial development and deployment were supported through Horizon project funding, the platform is envisioned as a long-term component of the national agricultural support infrastructure. A subscription-based service model, in which users contribute through periodic service fees, represents one potential mechanism for covering operational and maintenance costs. However, the long-term objective is to minimize financial barriers to access and to position the platform as a public-support infrastructure that promotes broad adoption and contributes to the environmental, economic, and cultural sustainability of viticulture.
Achieving this objective requires formal institutional engagement with the Ministry to establish governance structures, budgetary pathways, and coordinated deployment strategies, complemented by collaboration with research institutions, industry stakeholders, and agricultural agencies. The lessons learned and partnerships established through the pilot deployment provide a foundation for extending the platform to wider regional contexts and to additional agricultural systems, thereby supporting both functional scalability and long-term institutional integration.
6. Future Work and Scalability
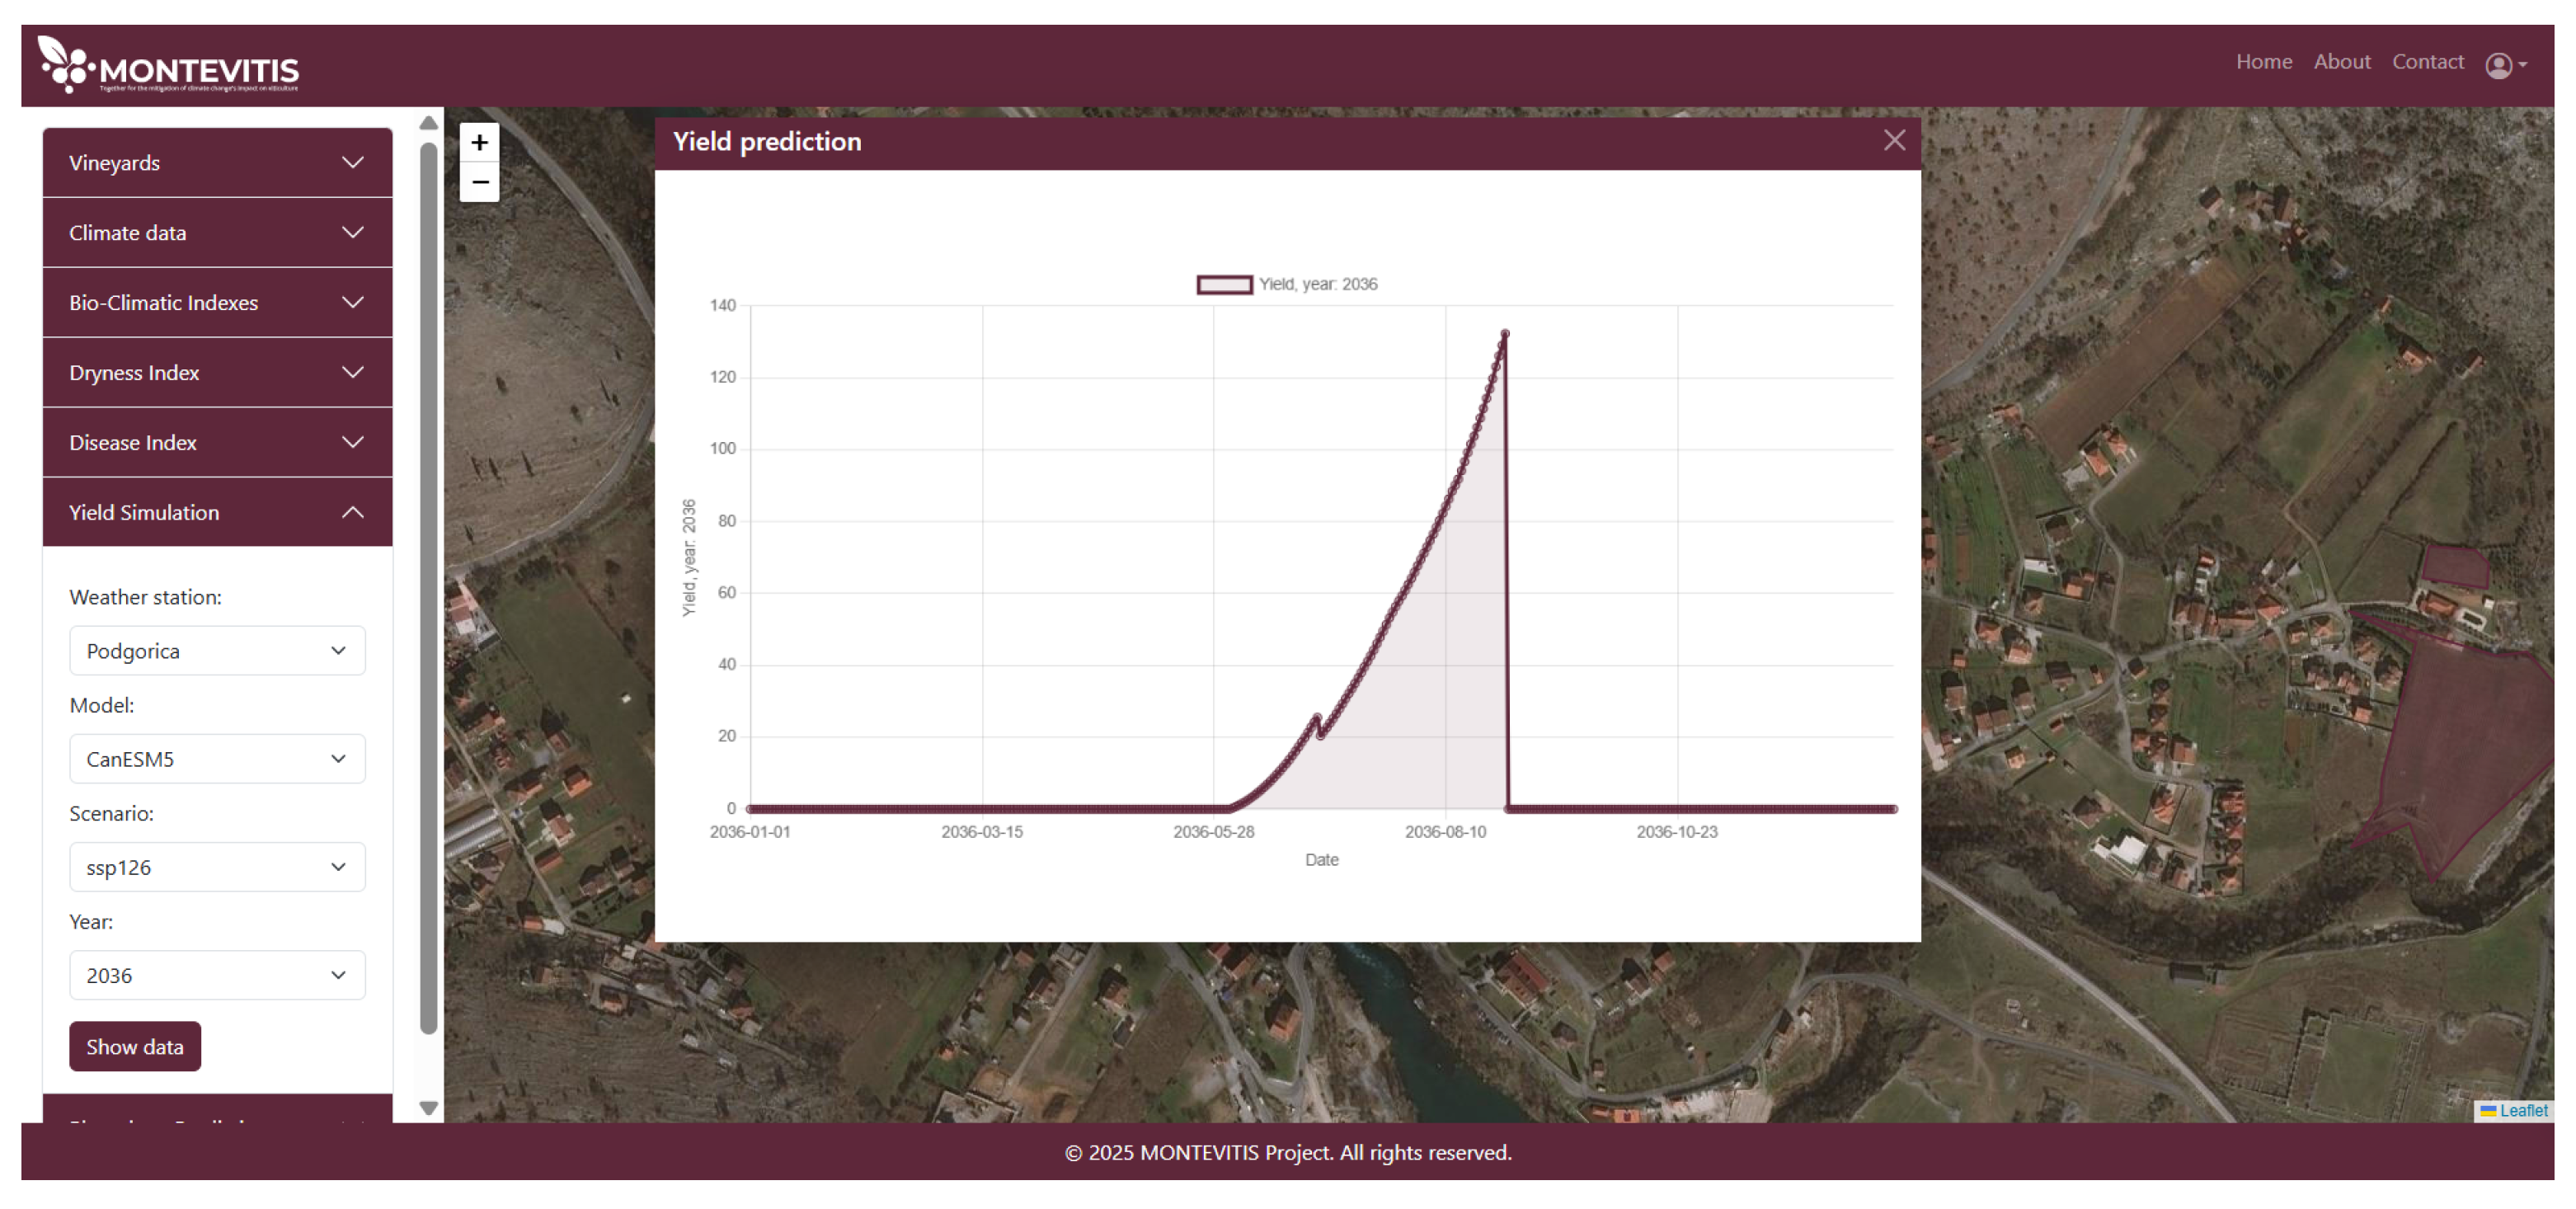
While the present study demonstrates the technical implementation and pilot deployment of the MONTEVITIS DSP, a comprehensive validation of its long-term performance and its impact on vineyard decision-making was beyond the scope of this work. The current results primarily illustrate the operational feasibility of the system and its ability to integrate heterogeneous data streams into a functional decision support environment. A structured qualitative evaluation involving stakeholder interviews, usability studies, and systematic assessment of user-related factors such as satisfaction, trust, and perceived usefulness is planned as part of the post-project phase. Since the platform constitutes the final deliverable of the MONTEVITS project and was fully deployed only at the end of the project period, stakeholders have only recently gained access to the complete system, and additional time is required to support a meaningful and representative evaluation. Future research will therefore focus on systematic validation through longer observational periods, expanded vineyard participation and the evaluation of platform-supported decisions against observed management outcomes.
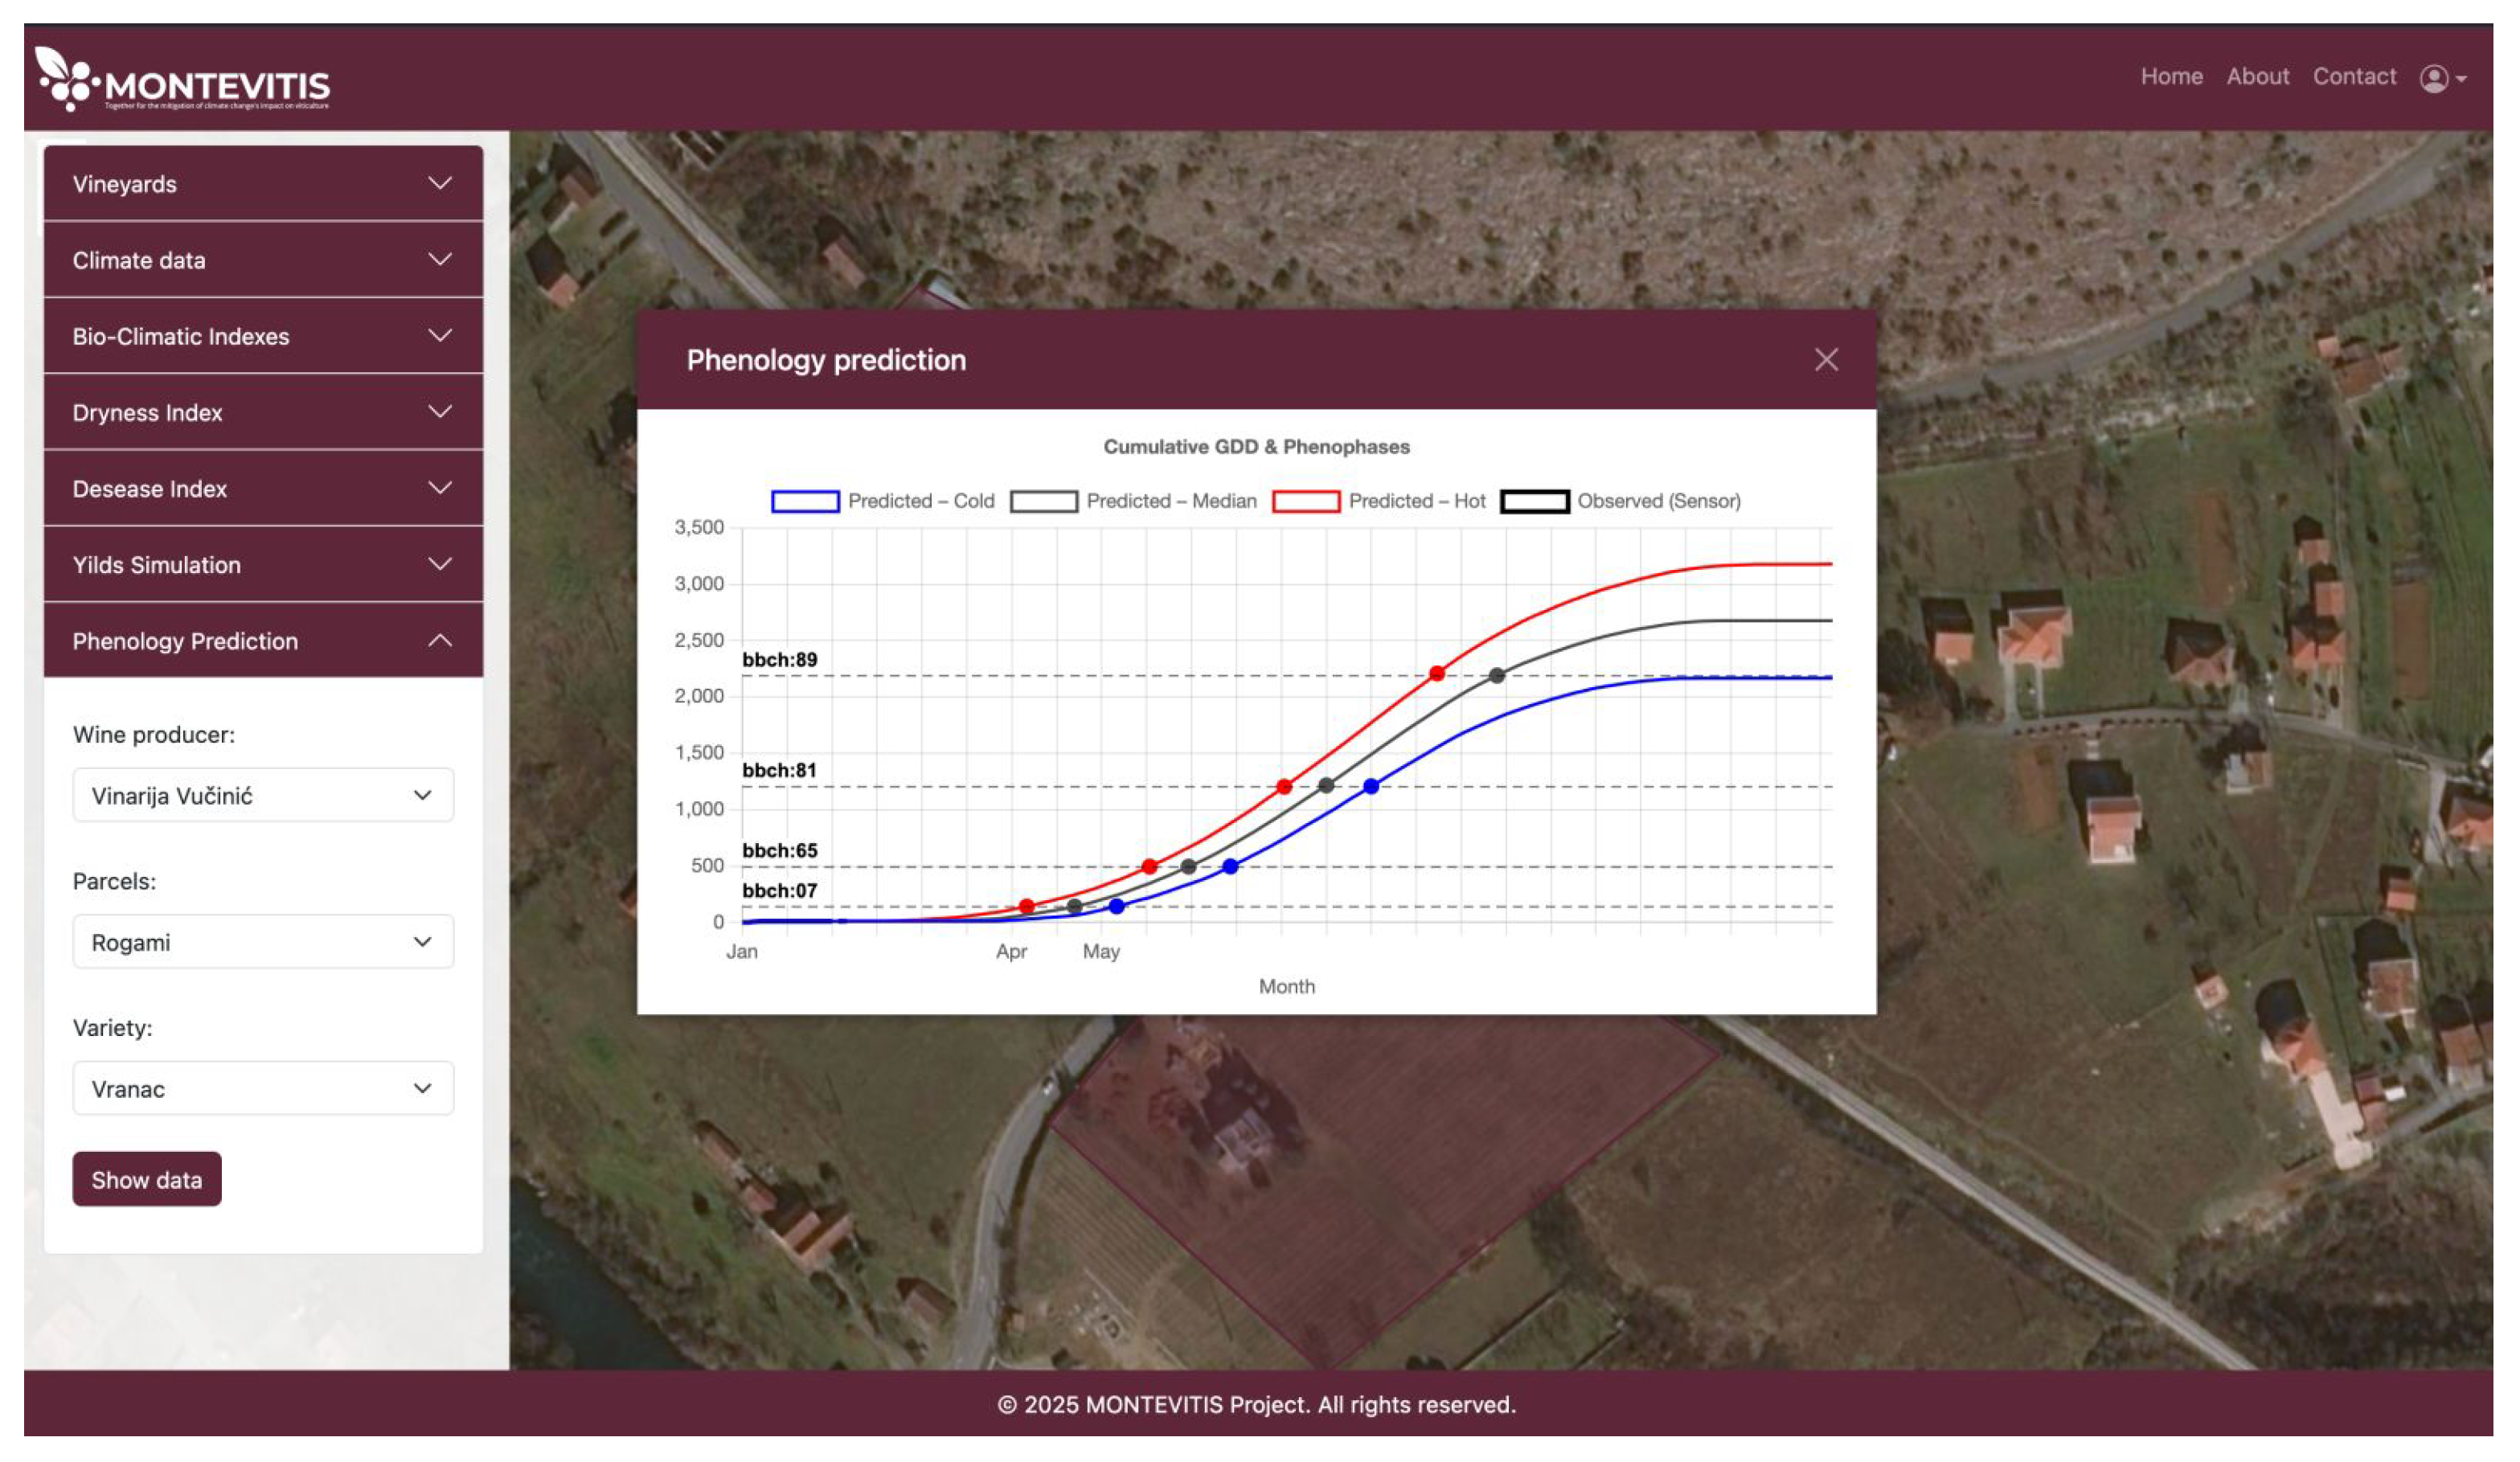
Platform sustainability implies continuous improvement of the modelling components deployed within the system, including the integration of machine learning approaches. Reported phenological stages provided by winegrowers are accompanied by field photographs and subsequently reviewed by project researchers to ensure consistency with the BBCH scale; observations that cannot be confirmed from the visual evidence are excluded from further use. However, this process could be streamlined by introducing ML-based methods capable of automatically detecting BBCH growth stages from image data [
76]. In the interim, targeted field training for end users is recommended to improve the accuracy and consistency of manually recorded phenological observations and to support the quality of the resulting training datasets. In parallel, ML models can be deployed to support irrigation-related decision-making by estimating vine water stress and irrigation demand based on agroclimatic and physiological inputs [
77]. Grapevine yield prediction, particularly during advanced phenological stages and in the pre-harvest period, represents a critical component of effective vineyard management, as it supports planning, resource allocation, and market-oriented decision-making. The integration of ML-based yield prediction models that relate historical yield records to agroclimatic patterns can therefore be considered a key future extension of the platform [
78]. In addition, supplementary IoT measurements, such as sap flow sensors [
79], can be integrated to enhance the estimation of vine water status and irrigation demand.
Two additional types of predictive alerts can be considered as future extensions of the MONTEVITIS platform, depending on data availability: immediate alerts operating on short time scales (minutes to hours), such as notifications of approaching storms, and near-term warnings operating on longer time scales (days to weeks), including indications of adverse weather conditions, drought development, or frost risk. Near-term warnings are particularly relevant for routine vineyard management, as they support operational planning and resource allocation over several days and enable the implementation of adaptation measures such as frost protection or irrigation scheduling. Forecast based alert components are already commonly implemented in operational viticultural decision-support systems and represent a logical next step for further development of the MONTEVITIS platform. Their integration could be achieved either by connecting to freely available global forecasting services (e.g., open meteorological APIs [
80]) or through a direct data link with ZHMS, enabling the use of national operational forecasts. Incorporating such a forecasting component would allow end users to access long term climate projections together with mid and short term weather forecasts within a single interface, further supporting decision making processes.
Building on recent advances in the application of unmanned aerial vehicles (UAVs) in viticulture, the integration of such data sources can be considered as a potential extension of the platform [
81]. In this context, UAV-based observations can further enrich the system by enabling detailed spatial and temporal monitoring of vineyard conditions. For example, spatial heterogeneity in canopy growth or differences in vine water stress within a single parcel can be identified. In parallel, satellite-based Earth observation data can complement this information by providing consistent, large-scale coverage and regular temporal sampling, enabling the assessment of seasonal trends and regional patterns in vegetation condition and climatic stress [
82]. The fusion of these spatial products with point-based IoT measurements supports multi-scale analysis and zone-specific decision support outputs.
One potential direction for future research is the integration of the proposed system with certification and labelling systems commonly used in viticulture, including organic and sustainable standards and the GLOBALG.A.P. framework for Good Agricultural Practices [
83]. In addition, geographical indication schemes (GI/PGI/DO) could be considered to support the protection of geographic origin and product heritage. Moreover, integration with these platforms would enhance transparency, traceability and market competitiveness. Furthermore, multilingual support should be considered, as Montenegro has become a destination for international migration, and a diverse user base may include non-native speakers among potential platform users. The core function of the platform is the timely delivery of alerts and decision support, one remaining technical challenge concerns reliable message delivery. In case the winegrower is not connected to the internet it is still important to receive an alert, therefore SMS-based alert delivery should be considered as a complementary communication channel in situations of limited internet connectivity.
The MONTEVITIS methodology, which integrates local IoT measurements, regional weather station data, gridded climate products, and vineyard-specific observations such as phenology and yield, is not limited to deployment in Montenegro. Scalability to other Mediterranean viticultural zones is enabled by substituting national meteorological networks and reference datasets with equivalent regional services, while preserving the same parcel-level decision support logic. This requires the recalibration of phenological models and alert thresholds to locally dominant grape varieties and management practices, supporting deployment in coastal, island, and mountainous regions characterised by fragmented vineyards and strong microclimatic gradients.
Beyond viticulture, the platform architecture can be extended to other crop systems by adapting the decision support logic to crop-specific phenological stages and weather-driven management processes, including olive groves, citrus orchards, and cereal production [
84]. This transferability is enabled by substituting grapevine-specific phenological models and bioclimatic indices with crop-specific indicators, threshold values, and management-relevant alert logic while preserving the same data ingestion, validation, and decision support pipeline. In practice, this allows the system to support applications such as drought stress monitoring in rainfed cereals, heat and frost risk assessment in citrus orchards, or phenology-driven pest management in perennial tree crops, thereby positioning the platform as a modular decision support framework adaptable across multiple climate-sensitive agricultural sectors.




 ,
,