


Abstract
This study investigates critical-speed amplification, stress transfer and rail-pad dynamic load response of CRTS I ballastless track under ultra-high-speed train loads. A three-dimensional vehicle–track–subgrade coupled finite-element model was developed for a CRH380B train and compared with field measurements from the Beijing–Tianjin Intercity line. The direct displacement-amplitude method identifies a displacement-peak speed of approximately 109 m/s for the ideal track–subgrade system. Full-scale tests show a non-monotonic slab-acceleration response, with a main peak near 396 km/h and a secondary peak near 325 km/h. Flexible-sensor measurements over multiple train speeds also show a non-monotonic rail-pad load response, with the maximum measured load occurring near 396 km/h. Numerical results at 110 and 180 m/s indicate that the track slab mainly carries vertical compression and longitudinal tension, whereas the CA mortar layer mainly carries vertical compression and shear. A quantitative fatigue assessment based on the adopted 2 × 10⁶ reference load cycles gives track-slab fatigue utilisation ratios of 0.273 and 0.325 at 110 and 180 m/s, respectively, and a CA-mortar Miner damage index of approximately 2.32 × 10⁻⁷ under the most severe calculated compressive stress. These nominal fatigue indices are conditional on the adopted stress inputs and S–N extrapolation and do not establish field service life. The combined numerical and sensing results indicate a common speed range of amplification at both the global structural scale and the local rail-pad load-transfer scale.
1. Introduction
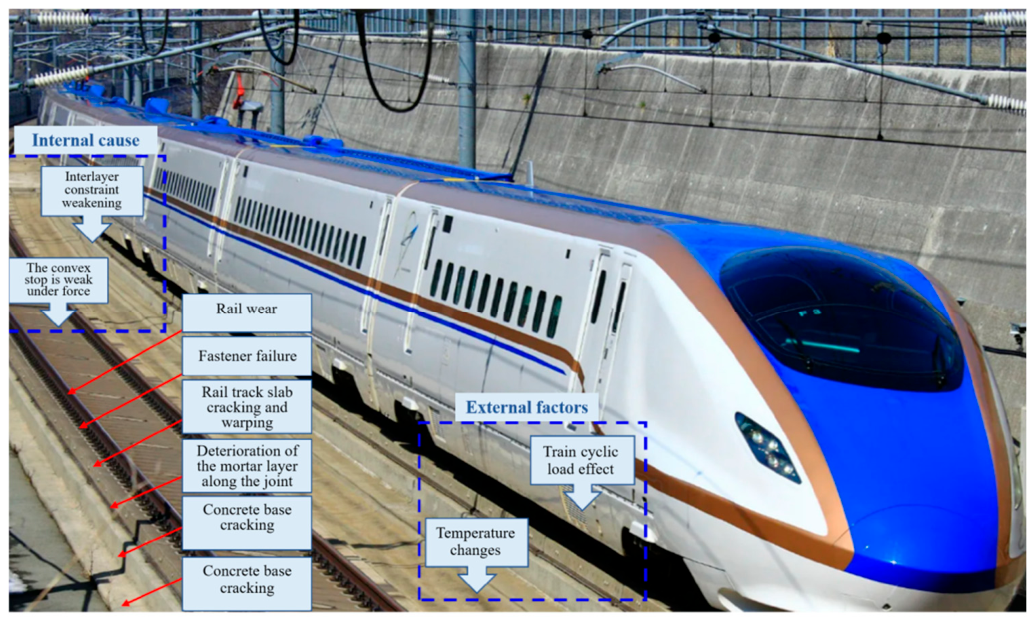
Ultra-high-speed train loading can be treated as repeated axle forces moving over a layered rail–fastener–slab–subgrade system. Ballastless slab track is widely used on high-speed railway lines above 300 km/h because its continuous support reduces maintenance demand relative to ballasted track [1]. During long-term operation, ballastless track may develop rail wear, fastener failure, cracking and warping of the track slab, deterioration of the cement-asphalt (CA) mortar layer and cracking of the concrete base slab, as shown in Figure 1. These damage forms are associated with mechanically weak components, environmental actions and cyclic train loading [2,3,4,5,6]. Repeated dynamic loading at high speed can accelerate fatigue-related deterioration of the track structure [7].
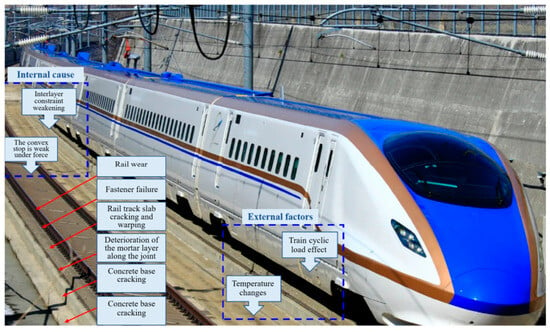
Figure 1.
Causes of damage and problems of ballastless track structure.
At higher speeds, the spatial periodicity of wheelsets, bogies and vehicles is converted into temporal excitation frequencies. Wheel–rail interaction and track-foundation vibration then have to be resolved as a coupled dynamic problem [8,9,10]. Treating the vehicle and track as separate subsystems gives an incomplete description of the response in this speed range. Vehicle–track coupled dynamics provides the framework for analysing vehicle motion, wheel–rail force transmission and track/subgrade deformation within the same system [11,12].
The critical speed of the track–subgrade system controls part of this coupled response. When train speed approaches or exceeds the characteristic wave-propagation speed of the composite track-foundation system, track and subgrade vibration may be amplified, and Mach-type effects may appear [13]. In ballastless track, the amplification is seen not only in slab displacement, slab acceleration and subgrade vibration, but also in the stress partition along the rail–fastener–slab–mortar–subgrade load path. This link between global critical-speed response and local load transfer is central to the mechanics considered here.
Previous studies have addressed structural vibration, track deformation, fatigue-related deterioration and ground response of ballastless tracks under high-speed train loading. However, most existing studies have concentrated on global structural responses, while the local dynamic pressure transmitted through rail pads and fastening systems has received less attention, although these components control the force transfer from rail to slab and contribute to the local stiffness and damping of the track. This issue is relevant for ballastless tracks because installation quality, geometric accuracy and maintenance condition influence service performance [14]. Direct rail-pad load measurement can add local information that slab acceleration or subgrade displacement cannot supply directly. Embedded strain monitoring of concrete has also been demonstrated using thick-film smart aggregates [15].
Flexible piezoelectric film sensors offer a thin, compliant form for embedded dynamic measurements. PVDF-based railway force sensing is established; for example, Song et al. [16] investigated wheel–rail force monitoring using piezoelectric sensing and comparison with strain gauges. Other compliant mechanical sensors include paper-based piezoresistive pressure sensors [17] and soft tri-axial inductive tactile sensors [18], while hybrid 3D-printed three-axis force sensors use machine learning for decoupling [19]. Electromechanical conversion can be regulated to enhance flexible strain-sensor sensitivity [20]. Mechanical design studies have addressed geometry-dependent deformation in horseshoe lattices [21] and kirigami structures [22], as well as porous substrates [23] and encapsulation [24] for stretchable electronics.
In this study, a customised PVDF piezoelectric sensor with a PI/Au/PVDF/Au/PI multilayer structure is used to record the dynamic component of rail-pad load transfer, while the three-dimensional vehicle–track–subgrade finite-element model resolves the global coupled response. The scientific question addressed by the two approaches is how ultra-high-speed train loading near the critical-speed range affects both the global structural response of the ballastless track and the local load transmission through the rail-pad/fastening layer. This combination provides complementary information at two mechanical scales: the finite-element model identifies global displacement and stress amplification of the vehicle–track–subgrade system, whereas the embedded sensor records the local dynamic load transmitted through the rail-pad/fastening interface.
The contribution of this study is the combined numerical–experimental identification of the near-critical speed of the investigated ballastless-track system and the demonstration that this amplification appears simultaneously in global track response and local rail-pad load transfer. Unlike conventional critical-speed investigations, which predominantly assess global displacement, acceleration or ground vibration [25], the embedded flexible PVDF sensor enables direct in situ measurement of the dynamic pressure/load transmitted at the rail-pad/fastening interface during full-scale train passage. The numerical displacement response reaches its maximum at 109 m/s (392.4 km/h), while the in situ track-slab acceleration and rail-pad dynamic-load measurements both reach their maxima near 396 km/h. This agreement provides experimental corroboration of the identified critical-speed range and, importantly, reveals the local load-transfer amplification at the rail pad that cannot be obtained from global vibration measurements alone.
2. Materials and Methods
2.1. Vehicle–Track–Subgrade Coupled Finite-Element Model
2.1.1. Train Model
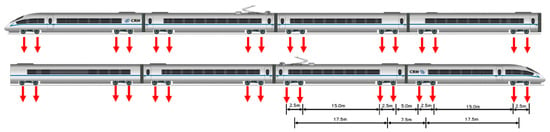
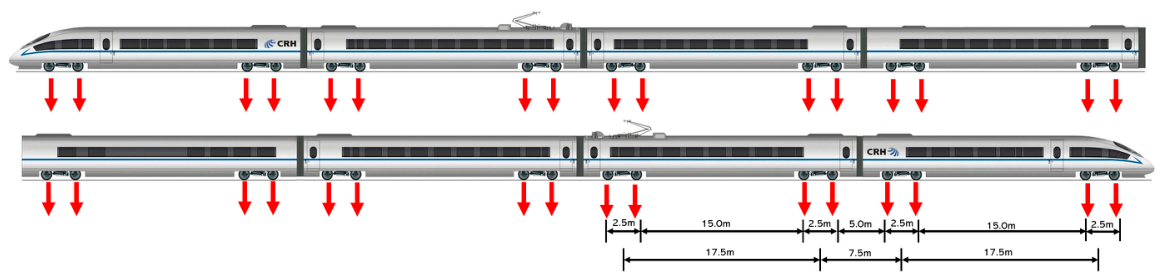
The train is represented by a CRH380B electric multiple unit (EMU), with a design speed of 380 km/h, an operating speed of 350 km/h and a maximum axle load of 17 t. Figure 2 shows the geometry used in the model. Each vehicle consists of one car body, two bogies and four wheelsets. The car length is 25 m, the bogie spacing within one vehicle is 17.5 m, the distance between adjacent bogies of neighbouring vehicles is 7.5 m, and the wheelbase within one bogie is 2.5 m. These lengths determine the spatial periodicity of the moving loads.
Figure 2.
Schematic of CRH380B train model dimensions.
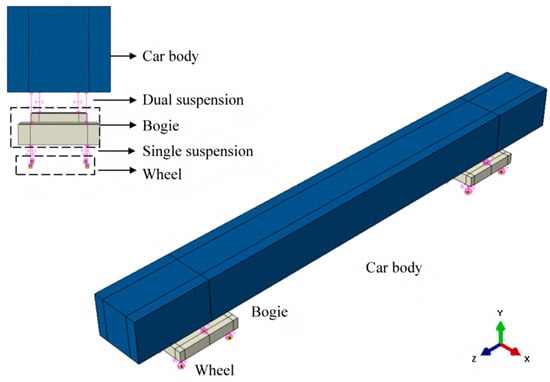
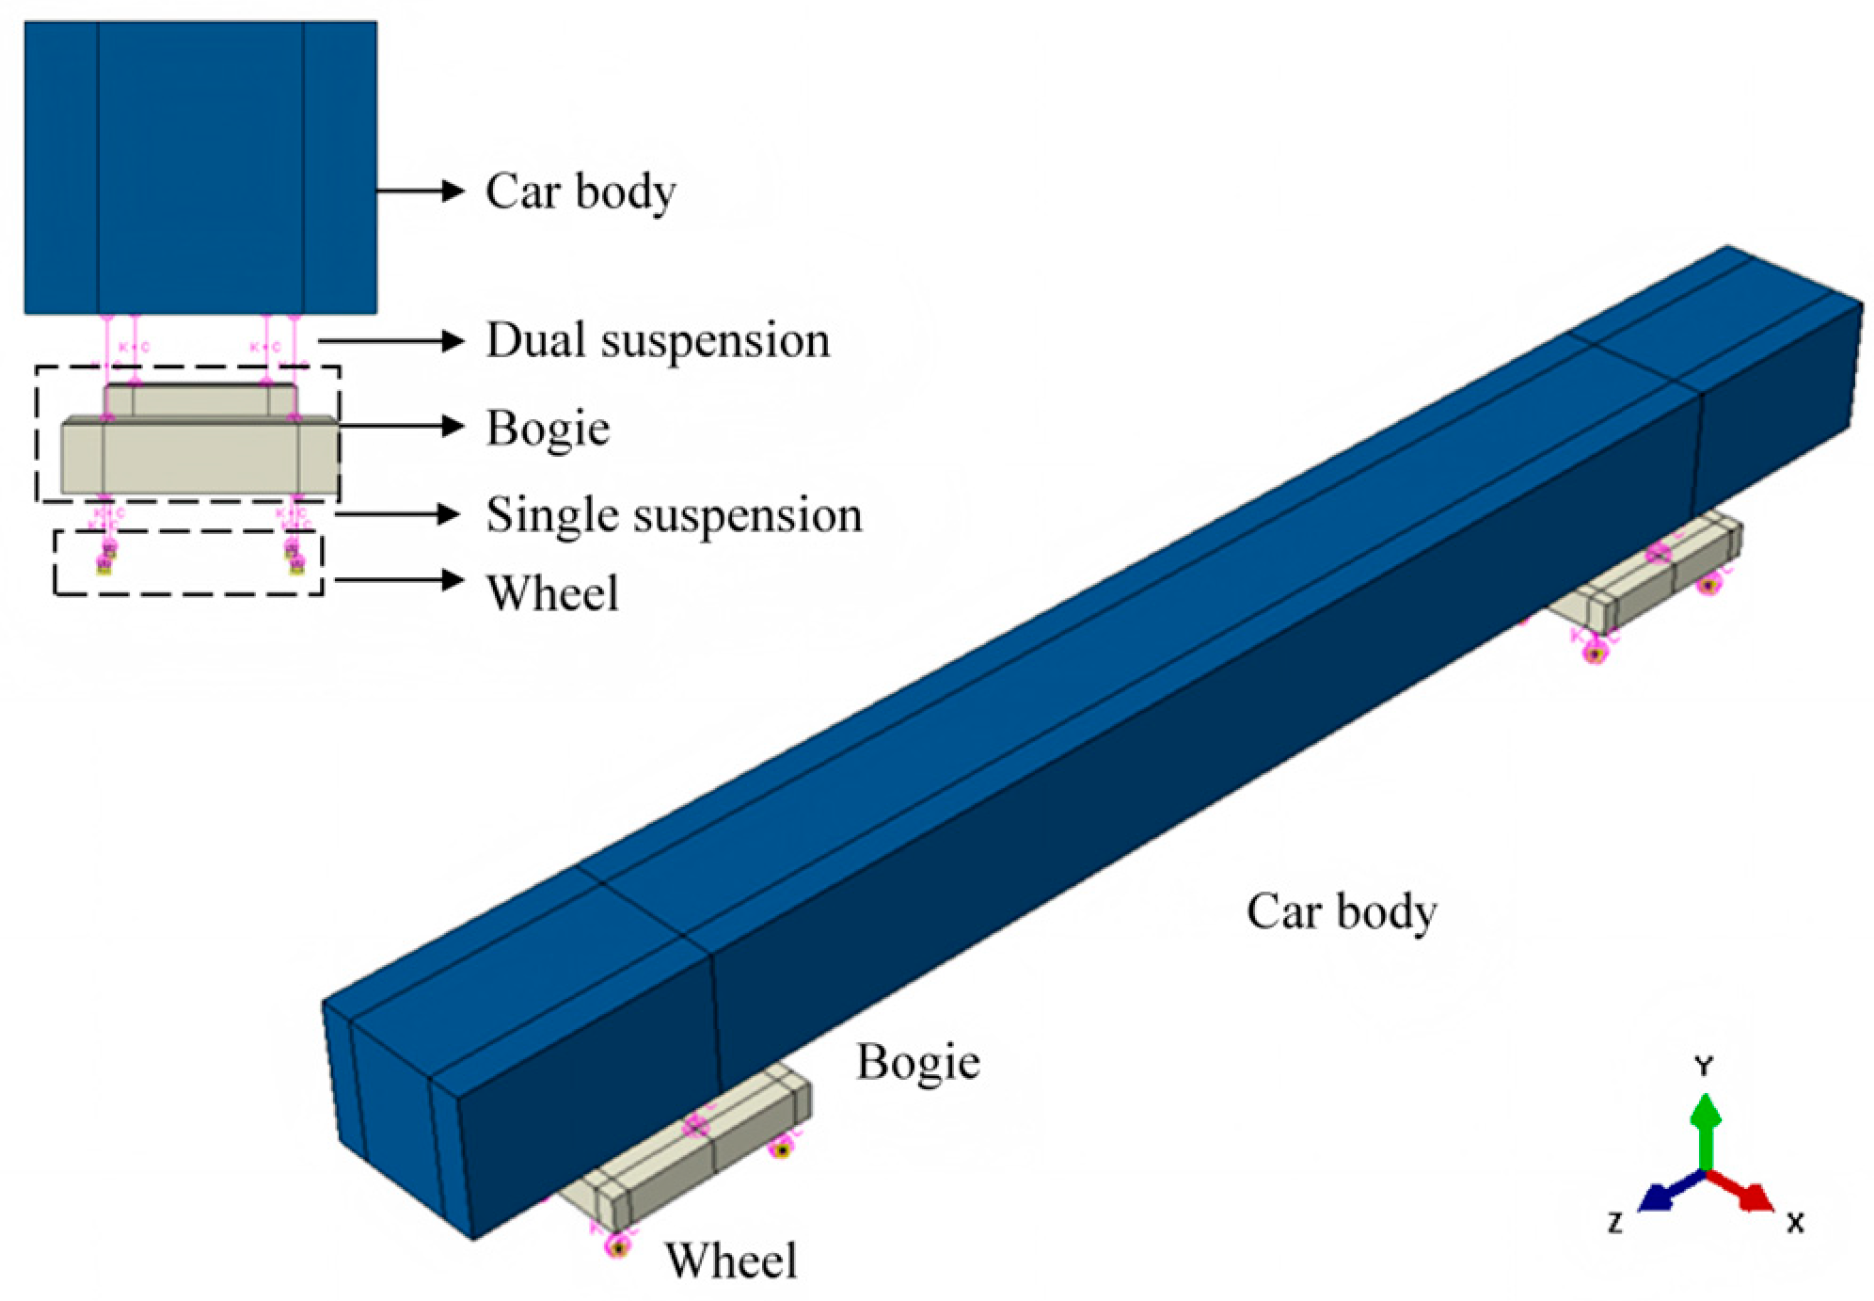
The car body, bogies and wheelsets are treated as rigid bodies, so their elastic deformation is omitted from the vibration calculation. Spring-damper elements represent the secondary suspension between the car body and bogies and the primary suspension between bogies and wheelsets, as shown in Figure 3. Yang and Hung [26] reported that, for a multi-car train, the fourth to tenth cars have limited influence on the vertical dynamic response of the track–subgrade system after the response has stabilised. The simulation uses four cars. The train parameters are listed in Table 1.
Figure 3.
Train modelling diagram.
Table 1.
Main parameters of the CRH380B train model.
The analysis focuses on vertical track response. The car body and bogies are assigned bounce, longitudinal motion and pitch, while the wheelsets are assigned bounce and longitudinal motion. Wheel–rail interaction is modelled by frictionless tangential contact and hard normal contact, with separation after unloading. This simplified contact formulation is adopted to capture the dominant vertical load transfer from the wheelset to the rail while maintaining computational efficiency for the global track–subgrade response analysis. Reduced vertical vehicle–track models have also been used to investigate critical-speed amplification [25], while moving-axle-load analyses reproduce speed-dependent track–ground response [8,27]. These precedents support the selected global-response scope; the present model does not resolve tangential creep/spin forces or elastic wheelset modes and is not used to reconstruct high-frequency rail-pad force spectra. Surface-to-surface finite-sliding contact is used, with the rail top as the master surface and the wheelset bottom as the slave surface.
A multi-layer damping boundary is applied to the subgrade to reduce wave reflection from the model boundaries. Ten damping layers are arranged symmetrically, with five layers on each side and a thickness of 3.78 m for each layer. Here Alpha and Beta are the mass- and stiffness-proportional Rayleigh damping coefficients, with units T−1 and T, respectively. Their values are determined by αk = α0ζk, where α0 is the baseline mass-proportional damping coefficient of the subgrade soil and ζ is a damping increase factor. The damping coefficients are given in Table 2.
Table 2.
Subgrade damping boundary coefficients.
Train movement is imposed through a velocity boundary condition in the running direction. The analysis is performed with an implicit dynamic step and geometric nonlinearity. The time increment is set from the rail element length and train speed, , where the rail element length s is 0.63 m and v is the simulated train speed. This corresponds to travel over one rail element per time increment.
2.1.2. Track–Subgrade Model
The track system is a CRTS I slab ballastless track. From top to bottom, it consists of rails, fasteners, track slabs, a CA mortar layer and a concrete base slab. The rails are represented by Bernoulli–Euler beam elements, and the CHN60 rail section is simplified as an I-shaped section using the equivalent moment of inertia. The fasteners are represented by spring and damping elements, with stiffness kf = 5.0 × 10⁷ N/m and damping coefficient cf = 2.4 × 10⁴ N·s/m. The dimensions of the track slab, CA mortar layer and concrete base slab are 4.97 m × 2.4 m × 0.2 m, 4.97 m × 2.4 m × 0.05 m and 20 m × 3.2 m × 0.3 m, respectively. These layers and the subgrade are modelled by eight-node linear hexahedral reduced-integration solid elements (C3D8R).
Tie constraints are used between adjacent structural layers to represent the bonded reference state of the track. This treatment enforces deformation compatibility between layers. The contact between the subgrade and the concrete base slab is described by hard normal contact, with no penetration and with separation permitted after unloading. In the tangential direction, a Coulomb friction model is used; sliding starts only after the critical shear stress is reached, and the friction coefficient is 0.005.
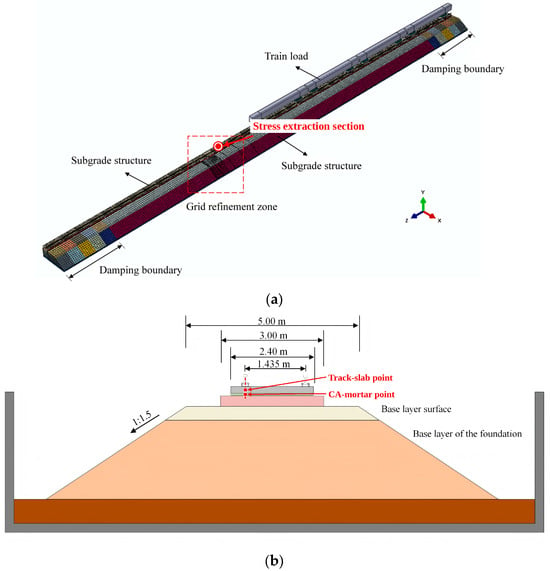
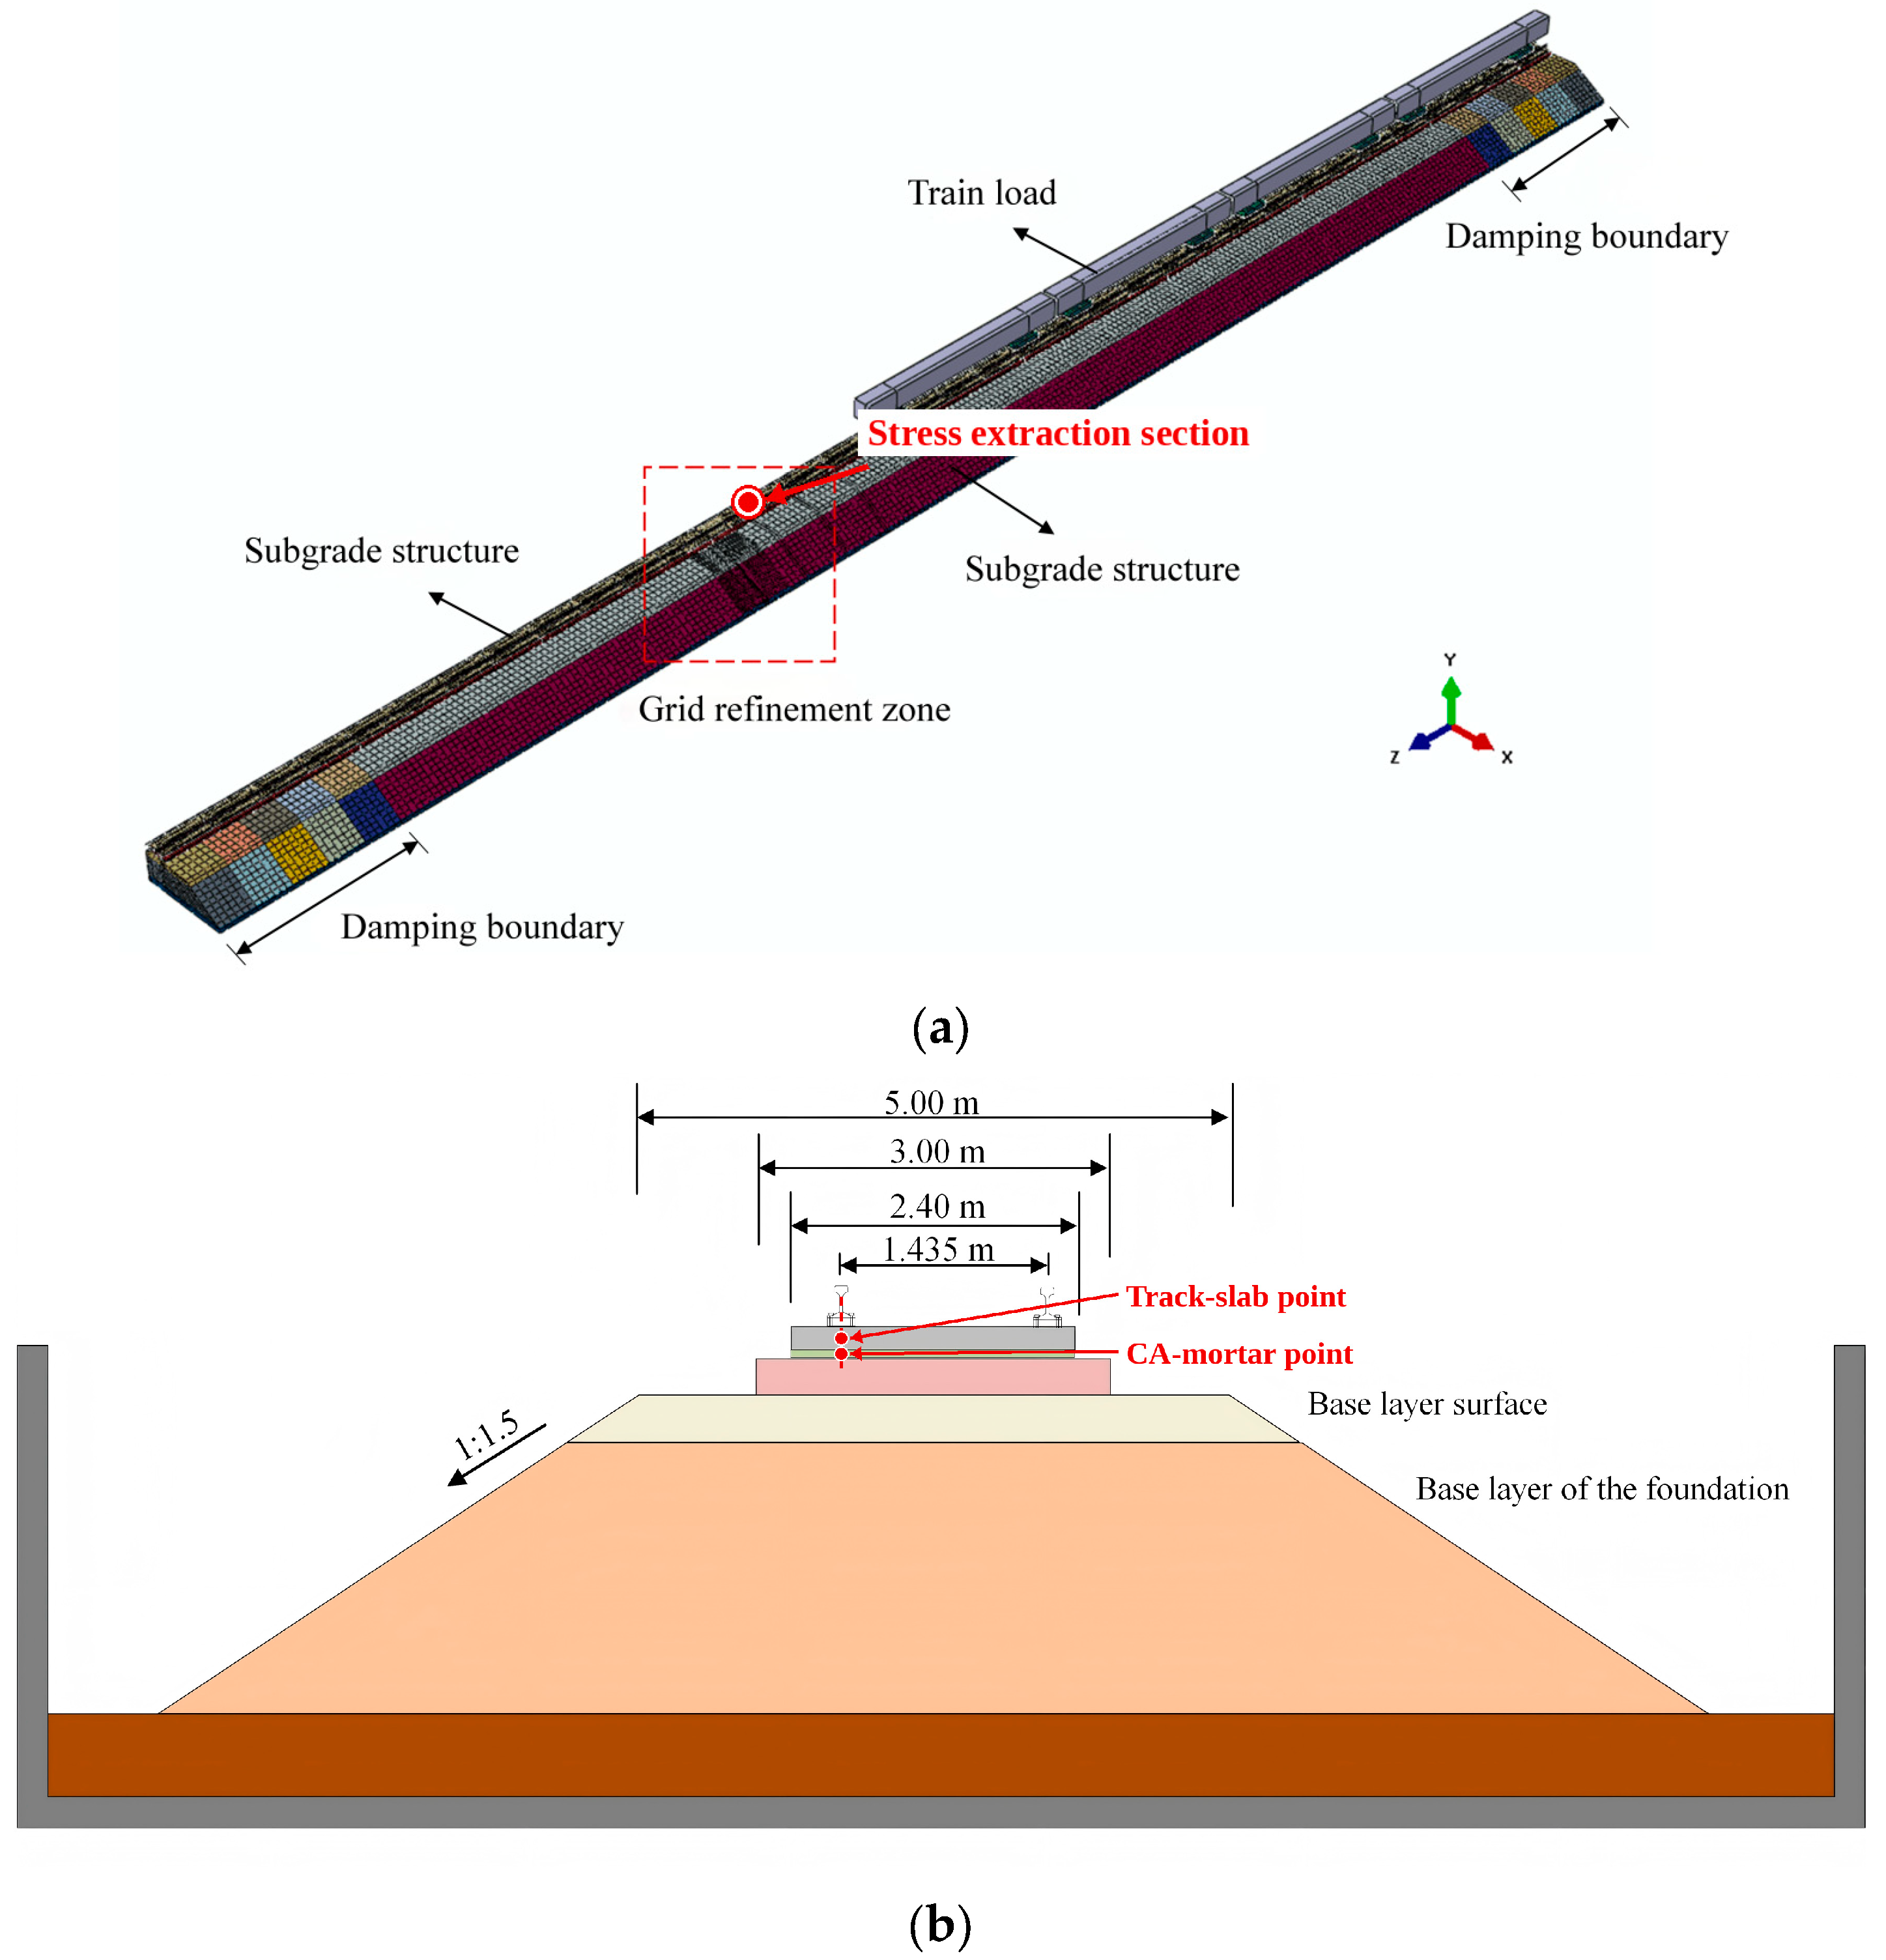
Figure 4 shows the three-dimensional vehicle–track–subgrade finite-element model. The model contains 670,350 C3D8R elements and 1,134,990 nodes. It is solved with an implicit dynamic method, which permits a fixed time increment and is suitable for the speed-synchronised moving-load calculation used here. The material parameters of the track structure and subgrade are listed in Table 3. Figure 4b shows the cross-section of the track–subgrade structure, where the subgrade is represented by a layered foundation comprising an upper layer and a lower layer, with the corresponding parameters given in Table 3. The interaction between the concrete base slab and the underlying foundation layer is as follows: In the normal direction, hard contact is used to prevent penetration while allowing separation under unloading. In the tangential direction, Coulomb friction is adopted with a friction coefficient of 0.005. The tied interfaces and uniform properties within each soil layer define an intact reference configuration that isolates the response to train speed. Published analyses show that vertical irregularities add dynamic excitation [28], while layered reference models are used to investigate speed amplification [25]; omission of deterioration and irregularities here is a scope assumption, not a claim that they cannot increase local stress.
Figure 4.
Model diagram: (a) schematic diagram of the three-dimensional finite-element model of the vehicle–track–subgrade system; (b) schematic diagram of the track–subgrade system cross-section.
Table 3.
Parameters of each structural layer of rail track and roadbed.
2.1.3. Model Validation
The model was compared with field measurements from the Beijing–Tianjin Intercity Passenger Dedicated Line [28]. The tested section used a standard double-track embankment cross-section with ballastless track, designed according to the Code for Design of High-Speed Railway in China. The operating train was a CRH3 high-speed train. Concrete-base vibration was measured during train passage.
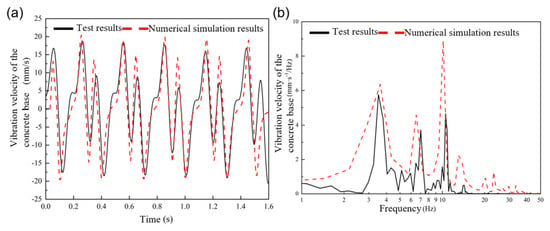
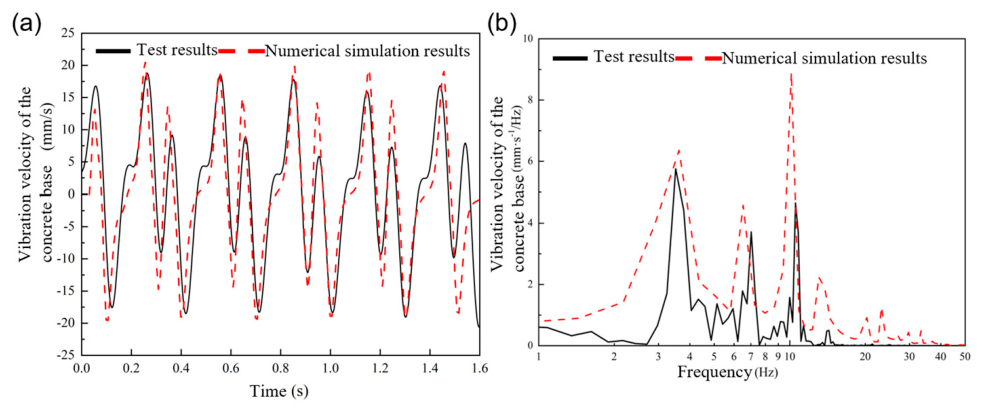
Figure 5a compares the measured and simulated vibration velocity of the concrete base when the train ran at 316 km/h. The measured velocity amplitude was 18.7 mm/s, and the simulated value was 20.5 mm/s. Figure 5b compares the Fourier spectra. The dominant measured frequencies were 3.5, 7.0 and 10.5 Hz, while the simulated frequencies were 3.5, 6.5 and 10.1 Hz. The shifts in the second and third peaks are small relative to the frequency range of interest and may reflect differences between the field section and the model in boundary conditions, damping and material parameters.
Figure 5.
Concrete base vibration velocity (v = 316 km/h): (a) time history; (b) Fourier spectrum.
At 316 km/h, the predicted peak concrete-base vibration velocity exceeds the measurement by 9.6% (20.5 versus 18.7 mm/s); the relative differences in the three reported dominant frequencies are 0%, 7.1% and 3.8%. This agreement supports the dominant vertical response at the validation speed. More importantly, the simulated displacement maximum occurs at 109 m/s (392.4 km/h), while the independently measured track-slab acceleration and rail-pad dynamic load both reach their maximum values near 396 km/h (110.0 m/s). The difference in peak speed is approximately 0.9%, providing full-scale experimental corroboration of the identified near-critical speed range. This response-based procedure is consistent with Wu et al. [25], who identify critical speed from the train speed producing the maximum vertical displacement in a validated numerical speed sweep.
2.2. Flexible Piezoelectric Sensor and Rail-Pad Measurement
The flexible sensor used for the rail-pad measurements was a customized PVDF-based piezoelectric sensor with a laminated PI/Au/PVDF/Au/PI structure. The PVDF film serves as the active piezoelectric layer, the Au layers on its two sides act as charge-collecting electrodes, and the outer polyimide (PI) layers provide electrical insulation, mechanical protection and flexibility. This thin and compliant configuration enables the sensor to be embedded in the rail-pad interface.
The sensing mechanism is based on the direct piezoelectric effect of PVDF. When a wheel load is transmitted through the rail and fastening system, local compression and deformation of the rail pad induce mechanical deformation of the embedded PVDF layer. The resulting strain produces electric charge on the Au electrodes and a corresponding voltage output. The sensor therefore records the time-varying local load transfer during train passage.
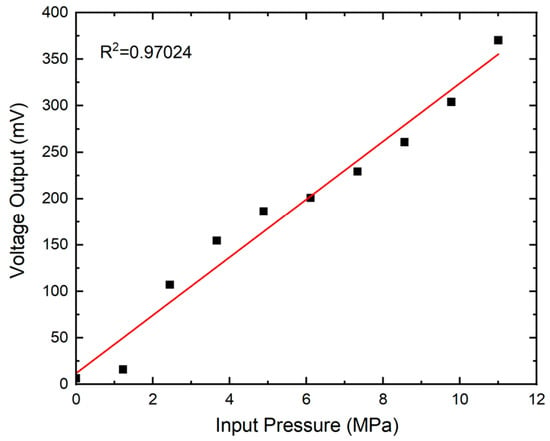
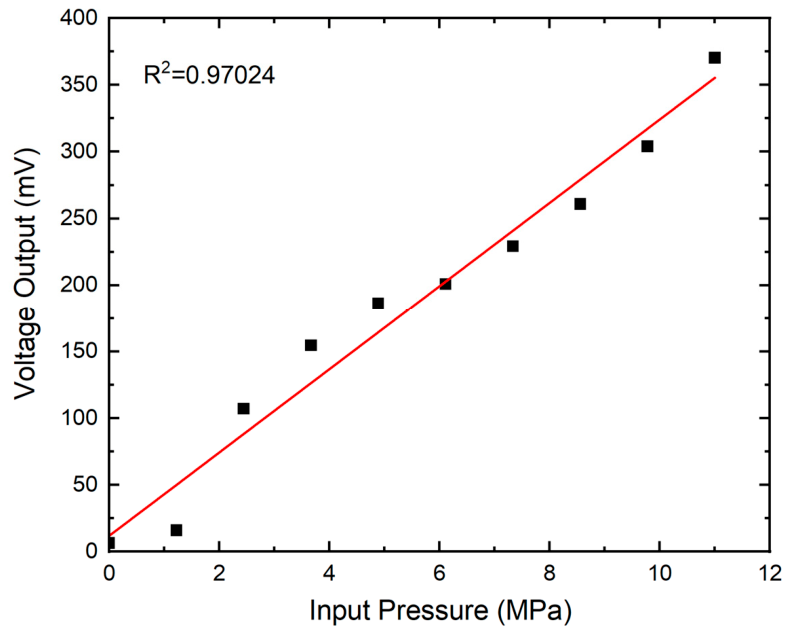
Before the full-scale tests, an application-specific calibration was performed under stepwise known compressive loading. Figure 6 shows the pressure–voltage characterisation over approximately 0–11 MPa, for which the voltage increased from near zero to approximately 370 mV and the linear regression gave R2 = 0.97024. Based on the calibration points shown in Figure 6, the fitted relationship can be expressed approximately as V = 31.3P + 12.1, where V is in mV and P is in MPa. The coefficients are reported to the precision supported by the plotted calibration data. This pressure–voltage curve characterises the electromechanical response of the sensor assembly.
Figure 6.
Pressure–voltage characterisation of the flexible PVDF sensor under stepwise known compressive loading (The red line denotes the linear regression fit (R2 = 0.97024); the approximate fitted relation is V = 31.3P + 12.1 (V in mV, P in MPa)).
The field-test channel was calibrated under known compressive loading before installation, and the same conversion, sensor position, mechanical constraint and acquisition settings were retained for all train-speed tests. Thus, Thus, the peak rail-pad loads and representative load time histories are compared using the same calibrated load quantity consistently across speeds rather than reporting a voltage-to-kPa conversion.
During the full-scale measurements, the sensor voltage was sampled at 10,000 Hz without low-pass or high-pass filtering during acquisition or post-processing. The calibration fit yielded R2 = 0.97024, and the installation and acquisition settings were kept unchanged throughout the speed series; the reported loads and amplification factor are interpreted as calibration-based estimates. The fit coefficient does not quantify measurement uncertainty, and the sampling rate does not establish the installed measurement-chain bandwidth. The technical specifications and calibration information of the flexible sensing and acquisition system are summarized in Table 4.
Table 4.
Technical specifications and calibration information of the flexible sensing and acquisition system.
Full-Scale Test Setup and Data Processing
A full-scale ballastless-track test was used to obtain the speed-dependent track-slab acceleration and rail-pad load responses. The flexible PVDF sensor was embedded at the rail-pad/fastening interface so that the transient load transmitted from the rail through the fastening system could be measured directly. The sensor installation position, mechanical constraint, signal-conditioning configuration and data-acquisition settings were kept unchanged for all train-speed conditions.
Before the train-passage tests, the sensor was calibrated under stepwise known compressive loading as described above. During each train passage, the raw sensor voltage was continuously sampled at 10 kHz without low-pass or high-pass filtering. The same calibration/conversion procedure was applied to every speed condition.
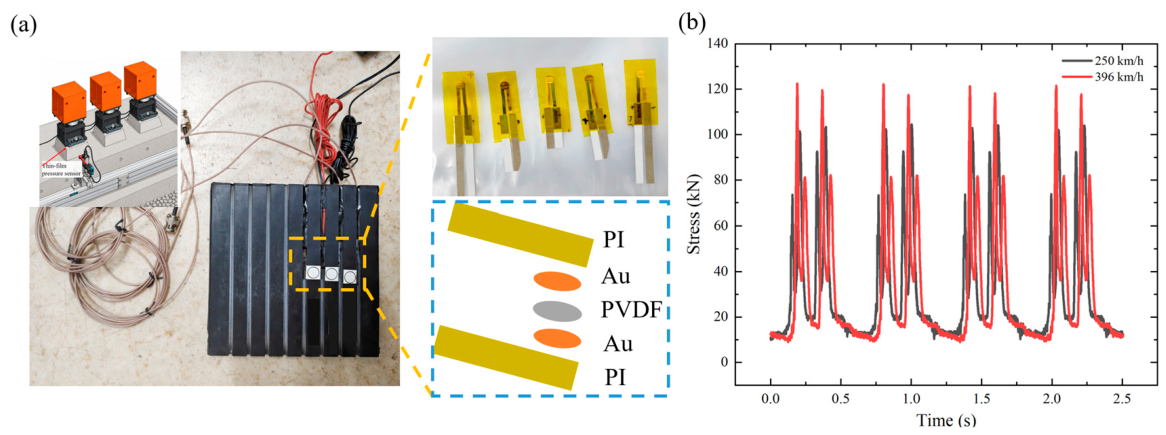
For the speed-effect analysis, the train-passage interval was identified from each calibrated rail-pad load record and the maximum dynamic load within that interval was extracted. These peak values were used to construct the load-versus-speed relationship in Figure 8c. The complete calibrated load histories at 250 and 396 km/h are retained in Figure 10b as representative examples of the transient wheel-passage waveform. Track-slab acceleration was measured independently over the investigated speed range, and the characteristic acceleration amplitude from each train-passage record was extracted using the same processing procedure at every speed to construct Figure 8b.
The data-processing workflow therefore consisted of: (i) acquisition of raw sensor-voltage time histories under a fixed experimental configuration; (ii) application of the pre-test calibration/conversion to obtain rail-pad load; (iii) identification of the train-passage interval; and (iv) extraction of the maximum dynamic rail-pad load used for the speed-dependent comparison. Keeping the installation, calibration procedure, sampling frequency and processing sequence unchanged across the speed series reduces processing-induced bias.
2.3. Dynamic Response Indices of the Vehicle–Track–Subgrade System
2.3.1. Evaluation Criteria for Concrete Structures
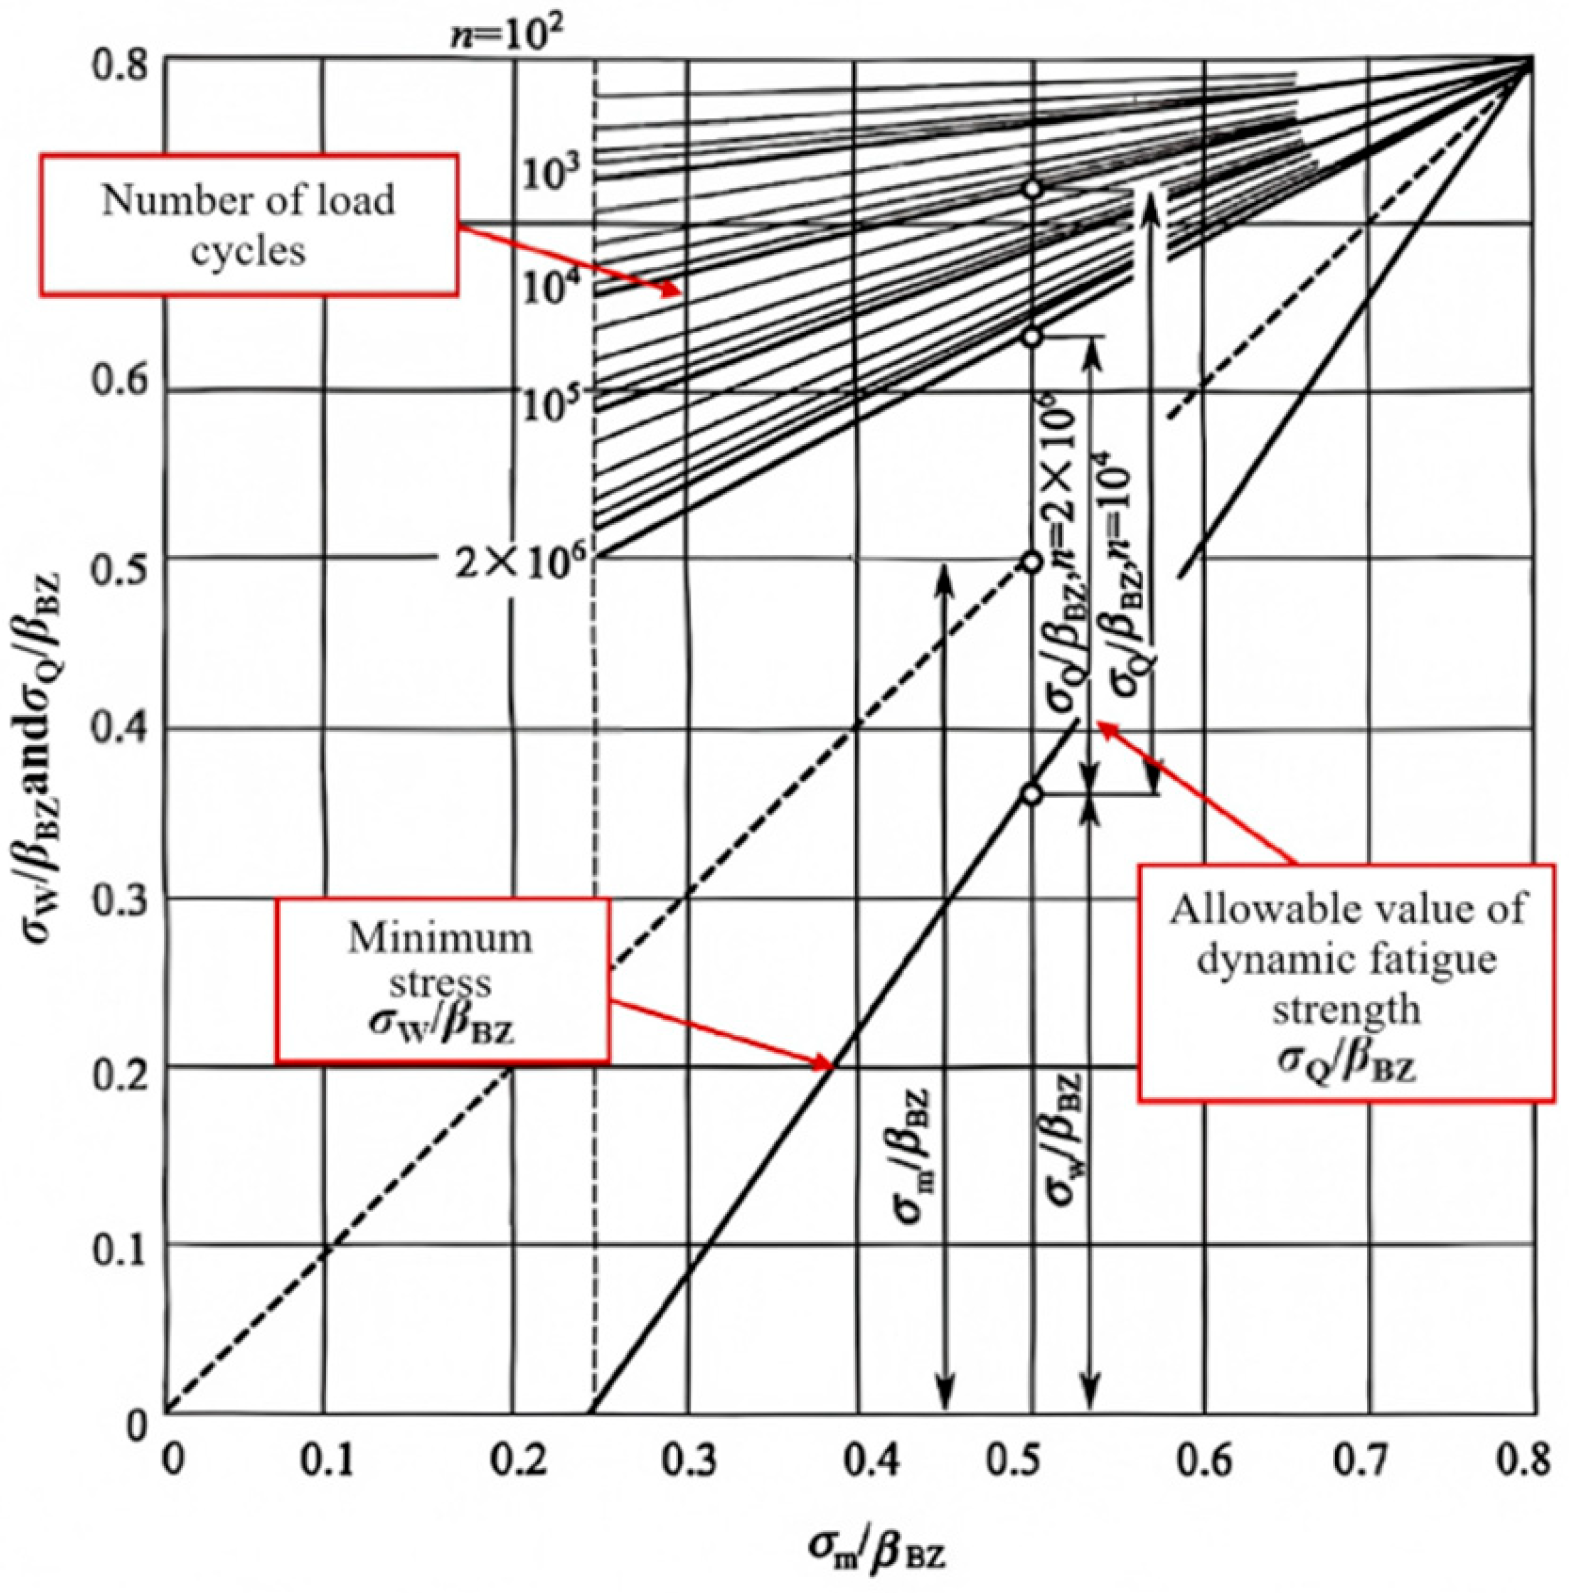
In ballastless track, traffic-induced bending tensile stress is mainly resisted by the concrete slab and concrete base. Repeated train loading subjects these members to fatigue action during service. The fatigue strength of concrete depends on the maximum stress in a loading cycle and on the minimum stress level [29]. The Smith fatigue diagram is used to determine the allowable dynamic fatigue strength of the concrete structure, as shown in Figure 7.
In the Smith diagram, βBZ denotes the flexural tensile strength of concrete, taken as approximately 14.3–16.7% of its compressive strength [30]. σW denotes the minimum stress in the loading cycle and is taken here as the longitudinal tensile stress in the concrete. The parameter n denotes the number of train load cycles. In this study, n = 2 × 10⁶ is adopted as a reference number of cycles; conversion to a service duration requires a traffic spectrum. σQ denotes the allowable dynamic fatigue strength.
Using the Smith fatigue diagram and the parameters above, the relationship between the allowable dynamic fatigue strength of the ballastless-track concrete structure, σQ, and the minimum stress, σW, is written as Equation (1) [31].
Figure 7.
Smith design diagram of concrete fatigue strength (reproduced from Ref. [31]).
For quantitative long-term assessment, the Smith criterion is expressed as a fatigue utilisation ratio, , where σmax is the calculated longitudinal tensile stress and σQ is the allowable fatigue stress corresponding to the adopted n = 2 × 10⁶ reference cycles. U < 1 indicates that the calculated stress remains within the Smith fatigue limit for the adopted reference inputs. Because the Smith relation used here specifies an allowable stress at a prescribed number of cycles rather than a complete S–N curve, U is reported for the track slab as a nominal stress-based index.
The nominal reference flexural tensile strength used in Equation (1) for the C60 track slab is βBZ = 2.04 MPa. This input is distinct from the allowable fatigue stress σQ calculated from the equation.
2.3.2. Evaluation Criteria for the CA Mortar Layer
Under cyclic train loading, cracks may initiate and propagate in the CA mortar layer. Its fatigue behaviour depends on load repetition, material properties and environmental conditions, especially temperature. Fatigue tests on CA mortar specimens have led to the following equation at 20 °C [32]:
where is the stress level; σc,max is the maximum compressive stress; fc is the 28-day compressive strength of CA mortar, taken as 1.8 MPa at 20 °C; and N is the number of fatigue cycles, taken as 2 × 10⁶. The corresponding value is σc,max = 1.25 MPa.
For the CA mortar layer, Equation (2) can be inverted to estimate the fatigue life Nf at the calculated compressive stress level. The cumulative fatigue damage is then evaluated using the linear Miner rule, , with n = 2 × 10⁶ reference load cycles. At stress levels outside the calibration range of the adopted S–N relation, the resulting Nf and D are formal extrapolations rather than validated service-life predictions.
Based on field measurements and push-out tests, the CA mortar layer has allowable dynamic fatigue stress limits of approximately 0.4 MPa in tension and 0.025 MPa in tangential bond strength.
2.3.3. Vehicle Operation Safety Indicators
1. Wheel–rail vertical interaction force
Track irregularities generate dynamic wheel–rail forces during high-speed train passage. These forces exceed the static wheel load and contribute to the stress demand in the track and subgrade. The wheel–rail vertical force is used as an index for track degradation and vehicle operation.
According to the Code for Design of High-Speed Railway (TB 10621-2014) [33] and the Technical Code for Dynamic Acceptance of High-Speed Railway Engineering (TB 10761-2013) [34], the maximum allowable wheel–rail vertical interaction force is 170 kN, with a reference value of 120 kN. These limits are used to judge whether the coupled vehicle–track response remains within the accepted operating range.
2. Car-body acceleration
Car-body acceleration records the vibration transmitted from track to vehicle and is related to ride comfort, train stability and track smoothness. According to the Maintenance Rules for Ballastless Track of High-Speed Railways (TG/GW 115-2012) [35], dynamic track quality is classified into four management levels: Routine Maintenance (Grade I), Comfort (Grade II), Temporary Repair (Grade III) and Speed Restriction (Grade IV). The thresholds are listed in Table 5. This study adopts the Routine Maintenance threshold, giving a limiting vertical car-body acceleration of 1.0 m/s2.
Table 5.
Vehicle body acceleration management value.
3. Results
Train speed changes the temporal content of the moving load rather than the axle load itself. The same axle spacing, bogie spacing and vehicle spacing produce different excitation frequencies as speed varies. In the following results, track displacement and structural stresses are numerical outputs from the finite-element model, whereas track-slab acceleration and rail-pad dynamic load are measured quantities from the full-scale tests.
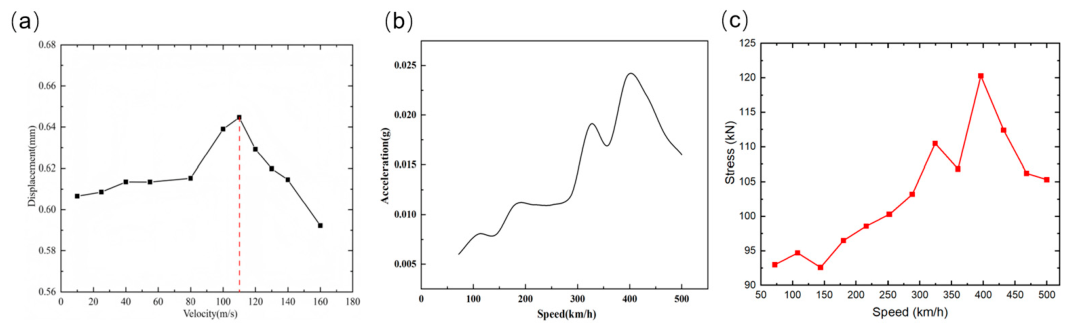
In track-structure mechanics, a response-based peak speed is the speed at which the track–subgrade response reaches a maximum for a given moving load. The phenomenon was first observed in 1997 at the Ledsgård test site in Sweden, where the track was constructed on soft subgrade soils [36,37]. The present study uses the direct displacement-amplitude method: track displacement amplitudes are calculated at different train speeds, and the speed corresponding to the maximum displacement is reported as the model-specific displacement–peak speed [27,38]. Figure 8a gives a critical speed of 109 m/s. Two speeds are then selected for stress analysis: 110 m/s, close to the critical speed, and 180 m/s, above the critical speed. It should be noted that the 180 m/s case is a hypothetical numerical extrapolation, representing a post-critical-speed condition for examining the trend of dynamic amplification and its attenuation beyond the critical speed, rather than an actual operating speed of the investigated train. At this extreme speed, the idealised model assumptions—including simplified wheel–rail contact, perfectly bonded interfaces, homogeneous subgrade, and smooth track—may have a greater influence on the predicted response, and effects such as aerodynamic loading, wheel–rail creep, and nonlinear contact behavior may become more significant. The 180 m/s result is therefore presented as a sensitivity case for understanding the post-critical response trend and should not be interpreted as evidence of operational safety at this speed.
Figure 8.
Effect of train speed on the dynamic response of the track structure: (a) simulated variation in track displacement with train speed (m/s); (b) measured variation in track-slab acceleration with train speed (km/h) in the full-scale test; (c) measured variation in peak rail-pad load with train speed (km/h).
A full-scale ballastless-track test measured slab acceleration and rail-pad load over a range of train speeds. As described in Section Full-Scale Test Setup and Data Processing, the maximum dynamic rail-pad load within each train-passage interval was extracted for the speed-effect comparison. Figure 8b shows the independently measured slab-acceleration response, while Figure 8c shows the corresponding peak rail-pad load. Both responses vary non-monotonically with train speed. The largest slab-acceleration response occurs at approximately 396 km/h, with a secondary peak near 325 km/h, and the rail-pad load reaches its maximum measured value of approximately 120 kN near 396 km/h before decreasing at higher speeds. The agreement of these independently processed experimental indices with the simulated displacement peak near 109 m/s (approximately 392 km/h) places the principal global and local amplification in the same speed range. Periodic axle loading provides a kinematic interpretation of the secondary peak [8]: at 325 km/h, gives 36.1 Hz for the 2.5 m wheelbase, 12.0 Hz for the 7.5 m inter-bogie spacing, 5.16 Hz for the 17.5 m bogie-centre spacing and 3.61 Hz for the 25 m vehicle length. These are candidate forcing frequencies; without a coincident modal or spectral peak, the secondary feature cannot be assigned uniquely to resonance. The measured acceleration decreases after the main peak. The slab acceleration and rail-pad pressure measurements presented in this study were obtained during the same test campaign, on the same track section, and under the same train configuration, which supports their joint interpretation in the following analysis.
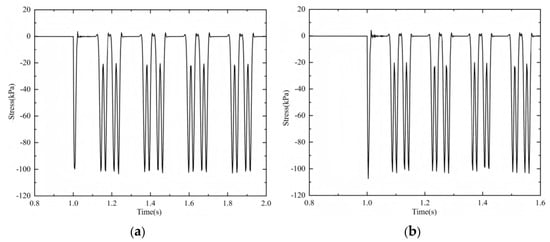
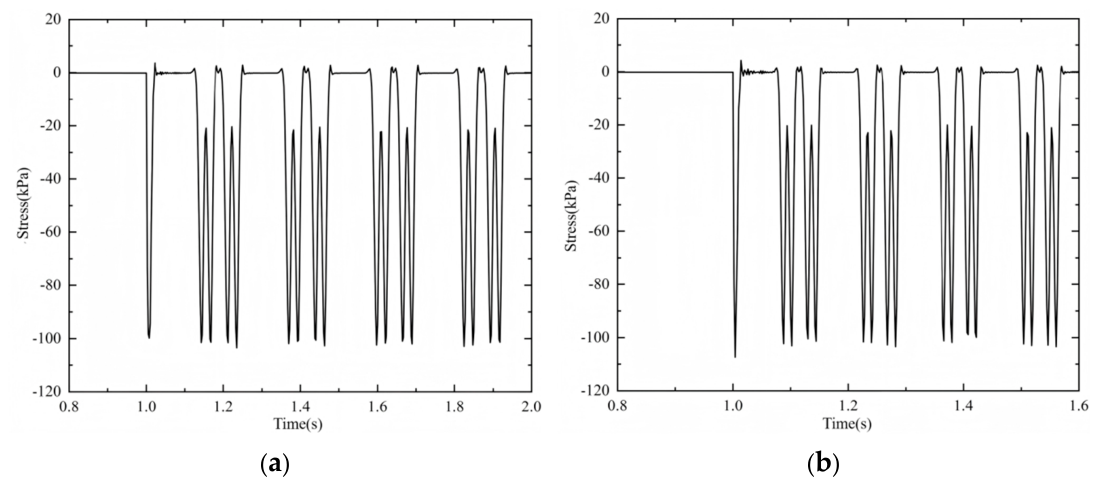
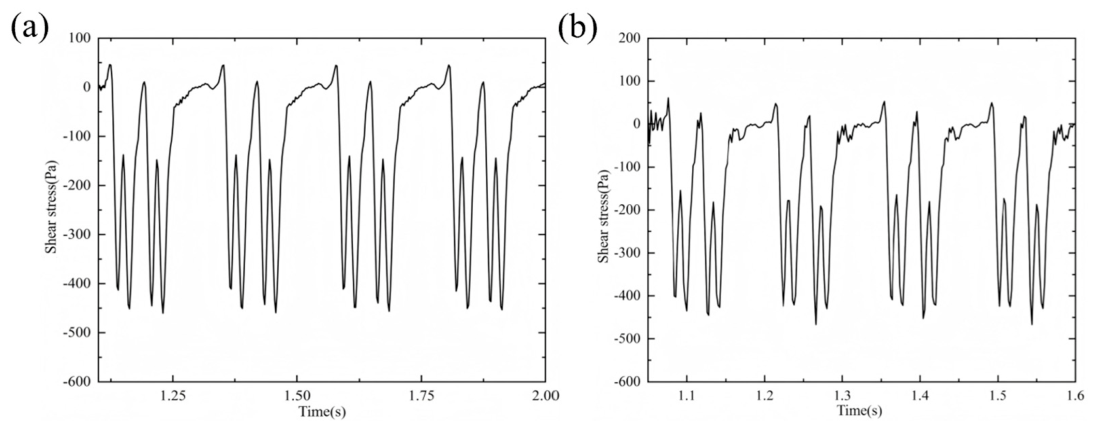
Figure 9 shows the vertical-stress histories of the track slab. Under ideal track conditions, the slab mainly carries repeated vertical compression. At train speeds of 110 and 180 m/s, the vertical stresses remain below the compressive strength of the slab, 27.5 MPa. The stress histories have a pulse-train form governed by successive wheel passages.
Figure 9.
Simulated vertical stress time–history curves of track slabs at different speeds: (a) 110 m/s; (b) 180 m/s.
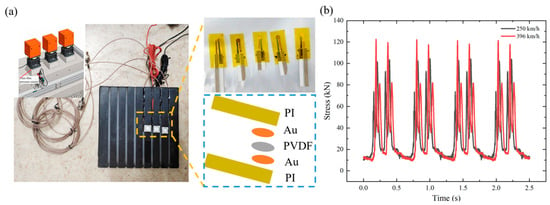
While the preceding results describe the global structural response, the local load transmission through the rail-pad/fastening interface constitutes a complementary aspect of the same dynamic amplification mechanism. The flexible pressure sensor embedded in the rail pad provides a calibrated estimate of this local component of the load-transfer path. Figure 10a shows the customised flexible PVDF sensor installed in the rail-pad assembly. Figure 10b presents the calibrated rail-pad load time histories at 250 and 396 km/h. These complete time histories illustrate the transient wheel-passage response, whereas the peak load extracted from each speed condition is used in Figure 8c. The higher load pulses at 396 km/h are therefore consistent with the multi-speed load-versus-speed trend rather than being the sole basis for identifying near-critical amplification. To quantify this local load amplification, the rail-pad dynamic load amplification factor is defined as , where P(v) is the peak rail-pad load at train speed v, and Pref is the corresponding load at the reference speed. Taking 250 km/h as the reference, the load amplification factor at 396 km/h is (calculated from the calibrated load estimates), indicating a notable increase in local load transmission through the rail-pad/fastening layer near the critical-speed range.
Figure 10.
Flexible PVDF sensor measurement of rail-pad dynamic load at different train speeds: (a) customised PI/Au/PVDF/Au/PI sensor and its installation in the rail-pad assembly; (b) comparison of calibrated rail-pad load responses at 250 km/h and 396 km/h.
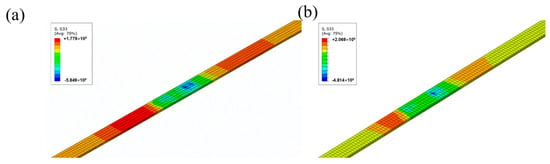
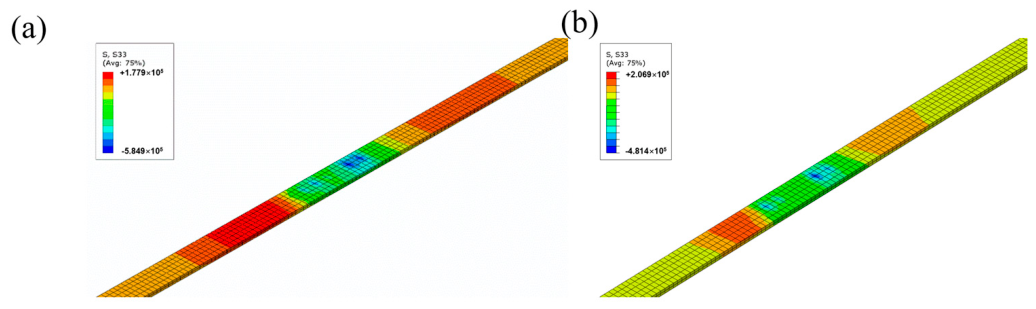
Figure 11 shows the longitudinal stress contours of the track slab. When the train speed increases from 110 to 180 m/s, the longitudinal tensile stress increases from 0.18 to 0.21 MPa. These stresses are used below for the quantitative Smith fatigue assessment, rather than being compared only with the static flexural tensile strength of 2.04 MPa. The slab response is governed by vertical compression with a smaller longitudinal tensile component.
Figure 11.
Simulated longitudinal stress cloud diagram of rail slab at different speeds: (a) 110 m/s; (b) 180 m/s.
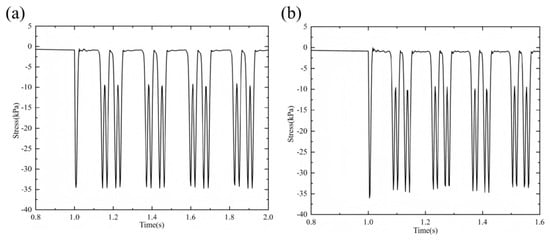
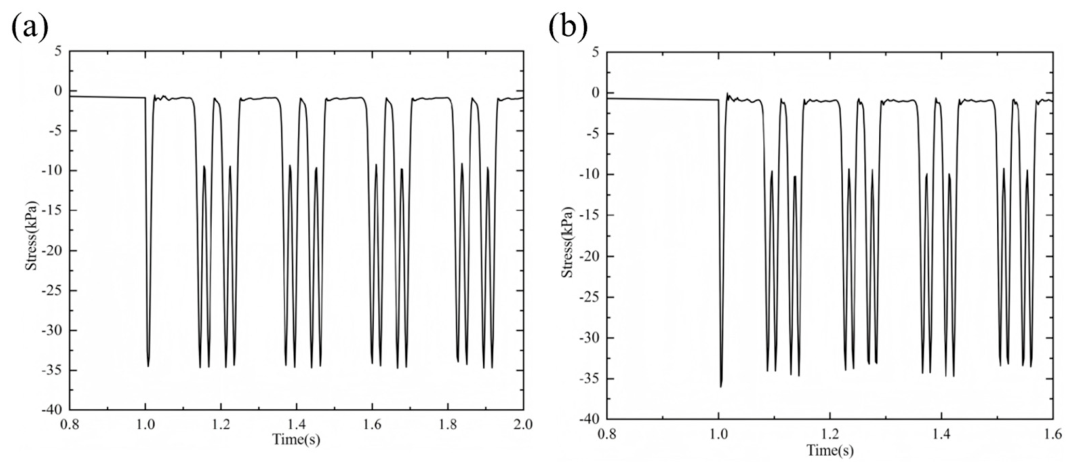
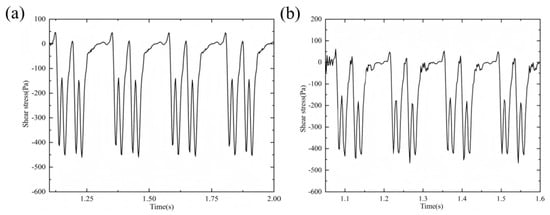
In the CA mortar layer stress histories shown below, individual wheel-load peaks remain visible rather than being fully smoothed. This is because the CA mortar has a much lower elastic modulus (300 MPa) than the concrete slab (36 GPa), and the CRTS I slab length (4.97 m) is limited compared with continuous slab tracks, reducing the filtering effect of the slab on discrete wheel loads. Figure 12 shows the vertical-stress histories of the CA mortar layer. The mortar layer mainly carries vertical compression, and the maximum compressive stress at the higher speed is approximately 35 kPa (0.035 MPa). Figure 13 shows the shear-stress histories of the same layer, with the shear stress remaining below the measured tangential bond strength of 0.025 MPa. The maximum compressive stress is used in the following fatigue-life calculation to quantify long-term service demand under the adopted design cycles.
Figure 12.
Simulated time–history curves of vertical stress in CA mortar layer at different speeds: (a) 110 m/s; (b) 180 m/s.
Figure 13.
Simulated shear stress time–history curves of CA mortar layer at different speeds: (a) 110 m/s; (b) 180 m/s.
A quantitative fatigue assessment was performed using the reference loading of 2 × 10⁶ cycles. For the C60 track slab, Equation (1) gives allowable Smith fatigue stresses σQ of 0.660 MPa at 110 m/s and 0.646 MPa at 180 m/s for the calculated longitudinal tensile stresses of 0.18 and 0.21 MPa, respectively. The corresponding fatigue utilisation ratios are 0.273 and 0.325, both below unity for these nominal inputs. These calculations use 0.18 and 0.21 MPa in both the σW and σmax positions; because σW is defined as a cycle minimum, the indices are conditional calculations pending verification against complete stress cycles. For the CA mortar, the maximum calculated compressive stress of 0.035 MPa gives . Inverting Equation (2) yields a theoretical fatigue life Nf ≈ 8.61 × 10¹² cycles. Applying the Miner rule with n = 2 × 10⁶ gives D ≈ 2.32 × 10⁻⁷, which is a formal extrapolation at S = 0.01944 and does not establish a field fatigue life. These results are summarised in Table 6.
Table 6.
Quantitative fatigue assessment under the adopted design service loading.
The vehicle operation safety indicators introduced in Section 2.3.3—wheel–rail vertical force and car-body acceleration—are also evaluated from the coupled model. The maximum wheel–rail vertical force remains below the allowable limit of 170 kN, and the vertical car-body acceleration is within the Routine Maintenance threshold of 1.0 m/s2.
The analysis defines the response of the intact system under ideal support. A single ultra-high-speed passage produces a bounded stress response, with amplification concentrated near the critical-speed range. The finite-element results describe how this amplification is distributed through the slab and CA mortar, while the flexible-sensor measurements show a corresponding speed-dependent amplification in the local load transmitted through the rail-pad/fastening layer. Long-term assessment should therefore consider both global near-critical response and local load transfer under degraded support conditions.
4. Discussion
The numerical displacement maximum occurs at 109 m/s (392.4 km/h), while the measured track-slab acceleration and rail-pad dynamic load both reach their maxima near 396 km/h (110.0 m/s). The approximately 0.9% speed difference shows that three independent response indicators converge on the same near-critical range for the investigated configuration. This agreement is used here as experimental corroboration of the critical-speed identification, while the amplitudes of displacement, acceleration and local load remain distinct physical quantities. The comparison of critical-speed indicators obtained from the numerical model and full-scale measurements is summarized in Table 7.
Table 7.
Comparison of critical-speed indicators from the numerical model and full-scale measurements.
To compare the direct displacement-amplitude method with an established alternative, the numerical speed-sweep results are reprocessed using the displacement Dynamic Amplification Factor (DAF) procedure adopted by Wu et al. [25]. Let , where the denominator is the displacement amplitude at a fixed reference speed. Because the denominator is constant, the maximum of the DAF occurs at the same speed as the maximum displacement. The DAF method therefore identifies the same critical-speed indicator of 109 m/s (392.4 km/h).
The full-scale measurements provide an independent comparison with this numerical identification. The track-slab acceleration and rail-pad dynamic load both reach their maximum values near 396 km/h (110.0 m/s), which is only approximately 0.9% above the 109 m/s numerical displacement peak. Thus, the direct FE displacement method, the DAF method and two independently measured response quantities all identify essentially the same critical-speed range.
Simplified Winkler-foundation and homogeneous-half-space formulations do not fully represent the layered track–subgrade system considered in this study. Therefore, the critical-speed comparison is limited to the response-based indicators obtained from the numerical model and field measurements. An independent wave-based prediction would require dispersion analysis accounting for the layered foundation and track structure. The DAF comparison remains response-based and therefore depends on the selected response quantity and the resolution of the speed sweep; a rigorous wave-based critical-speed prediction for the complete layered system would require a dedicated dispersion analysis.
PVDF railway force sensing has previously been compared with strain-gauge measurements [16]. Here, the film provides a local embedded signal complementary to global vibration measurements. Its geometry facilitates installation within the rail pad, but no controlled comparison with a reference load cell is available to establish an accuracy or bandwidth advantage.
The flexible PVDF sensor measurements provide information complementary to the finite-element analysis. The customised PI/Au/PVDF/Au/PI sensor operates through the direct piezoelectric effect and converts time-varying deformation of the rail-pad/sensor assembly into an electrical signal. The sensor was characterised under known compressive pressure over approximately 0–11 MPa (Figure 6), and the full-scale load channel was calibrated before installation. During train passage, the voltage signal was sampled at 10 kHz without low-pass or high-pass filtering. Across the tested speed range, the measured peak rail-pad load increases toward the near-critical range, reaches approximately 120 kN near 396 km/h, and decreases at higher speeds.
For the intact reference configuration, the longitudinal tensile stress of the track slab increases from 0.18 MPa at 110 m/s to 0.21 MPa at 180 m/s, a 16.7% increase, as reported in Figure 11 and Table 6. Thus, the displacement-peak speed does not necessarily maximise each local stress component. The reported maximum CA-mortar compression is approximately 35 kPa at the higher simulated speed (Figure 12).
The stress and fatigue calculations apply to the adopted intact interfaces, uniform support and reference loading. Existing agreement in concrete-base vibration supports the selected global response, but does not establish the accuracy of local fatigue demand in deteriorated track or a field service life.
In this framework, the finite-element model and the flexible sensor measurements are complementary rather than independent: the numerical analysis characterises the global critical-speed amplification and stress response, while the sensor records the corresponding local pressure transmission along the rail-pad/fastening layer. Together, they address the same question of how near-critical loading affects both the global track response and the local load path.
5. Conclusions
The coupled finite-element model predicted a maximum track displacement at 109 m/s (392.4 km/h) for the idealised CRTS I ballastless track system. The track slab was mainly subjected to vertical compression and longitudinal tension, while compression and shear dominated the CA mortar response. At 110 and 180 m/s, the calculated fatigue utilisation ratios of the track slab were 0.273 and 0.325, respectively, for the adopted reference loading of 2 × 10⁶ cycles. The CA mortar damage index was approximately 2.32 × 10⁻⁷, obtained by extrapolating the adopted S–N relationship. These fatigue indices provide a nominal assessment under the adopted track and loading conditions, while a more realistic evaluation of long-term performance would require representative traffic loading histories and validated fatigue relationships.
In the full-scale tests, track-slab acceleration and rail-pad dynamic load both reached their maxima near 396 km/h, close to the numerical displacement peak at 392.4 km/h. The PVDF sensor recorded the transient load response at the rail-pad/fastening interface, giving a peak-load estimate of approximately 120 kN and a load amplification factor of approximately 1.65 relative to 250 km/h. The numerical and experimental results thus indicate amplification over a similar speed range, although they represent different response quantities. The flexible sensor provides local load-transfer information that complements the global track response obtained from numerical analysis and vibration measurements. The reported absolute loads and amplification factor remain calibration-based estimates without quantified measurement uncertainty.
Further work is needed to validate the near-critical response and improve the quantitative reliability of the rail-pad measurements. This includes comparisons of numerical and experimental results at matching speeds and for the same response quantities, as well as dynamic calibration of the complete sensor–conditioning–acquisition chain to determine its bandwidth, repeatability, hysteresis and measurement uncertainty. Reference force measurements are also needed to assess the estimated rail-pad loads. The numerical model could be extended to include interface deterioration, nonuniform support, track irregularities and more realistic wheel–rail contact and wheelset dynamics. Spectral and modal analyses would help clarify the secondary acceleration peak near 325 km/h, while dispersion analysis could provide an independent assessment of the critical-speed range. Repeated measurements under representative track conditions are needed to establish speed-dependent monitoring baselines and develop warning thresholds. The present amplification range and load estimates should not be used as operational speed limits or acceptance criteria.
Author Contributions
Conceptualisation, W.L., C.H. and G.L.; methodology, W.L. and T.L.; software, W.L. and T.L.; validation, W.L. and Q.Z.; formal analysis, W.L.; investigation, W.L., C.H., T.L. and X.Z.; data curation, W.L., T.L. and Z.W.; writing—original draft preparation, W.L.; writing—review and editing, G.L. and H.F.; supervision, G.L. and H.F.; project administration, C.H., G.L. and H.F.; funding acquisition, G.L. and H.F. All authors have read and agreed to the published version of the manuscript.
Funding
This research was funded by the Open Fund of the National Key Laboratory of High-Speed Railway Track System, grant number 2024YJ247, and the National Natural Science Foundation of China, grant number 52208374.
Institutional Review Board Statement
Not applicable.
Informed Consent Statement
Not applicable.
Data Availability Statement
The raw finite element simulation outputs and flexible-sensor field-test data supporting the results of this study are not publicly available due to ongoing follow-up research. All processed dynamic stress curves, acceleration records and rail-pad load responses visualized in figures are provided within the manuscript. Requests for complete raw datasets can be submitted to the corresponding author upon reasonable request.
Acknowledgments
The authors sincerely appreciate the financial support provided by the Open Fund of the National Key Laboratory of High-Speed Railway Track System and the National Natural Science Foundation of China.
Conflicts of Interest
The authors declare no conflicts of interest.
Abbreviations
The following abbreviations are used in this manuscript:
| CRTS | China Railway Track System |
| CA | Cement Asphalt Mortar |
| CRH | China Railway High-speed |
| EMU | Electric Multiple Units |
References
- Wang, T.F.; Luo, Q.; Liu, J.K.; Liu, G.; Xie, H.W. Method for slab track substructure design at a speed of 400 km/h. Transp. Geotech. 2020, 24, 100391. [Google Scholar] [CrossRef] [Scilit]
- Wan, Z.B.; Bian, X.C.; Li, S.H.; Chen, Y.M.; Cui, Y.J. Remediation of mud pumping in ballastless high-speed railway using polyurethane chemical injection. Constr. Build. Mater. 2020, 259, 120401. [Google Scholar] [CrossRef] [Scilit]
- Bian, X.C.; Wan, Z.B.; Zhao, C.; Cui, Y.J.; Chen, Y.M. Mud pumping in the subgrade of ballastless high-speed railway. Géotechnique 2023, 73, 614–628. [Google Scholar] [CrossRef] [Scilit]
- Li, Y.; Cao, K.; Chen, J.; Li, H.; Yang, Z.; Wang, G. Damage evolution of slab tracks with complex temperature distribution. Alex. Eng. J. 2025, 110, 479–489. [Google Scholar] [CrossRef] [Scilit]
- Walubita, E.; Li, H.; Li, Y.; Shi, X. Damage assessment of the CRTS III ballastless slab track in high temperature regions. Structures 2024, 69, 107456. [Google Scholar] [CrossRef] [Scilit]
- Zhang, K.; Ren, J.; Ye, W.; Li, C.; Xu, G.; Liu, W.; Deng, S. The influence of uneven frost heave and thermal conditions on deformation and damage of slab track in seasonally frozen regions. Eng. Fail. Anal. 2024, 157, 107881. [Google Scholar] [CrossRef] [Scilit]
- Song, L.; Shi, J.; Wu, J.; Cui, C.; Liu, R.; Yu, Z. Investigating the fatigue performance of conventional reinforced concrete CRTS III ballastless track structures using a fatigue damage constitutive model. Eng. Struct. 2024, 303, 117504. [Google Scholar] [CrossRef] [Scilit]
- Sheng, X.; Jones, C.J.C.; Thompson, D.J. A theoretical study on the influence of the track on train-induced ground vibration. J. Sound Vib. 2004, 272, 909–936. [Google Scholar] [CrossRef] [Scilit]
- Takemiya, H.; Bian, X.C. Shinkansen high-speed train induced ground vibrations in view of viaduct–ground interaction. Soil Dyn. Earthq. Eng. 2007, 27, 506–520. [Google Scholar] [CrossRef] [Scilit]
- Kaynia, A.M.; Madshus, C.; Zackrisson, P. Ground vibration from high-speed trains: Prediction and countermeasure. J. Geotech. Geoenviron. Eng. 2000, 126, 531–537. [Google Scholar] [CrossRef] [Scilit]
- Zhai, W.M. Vehicle-Track Coupled Dynamics, 4th ed.; Science Press: Beijing, China, 2015. [Google Scholar]
- Zhai, W.M.; Wang, K.; Cai, C.B. Fundamentals of vehicle-track coupled dynamics. Veh. Syst. Dyn. 2009, 47, 1349–1376. [Google Scholar] [CrossRef] [Scilit]
- Chen, Y.M.; Bian, X.C. The review of high-speed railway track foundation dynamics. J. China Civ. Eng. 2018, 51, 1–13. [Google Scholar] [CrossRef]
- Schilder, R.; Diederich, D. Installation quality of slab track-a decisive factor for maintenance. In RTR Special-Maintenance and Renewal; RTR: Hamburg, Germany, 2007. [Google Scholar]
- Wen, M.; Miao, L.; Guan, X. High-compatibility thick-film smart aggregates for strain monitoring of concrete. Int. J. Smart Nano Mater. 2025, 16, 596–611. [Google Scholar] [CrossRef] [Scilit]
- Song, Y.; Du, Y.L.; Sun, B.C. Study on Wheel/Rail Interaction Force Real-Time Monitoring Method Based on Piezoelectric Sensing Technology. Adv. Mater. Res. 2009, 79–82, 7–10. [Google Scholar] [CrossRef] [Scilit]
- Zhang, Y.; Zhang, B.; Lv, Y.; Wang, P.; Liu, T.; Meng, C. Flexible and breathable MXene-modified paper-based piezoresistive pressure sensors integrated into airbag pillow for sleep monitoring. Soft Sci. 2025, 5, 17. [Google Scholar] [CrossRef] [Scilit]
- Chen, S.; Li, S.; Zheng, Y.; Fong, B.; Li, Y.; Dong, P.; Hwang, D.; Yao, S. Highly sensitive and robust soft tri-axial tactile sensors enabled by dual inductive sensing mechanisms. Soft Sci. 2025, 5, 6. [Google Scholar] [CrossRef] [Scilit]
- Liu, G.; Yu, P.; Tao, Y.; Liu, T.; Liu, H.; Zhao, J. Hybrid 3D printed three-axis force sensor aided by machine learning decoupling. Int. J. Smart Nano Mater. 2024, 15, 261–278. [Google Scholar] [CrossRef] [Scilit]
- Wu, C.; Zhu, H.; Wang, X.; Yuan, W.; Tian, Y.; Jiang, X.; Han, Y.; Gao, X.; Lai, W. Efficient electromechanical conversion regulation to enhance the sensitivity of flexible strain sensors. Soft Sci. 2025, 5, 42. [Google Scholar] [CrossRef] [Scilit]
- Ma, Q.; Cheng, H.; Jang, K.I.; Luan, H.; Hwang, K.C.; Rogers, J.A.; Huang, Y.; Zhang, Y. A nonlinear mechanics model of bio-inspired hierarchical lattice materials consisting of horseshoe microstructures. J. Mech. Phys. Solids 2016, 90, 179–202. [Google Scholar] [CrossRef] [Scilit]
- Dang, X.; Paulino, G.H. Kirigami Engineering: The Interplay Between Geometry and Mechanics. Appl. Mech. Rev. 2025, 77, 050801. [Google Scholar] [CrossRef] [Scilit]
- Gao, H.; Li, J.; Wang, Z.; Xue, Z.; Meng, X. Design of porous partition elastomer substrates for the island–bridge structures in stretchable inorganic electronics. J. Appl. Mech. 2024, 91, 051005. [Google Scholar] [CrossRef] [Scilit]
- Li, J.; Meng, X.; Shen, Y.; Gu, J.; Luo, G.; Bai, K.; Li, H.; Xue, Z. Design strategy of porous elastomer substrate and encapsulation for inorganic stretchable electronics. Int. J. Smart Nano Mater. 2024, 15, 330–347. [Google Scholar] [CrossRef] [Scilit]
- Wu, Y.; Fu, H.; Bian, X. Comparative study on dynamic responses of ballasted and ballastless tracks at critical velocity. Transp. Geotech. 2024, 48, 101354. [Google Scholar] [CrossRef] [Scilit]
- Yang, Y.B.; Hung, H.H. Wave Propagation for Train-Induced Vibrations: A Finite/Infinite Element Approach; World Scientific: Singapore, 2009. [Google Scholar]
- Bian, X.C.; Cheng, C.; Jiang, J.Q.; Chen, R.P.; Chen, Y.M. Numerical analysis of soil vibrations due to trains moving at critical speed. Acta Geotech. 2016, 11, 281–294. [Google Scholar] [CrossRef] [Scilit]
- Bian, X.C.; Jiang, H.G.; Chang, C.; Hu, J.; Chen, Y.M. Track and ground vibrations generated by high-speed train running on ballastless railway with excitation of vertical track irregularities. Soil Dyn. Earthq. Eng. 2015, 76, 29–43. [Google Scholar] [CrossRef] [Scilit]
- Song, Y.P. Fatigue Performance and Design Principles of Concrete Structures; China Machine Press: Beijing, China, 2006. [Google Scholar]
- Ministry of Transport of the People’s Republic of China. Design Code for Highway Cement Concrete Pavement; China Communications Press: Beijing, China, 2011.
- Liu, S. Study on Mechanism of Mud Pumping in High-Speed Railway Subgrade and Induced Wheel–Rail Dynamic Response. Master’s Thesis, Shandong University, Jinan, China, 2021. [Google Scholar]
- Wang, F.Z.; Liu, Z.C. Research on the fatigue behavior of CA mortar used in ballastless slab track of high speed railway. J. Wuhan Univ. Technol. 2008, 30, 79–81. (In Chinese) [Google Scholar]
- TB 10621-2014; Code for Design of High Speed Railway. China Railway Publishing House: Beijing, China, 2014.
- TB 10761-2013; Technical Regulations for Dynamic Acceptance for High-speed Railway Construction. China Railway Publishing House: Beijing, China, 2013.
- TG/GW 115-2012; Maintenance Rules for Ballastless Track of High-speed Railway (Trial). China Railway Publishing House: Beijing, China, 2012.
- Adolfsson, K.; Andréasson, B.; Bengtson, P.; Bodare, A.; Madshus, C.; Massarch, R.; Wallmark, G.; Zackrisson, P. High Speed Lines on Soft Ground: Evaluation and Analyses of Measurements from the West Coast Line; Technical Report; Banverket: Stockholm, Sweden, 1999. [Google Scholar]
- Takemiya, H. Simulation of track–ground vibrations due to a high-speed train: The case of X-2000 at Ledsgard. J. Sound Vib. 2003, 261, 503–526. [Google Scholar] [CrossRef] [Scilit]
- Hu, J.; Bian, X.C.; Xu, W.; Thompson, D. Investigation into the critical speed of ballastless track. Transp. Geotech. 2019, 18, 142–148. [Google Scholar] [CrossRef] [Scilit]

Disclaimer/Publisher’s Note: The statements, opinions and data contained in all publications are solely those of the individual author(s) and contributor(s) and not of MDPI and/or the editor(s). MDPI and/or the editor(s) disclaim responsibility for any injury to people or property resulting from any ideas, methods, instructions or products referred to in the content. |
© 2026 by the authors. Licensee MDPI, Basel, Switzerland. This article is an open access article distributed under the terms and conditions of the Creative Commons Attribution (CC BY) license.