


Abstract
Resistive pulse sensing (RPS), also known as Coulter counting, is a valuable technology for individually counting and measuring particles. However, practical implementation of microfluidic RPS requires appropriate sensing-region geometry and reproducible aperture fabrication. In this study, we fabricated PDMS microchannels for particle measurement using molds produced with an inexpensive consumer-grade stereolithography (SLA) 3D printer. The mold for the microchannel was designed using 3D modeling software, converted into data for the 3D printer, and then printed. The resulting mold was used to transfer the pattern to polydimethylsiloxane, which was then bonded to a glass substrate to produce the microchannel for particle measurement. For a nominal aperture width of 50 µm, the measured aperture width was 48.3 ± 6.0 µm (mean ± standard deviation, n = 8). Detectable RPS pulse signals were obtained from MDA-MB-231 cells and 10 µm polystyrene particles. The estimated primary material cost was approximately 37 JPY per microchannel (approximately USD 0.23 at 160 JPY/USD); this estimate excludes equipment, labor, utilities, and other non-primary-material costs. The complete fabrication process required approximately 2–3 days, and the resin mold was single-use in the present procedure. The present study represents a proof-of-concept evaluation; quantitative counting efficiency, detection limit, and particle-sizing accuracy were not established.
1. Introduction
Microfluidic systems provide versatile platforms for manipulating and measuring suspended particles and cells in small liquid volumes. Particle manipulation in microchannels can be achieved using several physical mechanisms. For example, inertial microfluidics exploits hydrodynamic forces generated by channel geometry to focus and separate particles [1], whereas dielectrophoresis uses non-uniform electric fields to manipulate polarizable particles and cells [2]. Such approaches have expanded the use of microfluidic systems for particle focusing, separation, capture, and analysis.
The performance and functionality of microfluidic systems depend strongly on the fabrication of microchannels with appropriate geometries. Conventional microfluidic devices are commonly fabricated using photolithography and related lithographic or etching processes, often followed by replication in polydimethylsiloxane (PDMS). Other fabrication approaches include micromachining, laser processing, hot embossing, injection molding, and additive manufacturing, each offering different trade-offs in achievable feature size, geometry, materials, fabrication time, and required equipment [1]. Recent studies have also demonstrated microfluidic particle-counting systems based on optical and electrical detection approaches [3]. Low-cost implementations have been explored; for example, Xun et al. developed a microfluidic microparticle/bacteria counter using inexpensive optical components [4].
Resistive pulse sensing (RPS), based on the Coulter principle, detects particles passing through a fine pore by measuring ionic current in real time; a temporary decrease in ionic current indicates the passage of a particle. Because the reduction in ionic current depends on the size of the particle, particle size information can be obtained [5,6]. RPS can resolve particle-to-particle variation in polydisperse samples that may be obscured by ensemble light-scattering measurements [7]. RPS can also provide information on particle properties such as zeta potential [5]. The Coulter principle is a long-established approach for electrical particle counting [8,9,10], and tunable resistive pulse sensing (TRPS), in which the pore size can be adjusted by stretching an elastomeric membrane, has also been developed [11,12,13]. In microfluidic RPS, sensing performance depends strongly on the geometry and reproducibility of the narrow aperture, and practical operation can also be affected by clogging and pore-to-particle size matching. Therefore, fabrication of the sensing region remains an important consideration when developing RPS devices for different measurement targets.
Additive manufacturing provides a flexible approach for fabricating and modifying microfluidic geometries. Material-extrusion methods, including fused filament fabrication and fused deposition modeling, are widely used 3D-printing approaches [14,15,16], whereas stereolithography (SLA) forms structures by selectively curing a photosensitive resin with light [17]. However, directly printing enclosed microscale channels by SLA is challenging because uncured resin must be removed from internal voids and unintended curing can partially or completely close small channels [18]. Alternatively, 3D-printed structures can be used as molds for replicating microchannels in PDMS. Previous studies have demonstrated PDMS microfluidic-device fabrication using SLA-printed molds, including multi-depth microchannels and rapid soft-lithography approaches [19,20]. Previous studies have nevertheless demonstrated RPS devices incorporating 3D-printed components. Pollard et al. developed a tunable flow-RPS device in which separately printed base and lid components, together with a compressible PDMS gasket, formed and adjusted the sensing region [21]. Yan et al. reported a disposable 3D-printed Coulter analysis box incorporating a separately fabricated small-hole component for blood-cell counting [22]. The use of 3D-printed molds for PDMS microfluidic-device fabrication has been established in previous studies [19,20]. In the present study, we applied this established fabrication approach to an RPS sensing architecture requiring a microscale aperture. A consumer-grade SLA 3D printer was used to fabricate molds for PDMS–glass RPS microchannels with a nominal aperture cross-section of 50 × 50 µm and nominal aperture lengths of 50, 200, and 800 µm. We then evaluated whether these channels could generate detectable RPS pulse signals from 10 µm polystyrene particles and MDA-MB-231 cells. Thus, the contribution of the present study is not the introduction of PDMS replication from a 3D-printed mold itself, but its implementation and proof-of-concept evaluation for this RPS sensing geometry using a consumer-grade SLA fabrication workflow. The printed mold pattern was transferred to PDMS and bonded to a glass substrate to form the RPS microchannel. Using this approach, we evaluated whether RPS measurements could be per-formed with microchannels fabricated from consumer-grade SLA-printed molds and whether the aperture length could be readily modified for particle measurement experiments.
The fabrication architectures and reported capabilities of representative RPS devices incorporating 3D-printed components are compared with the present mold-transfer approach in Table 1. For the present workflow, the material cost of microchannel fabrication was estimated to be approximately 37 JPY per device (approximately USD 0.23 at 160 JPY/USD), based on the measured consumption of resin and PDMS and the cost of the glass substrate. The complete fabrication process typically required 2–3 days, including the curing and drying steps described in the fabrication procedure. These values represent material cost and elapsed fabrication time rather than a comprehensive manufacturing cost analysis.
Table 1.
Comparison of representative RPS devices incorporating 3D-printed components and the present RPS implementation using an established 3D-printed-mold/PDMS-replication approach.
2. Materials and Methods
2.1. Materials and Equipment
The free software “Blender“ (version 4.3.2), developed by the Blender Foundation, was used to generate 3D models. For 3D printing, a Photon Mono 4 Ultra printer (Anycubic, Shenzhen, China) was purchased and used. Sliced data for printing were created using Anycubic’s software, “AnycubicPhotonWorkshop“ (version 3.6.3), and for the photosensitive resin, Anycubic High Clear Resin was used. To perform post-curing of the printed objects, an ultraviolet A (UV-A) lamp (FPL27BLB, Sankyo Denki Co., Ltd., Kanagawa, Japan) was used. To fabricate the microchannels, SILPOT™ 184 silicone elastomer base and curing agent (Dow Toray Co., Ltd., Tokyo, Japan) were purchased. Glass slides (S1111, Matsunami Glass Ind., Ltd., Osaka, Japan) were used to bond the fabricated silicone microchannels. To hydrophilize the silicone materials and glass, a plasma cleaner (PDC-32G, Harrick Plasma, Ithaca, NY, USA) was used. To create electrodes with stable potential, reference electrode silver/silver chloride ink (BAS Inc., Tokyo, Japan) was purchased. For measuring small currents, a WEL1200 was borrowed from Advantest Corporation, Saitama R&D Center (Saitama, Japan); for post-measurement analysis, the company’s software “minaSCOUTER (version 2.03)” was also used. To deliver sample liquid into the microchannel, a ring pump (RP-HXP5S-P4A-DC3VS, Aquatech Co., Ltd., Osaka, Japan) was used and controlled by the company’s programmable controller (RE-C600). To prevent external noise, a customized test fixture (12701A, ADC Corporation, Saitama, Japan) was used to house the microcurrent measurement part for particle measurement.
The MDA-MB-231 cell line (American Type Culture Collection; ATCC, Product Code: HTB-26) was used. For cell culture reagents, RPMI-1640 (with L-glutamine and phenol red), D(+)-glucose, and sodium pyruvate were purchased from FUJIFILM Wako Pure Chemical Corporation, Osaka, Japan; HEPES (2-[4-(2-hydroxyethyl)-1-piperazinyl]ethanesulfonic Acid) from DOJINDO Laboratories, Kumamoto, Japan; penicillin–streptomycin–neomycin solution from Sigma-Aldrich, St Louis, MO, USA; and fetal bovine serum (FBS) from Japan Bioserum Co., Ltd., Hiroshima, Japan. Additionally, to detach cultured cells from culture dishes, 0.25 w/v% Trypsin-1 mmol L−1 EDTA·4Na solution (with phenol red) was purchased from FUJIFILM Wako Pure Chemical Corporation, Osaka, Japan. A 20 µm filter (Filcon S Cup Type, AS ONE Corporation, Osaka, Japan) was purchased and used to prevent the aperture from being clogged by cell aggregates during particle measurement. To measure the concentration of cells in the dispersion, a TC20 automated cell counter (Bio-Rad Laboratories, Inc., Hercules, CA, USA) was used. Finally, monodisperse polystyrene particles with a diameter of 10 μm (Polybead® Microspheres, Polysciences, Inc., Warrington, PA, USA) were used for particle measurement. The original concentration of the commercial polystyrene standard-particle suspension was 4.73 × 10⁷ particles mL−1. The suspension was diluted with PBS to prepare the concentrations used for RPS measurement. No surfactant was added.
2.2. Fabrication of Microchannels
After the 3D model was created in Blender, the model was converted and exported as an .stl file. Because SLA builds objects layer by layer from the platform, sliced data that divides the 3D model into individual layers is required. Therefore, the .stl file was imported into Photon Workshop version 3.6.3 and converted from a 3D model into a file for 3D printing (i.e., sliced data). High Clear Resin (Anycubic) was used for printing. The layer thickness was 50 µm, the normal exposure time was 6 s per layer, and the bottom exposure time was 50 s for five layers. The printed object had uncured resin adhered to its surface and was not fully cured inside. Therefore, it was cleaned with 2-propanol and subjected to additional UV-A irradiation for 2 h for post-curing.
To create the mold, addition-curing-type polydimethylsiloxane (PDMS), SILPOT™, was prepared by mixing the base and curing agent at a 10:1 ratio in accordance with the manufacturer’s instructions. Before being poured into the printed mold, the mixed PDMS was placed in a desiccator and degassed under reduced pressure using a diaphragm pump until visible bubbles disappeared. The degassed PDMS was then poured into the printed mold and heated at 100 °C for 2 h to achieve complete curing. Residual uncured resin was carefully removed during washing and post-processing before PDMS replication to minimize interference with PDMS curing. Slight warping of the resin mold could occur after heating at 100 °C; however, the PDMS replica was subsequently peeled from the mold and bonded to a glass substrate, and such warping did not prevent microchannel fabrication by the present procedure. The mold was not reusable because its walls were broken during removal of the cured PDMS to allow the replicated channel structure to be carefully peeled from the mold surface. Before bonding, the PDMS replica and glass substrate were plasma-treated using the HI setting for 1 min. The hydrophilized PDMS sheet was then bonded to the glass slide, resulting in the formation of the microchannel.
2.3. Preparation of Cell Samples
The culture medium was prepared using RPMI-1640 as the base, supplemented with 2.5 g L−1 D(+)-glucose, 10 mM HEPES, 1 mM sodium pyruvate, 10% FBS, and penicillin–streptomycin–neomycin at concentrations of 100 units mL−1, 100 µg mL−1, and 200 µg mL−1, respectively. MDA-MB-231 cells were cultured in this medium, and cell detachment was carried out using a 0.25 w/v% trypsin–1 mmol L−1 EDTA·4Na solution. The harvested cells were dispersed in phosphate-buffered saline (PBS) and the cell suspension was passed through a 20 µm filter to remove cell aggregates, after which the concentration of the filtered suspension was measured using a TC20 automated cell counter. The post-filtration suspension was then appropriately diluted with PBS to prepare the cell concentrations used for RPS measurement. Individual cell diameters and the cell-size distribution were not retained in the experimental record; therefore, a measured size distribution cannot be reported for the MDA-MB-231 cells used in the present experiments. For reference, Ren et al. reported the size distribution of MDA-MB-231 cells and demonstrated their deformation during passage through microscale constriction channels [23].
2.4. Particle Measurement
A platinum wire (ϕ500 µm) was cut into 10 mm pieces for use as electrodes, and the tips of these electrodes were coated with silver/silver chloride ink for stabilization of electrode potential, then heated and dried at 80 °C for 2 h. The resulting electrodes were inserted into the electrode holes of the fabricated microchannel. To prevent the PDMS sheet from peeling off the glass slide and to secure the electrode in place, SILPOT™ was applied to the contact area and heated.
A chamber for the sample solution was set up at the inlet of the channel, and a pump was connected to the opposite side. For the particle samples, either 10 µm polystyrene beads or cultured cells (MDA-MB-231) dispersed in PBS were used. The samples were placed in the chamber, and measurements were carried out for approximately 2 min per sample using a nominal pump-controller setting of 20 µL min−1 for the cell measurements. The same nominal setting was used for particle measurements with aperture lengths of 50 and 200 µm. A nominal setting of 50 µL min−1 was used only for particle measurements with the 800 µm aperture-length channel because its higher hydraulic resistance made liquid transport through the channel more difficult. These settings were not independently verified using a flow meter and therefore should not be interpreted as calibrated volumetric flow rates through the aperture. For each nominal cell concentration, three measurement runs were analyzed. At 9.46 × 10² cells mL−1, all three runs used the same channel with refresh steps between runs. At 4.73 × 10³ cells mL−1, three runs used a replacement channel because the preceding channel had become unusable. At 9.46 × 10³ cells mL−1, one run used that channel, after which the channel became unusable, and the remaining two runs used another replacement channel. Thus, n = 3 denotes measurement runs rather than three independent devices or biological replicates. Between successive measurements, PBS without particles or cells was passed through the channel as a washing step, and the absence of detectable pulse events was confirmed before the subsequent measurement. These PBS-only intervals were not retained as independent blank datasets. The applied voltage was 0.4 V. Electrical signals were acquired at a sampling rate setting of 250 ksps and analyzed using minaSCOUTER. The amplifier bandwidth of the WEL1200 measurement system was 100 kHz. A pulse-detection threshold of 0.8 nA was used to distinguish particle-derived current-pulse events from background electrical fluctuations. Pulse width was obtained from each detected current pulse by minaSCOUTER and was defined as the full width at half maximum (FWHM) of the pulse. The internal filtering bandwidth was not a user-configurable parameter available to the authors. An overview of this analysis is shown in the Supplementary Materials.
3. Results and Discussion
3.1. Performance of Microchannel Fabrication Using a 3D Printer
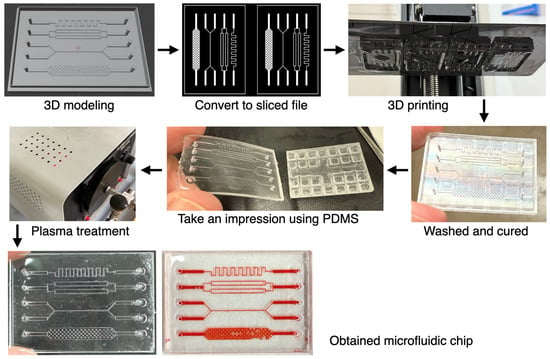
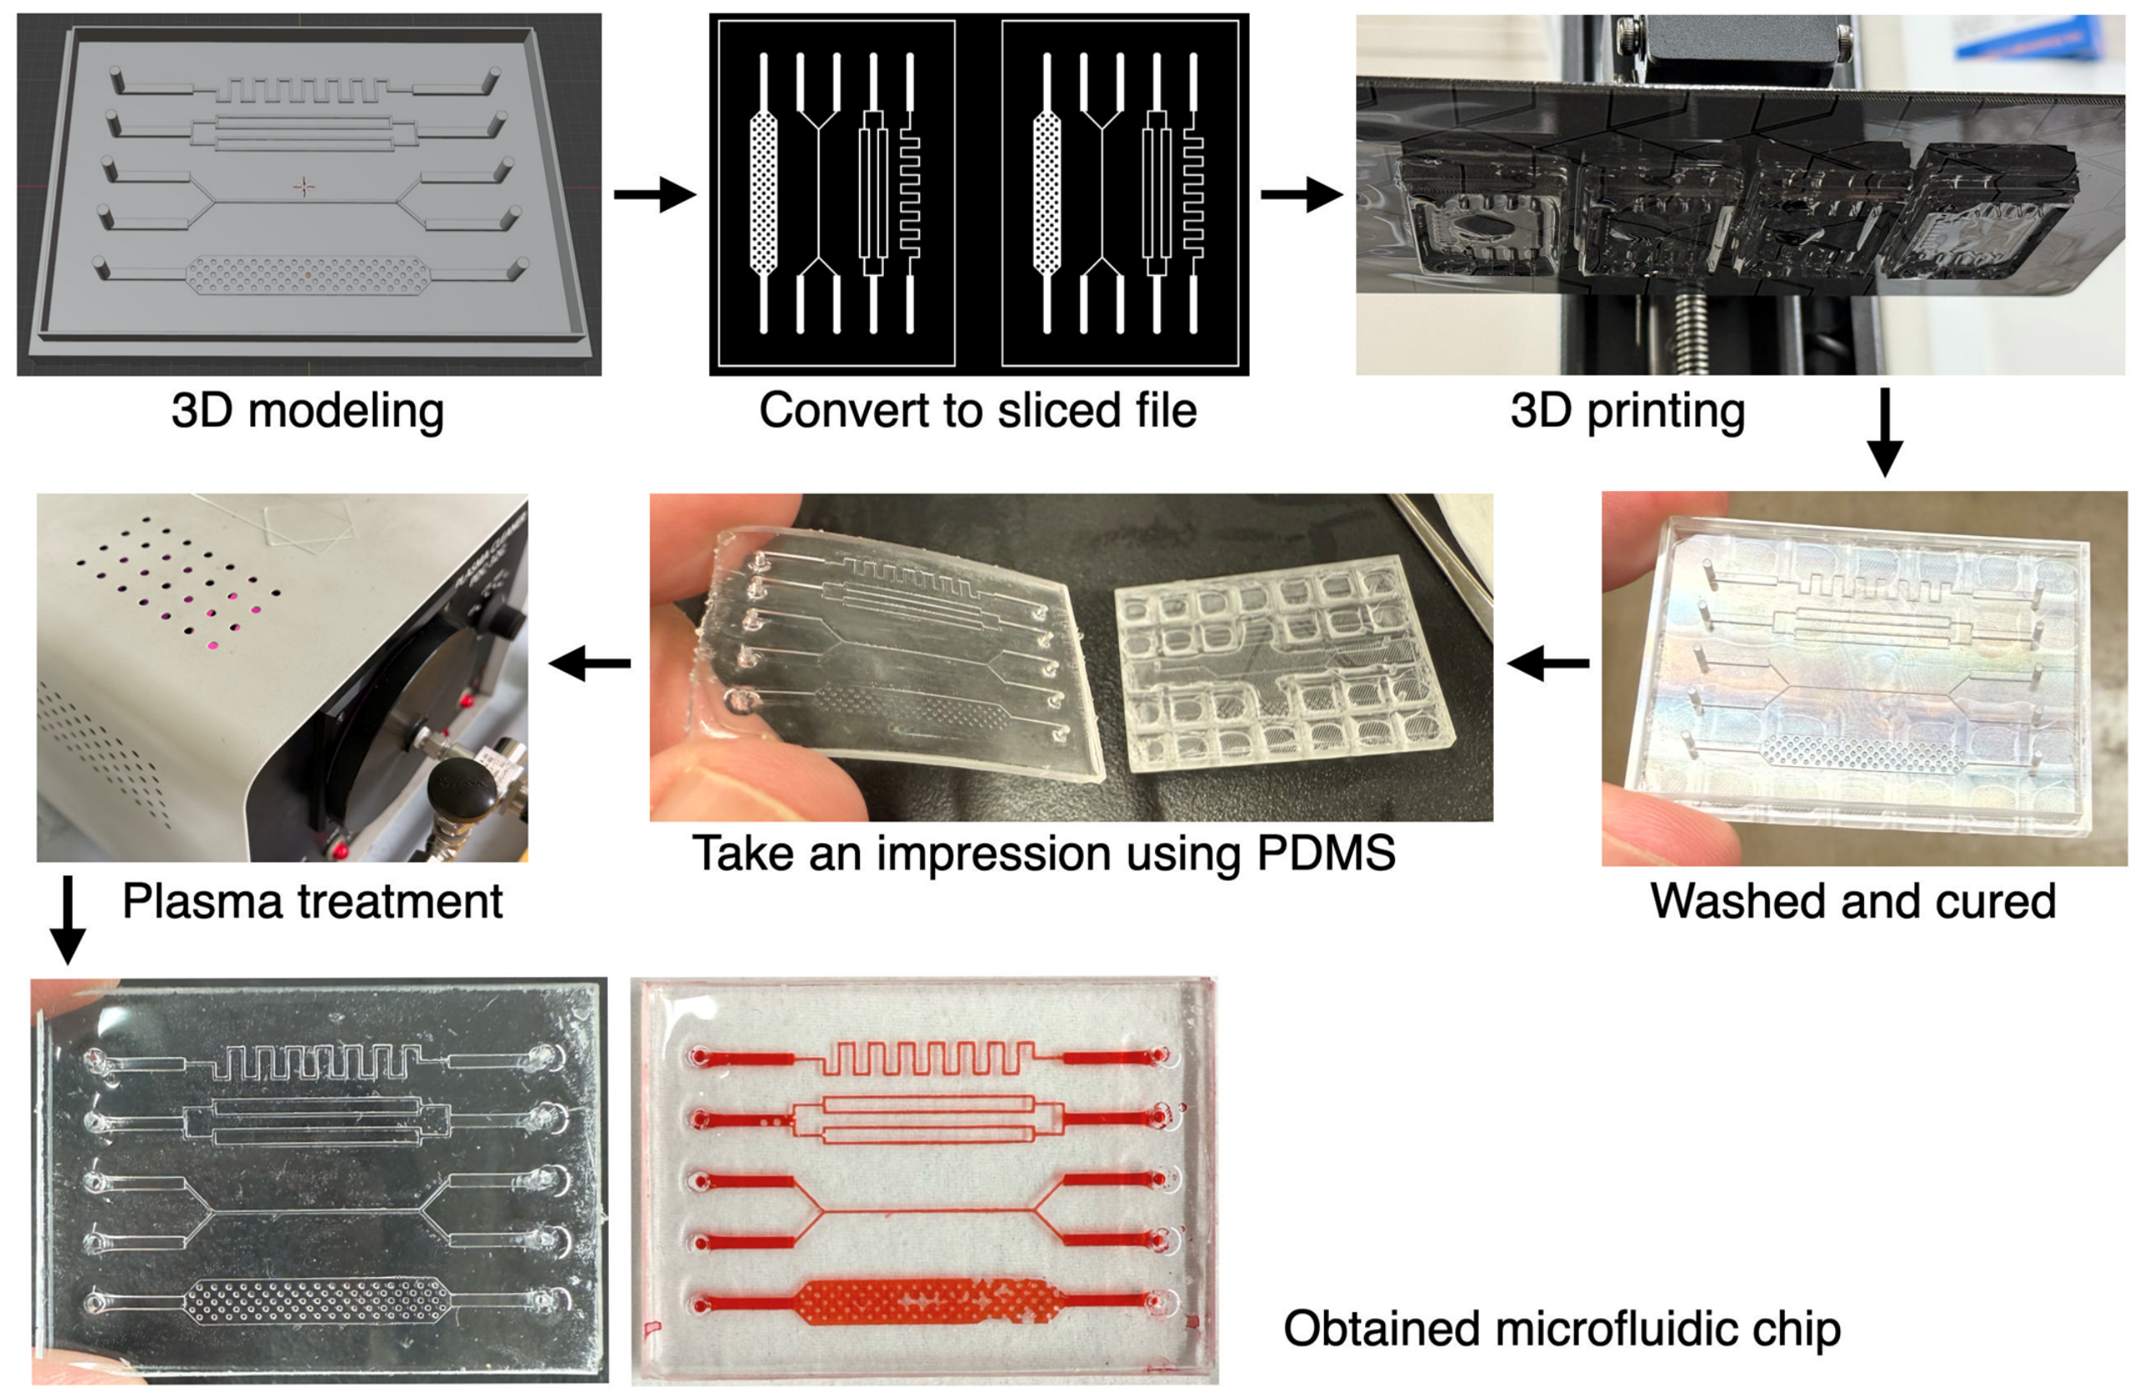
Figure 1 shows the overall process of fabricating microchannels using a 3D printer. While SLAs allow for high-resolution 3D printing, directly creating microchannels from photopolymer resin presents challenges—such as unintended curing of the channel areas due to UV light leakage—making it extremely difficult to form narrow and complex shapes. Therefore, in this study, microchannels were fabricated by transferring the pattern to PDMS. Specifically, a negative mold of the desired microchannel was created with a 3D printer. As shown in Figure 1, the pattern could be accurately transferred to PDMS, enabling the fabrication of microchannels with complex shapes such as zigzags, branches, and pillar structures. This method is similar to the approach where patterns made on a silicon substrate by photolithography or electron beam lithography are transferred to PDMS to fabricate microchannels. Although the precision of 3D-printed microchannels is inferior to that of those made using silicon substrates, the present approach avoids the specialized fabrication equipment generally required for conventional silicon-based microfabrication. An additional advantage is the ability to quickly design, print, and fabricate the channels.
Figure 1.
Overview of microchannel fabrication using a 3D printer. First, a reverse model of the desired microchannel is created. This model is then converted into a slice file for 3D printing and printed. The resulting printed object is cleaned and post-cured to remove any unreacted materials. Next, a mold is made using PDMS, and after plasma treatment, the microchannel is obtained by bonding it to a glass substrate. Red-colored liquid was manually introduced using a micropipette solely to visualize the replicated channel patterns. The bubbles visible in these images were introduced during this visualization procedure; these images were not obtained during electrical RPS measurements.
3.2. Fabrication of Microchannels for Particle Measurement
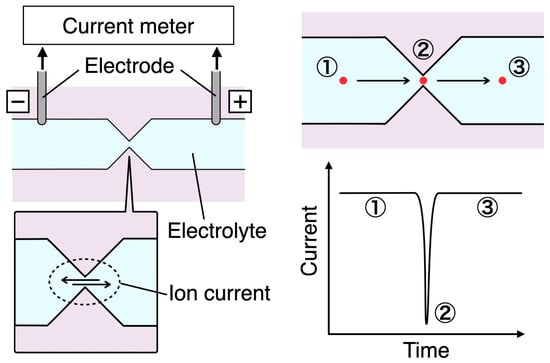
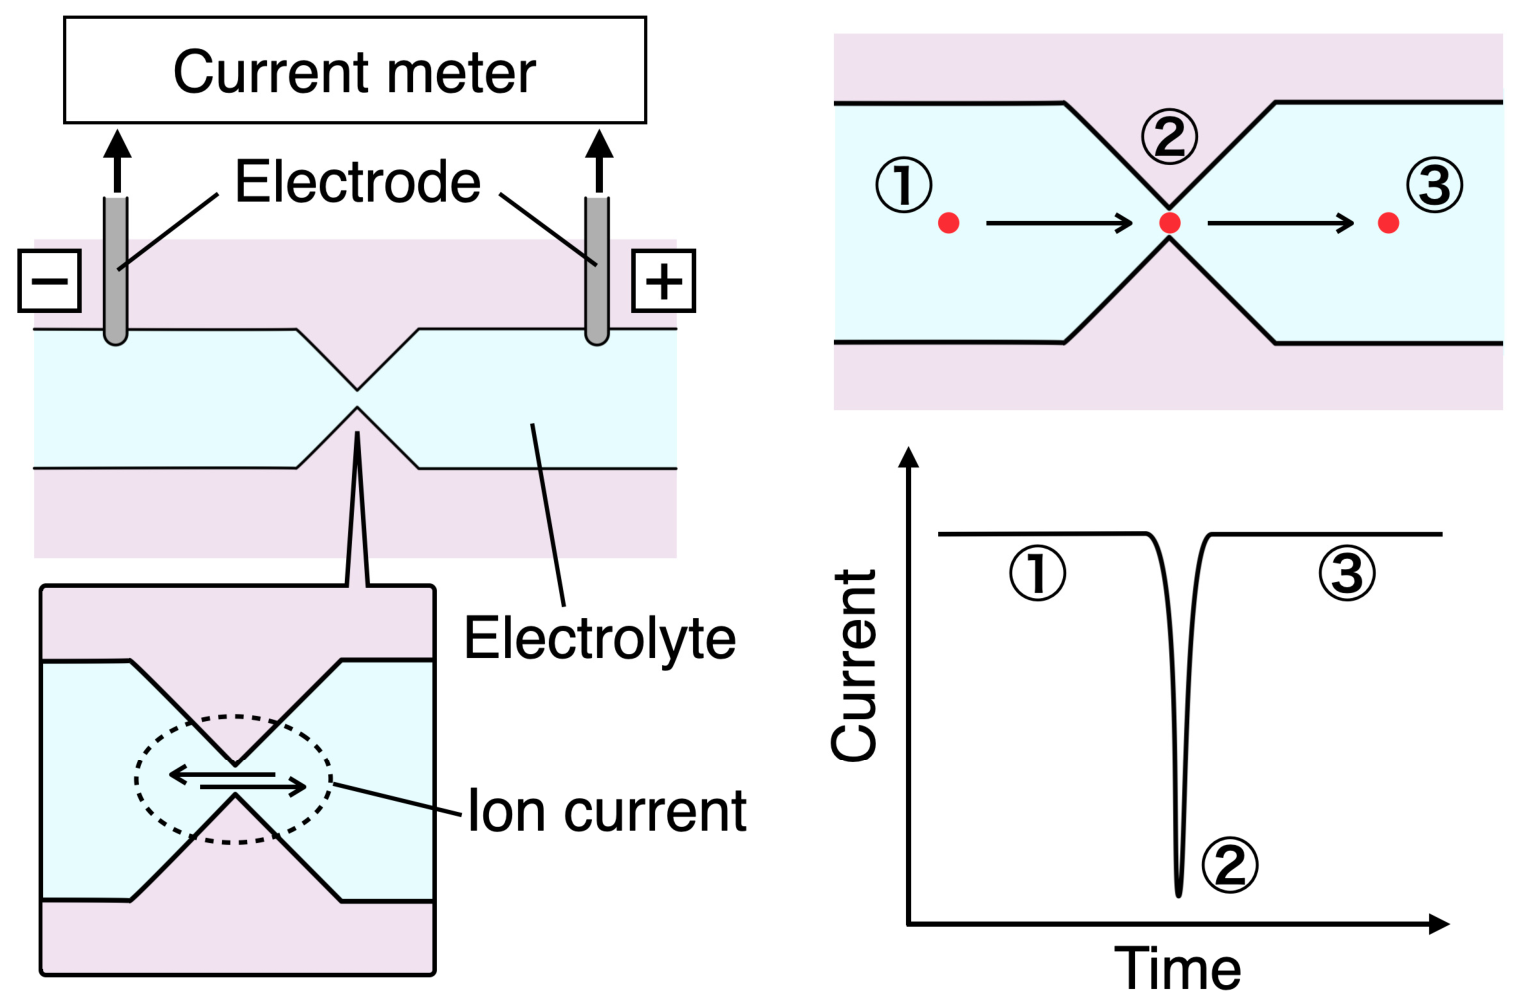
Figure 2 shows a schematic diagram of the RPS. When fabricating microchannels for particle measurement using a 3D printer, creating a highly constricted section (aperture) in the channel is necessary for particle detection. Electrodes are placed at both ends of the aperture, and the passage of particles through the aperture can be observed as a drop in ionic current, because the particles block the current as they pass through.
Figure 2.
A schematic illustration of the RPS mechanism. An aperture is placed in the center of the channel, with electrodes positioned on both sides. When the channel is filled with an electrolyte solution and a voltage is applied, the resulting ionic current is measured. As a particle passes through the aperture, the current temporarily decreases and is recorded as a pulse. As a result, the number of particles that have passed through can be determined. The red dot represents a particle, the arrows indicate its direction of movement, and ①–③ correspond to the particle positions and the associated current levels before, during, and after passage through the aperture, respectively.
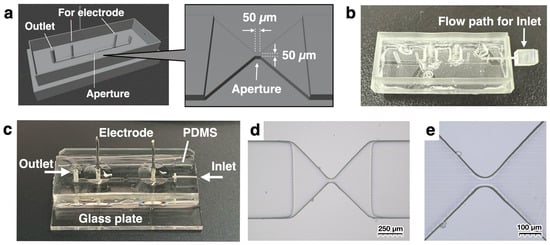
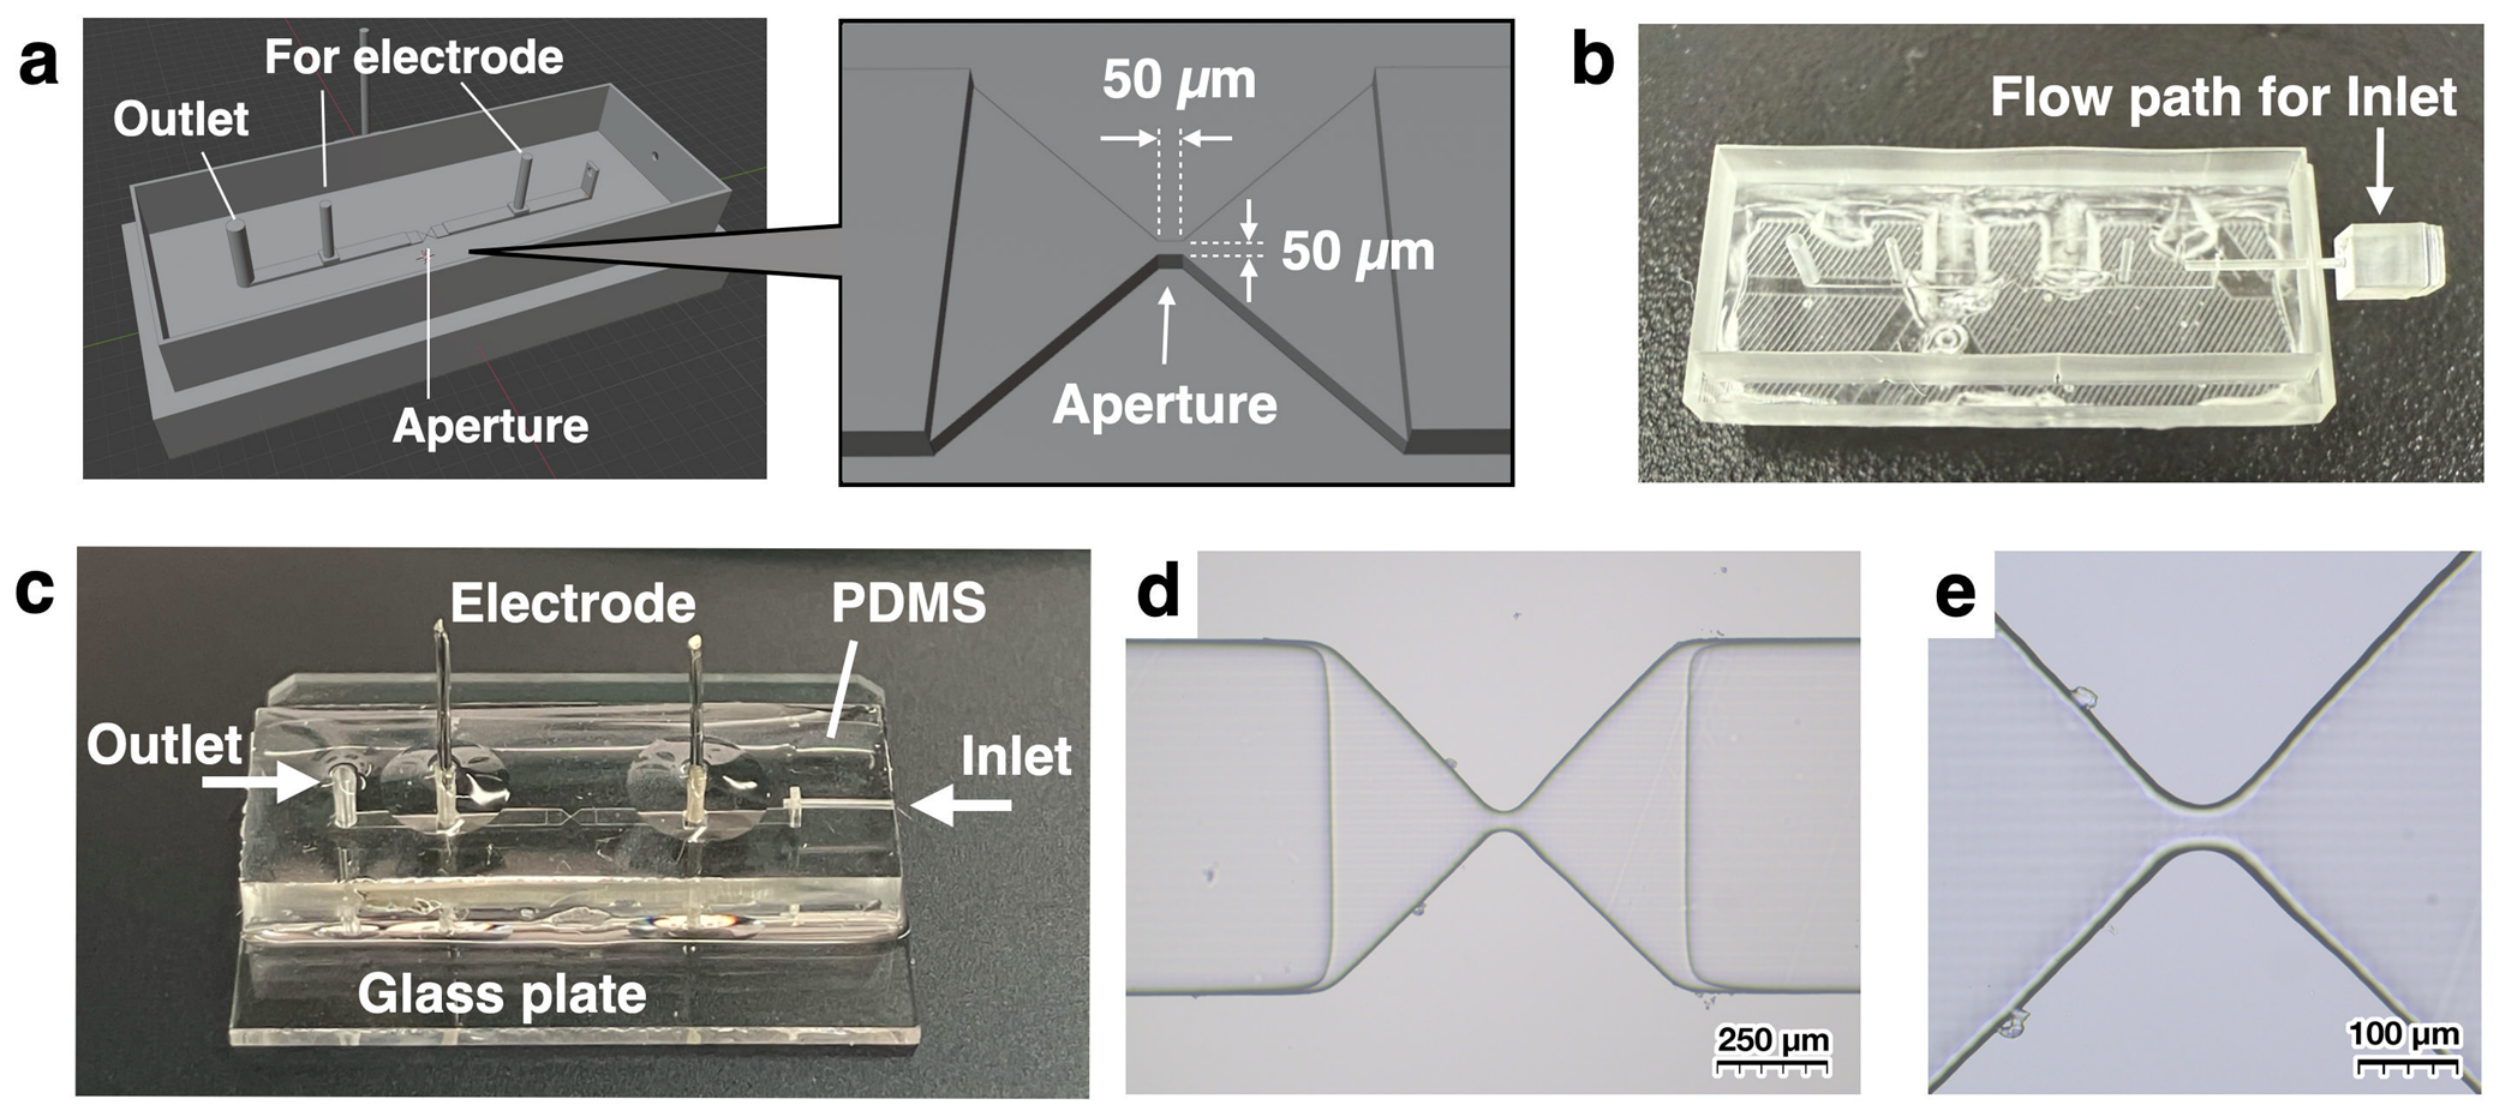
The 3D model created based on the above mechanism is shown in Figure 3a. The design includes a flow channel for liquid and openings for inserting two electrodes, with a central aperture measuring 50 µm on each side. The nominal aperture cross-section was set to 50 × 50 µm based on a practical trade-off between RPS signal detection, particle/cell passage, and fabrication feasibility. A substantially larger aperture was expected to reduce the relative ionic-current change generated by particle passage, whereas a smaller aperture would increase the risk of clogging and would be more difficult to fabricate reproducibly using the present consumer-grade SLA mold-fabrication process. As will be described later, this channel is used in an upright position, with a sample chamber directly connected to the channel. As shown in Figure 3b, pins printed with a 3D printer are inserted to construct the flow path for introducing the sample. This assembly was then used as a mold to transfer the pattern to PDMS, which, after hydrophilization by vacuum plasma, was bonded to a glass slide, as illustrated in Figure 3c. To enhance adhesion, PDMS was applied to the edges after bonding and cured. PDMS was also applied and cured at the electrode insertion points to prevent the inserted electrodes from coming out. Figure 3d,e show microscope images of the aperture section. These images confirm that an aperture with an opening of approximately 50 µm was successfully fabricated, in turn confirming that a commercially available, inexpensive 3D printer not originally intended for microchannel fabrication can be used to create particle measurement channels like those shown in Figure 3.
Figure 3.
Fabrication of microchannels for particle measurement using a 3D printer. (a) An aperture measuring 50 µm on each side was created at the center of the channel, and electrode ports were installed on both sides. Additionally, an outlet was added to drain liquid from the channel. (b) To use the channel vertically during particle measurement, the inlet was also positioned with the same orientation as the channel. In this case, because the direction for removing the molded PDMS differs, a separate pin was made to form the channel opening. This pin was inserted while pouring and curing the PDMS. After curing, the pin was withdrawn and the PDMS was removed from the mold, resulting in the channel. (c) The channel obtained in (b) was bonded to a glass substrate, electrodes were inserted, and the assembly was sealed with PDMS. (d,e) Microscope images of the aperture region of the fabricated microchannel. Additional dimensions of the 3D-printed mold, including the electrode-hole geometry and electrode spacing, are provided in Figure S6 in the Supplementary Materials.
3.3. Particle Measurement Using the Fabricated Microchannels
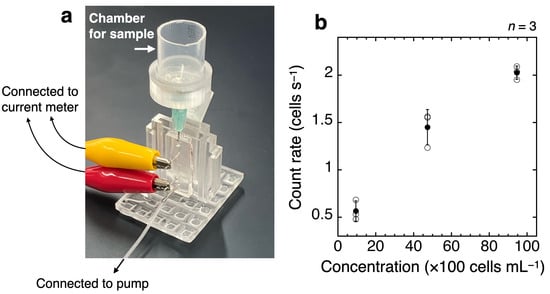
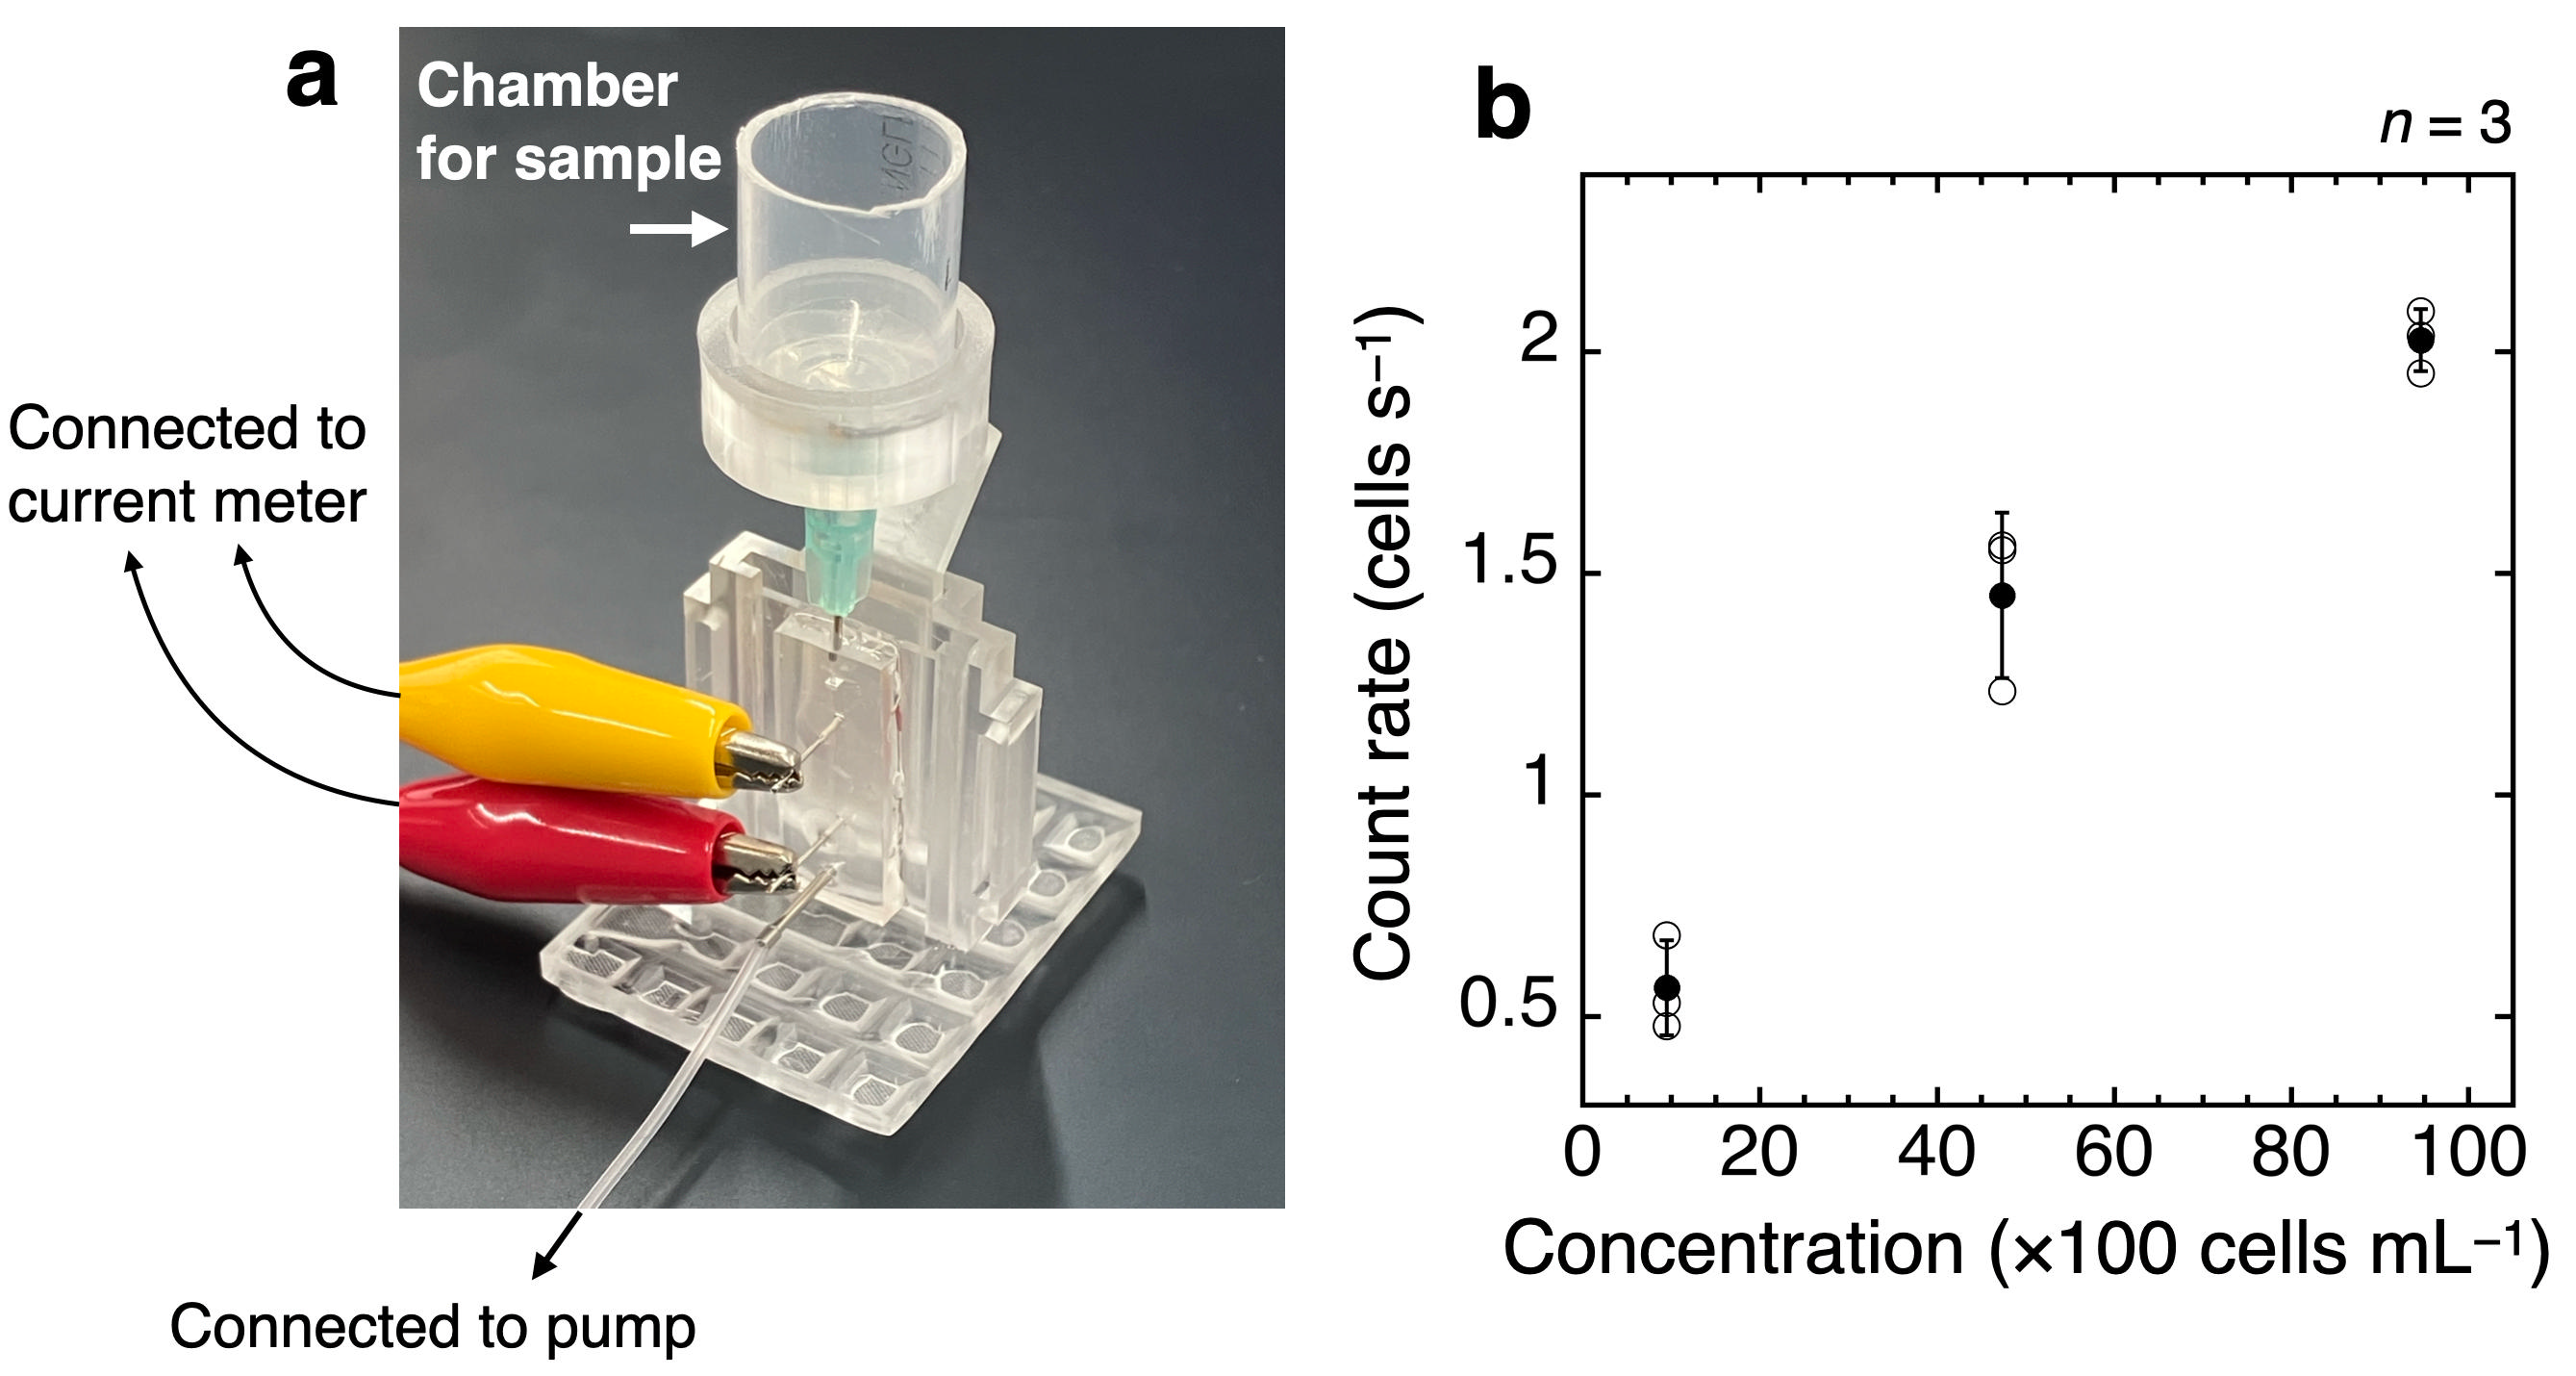
Figure 4a illustrates the method for actually measuring particles using the microchannels introduced in the previous section. An important point is to set the fabricated channel in a vertical position. Because the 50 µm square aperture has relatively high hydraulic resistance, liquid transport through the channel becomes more difficult. In this situation, microscale particles, which are several tens of micrometers in size, naturally settle and accumulate in the channel, meaning that the particles are not transported by the flow of liquid. Therefore, it is not possible to measure microparticles with the channel in a horizontal orientation. In this study, the channel was positioned vertically to prevent particles from accumulating. As a result, the inlet was designed as shown in Figure 3c. A syringe needle was inserted directly into the inlet so that the sample liquid from the chamber could quickly enter the channel. The jig for standing the channel upright and the holder for supporting the chamber were also fabricated using a 3D printer. A pump was connected to the lower outlet and used to draw the liquid by suction. The electrodes were connected to an ammeter using alligator clips. The results of measuring cultured cells with this measurement device are shown in Figure 4b. The observed counting rate tended to increase across the three tested cell concentrations; however, these measurements were not designed to establish a quantitative calibration relationship. Loss of channel functionality occurred during repeated cell measurements and sometimes required channel replacement. Possible causes include clogging, leakage, or other device-related failure; however, the specific cause of each failure could not be identified retrospectively from the available experimental records. Therefore, the present data do not allow the frequency or concentration dependence of channel clogging to be quantified.
Figure 4.
(a) Setup image of the particle measurement section. The microchannel was fixed vertically, and a cut syringe with a needle was used as the sample chamber, which was directly inserted and connected to the microchannel inlet. On the outlet side, the channel was connected to a pump to draw the sample liquid. The electrodes were connected to an ammeter to measure the ionic current. (b) Results of cell measurement. Samples containing 9.46 × 10², 4.73 × 10³, and 9.46 × 10³ cells mL−1 were prepared, and their corresponding counting rates were graphed. Open circles represent the individual measurement runs, and filled circles represent the mean of the three runs at each concentration. Error bars represent the sample standard deviation of three measurement runs at each concentration (n = 3), calculated using STDEV.S. Because the nominal pump-controller setting was not independently verified as the volumetric flow rate through the aperture, quantitative counting efficiency could not be calculated from the available data.
The cell experiment was conducted to confirm that cells passing through the fabricated channel generated detectable pulse events. It was not designed to establish counting efficiency, analytical sensitivity, a detection limit, or quantitative concentration accuracy. Although post-filtration cell concentrations were measured using the TC20 automated cell counter, the actual volumetric flow through the aperture was not independently measured, and quantitative counting efficiency could therefore not be calculated from the available data. The nominal pump-controller setting does not necessarily equal the actual volumetric flow through the vertical channel because the flow may also be affected by the assembled fluidic configuration, including hydraulic resistance and pressure differences such as hydrostatic head. For example, the observed count rate of approximately 0.55 cells s−1 at 9.46 × 10² cells mL−1 was not quantitatively consistent with the value expected when the nominal pump-controller setting of 20 µL min−1 was treated as the actual volumetric flow. Accordingly, the nominal pump-controller setting should not be used to infer quantitative counting efficiency in the present experiments. In addition, the limited number of detected events at the lowest tested concentration introduces substantial counting uncertainty. Therefore, the present results should be interpreted as a proof-of-concept demonstration of cell-derived pulse detection under the tested conditions rather than as a quantitative calibration or validation of low-concentration counting performance.
3.4. Advantages of Fabricating Particle Measurement Channels Using a 3D Printer
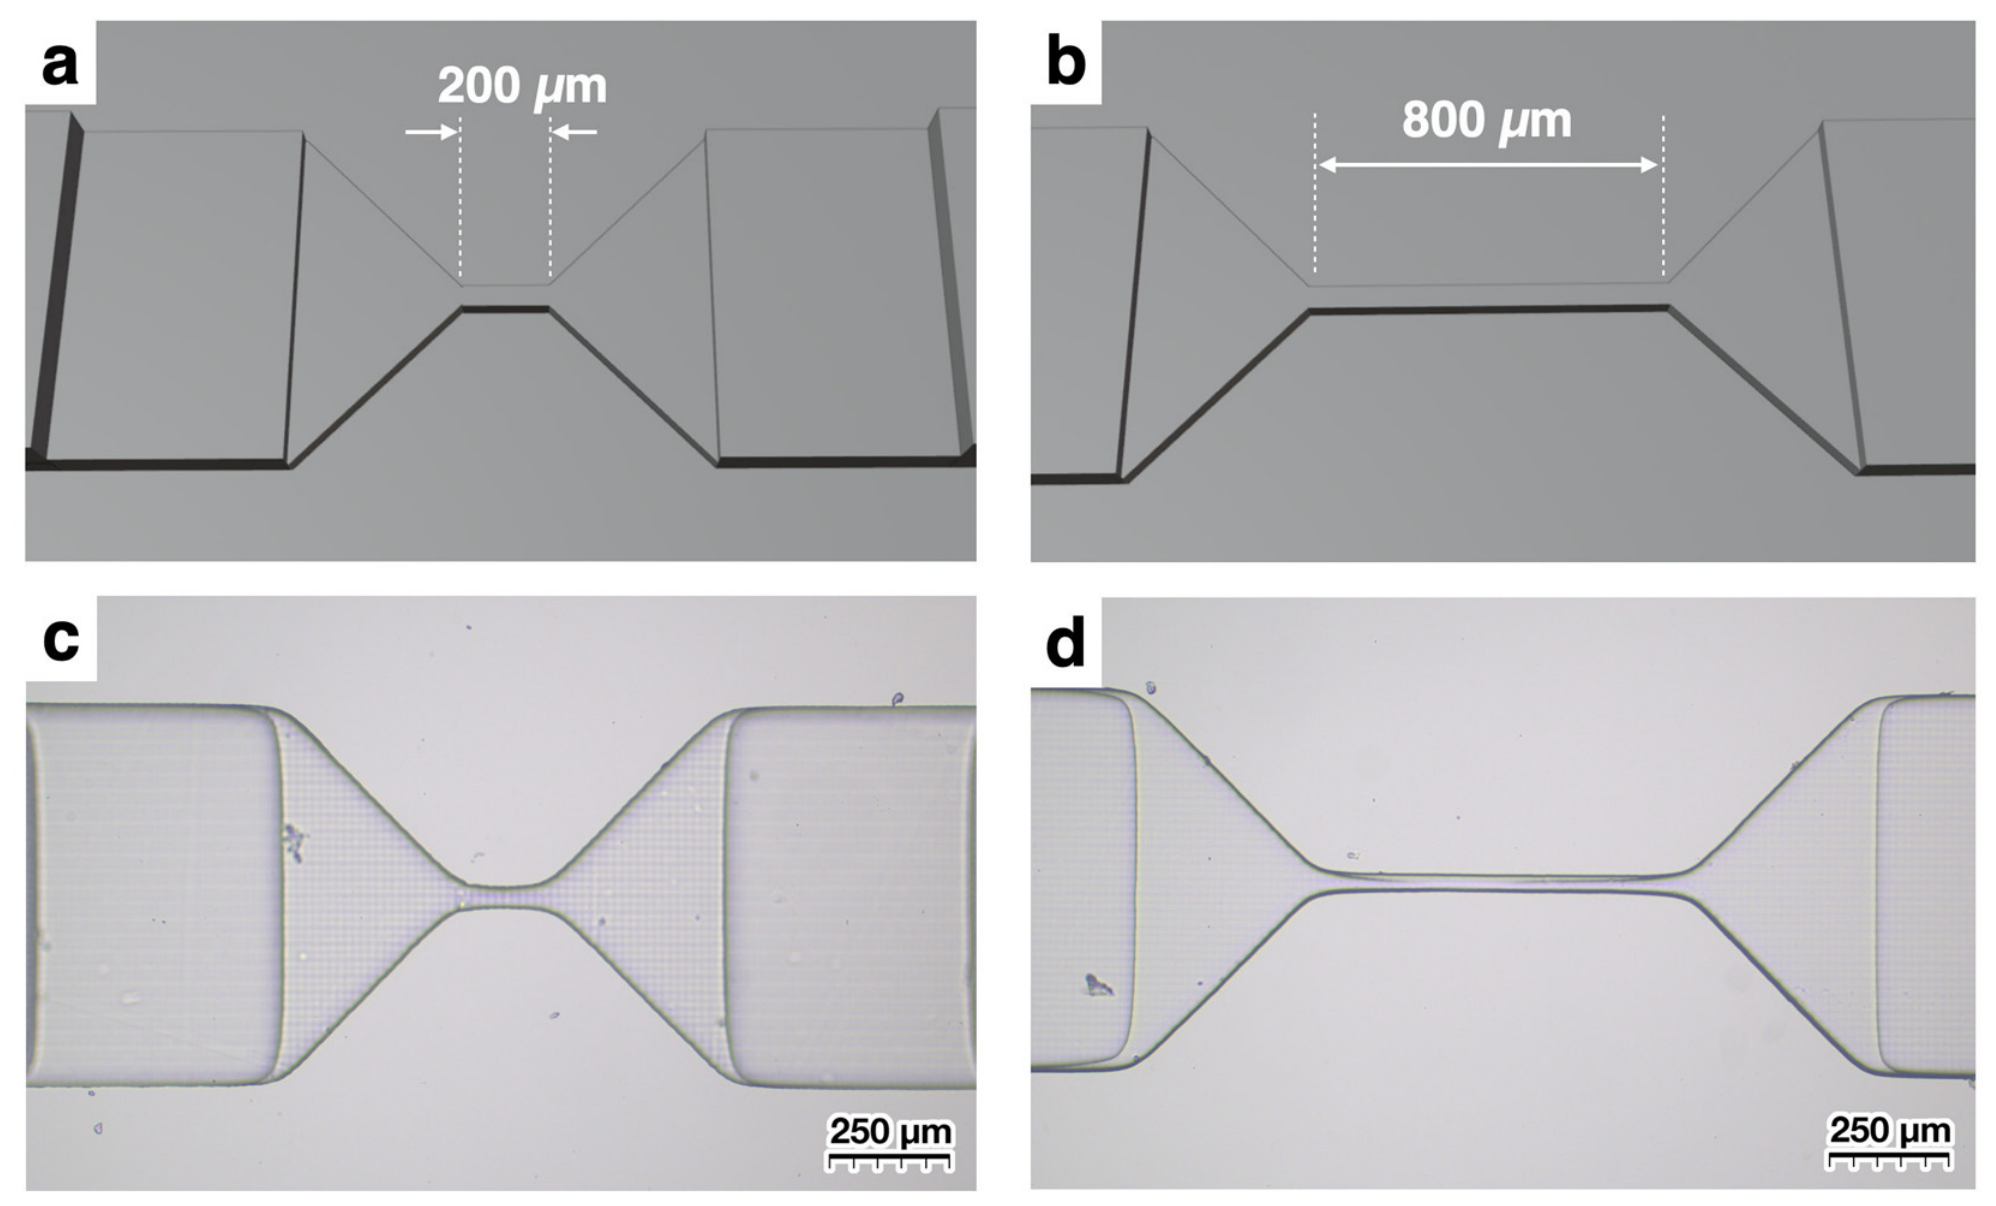
As shown in Figure 4, the channels fabricated using 3D-printed molds generated detectable pulse signals from cells under the tested conditions. One advantage of creating channels with a 3D printer, as opposed to processing silicon substrates, is that no specialized equipment for semiconductor manufacturing is required. This reduces reliance on specialized semiconductor-processing equipment. Another significant benefit is the ability to design and immediately test new channels. For example, in this study, we fabricated channels with different nominal aperture lengths to compare the pulse-width distributions obtained under their respective measurement conditions. While the aperture length was 50 µm in Figure 3, we designed channels with aperture lengths of 200 µm and 800 µm. The aperture length was increased fourfold from 50 to 200 µm and then fourfold again to 800 µm because a small change in aperture length was not expected to produce a sufficiently clear difference in the detected pulse width (FWHM). These lengths were therefore selected to provide sufficiently separated geometries for comparison rather than as analytically optimized dimensions. As a result, we were able to obtain channels that were generally fabricated as designed. Thus, the present approach provides a practical means of fabricating small quantities of microchannels with different geometries.
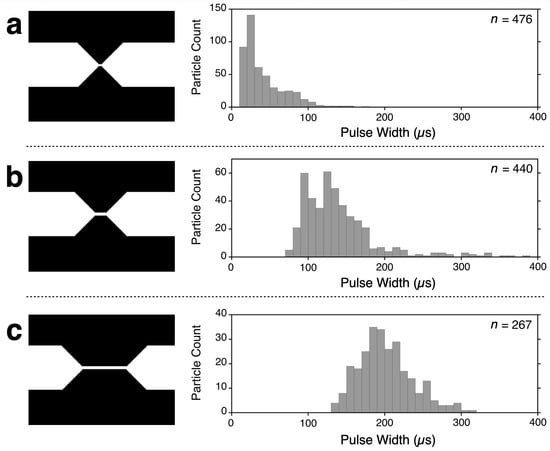
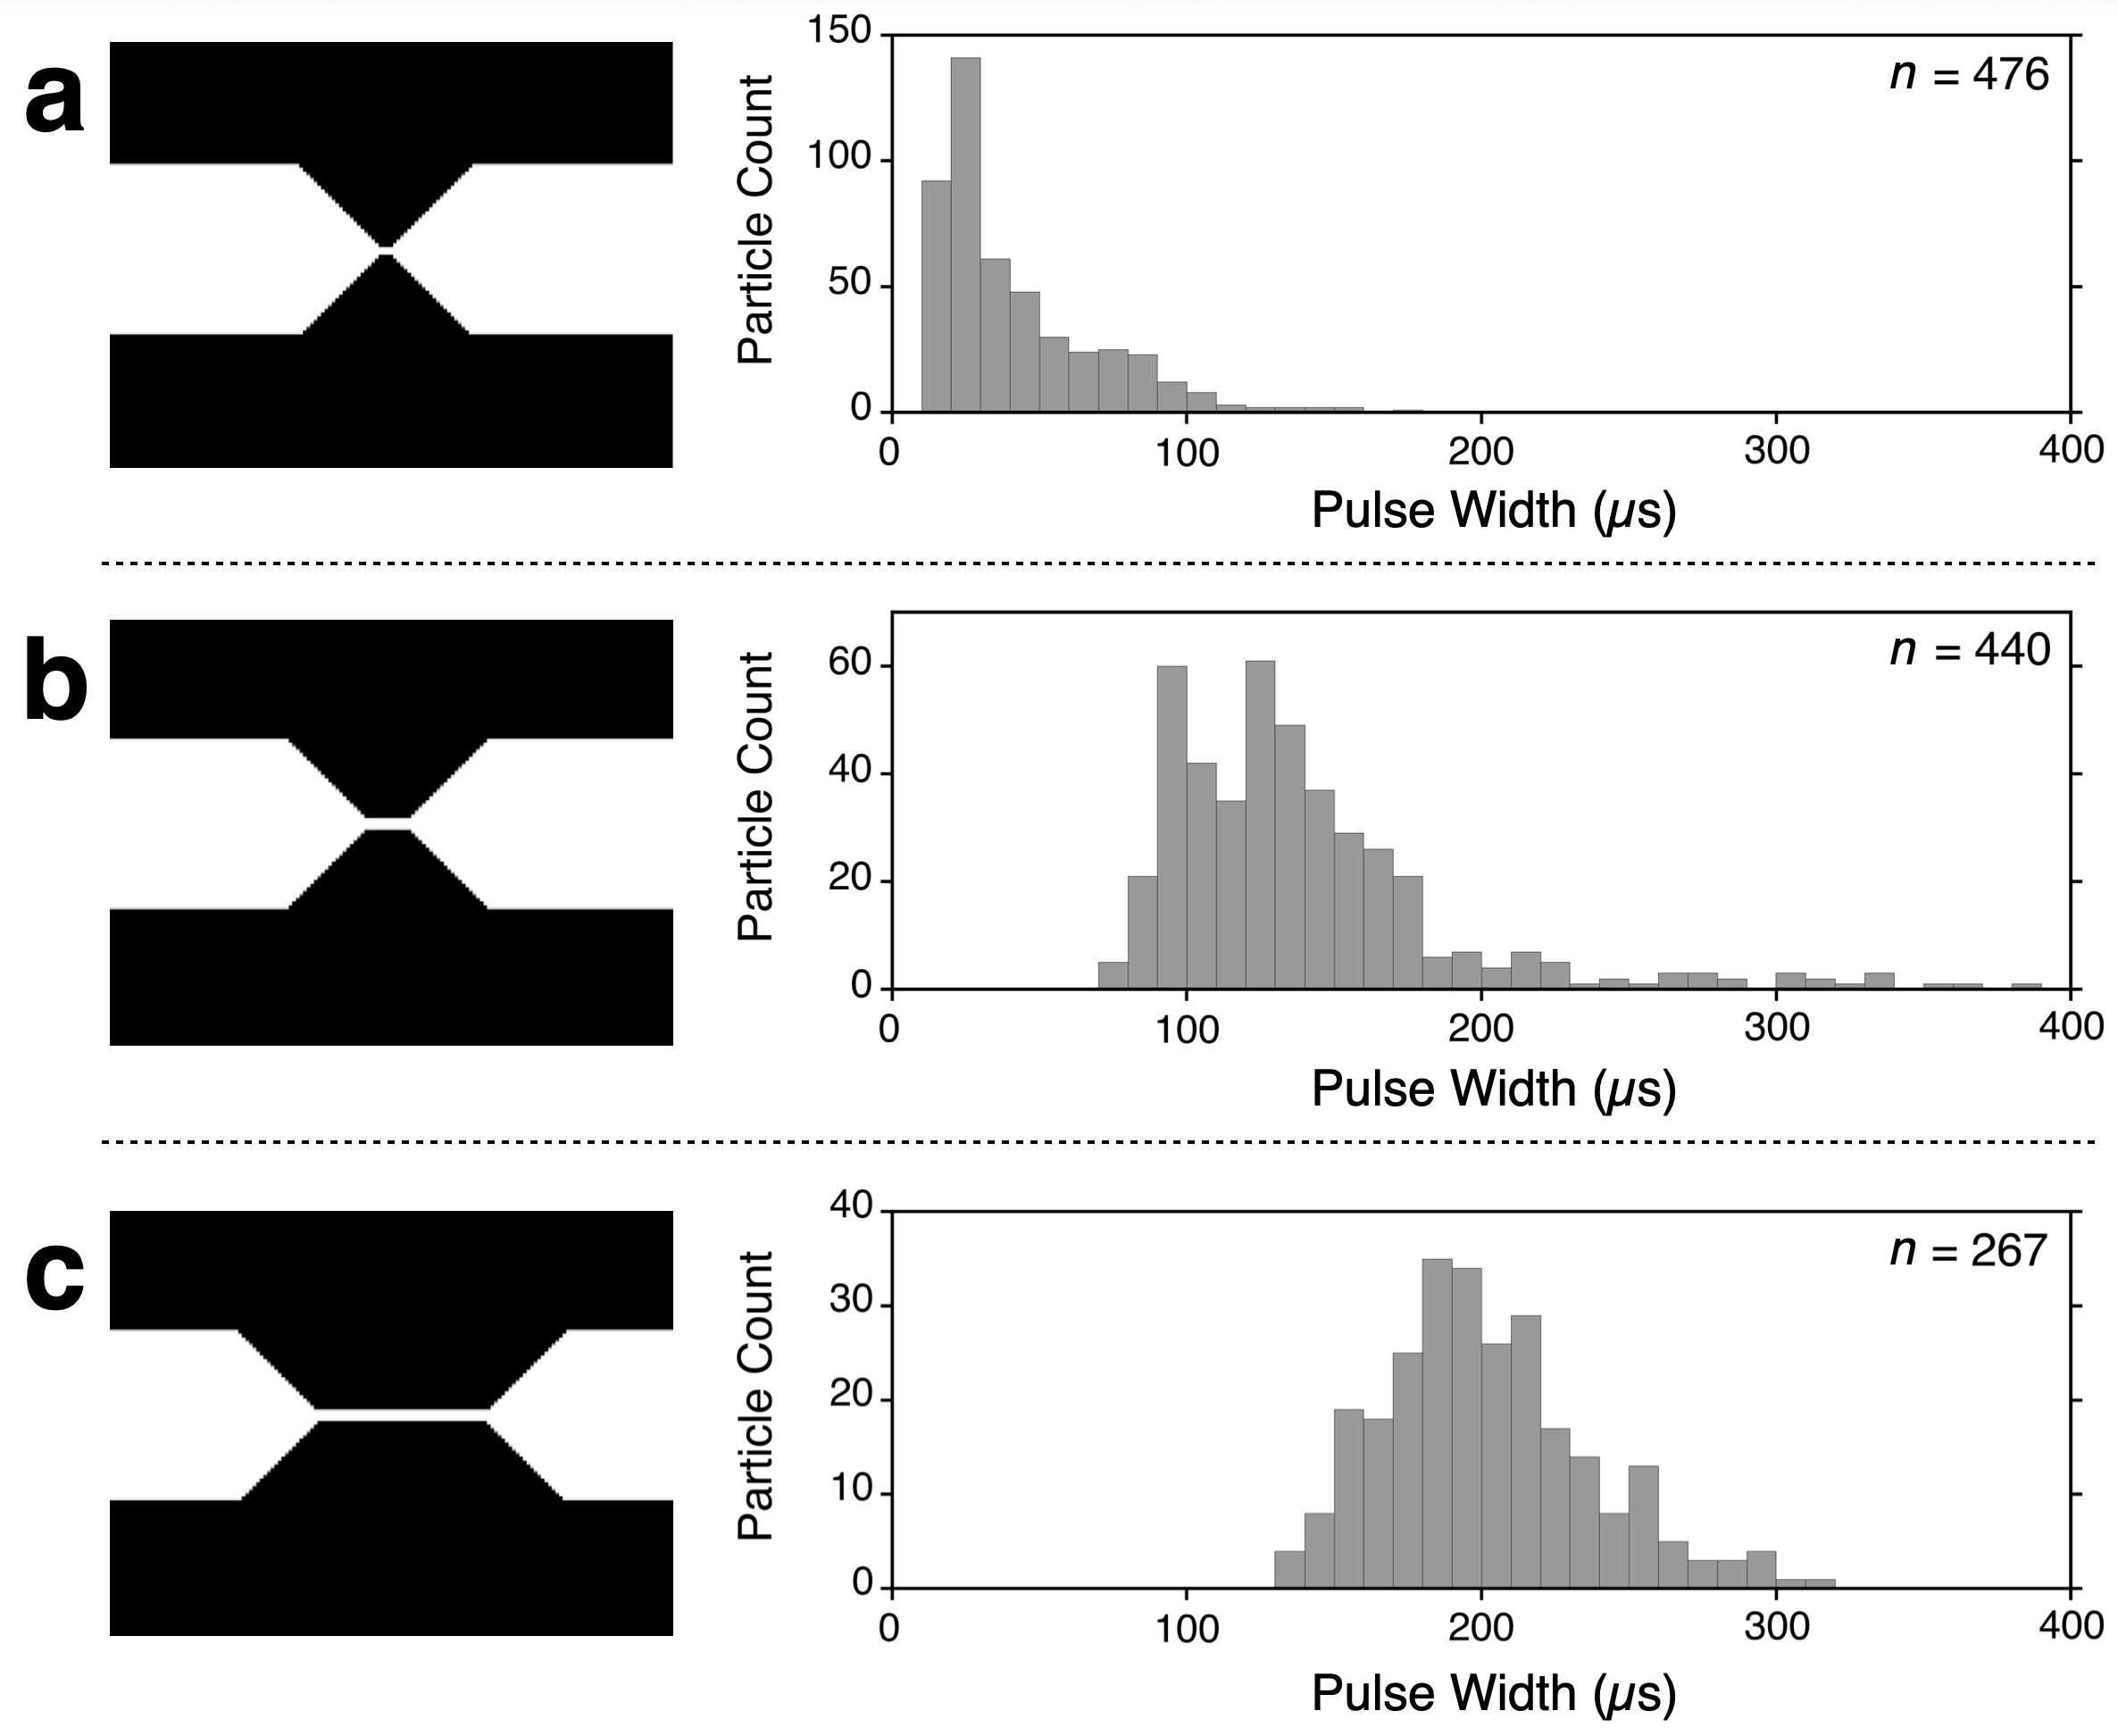
Figure 5 shows the results of measuring 10 µm polystyrene particles using the three types of channels depicted in Figure 3 and Figure 6. For the nominal 50 µm aperture-length channel, the pulse width determined by minaSCOUTER was approximately 20–30 µs (Figure 5a). For the nominal 200 µm aperture-length channel, the pulse-width distribution shifted to approximately 100–150 µs (Figure 5b). Longer pulse widths were observed for the nominal 800 µm aperture-length channel (Figure 5c). These values represent pulse widths determined by minaSCOUTER from the detected electrical signals and should not be interpreted as calibrated physical transit times through the full nominal aperture length. It should be noted that measurements in (a) and (b) were performed at a nominal pump-controller setting of 20 µL min−1, whereas in (c) the nominal pump-controller setting was 50 µL min−1. This is because increasing the aperture length increases hydraulic resistance, making it difficult to measure particles using the 20 µL min−1 setting. The 50 µL min−1 setting was therefore used only for the 800 µm aperture-length channel. These values represent settings on the pump equipment and were not independently verified using a flow meter; therefore, they should not be interpreted as calibrated volumetric flow rates through the aperture. Because the 800 µm aperture-length channel was measured using a different nominal pump-controller setting, the comparison among the three channels does not isolate aperture length as the sole factor affecting the pulse-width distributions.
Figure 5.
Histograms of pulse widths for 10 µm polystyrene particles measured using channels with aperture lengths of (a) 50 µm, (b) 200 µm, and (c) 800 µm, as shown in Figure 3 and Figure 6. Pulse width represents the FWHM determined from each detected current pulse by minaSCOUTER and should not be interpreted as a calibrated physical transit time through the full nominal aperture length. Measurements with nominal aperture lengths of 50 and 200 µm used a nominal pump-controller setting of 20 µL min−1, whereas the 800 µm measurement used a nominal setting of 50 µL min−1.
Figure 6.
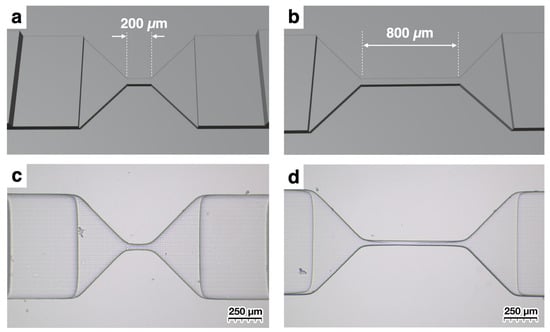
Design of microchannels with elongated apertures. In contrast to Figure 3, where the aperture length is 50 µm, models with longer apertures of (a) 200 µm and (b) 800 µm were fabricated. (c,d) show microscope images of the fabricated apertures.
RPS can not only count passing particles, but can also record the temporary capture of target particles through interactions when ligands are immobilized on the aperture as changes in current values [24,25,26,27]. When the aperture is short, there is a high probability that target particles will pass through without contacting the wall surface, but if the aperture is long, this probability decreases. As demonstrated by the results of this experiment, if the aperture is too long, the increased hydraulic resistance can hinder particle measurement. In this way, when performing particle measurement with RPS, channels can be freely designed and rapidly fabricated according to given specifications, allowing for faster verification cycles.
As stated above, fabricating microchannels with a 3D printer offers many advantages. Of particular interest is the fact that our results were achieved using 3D printers not originally intended for microchannel fabrication. Although inexpensive 3D printers tend to have lower precision, resulting in variation in the fabricated aperture widths, it was still possible to create microchannels that functioned in actual particle measurement.
One important consideration is that the width of the created aperture is not necessarily precise. Because the 3D printer used is not specifically designed for fabricating microchannels, the actual width can vary around 50 µm. The example of the size variation of obtained microchannels is shown in Figure S5 as Supplementary Material. Because the channels are designed with a width of 50 µm, the eight obtained channels have values close to 50 µm, but some are slightly larger or smaller. For the eight channels shown in Figure S5, the measured aperture width was 48.3 ± 6.0 µm (mean ± standard deviation; range, 42–59 µm; n = 8) for a nominal width of 50 µm. The nominal channel height was 50 µm, corresponding to one layer at the 50 µm layer-thickness setting used for 3D printing; however, the actual channel height of the PDMS replicas was not independently measured. Paired dimensional changes between the printed mold and PDMS replica were also not measured. Formal fabrication yield and measurement success rate were not prospectively recorded, and the minimum detectable particle or cell size was not established. This variation may be due to factors such as the uniformity of the UV light required for photopolymerization and distortion that occurred when the printed object was peeled from the membrane after UV exposure. While the obtained microchannels for RPS are useful for counting particles that pass through, accurately estimating the sizes of particles passing through from the drop in ionic current requires precise fabrication of the aperture size, which is difficult with the 3D printer used in this study. Furthermore, it has been reported that the magnitude of ionic current decrease as particles pass through the aperture varies depending on the part of the aperture they pass through, making particle size estimation complex [28]. The rounded aperture corners observed in Figure 3e differ from an ideal sharp-edged geometry and may alter the local electric-field distribution and particle trajectories, thereby affecting the resulting pulse amplitude. Because these effects were not independently characterized, their quantitative influence could not be determined in the present study. Therefore, we do not discuss size evaluation in this study. The minimum detectable particle or cell size was not determined in the present study. Detectable pulse signals were obtained with 10 µm polystyrene particles; however, this value should not be interpreted as the detection limit. Previous RPS studies indicate that detectable particle size relative to aperture dimensions depends strongly on sensing geometry and signal-to-noise characteristics [29]. Therefore, measurements using smaller particles and systematic evaluation of the signal-to-noise ratio will be required to establish the lower detection limit of the present device.
4. Conclusions
This study demonstrated a workflow for fabricating PDMS–glass microchannels using molds produced with a consumer-grade SLA 3D printer. Channels with a nominal aperture width of 50 µm and nominal aperture lengths of 50, 200, and 800 µm were fabricated, and detectable RPS pulse signals were obtained from MDA-MB-231 cells and 10 µm polystyrene particles. The present study is limited to a proof-of-concept evaluation. Effective flow rate, quantitative counting efficiency, detection limit, particle-sizing accuracy, cell-size distribution, channel-height reproducibility, manufacturing yield, and long-term resistance to leakage and clogging were not established. Future work should incorporate calibrated flow measurements, independent reference counting, multiple independently fabricated devices, systematic three-dimensional metrology, and anti-clogging strategies.
Supplementary Materials
The following supporting information can be downloaded at https://www.mdpi.com/article/10.3390/s26227240/s1, Figure S1: Example of measurement data; Figure S2: Extraction of pulses from current data; Figure S3: Example of time vs. pulse count trend; Figure S4: Example of scatter plot of pulse measurements; Figure S5: Examples of obtained microchannels designed with a width of 50 µm; Figure S6: Principal dimensions of the mold fabricated using the 3D printer.
Author Contributions
Conceptualization, Y.H., M.Y., K.-i.N. and H.A.; methodology, Y.H., M.Y., K.-i.N. and H.A.; investigation, Y.H.; validation, Y.H.; formal analysis, Y.H.; data curation, Y.H.; microchannel fabrication concept and optimization, M.Y. and Y.H.; PDMS transfer and microchannel assembly process development, K.-i.N. and Y.H.; particle measurement device design and optimization, H.A. and Y.H.; writing—original draft preparation, Y.H.; writing—review and editing, Y.H., M.Y., K.-i.N. and H.A. All authors have read and agreed to the published version of the manuscript.
Funding
This study was supported by a joint research grant from Advantest Corporation, as well as by a subsidy project (JPNP20004) from the New Energy and Industrial Technology Development Organization (NEDO).
Data Availability Statement
Data supporting the content of this article are included in the Supplementary Materials. The original raw current measurement data underlying the results and the STL design files used for microchannel fabrication are retained in the institutional data storage of the authors’ affiliated institution and are available from the corresponding author upon reasonable request, subject to applicable institutional requirements.
Conflicts of Interest
The authors have received joint research funding from Advantest Corporation. The authors declare no conflicts of interest.
References
- Akbari, Z.; Raoufi, M.A.; Mirjalali, S.; Aghajanloo, B. A review on inertial microfluidic fabrication methods. Biomicrofluidics 2023, 17, 051504. [Google Scholar] [CrossRef] [Scilit] [PubMed]
- Yao, J.; Zhao, K.; Lou, J.; Zhang, K. Recent Advances in Dielectrophoretic Manipulation and Separation of Microparticles and Biological Cells. Biosensors 2024, 14, 417. [Google Scholar] [CrossRef] [Scilit] [PubMed]
- Dang, Z.; Jiang, Y.; Su, X.; Wang, Z.; Wang, Y.; Sun, Z.; Zhao, Z.; Zhang, C.; Hong, Y.; Liu, Z. Particle Counting Methods Based on Microfluidic Devices. Micromachines 2023, 14, 1722. [Google Scholar] [CrossRef] [Scilit] [PubMed]
- Xun, Z.-Y.; Liu, L.; Zhang, B.-C.; Fan, L.-L.; Zhang, L.-W.; Zhao, H.; Iqbal, S.; Shakoor, R.I.; Zhao, L. A Low-Cost Microfluidic Device for the On-Line Counting of Microparticle/Bacteria. Electrophoresis 2024, 45, 2182–2190. [Google Scholar] [CrossRef] [Scilit] [PubMed]
- Kozak, D.; Anderson, W.; Vogel, R.; Chen, S.; Antaw, F.; Trau, M. Simultaneous Size and ζ-Potential Measurements of Individual Nanoparticles in Dispersion Using Size-Tunable Pore Sensors. ACS Nano 2012, 6, 6990–6997. [Google Scholar] [CrossRef] [Scilit] [PubMed]
- Willmott, G.R.; Smith, B.G. Modelling of resistive pulse sensing: Flexible methods for submicron particles. ANZIAM J. 2014, 55, 197–213. [Google Scholar] [CrossRef] [Scilit]
- Anderson, W.; Kozak, D.; Coleman, V.A.; Jämting, Å.K.; Trau, M. A comparative study of submicron particle sizing platforms: Accuracy, precision and resolution analysis of polydisperse particle size distributions. J. Colloid Interface Sci. 2013, 405, 322–330. [Google Scholar] [CrossRef] [Scilit] [PubMed]
- Brecher, G.; Schneiderman, M.; Williams, G.Z. Evaluation of Electronic Red Blood Cell Counter. Am. J. Clin. Pathol. 1956, 26, 1439–1449. [Google Scholar] [CrossRef] [Scilit] [PubMed]
- Mattern, C.F.T.; Brackett, F.S.; Olson, B.J. Determination of Number and Size of Particles by Electrical Gating: Blood Cells. J. Appl. Physiol. 1957, 10, 56–70. [Google Scholar] [CrossRef] [Scilit] [PubMed]
- Kubitschek, H.E. Electronic Counting and Sizing of Bacteria. Nature 1958, 182, 234–235. [Google Scholar] [CrossRef] [Scilit] [PubMed]
- Sowerby, S.J.; Broom, M.F.; Petersen, G.B. Dynamically resizable nanometre-scale apertures for molecular sensing. Sens. Actuators B Chem. 2007, 123, 325–330. [Google Scholar] [CrossRef] [Scilit]
- Kozak, D.; Anderson, W.; Vogel, R.; Trau, M. Advances in resistive pulse sensors: Devices bridging the void between molecular and microscopic detection. Nano Today 2011, 6, 531–545. [Google Scholar] [CrossRef] [Scilit] [PubMed]
- Kozak, D.; Anderson, W.; Grevett, M.; Trau, M. Modeling Elastic Pore Sensors for Quantitative Single Particle Sizing. J. Phys. Chem. C 2012, 116, 8554–8561. [Google Scholar] [CrossRef] [Scilit] [PubMed]
- Danforth, S. Fused Deposition of Ceramics: A New Technique for the Rapid Fabrication of Ceramic Components. Mater. Technol. 1995, 10, 144–146. [Google Scholar] [CrossRef] [Scilit]
- Masood, S.H. Intelligent rapid prototyping with fused deposition modelling. Rapid Prototyp. J. 1996, 2, 24–33. [Google Scholar] [CrossRef] [Scilit]
- Cesarano, J. A Review of Robocasting Technology. MRS Online Proc. Libr. 1998, 542, 133–139. [Google Scholar] [CrossRef] [Scilit]
- Kodama, H. Automatic method for fabricating a three-dimensional plastic model with photo-hardening polymer. Rev. Sci. Instrum. 1981, 52, 1770–1773. [Google Scholar] [CrossRef] [Scilit]
- Waheed, S.; Cabot, J.M.; Macdonald, N.P.; Lewis, T.; Guijt, R.M.; Paull, B.; Breadmore, M.C. 3D printed microfluidic devices: Enablers and barriers. Lab Chip 2016, 16, 1993–2013. [Google Scholar] [CrossRef] [Scilit] [PubMed]
- Mohamed, M.G.A.; Kumar, H.; Wang, Z.; Martin, N.; Mills, B.; Kim, K. Rapid and Inexpensive Fabrication of Multi-Depth Microfluidic Device using High-Resolution LCD Stereolithographic 3D Printing. J. Manuf. Mater. Process. 2019, 3, 26. [Google Scholar] [CrossRef] [Scilit]
- Razavi Bazaz, S.; Kashaninejad, N.; Azadi, S.; Patel, K.; Asadnia, M.; Jin, D.; Ebrahimi Warkiani, M. Rapid Softlithography Using 3D-Printed Molds. Adv. Mater. Technol. 2019, 4, 1900425. [Google Scholar] [CrossRef] [Scilit]
- Pollard, M.; Hunsicker, E.; Platt, M. A Tunable Three-Dimensional Printed Microfluidic Resistive Pulse Sensor for the Characterization of Algae and Microplastics. ACS Sens. 2020, 5, 2578–2586. [Google Scholar] [CrossRef] [Scilit] [PubMed]
- Yan, J.; Wang, C.; Fu, Y.; Guo, J.; Guo, J. 3D printed microfluidic Coulter counter for blood cell analysis. Analyst 2022, 147, 3225–3233. [Google Scholar] [CrossRef] [Scilit] [PubMed]
- Ren, X.; Ghassemi, P.; Babahosseini, H.; Strobl, J.S.; Agah, M. Single-Cell Mechanical Characteristics Analyzed by Multiconstriction Microfluidic Channels. ACS Sens. 2017, 2, 290–299. [Google Scholar] [CrossRef] [Scilit] [PubMed]
- Bayley, H.; Cremer, P.S. Stochastic sensors inspired by biology. Nature 2001, 413, 226–230. [Google Scholar] [CrossRef] [Scilit] [PubMed]
- Gyurcsányi, R.E. Chemically-modified nanopores for sensing. Trends Anal. Chem. 2008, 27, 627–639. [Google Scholar] [CrossRef] [Scilit]
- Ren, R.; Zhang, Y.; Nadappuram, B.P.; Akpinar, B.; Klenerman, D.; Ivanov, A.P.; Edel, J.B.; Korchev, Y. Nanopore extended field-effect transistor for selective single-molecule biosensing. Nat. Commun. 2017, 8, 586. [Google Scholar] [CrossRef] [Scilit] [PubMed]
- Horiguchi, Y.; Naono, N.; Sakamoto, O.; Takeuchi, H.; Yamaoka, S.; Miyahara, Y. Methodology to Detect Biological Particles Using a Biosensing Surface Integrated in Resistive Pulse Sensing. ACS Appl. Mater. Interfaces 2022, 14, 20168–20178. [Google Scholar] [CrossRef] [Scilit] [PubMed]
- Tsutsui, M.; He, Y.; Yokota, K.; Arima, A.; Hongo, S.; Taniguchi, M.; Washio, T.; Kawai, T. Particle Trajectory-Dependent Ionic Current Blockade in Low-Aspect-Ratio Pores. ACS Nano 2016, 10, 803–809. [Google Scholar] [CrossRef] [Scilit] [PubMed]
- Song, Y.; Zhang, J.; Li, D. Microfluidic and Nanofluidic Resistive Pulse Sensing: A Review. Micromachines 2017, 8, 204. [Google Scholar] [CrossRef] [Scilit] [PubMed]

Disclaimer/Publisher’s Note: The statements, opinions and data contained in all publications are solely those of the individual author(s) and contributor(s) and not of MDPI and/or the editor(s). MDPI and/or the editor(s) disclaim responsibility for any injury to people or property resulting from any ideas, methods, instructions or products referred to in the content. |
© 2026 by the authors. Licensee MDPI, Basel, Switzerland. This article is an open access article distributed under the terms and conditions of the Creative Commons Attribution (CC BY) license.