


Abstract
Industrial parks and company growth are vital for urban planning and development. With temporal data collection, mathematical model-based growth predictions of industrial parks become feasible. This study proposes an industrial park land development simulation and company growth projection (LSGP) framework that integrates historical satellite imagery and social big data. The framework links a cellular automaton–logistic regression (CA-LR) land development model at a 5 m grid resolution with a logistic growth (LG) company projection model through a shared park-level spatiotemporal data model and planning scenarios. Three industrial parks in Xiamen and Shanghai were used for calibration and cross-park transfer experiments. Results show that the LSGP framework can reproduce calibration-period land expansion and company growth patterns. For Land A (Xiamen Software Park III), the CA-LR land simulation achieved an average OA of 0.9059 and an average FOM of 0.2892 over seven iterations, and the LG company growth model achieved a testing MAE of 36.2903. Main findings include: (1) underlying land growth follows similar patterns, and key influencing factors are similar, such as traffic convenience and adjacency to urban centers; (2) the company growth pattern follows a logistic growth curve, with each subgroup of companies following the same pattern; (3) cross-park transfer provides preliminary evidence that models calibrated in one park may be transferable to another, but this transferability is conditional and requires independent spatial/temporal validation before application to newly planned parks; (4) the LSGP framework may be further developed to simulate various land-use projects and emulate growth patterns for additional areas of interest. Because no independent spatial or temporal validation was performed, the LSGP framework is positioned as a planning-support scenario tool rather than as a validated forecasting system.
1. Introduction
Industrial parks, as the primary physical carriers of industrial agglomeration and innovation, constitute a representative focal point in the transformation of contemporary urban planning from expansive growth management to the fine-grained regulation of land-use structure and spatial quality [1,2]. Their development is characterized by high spatiotemporal heterogeneity, involving not merely simple boundary expansion but also intricate processes of internal textural reorganization, infill development, and infrastructure penetration [3,4]. Traditional planning methodologies, which predominantly rely on static cross-sectional analyses or periodic statistical reports, are insufficient to capture the dynamic interplay between the compact, intensive development and peripheral sprawling growth that defines these zones [5]. Consequently, advancing a quantitative understanding of industrial land morphology and constructing an analytical framework capable of precisely mapping land cover transformation trajectories is a foundational step in steering spatial planning from an experience-based practice toward a data-driven, evidence-based science [3,4]. Industrial parks are a global phenomenon, but their development pathways differ significantly between developed and developing countries due to distinct urbanization trajectories, industrial policies, and social conditions [3]. In developed countries, industrial parks often emphasize innovation clusters and brownfield redevelopment, whereas in developing countries, they are frequently deployed as instruments of rapid industrialization, employment creation, and urban expansion [6].
Within the established research domain of land-use change, the quantitative characterization of built-up area expansion has long been a core metric for evaluating the coordination of human–land relationships [4,7]. An extensive body of literature has explored conversion mechanisms in heterogeneous suburban or mixed-function areas, yet significant technical hurdles persist in isolating the pure growth signals of construction land within high-standard industrial parks. These zones present unique remote sensing challenges, such as spectral confusion between impervious surfaces, including metal factory roofs, and surrounding bare soil or fallow land, which complicates automated classification using standard spectral indices [8]. Furthermore, current analytical practices are frequently constrained by the insufficient granularity of multisource data fusion and a lack of methodological support for translating long-term spatial distribution sequences into the continuous evolutionary parameters required for predictive modeling [9]. Simulation is essential because it allows planners to test alternative development scenarios, anticipate land-use outcomes, and avoid irreversible planning decisions before implementation. Machine learning classifiers and cellular automaton (CA) models have been applied to urban land studies and growth simulation with considerable success [10,11], yet their application to the specific dynamics of industrial park land use remains comparatively underexplored. This technological bottleneck manifests as a critical information deficit for decision-makers, who face substantial lags and scale mismatches when attempting to prospectively delineate the potential footprint of new industrial plots, calculate sustainable development intensity thresholds, or optimize the layout of supporting road networks. Developing forward-looking simulation tools that accommodate complex spatial constraints and integrate multi-dimensional factors is therefore of paramount importance for enhancing the foresight, precision, and implementation feasibility of urban planning [11,12].
The advancement of digital technologies provides means for land use and planning. Remote sensing and satellite technology have greatly enhanced our ability to observe the Earth’s surface on a large scale [13,14] and monitor time-series changes [15,16]. Based on multisource remote sensing data [17], advanced geographic information system (GIS) technologies, and improved artificial intelligence (AI) algorithms, land use and land change have been studied extensively [14,16]. GIS applications with multiple spatial resolutions are available, ranging from coarse resolution to fine resolution and from classical mapping classifiers to advanced convolutional neural network (CNN) algorithms [18,19]. As for algorithms, machine learning algorithms such as random forest (RF) [20,21], classification and regression tree (CART) [22], and support vector machine (SVM) [23] are explored for urban land studies. CA models have been widely used to simulate urban growth and land-use change [24,25]. These models have been applied to various contexts, such as rural–urban land conversions and urban formation [26,27], demonstrating the ability of CA modeling to capture urban growth dynamics and provide helpful planning tools for testing different land development scenarios. The integration of GISs with CA models has been explored to improve the simulation of land-use changes and urban development [28,29,30]. These models incorporate high-resolution spatial data to represent land-use change in rural–urban settings and enable detailed analysis of land-use changes locally and globally. Computational models have been proposed to link micro-level behavior with macro-level land-use dynamics [31]. Applications of related studies in the areas of system dynamics, artificial immune systems, and data mining techniques in combination with CA models have been explored to simulate land-use dynamics, exploring new ways to construct transition rules for geographical CA [32,33,34]. The sensitivity analysis of CA models has also been conducted to assess behavior and the influence of the neighborhood size and type on the model’s output [35,36]. In addition, the integration of agent-based, nonlinear CA and logistic algorithms has been proposed to improve the simulation accuracy of urban land-use changes and to calibrate CA models based on landscape metrics [37,38,39].
Some studies have explored issues related to company growth. The classical firm dynamics tradition, rooted in Gibrat’s law of proportionate effect, has long established that company growth varies systematically with company size and age, with growth rates, the variability of growth, and failure probabilities all declining as companies mature [40,41]. Building on this foundation, agglomeration economics has emphasized that the spatial concentration of enterprises—such as that embodied in industrial parks—generates localization (MAR) and Jacobs externalities that shape both company-level outcomes and regional economic performance [42]. More recently, empirical studies have demonstrated that industrial parks materially affect enterprise activity: quasi-experimental evaluations of industrial park development projects report significant positive effects on company employment, particularly for female and total workforces [43], while complementary analyses of company entry and exit reveal that locational and environmental conditions drive substantial spatial restructuring of industrial activity [44]. At the same time, a growing body of recent research has assessed the operational effectiveness of industrial parks as instruments of local economic development, underscoring both their role in attracting residents and investment and persistent gaps between formal park registration and actual company presence and operational status [45].
While significant efforts have been made globally to study industrial park planning and management, four specific gaps remain. First, CA-based land-use modeling has rarely been adapted to the industrial park scale. Existing CA models are mostly calibrated for city or regional growth, where parcels are larger and land-use categories are coarser; at the industrial park scale, small parcel sizes, mixed impervious surfaces, internal infill, and infrastructure penetration create unresolved transition rule and validation problems. Second, land development simulation and company growth projection are typically treated as separate problems. Few studies explicitly link simulated land supply, land saturation timing, and company growth, so it is unclear how planning scenarios for land development can constrain or update company growth forecasts. Third, the existing research related to company growth is limited and mainly relies on static cross-sectional data, regional economic indicators, or survey-based samples rather than fine-grained, long-term social big data; it remains unclear whether company growth in industrial parks follows a general mathematical pattern, whether different industry subgroups share that pattern, and whether the model can be transferred to newly planned parks. Fourth, the transferability and future predictive performances of such models across parks have rarely been evaluated with quantitative metrics. To address these gaps, this study develops the land development simulation and company growth projection (LSGP) framework. Specifically, the CA-LR land model answers the first gap by simulating industrial park land expansion and infill at a 5 m grid resolution; the shared spatiotemporal data model and scenario linkage answer the second gap by using simulated land development trajectories to constrain company growth projections; the logistic growth (LG) model based on company POI data answers the third gap by quantifying overall and industry-specific company growth patterns; and the cross-park model transfer and future-prediction experiments answer the fourth gap by testing whether case-based models can be applied to newly planned industrial parks. Industrial parks in Xiamen and Shanghai were selected for developing the models and simulation study. Our findings highlight the underlying growth principles of industrial parks, which are of value in optimizing their planning and development. We do not claim out-of-sample predictive validity; the absence of independent spatial/temporal validation is treated as a design limitation, and its implications are discussed in Section 6.3.
The remaining sections of this paper are organized as follows: Section 2 provides an in-depth description of the study area and the data sources. Section 3 outlines the framework of the industrial park LSGP. Section 4 entails methodology through case studies. Section 5 showcases the experimental results and analysis. Section 6 follows with discussions and future work. Section 7 encapsulates the conclusions.
2. Study Area and Datasets
2.1. Study Area
Three industrial parks were selected for this study, two in Xiamen and one in Shanghai. The two industrial parks in Xiamen were chosen because of their locations and environments, while the reason for selecting the industrial park in Shanghai was to find model similarities across regions. Specifically, the two parks in Xiamen differ in their sizes, industrial mixes, and development stages, allowing within-city comparison while controlling for regional context; the park in Shanghai provides a cross-regional case with a different institutional and economic setting, which is essential for testing the transferability claim. These three parks thus cover a range of scales and sectors, making them suitable for assessing whether the LSGP framework can be generalized. Brief descriptions of the industrial parks are as follows:
1. Xiamen Software Park III (Land A) is located north of the Jimei District, south of Houxi Town, east of Guankou Town, and west of the Jimei Cultural and Educational District, facing Xinglin Bay and adjacent to Yuanbo Garden. It is an essential part of Jimei’s newly developed district, as shown in Figure 1d. The total planned area is 10 km2, with a building area of 8.6 million m2. As planned, it can accommodate 2000 companies, amounting to 200,000 employees. The main focus areas are in the following five sectors: big data and artificial intelligence, digital creativity, e-commerce, smart cities and industrial applications, and mobile internet.
Figure 1.
Study areas (this figure uses GF-7 high-resolution satellite data, whose copyright belongs to the China Centre for Resources Satellite Data and Application): (a) industrial park locations; (b) Land A and Land B located in Xiamen; (c) Land C located in Shanghai; (d) zoomed-in area of graph (b); (e) zoomed-in area of graph (c).
2. Xiamen Science and Technology Innovation Park (Land B) is located at the junction of the Jimei District and Tong’an District with a planned area of 4.9 km2, as shown in Figure 1d. It is planned to support the development of the Circum Eastern Sea Area. The functional layout of the industrial park consists of central office areas, research and development (R&D), industrial design centers, software industry areas, and living and supporting areas.
3. Zizhu Industrial Park (Land C) is located southeast of the Minhang District of Shanghai City, is convenient for transportation, and has a planned area of 13 km2. It comprises three parts: the University Park, the Research and Development Center, and the Zizhu Peninsula, as shown in Figure 1e. The University Park is located on the campuses of Shanghai Jiaotong University and East China Normal University, promoting cooperation between universities and enterprises. The Zizhu Peninsula is located in the park’s southeast corner, planned for a friendly and convenient large-scale residential community.
2.2. Datasets
We used multisource datasets, mainly categorized into two groups: (1) high-resolution satellite imagery from Google Earth and Gaofen-7 (GF-7), and (2) social big data collected from publicly available internet resources and different companies, such as the China National Enterprise Credit Information Publicity System (NECIPS) and OpenStreetMap (OSM).
Regarding satellite data, very-high-resolution optical imagery from Google Earth and imagery from the GF-7 satellite were collected for the identification and comparative analysis of developed, undeveloped, and constrained areas in the different industrial parks, as shown in Figure 1. For Land A and Land B in Xiamen, the 2010 and 2017 images were obtained from Google Earth, and the 2023 image was acquired by GF-7; for Land C in Shanghai, the 2002 and 2022 images were obtained from Google Earth [46]. The GF-7 satellite provides high-resolution imagery with a resolution of 0.65 m after true-color image fusion [47]. The DEM used in this study is the publicly available Shuttle Radar Topography Mission (SRTM) DEM (1 arc-second, approximately 30 m; absolute vertical accuracy of approximately 16 m, LE90; acquired in February 2000) [48], which was obtained from a public GIS data platform and used directly without further processing. All images were selected with a cloud cover of 0% and were acquired between July and September of the respective years to ensure consistent seasonal conditions across the time series. Detailed information on the images is provided in Table 1.
Table 1.
Detailed information on satellite imagery used in this study.
The GF-7 L1A-level image used in this study has undergone sensor-level systemic radiometric and coarse geometric correction. Orthorectification was conducted based on the rational polynomial coefficient (RPC) model with the SRTM DEM [48] to remove topographic and geometric distortions, and all data were unified into the CGCS2000/UTM map projection coordinate system. To balance spatial detail and spectral information, the 0.8 m panchromatic image and the 3.2 m multispectral image were fused via the Gram–Schmidt method to generate high-resolution multispectral imagery (approximately 0.65 m). The Google Earth imagery was used as already-orthorectified products and therefore required no additional orthorectification [46]. After registration and clipping to the study-area boundaries, cloud-free scenes (cloud cover of 0%) were retained for the subsequent land-use annotation.
In addition to satellite images, different types of social data, especially companies’ POIs, were collected. The POI data collected from the NECIPS contains company information, including name, address, registration time, and company type, while the OSM API was used to convert company addresses into latitude and longitude coordinates for spatial intersection with park boundaries. Taking the Xiamen industrial parks as an example, 408,358 POIs were retained after performing data cleansing and filtering. For per-park modeling, the POIs were further filtered by each park boundary, yielding 4001 for Land A, 621 for Land B, and 3726 for Land C, which are described in detail in Section 4.1.2.
3. Industrial Park LSGP Framework
The LSGP framework consists of four modules: the data model, land simulation model, company growth model, and visual analysis module. The functional diagram is shown in Figure 2, which we describe in detail next.
Figure 2.
The LSGP framework.
The four modules are not independent but are coupled through a shared spatiotemporal data model and a scenario-based workflow. The data model provides a unified park-level grid, land information, and company information. The land simulation model uses the CA algorithm to produce annual land development probability maps, developed/undeveloped/constrained labels, and land saturation timing. These simulated land development trajectories are then passed to the company growth model as scenario inputs, which constrain and update the upper limit and inflection point of the logistic growth curve. The company growth model outputs overall and industry-specific company growth projections. Finally, the visual analysis module integrates the outputs of both models and converts them into decision support information rather than merely displaying maps.
3.1. LSGP Data Model
The LSGP data model is based on the City Meta Unit (CMU) data model developed previously in Xiamen [21], for which satellite and social big data are collected and processed.
The land information and company information are linked by industrial park and year. The land information provides the spatial grid and land development status, while the company information provides the company counts, registration time, and industry type. The land simulation model reads the land information and generates simulated development trajectories. These trajectories are then used by the company growth model as scenario variables. In this way, the data model is not a static database but the connecting layer between land simulation and company projection.
3.2. CA Modeling for Land Development Simulation
CA modeling is a mathematical framework used to model the spatiotemporal behavior of complex systems [24]. In the context of urban land development simulation, CA models simulate the growth and evolution of land-use patterns over time [25].
A commonly used model of constrained CA was selected in this study as a basic framework for urban modeling. The components of the constrained CA include transition rules, neighborhood constraints, and stochastic perturbation [36]. These components are combined in the form of Equation (1):
where is the development probability, Sij represents the transition rules, Cij is the constraint of a specific land use, represents the impact of the neighborhood configuration, and RA is the stochastic perturbation term reflecting the effect of unconsidered factors (a random number within the range of [0, 1)).
The constrained CA is adopted because it separates static suitability, hard constraints, neighborhood influence, and stochastic perturbation, which is necessary for small industrial parcels and the strict exclusion of water, railways, and mountains [28,36]. The alternative forms, like additive CAs, cannot enforce hard constraints, fuzzy-set CAs require extra calibration and transfer poorly [25], and ANNs/RFs need larger samples and reduce interpretability [19,20]. The multiplicative form shown in Equation (1) is therefore selected for interpretability and cross-park transferability. A 3 × 3 Moore neighborhood is used because park development is local and fine-grained, which can be formulated as Equation (2):
where m is the window size, and con() is a conditional function which returns true if the state (Lij) is developed land use in the neighborhood.
The constraint of land use covers developed, undeveloped, and constrained in our study. Hence, the expression of Cij is as Equation (3), which means that the transition from constrained to developed is impossible:
After obtaining the development probability (), the evolution of urban land use during each iteration is completed through the following two steps: First, the available pixels (undeveloped) are sorted in a descending sequence based on . Second, pixels with higher development probabilities are preferentially converted to the developed area. To ensure that the simulated urban land use matches the observed, the number of converted pixels during each iteration is determined using a linear allocation scheme, which can be expressed as Equation (4):
where Per denotes the number of converted pixels during each iteration, D is the total conversion number of urban land use during the entire simulation phase, which is determined from the observed land use at two different phases, and K is the total number of iterations. A linear allocation scheme is adopted because it keeps the total converted amount consistent with the observed land-use change and supports cross-park comparison and transfer. Other allocation schemes, like demand-driven allocation, require exogenous socioeconomic scenarios [49], while patch-based allocation needs additional patch rules and data [39], both of which introduce extra uncertainty at the small industrial park scale. This scheme is therefore used as a simple, reproducible baseline, and its potential smoothing effect on expansion patterns is acknowledged.
It should be noted that we did not conduct a sensitivity analysis on the CA parameters (neighborhood size, stochastic term, and allocation scheme); the 3 × 3 Moore neighborhood and linear allocation followed common practice, and simulation results should be interpreted as conditional on these settings.
3.3. Model Parameter Setup
3.3.1. Transition Rules of CA Model
Transition rule calculation is very important in urban CA modeling. Calibrating processes can be achieved via various AI algorithms based on historical data. The performances of the obtained transition rules depend on the quantity and quality of the training samples and the selected mathematical models. This study uses the logistic regression (LR) model to estimate the probability of each pixel in the selected area [36], which can be expressed as Equations (5) and (6) jointly:
where Sij is the probability derived from the LR model, [x1,x2, …, xn] are independent variables related to land development, namely, the features used in this study (main highway, main road, relief road, bridge in island, bridge out island, market, metro, DEM, and slope (the detailed definitions are described in Section 4.1.1)), [b1,b2, …, bn] are regressed coefficients for different variables, and b0 is a constant.
z = b0 + b1x1 + b2x2+…+bnxn
Besides LR, other classification algorithms, such as RF and SVM, have been widely used in urban land studies. However, their applications at the industrial park scale remain underexplored: RF has slightly higher accuracy but risks overfitting on small park samples and lacks interpretability [20]; SVM is sensitive to feature scaling and sample imbalance [23]. LR strikes a good balance among accuracy, stability and interpretability, with explicit coefficients that directly reflect driving-factor weights, supporting both planning insight and cross-park model transfer [36], which is why LR is used here as an interpretable baseline.
We did not conduct multicollinearity diagnostics or empirical comparisons with RF/SVM; LR was selected as an interpretable baseline rather than a demonstrably superior model. Coefficient-based driver interpretations should therefore be treated as exploratory.
3.3.2. Logistic Model for Company Growth Model
For projecting company growth in an industrial park, the logistic growth (LG) model [50] is used to emulate the changing trends of company numbers, which can be expressed as Equation (7):
where y represents the total number of companies, t represents the feature variable (time period), a is the initial value, b is the upper limit of the logistic curve based on the zero baseline (a + b is the final upper asymptote of the LG model and together reflect the saturation level of the number of companies in the industrial park), c is the slope of the logistic curve, which reflects the growth rate, and d is the inflection point. Parameters a and b are constants set beforehand based on the statistical number of companies, while c and d are obtained from model training.
In the calibration, a was fixed as the initial observed company count and b was fixed so that a + b approximated the observed saturation level, while c and d were estimated by linearizing Equation (7) and fitting the transformed data. In the scenario projection (Section 5.2.3), a and c were kept unchanged, whereas b and d were adjusted according to explicit planning assumptions (saturation year and land–company lag). These scenario adjustments are assumptions, not estimated parameters.
3.4. Visual Analysis Module
The visual analysis module is designed for decision-making support. Specifically, it performs four functions: (1) comparing land development scenarios and company growth projections under different planning assumptions; (2) identifying the timing and spatial locations of land saturation, infill gaps, and constrained areas; (3) quantifying the lag between land development and company growth so that planners can judge whether land supply is ahead of or behind company demand; and (4) generating GIS-based, BIM/3D growth analysis and science park reports for planners to adjust land supply, supporting facility and industry mixing. Therefore, the module supports scenario exploration rather than validated prediction, showing what may happen under explicit assumptions and what can be adjusted.
4. LSGP-Based Land-Use Simulation and Company Growth Projection for Xiamen and Shanghai Industrial Parks
Based on the LSGP framework, we set up the LSGP data model for land-use simulation and company growth projections. For the land simulation, both the LR and CA models were applied. The land grid was set up for Land A, and the grid size was 5 m × 5 m. We used Land B and Land C as case-based references for model parameter acquisition. For company growth emulation, we set up an LG model each for the three selected land areas. The inspiration for using the LG model was based on our observations of company growth patterns for the selected industrial parks, which was verified and described by the proposed model in Section 5. The implementation of the proposed method is shown in Figure 3.
Figure 3.
Proposed-method diagram for land-use simulation and company growth projections.
4.1. Data Preparation
4.1.1. Land-Use Data Processing
We collected labeling data for the land uses of Land A and Land B in 2010 and 2017 and for Land C in 2002 and 2022 separately. In addition, the land-use state of Land A in 2023 was derived from the GF-7 image to support the future-growth simulation (Section 5.1.3). The selection of the observation periods followed the planning and construction timelines of the parks: Land A and Land B were planned after 2010 and were essentially completed by 2017, whereas Land C commenced construction in 2002 and experienced a considerably longer development cycle. Each land has its own geographic features, such as a main highway, main road, relief road, DEM, and slope. Through the unified map projection coordinate system (CGCS2000/UTM), these image data were preprocessed to obtain the label data and feature data with a pixel size of 5m × 5m and resolutions of 618 × 1556 (Land A), 719 × 673 (Land B), and 790 × 1182 (Land C). Taking Land A as an example, the data processing steps were as follows:
(1) Data annotation
The remote sensing images acquired for the first and second periods were manually annotated. The land-use scheme is a three-class park-level taxonomy—developed, undeveloped, and constrained—as shown in Table 2. This scheme is not a generic ULUC system [18] but a development-oriented scheme that separates developable, non-developable, and already developed land for industrial parks.
Table 2.
The land cover scheme for industrial parks.
(2) Label processing
The actual annotated areas of different land-use types for Land A in 2010 and 2017 are shown in Table 3. By comparing the annotated land-use data between the two periods, the classification label of each pixel was obtained [26], as shown in Figure 4. Pixels were then sampled from the developed area (labeled as 1) and undeveloped area (labeled as 0) to generate training samples and label data.
Table 3.
Annotated areas of different land-use types for Land A in 2010 and 2017.
Figure 4.
Land development classification label of Land A.
(3) Feature processing
By locating geographical feature points near the industrial park, such as road intersections, subway stations, and market centers, the feature values of each pixel (the distance to these feature points) were calculated to obtain feature maps of the park. The corresponding feature values of each sample pixel from the feature maps were extracted and integrated with the label data to form a complete training sample dataset. Descriptions of the features are shown in Table 4 below.
Table 4.
The features used to compute the land development probability.
The feature variables in Table 4 were not selected by an automated procedure. They represent the main accessibility and site-condition drivers commonly used in park-scale CA studies and were chosen based on three criteria: (i) relevance to industrial park land development (e.g., highway/road/metro access, market proximity, and terrain); (ii) consistent availability from GIS and remote sensing data across the study parks; and (iii) interpretability for planning. Bridge-related variables were retained for Xiamen because cross-sea bridges strongly shape local accessibility, but they were omitted for Shanghai (Land C) because no comparable cross-sea bridge exists. For application to another industrial park, the same feature categories should be used only when equivalent data and geographic conditions exist; otherwise, analogous local accessibility variables should be substituted, and the LR model should be recalibrated locally. Direct transfer without feature matching and local calibration is not recommended. Feature selection followed the planning-oriented rationale above rather than a data-driven variable-selection algorithm; consequently, the LR coefficients should be interpreted as conditional associations under the selected feature set, not as independently identified causal effects.
4.1.2. Company Data Processing
The data processing steps for company growth were as follows:
(1) The company data of Xiamen and Shanghai were retrieved from publicly available internet resources through the NECIPS [51], including the basic information of each company, such as the name, address, registration time, and type.
(2) Company addresses were converted into latitude and longitude coordinates by the OSM’s Nominatim API [52].
(3) ArcGIS 10.7 software was used to project company POIs according to longitude and latitude coordinates and perform intersection processing with the shape file of the industrial park to obtain company data inside each park.
(4) Data were cleaned using the following criteria: Companies with missing or invalid addresses/coordinates, duplicate records, or “cancelled/revoked” status were removed. Only companies with valid registration times, industry types, and coordinates inside the park boundary were retained.
(5) Statistical analysis of company data in each park yearly was conducted to get the number of companies for each year.
(6) Sample data were obtained and organized for each park for LG modeling.
By plotting the growth curves, we adopted the working assumption that the company growth follows a logistic pattern, which led us to adopt the LG model.
4.2. CA Modeling for Land-Use Simulation
As described in Section 4.1.1, 1000 samples were randomly sampled for Land A, Land B, and Land C separately, including 500 positive samples and 500 negative samples, each containing nine feature values (seven for Land C). Manual validation removed samples that were mislabeled, located on mixed-boundary pixels, or that contradicted the remote sensing image, retaining 837 samples (417 positive and 420 negative). Manual validation was applied only to Land A because it was the primary modeling area; Land B and Land C served as transfer sources, and their samples were kept as originally labeled to avoid cleaning bias in cross-park transfer assessment. By splitting the training and testing data, 737 training samples and 100 testing samples were obtained for Land A, while 900 training samples and 100 testing samples were obtained for Land B and Land C. The steps to simulate land development using the CA algorithm are as follows:
(1) Train the LR model using the training set of Land A, and evaluate the accuracy of the model using the testing set.
(2) Extract the feature value combination of each pixel in Land A through the feature maps and use the LR model to predict each pixel to obtain the static development probability of Land A.
(3) By comparing the land-use data of Land A in 2010 and 2017, the total number of converted pixels in the developed area is 67,713, which determines that the average number of converted pixels per iteration is 9673.
(4) Since there is a 7-year interval from 2010 to 2017, the number of iterations is set to 7. Before the first iteration, 5000 pixels with the highest static development probability are selected, and land development simulation is conducted using the CA algorithm described in Section 3.2. In each iteration, the 9673 pixels with the highest dynamic development probability in the undeveloped area are converted into developed areas.
(5) Compare the predicted results of each iteration with the actual land-use results in 2017, calculate the overall accuracy (OA) and figure of merit (FOM) [4] indicators, and evaluate the effectiveness of the CA simulation, which can be expressed as Equations (8) and (9):
where Mii is the number of correctly classified pixels on the diagonal of the confusion matrix (consisting of real and predicted land-use categories), n denotes the number of land-use categories, and the denominator represents the total number of valid pixels;
where is an area of error due to real-change pixels predicted as unchanged, is an area of accuracy due to correctly predicted change pixels, is an area of error due to real-change pixels predicted with incorrect categories, and is an area of error due to unchanged pixels incorrectly predicted as changed.
(6) Similarly, train the LR models of Land B and Land C and transfer them to Land A for land development simulation by replacing the LR model of Land A. Repeat steps (2)–(5), then compare the simulation results and provide preliminary evidence of model transfer from different lands. Cross-park transfer can be validated by comparing the OA and FOM under the same CA framework.
4.3. Logistic Model to Emulate Company Growth
As described in Section 4.1.2, we obtained 4001 companies for Land A, 621 companies for Land B, and 3726 companies for Land C. The starting time of modeling was the year when the industry park began to develop, which was 2014 for Lands A, B, and C. Seven regression samples were obtained. The steps to emulate company growth using the LG model are as follows:
(1) Determine the values of constants a and b in the LG model based on statistical company data.
(2) Take the company numbers as the target (y) and the establishment period of the industrial park as the feature (t) (values are 0–6). According to Equation (7), if z′ = −c × (t − d), then z′ = ln[y′/(1 − y′)], where y′ is the normalized value of y, which transforms nonlinear data into linear data.
(3) Train and test z′ using the linear regression algorithm (5 training samples and 2 test samples), use the mean absolute error (MAE) as the evaluation indicator, and then obtain the parameter values of c and d.
(4) By substituting the values of a, b, c, and d into the LG model, the emulation data and LG curve of companies for different parks can be obtained.
5. Results and Analysis
All results in Section 5 serve as calibration and transfer diagnostics. Because no independent spatial or temporal validation was performed, they characterize model fit and conditional cross-park similarity rather than out-of-sample predictive skill.
5.1. Industrial Park Land Simulation
5.1.1. CA Modeling-Based Land Simulation
For Land A, the accuracy of the trained LR model on the testing set is 79.00%, and the regression coefficients are [−0.2929, −0.3695, −0.0201, −0.2110, 0.1571, −0.6468, 0.1887, −0.6157, 0.0678], namely:
According to the method described in Section 4.2, the land development simulation result for Land A based on the CA algorithm was obtained and is shown in Figure 5a below.
Figure 5.
Land A’s land development simulation result based on LR model and CA algorithm (in 2017): (a) Land A-based LR model; (b) Land B-based LR model transfer; (c) Land C-based LR model transfer.
The changing curves of the OA and FOM for different iterations are shown in Figure 6a,b below. By obtaining the label values between the map generated by each iteration and the actual land-use map in 2017, the OA can be calculated using Equation (8), in which the confusion matrix consists of simulated and actual land-use categories, including developed, undeveloped and constrained areas. By comparing the label values of 9673 pixels converted in each iteration with the values of the corresponding pixels in the actual map, the FOM can be calculated using Equation (9).
Figure 6.
Land A’s land development simulation result based on LR model and CA algorithm: (a,b) OA and FOM changes of Land A-based LR model; (c,d) OA and FOM changes of Land B-based LR model transfer; (e,f) OA and FOM changes of Land C-based LR model transfer.
We observe that the average OA and FOM in seven iterations are 0.9059 and 0.2892, respectively; the OA and FOM of the final simulation result in 2017 are 0.8916 and 0.2390, respectively. This OA-FOM pattern is typical for fine-scale industrial land simulation: the OA can be dominated by unchanged pixels, whereas the FOM directly measures the ability to predict actual land changes. However, the FOM alone cannot establish predictive performance; OA is strongly influenced by unchanged pixels, and no independent spatial or temporal validation was performed. These metrics should therefore be treated as calibration/transfer diagnostics rather than as proof of operational predictive skill. The contrast between a high OA and low FOM will be further discussed in Section 6.1.
5.1.2. Model Transfer-Based Land Simulation
For Land B, the accuracy of the trained LR model on the testing set is 74.00%, and the regression coefficients are [0.5012, −0.8220, 0.1609, 0.0803, −0.0128, 0.0377, −0.1427, −0.0968, −0.3063], namely:
For Land C, the accuracy of the trained LR model on the testing set is 73.00%, and the regression coefficients are [−0.4119, −0.3513, −0.0518, 0.0889, 0.1059, −0.3936, −0.3117], namely:
According to the method described in Section 4.2, the LR model of Land B was transferred to Land A, and then the CA algorithm was used to simulate the land development of Land A. The result is shown in Figure 5b. The changing curves of the OA and FOM for different iterations are shown in Figure 6c,d. As for the LR model transfer of Land B, the average OA and FOM in seven iterations are 0.8993 and 0.2277, respectively; the OA and FOM of the final simulation result in 2017 are 0.8830 and 0.2253, respectively.
Similarly, the LR model of Land C was transferred to Land A, and then the CA algorithm was used to simulate the land development of Land A. The result is shown in Figure 5c. The changing curves of the OA and FOM for different iterations are shown in Figure 6e,f. As for the LR model transfer of Land C, the average OA and FOM in seven iterations are 0.9055 and 0.2911, respectively; the OA and FOM of the final simulation result in 2017 are 0.8919 and 0.2445, respectively. The comparison of the average OA and FOM values of the land development simulation results for Land A based on the LR models of Lands A, B, and C is shown in Figure 7 below.
Figure 7.
Comparison of land development simulation results for Land A based on different LR models.
The Land B/C-to-A experiments constituted cross-park transfer tests rather than independent spatial validation, since Land A remained the calibration target. Accordingly, they provide only preliminary evidence of transferability and do not support operational use in unobserved parks. Moreover, these transfer experiments involved cross-park comparisons rather than baseline-controlled tests; therefore, they cannot by themselves establish that the transferred models capture shared drivers rather than merely coarse spatial similarity.
5.1.3. Land Simulation: Prediction for Future Growth
By comparing the land-use data of Land A from 2017 and 2023, the total number of converted pixels in the developed area is 106,730, which determines that the average number of converted pixels per iteration during the period is 17,788.
As stated in Section 2.1, it is known that the total planned area of Land A is 10 km2, the planned building area is 8.6 million m2, and the planned plot ratio is 4. The land development area can be calculated based on the building area and plot ratio through Equation (10):
where LA represents the land development area, BA represents the building area, and PR is the plot ratio, which reflects the density of buildings on the land.
By comparison with the land development area in 2023, the number of converted pixels for each subsequent year can be obtained. It is known that the building area in 2023 is 4.8 million m2. Assuming that Land A will be fully developed by 2035, the calculation process is as follows:
(1) Assumed land development area in 2035 = Building area in 2035/plot ratio = 8.6 million m2/4 = 2.15 million m2;
(2) Actual land development area in 2023 = Building area in 2023/plot ratio = 4.8 million m2/4 = 1.2 million m2;
(3) Subsequent annual converted pixels = ((Assumed land development area in 2035—Actual land development area in 2023)/Pixel area)/Duration years = ((2.15 million m2 −1.2 million m2)/25 m2)/12 = 3167.
Based on the result in Section 5.1.1, the CA algorithm was further applied to the iteration to predict the future land development of Land A. The prediction result is shown in Figure 8 (9673 converted pixels in each iteration from 2010 to 2017, 17,788 converted pixels in each iteration from 2018 to 2023, and 3167 converted pixels in each iteration from 2024 to 2035). The 2035 full-development target is a planning assumption used to allocate future converted pixels; it is not an empirically validated outcome. The future-land simulation should therefore be regarded as a scenario projection rather than as a validated forecast.
Figure 8.
The future-land-development simulation result for Land A (in 2035).
5.2. Industrial Park Growth Emulation
5.2.1. Company Growth Emulation for Land A
As described in Section 4.3, LG modeling was conducted on the company growth data for Land A, and the parameters a = 716, b = 3285, c = 0.9127, and d = 3.6203 were obtained. The MAE on the testing set was 36.2903. The emulation results are shown in Figure 9.
Figure 9.
Statistical and emulation results of company growth for Land A: (a) statistical result; (b) emulation result.
The companies in Land A were divided into six categories according to their respective industries: software industry, technology service industry, business service industry, wholesale and retail industry, manufacturing industry, and others. In the same way, statistical processing and LG modeling were conducted for each sector. The parameters of the LG model for different industries are shown in Table 5, and the emulation results are shown in Figure 10.
Table 5.
Parameters of LG model for different industries in Land A.
Figure 10.
The company growth emulation results for different industries for Land A: (a) emulation results; (b) normalization results of graph (a).
The parameters a and b are interpretable as the initial number of companies and the additional capacity before saturation (a + b is the final upper asymptote). The contrast is notable: the software industry has a + b = 1352, whereas manufacturing has a + b = 156, indicating a much larger sectoral capacity for software. This supports this study’s claim that different industries follow logistic growth but with distinct scales.
5.2.2. Model Transfer-Based Company Growth Emulation
Similarly, LG modeling was conducted on the company growth data for Lands B and C, and the LG model parameters were obtained, as shown in Table 6. The emulation results are shown in Figure 11.
Table 6.
LG model parameters for different lands.
Figure 11.
The statistical and emulation results of company growth: (a) Land B; (b) emulation result of graph (a); (c) Land C; (d) emulation result of graph (c).
Through comparison, we can find that the emulation results between Lands B, C, and A have some similar trends. Therefore, the LG models of Lands B and C can be transferred to Land A, where the parameter values of c and d in Land A are replaced with the corresponding values in Lands B and C. The parameter values of a and b are constants and remain unchanged. Note that this company growth transfer is not the same operation as the land-use transfer in Section 5.1.2: the latter replaces the entire LR model, whereas here only the growth rate and inflection parameters c and d are transferred, while the scale parameters a and b are kept park-specific. The emulation results are shown in Figure 12.
Figure 12.
Comparison of company growth emulation results for Land A based on LG model transfer in Lands B and C.
5.2.3. Future-Company-Growth Prediction
We can emulate future company growth based on land development; that is, the parameters of a and c in the LG model remain unchanged, while the parameters of b and d are modified according to the plan specified. Assuming that the land development of Land A reached saturation in 2024, the company growth lags by four years and will reach saturation in 2028. The company’s growth started in 2014, so the inflection point is in 2021, and the actual company number in 2021 is 4737. Equation (7) shows that the parameters d = 7 and b = 8042 can be obtained. These parameters were substituted into the LG model of Land A, as described in Section 5.2.1. The emulation result of the subsequent company growth for Land A is shown in Figure 13a.
Figure 13.
Company growth emulation results: (a) Land A (2014–2028); (b) Land B (2014–2024); (c) Land C (2014–2028).
The four-year lag is not arbitrary: it is estimated from the historical land–company curves and is treated as a scenario assumption, which is described in Section 5.2.4. The full-development-by-2035 assumption is also a planning target; if development is delayed, the company growth curve shifts right and may saturate lower.
Similarly, Land B’s land development reached saturation in 2020, and the company growth reached saturation in 2024. The company’s growth started in 2014, so the inflection point is in 2019, and the actual company number in 2019 is 525. Therefore, the parameters d = 5 and b = 780 can be obtained. These parameters were substituted into the LG model of Land B described in Section 5.2.2. The emulation result of the subsequent company growth for Land B is shown in Figure 13b.
Similarly, assuming that the land development of Land C reached saturation in 2024, and the company’s growth will reach saturation in 2028, the company growth started in 2014, so the inflection point is in 2021, and the actual company number in 2021 is 4301. Therefore, the parameters d = 7 and b = 7096 can be obtained. These parameters were substituted into the LG model of Land C described in Section 5.2.2. The emulation result of the subsequent company growth for Land C is shown in Figure 13c.
The future projections in this subsection are scenario simulations rather than validated forecasts. The assumptions include: (i) Land A reaching land development saturation by 2035; (ii) a four-year lag between land development saturation and company growth saturation; and (iii) unchanged a and c with scenario-adjusted b and d. These assumptions are derived from planning targets and observed historical patterns across the three parks, but they have not been statistically tested or independently validated.
5.2.4. Land Development Change and Company Growth
The actual land development areas of Lands A, B and C per year were obtained by manually labeling the satellite images. By comparison with the emulation results of company growth, the relationships between land development change and company growth were obtained and are shown in Figure 14.
Figure 14.
Relationships between land development change and company growth: (a) Land A; (b) Land B; (c) Land C.
To avoid relying on visual impression alone, the lag is quantified as the time difference between the years when the land development curve and the company growth curve reach 50% of their respective saturation levels. Based on this calculation, it takes approximately 4 years for Land A, Land B and Land C. This quantified lag time is used as the baseline scenario in Section 5.2.3. This four-year lag is a descriptive estimate based on the 50% saturation timing, not a statistically validated causal lag; no confidence interval or uncertainty analysis was conducted. It is used only as a scenario assumption and should not be treated as a reliable predictor without further temporal validation.
6. Discussion
6.1. Industrial Park Land Simulation Analysis
From the regression coefficients of the LR model in different lands, it can be found that the essential features of land development simulation in Land A are the DEM, main road, bridge in island, and main highway. The important features in Land B are the bridge in island, main highway, and relief road. The important features in Land C are the main highway, main road, market and relief road. We observe differences and similarities in the important features of land development simulation in the different land areas. The features with high contributions mainly include main highways, main roads, relief roads, and bridges in island. Land C is located in Shanghai, and the geographical characteristics of Shanghai and Xiamen are different, i.e., there are no cross-sea bridges in Shanghai. Therefore, when comparing Land C to Land A, Land C does not have the features of bridge in and out islands. Therefore, when transferring the LR model of Land C to Land A for land development probability prediction, it was also necessary to remove these two features of Land A to ensure the effectiveness and accuracy of the model transfer.
According to the land development simulation results for 2017 and the OA and FOM indicators generated by CA iteration using different LR models, as shown in Figure 7, the OA and FOM based on the model of Land B are slightly lower than those of the model of Land A, while the FOM based on the model of Land C is slightly higher than that of Land A’s own model (0.2911 vs. 0.2892). This outcome may reflect shared drivers, but it may also reflect coarse pattern similarity [53]. The baseline comparison outlined above was not executed in this study. Accordingly, the cross-park transfer results cannot distinguish shared drivers from coarse pattern similarity; they should be interpreted only as preliminary evidence of conditional transferability. A distance-to-nearest-main-road baseline remains a required test before claims of shared drivers or operational transfer can be supported. Moreover, although the OA is around 0.90, the FOM is only about 0.23–0.29, indicating that the model’s ability to accurately predict the exact locations of real changes can be further improved. This is mainly because changed pixels account for a small proportion of the study area, unchanged pixels dominate OA, and industrial park changes are fragmented and spectrally confused [8]. The FOM values are comparable to existing studies at different spatial scales [4], indicating acceptable performance for planning support. In short, the results support the feasibility of transfer learning and land development simulation using the models in different lands. In future work, the method may be tested by transferring existing models to new land areas after feature matching and local recalibration; however, the present results do not yet demonstrate operational transferability to unobserved parks. The framework should currently be viewed as a planning-support scenario tool rather than as a validated forecasting system.
This study also attempted to determine the number of converted pixels for future-land-development simulation based on the total planned building area of Land A, which demonstrates that the CA algorithm can be applied to continue the iteration based on the result shown in Figure 5a so as to predict future-land-development simulation results.
However, important limitations remain: multicollinearity among distance features was not diagnosed, CA parameter sensitivity was not tested, and no independent spatial/temporal validation or empirical comparison with RF/SVM/alternative CA forms was performed. The reported OA/FOM and transfer results should therefore be interpreted as calibration and preliminary transfer diagnostics, not as evidence of robust out-of-sample predictive skill.
6.2. Industrial Park Company Growth Emulation Analysis
By emulating the company growth in Lands A, B and C and transferring the LG models of Lands B and C to Land A (by modifying parameters c and d), as shown in Figure 12, it can be found that compared to the LG model of Land A, the parameters c and d in the LG model of Land B are larger and smaller, respectively, while the parameters c and d in the LG model of Land C are smaller, but the inflection point (d) is closer. The company growth patterns in Land C and Land A are more similar. In general, the emulation results based on the transfer models and the model of Land A have small errors and are similar to a certain extent, which provides preliminary evidence of conditional transferability, rather than proof of general feasibility. Evidence for transferring c and d is likewise preliminary: only three parks were available for analysis, and the LG parameters were not validated on independent parks or future years. The four-year land–company lag is a scenario assumption, not a statistically estimated parameter.
For the same land space, different types of companies exhibit the same overall LG growth patterns but differ in time and growth numbers, which merits further studies. Based on the company growth emulation results for the different industries of Land A, as shown in Figure 10, the following conclusions can be drawn: the industries with larger parameter values of a + b (company capacity) are the software industry, the wholesale and retail industry, and other industries; the industries with larger parameter values of c (growth rate) are the business service industry, wholesale and retail industry, and technology service industry; the industries with smaller parameter values of d (inflection point) are the technology service industry, manufacturing industry, and software industry. After further analysis, it can be found that there are some internal patterns in the industry development of Land A: (1) In terms of the relationship between the software industry, technology service industry, and business service industry, the technology service industry develops first, providing infrastructure for the software industry. After the software industry reaches a specific scale, then the business service industry begins to grow, providing business services such as marketing, financial management, and investment management for the software industry. (2) The development of the wholesale and retail industry is relatively good, second only to the software industry, which could be related to the policies introduced in Xiamen in recent years to promote the development of e-commerce. (3) The manufacturing industry and other industries are not the dominant sectors in Land A, and their growth is relatively less prominent.
Future company growth can be emulated based on land development changes. By comparing the actual land development change areas of these lands with the company growth simulation results, as shown in Figure 14, it is concluded that both the land development and company growth exhibit a logistic pattern growth curve [50], and the company growth curves lags behind the land development change curve generally. This phenomenon is in line with the reality.
The results in Section 5.1 and Section 5.2 should be distinguished from the assumptions used for projection. The CA/LR and LG calibrations are empirical results for the three parks. In contrast, the four-year lag, full development by 2035, and use of logistic growth as a general pattern for other parks are working assumptions. These assumptions are necessary for scenario construction but should not be interpreted as validated findings.
6.3. Limitations and Future Research
The absence of independent validation has three implications. Interpretively, the OA/FOM and LG errors reflect calibration or transfer fit rather than forecast accuracy. In terms of generalizability, the findings are limited to the three parks and observed periods, and transfer to new parks or future years remains conditional. Practically, the outputs should inform scenario comparison and planning deliberation; they should not inform regulatory, investment, or land supply decisions unless accompanied by local calibration, baseline comparison, independent spatial or temporal validation, and uncertainty analysis.
In terms of land development simulation, due to the exponential curve variation of urban development, the converted number of CA models in different years during the land development process may be different. In the future, the land-use data during the iteration period can be annotated to obtain the actual changed area and converted numbers of the developed zone each year. Then, the converted number during the CA iteration process can be continuously adjusted based on the actual changes so the simulation results are closer to the real land development situation. In the future, we will check multicollinearity between feature variables before LR model training to support coefficient interpretability [54], conduct sensitivity analysis on the neighborhood size, stochastic perturbation, conversion rate, and number of CA iterations [35,36], and compare LR with alternative transition rule algorithms, such as RF and CART, under consistent criteria (OA, FOM, and transition matrix consistency) to attempt to improve the real-change prediction accuracy. In addition, we will also attempt a spatially independent validation of the model, such as spatial blocks or geographically separated sampling areas, in order to avoid possible accuracy inflation caused by adjacent pixels.
In terms of company growth, due to difficulties in obtaining data and limitations in data sources, this study only emulates the company numbers for 7 years and predicts their subsequent growth trends. In the future, we will conduct temporal validation by collecting real data from subsequent years and evaluate the uncertainty of the LG model’s predictive performance. For logistic function, the b and d values and the four-year lag in future-company-growth emulation are scenario assumptions, not empirically confirmed constants, because the parks have not reached saturation. Full land development may also be delayed. Future work should conduct statistical testing to confirm these assumptions, such as validating them with subsequent real data, testing more lag scenarios, and including delay probabilities in the projection. Then, efforts can be made to emulate additional dimensions of industrial data or indicators, such as GDP or number of employees. LG modeling analysis can be conducted to fully illustrate the influencing factors and development patterns of industrial growth. Moreover, as the number of companies grows, so-called “unicorn” companies may excel, which, in turn, would impact the ecosystem, which often happens among leading innovation areas worldwide [55,56]. In addition, for this study, we assumed that the land space of a selected industrial park was constructed as planned and is fully utilized, which is true in an uptick under normal development phases. We hypothesize that it will be interesting to study and simulate when land space is not fully used; company growth may plateau or even decline.
The land simulation and company growth in this study mainly focused on Land A. At the same time, the models of Lands B and C were transferred to Land A for comparative analysis to provide preliminary evidence of model transfer learning between different lands. In the future, we intend to collect datasets for Lands A, B and C up to the latest years (e.g., 2025, 2026) in order to integrate more temporal data into the land simulation and company growth modeling, which will benefit the proposed LSGP framework. Moreover, we intend to refer to the practice of Land A, conduct more in-depth analysis on Lands B and C, and present their land development simulation results. In addition, we intend to apply the proposed method to additional industrial parks, as well as urbanization predictions based on township development, to further demonstrate the general regularity of industrial park development and the widespread applicability of this study.
7. Conclusions
To effectively plan and develop industrial parks, it is essential to thoroughly understand the fundamental principles and growth dynamics underlying industrial park practices. By harnessing advanced digital technologies, such as high-resolution satellite imagery and accumulating historical data, it becomes feasible to create mathematical models that simulate the growth of industrial parks with enhanced precision at finer scales. In this study, we develop an industrial park land development simulation and company growth projection (LSGP) framework by setting up CA and logistic function models. We applied the LSGP framework to industrial parks in Xiamen and Shanghai, and the results suggest that the LSGP framework can reproduce calibration-period industrial park land expansion and company growth patterns and serve as a planning-support scenario tool, although its predictive ability is subject to several limitations. Benefiting from state-of-the-art remote sensing and big data technologies, this study contributes to filling the gap in both land-use simulation and company growth projection at the industrial park scale. The main findings are as follows. First, the land use across the selected industrial parks follows similar patterns. Key factors influencing land use are similar, such as traffic convenience and adjacency to key centers. Secondly, the company growth patterns within the selected industrial parks follow a logistic function curve, with each subgroup of companies also following a similar pattern. Thirdly, the results provide preliminary evidence of conditional transferability from one industrial park to another, but this transferability still requires independent spatial/temporal validation and baseline comparison; case-based studies can therefore only be tentatively applied to newly planned industrial parks. However, the CA model showed high OA but a relatively low FOM, indicating that its ability to predict the exact locations of real land changes can be improved. The logistic pattern was observed only in the three selected parks; therefore, further verification is necessary before transferring the model to more industrial parks. In addition, the future projections are scenario-based and have not been fully validated with independent temporal and spatial data. Because multicollinearity among distance features, CA parameter sensitivity, independent spatial/temporal validation, and empirical comparisons with alternative models were not addressed in this study, the reported transferability and future projections remain preliminary and conditional. The framework should therefore be used as a planning-support scenario tool rather than as an operational forecasting system. Accordingly, the conclusions are limited to calibration-period reproduction and preliminary conditional transferability; operational use requires independent validation. These findings provide insights into optimizing the planning and design of industrial parks and highlight their potential underlying growth principles. The proposed LSGP framework may be further developed to simulate various land-use projects and emulate growth patterns for newly selected criteria.
Author Contributions
Conceptualization, X.W.; methodology, X.W. and X.L. (Xuecao Li); formal analysis, X.W., X.L. (Xuecao Li), X.L. (Xianyao Ling) and B.C.; writing—original draft preparation, X.W., X.L. (Xianyao Ling) and K.L.; writing—review and editing, X.L. (Xuecao Li), B.C. and P.G.; software, X.L. (Xuecao Li), X.L. (Xianyao Ling) and K.L.; investigation, X.W., X.L. (Xuecao Li) and B.C.; resources, X.W. and P.G.; data curation, X.L. (Xianyao Ling), B.C. and K.L.; visualization, X.W., X.L. (Xianyao Ling) and K.L.; supervision, X.W.; funding acquisition, P.G. and X.W. All authors have read and agreed to the published version of the manuscript.
Funding
This research was funded by the City Digital Appraisel research project and High-Resolution GIS Study for the Urban Management Phase II project established by the Ministry of Housing and Urban Rural Development of the People’s Republic of China.
Institutional Review Board Statement
Not applicable.
Informed Consent Statement
Not applicable.
Data Availability Statement
The data presented in this study are available upon request from the corresponding author. The data are not publicly available due to privacy.
Acknowledgments
This research was supported by the Department of Automation, AI for Earth Laboratory, Cross-strait Tsinghua Research Institute, Tsinghua University. We express our appreciation to Jun Li for his guidance for the modeling study, and to our colleague Gang Yin in the laboratory for his support of the field inspection and software preparation.
Conflicts of Interest
The authors declare no conflicts of interest.
References
- Long, H.; Qu, Y.; Tu, S.; Zhang, Y.; Jiang, Y. Development of land use transitions research in China. J. Geogr. Sci. 2020, 30, 1195–1214. [Google Scholar] [CrossRef] [Scilit]
- Fan, P.; Yue, W.; Zhang, J.; Huang, H.; Messina, J.; Verburg, P.H.; Qi, J.; Moore, N.; Ge, J. The spatial restructuring and determinants of industrial landscape in a mega city under rapid urbanization. Habitat Int. 2020, 95, 102099. [Google Scholar] [CrossRef] [Scilit]
- Seto, K.C.; Güneralp, B.; Hutyra, L.R. Global forecasts of urban expansion to 2030 and direct impacts on biodiversity and carbon pools. Proc. Natl. Acad. Sci. USA 2012, 109, 16083–16088. [Google Scholar] [CrossRef] [Scilit] [PubMed]
- Liu, X.; Liang, X.; Li, X.; Xu, X.; Ou, J.; Chen, Y.; Li, S.; Wang, S.; Pei, F. A future land use simulation model (FLUS) for simulating multiple land use scenarios by coupling human and natural effects. Landsc. Urban Plan. 2017, 168, 94–116. [Google Scholar] [CrossRef] [Scilit]
- Gao, J.; O’Neill, B.C. Mapping global urban land for the 21st century with data-driven simulations and Shared Socioeconomic Pathways. Nat. Commun. 2020, 11, 2302. [Google Scholar] [CrossRef] [Scilit] [PubMed]
- Angel, S.; Parent, J.; Civco, D.L.; Blei, A.; Potere, D. The dimensions of global urban expansion: Estimates and projections for all countries, 2000–2050. Prog. Plan. 2011, 75, 53–107. [Google Scholar] [CrossRef] [Scilit]
- Verburg, P.H.; Soepboer, W.; Veldkamp, A. Modeling the spatial dynamics of regional land use: The CLUE-S model. Ecol. Model. 2002, 154, 101–118. [Google Scholar]
- Amine, J.; Mohcine, C.; Jaouad, E.; Soufiane, H.; Abdessamad, J. A new index for extracting built-up land features using Landsat satellite imagery. E3S Web Conf. 2025, 607, 03005. [Google Scholar] [CrossRef] [Scilit]
- Clarke, K.C.; Hoppen, S.; Gaydos, L. A self-modifying cellular automaton model of historical urbanization in the San Francisco Bay area. Environ. Plan. B 1997, 24, 247–261. [Google Scholar] [CrossRef] [Scilit]
- Breiman, L. Random forests. Mach. Learn. 2001, 45, 5–32. [Google Scholar] [CrossRef] [Scilit]
- Batty, M.; Xie, Y. Modeling inside GIS: Part 2—Selecting and calibrating urban models using ARC/INFO. Int. J. Geogr. Inf. Syst. 1994, 8, 451–470. [Google Scholar] [CrossRef] [Scilit]
- Verburg, P.; Nijs, T.; Eck, J.; Visser, H.; Jong, K. A method to analyse neighbourhood characteristics of land use patterns. Comput. Environ. Urban Syst. 2004, 28, 667–690. [Google Scholar] [CrossRef] [Scilit]
- Hansen, M.C.; Loveland, T.R. A review of large area monitoring of land cover change using Landsat data. Remote Sens. Environ. 2012, 122, 66–74. [Google Scholar] [CrossRef] [Scilit]
- Chen, J.; Chen, J.; Liao, A.; Cao, X.; Chen, L.; He, C.; Han, G.; Peng, S.; Lu, M.; Zhang, W. Global land cover mapping at 30 m resolution: A POK-based operational approach. ISPRS J. Photogramm. Remote Sens. 2015, 103, 7–27. [Google Scholar] [CrossRef] [Scilit]
- Yu, L.; Wang, J.; Gong, P. Improving 30 m global land-cover map FROM-GLC with time series MODIS and auxiliary data sets: A segmentation-based approach. Int. J. Remote Sens. 2013, 34, 5851–5867. [Google Scholar] [CrossRef] [Scilit]
- Zhu, Z.; Woodcock, C.E. Continuous change detection and classification of land cover using all available Landsat data. Remote Sens. Environ. 2014, 144, 152–171. [Google Scholar] [CrossRef] [Scilit]
- Jia, W.; Pei, T.; Lei, K. Research on Land Use Planning Based on Multisource Remote Sensing Data. Comput. Intell. Neurosci. 2022, 2022, 5851768. [Google Scholar] [CrossRef] [Scilit] [PubMed]
- Chen, B.; Xu, B.; Gong, P. Mapping essential urban land use categories (EULUC) using geospatial big data: Progress, challenges, and opportunities. Big Earth Data 2021, 5, 410–441. [Google Scholar] [CrossRef] [Scilit]
- Mahendra, H.N.; Pushpalatha, V.; Mallikarjunaswamy, S.; Kumar, D.M.; Ganesha, H.S.; Sudalayandi, R.S.; Rao, T. LULC Classification Using Deep Convolution Neural Networks for Change Detection Analysis. Int. J. Environ. Sustain. Dev. 2026, 25, 98–121. [Google Scholar] [CrossRef] [Scilit]
- Amini, S.; Saber, M.; Rabiei-Dastjerdi, H.; Homayouni, S. Urban Land Use and Land Cover Change Analysis Using Random Forest Classification of Landsat Time Series. Remote. Sens. 2022, 14, 2654. [Google Scholar] [CrossRef] [Scilit]
- Wang, X.; Chen, B.; Li, X.; Zhang, Y.; Ling, X.; Wang, J.; Li, W.; Wen, W.; Gong, P. Grid-Based Essential Urban Land Use Classification: A Data and Model Driven Mapping Framework in Xiamen City. Remote Sens. 2022, 14, 6143. [Google Scholar] [CrossRef] [Scilit]
- Yao, Y.; Li, J.; Zhang, X.; Duan, P.; Li, S.; Xu, Q. Investigation on the Expansion of Urban Construction Land Use Based on the CART-CA Model. ISPRS Int. J. Geo Inf. 2017, 6, 149. [Google Scholar] [CrossRef] [Scilit]
- Swetanisha, S.; Panda, A.R.; Behera, D.K. Land use/land cover classification using machine learning models. Int. J. Electr. Comput. Eng. (IJECE) 2022, 12, 2040–2046. [Google Scholar] [CrossRef] [Scilit]
- Pinto, N.; Antunes, A.P. A Cellular Automata Model Based on Irregular Cells: Application to Small Urban Areas. Environ. Plan. B Plan. Des. 2010, 37, 1095–1114. [Google Scholar] [CrossRef] [Scilit]
- Liu, Y.; Phinn, S.R. Modelling urban development with cellular automata incorporating fuzzy-set approaches. Comput. Environ. Urban Syst. 2003, 27, 637–658. [Google Scholar] [CrossRef] [Scilit]
- Wu, F. Calibration of stochastic cellular automata: The application to rural-urban land conversions. Int. J. Geogr. Inf. Sci. 2002, 16, 795–818. [Google Scholar] [CrossRef] [Scilit]
- Li, X.; Yeh, A.G. Neural-network-based cellular automata for simulating multiple land use changes using GIS. Int. J. Geogr. Inf. Sci. 2002, 16, 323–343. [Google Scholar] [CrossRef] [Scilit]
- Li, X.; Yeh, A.G. Modelling sustainable urban development by the integration of constrained cellular automata and GIS. Int. J. Geogr. Inf. Sci. 2000, 14, 131–152. [Google Scholar] [CrossRef] [Scilit]
- Stevens, D.; Dragićević, S. A GIS-Based Irregular Cellular Automata Model of Land-Use Change. Environ. Plan. B Plan. Des. 2007, 34, 708–724. [Google Scholar] [CrossRef] [Scilit]
- Shubham, B.; Neerav, S.; Munizzah, S.; Kavita, R.D.G. Predictive Modeling of Land Cover Changes in Round-1 Smart Cities of India Using Cellular Automata and GIS. Discov. Cities 2025, 2, 6. [Google Scholar] [CrossRef] [Scilit]
- Irwin, E.G. New Directions for Urban Economic Models of Land Use Change: Incorporating Spatial Dynamics and Heterogeneity. J. Reg. Sci. 2010, 50, 65–91. [Google Scholar] [CrossRef] [Scilit]
- He, C.; Yuanyuan, Z.; Tian, J.; Shi, P. Modeling the urban landscape dynamics in a megalopolitan cluster area by incorporating a gravitational field model with cellular automata. Landsc. Urban Plan. 2013, 113, 78–89. [Google Scholar] [CrossRef] [Scilit]
- Liu, X.; Li, X.; Shi, X.; Zhang, X.; Chen, Y. Simulating land-use dynamics under planning policies by integrating artificial immune systems with cellular automata. Int. J. Geogr. Inf. Sci. 2010, 24, 783–802. [Google Scholar] [CrossRef] [Scilit]
- Li, X.; Yeh, A.G. Data mining of cellular automata’s transition rules. Int. J. Geogr. Inf. Sci. 2004, 18, 723–744. [Google Scholar] [CrossRef] [Scilit]
- Kocabas, V.; Dragićević, S. Assessing cellular automata model behaviour using a sensitivity analysis approach. Comput. Environ. Urban Syst. 2006, 30, 921–953. [Google Scholar] [CrossRef] [Scilit]
- Li, X.; Liu, X.; Yu, L. A systematic sensitivity analysis of constrained cellular automata model for urban growth simulation based on different transition rules. Int. J. Geogr. Inf. Sci. 2014, 28, 1317–1335. [Google Scholar] [CrossRef] [Scilit]
- Zhao, L.; Peng, Z. LandSys: An agent-based Cellular Automata model of land use change developed for transportation analysis. J. Transp. Geogr. 2012, 25, 35–49. [Google Scholar] [CrossRef] [Scilit]
- Shi, W.; Pang, M.Y. Development of Voronoi-based cellular automata -an integrated dynamic model for Geographical Information Systems. Int. J. Geogr. Inf. Sci. 2000, 14, 455–474. [Google Scholar] [CrossRef] [Scilit]
- Chen, Y.; Li, X.; Liu, X.; Ai, B. Modeling urban land-use dynamics in a fast developing city using the modified logistic cellular automaton with a patch-based simulation strategy. Int. J. Geogr. Inf. Sci. 2014, 28, 234–255. [Google Scholar] [CrossRef] [Scilit]
- Hall, B.H. The relationship between firm size and firm growth in the U.S. manufacturing sector. J. Ind. Econ. 1987, 35, 583–606. [Google Scholar] [CrossRef] [Scilit]
- Choi, T.; Rupasingha, A.; Robertson, J.; Leigh, N. The Effects of High Growth on New Business Survival. Rev. Reg. Stud. 2017, 47, 1–23. [Google Scholar] [CrossRef] [Scilit]
- Zhu, H.Y.; Dai, Z.J.; Jiang, Z.R. Industrial Agglomeration Externalities, City Size, and Regional Economic Development: Empirical Research Based on Dynamic Panel Data of 283 Cities and GMM Method. Chin. Geogr. Sci. 2017, 27, 456–470. [Google Scholar] [CrossRef] [Scilit]
- Sime, W.; Eshetu, A.; Shemilis, M. Evaluating economic impact of industrial parks development projects in Ethiopia. SSRN Electron. J. 2021. [Google Scholar] [CrossRef] [Scilit]
- Zhang, P.; Li, J.; Zhang, W. Exploring Firm Decision-Making and Location Strategies in High-Tech Manufacturing Relocation in Beijing: A Lifecycle Perspective. Tijdschr. Voor Econ. Soc. Geogr. 2025, 116, 91–108. [Google Scholar] [CrossRef] [Scilit]
- Ismailov, A.; Kostenko, D.; Pronoza, P. Analysis of the State and Development Tendencies of Industrial Parks in Ukraine. Bus. Inform. 2026, 4, 600–618. [Google Scholar] [CrossRef] [Scilit]
- Potere, D. Horizontal Positional Accuracy of Google Earth’s High-Resolution Imagery Archive. Sensors 2008, 8, 7973–7981. [Google Scholar] [CrossRef] [Scilit] [PubMed]
- d’Angelo, P.; Tian, J. Geometric Evaluation of Gaofen-7 Stereo Data. ISPRS Ann. Photogramm. Remote Sens. Spat. Inf. Sci. 2023, 10–11, 805–811. [Google Scholar] [CrossRef] [Scilit]
- Farr, T.G.; Rosen, P.A.; Caro, E.; Crippen, R.; Duren, R.; Hensley, S.; Kobrick, M.; Paller, M.; Rodriguez, E.; Roth, L.; et al. The Shuttle Radar Topography Mission. Rev. Geophys. 2007, 45, 361. [Google Scholar] [CrossRef] [Scilit]
- Jiang, W.; Chen, Z.; Lei, X.; Jia, K.; Wu, Y. Simulating urban land use change by incorporating an autologistic regression model into a CLUE-S model. J. Geogr. Sci. 2015, 25, 836–850. [Google Scholar] [CrossRef] [Scilit]
- Tsoularis, A.; Wallace, J. Analysis of logistic growth models. Math. Biosci. 2002, 179, 21. [Google Scholar] [CrossRef] [Scilit] [PubMed]
- China National Enterprise Credit Information Publicity System. Available online: https://www.gsxt.gov.cn/index.html (accessed on 18 June 2021).
- OpenStreetMap Nominatim. Available online: https://nominatim.org/ (accessed on 10 April 2023).
- Pontius, R.G.; Millones, M. Death to Kappa: Birth of quantity disagreement and allocation disagreement for accuracy assessment. Int. J. Remote Sens. 2011, 32, 4407–4429. [Google Scholar] [CrossRef] [Scilit]
- Lokanan, M.; Maddhesia, V. Supply chain fraud prediction with machine learning and artificial intelligence. Int. J. Prod. Res. 2025, 63, 286–313. [Google Scholar] [CrossRef] [Scilit]
- Adams, S.B. From orchards to chips: Silicon Valley’s evolving entrepreneurial ecosystem. Entrep. Reg. Dev. 2021, 33, 15–35. [Google Scholar] [CrossRef] [Scilit]
- Hogarth, S. Valley of the unicorns: Consumer genomics, venture capital and digital disruption. New Genet. Soc. 2017, 36, 250–272. [Google Scholar] [CrossRef] [Scilit]
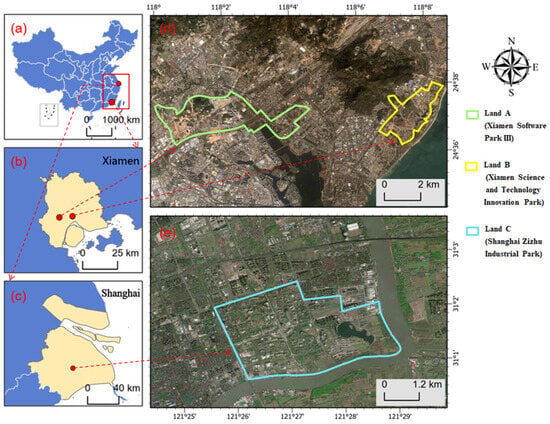
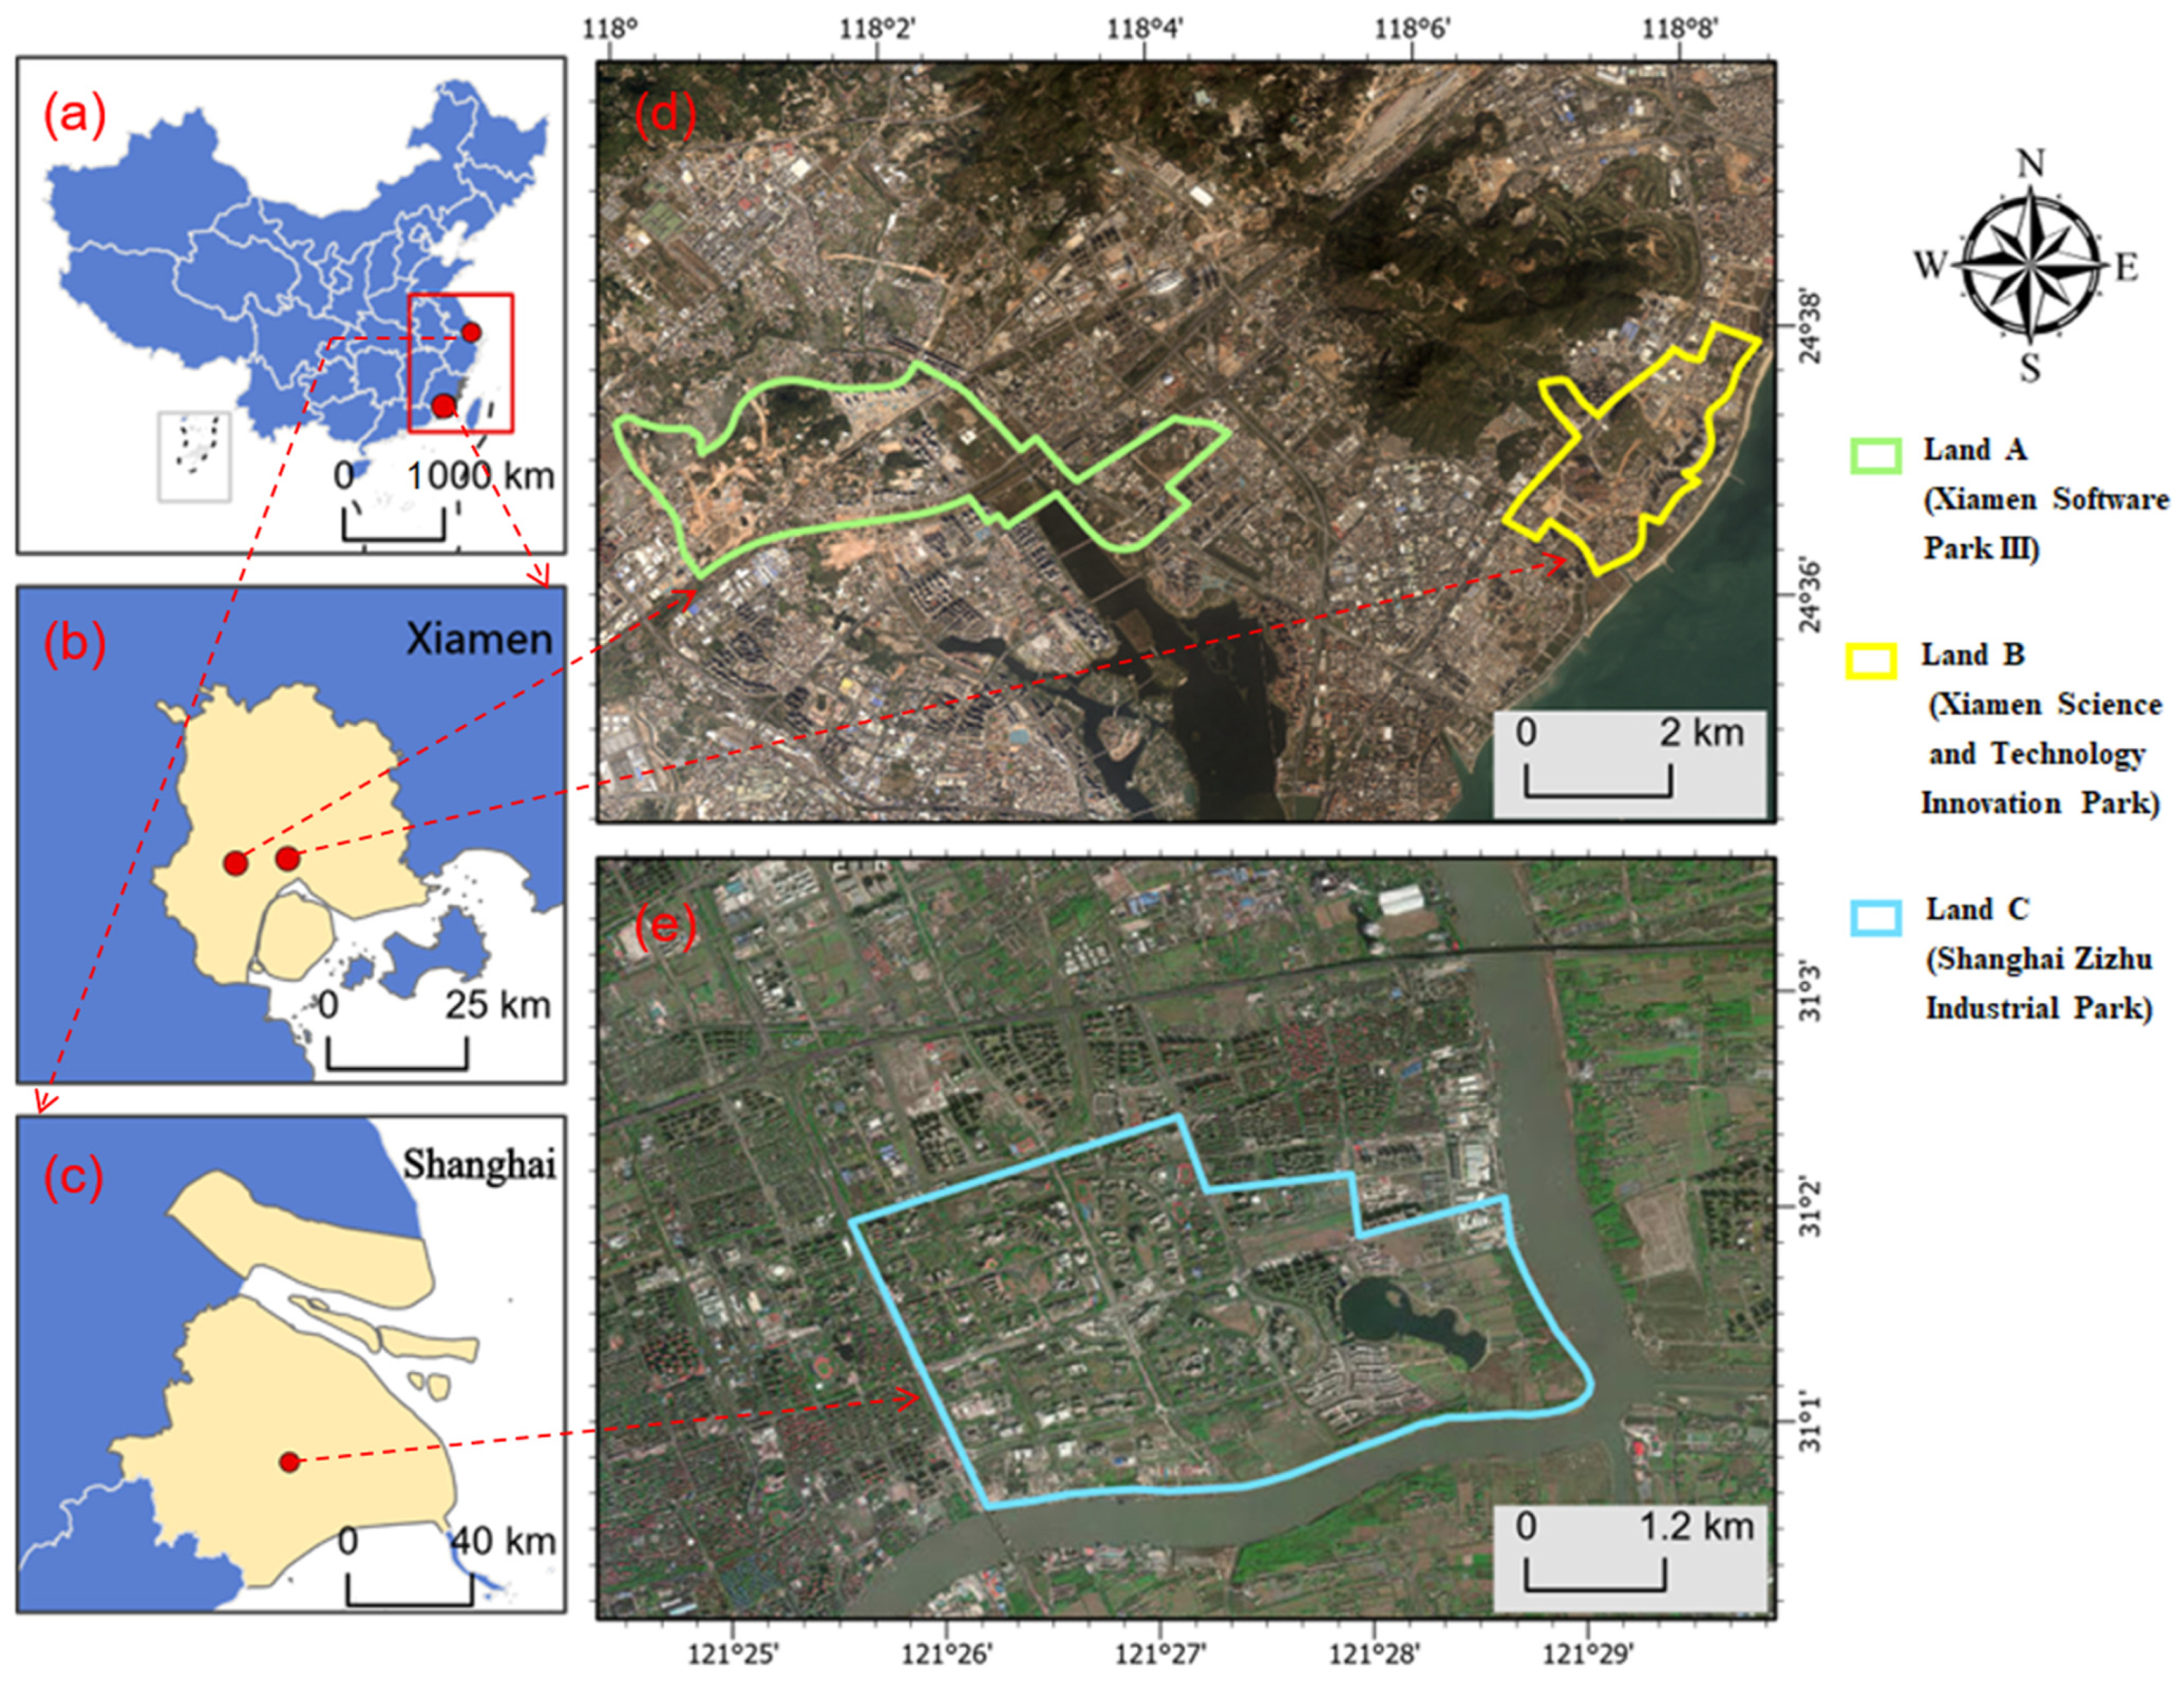
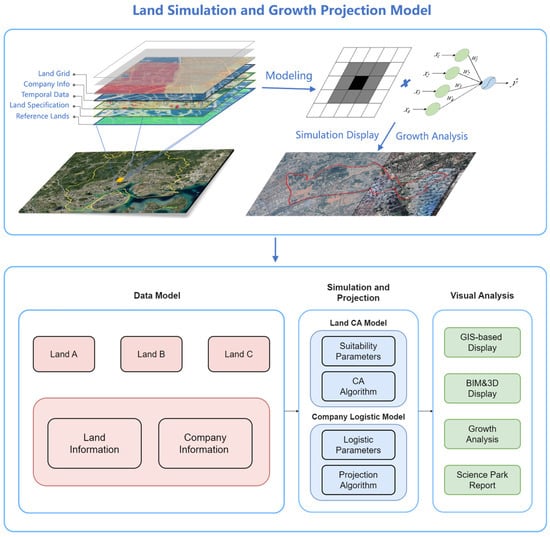
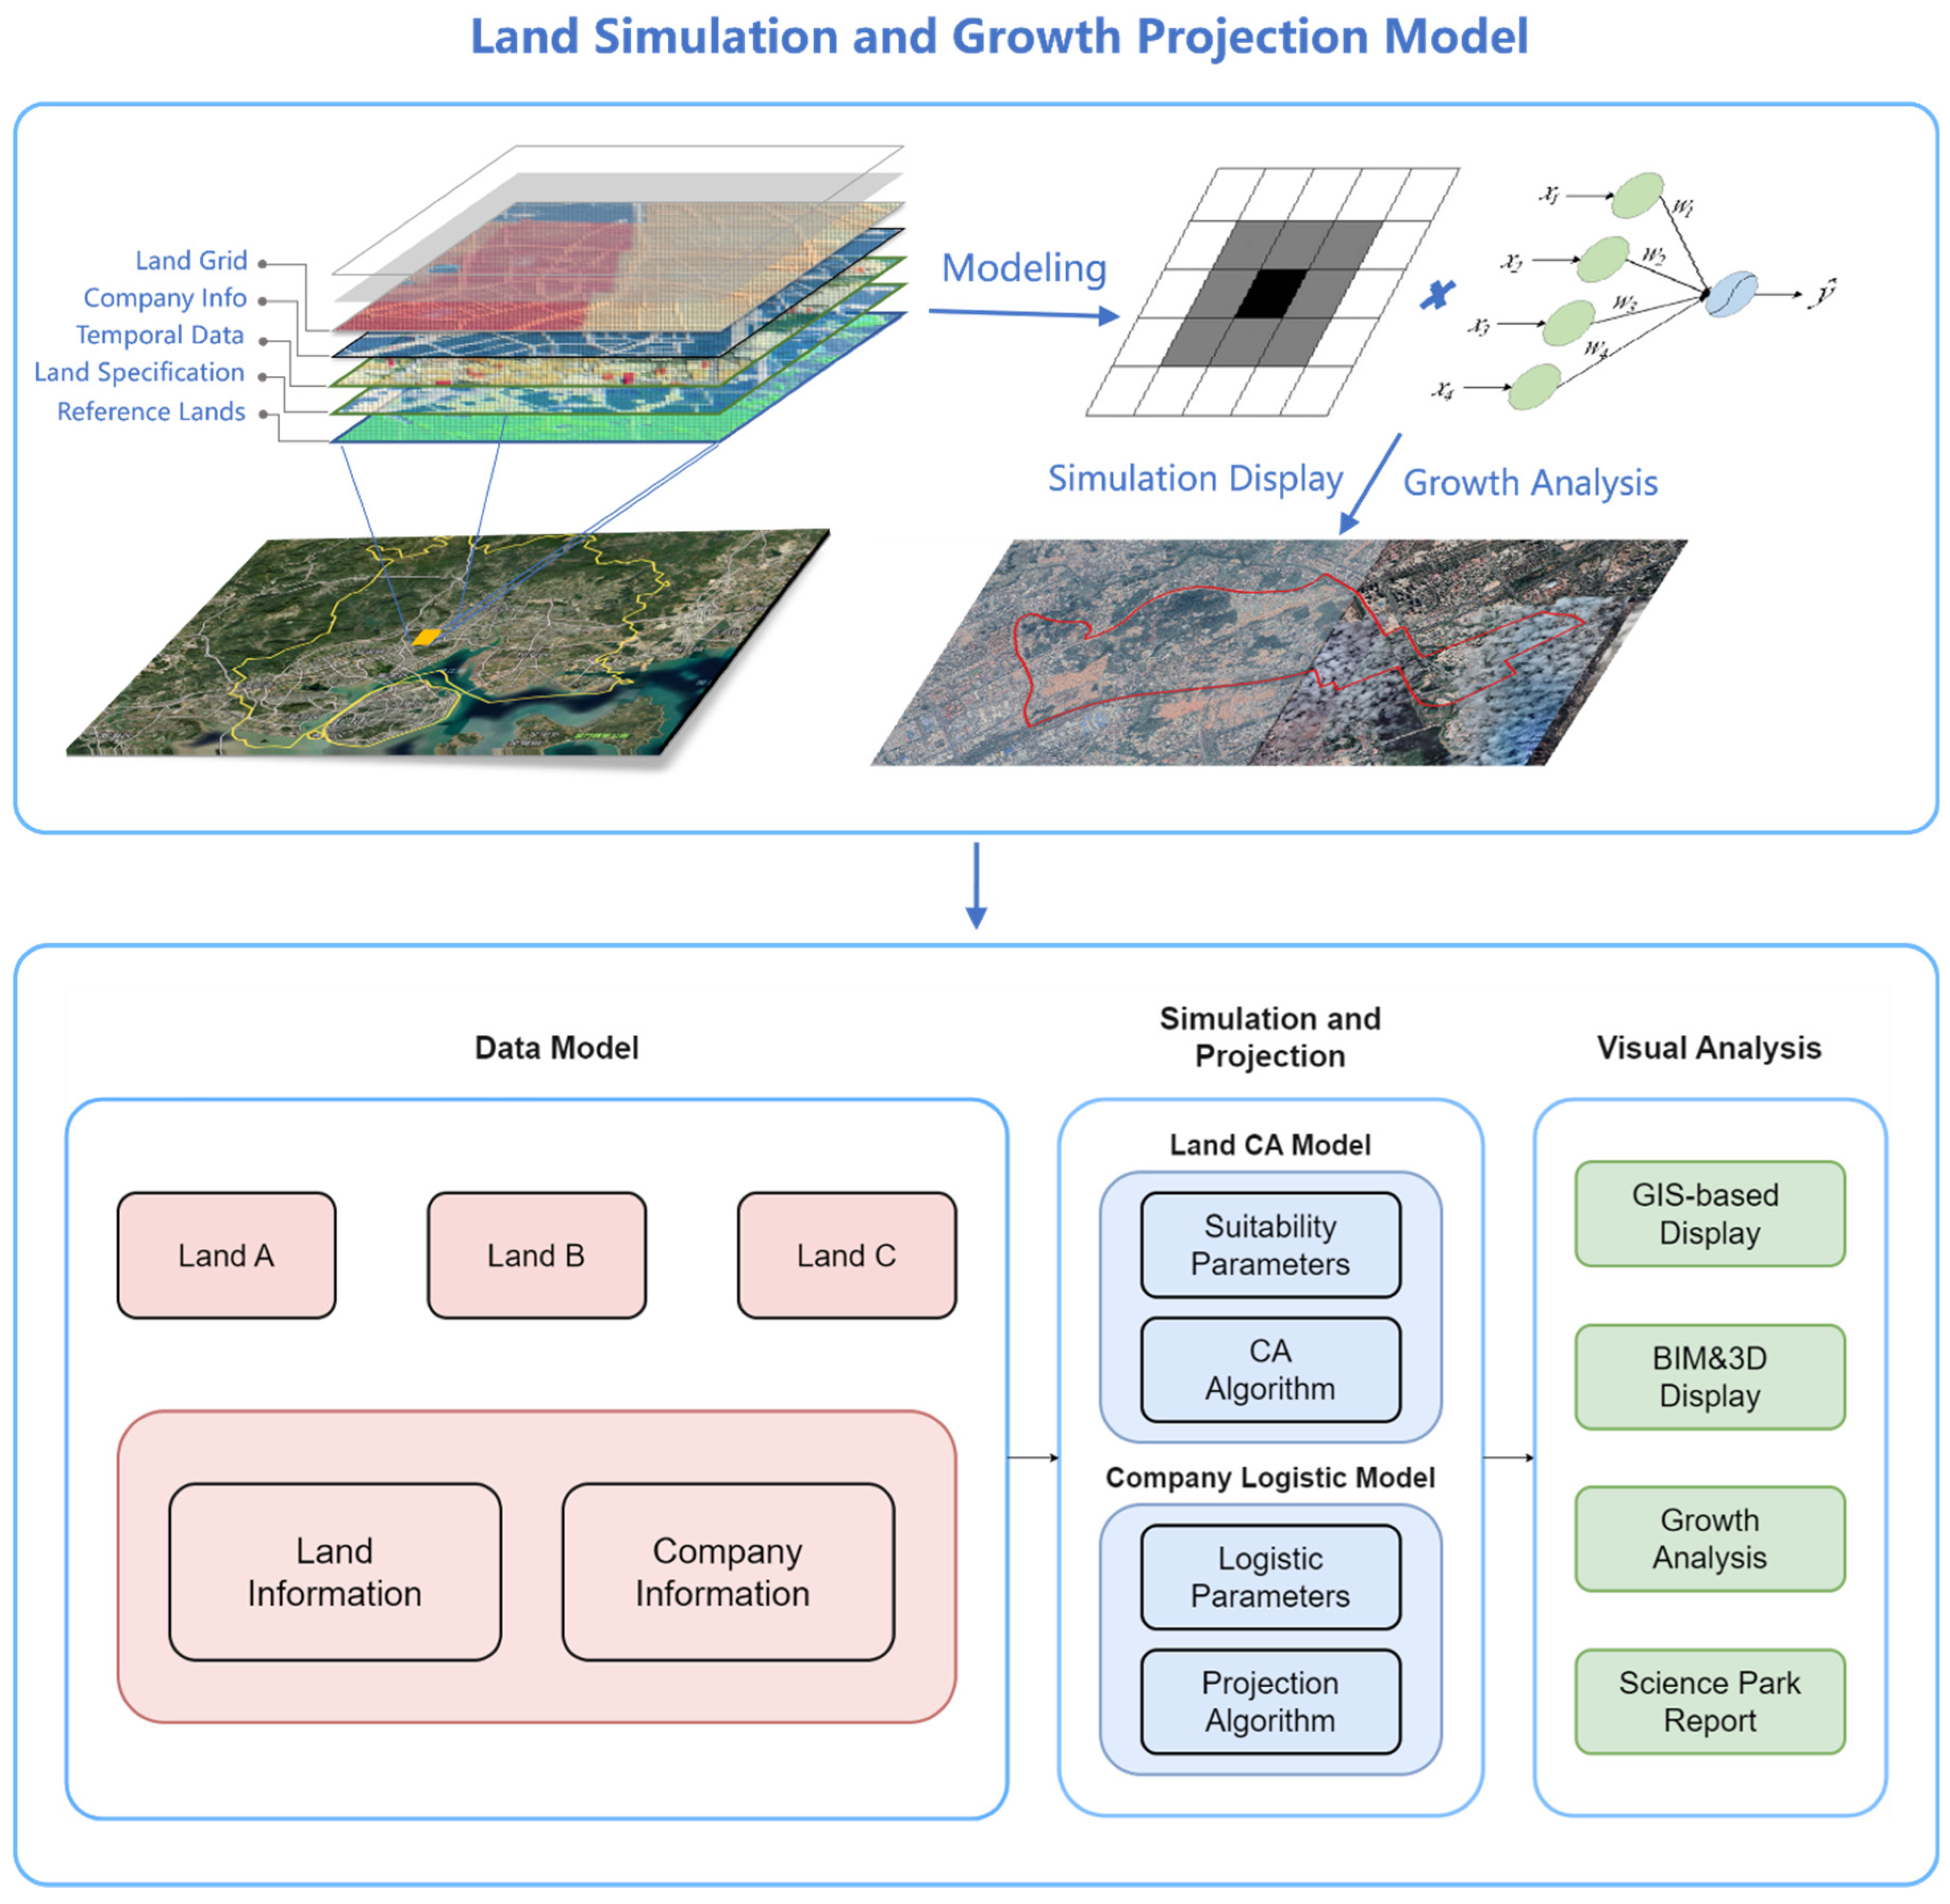
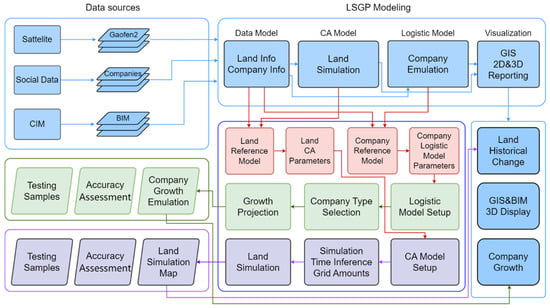
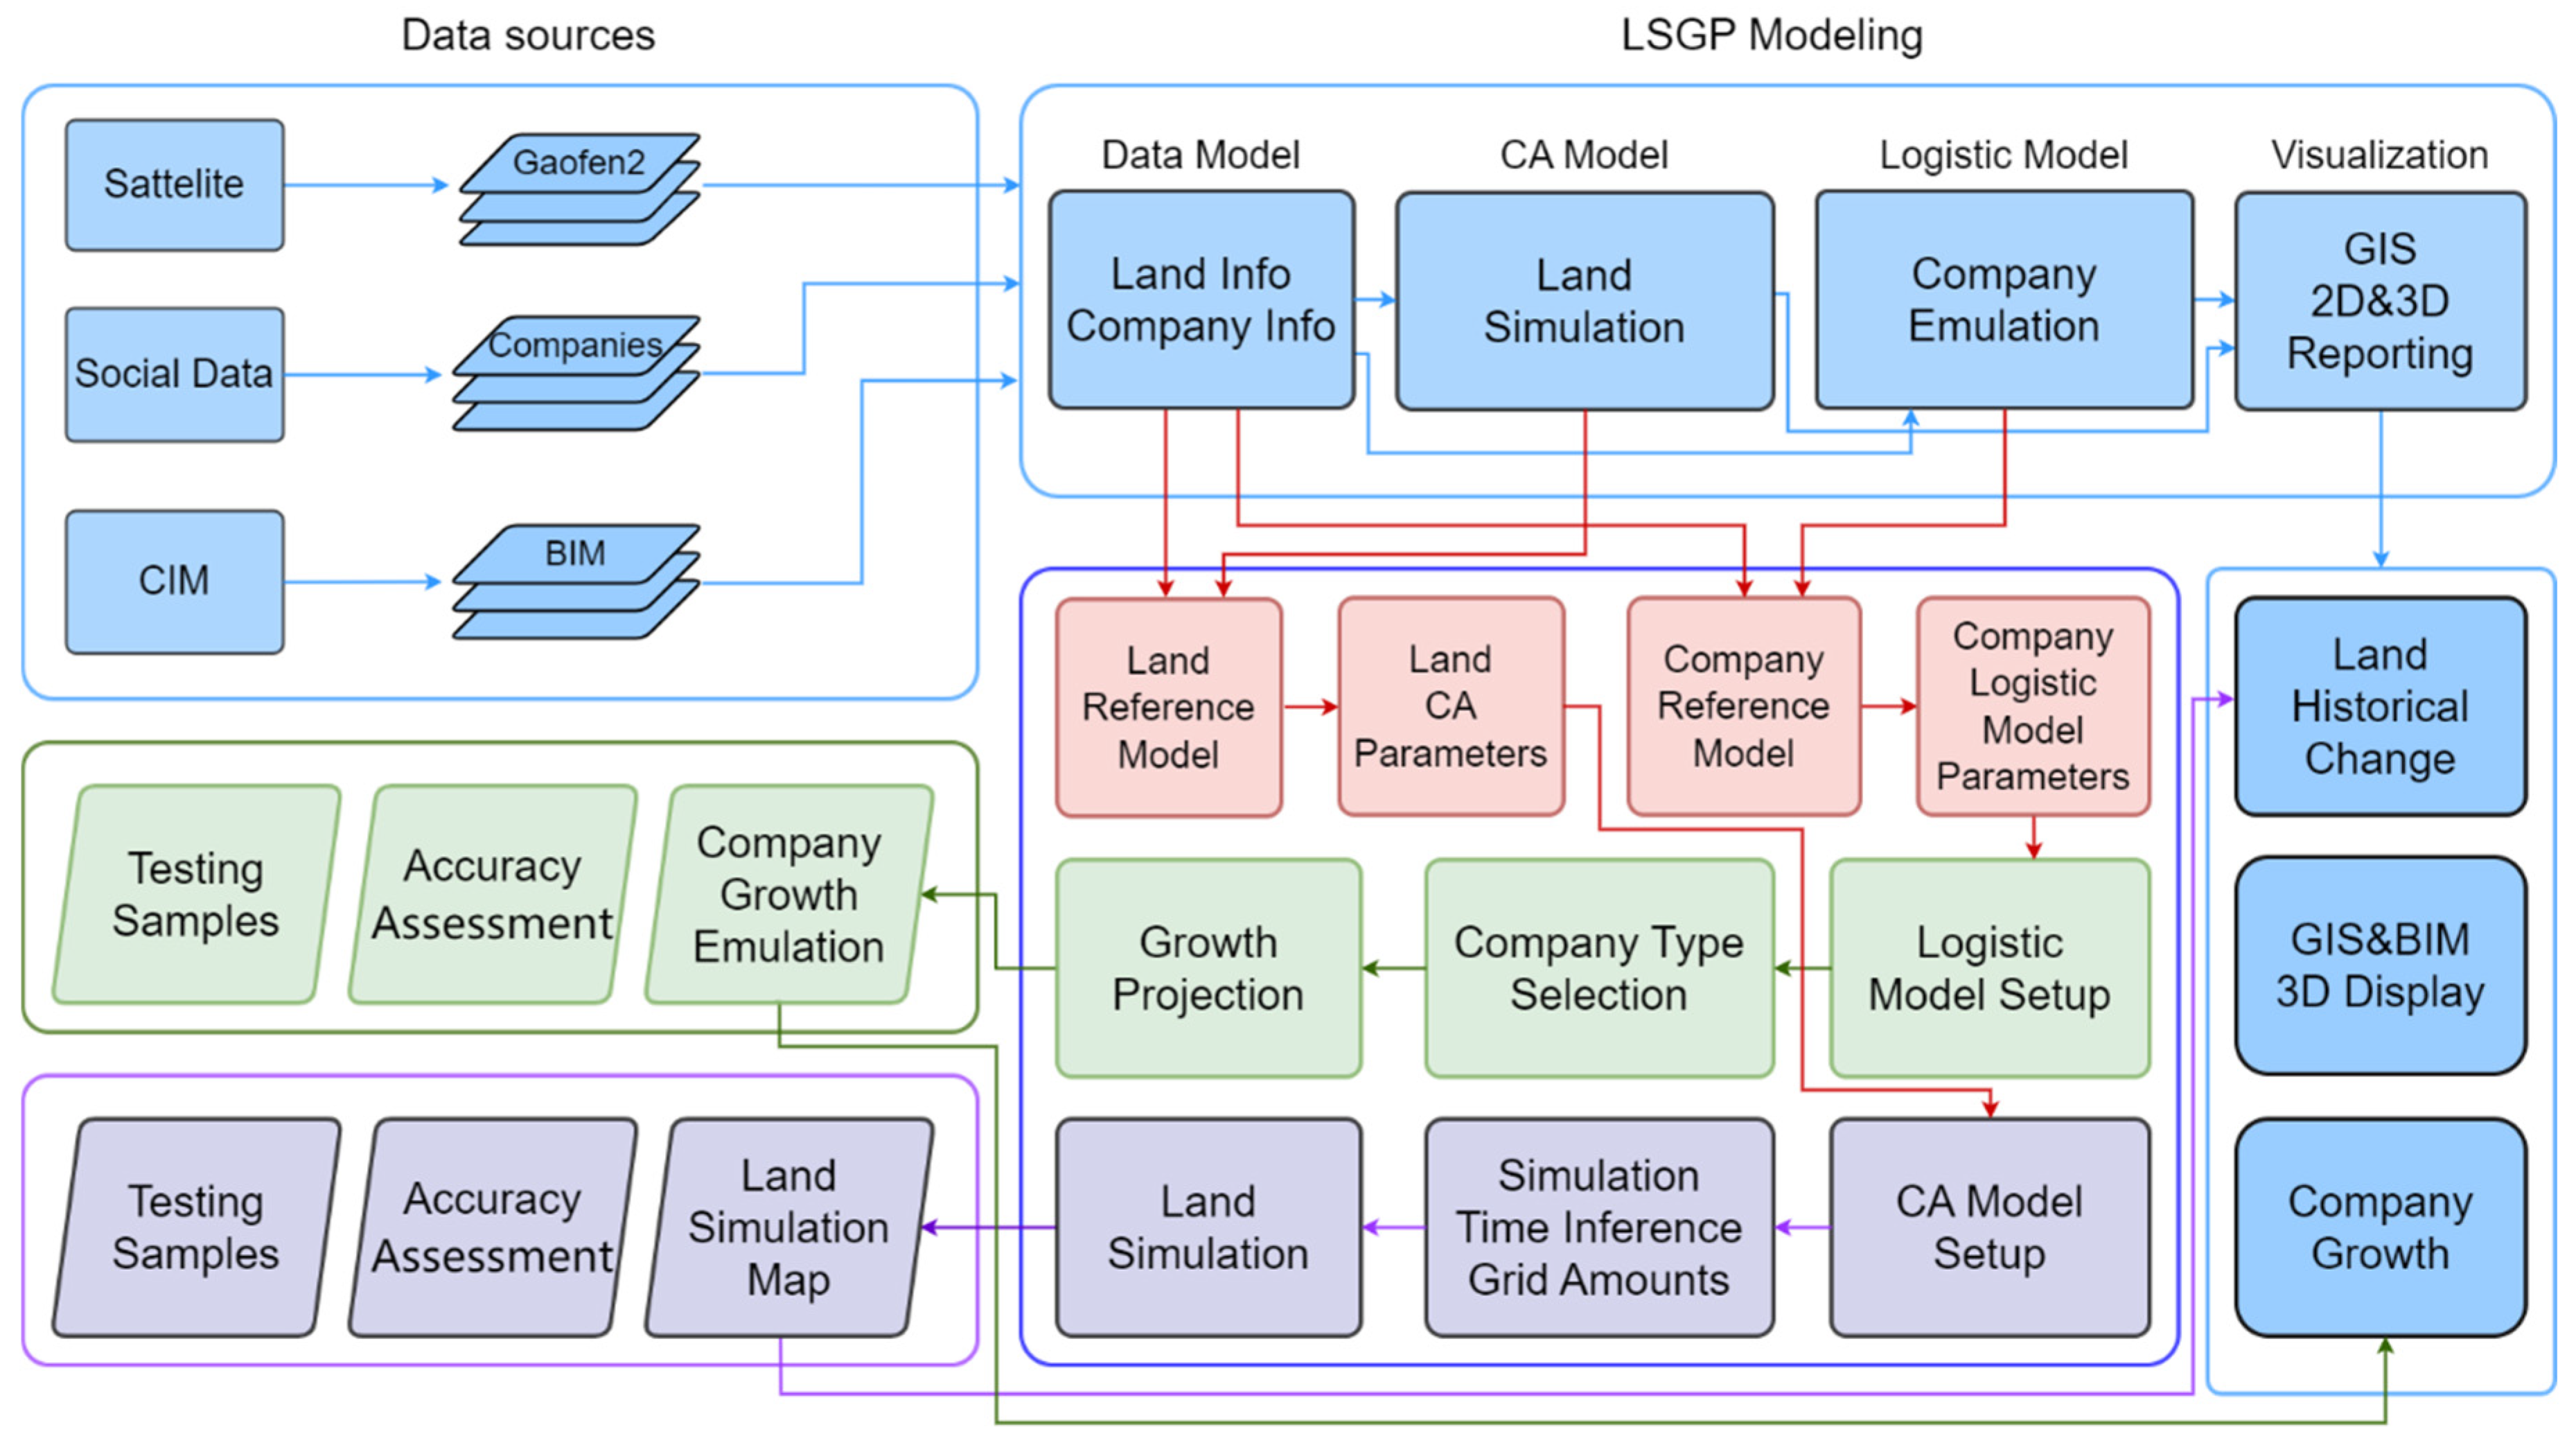
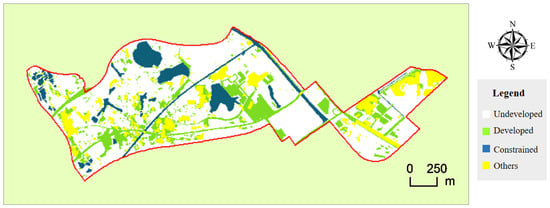
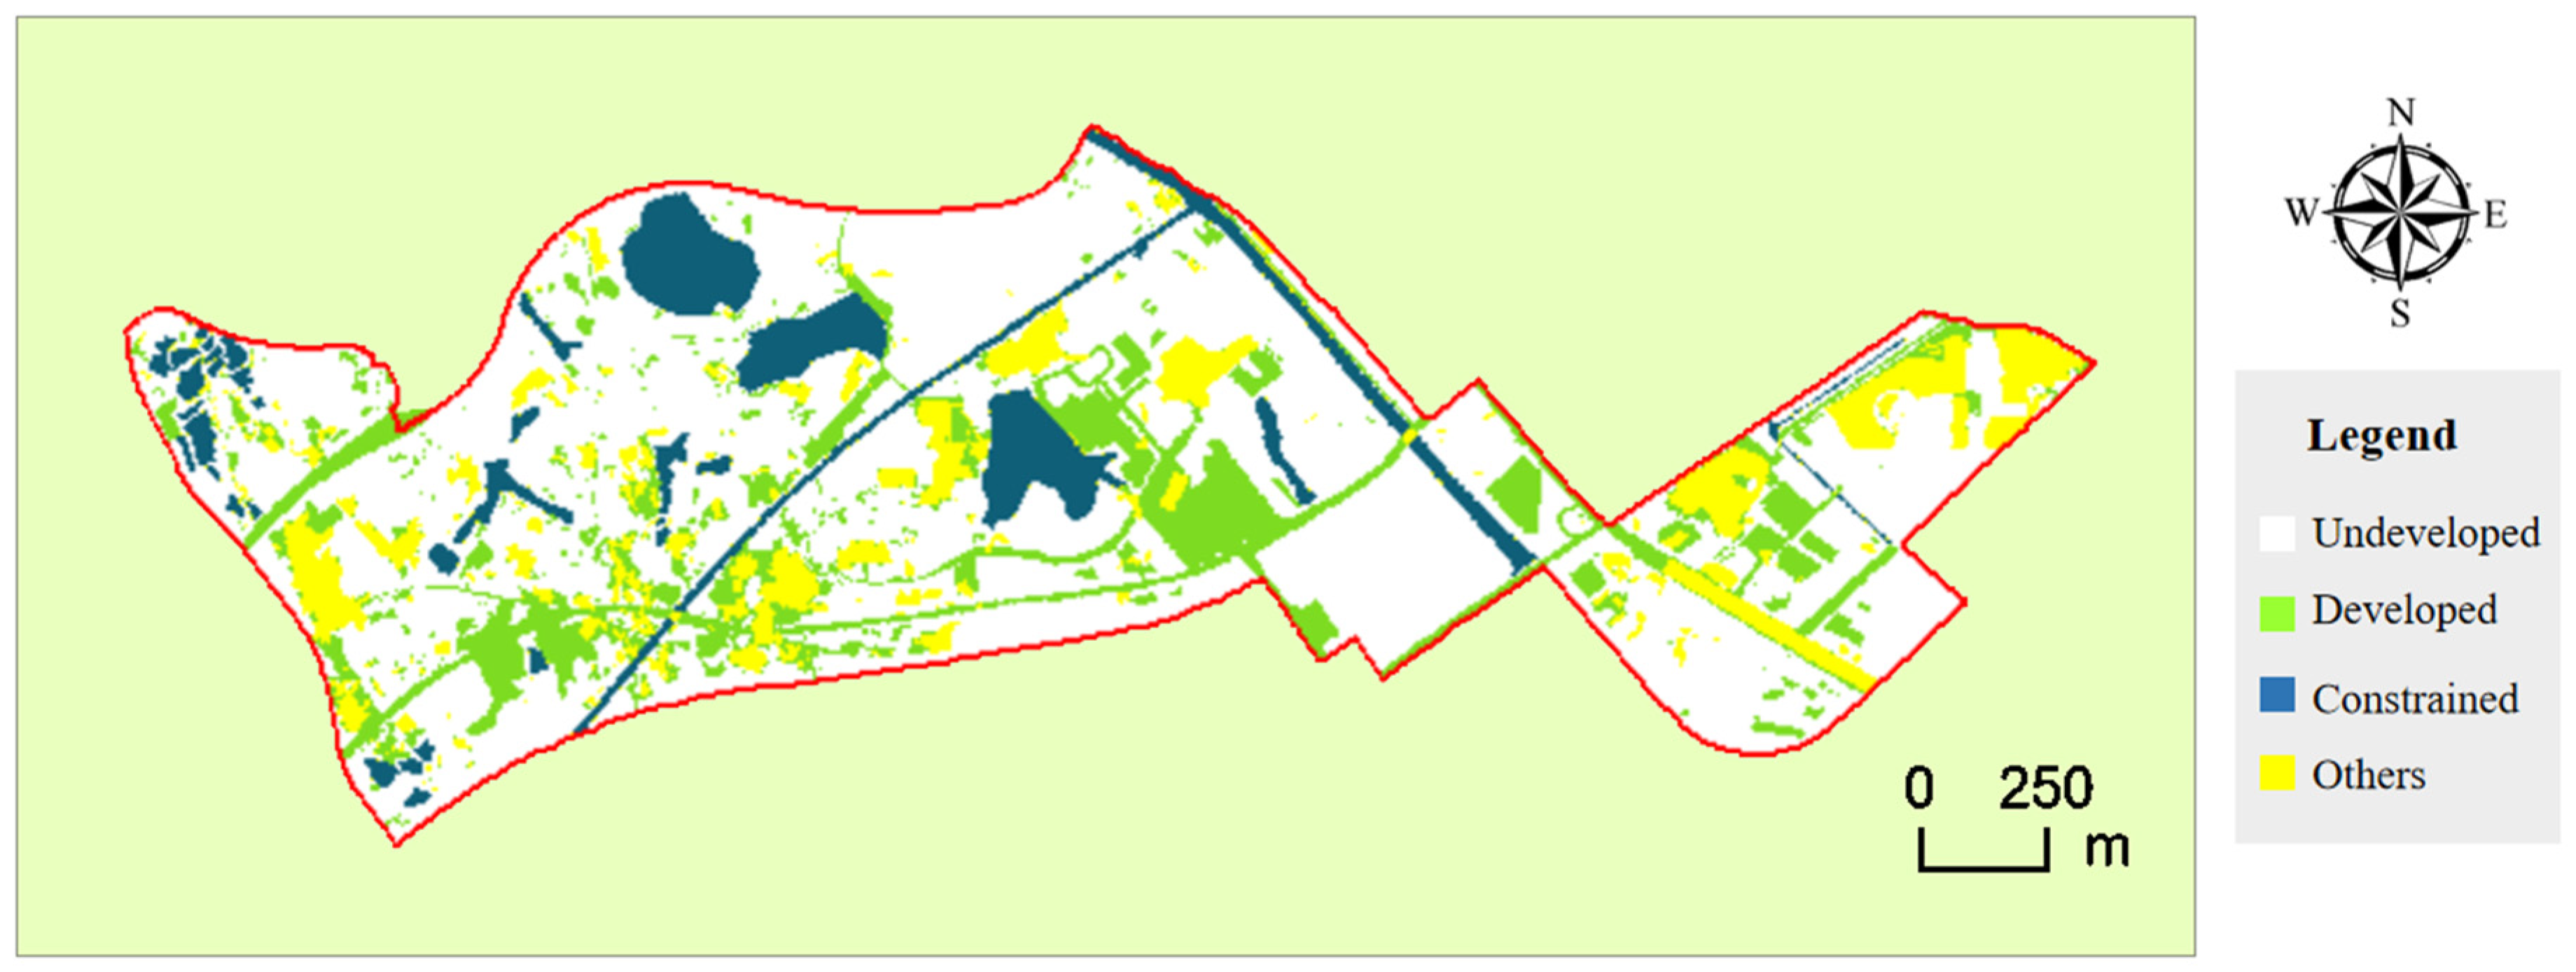
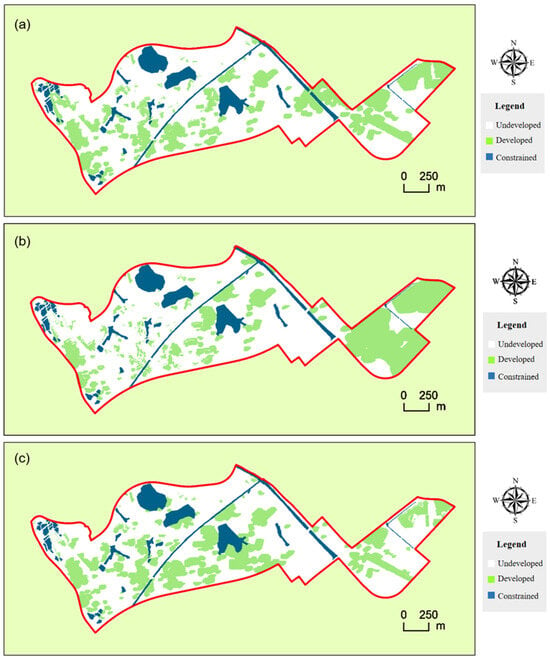
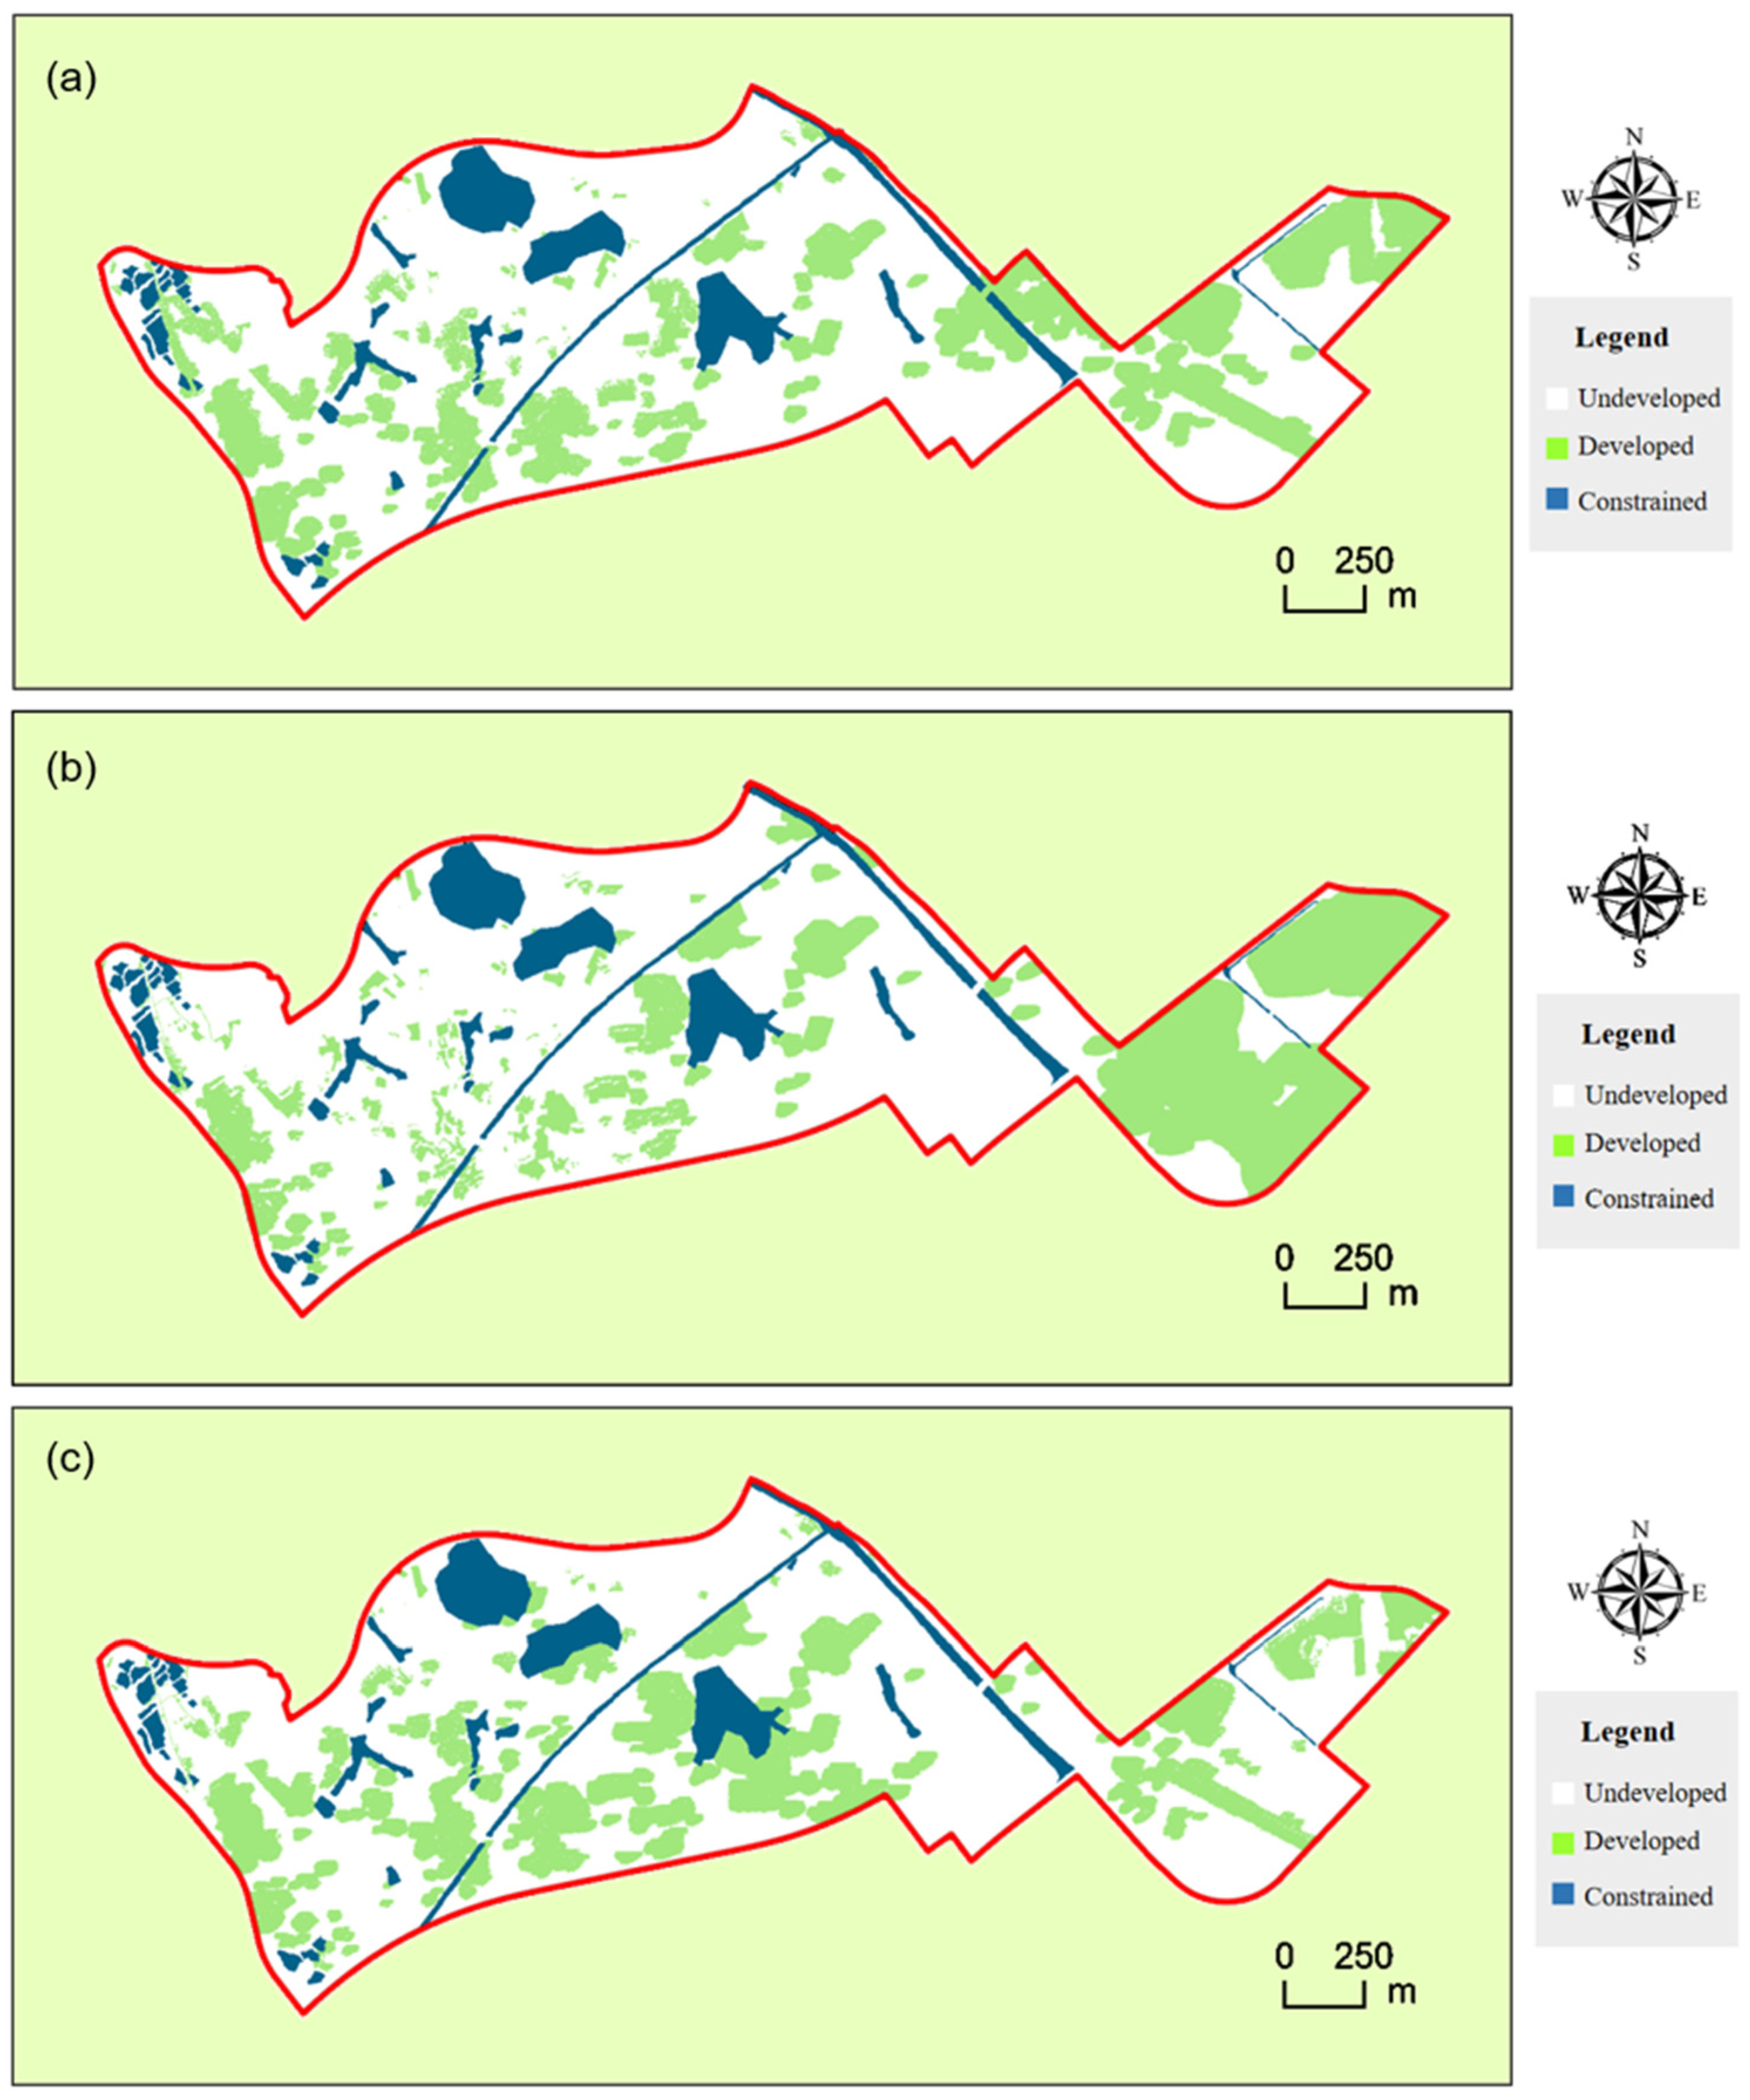
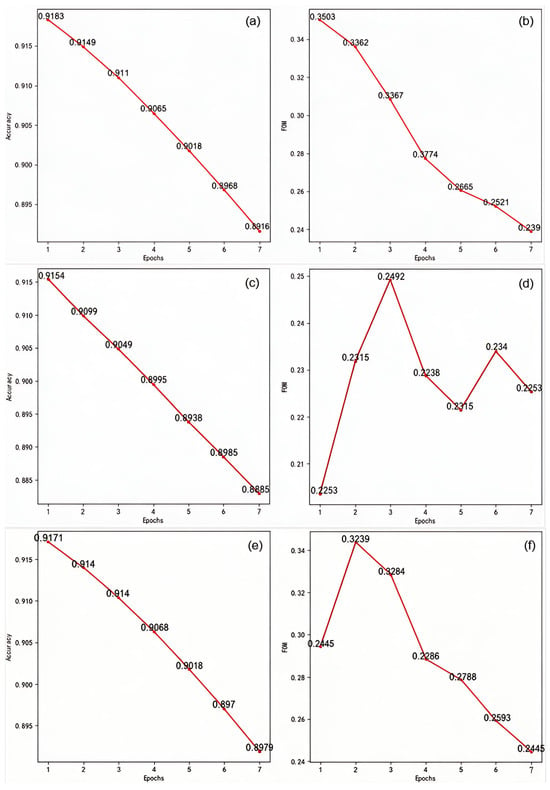
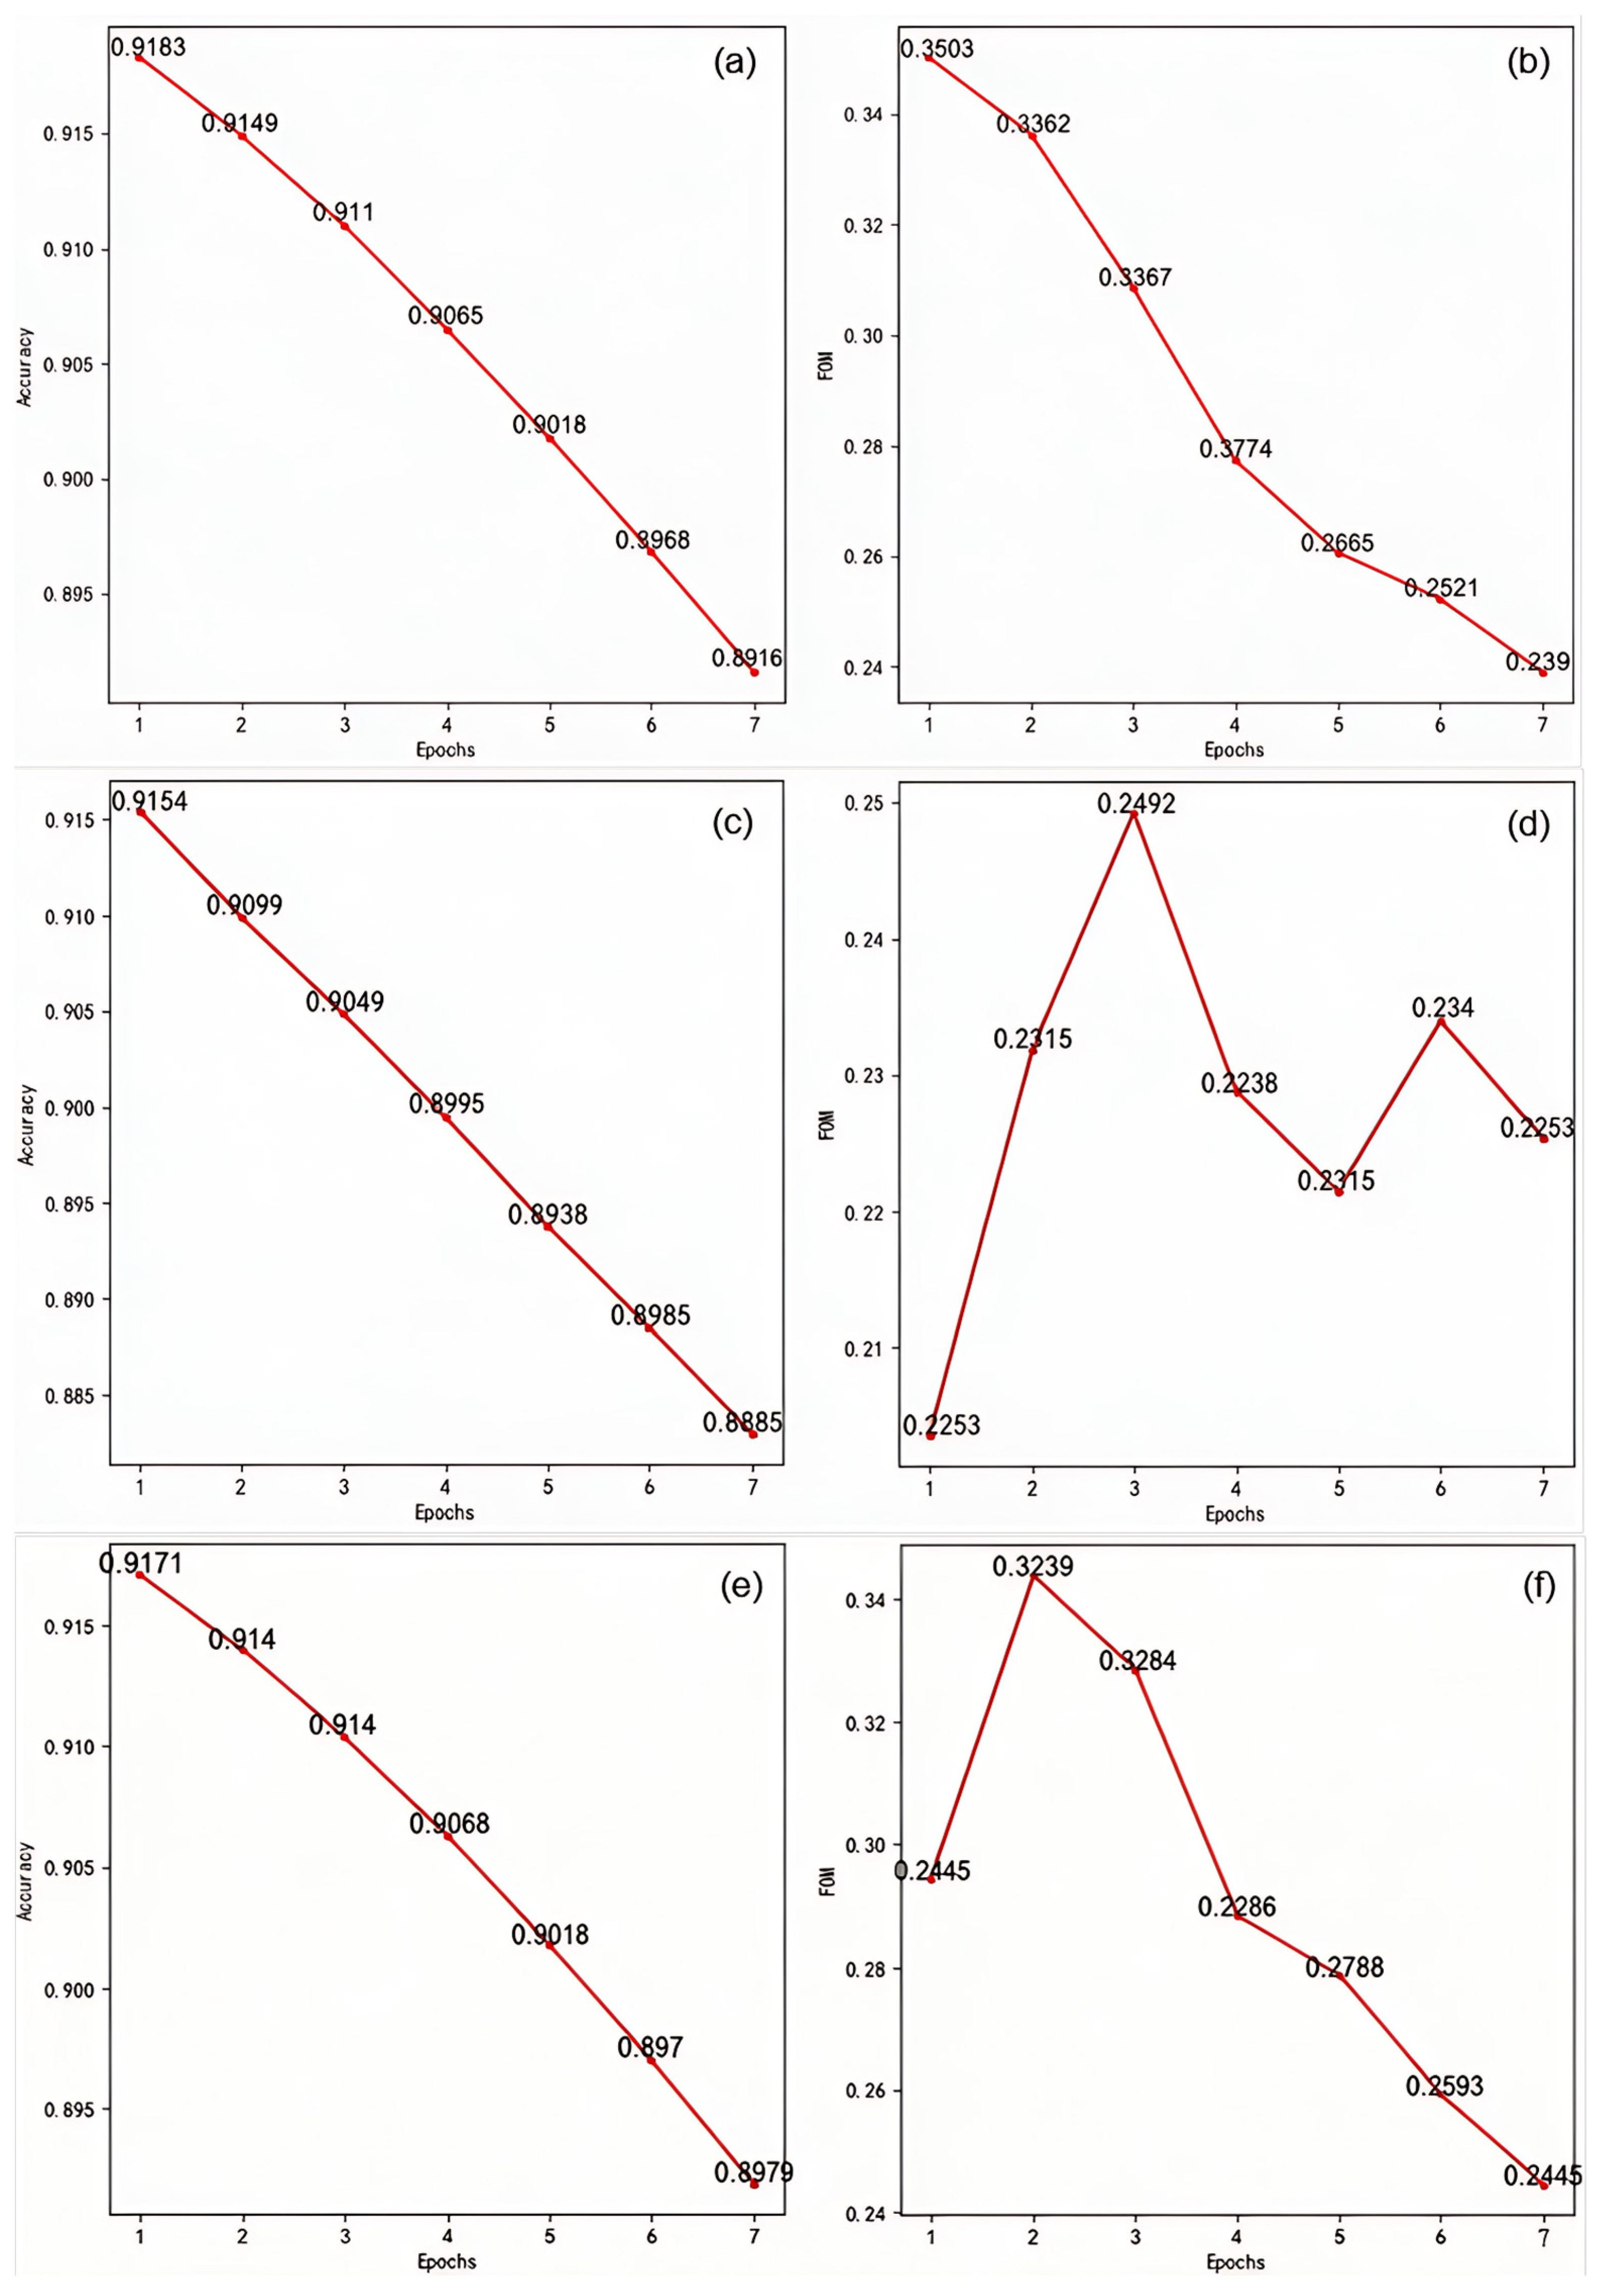
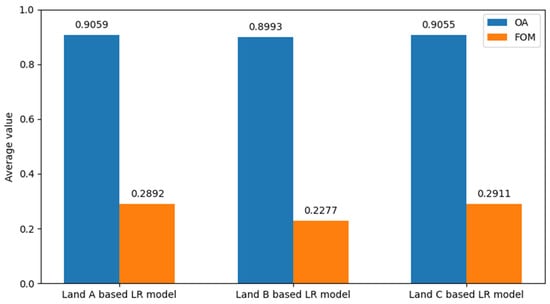
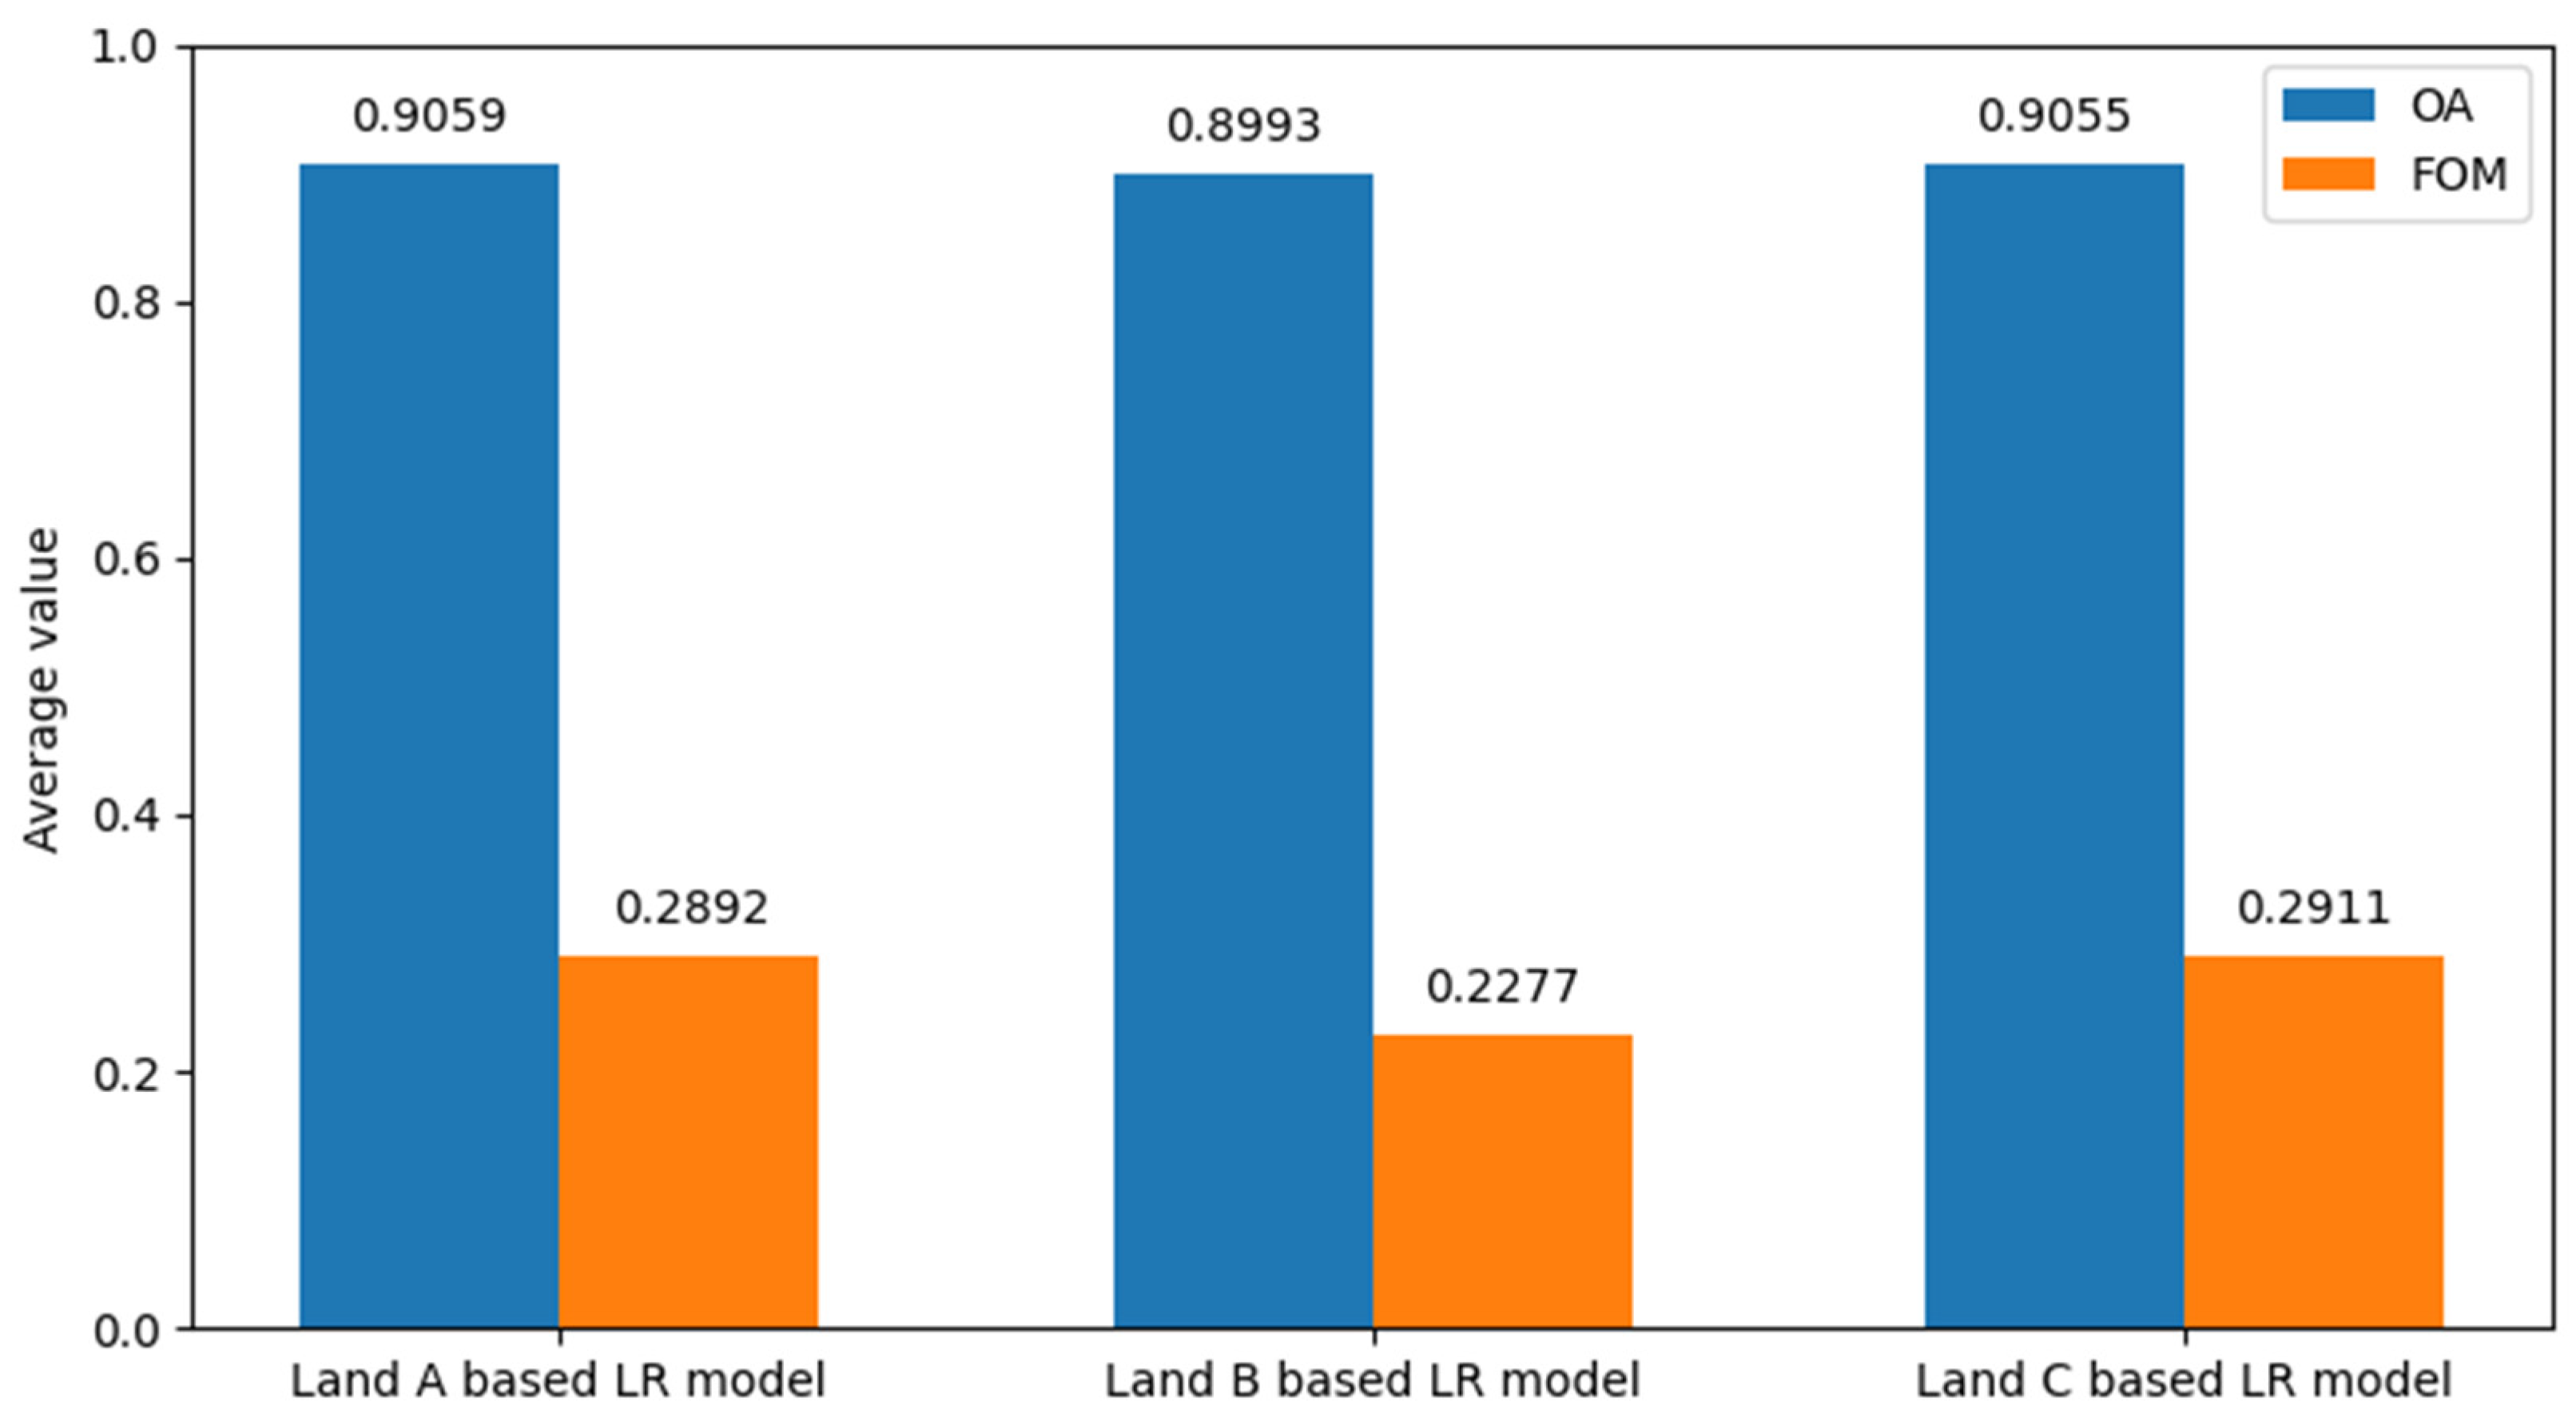
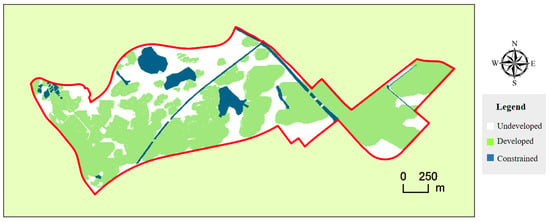
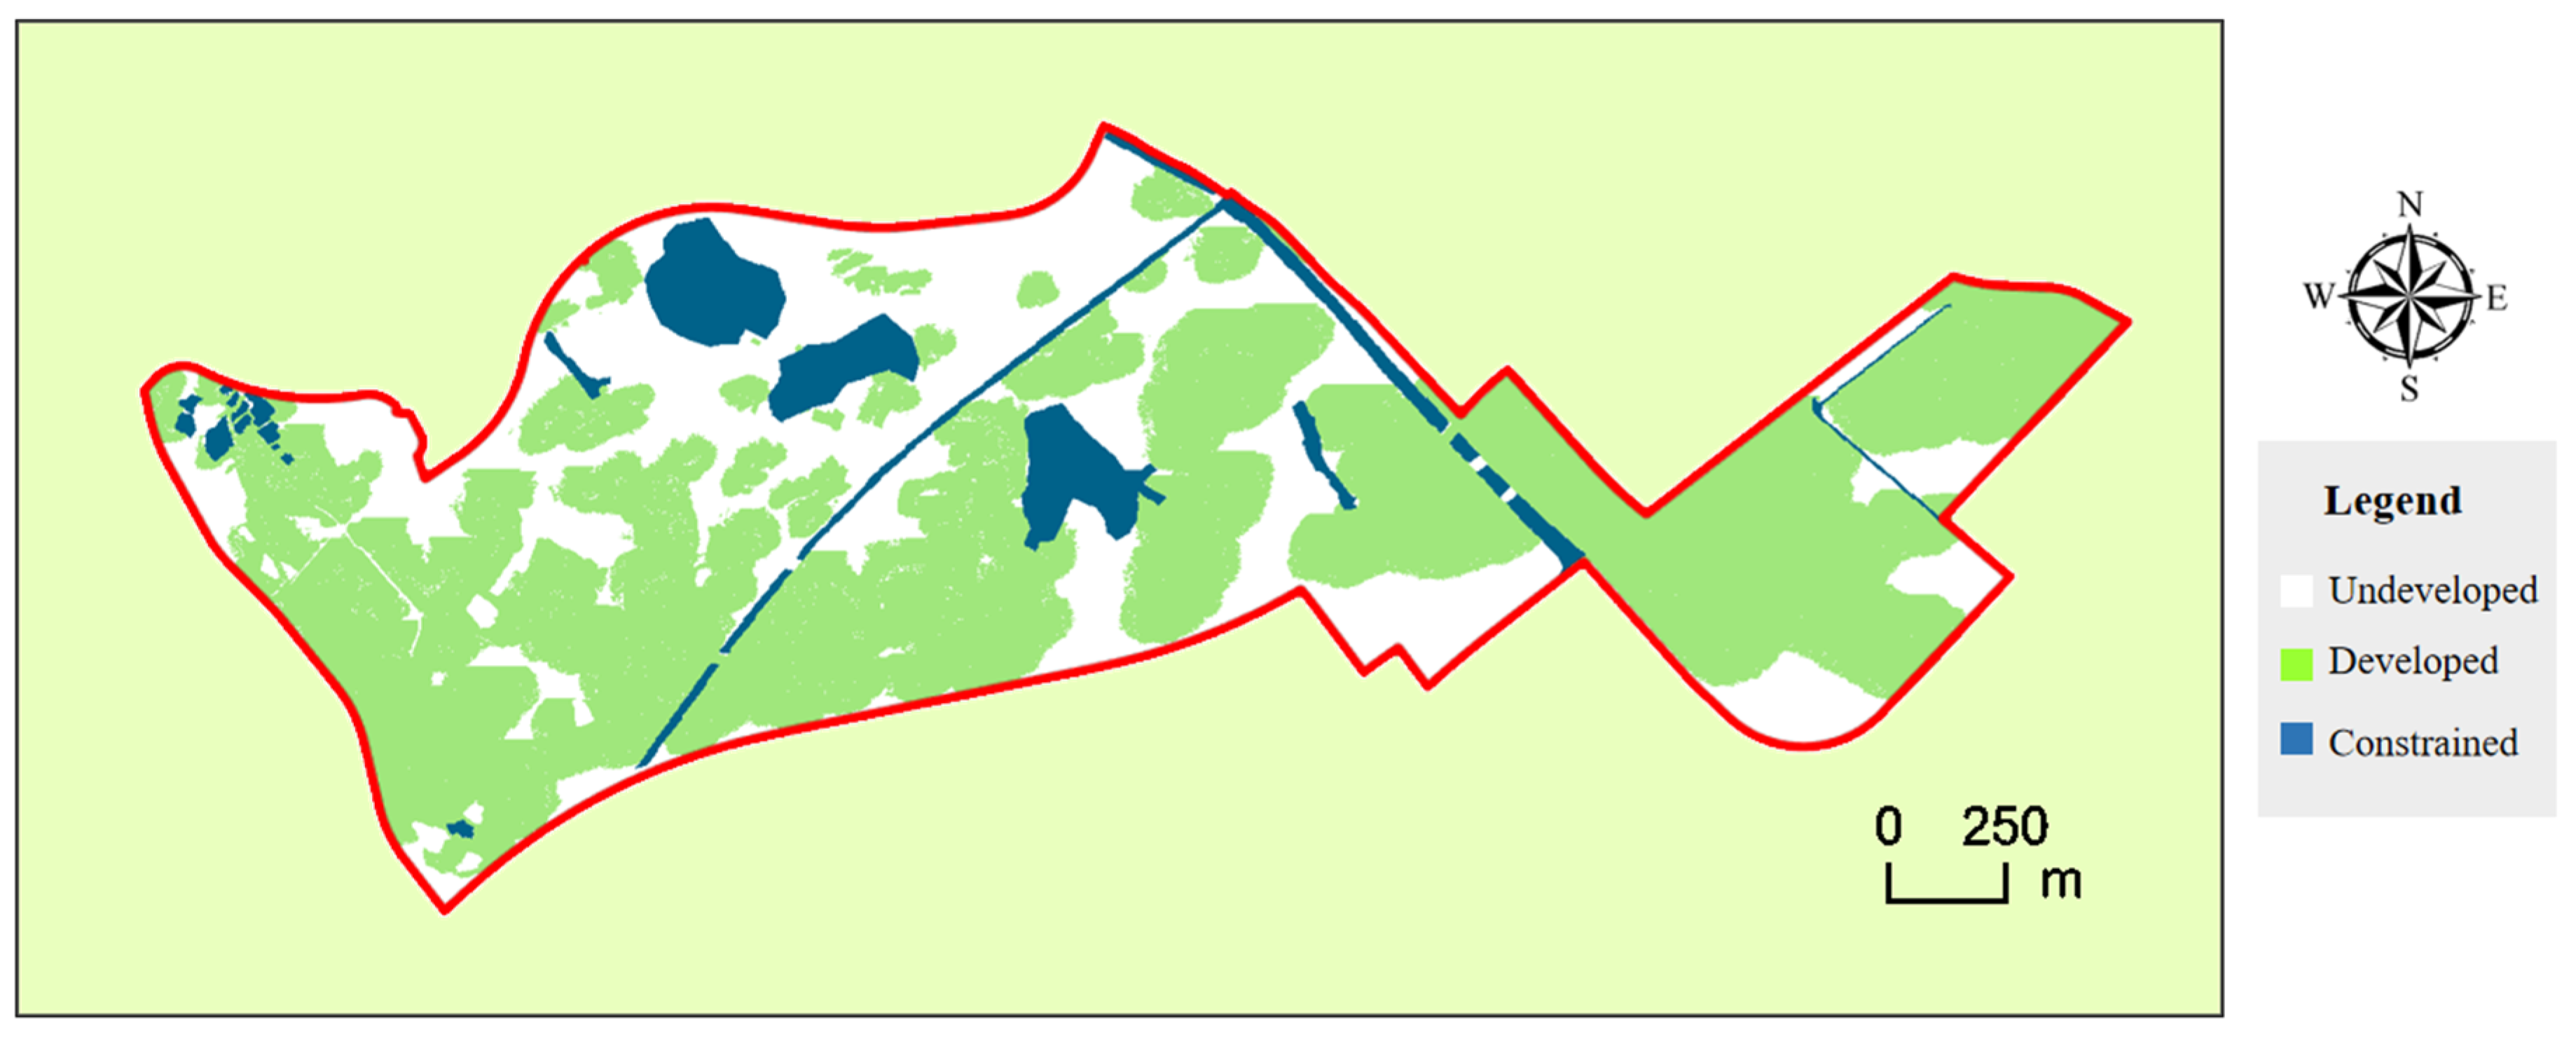
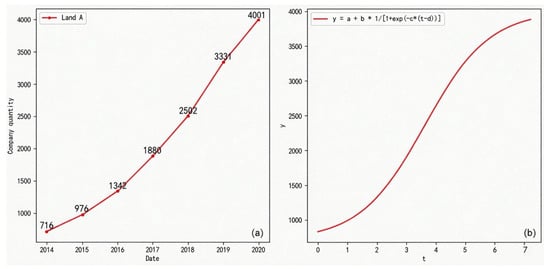
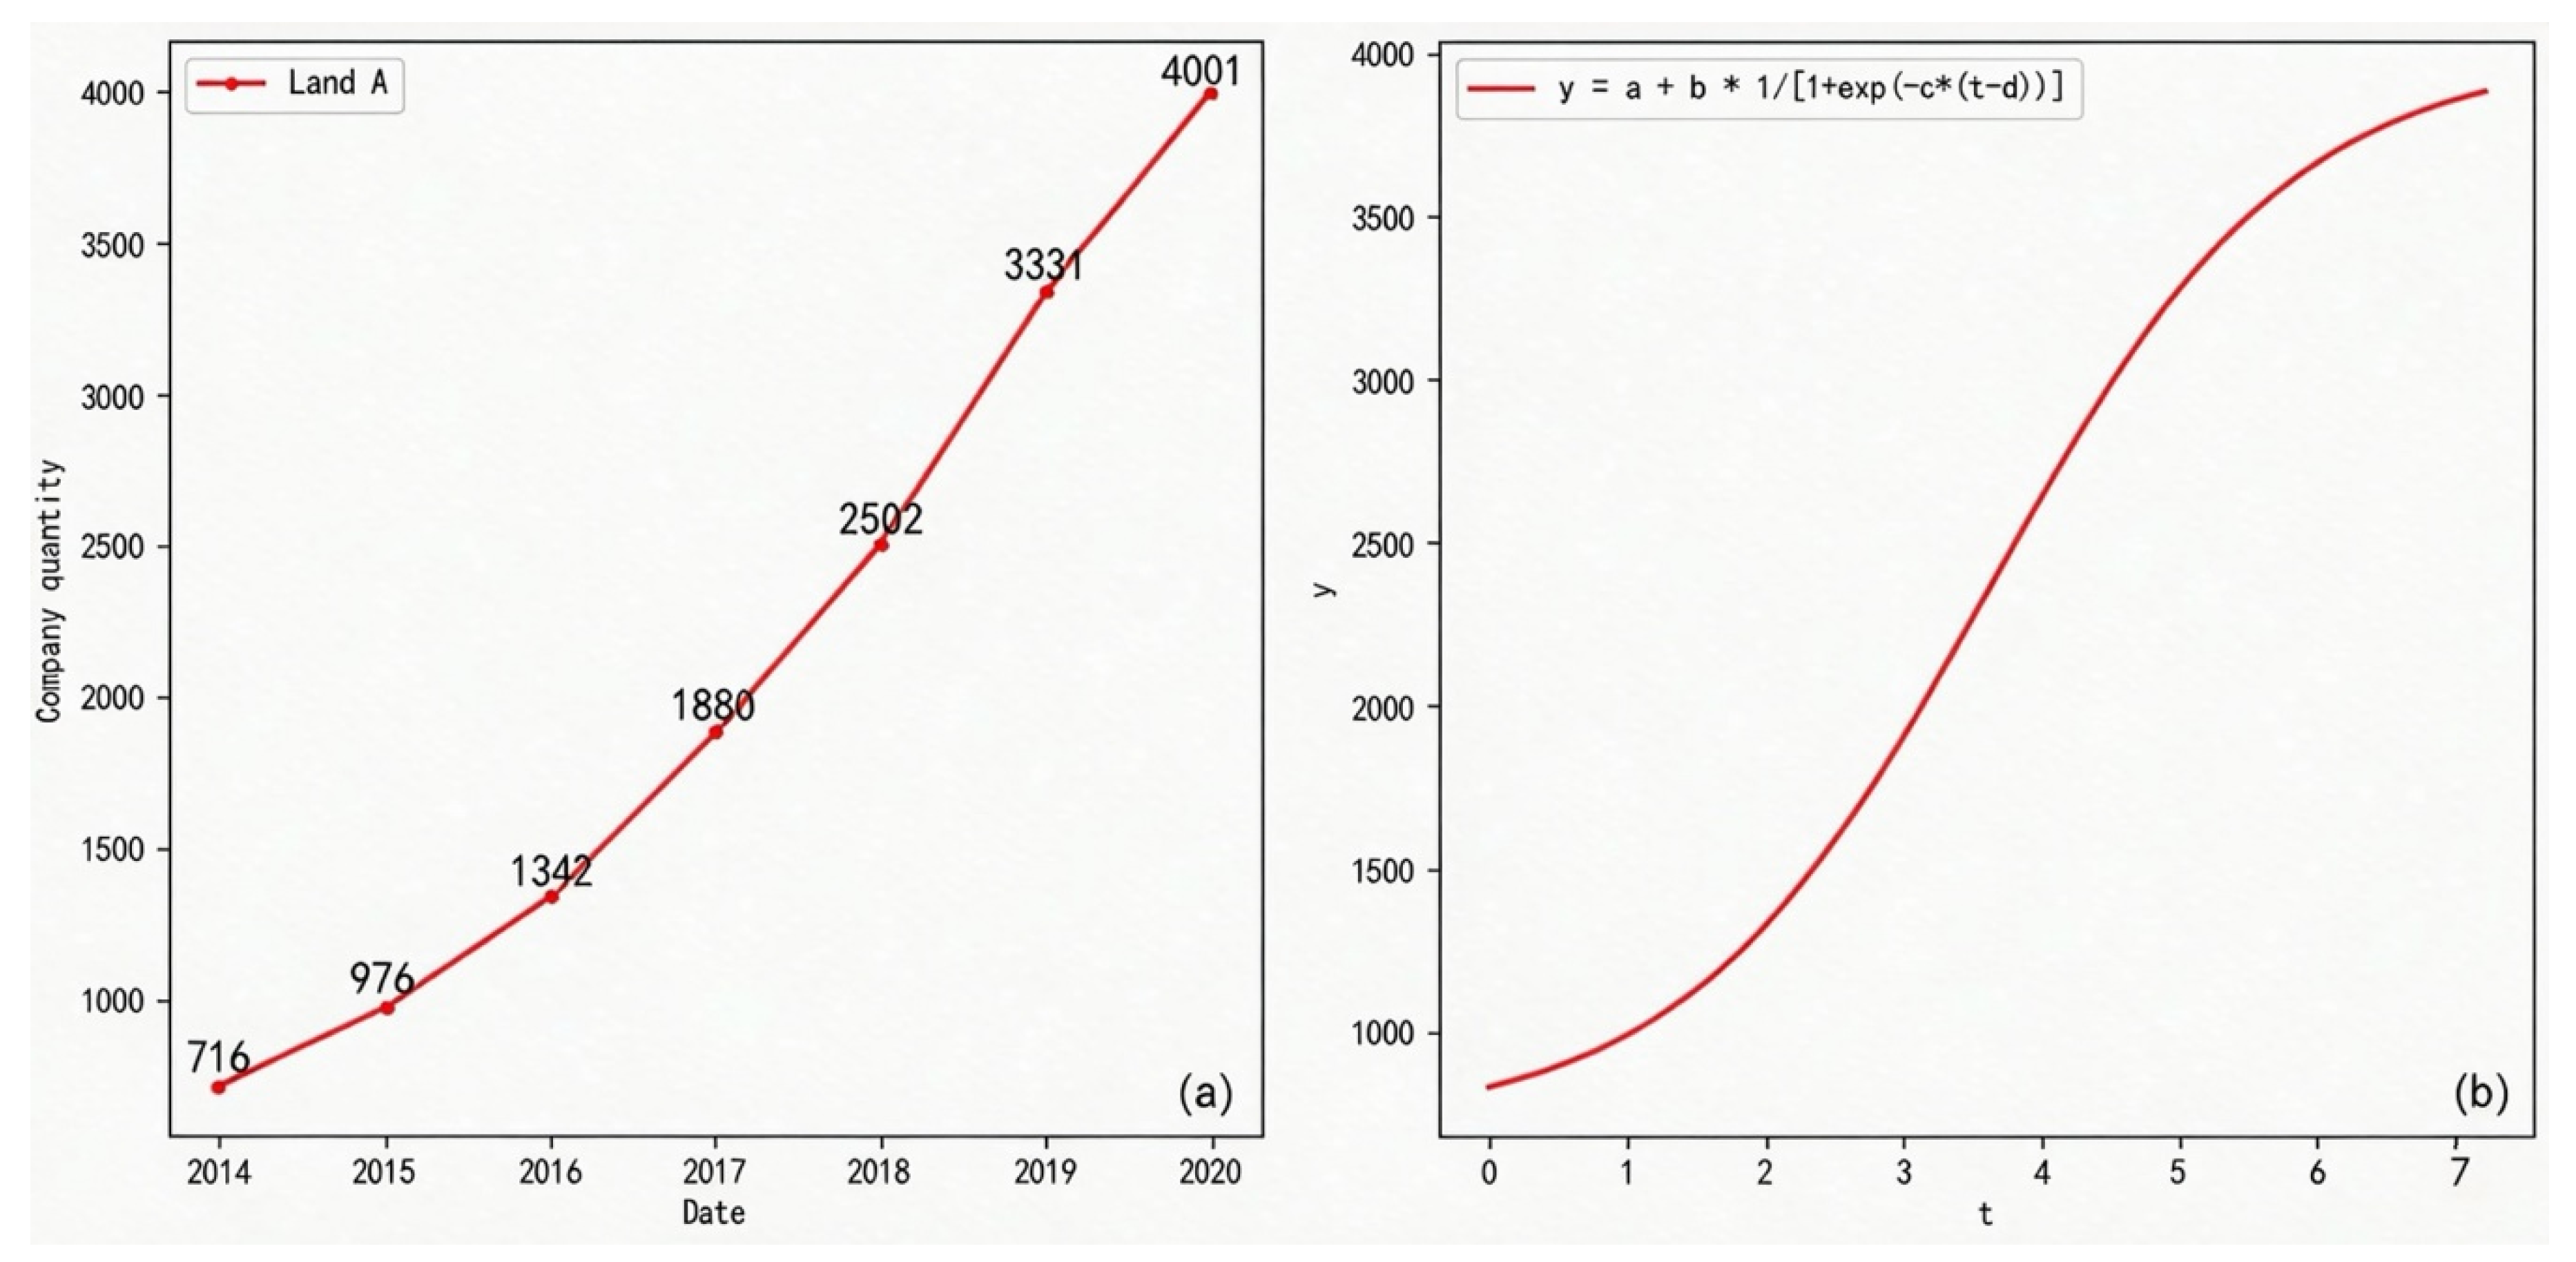
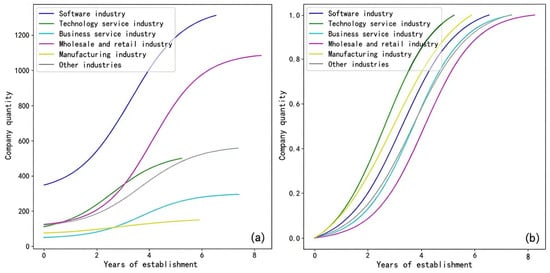
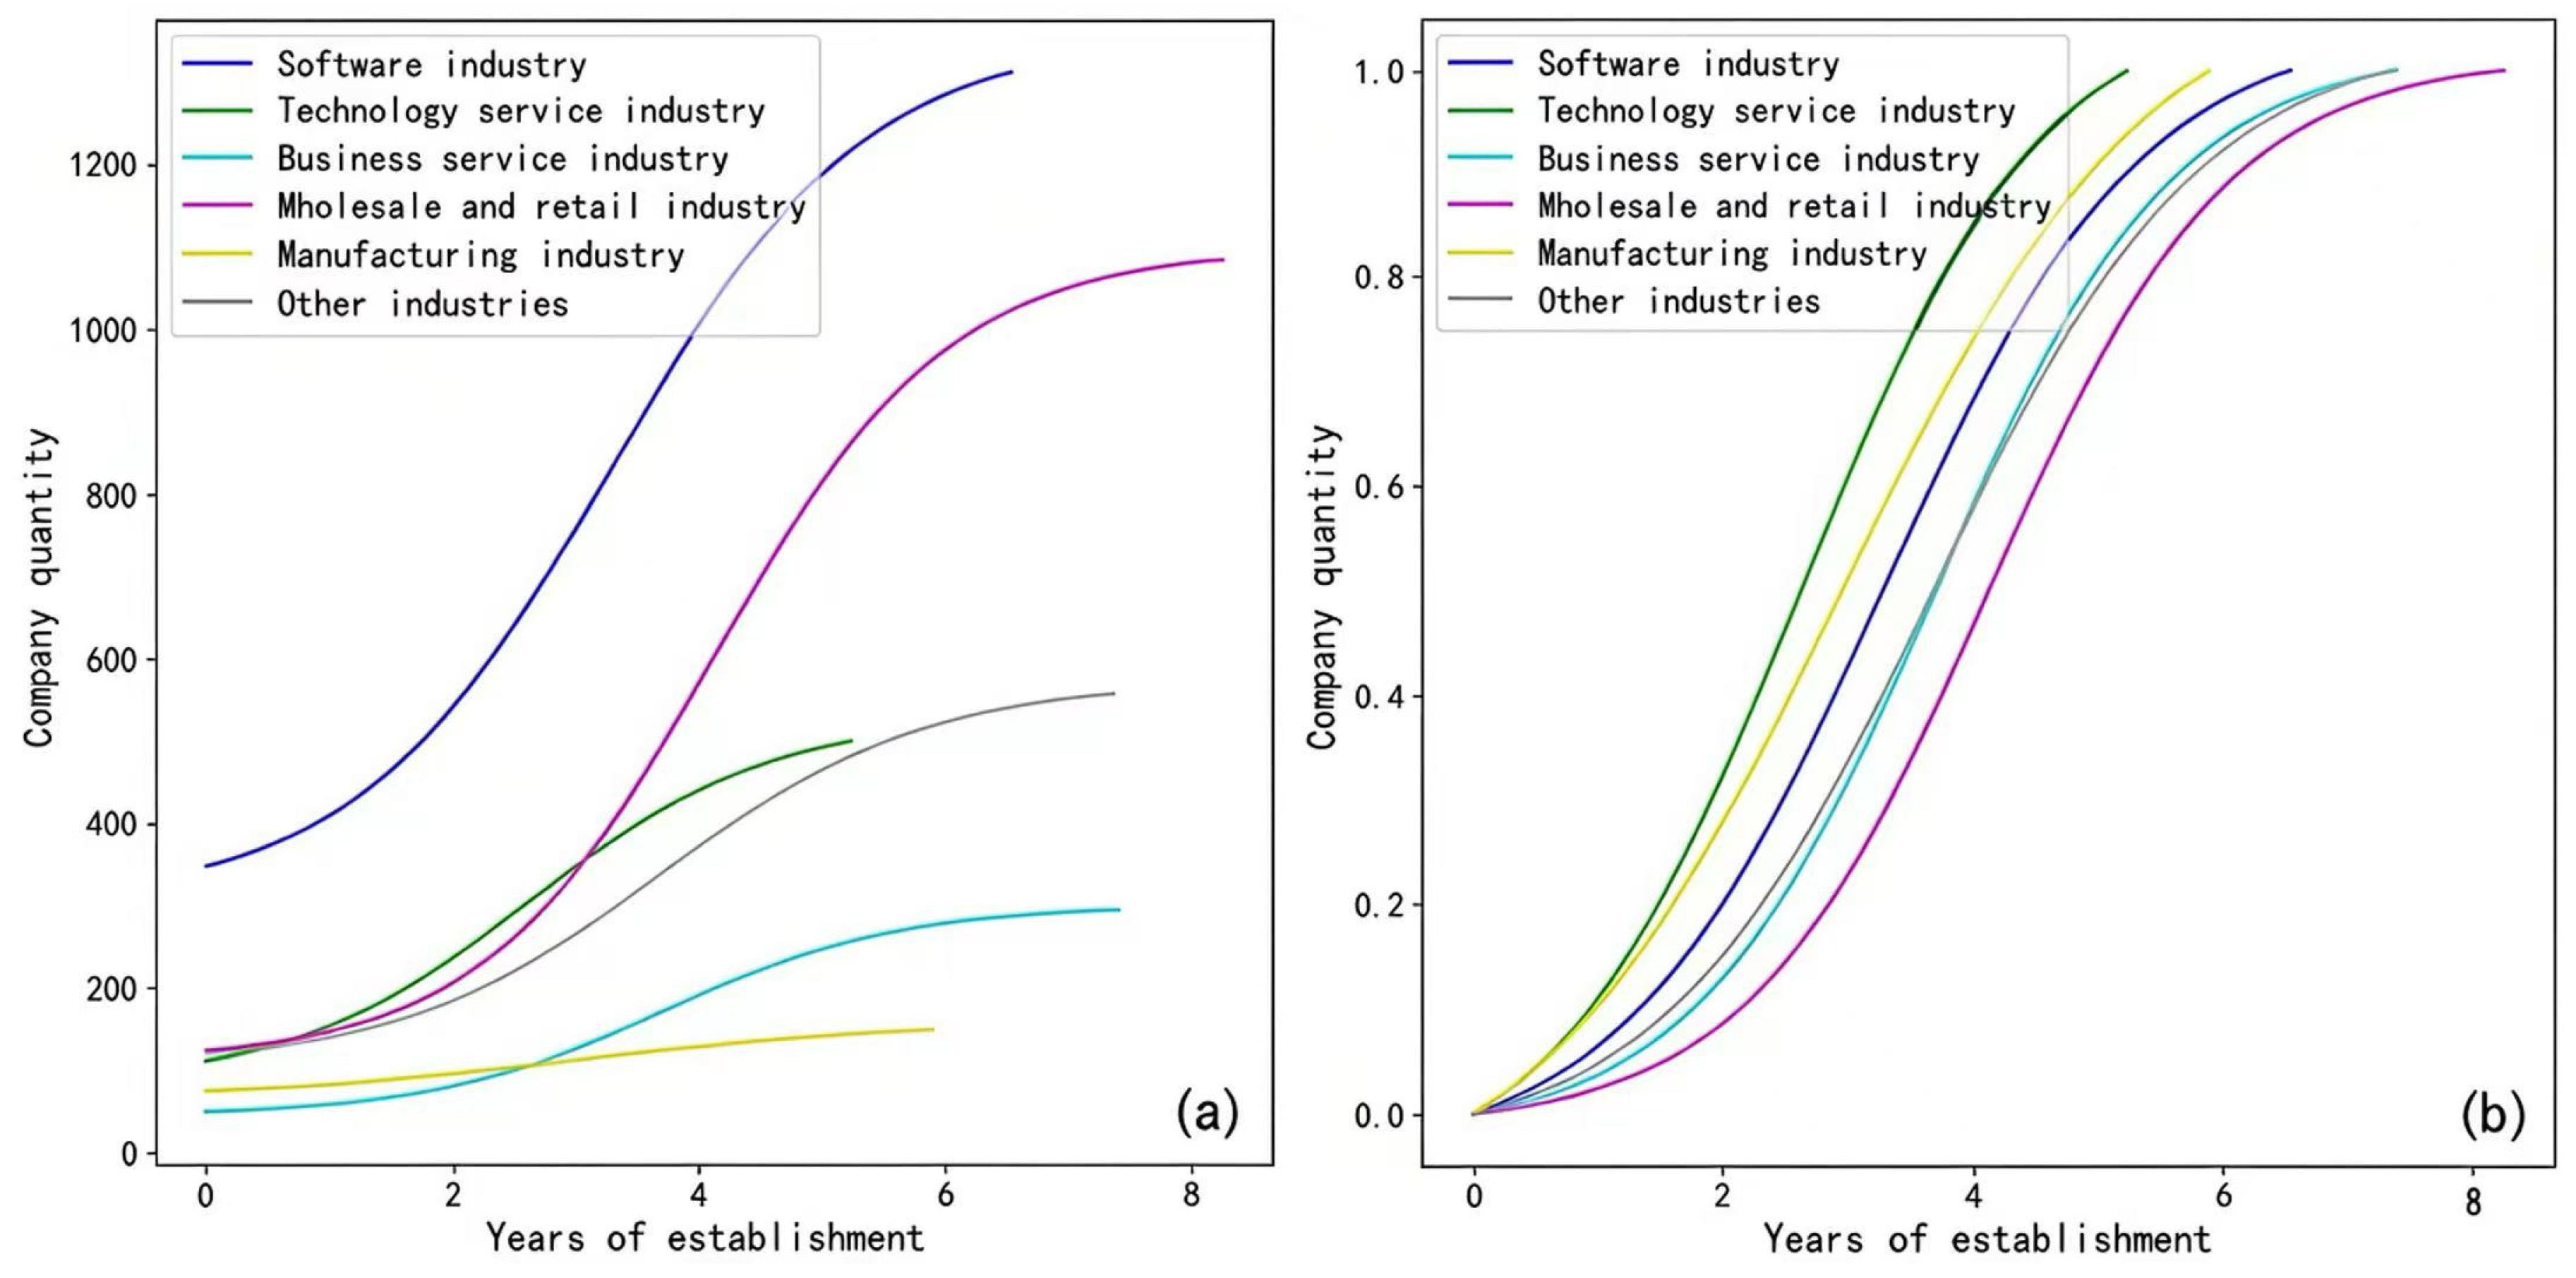
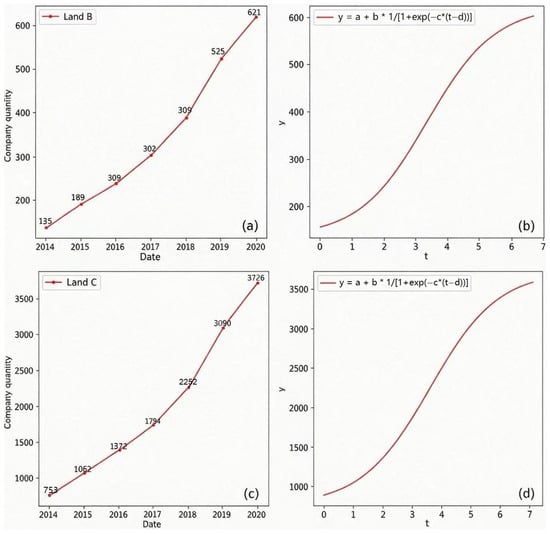
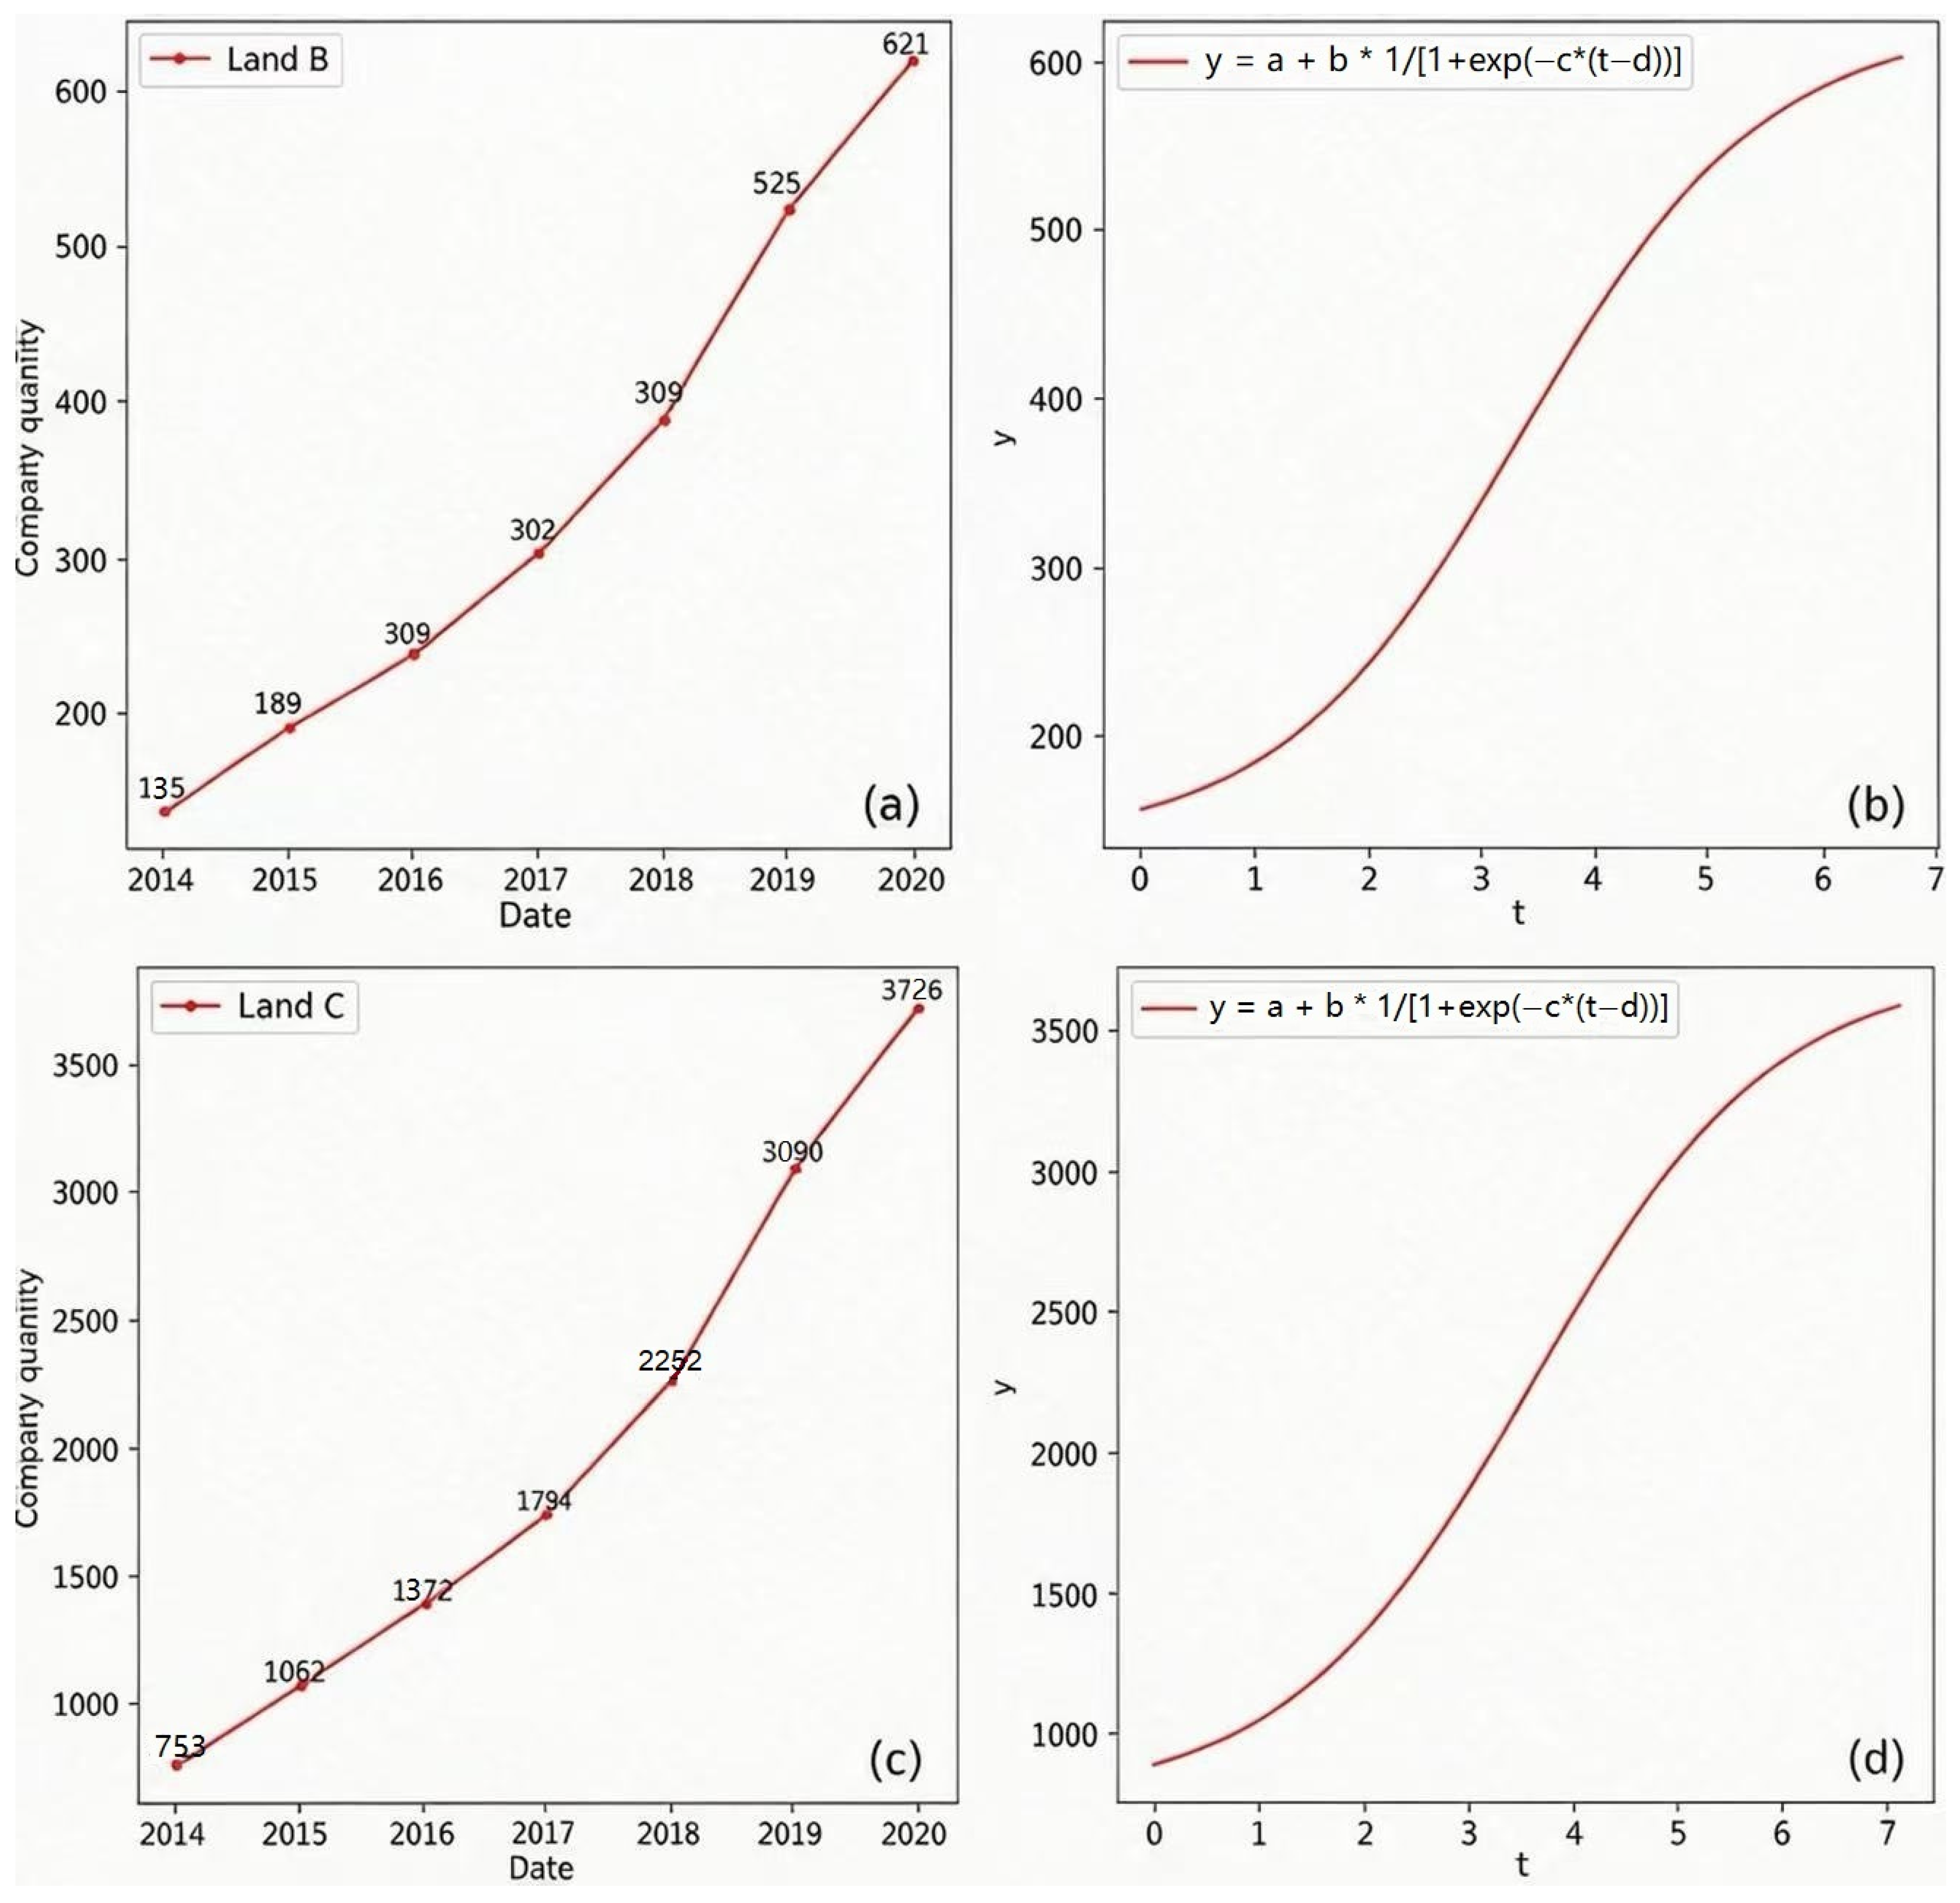
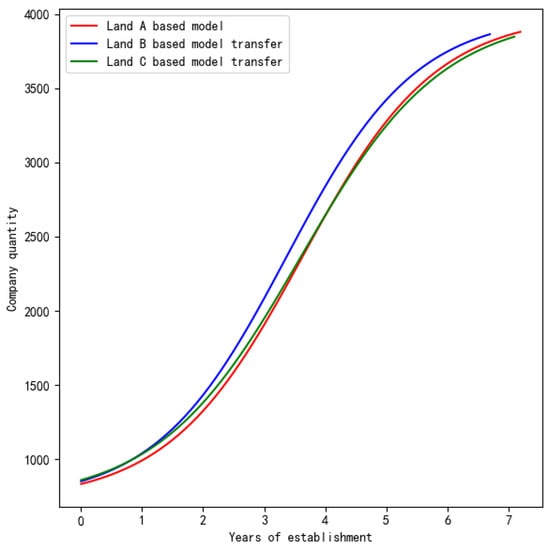
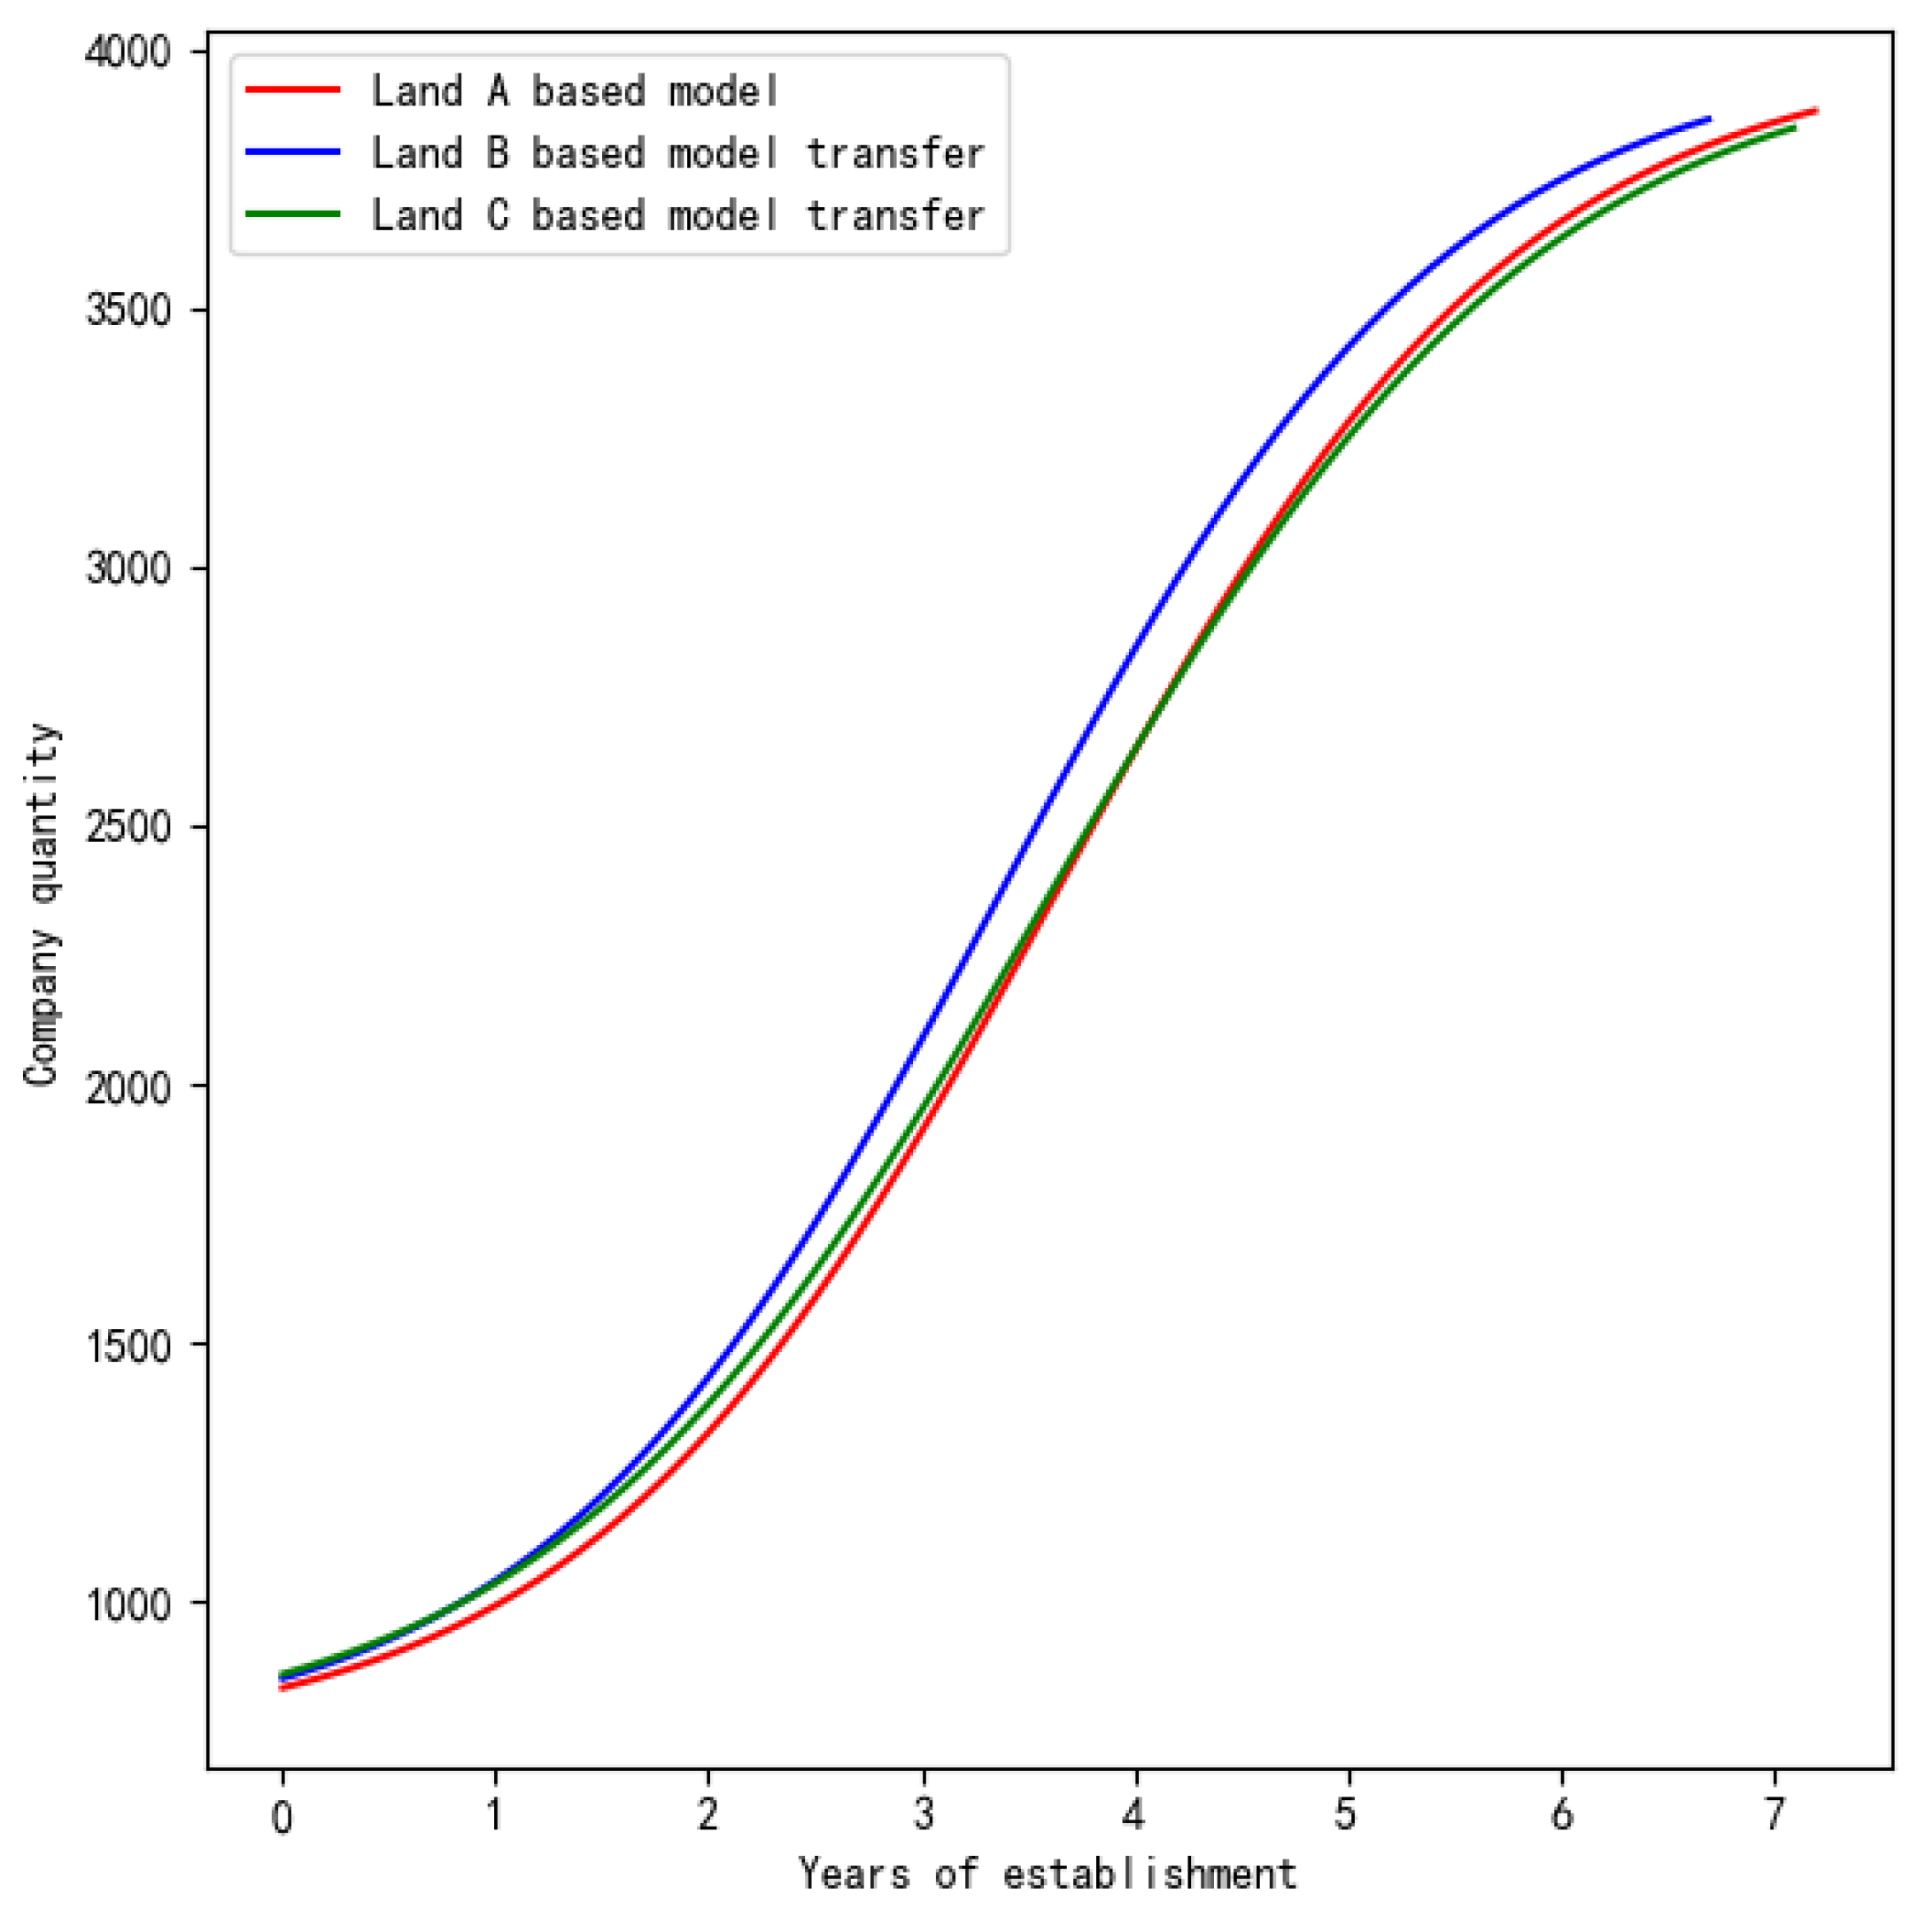
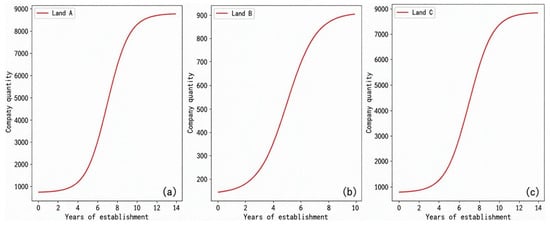
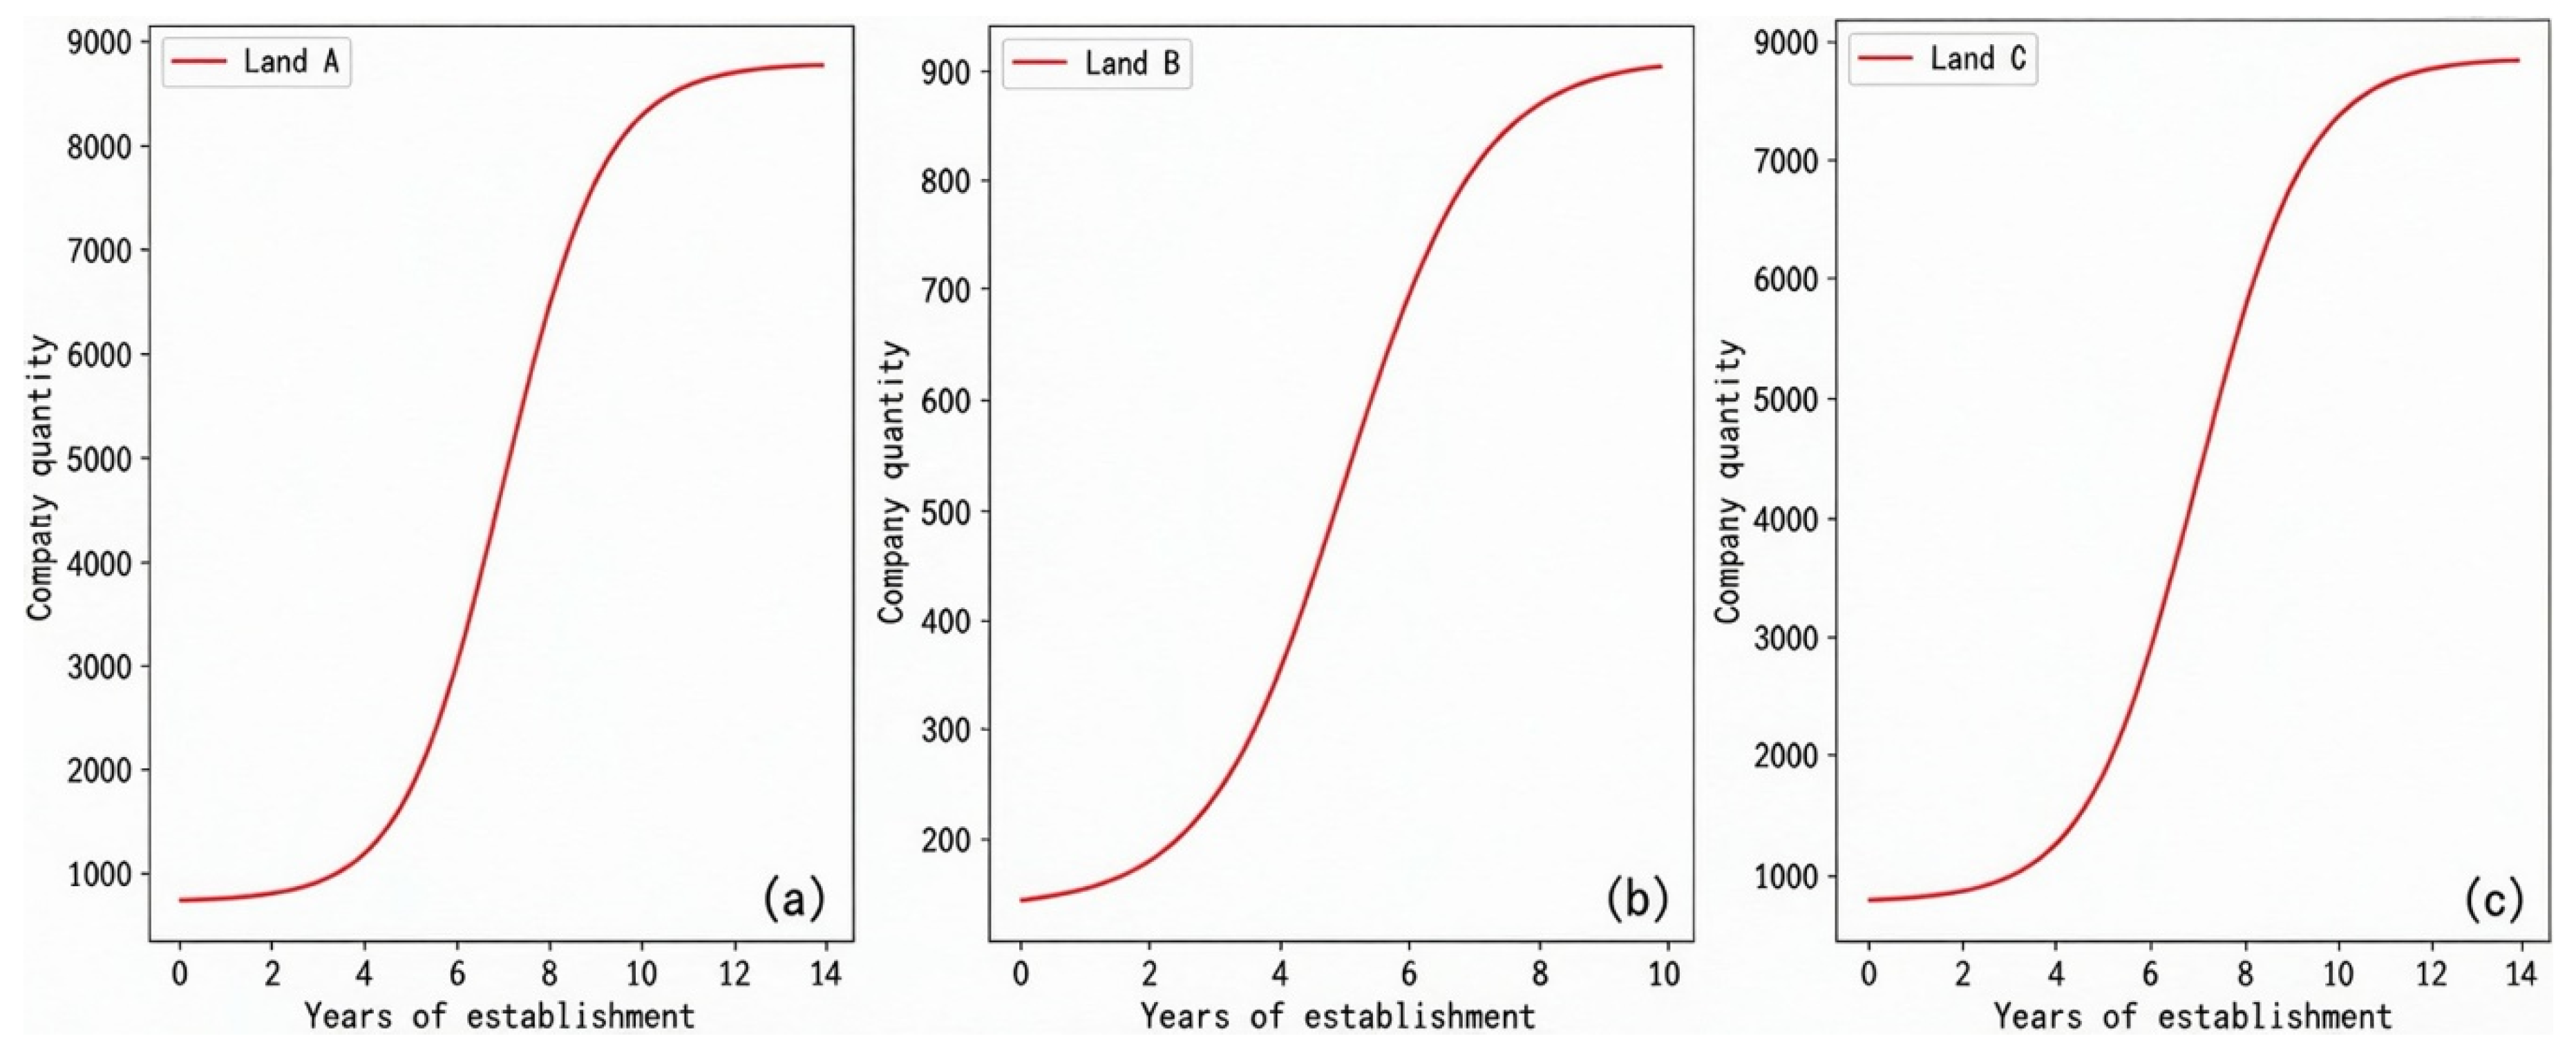
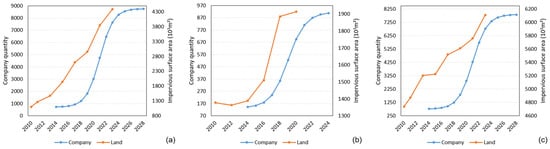
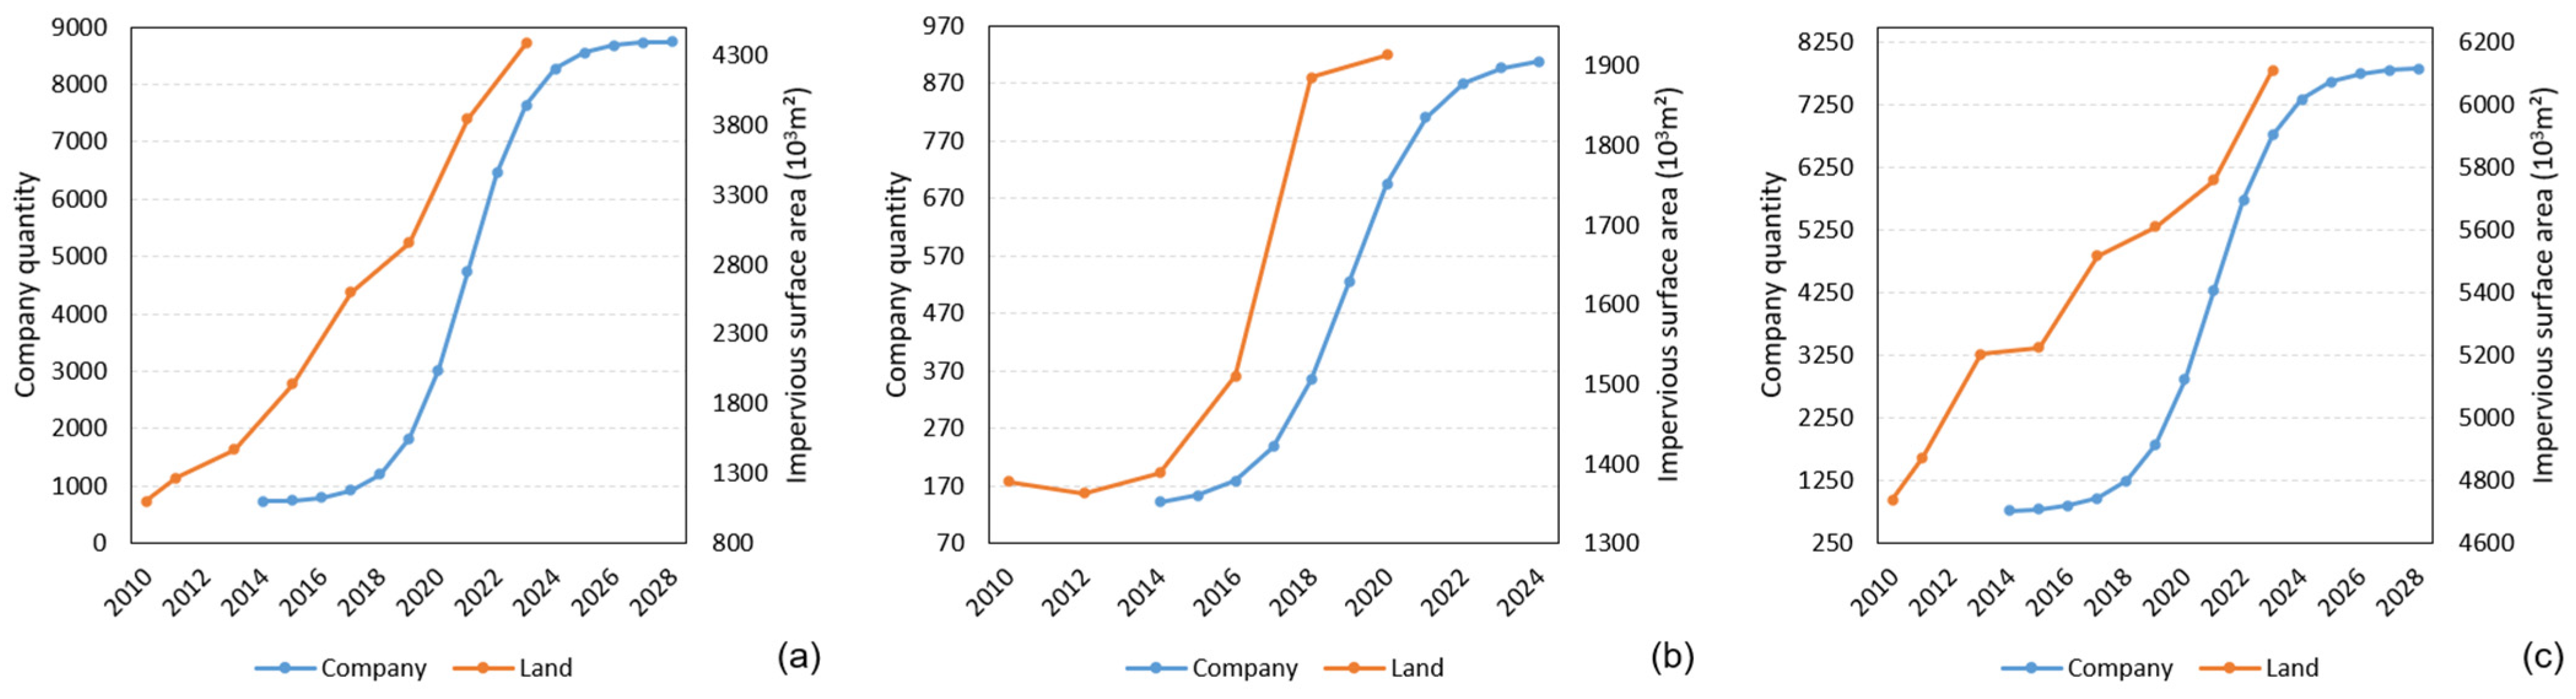

Disclaimer/Publisher’s Note: The statements, opinions and data contained in all publications are solely those of the individual author(s) and contributor(s) and not of MDPI and/or the editor(s). MDPI and/or the editor(s) disclaim responsibility for any injury to people or property resulting from any ideas, methods, instructions or products referred to in the content. |
© 2026 by the authors. Licensee MDPI, Basel, Switzerland. This article is an open access article distributed under the terms and conditions of the Creative Commons Attribution (CC BY) license.