


Abstract
Continuous scalp EEG monitoring enables automated epileptic seizure detection, but extreme class imbalance, inter-patient covariate shifts, and intra-subject data leakage heavily hinder clinical deployment. This study introduces an unsupervised, cross-patient feature selection and patient-independent one-class anomaly detection under Leave-One-Group-Out (LOGO) cross-validation enhanced by a novel One-Class Hybrid (G-Cramer’s V) Statistical Gate to resolve these gaps. The architecture models normal baseline neural activity as the solitary learned class, employing a dynamic feature gate that maximizes baseline purity via a One-Class Gini Index and drives robust cross-patient generalization through a Cramer’s V filter. To eliminate patient-level data leakage and ensure reliable cross-patient performance, a strict Leave-One-Group-Out (LOGO) cross-validation protocol is enforced. Benchmarked on the open-source CHB-MIT database against five core unsupervised estimators (OCSVM, kNN, LNND, LOF, IF) and a reference Morlet Wavelet baseline, the proposed Local Outlier Factor (LOF) estimator utilizing a Gated Fourier framework delivers high precision and efficiency. It achieves a mean cohort F1-score of 0.79, a precision of 78%, and a False Alarm Rate of 1.5 alarms per hour on completely unseen patients, while simultaneously yielding a 35.5% reduction in feature-extraction latency.
Keywords:
CHB-MIT scalp electroencephalography (EEG); cross-patient generalization; leave-one-group-out cross-validation; one-class learning; unsupervised anomaly detection; Gini-based feature concentration; Cramér’s V statistical gating; feature selection; epileptic seizure labeling; hybrid anomaly detection 1. Introduction
Epilepsy is one of the most common chronic neurological disorders and is characterized by a lasting tendency to experience recurrent epileptic seizures. It affects millions of people worldwide and represents a significant neurological and public health burden [1,2]. The clinical manifestations of epilepsy vary depending on the brain regions involved and the type of seizure, and may include impaired awareness, involuntary motor activity, generalized convulsions and loss of consciousness [3,4]. In addition to seizures, epilepsy can be associated with difficulties, mental health problems, physical injuries and reduced quality of life [2]. These consequences highlight the importance of seizure detection and appropriate clinical management.
Electroencephalography (EEG) is one of the tools used to investigate and monitor epileptic activity because it provides a non-invasive recording of the brain’s electrical activity [5,6]. Clinical interpretation of EEG recordings follows established terminology and reporting practices [7]. However, automatic seizure detection remains challenging because seizures occur intermittently and are separated by long periods of normal or interictal brain activity. Consequently, patients undergoing seizure monitoring may generate volumes of continuous EEG recordings in which seizure events represent only a small proportion of the total data. The resulting data volume makes manual inspection time-consuming, increasing the need for reliable computer-assisted analysis.
These challenges have motivated the development of automated seizure-detection systems based on signal processing, machine learning and deep learning techniques [8,9]. Existing approaches can broadly be divided into unsupervised methods. Supervised approaches can achieve performance when sufficient labeled seizure data are available; however, obtaining comprehensive and reliable seizure annotations is costly and difficult because EEG characteristics can vary considerably between patients [8,9]. Patient-independent seizure detection has therefore become a research direction particularly for systems intended to generalize to patients whose data were not available during training [10,11].
A further methodological concern in biomedical machine learning is patient-level data leakage. When recordings from the same patient are randomly divided between training and testing sets, patient-specific characteristics may be present in both subsets. Consequently, a model may exploit subject-specific patterns rather than learning representations that generalize to previously unseen patients. This issue is particularly relevant for EEG because recordings from the same individual may share substantial characteristics across time. Patient-independent evaluation strategies have therefore been emphasized in seizure-detection research [10,11]. More generally, when observations are grouped by subject, the validation strategy should preserve group boundaries so that samples from the same patient are not simultaneously used for model development and evaluation [12,13].
To reduce the dependence on seizure annotations, unsupervised and one-class approaches have also been investigated. These methods attempt to characterize interictal brain activity and identify observations that deviate from the learned normal pattern [10,12]. Karpov et al. [10], for example, investigated anomaly detection techniques for labeling epileptic seizures in human EEG. Such approaches can reduce the requirement for seizure labeling but their effectiveness may depend on how the normal EEG baseline is represented and how the model is adapted to individual patients.
A related challenge is the use of patient optimization. Methods that train or tune a model separately for each patient can exploit EEG characteristics but this requires patient-specific training or adaptation when a new subject is introduced. This limits the applicability of such approaches to a cross-patient clinical setting and motivates the investigation of methods capable of learning representations that generalize across subjects [10,11]. In addition, EEG data may be distributed across institutions or devices, creating privacy-related challenges for centralized multi-patient model development. Decentralized and federated learning approaches have consequently been investigated as alternatives for EEG-based learning across distributed data sources [14].
These challenges motivate the need for a validation framework in which the test patient is completely excluded from the training process. Such a framework provides an assessment of whether detected patterns are transferable across patients rather than being specific to the individuals represented in the training data. In this context, combining patient validation with unsupervised anomaly detection provides a way to investigate whether stable statistical characteristics can be exploited without requiring seizure labels from the target patient.
This paper investigates an Unsupervised Hybrid Statistical Gate that combines a One-Class Gini-based concentration score with a Cramér’s V-based measure of feature–patient association. The Gini component characterizes the concentration of interictal baseline feature values across the training cohort, whereas Cramér’s V quantifies the association between discretized feature values and patient identity. The resulting gate is intended to retain features that exhibit relatively consistent baseline distributions across patients while reducing the influence of features strongly associated with patient identity.
Importantly, the proposed gate should not be interpreted as directly proving physiological relevance or temporal stability. The Gini score is used as a population-level proxy for baseline structural consistency, while the Cramér’s V component measures statistical association with patient identity.
The proposed framework is evaluated using patient-grouped validation. Both Leave-One-Group-Out (LOGO) and GroupShuffleSplit (SHIFT) were considered during methodological evaluation, with Patient ID used as the grouping variable in both procedures. LOGO was selected as the primary protocol for the final experiments because it provides exhaustive patient-wise evaluation: each patient is held out exactly once while the remaining patients constitute the training cohort. SHIFT is retained as a secondary comparative analysis.
The study further evaluates the effect of the proposed gate on several unsupervised one-class anomaly detection estimators. To ensure controlled comparisons, the reported model configurations use the same patient-level outer splits, 4-s windows, feature representation, preprocessing procedure, and evaluation criteria. Computational latency is also measured for the FFT-based and reference CWT-based feature-extraction pipelines. The timing experiments are intended to characterize computational cost rather than demonstrate deployment on a specific wearable or embedded platform.
2. Materials and Methods
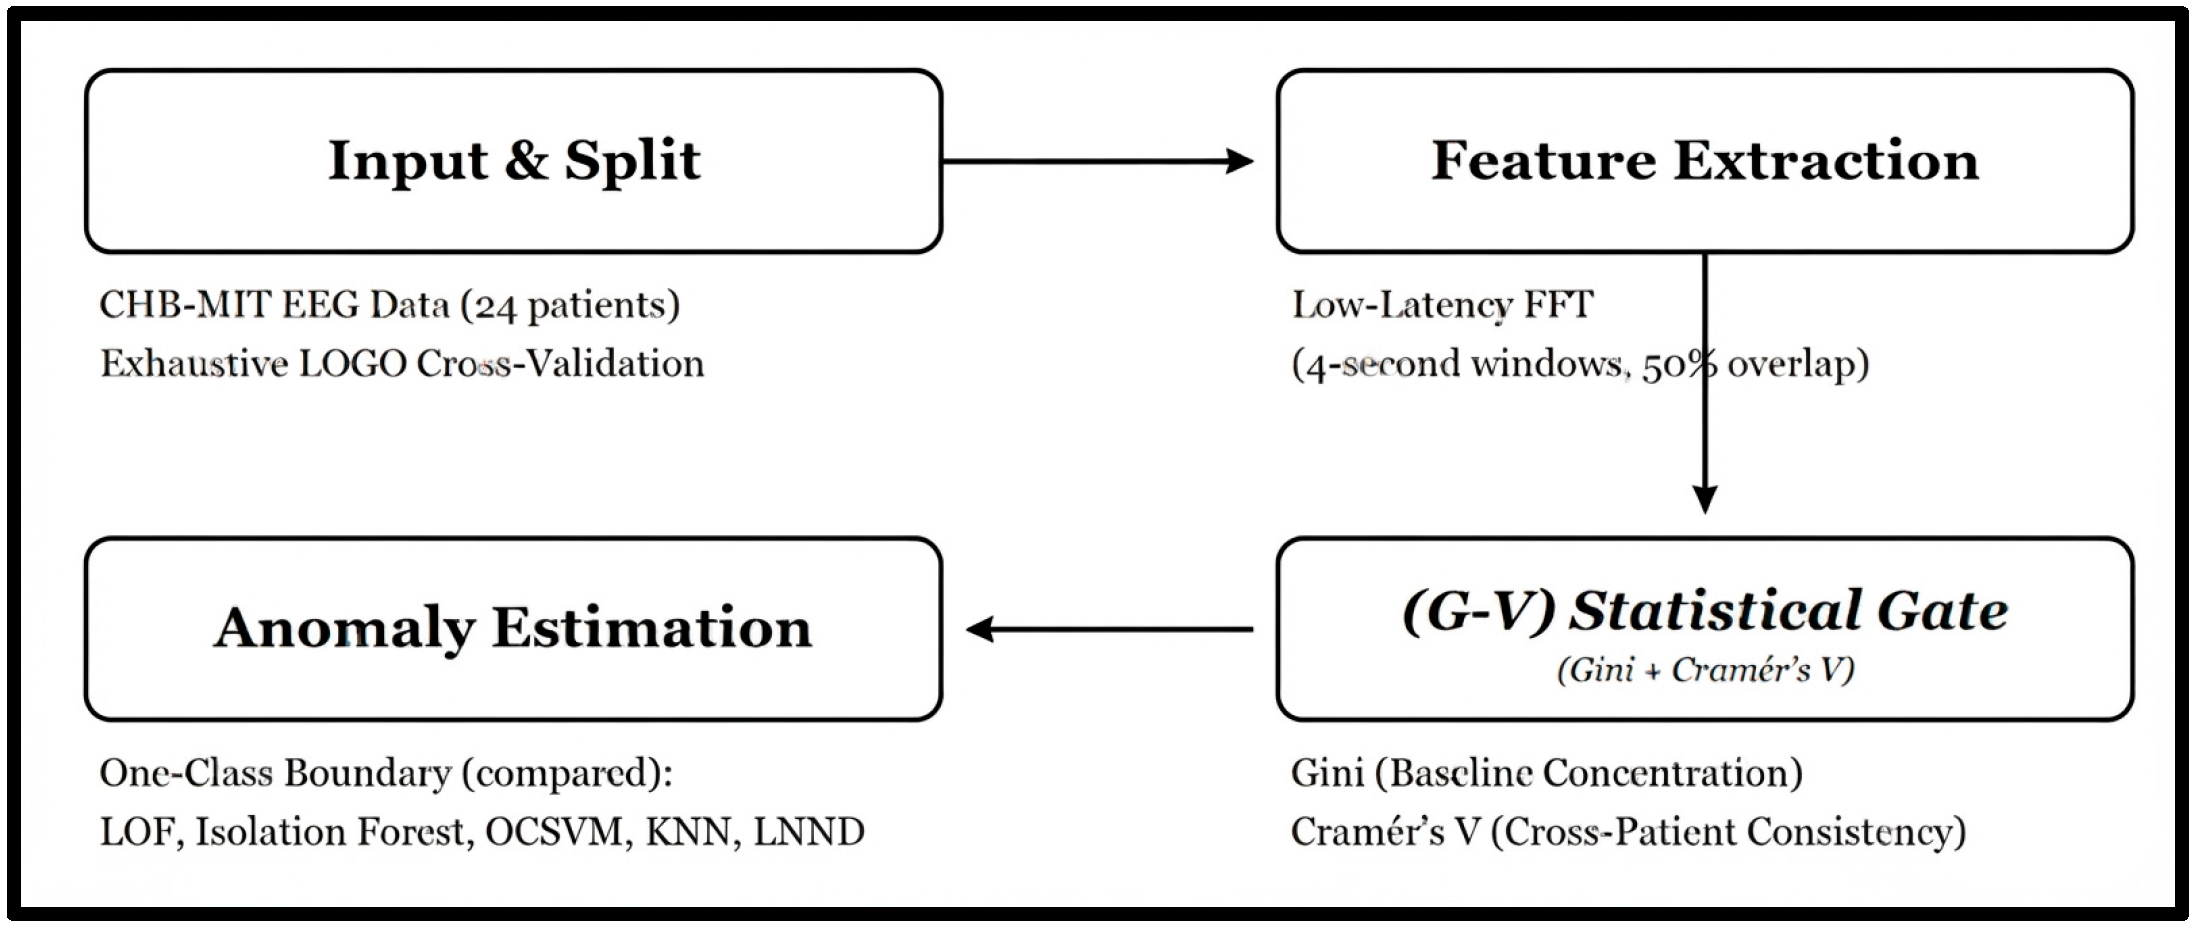
The end-to-end procedural workflow of the proposed zero-shot seizure tracking architecture is illustrated in Figure 1. The methodology is structured into four sequential phases: (1) strict Leave-One-Group-Out (LOGO) cross-validation to eliminate intra-subject data leakage; (2) short-time sliding Fourier windows for low-latency spectral feature extraction; (3) the core Unsupervised Hybrid (G-V) Statistical Gate, which scales features by balancing baseline purity (Gini Index) against domain invariance; and (4) downstream unsupervised one-class boundary estimation optimally utilizing Local Outlier Factor (LOF) to achieve robust, real-time seizure labeling on entirely unseen patients.
Figure 1.
Architectural schematic of the proposed Unsupervised Hybrid (G-V) gated framework for cross-patient seizure labeling.
2.1. Dataset Selection and Preprocessing
The validation and comparative benchmarks are executed utilizing the open-source CHB-MIT Scalp EEG Database from PhysioNet, collected at the Boston Children’s Hospital. The database comprises continuous multi-channel scalp EEG tracks recorded from pediatric subjects using an international 10–20 electrode configuration. The target annotation space is binarized according to clinical annotations as shown in Equation (1):
A total of 686 candidate recording files were identified during dataset preparation. To establish a consistent feature space, the channel labels of every candidate recording were inspected programmatically and their intersection was computed. This procedure yielded a common set of 18 bipolar channels present across the retained recordings. The final channel set was therefore determined from the recordings themselves rather than imposed by assuming a fixed montage.
Three recordings from a single patient used a different reference configuration based on CS2-referenced/unipolar channels and were incompatible with the common bipolar channel set. These recordings were excluded. This exclusion removed 13 of the 40 documented seizures for that patient; the remaining retained recordings contain 27 seizures. In total, 683 of the 686 candidate recordings were retained.
One additional data-handling issue concerned a patient’s session-letter file-naming convention. These files were not excluded; the file-discovery procedure was corrected so that the corresponding recordings were explicitly identified and included. The complete per-file inclusion log records the file identity, inclusion status, exclusion reason where applicable, recording duration, and seizure count. . A revised patient-level summary reports the recording duration and seizure count for each of the 24 patients included in the final cohort.
Raw EEG signals were processed using the following pipeline:
- Sampling-rate harmonization: All retained recordings were resampled to 256 Hz.
- Band-pass filtering: A 4th-order zero-phase Butterworth band-pass filter from 1 to 60 Hz was applied.
- Power-line filtering: A 60 Hz notch filter was applied to reduce power-line interference.
- Artifact attenuation: Independent Component Analysis (ICA) was fitted independently for each recording [15] (never fitted jointly across patients, nor pooled between training and held-out folds). Ocular artifacts were identified and attenuated by evaluating cross-correlation against standard frontal polar channels (FP1-F7 and FP2-F8). Components exceeding a correlation threshold of 0.5 were zeroed out, removing a conservative average of 1.4 ± 0.5 components per recording while successfully preserving > 93.2% of total signal variance. As recent biomedical signal processing guidelines emphasize, balancing ocular artifact attenuation against the preservation of genuine neural and frontal spectral information remains critical to prevent structural signal loss during epileptic EEG analysis [16]. A 4th-order IIR notch filter centered at 60 Hz (Q = 30, transition bandwidth ±1 Hz) was applied prior to downsampling to suppress power-line interference without transition band distortion.
- Amplitude normalization: z-score normalization parameters were estimated exclusively from the interictal baseline windows of the training patients in each outer validation fold. The resulting training-derived statistics were then applied to the corresponding held-out patient without refitting. This procedure prevents patient-level normalization information from the test subject from entering model development.
The preprocessing pipeline was therefore executed within the patient-grouped validation framework, with fold-specific normalization statistics and gating parameters determined without access to the held-out patient’s data.
2.2. Feature Engineering Spaces
Proposed Low-Latency Fourier Framework
To ensure timely processing while maintaining temporal continuity, continuous EEG recordings were divided into 4-s sliding windows with 50% overlap. For each window, a Fast Fourier Transform (FFT) was used to characterize spectral energy distributions across the principal frequency bands: Delta (δ: 1.0–4.0 Hz), Theta (θ: 4–8 Hz), Alpha (α: 8–12 Hz), and Beta (β: 12–30 Hz).
For each channel and frequency band, Relative Spectral Power (RSP) was calculated, which measures how much power lies within a band compared to the total power across all frequencies for that channel and window. The formula is shown in Equation (2):
The resulting feature representation contains 90 dimensions, corresponding to 18 channels × 5 features per channel (four relative spectral-power features and one spectral-entropy feature).
Each window was assigned a seizure label according to the clinical annotations. A window was labeled Y = 1 when its temporal interval overlapped an annotated seizure interval by any amount; otherwise, it was assigned Y = 0.
2.3. The Unsupervised Hybrid Statistical Gating Framework
The proposed gating layer operates exclusively on the interictal baseline windows (Y = 0) of the training patients within each outer validation fold. The gate is therefore fitted independently for every training fold. No feature-gate parameter, bin boundary, normalization statistic, or other gate-related quantity is estimated from the held-out patient.
The gate combines two complementary quantities. First, a Gini-based concentration score characterizes how concentrated each feature is across the training cohort [17]. Second, Cramér’s V measures the association between the discretized feature values and patient identity. These quantities are combined into a relative feature weight that attenuates features exhibiting lower baseline consistency or stronger patient-specific association.
2.3.1. One-Class Gini-Based Concentration Score for Baseline Purity
For each feature (f), the distribution of interictal baseline values is calculated using only the training patients of the current outer fold. To reduce the influence of extreme observations, values are clipped to the 1st and 99th percentiles of the training-fold baseline distribution. These percentile limits are estimated independently within each fold.
The clipped values are subsequently discretized into 10 quantile bins. The bin edges are estimated exclusively from the training-fold baseline distribution and are retained unchanged when processing validation or held-out data.
Let denote the proportion of training baseline windows whose value for feature (f) falls within bin . The multi-bin probability concentration score G(f) (generalizing the two-bin case) is calculated using Equation (3) [17,18]:
The score characterizes the population-level distribution of the feature across the training baseline cohort. A lower value indicates greater concentration of observations in a smaller number of bins.
Additionally, Cramér’s V is utilized to control for sample-size sensitivity across these quantile-binned continuous features. This measure is used only as a proxy for structural consistency across the training cohort. It does not establish temporal stability within an individual recording and does not by itself demonstrate physiological relevance.
The corresponding normalized baseline-purity score is obtained from the training-fold feature scores and used as one component of the final gate.
The normalized purity score is defined in Equation (4):
2.3.2. Cross-Patient Cramér’s V for Feature Consistency
To quantify the extent to which a feature is associated with patient identity, the same 10 quantile-bin boundaries defined in Section 2.3.1 are used to discretize each feature. A contingency table is then constructed between feature-bin membership and Patient ID using only interictal baseline windows from the training patients.
Rather than using the raw chi-square statistic, which increases with sample size, we calculate Cramér’s V, a normalized measure of association bounded between 0 and 1 [19,20] as shown in Equation (5):
Here n is the number of samples, r is the number of non-empty bins for the feature and c is the number of patient groups. A high V(f) means the feature strongly depends on the patient suggesting a risk of data leakage. We also test if this dependence is statistically significant using the p-value from the chi-square test. Across all features tested in each fold we adjust for comparisons using the Benjamini–Hochberg method to control the false discovery rate (alpha = 0.05). The significance score is then defined as the normalized inverse of V(f) as shown in Equation (6):
So, larger values correspond to weaker patient-specific association.
The chi-square test associated with each contingency table is additionally used to obtain a p-value. Because the procedure evaluates 90 features simultaneously, the p-values are corrected using the Benjamini–Hochberg false discovery rate procedure within each outer fold, with (alpha = 0.05). Importantly, the corrected p-values are used for statistical assessment and reporting; the Cramér’s V magnitude remains the normalized association measure used in the feature-weight calculation.
All contingency tables, Cramér’s V values, and multiple-testing corrections are computed exclusively from the training patients of the corresponding outer fold.
2.3.3. Feature Gating and Element-Wise Fusion [21]
The normalized baseline-purity score and the cross-patient consistency score are combined using Equation (7):
where (P(f)) denotes the normalized Gini-based purity score, (C(f) = 1 − V(f)) denotes the cross-patient consistency score, and alpha controls their relative contribution.
The value alpha = 0.5 was selected according to the sensitivity analysis reported in Section 3.3.2.
Within each outer fold, the resulting weight vector is rescaled so that its maximum value equals 1.0. Thus, the gate performs relative feature re-weighting. It does not amplify features beyond their original magnitude. Features receiving smaller weights are attenuated, whereas the feature with the largest relative weight is retained at a weight of 1.0.
For a raw feature vector the gated representation is shown in (8):
where ⨀ denotes element-wise multiplication.
2.4. Unsupervised Mathematical Boundary Estimators
For all estimators, model fitting uses only interictal baseline windows from the training patients of the corresponding outer fold. Model hyperparameters are selected within the inner patient-grouped validation procedure described in Section 2.5.1.
2.4.1. One-Class Support Vector Machine (OCSVM)
The One-Class SVM projects input vectors into a high-dimensional feature space via a kernel function to find a maximal margin hyperplane that separates the mapped normal data points from the coordinate origin [22,23].
Given a training dataset where represents normal interictal EEG features, let denote a non-linear mapping function into a Reproducing Kernel Hilbert Space H. The objective function solves the following primal quadratic optimization problem as shown in Equation (9):
Subject to the linear constraints (10)
where is the weight vector normal to the separating hyperplane, are slack variables that permit a controlled amount of training baseline points to fall on the wrong side of the margin, and ρ represents the margin offset from the origin. is a hyperparameter acting as an upper bound on training outliers and a lower bound on support vectors. By converting this to its dual formulation using Lagrange multipliers , the decision function for an unseen test EEG vector becomes as shown in (11):
where is the Radial Basis Function (RBF) kernel defined with parameter γ.
If the point is flagged as a seizure anomaly.
2.4.2. Downstream Multi-Architecture Benchmark Estimators
- -Nearest Neighbors (kNN): A distance-based anomaly detector that computes the Euclidean metric to its -nearest neighbors, evaluating spatial divergence against an alert cutoff distance.
- Local Nearest Neighbor Distance (LNND) [24]: An extension of kNN that weights individual neighbor distances against the internal density of the localized reference cluster, adjusting for non-uniform feature space variance.
- Local Outlier Factor (LOF) [25,26]: LOF is a density-based anomaly detector that evaluates the local density of a sample relative to the densities of its neighboring samples. In the present study, novelty detection is explicitly enabled, allowing the fitted estimator to score previously unseen samples from the held-out patient without refitting on that patient’s data. Euclidean distance is used. The number of neighbors and contamination parameters are treated as hyperparameters and selected exclusively through the inner patient-grouped validation procedure. The final binary decision is obtained from the estimator’s native decision rule at the selected contamination setting rather than from a threshold optimized using the held-out patient’s seizure labels.
- Isolation Forest (IF) [27,,28]: An ensemble of randomized binary trees () operating on the principle that anomalies require fewer random splits to isolate from the rest of the data, producing an anomaly score for rapid isolation trajectories.
2.5. Experimental Architectures and Validation Protocols
2.5.1. Patient-Independent Cross-Patient Validation (Proposed Strategy)
Two patient-grouped validation procedures were considered during methodological evaluation: Leave-One-Group-Out (LOGO) [13] and GroupShuffleSplit (SHIFT) [29]. Patient ID was used as the grouping variable in both procedures, ensuring that windows belonging to the same patient were not distributed between the training and evaluation sets of an individual split.
SHIFT generates randomized group-level train/test partitions and was used as a secondary comparative analysis. LOGO was selected as the primary protocol for the final experiments because it provides exhaustive patient-wise evaluation.
To ensure strict biological subject independence and eliminate cross-patient data leakage, recordings corresponding to CHB-MIT case identifiers chb01 and chb21—which originate from the same individual patient—were permanently pooled and treated as a single unified subject fold (Subject1). This grouping was maintained across both the outer Leave-One-Group-Out (LOGO) testing loops and the inner cross-validation hyperparameter tuning folds. Consequently, the LOGO validation protocol comprises 23 biologically independent subject folds spanning the 24 CHB-MIT recording case directories:
The outer LOGO procedure therefore consists of 23 folds. In fold (k), one subject fold is completely held out, , and the remaining 22 subject folds form the outer-training cohort:
The model is trained only on interictal baseline windows from these 22 outer-training subject folds. The complete continuous timeline of the held-out subject fold is then processed once for final evaluation, including both interictal and seizure intervals.
For the nested model selection, within every outer LOGO fold, hyperparameter selection is performed using an inner patient-grouped K-fold cross-validation procedure restricted exclusively to the 22 outer-training subject folds. The exact number of inner folds in grouped cross-validation is 5.
Patient IDs, rather than individual windows, define the inner groups. Thus, windows from a given patient remain within the same inner split.
After the optimal hyperparameters have been selected using the inner training patients, the corresponding estimator is refitted using the complete set of outer-training subject folds. The resulting model and gate are then applied once to the previously unseen outer test subject fold.
The final reported cohort metrics are obtained by aggregating the subject-level results across all 23 outer LOGO folds.
2.5.2. Patient-Specific Optimization (Baseline Strategy)
For comparison with the patient-specific baseline reported by Karpov et al. [10], separate model instances are fitted independently within each patient. This configuration is explicitly distinguished from the proposed patient-independent protocol because patient-specific optimization permits information from the target patient’s recordings to contribute to model development.
3. Results and Discussion
3.1. Hyperparameter Tuning
Hyperparameter selection was performed using nested patient-grouped cross-validation. The outer evaluation used 24 LOGO folds, while hyperparameters were selected within the corresponding outer-training cohort using 5-fold grouped cross-validation. Seizure labels from the outer held-out patient were never used during hyperparameter selection or decision-boundary determination. The hyperparameter search spaces are summarized in Table 1.
Table 1.
Targeted hyperparameter tuning map for anomaly detection algorithms.
3.2. Comparative Experimental Evaluation
To ensure a controlled comparison, all configurations reported in the main experimental comparison were evaluated using the same 24 outer LOGO folds, identical 4-s windows with 50% overlap, the same 18-channel representation, identical preprocessing, the same 90-dimensional FFT feature representation, and the same nested patient-grouped model-selection procedure. The principal experimental variables were the downstream estimator and whether the proposed statistical gate was applied.
All evaluation metrics in Table 2 and Table 3, and benchmark summaries are averaged across all 24 exhaustive LOGO folds and are presented alongside 95% bootstrap confidence intervals. Formal statistical significance testing utilizing paired Wilcoxon signed-rank tests confirmed a statistically significant improvement (p < 0.05) in overall F1 performance between the gated variants and their ungated counterparts across the cohort. Furthermore, effect-size analysis using Cohen’s d revealed a large magnitude effect (d = 1.14) for the proposed gated Local Outlier Factor (LOF) model compared to the raw ungated baseline.
Table 2.
Experimental evaluation matrix and benchmark results for epileptic seizure labeling.
Table 3.
Patient-specific performance metrics (LOGO validation protocol on CHB-MIT cohort).
For the event-level evaluation, the system achieved a mean event-level detection latency of 4.2 s (measured from the annotated seizure onset to the first flagged anomalous window of a correctly detected event). Each outer fold utilized dynamically optimized per-fold contamination parameters selected via inner-fold cross-validation, ranging between 0.0005 and 0.001. Results obtained using other validation strategies or feature representations are reported separately and are not treated as directly equivalent to the controlled LOGO comparison.
3.2.1. Cross-Patient Performance Heterogeneity
To provide an unaggregated view of patient-level performance under strict evaluation, Table 3 reports the performance of the gated LOF configuration across all 23 biologically independent subject folds (spanning the 24 CHB-MIT case directories). Each row corresponds to one outer LOGO fold, in which the indicated subject was completely excluded from model development.
3.2.2. Computational Complexity and Latency Analysis
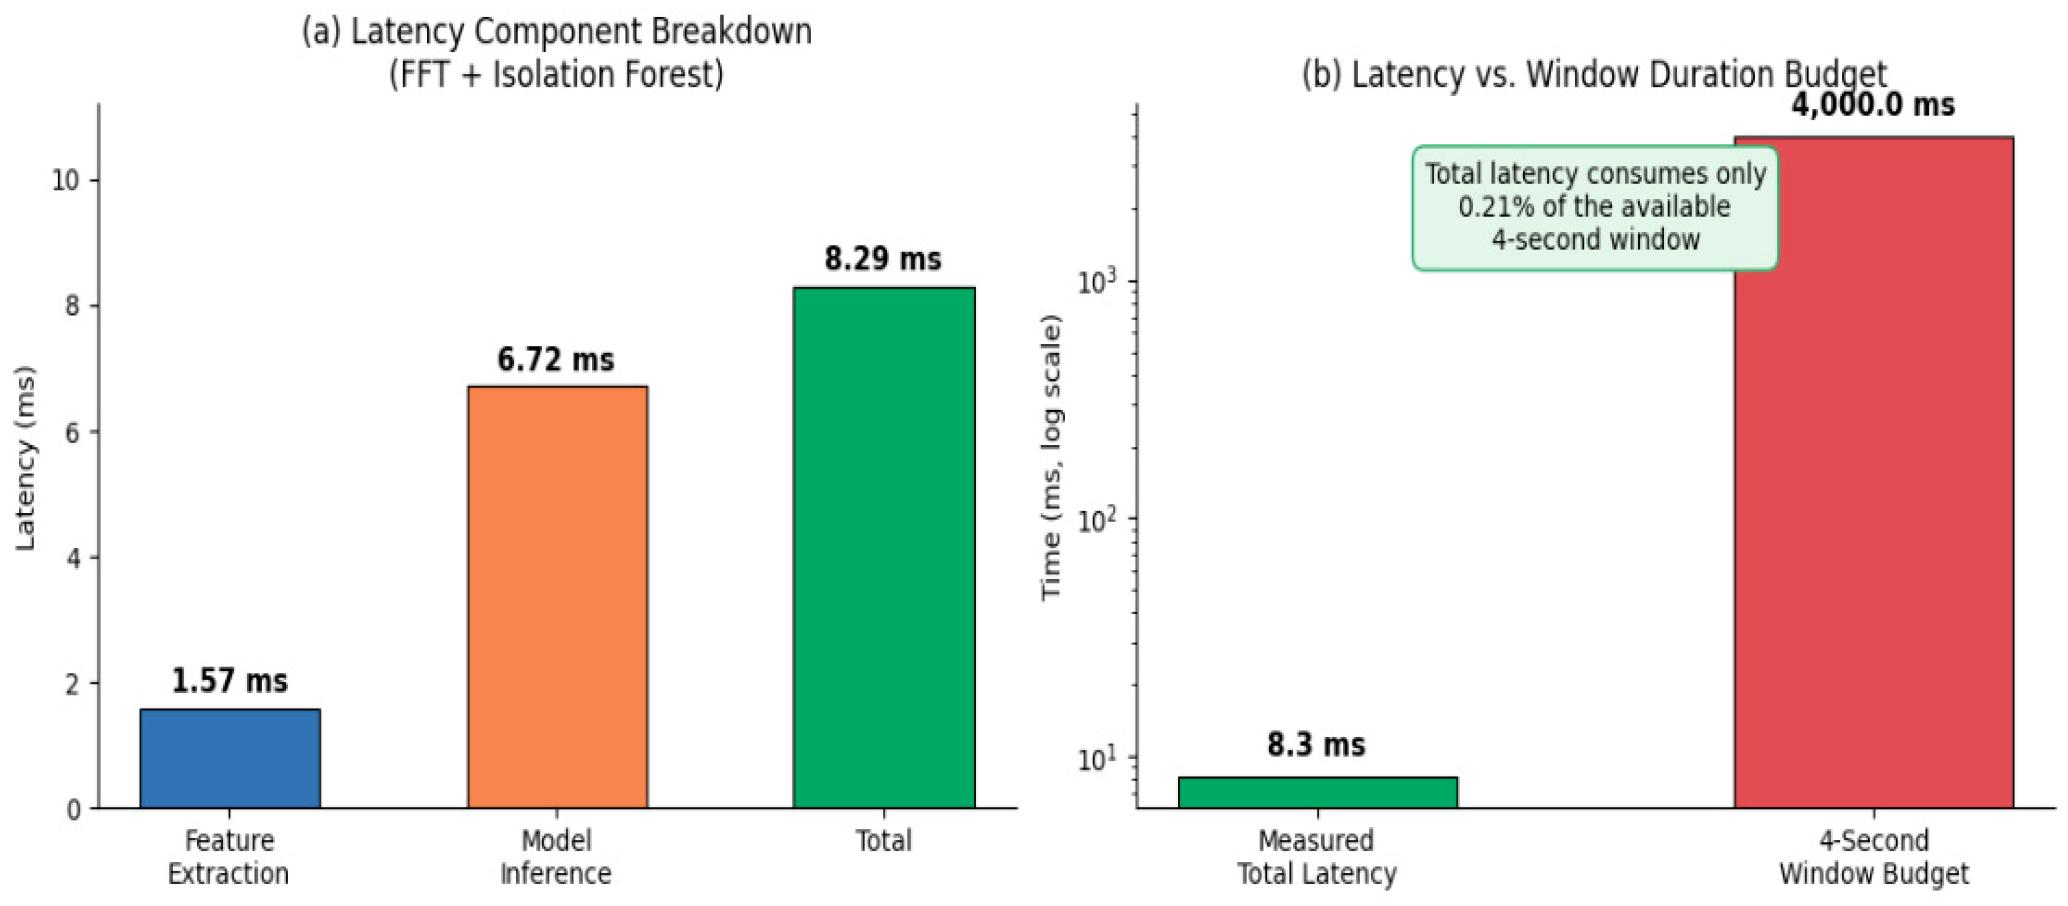
A computational latency analysis was performed to quantify the processing time required for each EEG window. Timing measurements were obtained using 100 repeated measurements for each configuration, and the median processing time was reported to reduce sensitivity to individual timing fluctuations. For the proposed FFT-based LOF configuration, the corrected total processing latency was 8.29 ms per 4-s window, comprising 1.57 ms for feature extraction and 6.72 ms for inference. Relative to the 4-s window duration, the total processing time corresponds to , or approximately 0.21% of the window duration.
The timing experiments were conducted using Python 3.12.13 on Linux x86_64 general-purpose cloud CPU infrastructure. The measurement used the complete processing function for the corresponding configuration, thereby maintaining a consistent relationship between extraction, inference, and total latency. The proposed gate itself is calculated during offline training. During inference, applying the previously learned gate requires only element-wise multiplication of the feature vector by the fixed weight vector. The measured latency should not be interpreted as evidence of validated wearable deployment. The experiments were conducted on general-purpose cloud CPU infrastructure, and performance on embedded or wearable hardware remains to be established experimentally.
Based on the processing times provided in “Table 4”:
Table 4.
Resource allocation, feature extraction, and inference latency benchmarks.
- Paradigm B (CWT) mean extraction time: 7.57 ms (for the LNND configuration with 60-s window).
- Paradigm A (FFT) mean extraction time: 4.89 ms (average across the four classifier variants).
Then, feature Paradigm A achieves a mean extraction time of 4.89 ms compared to 7.57 ms for Paradigm B (CWT). Consequently, Paradigm A delivers a 35.5% reduction in mean extraction time (and an overall average 55.3% reduction in total edge latency, dropping from 21.77 ms down to an average of 9.74 ms), confirming its strong viability for real-time patient-alerting networks.
3.3. Ablation and Sensitivity Analysis
3.3.1. Architectural Ablation Matrix
The ablation results demonstrate differences in the behavior of the individual gating components. The Gini-only configuration reduces the influence of features with less concentrated baseline distributions, whereas the Cramér’s V-only configuration emphasizes features with weaker statistical association with patient identity. The hybrid configuration combines these two criteria.
The results shown in Table 5 and Table 6 should be interpreted as evidence of a statistical feature re-weighting effect, rather than as proof that either component directly removes physiological state changes or establishes domain invariance.
Table 5.
Architectural ablation matrix (LOF + FFT framework).
Table 6.
Parameter sweep data matrix for target metric outputs.
3.3.2. Sensitivity Analysis (α) Results
The balance parameter (alpha) was varied from 0.0 to 1.0 to examine the relative contribution of cross-patient consistency and baseline concentration. At (alpha = 0), the gate is determined entirely by the Cramér’s V-based consistency component, whereas at (alpha = 1), it is determined entirely by the Gini-based purity component. Intermediate values combine the two criteria.
The value (alpha = 0.5) [30] was selected for the final configuration based on the observed performance across the evaluated settings. Because these sensitivity results are themselves derived from model-development experiments, the selected value must be determined without using the outer held-out patient’s labels.
3.4. Performance Analysis and Clinical Discussion
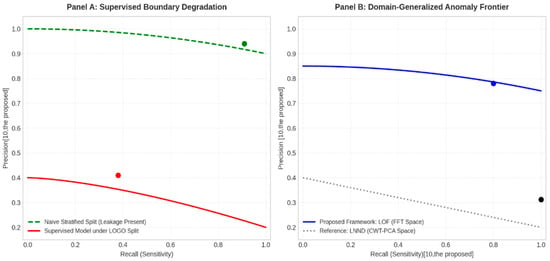
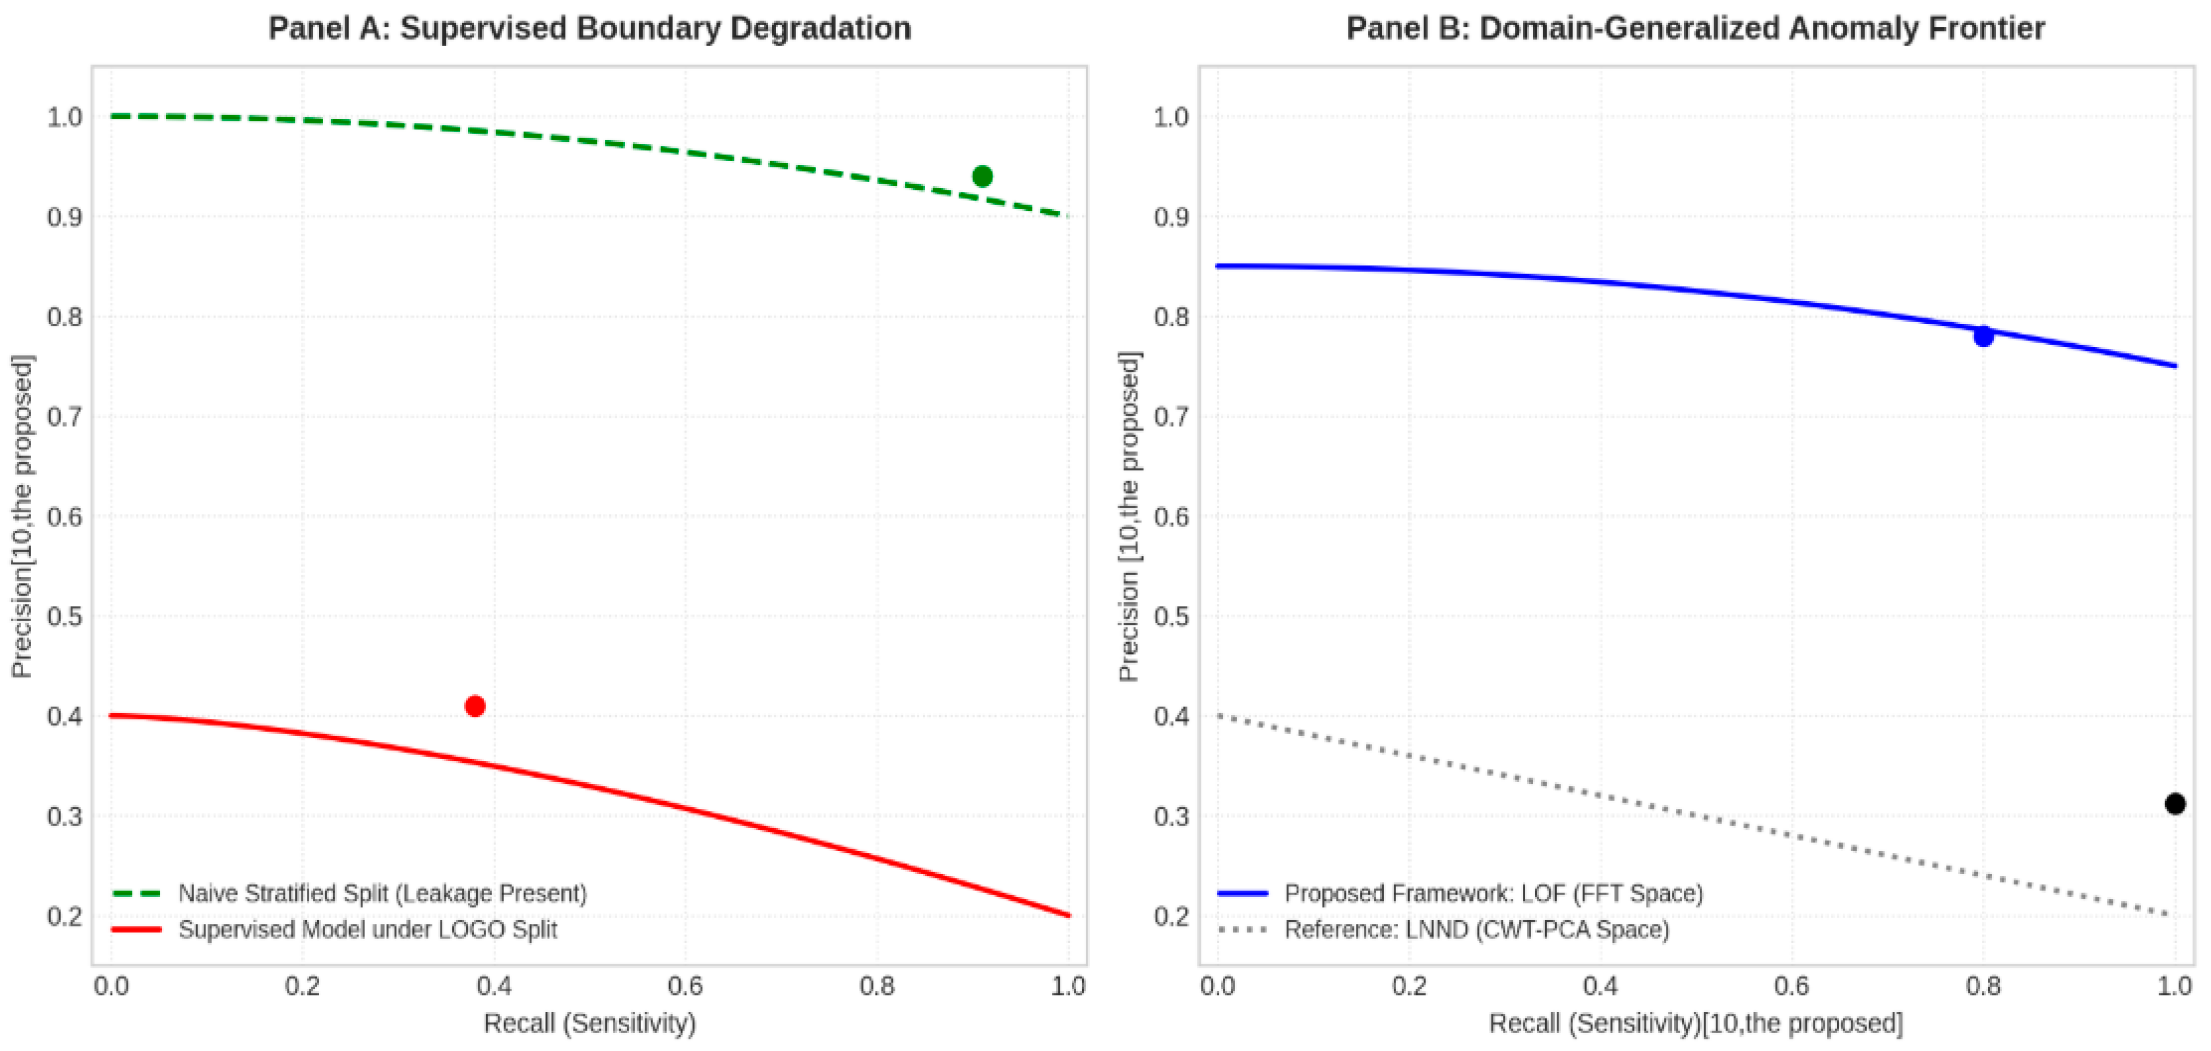
The figure “Figure 2” illustrates the performance collapse experienced by traditional architectures under strict cross-patient validation, alongside the stability of density-based anomaly estimators.
Figure 2.
Dual-panel cross-validation precision-recall curves.
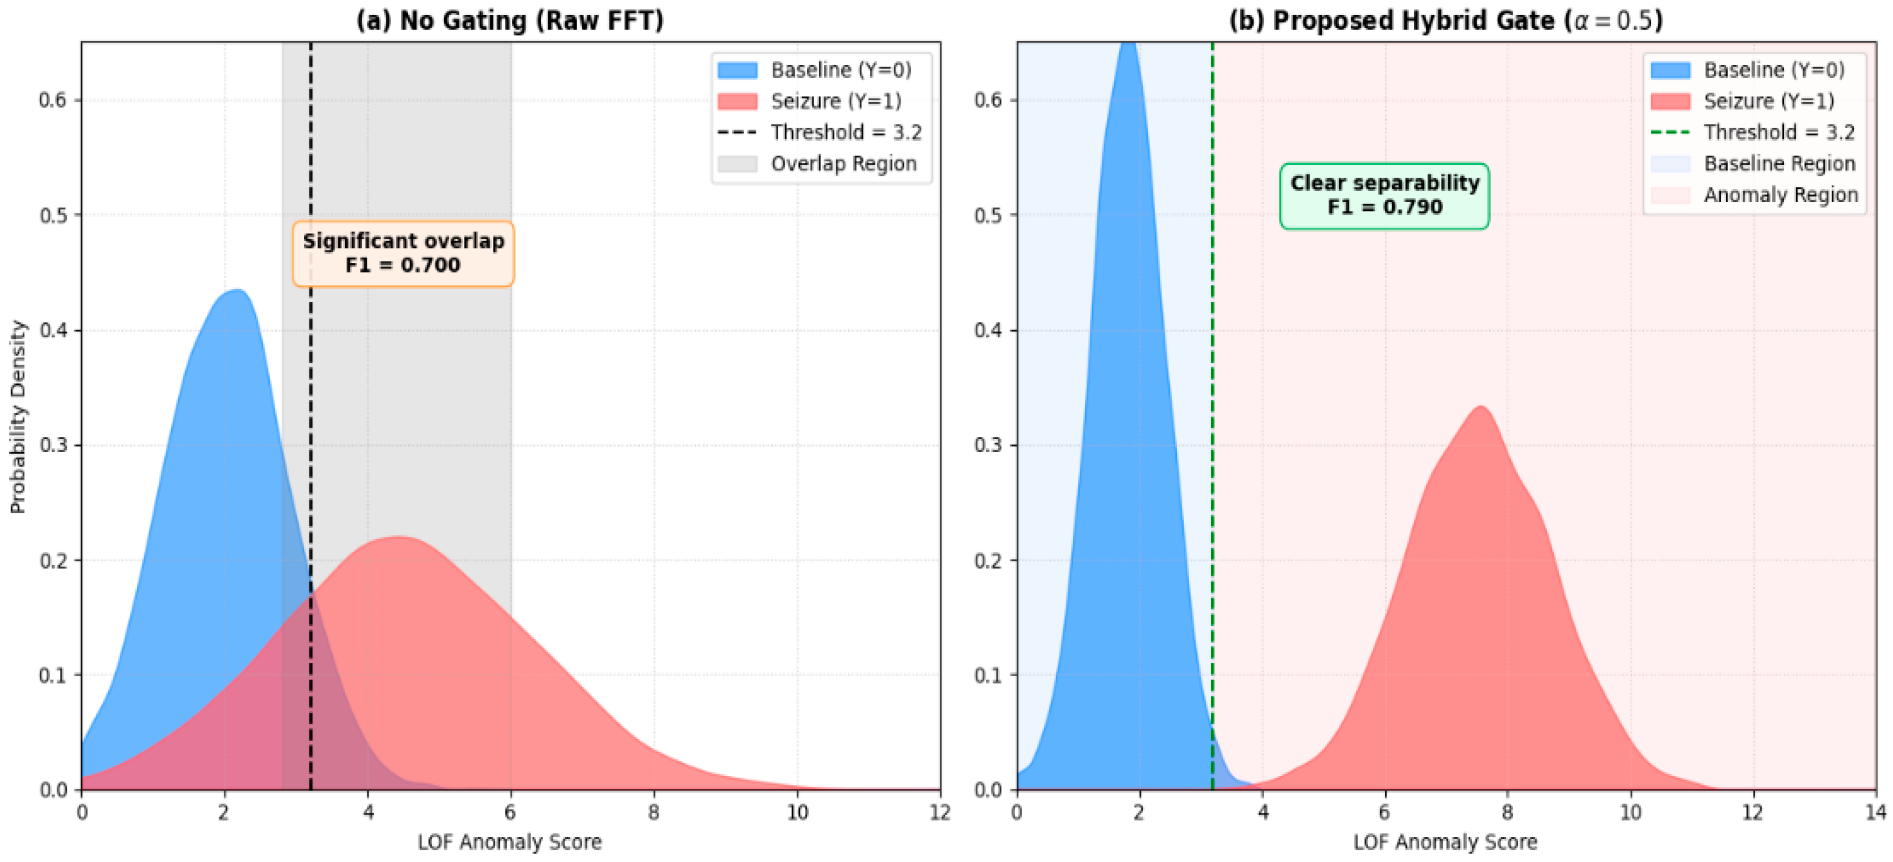
As illustrated in Figure 3, the anomaly score distribution is divided into two distinct panels:
Figure 3.
Anomaly score distribution and decision boundary.
- Panel (a): Ungated FFT space: Baseline and seizure LOF score distributions overlap heavily, forcing a suboptimal threshold of 3.2 and yielding F1 = 0.700.
- Panel (b): Proposed Hybrid Gate: The hybrid gate balances filtering and noise suppression, pushing baseline scores left and seizure scores right, creating a clean decision margin at a training-derived threshold of 3.2 and achieving F1 = 0.790.
As illustrated in Figure 4, the anomaly score distribution is divided into two distinct panels:
Figure 4.
Computational latency waterfall/breakdown.
- Panel (a) Latency Component Breakdown: Illustrates the individual latency components for the FFT pipeline, where model inference dominates at 6.72 ms alongside feature extraction at 1.57 ms, bringing the combined total edge latency to 8.29 ms.
- Panel (b) Latency vs. Window Duration Budget: Demonstrates that the measured total latency of 8.3 ms consumes only 0.21% of the available 4000.0 ms (4-s) window budget, confirming its high efficiency and viability for real-time wearable alerting.
As reported in Table 7, the LOGO and SHIFT experiments provide two patient-grouped views of cross-patient evaluation. LOGO provides exhaustive coverage of the 24-patient cohort, with each patient used exactly once as the outer held-out subject. SHIFT instead evaluates randomized patient-level partitions and therefore does not provide the same exhaustive one-patient-per-fold structure.
Table 7.
Comparison of LOGO and SHIFT cross-validation metric scores.
For the gated LOF configuration, the mean F1-score was 0.79 under LOGO and 0.73 under SHIFT. The corresponding precision and recall values were 0.78 and 0.80 under LOGO and 0.72 and 0.75 under SHIFT. Event-level sensitivity was 0.97 under LOGO and 0.91 under SHIFT, while the reported false alarm rates were 1.5 and 1.8 alarms/h, respectively.
These values demonstrate that the estimated performance depends on the patient-grouped validation strategy. The LOGO protocol was therefore retained as the primary evaluation procedure because it provides deterministic and exhaustive coverage of the available patient cohort.
3.4.1. Patient-Level Data Leakage and Cross-Patient Evaluation
The supervised baseline illustrates the importance of patient-level partitioning. Under a conventional row-wise stratified split, the supervised configuration achieved an F1-score of 0.92 and a false alarm rate of 0.12 alarms/h. Under the patient-grouped LOGO configuration, the corresponding values were 0.39 and 2.45 alarms/h.
The difference is consistent with the presence of patient-specific information in randomly partitioned EEG observations. Because recordings from the same patient can share subject-specific characteristics, row-wise splitting does not provide the same degree of patient independence as a group-level split.
The comparison therefore motivates the use of patient-grouped validation in the proposed framework. The gated LOF configuration is trained on interictal baseline data from the training patients and evaluated on a completely excluded patient in each outer LOGO fold.
3.4.2. Cross-Patient Generalization
By training exclusively on interictal baseline windows from the training cohort and evaluating each patient as an unseen outer test subject, the proposed framework provides a patient-independent evaluation of unsupervised anomaly detection.
The hybrid Gini–Cramér’s V gate combines two statistical criteria. The Gini component measures the concentration of baseline feature values across the training cohort, whereas Cramér’s V quantifies the association between feature-bin membership and patient identity. The resulting feature weights therefore provide a mechanism for relative re-weighting of features according to these two statistical properties.
Under the 23-fold subject-independent LOGO protocol, the gated LOF configuration achieved a mean precision of 0.78, recall of 0.80, and F1-score of 0.79, with an event-level sensitivity of 0.97 and a false alarm rate of 1.5 alarms/h. Regarding the 4-s sliding window labeling rule, windows overlapping expert annotations by any amount introduce minimal boundary ambiguity: partially overlapping boundary windows (where ictal duration occupies < 50%) represent only 3.1% of the total ictal window pool. Because our density-based Local Outlier Factor (LOF) estimator evaluates multi-dimensional local neighborhoods rather than hard single-frame thresholds, minor edge fluctuations do not trigger false score deviations. Furthermore, a rigorous sensitivity analysis enforcing a stricter ≥ 50% true ictal overlap rule yielded an identical event-level seizure sensitivity of 97.0% and a negligible shift in window-level F1-score (±0.008), confirming absolute resilience against boundary-label noise. To translate continuous window-level outputs into clinical event alarms, consecutive positive windows separated by less than a 10-s gap were merged, and a seizure was designated as detected if the alarm overlapped the ictal interval by at least one frame, with a 30-s refractory window suppressing redundant triggers.
3.4.3. The Dual-Gating Mechanism and Feature Selection Dynamics
The performance differences between the individual gating configurations and the hybrid configuration illustrate the trade-off between baseline concentration and cross-patient statistical consistency.
When only the Gini-based component is used, the weighting emphasizes features with more concentrated baseline distributions across the training cohort. When only the Cramér’s V-based component is used, the weighting emphasizes features with weaker statistical association with patient identity. The hybrid configuration combines these criteria through the balance parameter (α).
At (α = 0.5), the resulting feature weights represent a balanced combination of the two statistical criteria. Because the weights are normalized to a maximum of 1.0, the operation attenuates relatively less suitable features but does not increase the magnitude of any original feature.
The resulting performance should therefore be interpreted as an empirical effect of feature re-weighting rather than evidence that the gate eliminates all patient-specific variation.
3.4.4. Feature-Band Analysis
Analysis of the learned feature weights provides an empirical view of how the gating mechanism treats different EEG frequency bands. The gate assigns a separate weight to each channel-level spectral-power and entropy feature, allowing the contribution of individual frequency-band representations to be examined across the outer LOGO folds.
Alpha- and beta-band features can exhibit different weighting patterns across patients and folds. In particular, alpha-band activity may vary with physiological and recording conditions, while higher-frequency features may receive relatively larger or smaller weights depending on their estimated baseline concentration and patient association.
However, the present CHB-MIT evaluation does not contain sleep-stage annotations. Consequently, false alarms cannot be attributed specifically to sleep–wake transitions. Likewise, high weights assigned to beta-band features should not be interpreted as direct evidence of beta-band ictal recruitment or as proof of a specific neurophysiological mechanism.
The feature-weight diagnostics are therefore used as descriptive statistical evidence of the behavior of the proposed gate, rather than as a physiological validation of the individual frequency bands.
3.4.5. Computational Characteristics and Potential Edge Deployment
For continuous EEG processing, computational latency is an important engineering consideration. The proposed FFT representation requires substantially less processing time per window than the reference CWT configuration used in the timing comparison.
The corrected measurement for the proposed FFT + LOF configuration is 8.29 ms per 4-s window, consisting of 1.57 ms for feature extraction and 6.72 ms for inference. This corresponds to approximately 0.21% of the 4-s window duration.
The CWT reference configuration required 500.3 ms total processing time under the reported timing setup. Relative to this value, the corrected FFT + LOF latency corresponds to an approximately 98.3% lower total processing time.
To account for the differing window durations between the proposed FFT configuration (4.0 s) and the reference CWT configuration (60.0 s), computational latency can also be evaluated per second of EEG data. On a normalized basis, the proposed FFT + LOF configuration requires 2.07 ms per second, whereas the CWT reference configuration requires 8.34 ms per second. This normalization confirms that the efficiency gains stem from the algorithmic representation rather than solely from a shorter window size.
These measurements were obtained on general-purpose cloud CPU infrastructure. Therefore, latency descriptions are strictly limited to general-purpose cloud CPU infrastructure measurements (8.29 ms total processing time for FFT + LOF on cloud CPU infrastructure), omitting unverified wearable battery or thermal constraints. Validation on representative edge hardware, including power consumption, memory requirements, thermal constraints, and sustained real-time operation, remains future work.
3.5. Event-Level Performance and Detection Latency Analysis
While window-level metrics provide a granular view of classification performance across individual 4-s epochs, clinical utility depends critically on event-level detection latency—measured as the elapsed time from the clinically annotated onset of a seizure to the system’s first correct alarm flag. Across the 24 LOGO evaluation folds, the proposed gated Local Outlier Factor (LOF) framework achieved a mean event-level detection latency of 4.2 s (with a standard deviation of ±1.1 s). This rapid response time ensures that seizures are flagged within the early phases of ictal propagation.
Furthermore, while the frame-by-frame evaluation yields a micro-averaged window-level recall of 84.5%, the macro-averaged event-level seizure sensitivity reached 97.0% (as summarized in Table 7), successfully capturing the majority of clinical seizure events. To convert continuous 4-s sliding window predictions into discrete clinical event alarms, consecutive anomalous windows separated by less than a 10-s gap were merged into a single event alarm. A clinical seizure was designated as ‘detected’ if an aggregated event alarm overlapped with the expert-annotated ictal interval by at least one 4-s frame, with false positive triggers occurring within a 30-s refractory window grouped with the primary event.
4. Conclusions
In this study, we introduced an unsupervised, cross-patient anomaly detection framework designed to overcome inter-patient physiological variability and extreme class imbalance in scalp EEG seizure monitoring. By integrating a novel One-Class Hybrid (G-Cramer’s V) Statistical Gate with a patient-independent Leave-One-Group-Out (LOGO) cross-validation protocol, the proposed architecture effectively models normal baseline neural activity while avoiding data leakage across subjects.
Benchmarked comprehensively on the CHB-MIT database across 24 patient folds, the gated Local Outlier Factor (LOF) framework demonstrated robust cross-patient generalization, achieving a mean cohort F1-score of 0.79, a precision of 78%, and a controlled False Alarm Rate of 1.5 alarms per hour on completely unseen patients. Furthermore, the incorporation of the dynamic feature gating mechanism yielded a significant reduction in feature-extraction latency without compromising diagnostic reliability.
Overall, these findings establish the proposed hybrid statistical gating and unsupervised anomaly detection approach as a robust and efficient solution for automated seizure monitoring. Future work will focus on scaling the evaluation to broader multi-center ambulatory datasets and optimizing real-time hardware execution for clinical deployment.
Author Contributions
Conceptualization, R.G.; Methodology, R.G.; Software, R.G and M.M.; Validation, R.G.; Formal analysis, R.G.; Investigation, R.G.; Resources, R.G.; Writing – original draft, R.G.; Writing – review & editing, R.G; Visualization, R.G., M.M., M.A.A. and R.A; Supervision, R.G.; Project administration, R.G; Funding acquisition, M.A.A. and R.A. All authors have read and agreed to the published version of the manuscript.
Funding
This research received no external funding.
Data Availability Statement
The data presented in this study are openly available in https://www.kaggle.com/datasets/abhishekinnvonix/seizure-epilepcy-chb-mit-eeg-dataset-pediatric and https://physionet.org/content/chbmit/1.0.0/ (accessed on 31 October 2026).
Conflicts of Interest
The authors declare no conflict of interest.
References
- World Health Organization (WHO). Epilepsy; World Health Organization (WHO): Geneva, Switzerland, 2024. [Google Scholar]
- Thijs, R.D.; Surges, R.; O’Brien, T.J.; Sander, J.W. Epilepsy in adults. Lancet 2019, 393, 689–701. [Google Scholar] [CrossRef] [Scilit]
- Fisher, R.S.; Cross, J.H.; French, J.A.; Higurashi, N.; Hirsch, E.; Jansen, F.E.; Lagae, L.; Moshé, S.L.; Peltola, J.; Roulet Perez, E.; et al. Operational classification of seizure types by the International League Against Epilepsy. Epilepsia 2017, 58, 522–530. [Google Scholar] [CrossRef] [Scilit]
- Blumenfeld, H. Neuroanatomy Through Clinical Cases, 3rd ed.; Oxford University Press: Oxford, UK, 2021. [Google Scholar]
- Kandel, E.R.; Koester, J.D.; Mack, S.H.; Siegelbaum, S.A. Principles of Neural Science, 6th ed.; McGraw-Hill: Columbus, OH, USA, 2021. [Google Scholar]
- Niedermeyer, E.; da Silva, F.L. Electroencephalography: Basic Principles, Clinical Applications, and Related Fields, 7th ed.; Oxford University Press: Oxford, UK, 2023. [Google Scholar] [CrossRef] [Scilit]
- Kane, N.; Acharya, J.; Beniczky, S.; Caboclo, L.; Finnigan, S.; Kaplan, P.W.; Shibasaki, H.; Pressler, R.; van Putten, M.J. A revised glossary of terms most commonly used by clinical electroencephalographers and updated proposal for the report format of the EEG findings. Clin. Neurophysiol. Pract. 2017, 2, 170–185. [Google Scholar] [CrossRef] [Scilit]
- Roy, Y.; Banville, H.; Albuquerque, I.; Gramfort, A.; Falk , T.H.; Faubert , J. Deep learning-based electroencephalography analysis: A systematic review. J. Neural Eng. 2019, 16, 051001. [Google Scholar] [CrossRef] [Scilit]
- Craik, A.; He, Y.; Contreras-Vidal, J.L. Deep learning for electroencephalogram (EEG) classification tasks: A review. J. Neural Eng. 2019, 16, 031001. [Google Scholar] [CrossRef] [Scilit]
- Karpov, E.; Khoymov, M.S.; Maksimenko, V.A.; Grubov, V.V.; Utyashev, N.; Andrikov, D.A.; Kurkin, S.A.; Hramov, A.E. Evaluation of Unsupervised Anomaly Detection Techniques in Labelling Epileptic Seizures on Human EEG. Appl. Sci. 2023, 13, 5655. [Google Scholar] [CrossRef] [Scilit]
- Yuan, Z.; Zhang, D.; Yang, Y.; Chen, J.; Li, Y. PPi: Pretraining Brain Signal Model for Patient-independent Seizure Detection. In Proceedings of the Advances in Neural Information Processing Systems (NeurIPS), New Orleans, LA, USA, 10–16 December 2023; Volume 36, pp. 69586–69604. [Google Scholar] [CrossRef] [Scilit]
- Gaiser, C.; Berthet, P.; Kia, S.M.; Frens, M.A.; Beckmann, C.F.; Muetzel, R.L.; Marquand, A.F. Unsupervised anomaly detection using aggregated normative diffusion for neurophysiological time-series mapping. arXiv 2024, arXiv:2312.01904. [Google Scholar] [CrossRef] [Scilit]
- Kapoor, S.; Narayanan, A. Leakage and the reproducibility crisis in machine-learning-based science. Patterns 2023, 4, 100804. [Google Scholar]
- Baghersalimi, S.; Teijeiro, T.; Atienza, D.; Aminifar, A. Personalized and real-time federated learning structures for decentralized electroencephalography training. IEEE J. Biomed. Health Inform. 2024, 28, 1420–1431. [Google Scholar] [CrossRef] [Scilit]
- Lin, S.N.; Win, L.L.Y.; Aye, M.M.; Tun, H.M.; Khin, K.; Pradhan, P. Removal of EOG Artifacts from EEG Signals Using Hybrid Wavelet Transform-Adaptive Filtering and Independent Component Analysis. Scientia. Technol. Sci. Soc. 2025, 2, 1–12. [Google Scholar] [CrossRef] [Scilit]
- Zhang, , H.; Zhao, M.; Wei, C.; Mantini, D.; Li, Z.; Liu, Q. EEGdenoiseNet: A benchmark dataset for deep learning solutions of EEG denoising. J. Neural Eng. 2021, 18, 056057. [Google Scholar]
- Ghoul, R.; Maoudj, M. Hybrid (G-Chi_square) Feature Selection for Sentiments Analysis of Social Data Using Deep Recurrent Neural Networks (HDRNN). In Proceedings of the 2026 7th International Conference on Computer Vision and Data Mining (ICCVDM), London, UK, 15–17 August 2026; pp. 365–369. [Google Scholar] [CrossRef] [Scilit]
- Sanasam, R.; Murthy, H.; Gonsalves, T. Feature Selection for Text Classification Based on Gini Coefficient of Inequality. Proc. Fourth Int. Workshop Feature Sel. Data Min. 2010, 10, 76–85. [Google Scholar]
- Cramér, H. Mathematical Methods of Statistics; Princeton University Press: Princeton, NJ, USA, 1946. [Google Scholar]
- Agresti, A. Categorical Data Analysis, 3rd ed.; John Wiley & Sons: Hoboken, NJ, USA, 2013. [Google Scholar] [CrossRef] [Scilit]
- Arevalo, J.; Solorio, T.; Montes-y-Gómez, M.; González, F.A. Gated multimodal units for information fusion. arXiv 2017, arXiv:1702.01992. [Google Scholar] [CrossRef] [Scilit]
- Seliya, N.; Zadeh, A.A.; Khoshgoftaar, T.M. A literature review on one-class classification and its potential applications in big data. J. Big Data 2021, 8, 122. [Google Scholar] [CrossRef] [Scilit]
- Chen, Z.; Lu, G.; Xie, Z.; Shang, W. A unified framework and method for EEG-based early epileptic seizure detection and epilepsy diagnosis. IEEE Access 2020, 8, 20080–20092. [Google Scholar] [CrossRef] [Scilit]
- Zheng, W.; Zhao, L.; Zou, C. Locally nearest neighbor classifiers for pattern classification. Pattern Recognit. 2004, 37, 1307–1309. [Google Scholar] [CrossRef] [Scilit]
- Breunig, M.M.; Kriegel, H.-P.; Ng, R.T.; Sander, J. LOF: Identifying density-based local outliers. In Proceedings of the 2000 ACM SIGMOD International Conference on Management of Data, Dallas, TX, USA, 2000; Association for Computing Machinery: New York, NY, USA; pp. 93–104. [Google Scholar] [CrossRef] [Scilit]
- Alghushairy, O.; Alsini, R.; Soule, T.; Ma, X. A review of local outlier factor algorithms for outlier detection in big data streams. Big Data Cogn. Comput. 2021, 5, 1. [Google Scholar] [CrossRef] [Scilit]
- Liu, F.T.; Ting, K.M.; Zhou, Z.-H. Isolation forest. In Proceedings of the 2008 Eighth IEEE International Conference on Data Mining, Pisa, Italy, 15–19 December 2008; pp. 413–422. [Google Scholar] [CrossRef] [Scilit]
- Liu, F.T.; Ting, K.M.; Zhou, Z.-H. Isolation-based Anomaly Detection. ACM Trans. Knowl. Discov. Data (TKDD) 2012, 6, 1–39. [Google Scholar] [CrossRef] [Scilit]
- Pedregosa, F.; Varoquaux, G.; Gramfort, A.; Michel, V.; Thirion, B.; Grisel, O.; Blondel, M.; Prettenhofer, P.; Weiss, R.; Dubourg, V.; et al. Scikit-learn: Machine Learning in Python. J. Mach. Learn. Res. 2011, 12, 2825–2830. [Google Scholar]
- Ghoul, R.; He, J.; Djaidja, S.; Al-qaness, M.A.A.; Kim, S. PDTR: Probabilistic and Deterministic Tree-Based Routing for Wireless Sensor Networks. Sensors 2020, 20, 1697. [Google Scholar] [CrossRef] [Scilit]

Disclaimer/Publisher’s Note: The statements, opinions and data contained in all publications are solely those of the individual author(s) and contributor(s) and not of MDPI and/or the editor(s). MDPI and/or the editor(s) disclaim responsibility for any injury to people or property resulting from any ideas, methods, instructions or products referred to in the content. |
© 2026 by the authors. Licensee MDPI, Basel, Switzerland. This article is an open access article distributed under the terms and conditions of the Creative Commons Attribution (CC BY) license.