


Abstract
Understanding hand–paddle interaction is essential for optimizing performance and preventing injury in kayaking, yet coaches still lack objective, practical tools. We present a soft, instrumented glove that measures and dynamically maps palmar pressure throughout the stroke cycle. A matrix of piezoresistive sensors is integrated into the glove and connected to dedicated electronics housed in a waterproof enclosure. A viscoelastic model converts sensor resistance into forces, enabling time-resolved 3D mapping of contact mechanics. Data are transmitted via Bluetooth Low Energy (BLE). Experimental validation on a kayak ergometer across multiple cadences demonstrated accurate measurements (per-sensor root mean square error (RMSE) of ±2 N), clear delineation of pull and push phases, evolving pressure distribution over the motion, and a peak total right-hand force of 186 N at high cadence. Beyond feasibility, these results position the glove as a practical training aid: it supports athlete-specific load monitoring and the early detection of potentially problematic movement patterns.
1. Introduction
1.1. General Context
Measuring hand grip forces is a central issue in the study of hand–object interactions, particularly in sport and health. In public health, grip strength is commonly assessed as the maximal isometric force exerted when squeezing a dynamometer. Lower grip strength has been associated with increased risks of all-cause and cardiovascular mortality [1], while the screening of sarcopenia and frailty remains highly dependent on the thresholds used to define low grip strength [2]. International reference standards have further highlighted the importance of harmonized measurement protocols to facilitate comparisons across populations and contexts [3]. In addition, absolute grip strength appears to outperform several normalized indices for mortality prediction [4]. Despite their clinical relevance, these approaches rely on standardized maximal-grip measurements and provide only limited information about real-world palmar grasp, palm–finger coordination, grip technique, or the evolution of force during movement.
In sport, grip strength is both a capacity to be preserved and an indicator of fatigue. For example, warm-up strategies can influence sport-specific performance while affecting grip strength differently in young judoka [5]. In climbing, elite athletes exhibit superior intermittent endurance of the finger flexors and faster muscle reoxygenation during repeated efforts, emphasizing the importance of the forearm musculature in sustaining prolonged holds [6]. However, these studies remain largely based on standardized gripping tasks or specific finger postures and therefore only partially reflect the complexity of real hand–object interactions, where palm–finger integration, object geometry, friction, and force distribution play a central role.
1.2. Sensor Technologies
Palmar pressure can be measured using several sensing technologies. Piezoresistive approaches based on low-cost materials such as Velostat® have been integrated into tactile gloves for pressure sensing and finger motion tracking [7,8,9,10]. These systems provide detailed information on hand–object interactions but often require complex wiring architectures and generally rely on local pressure measurements rather than direct estimation of global grip force. More advanced piezoresistive sensors capable of measuring both normal and shear forces have also been proposed [11], although their integration into wearable systems remains limited. Force-sensing resistors (FSRs) are widely used because of their ease of integration and lightweight instrumentation [12,13,14], but they typically exhibit nonlinear responses and mainly measure normal loads. To improve robustness, some studies combine FSR with electromyography (EMG) and kinematic measurements [15], resulting in more complex acquisition systems. Alternative technologies include capacitive sensors, which can measure normal and shear stresses but generally require more complex electronics [16]; piezoelectric sensors based on polyvinylidene fluoride (PVDF), which are effective for vibration and slip detection but less suitable for sustained pressure measurements [17]; and optical fiber systems used primarily for finger kinematics assessment [18], whose deployment is limited by cost and fragility. Finally, smart textiles have attracted increasing interest because their flexibility and ease of integration into garments enable continuous physiological monitoring [19].
1.3. Sport Context: The Case of Kayaking
Dynamic settings such as kayaking raise three specific challenges: a cylindrical contact surface, a highly dynamic movement context, and a wet environment. These constraints make direct measurement of hand forces difficult, especially in real on-water conditions.
Piezoresistive technology is the predominant approach in this area. The earliest attempts to instrument kayaking movements relied on strain gauges mounted on key elements of the boat or simulator [20,21]. In Sturm et al. [22], a wireless system was proposed to capture forces on both the paddle and the footrest. Data were transmitted via Bluetooth, and ergometer tests revealed a coherent force profile between the upper and lower limbs. While discreet and portable, the system is essentially confined to laboratory use and does not measure pressures directly at the hands. The same limitation is observed in similar studies [23,24].
Subsequently, Bonito et al. [25] analyzed the forces generated by elite kayakers at the paddle and footrests using strain gauges. Their study highlights a correlation between force profiles and dynamic performance on an ergometer. They clearly show that forces applied to the footrests reach values roughly two to three times higher than those measured at the paddle, with peaks exceeding 700 N versus an average of about 240 N at the hand. However, pressure exerted specifically by the fingers or the palm is not captured, limiting fine-grained analysis of grasp. In addition, the system remains relatively cumbersome due to the conditioning electronics required.
A more advanced approach was proposed by Nates [26], who designed a comprehensive three-dimensional system measuring mechanical loads along the longitudinal, transverse, and vertical axes on the paddle while also integrating measurements at the seat and foot supports. The force sensors are based on calibrated strain gauges to detect asymmetric contributions from the hands. In parallel, an optoelectronic motion-capture system with 101 markers placed on the athlete and the ergometer was used to reconstruct gesture kinematics in detail. Although effective and validated in real conditions, the setup is wired and bulky and requires rigorous calibration, which limits autonomous use by coaches and athletes.
Commercial systems dedicated to kayaking primarily focus on measuring deformation of the paddle shaft, providing information on cadence, orientation during movement, and shaft flexion [27]. However, none of these systems explicitly accounts for palmar pressure. Instrumented glove systems available on the market are listed in Table 1.
Table 1.
Commercial instrumented glove systems available on the market.
None was designed specifically for kayaking or for fine, localized measurement of hand pressure in a dynamic, aquatic environment. The major limitations in water-sport contexts are system waterproofing [28,29,30,31,33] and insufficient battery life to cover full training sessions [34]. Some gloves are too thick or bulky, reducing freedom of movement. Most systems target rehabilitation [18,35,36,37], robotics [13,38], or ergonomic research [34,39,40], and they do not meet the economic and functional constraints of outdoor athletic use. Wrist and forearm-worn devices provide promising approaches for estimating physical effort from proximal measurements, for example, using force myography or EMG combined with inertial sensing. However, these approaches provide indirect estimates of interaction forces and do not measure contact pressure at the palm object interface or its spacetime distribution, which requires pressure-sensing instrumentation located on the hand, such as on the palm or fingertips [41,42].
Our previous study [27] mainly focused on the characterization of flexible Velostat-based piezoresistive sensors with a regular matrix of identical sensors, applied to a non-planar surface using a symmetric sensor arrangement that did not allow the estimation of global palmar pressure. In contrast, the present work investigates the integration of these sensors into a functional textile support while exploring different sensor shapes and sizes for comprehensive palmar pressure analysis during gripping tasks. This study demonstrates the feasibility of an instrumented textile glove embedding sewn flexible piezoresistive sensors to measure palmar pressure distribution under dynamic conditions. The proposed device is specifically applied to the context of kayaking, where performance strongly depends on biomechanical and physiological parameters related to the hand–paddle interaction. Beyond kayaking, this approach also opens perspectives for other sports applications as well as medical applications, particularly for rehabilitation monitoring following injury or surgery.
2. Materials and Methods
2.1. System Description
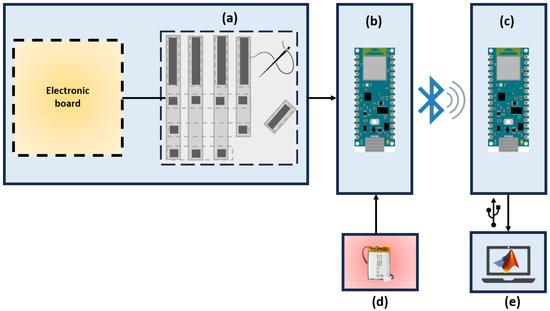
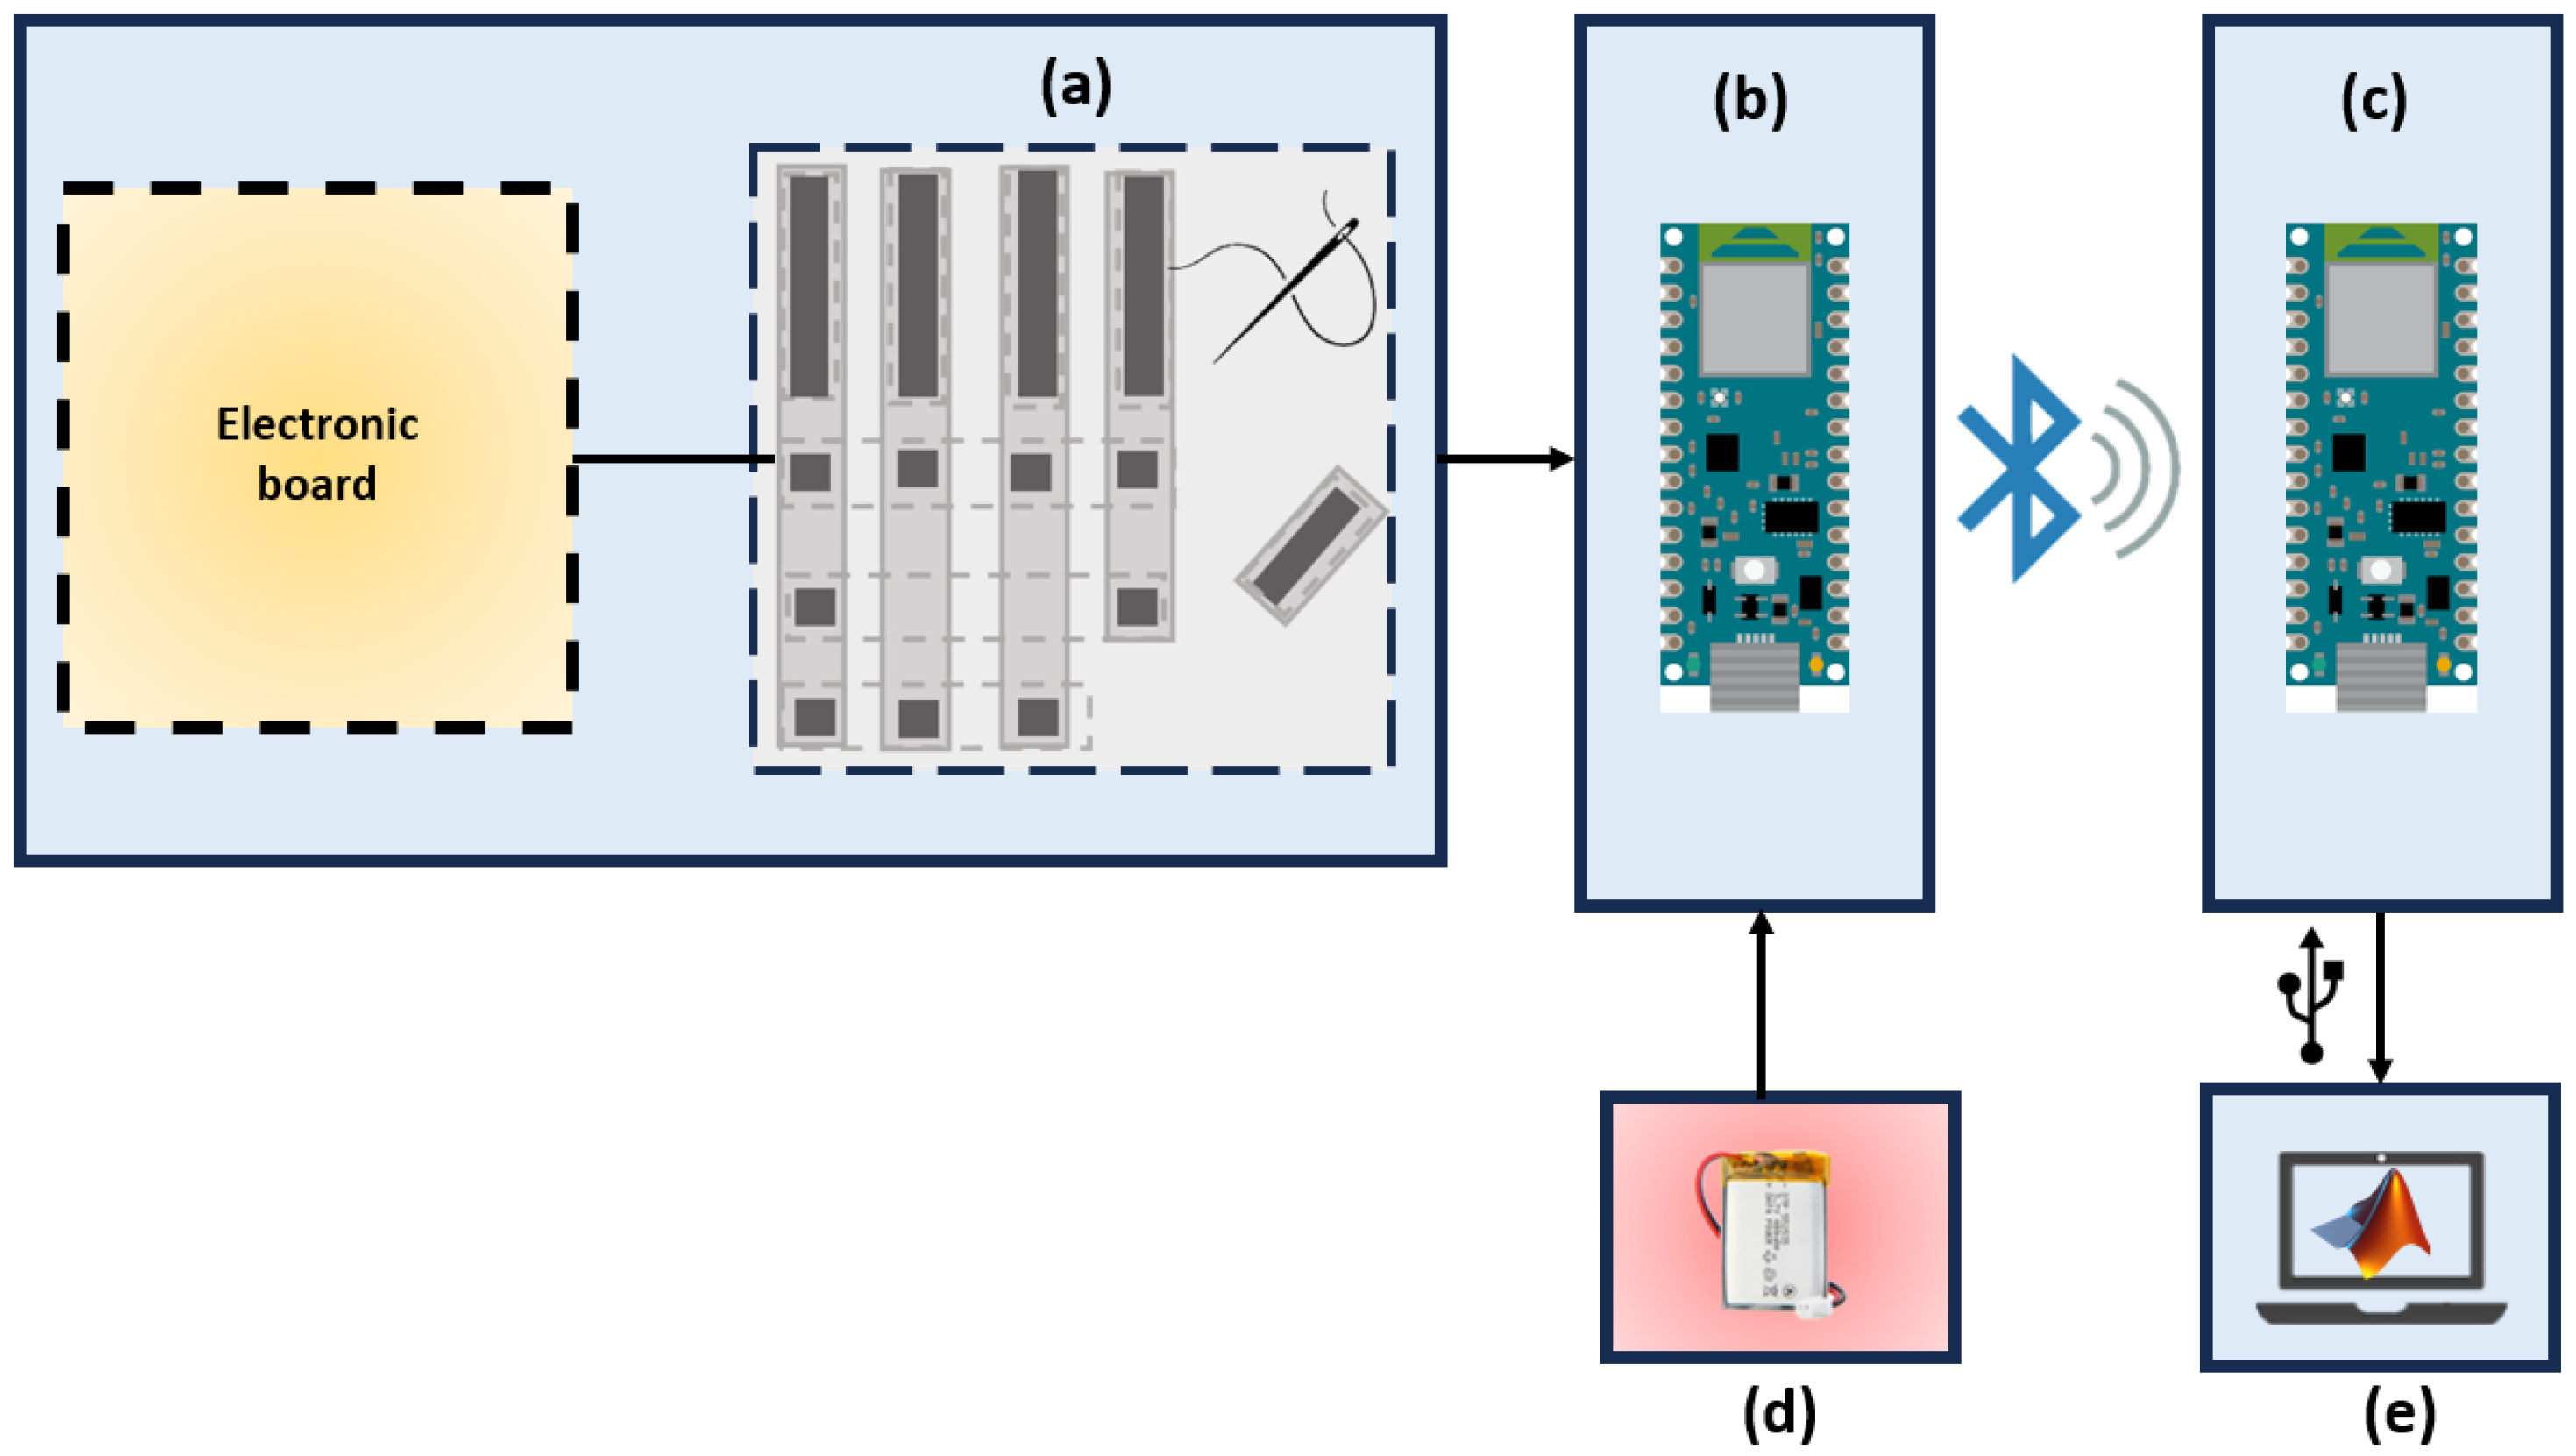
The developed system is an instrumented glove incorporating flexible piezoresistive sensors based on a carbon-loaded polyethylene composite: Velostat® (3M Electronics Division, Saint Paul, MI, USA) [43]. Sensor outputs are acquired by an Arduino Nano 33 BLE microcontroller (Arduino, Ivrea, Italy), referred to as the “peripheral”, which reads resistance variations at each node of the sensor matrix described in Section 2.2. The peripheral is powered by a 3.7 V, 400 mAh LiPo battery (Model 502535, EAST (Shenzhen) Technology Co., Ltd., Shenzhen, China). This development board was selected to meet the system’s energy constraints and to ensure sufficient autonomy over full training sessions through the use of the BLE protocol. The peripheral transmits data wirelessly to a second Arduino Nano operating as a BLE “central,” which is connected to the PC. Data processing is then performed using MATLAB R2025a (MathWorks, Natick, MA, USA). An overview of the system is shown in Figure 1.
Figure 1.
System illustration: (a) textile glove with sensor matrix; (b) peripheral device; (c) central unit; (d) battery; (e) processing on PC.
2.2. Choice of the Number of Pressure Points to Measure
To determine how many sensors to place on the palmar side, it is essential to understand the hand’s architecture and the muscular loads engaged when gripping a cylinder.
Intrinsic muscles provide fine modulation of pressures, stabilize the thumb, and supply lateral support, thereby increasing the contact area. Their action enables the redistribution of the forces generated by the extrinsic muscles. Consequently, for meaningful data acquisition, sensors should be placed primarily on the fingers, the thenar and hypothenar eminences, and along the lateral contact zones of the hand, where synergies between extrinsic and intrinsic muscles are expressed during gripping [44].
The study by [45] showed that during a power grip, the principal contact regions are located at the distal phalanges, the palm near the radius, and the thenar and hypothenar eminences, with a large contact area that depends on hand size and handle diameter. These zones, therefore, concentrate the main pressures during grasping.
As reported in [46], gripping a cylinder engages the entire palm and fingers, unlike a finer pinch grip. It also describes that pressures are localized on the palmar surface of the hand and that load distribution is influenced by soft tissues, such as digital pads and palmar pulp, which deform under pressure.
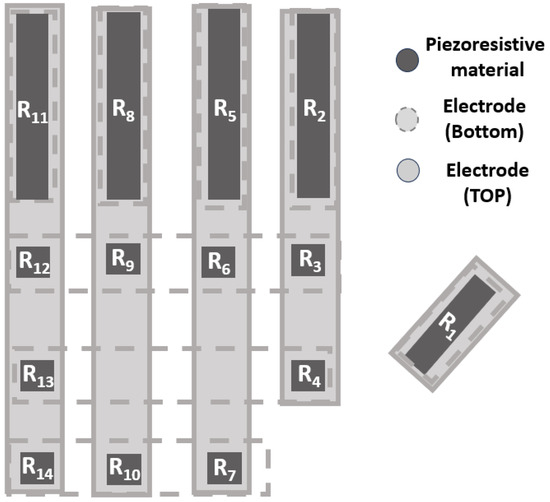
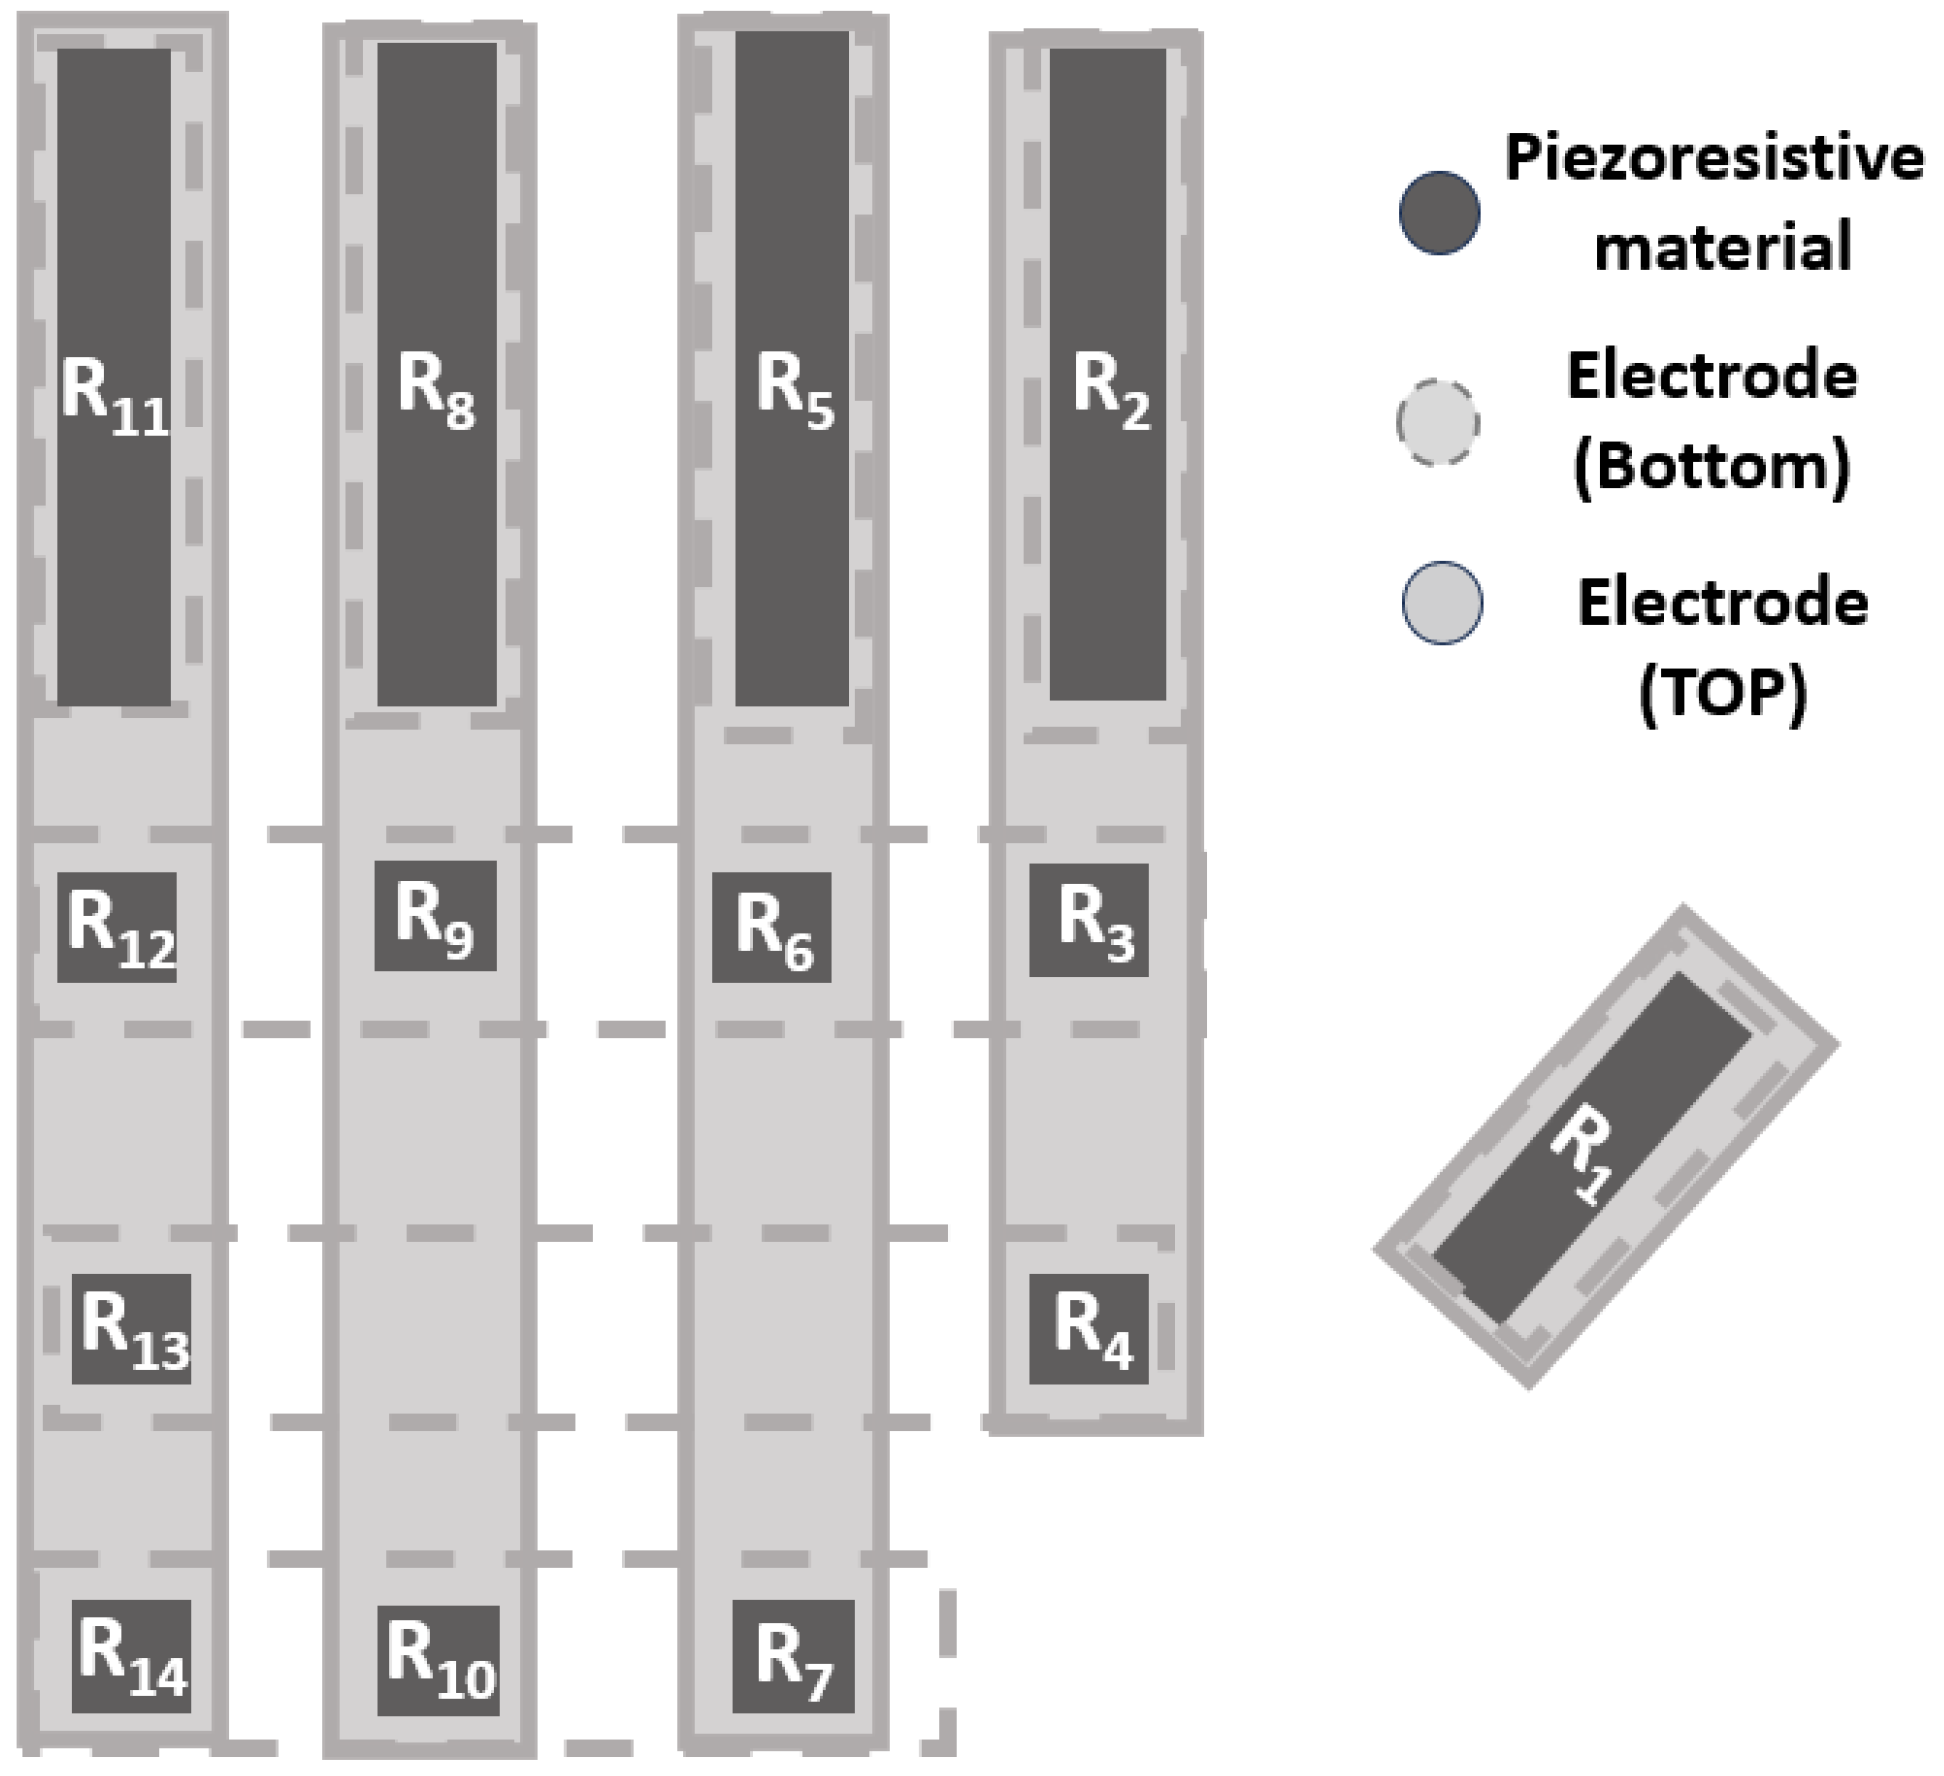
Accordingly, the sensor matrix comprises 14 measurement points strategically distributed over the palmar surface of the hand. Each point is associated with a variable resistor Ri with i ∈ [1, 14]. Each finger is equipped with a 7 cm2 sensor to capture the overall pressure exerted by all phalanges. In addition, nine 1 cm2 sensors are positioned on the palm: two on the thenar eminence, two on the hypothenar eminence, one on each of the four metacarpal heads, and one at the carpal tunnel. This arrangement is designed to capture both the primary support zones and the stabilization points. The diagram in Figure 2 illustrates this configuration.
Figure 2.
Sensor matrix selected for the right hand: Palmar view.
2.3. Glove Fabrication
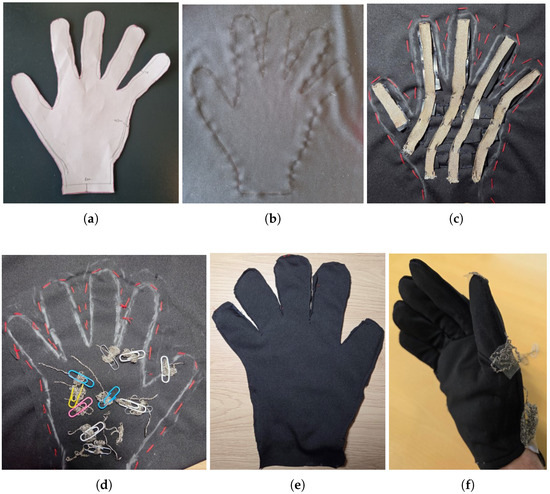
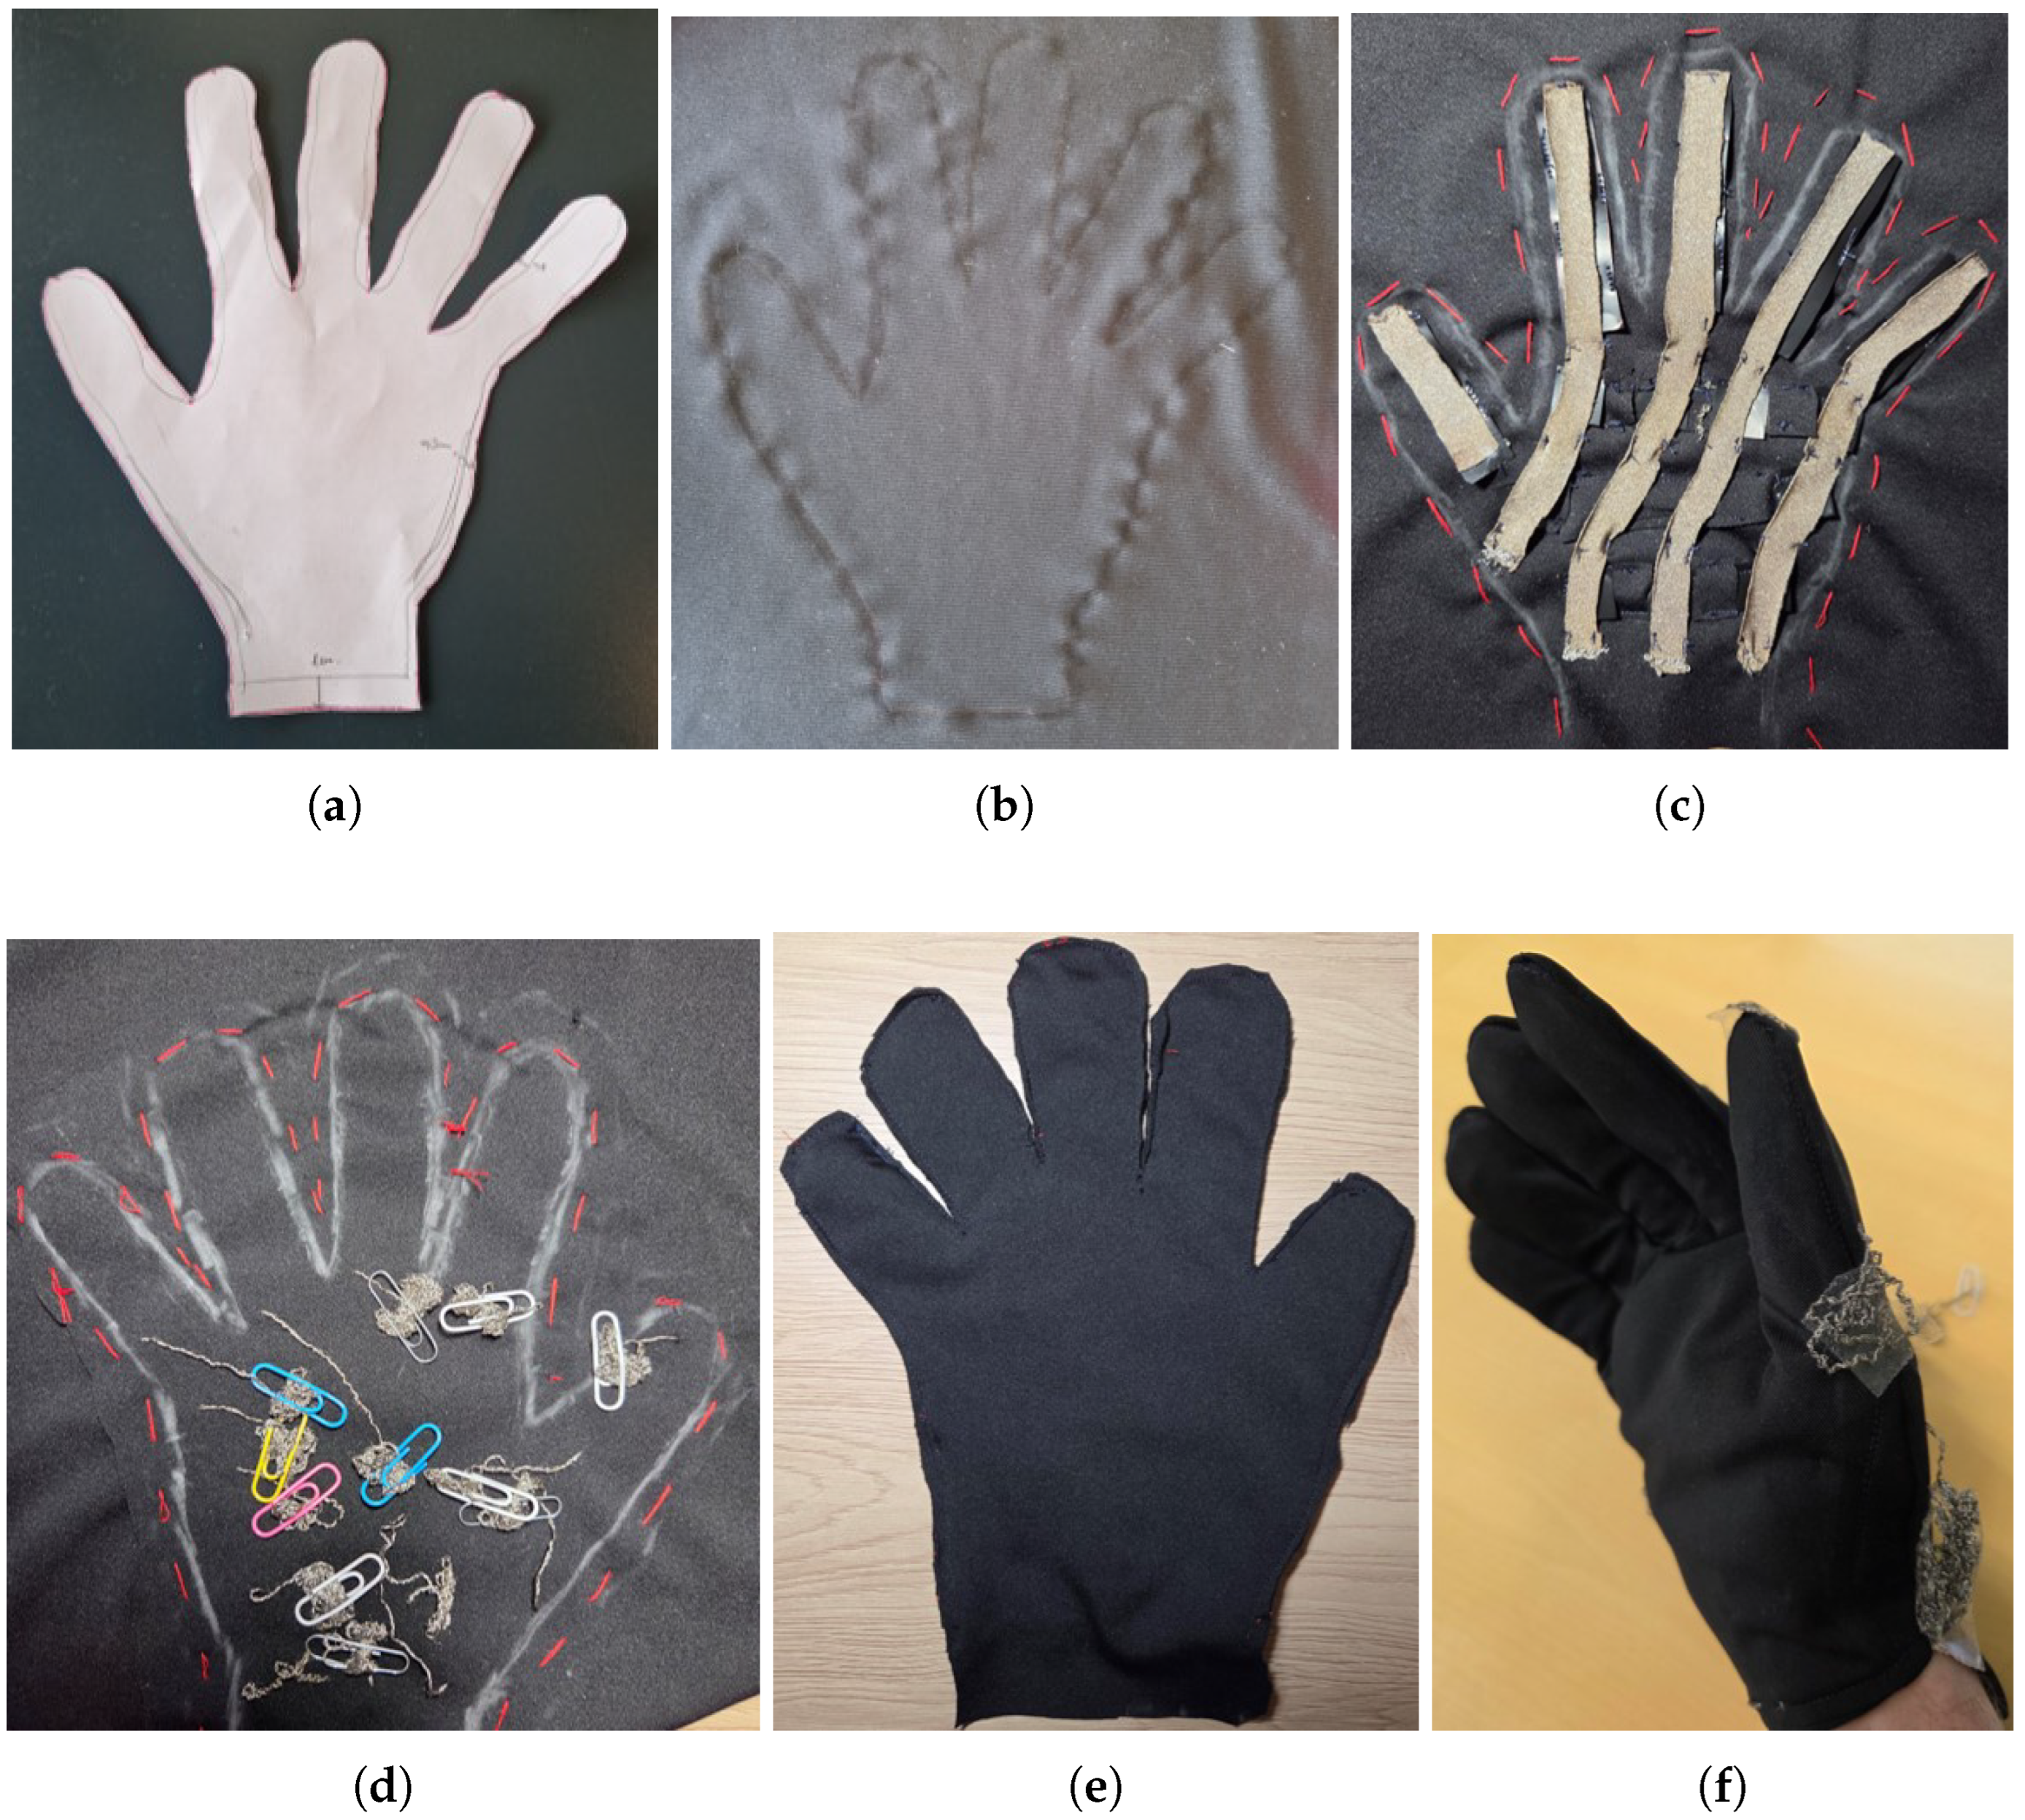
The first step is to create the hand pattern (Figure 3a). Once the pattern outline is transferred onto the fabric using a fabric marker (Figure 3b), the lower-layer electrodes and the piezoresistive material are stitched in a straight stitch with polyester thread. The goal is to avoid damaging the material so as to preserve its properties. Next, the upper-layer electrode strips are positioned (Figure 3c). The conductive leads can then be routed to the opposite side of the glove (Figure 3d). The conductor is a multi-strand, silver nano-plated thread designed to integrate electronic components into textiles [47]. The glove is then closed (Figure 3e) with a lining to prevent any contact between the skin and the electrodes and finally turned right side out (Figure 3f) so that the leads exit on the outside.
Figure 3.
Glove manufacturing steps: (a) right-hand pattern; (b) tracing on fabric; (c) piezoresistive sensor matrix (palmar view); (d) dorsal view of the glove; (e) cutting out the glove; (f) view of the glove being worn.
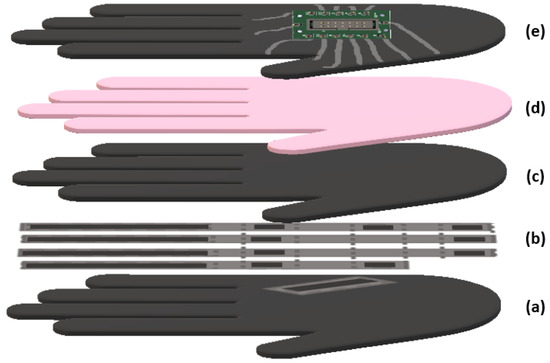
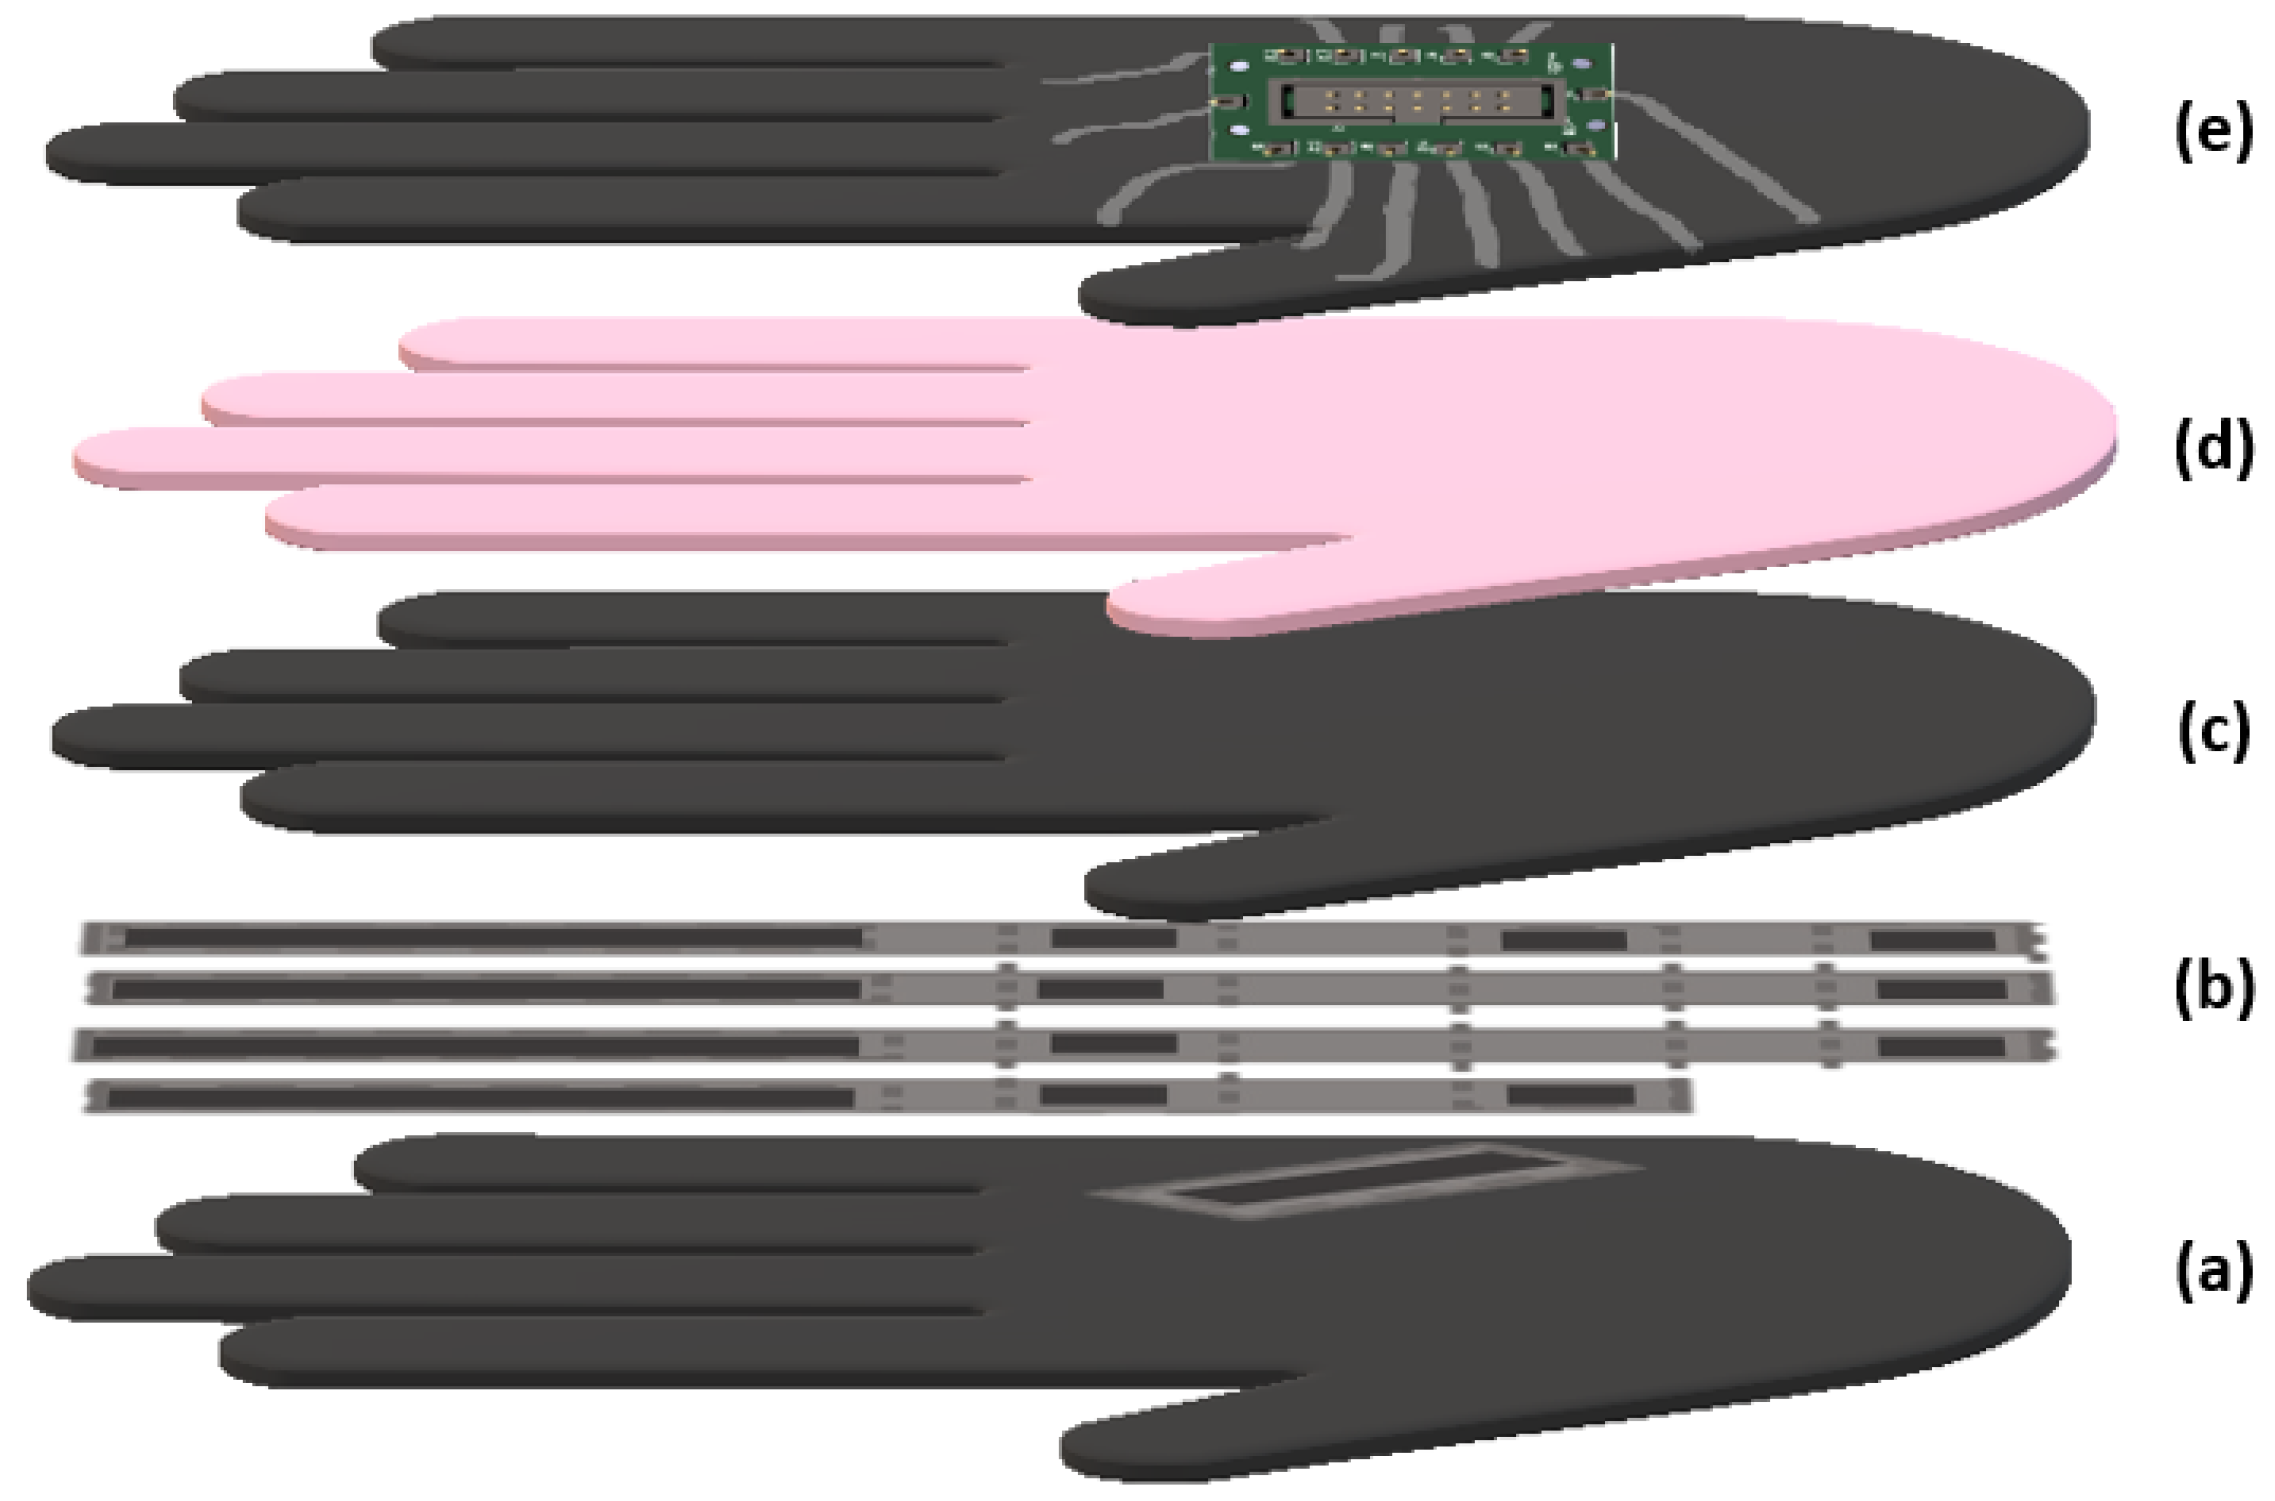
A cross-sectional view of the glove is provided in Figure 4. It should be noted that this glove prototype was manufactured using the anthropometric measurements of a single reference user due to participant availability at the time of fabrication tests. As a result, the current device is size-specific. It can be worn by other individuals provided their hand dimensions fall within the same size range.
Figure 4.
Cross-section view of the glove: (a) palmar view; (b) sensor matrix; (c) fabric lining; (d) hand; (e) dorsal view (wires and PCB).
An electronics board with an insulation displacement connector (IDC) is sewn onto the dorsal side of the glove (Figure 4e) to collect data from each node of the matrix. This connector is then linked to the enclosure described in Section 2.5.
2.4. Sensor Characterization
This section presents the different characterization procedures implemented to evaluate the sensor performance. A static characterization was first performed directly on the sensor matrix prior to glove closure. This was followed by a dynamic characterization with the glove worn, allowing the assessment of the sensor behavior under realistic operating conditions. Since the contact between the skin and the sensor induces a decrease in resistance, a new baseline resistance was established when the glove was worn and measured before conducting the dynamic tests.
2.4.1. Static Characterization
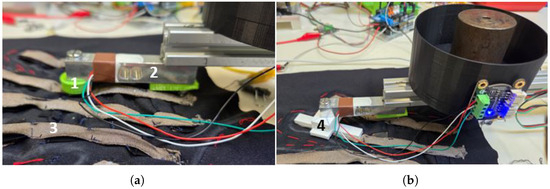
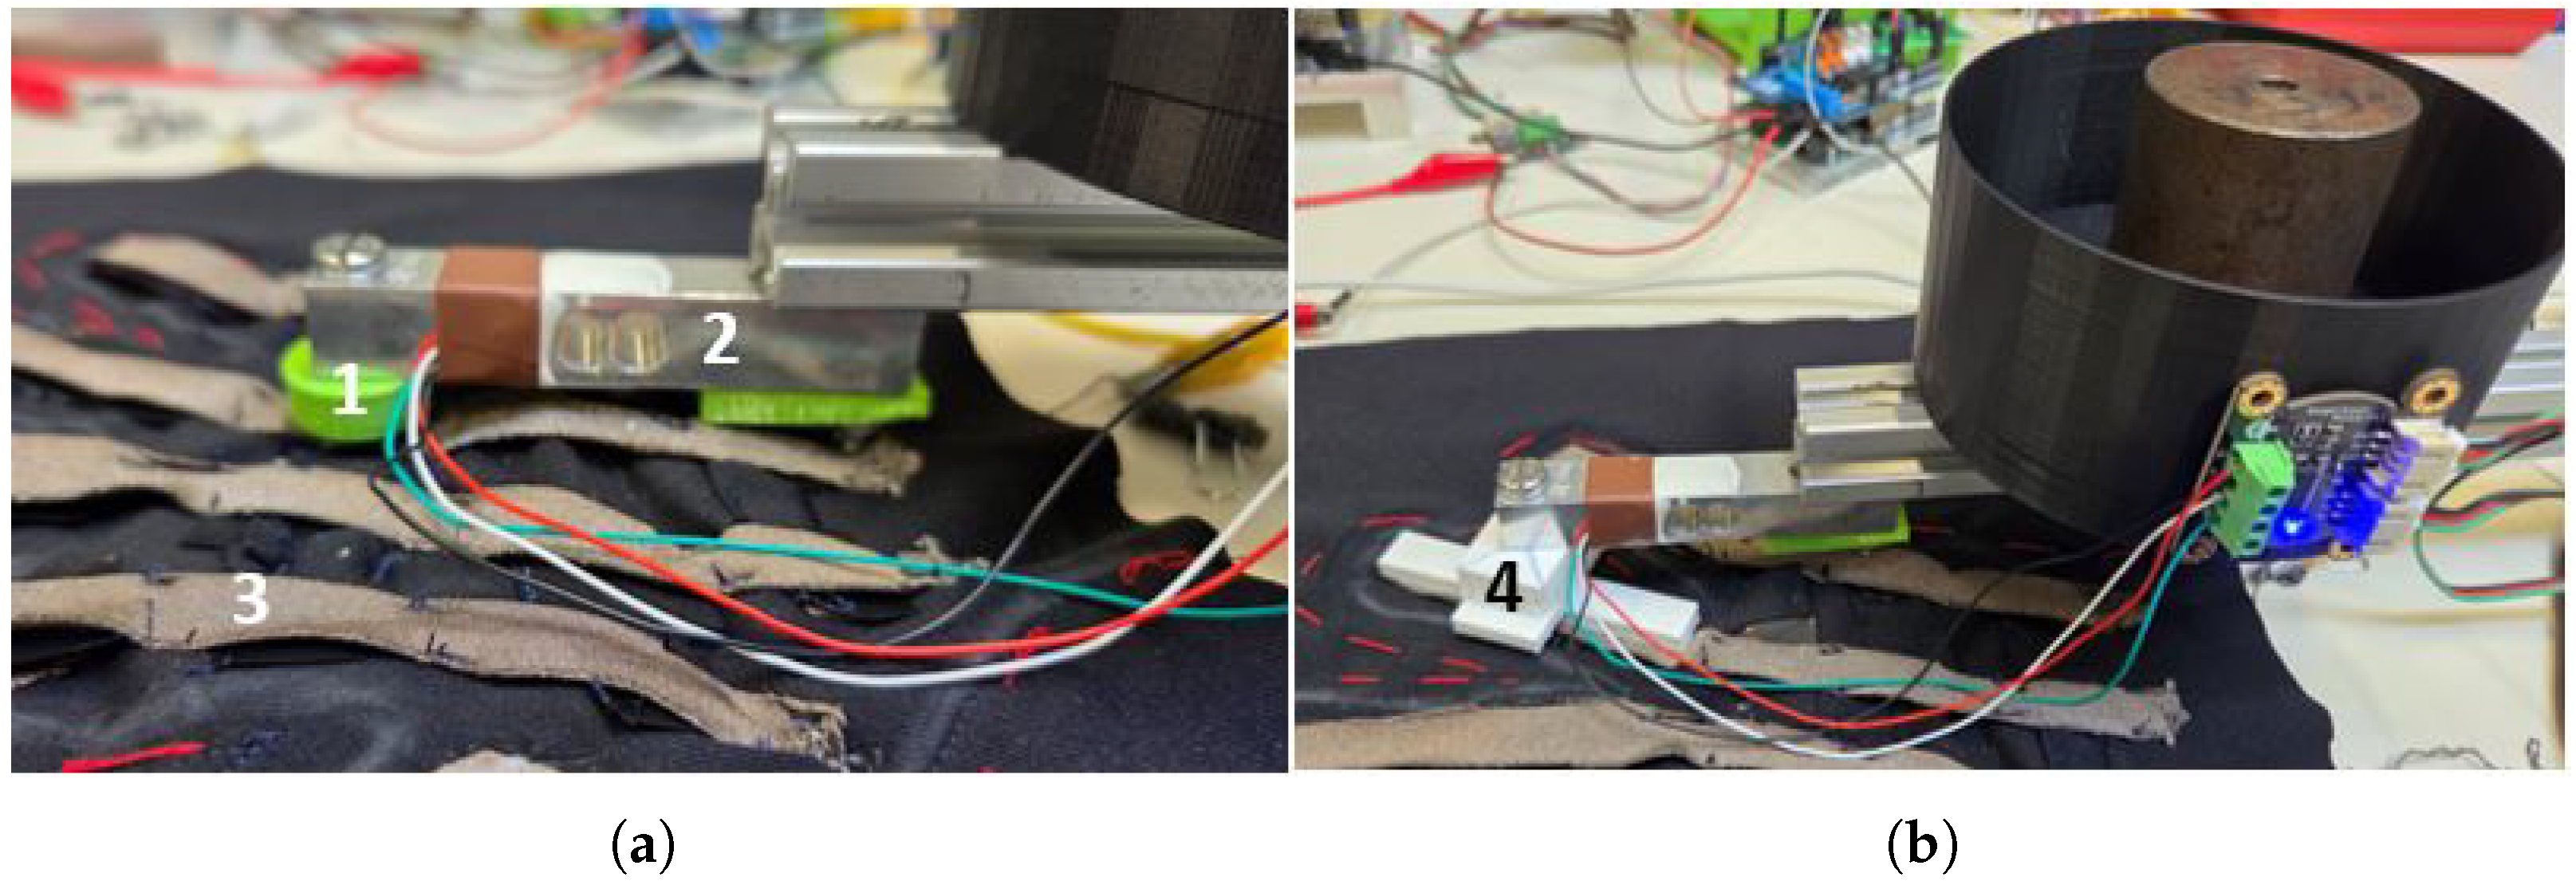
The sensor matrix was characterized under static conditions using a test bench to observe the sensor’s reproducible behavior under load and to verify repeatability [27]. The experimental protocol consisted of applying a mass to the sensor for 50 s, corresponding to the material’s stabilization time. The mass was then removed, and the sensor was left at rest for 1 min before placing a new mass. This procedure was repeated five times on each sensor to ensure measurement reproducibility. Note that the sensors differ in size and therefore must be characterized independently. Specifically, the finger sensors have an area of 7 cm2 (Figure 5b), while the palm sensors are 1 cm2 (Figure 5a), which requires two separate 3D-printed polylactic acid (PLA) fixtures to distribute load uniformly over each sensor. This process was carried out for all nodes of the sensor matrix.
Figure 5.
Static sensor characterization: (a) 1 cm2 sensor; 1. PLA support 1 cm2; 2. strain gauge; 3. piezoresistive sensor matrix; (b) 7 cm2 sensor; 4. PLA support 7 cm2.
In addition, the sensitivity and hysteresis of the sensors were investigated. Owing to the nonlinear resistance–pressure relationship, the sensitivity was evaluated separately over two pressure intervals: 200 to 500 kPa and 550 to 1100 kPa. For each interval, the sensitivity was calculated according to Equation (1).
where and are the conductance values measured at pressures and , respectively. The sensitivities corresponding to the lower and higher pressure intervals are denoted as and , respectively.
Hysteresis was quantified by comparing the loading and unloading curves obtained during the calibration procedure and was calculated using Equation (2).
where and denote the resistance values measured during the loading and unloading processes, respectively, at the same applied force, while and represent the maximum and minimum resistance values recorded over the entire cycle. After completion of the loading phase, the unloading phase was performed by sequentially removing the applied masses while maintaining a stabilization period of 50 s between successive load levels. The resulting loading and unloading responses were subsequently used for hysteresis evaluation.
2.4.2. Dynamic Characterization
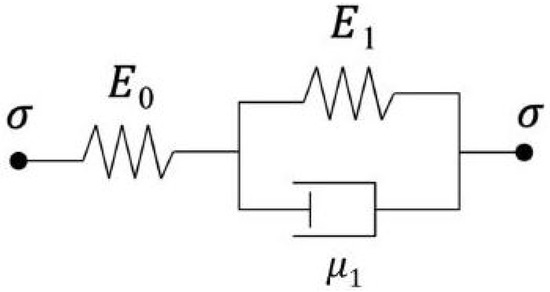
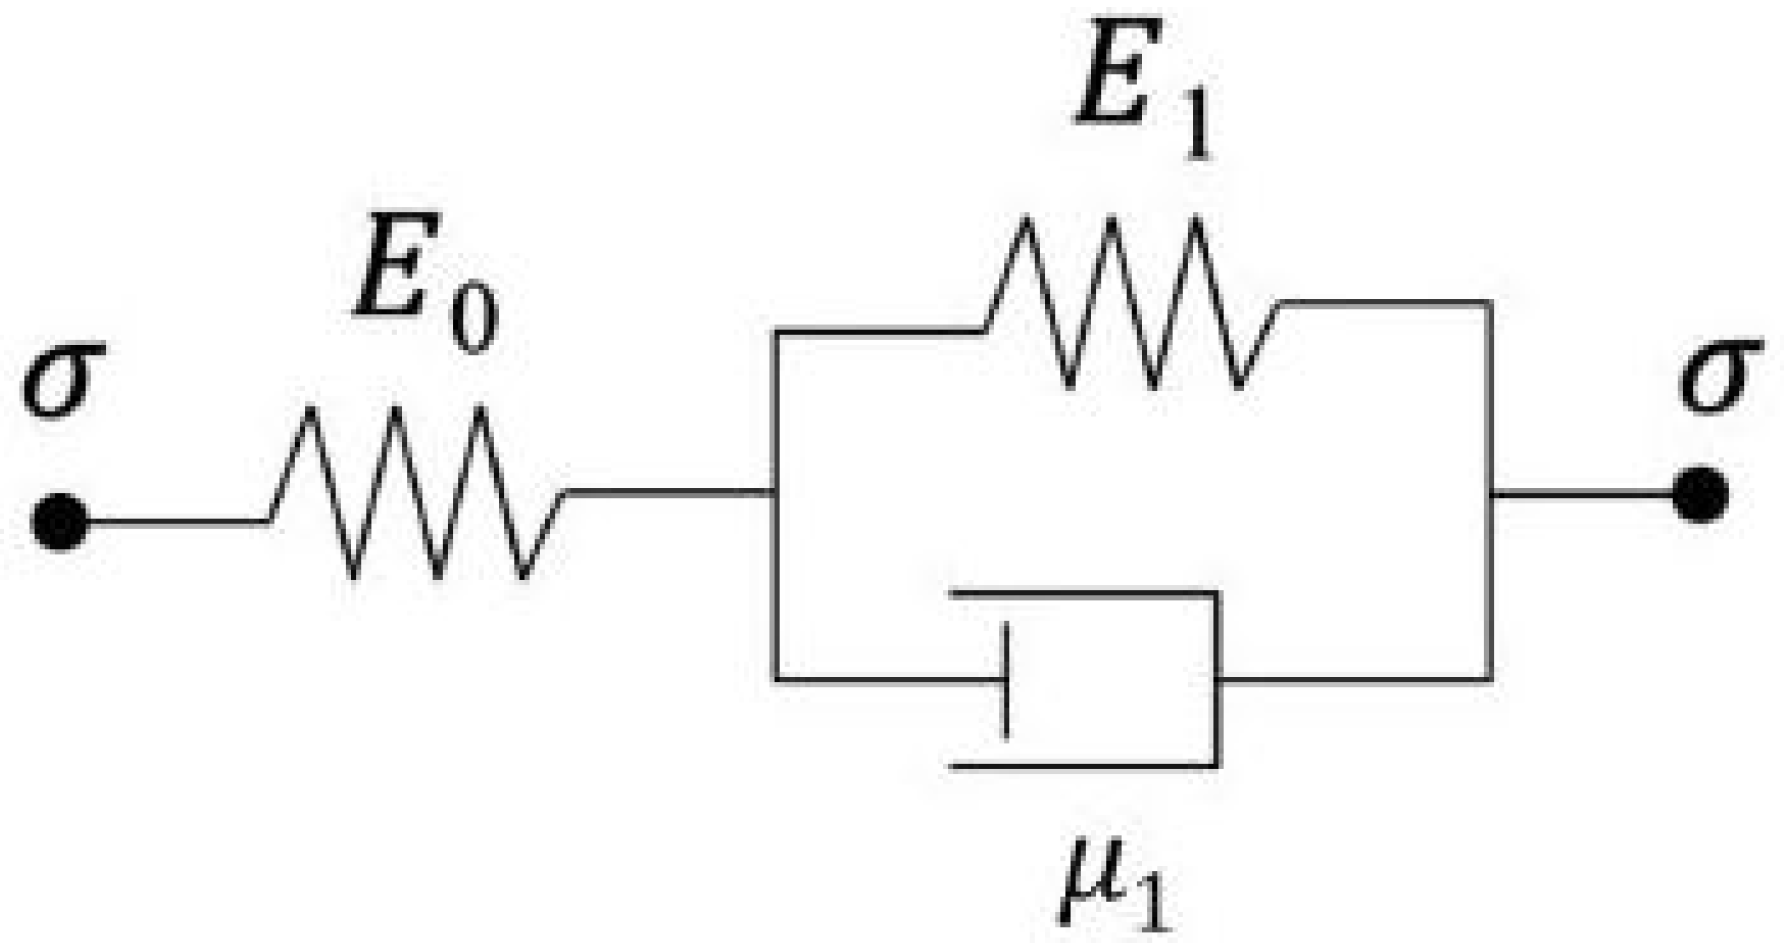
Dynamic characterization was performed to estimate the force applied to the sensor matrix from the resistance variations measured at each sensing node. This approach relies on the inverse viscoelastic model proposed by Laaraibi et al. [27], based on a standard linear solid representation. As shown in Figure 6, the model consists of an elastic spring of Young’s modulus connected in series with a Kelvin–Voigt element, composed of a spring of Young’s modulus in parallel with a dashpot of viscosity coefficient .
Figure 6.
Viscoelastic model of the sensor. is the mechanical stress, and are the Young’s moduli of the elastic springs, and is the viscosity coefficient of the dashpot [27].
In this model, the mechanical stress corresponds to the force applied to the sensor normalized by the active sensing area according to Equation (3).
where F is the applied force in newtons and is the active surface area of the considered sensor in square meters.
A nonlinear constitutive relationship links the sensor resistance to the strain of the viscoelastic model according to Equation (4).
where R is the sensor resistance, is the initial resistance, is the strain, and is a relaxation parameter governing the nonlinear resistance–strain relationship. The strain was then used within the viscoelastic model to estimate the corresponding stress and applied force.
The model parameters were identified by minimizing the error between the estimated force and the reference force measured by the test bench. The optimized parameters are the Young’s moduli and and the viscosity coefficient . In the inverse formulation, the mechanical properties are expressed as load-dependent quantities. The corresponding coefficients (, , , , and ) were identified experimentally for each sensor geometry. The model parameters can be expressed according to Equations (5)–(7).
The complete formulation of the viscoelastic model and its parameter identification procedure have been detailed in a previous study [48] and are therefore only briefly summarized here.
Since contact between the skin and the sensor modifies the initial electrical state by decreasing the resistance, a new baseline resistance was first measured after the glove was donned. This value was then used as the reference state for all dynamic measurements.
Dynamic loading tests were performed by applying the test bench directly to the gloved hand. Each trial provided a dataset composed of resistance, force, and time measurements. These data were used to locally optimize the model parameters at each sensing node. Once identified, the calibrated model was used to estimate the applied force point by point across the sensor matrix.
2.4.3. Durability and Recovery Test Protocol
To assess the long-term stability and durability of the sensor node, an additional cyclic loading experiment was conducted on sensing point R7. The objective was to evaluate whether repeated mechanical loading induces permanent changes in the electrical response of the sensor and to determine its ability to recover after a resting period. A constant load of 294.3 kPa was selected for this experiment, as it is representative of the force range encountered in the intended kayaking application and corresponds to the operating conditions investigated throughout this study.
The experiment consisted of successive loading and unloading phases followed by a recovery period. During the entire test, the sensor resistance was continuously recorded.
The test sequence was defined as follows:
- 1.
- Repeat the complete sequence three times:
- (a)
- Apply 1000 loading cycles:
- Apply the 294.3 kPa load and maintain it for 5 s.
- Release the load and maintain the unloaded state for 5 s.
- (b)
- Remove the load completely and allow the sensor to recover for 2 h.
The loading and unloading durations were selected to reproduce repeated mechanical solicitations while enabling the evaluation of cumulative effects over a large number of cycles. The 2-h recovery period was introduced to investigate the reversibility of the sensor response and to identify possible permanent drift mechanisms.
Throughout the experiment, the electrical resistance of the sensing element was monitored continuously, allowing both the short-term response during cyclic loading and the long-term evolution of the baseline resistance to be analyzed. The results of this experiment are presented in Section 3.2.
2.5. Experiment on an Ergometer
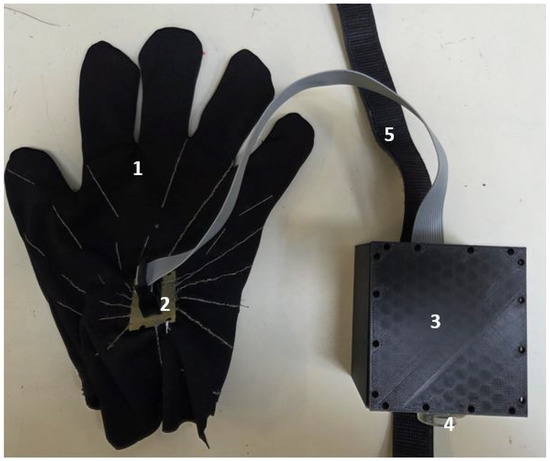
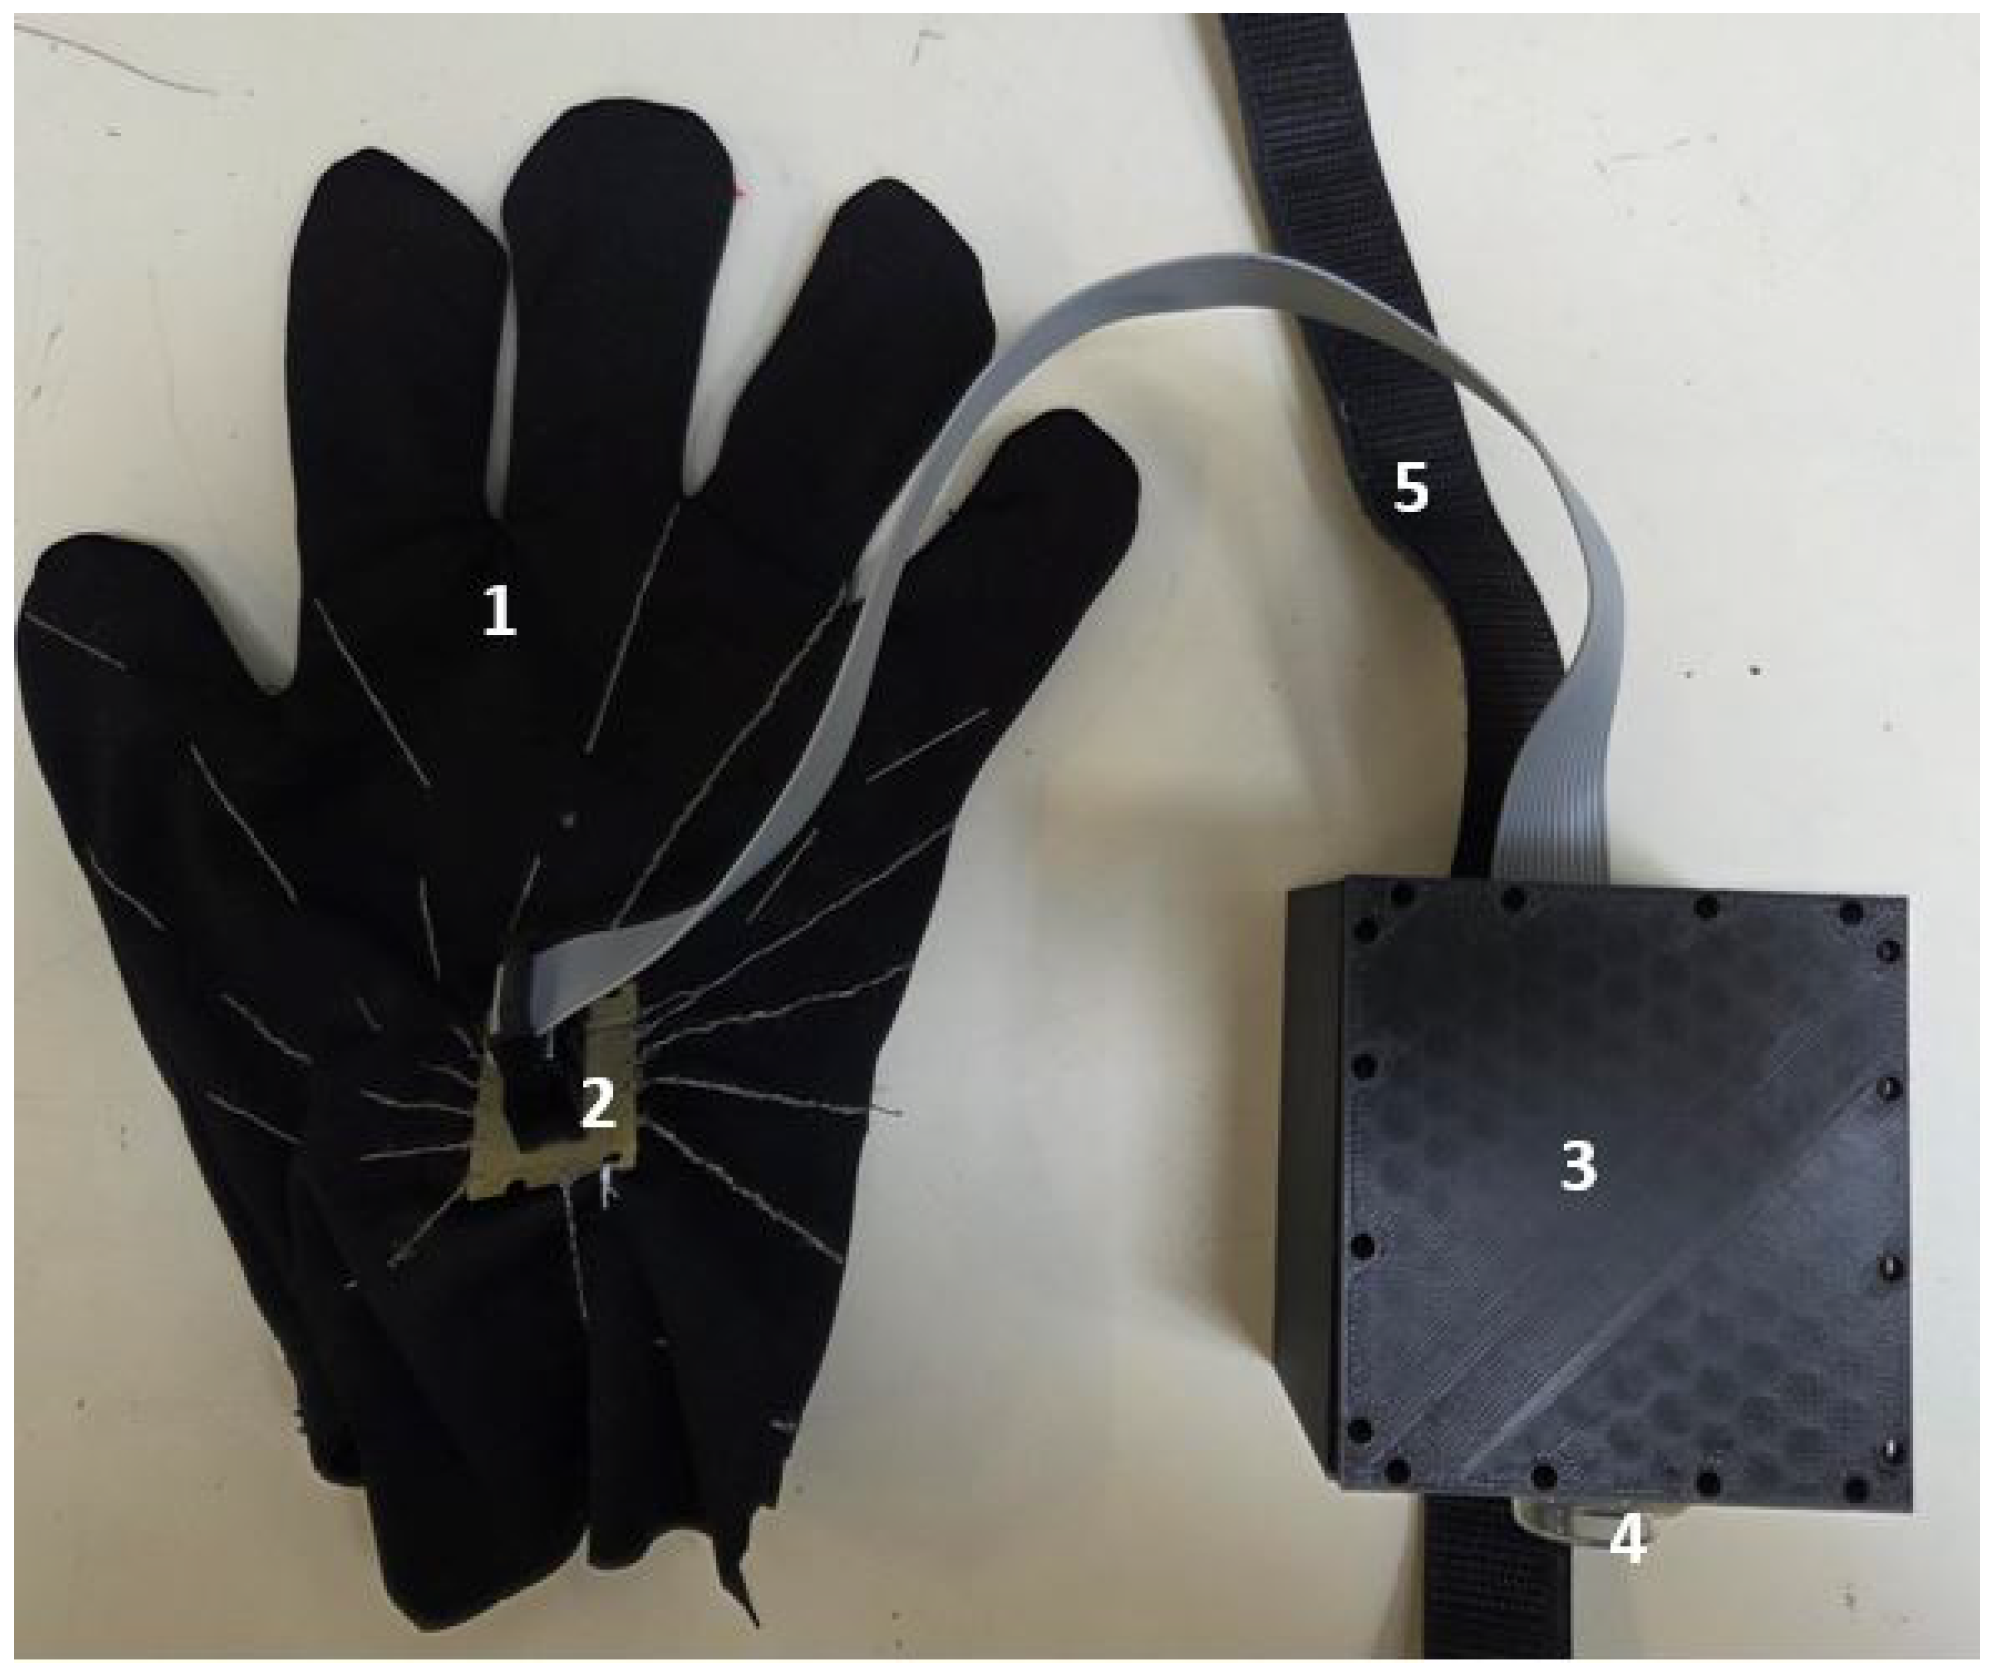
An embedded system was designed, comprising electronic boards that interface the sensor matrix with the conditioning electronics housed in a PLA enclosure. The conditioning electronics are enclosed in an IP65-rated waterproof housing, allowing the system to be worn around the forearm while ensuring protection of the internal electronics and full freedom of movement for the user. Although the glove itself is not waterproof at this stage of development, the current design is suitable for use on an ergometer and other dry-environment testing conditions.
Figure 7 shows the instrumented glove and its enclosure.
Figure 7.
Photo of the measurement system: 1. glove; 2. electronic board; 3. enclosure; 4. switch; 5. strap.
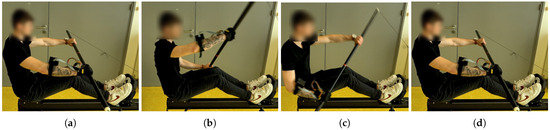
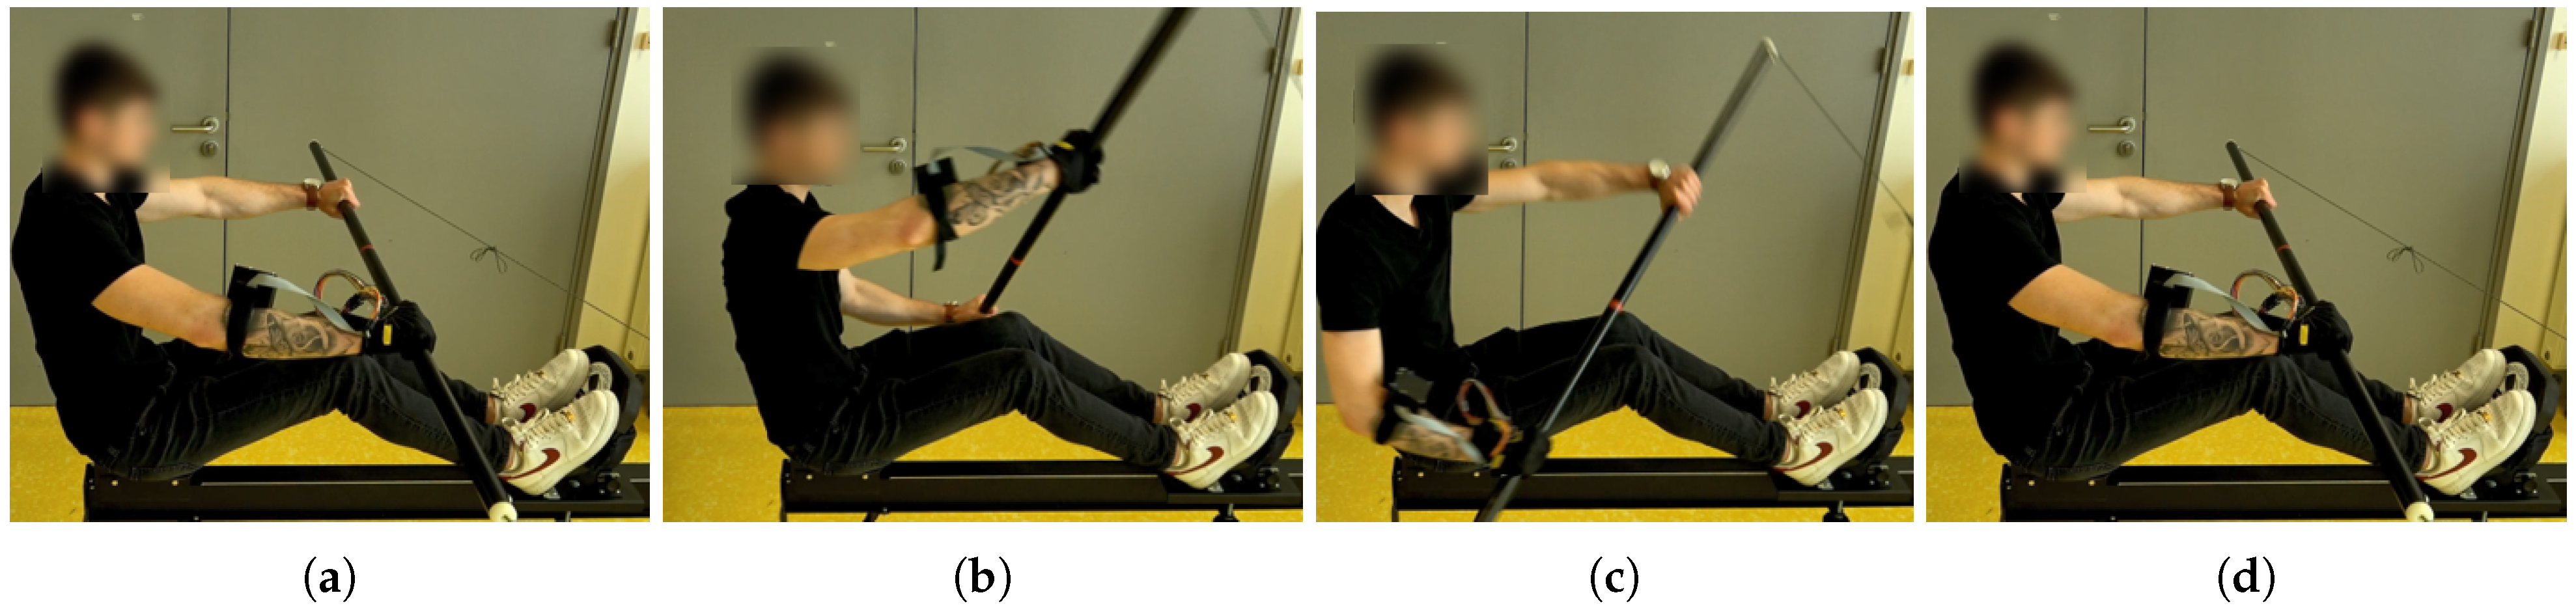
The protocol is based on a movement sequence reproducing a complete paddling cycle [49]. It begins with a 10-s static catch position, followed by 20 s at a moderate cadence of 35 strokes/min, then 20 s at a higher cadence of 48 strokes/min. Figure 8 illustrates the main hand phases observed during the cycle for the instrumented hand: the initial catch position (Figure 8a), the push phase (Figure 8b), the pull phase (Figure 8c), and the return to the initial position (Figure 8d). The initial catch position corresponds to a steady gripping condition in which the athlete is already holding the paddle. This state serves as a reference baseline for the subsequent analysis of pressure redistribution during the paddling cycle. The pressure measured in this configuration is considered an offset associated with the static grip force required to hold the paddle and is subtracted from subsequent measurements. Consequently, the reported pressure variations represent only the additional pressure exerted on the paddle throughout the paddling motion. The tests were conducted on a single user. Experimental constraints, as well as the glove’s specific measurements, did not allow tests to be carried out on other subjects. However, the aim of this study is to provide a proof of concept for the prototype presented here.
Figure 8.
Phases of the paddling cycle reproduced during the experiment: (a) start of the cycle; (b) pushing phase; (c) pulling phase; (d) end of the cycle.
3. Results
This section presents the main results of the static and dynamic characterization of the piezoresistive sensors. It also details the palmar pressure mapping at each node of the matrix.
3.1. Static Characterization
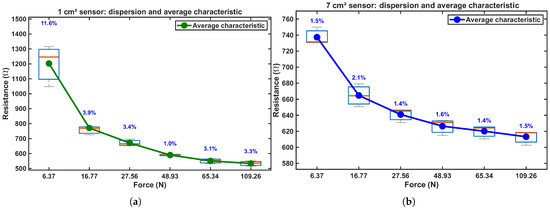
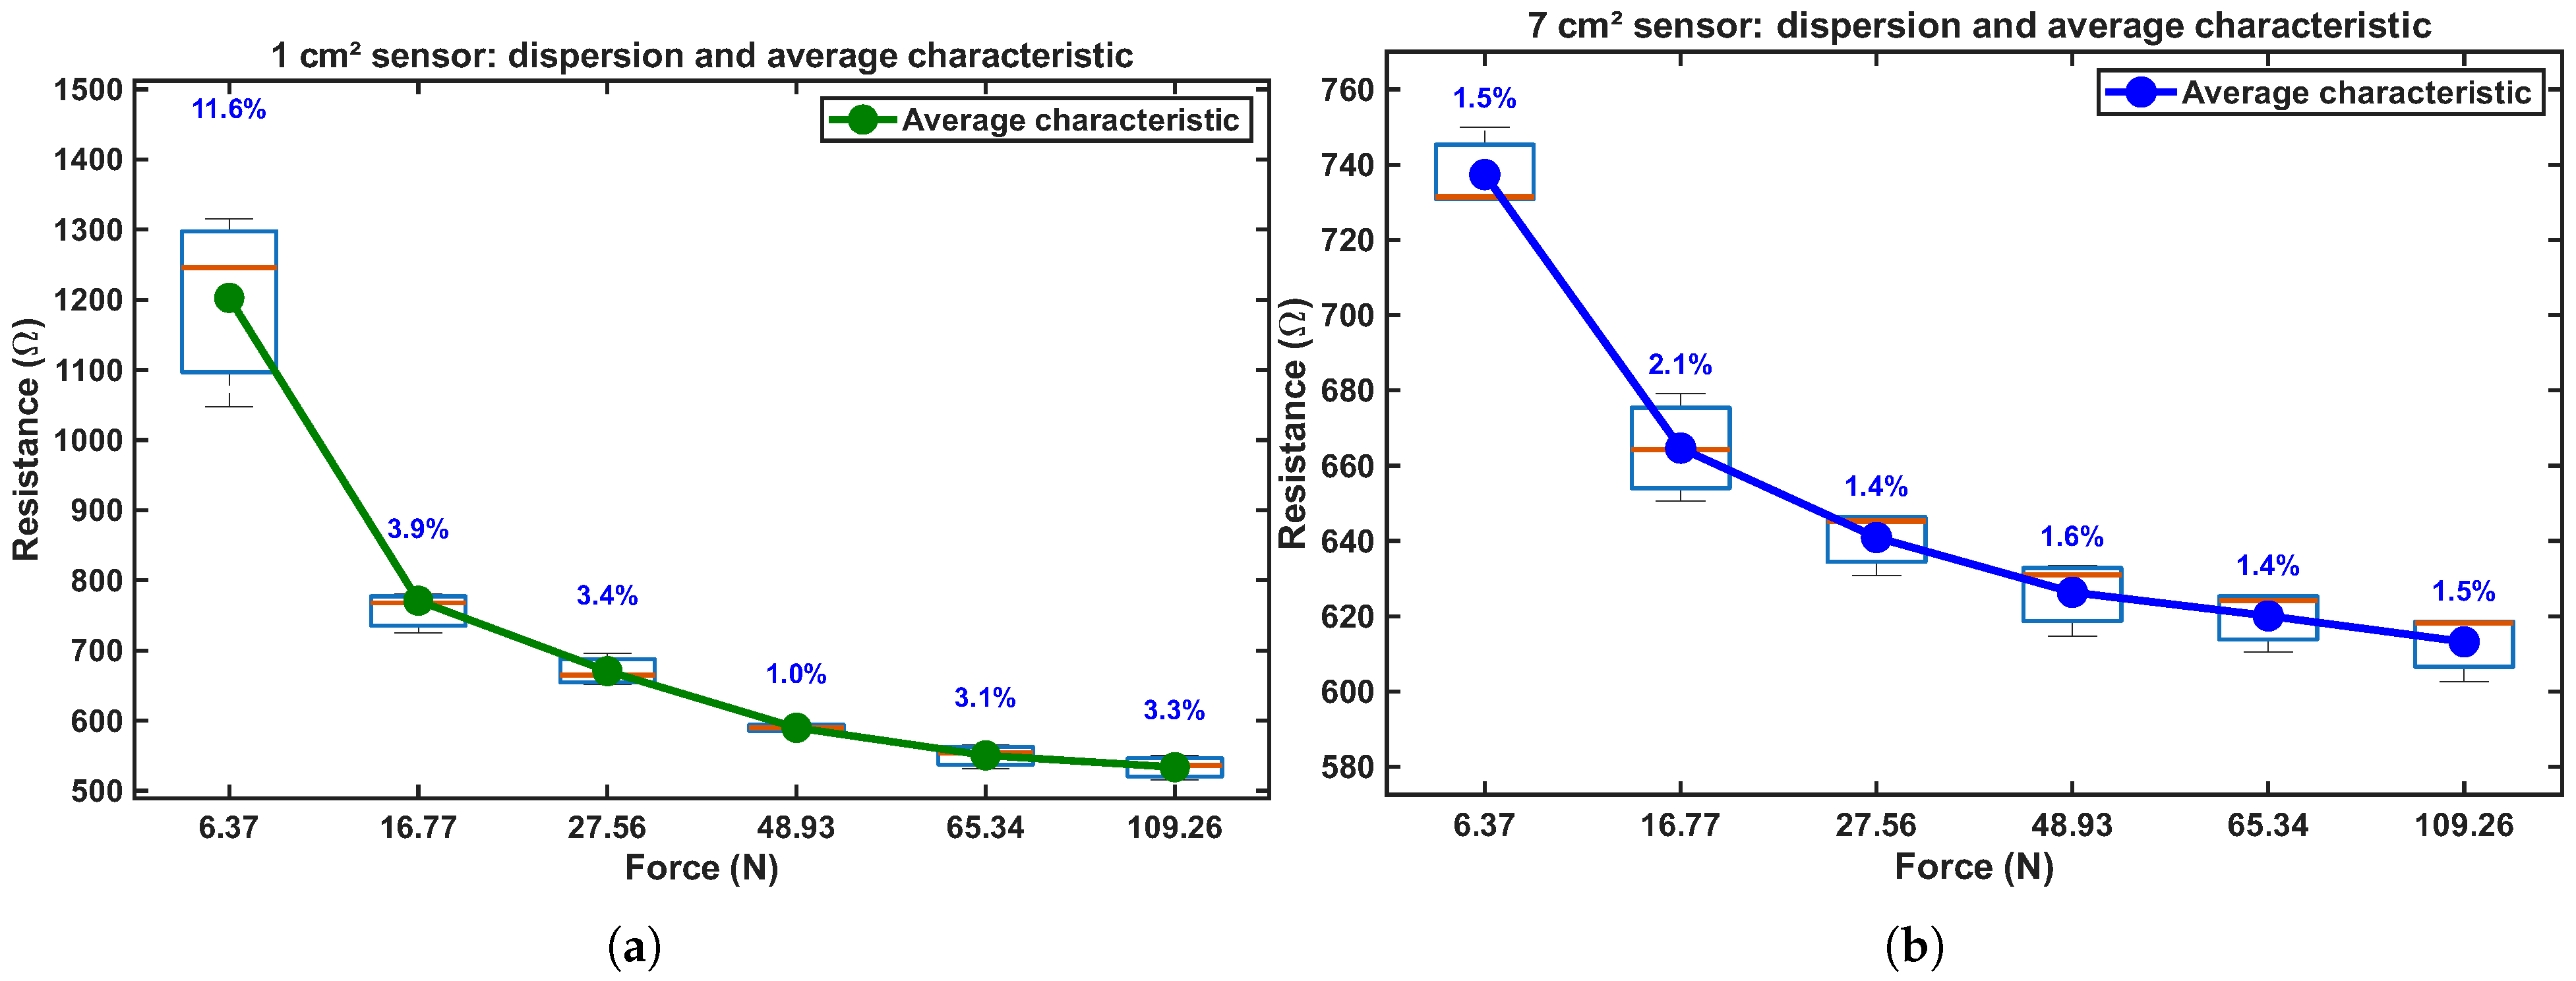
Figure 9a,b show the mean resistance as a function of the applied load for a 1 cm2 sensor (mounted on the palm) and a 7 cm2 sensor (mounted on the fingers), together with the associated dispersion across five trials conducted in accordance with the protocol described in Section 2.4. The sensitivity and hysteresis values obtained from the static characterization are summarized in Table 2.
Figure 9.
Graphs of the characteristics obtained for the two sensor sizes: (a) 1 cm2 sensor; (b) 7 cm2 sensor. Blue percentages indicate the dispersion between repeated measurements at each force level. Boxplots show the median (central line), interquartile range (box), and data spread (whiskers).
Table 2.
Static characterization of the two sensor sections.
3.2. Dynamic Characterization
Table 3 summarizes the coefficients identified for the two sensor geometries. These coefficients define the load-dependent evolution of the mechanical properties used by the viscoelastic model.
Table 3.
Optimized coefficients of the inverse viscoelastic model.
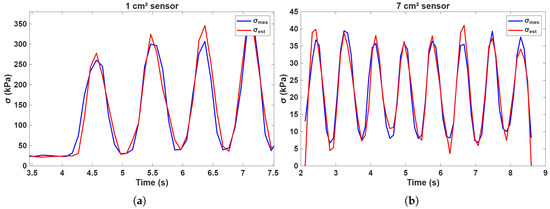
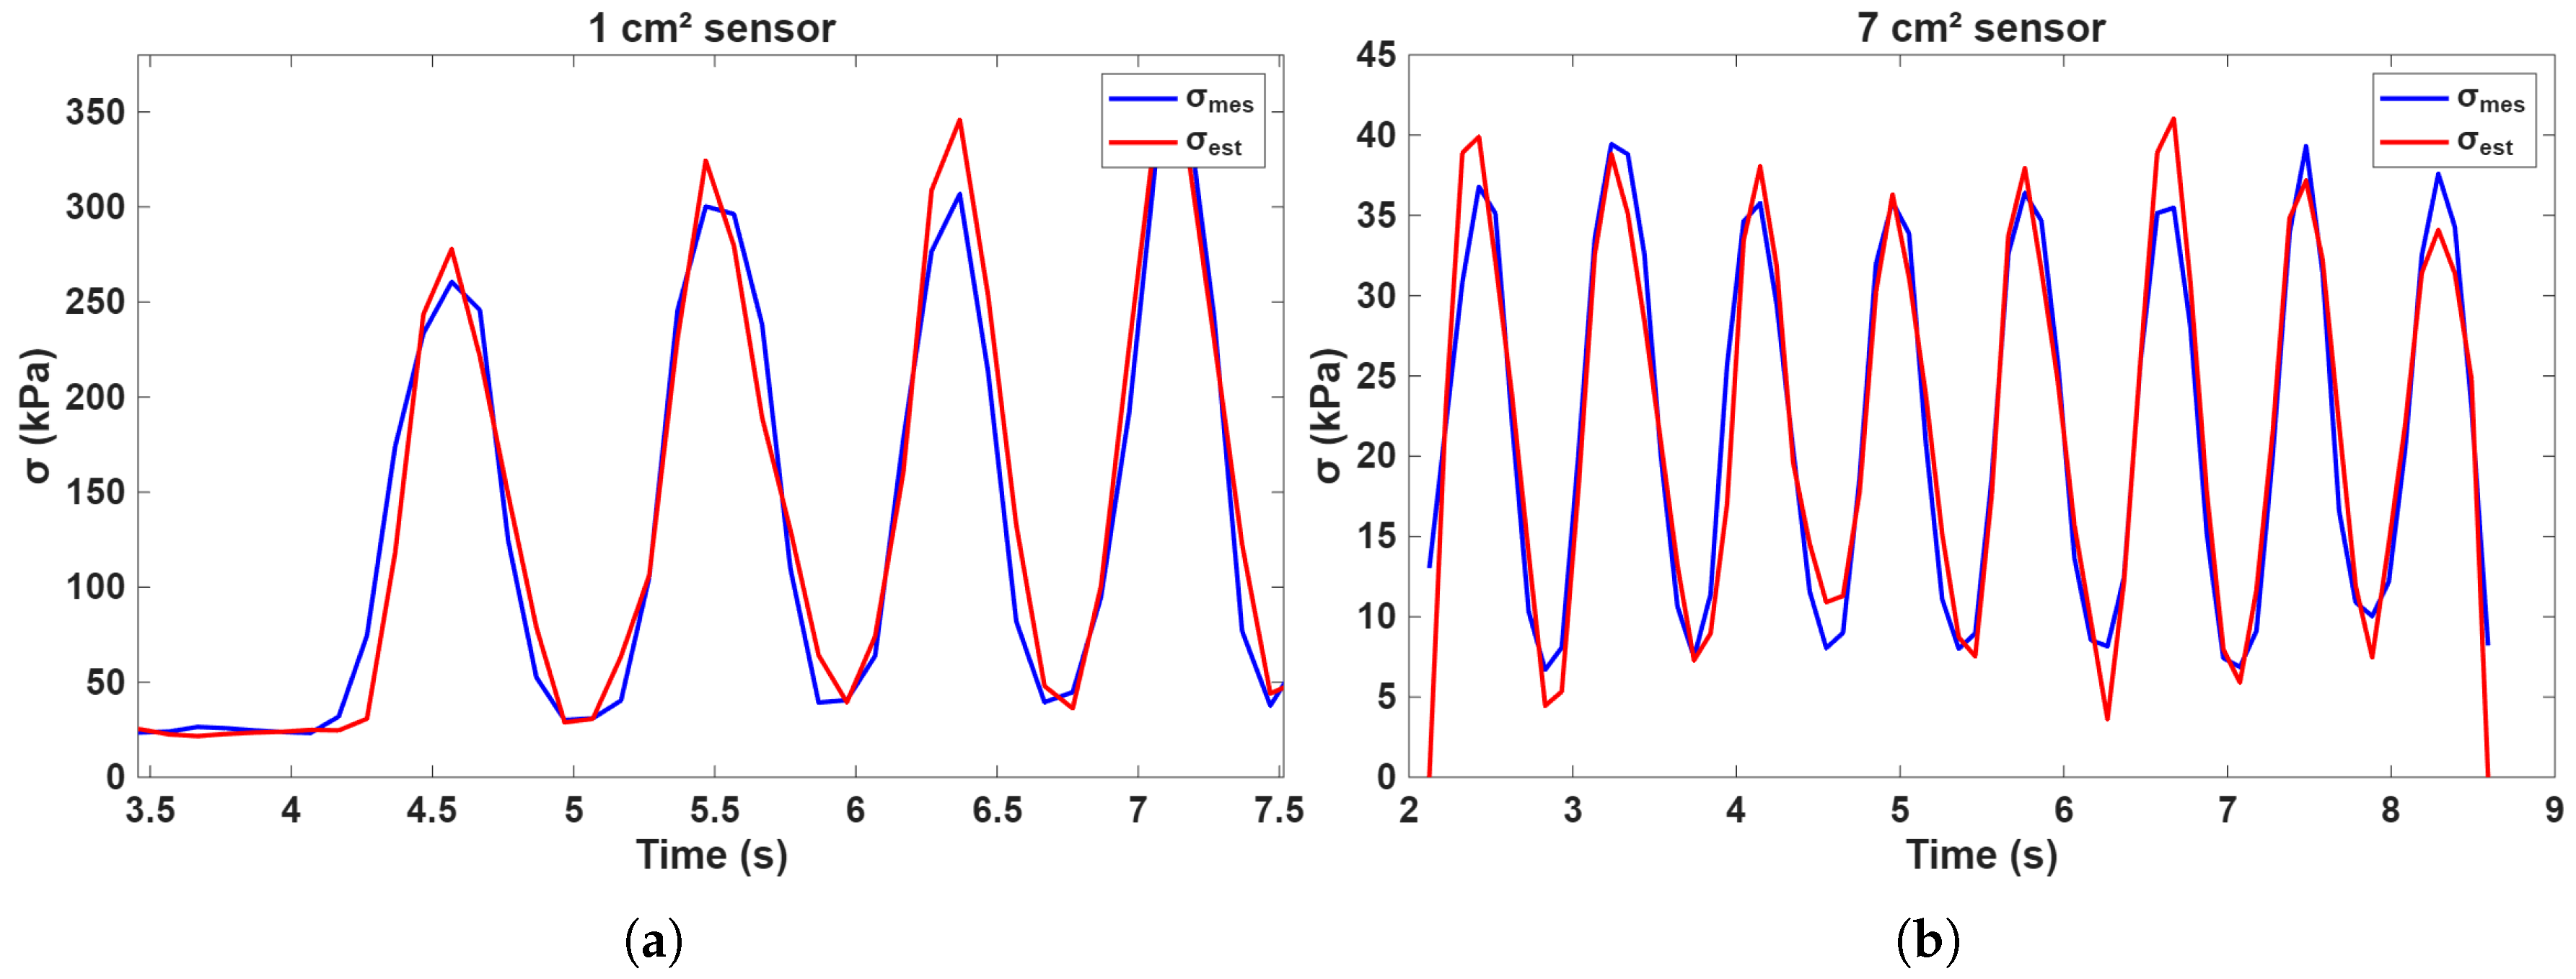
Figure 10a,b show the measured and estimated mechanical stress as a function of time for the two sensor sections embedded in the glove. corresponds to the reference force measured by the commercial force sensor visible in Figure 5 during dynamical applied force. is the estimated force from the viscoelastic model applied to the piezoresistive resistance measures.
Figure 10.
Results of the model on the optimized-parameter dataset. Comparison between the measurement () and the model estimate (): (a) 1 cm2 sensor; (b) 7 cm2 sensor.
The accuracy of both models was evaluated using several indicators: the root mean square error (RMSE) in Equation (8), the coefficient of determination in Equation (9), and the mean relative error over the entire signal in Equation (10). These metrics quantify how closely the estimated force matches the actual applied force. They are presented in Table 4.
where N is the number of samples, the measured load, the load estimated by the model, and the mean value of the measured load.
Table 4.
Viscoelastic model performance for both sensor sections.
The same characterization methodology was applied to all sensor nodes of the matrix using an identical experimental protocol. Since the focus of this study is the validation of the sensing principle and characterization procedure, detailed results for the remaining nodes are not included in this paper. Previous investigations conducted on the same sensing technology under dynamic loading conditions with different temporal profiles demonstrated the ability of the inverse viscoelastic model to accurately track force variations over a wide range of operating conditions [48]. However, previous studies were performed on bare sensors and did not consider the integration of the sensing matrix into a textile structure. The present work addresses this limitation by evaluating the model after integration into a wearable glove. The inverse viscoelastic model effectively compensates for the short-term viscoelastic effects associated with the dynamics of the measured motion. In contrast, long-term viscoelastic phenomena require several hours to reach equilibrium, which is several orders of magnitude slower than the time scales involved in paddle gripping tasks. Consequently, long-term effects do not significantly affect force measurements in the considered application.
Durability and Recovery Test
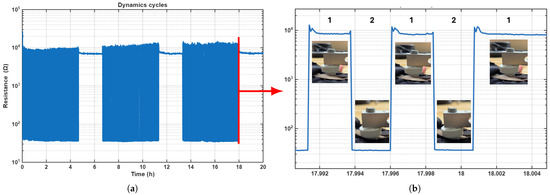
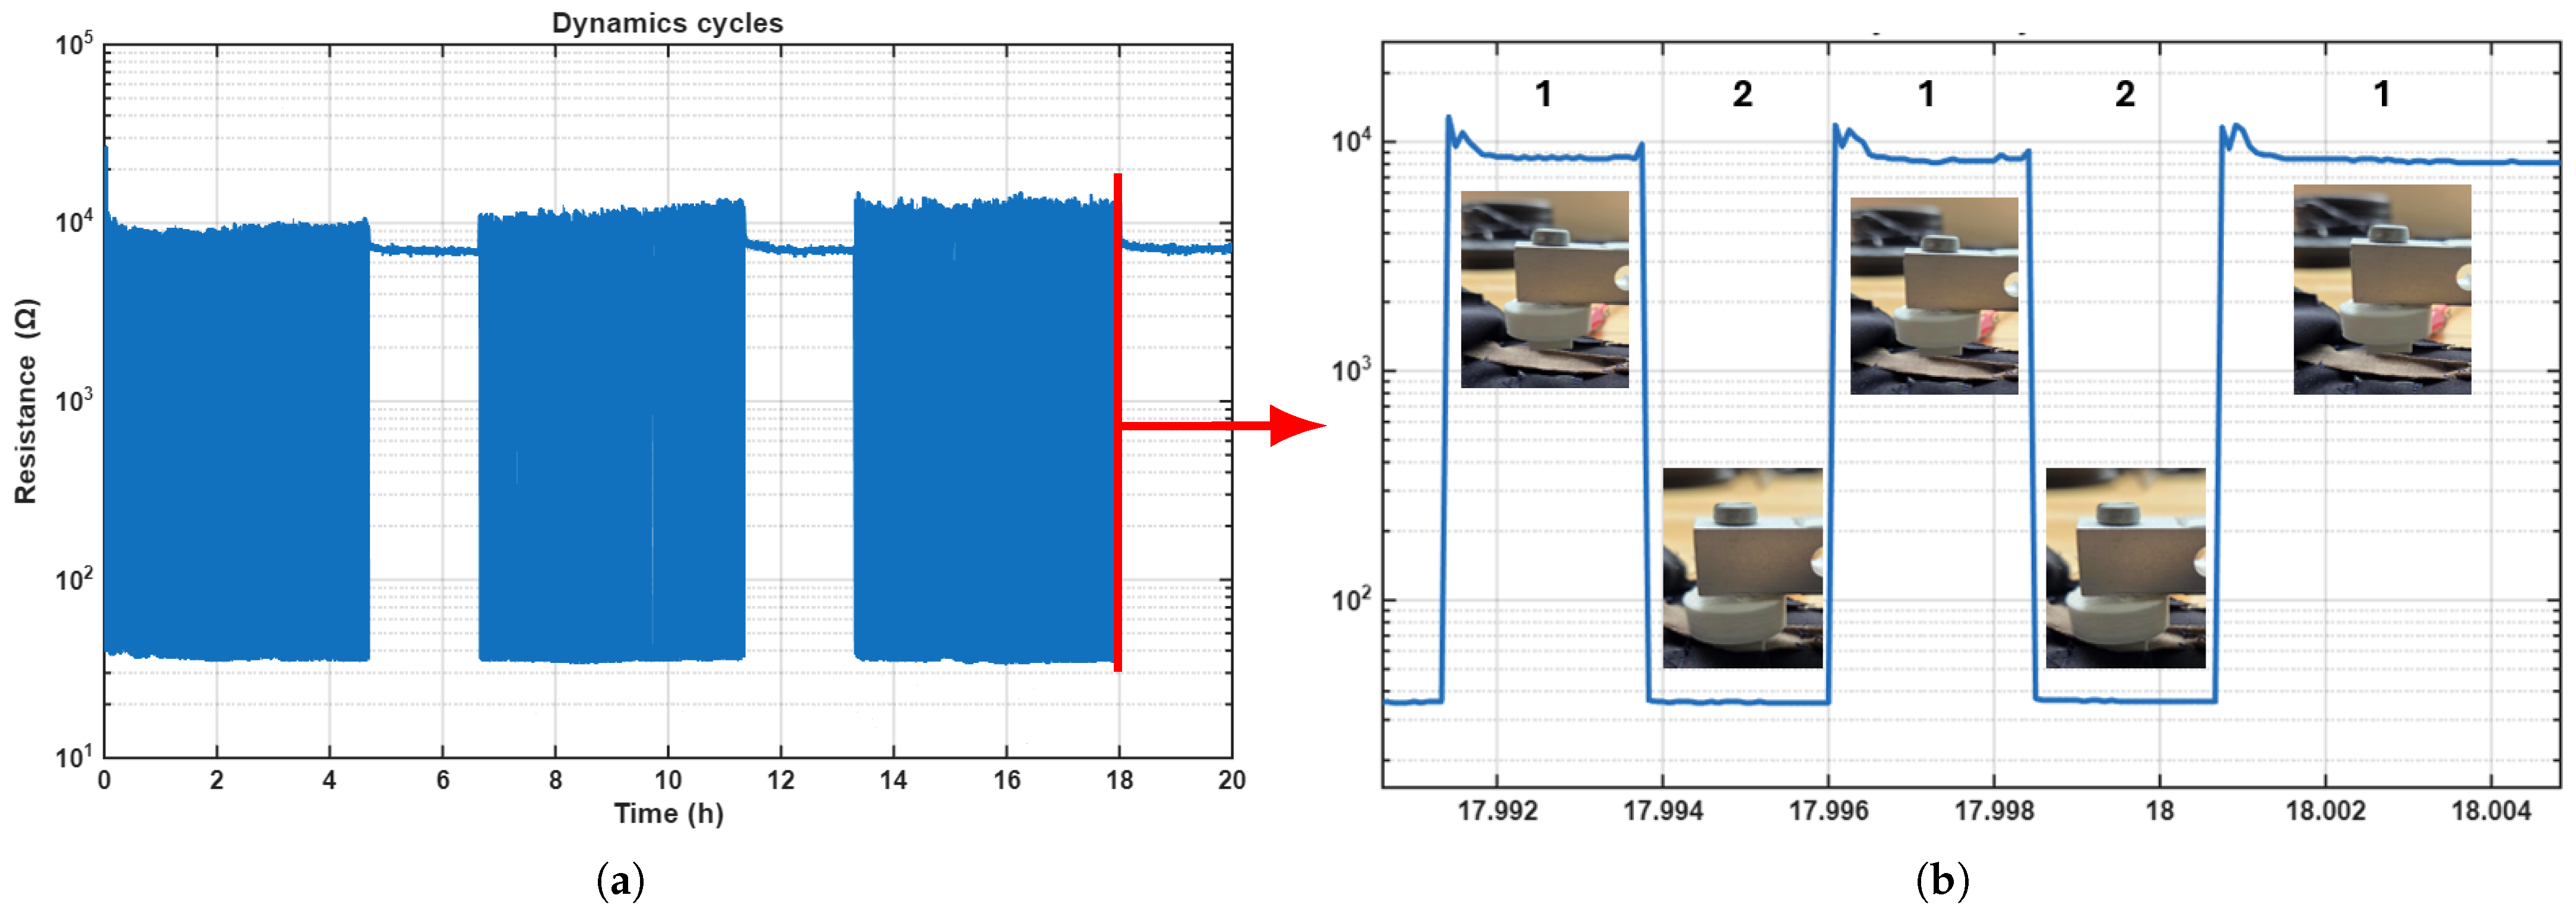
The results of the durability test are illustrated in Figure 11.
Figure 11.
Resistance response of pressure point R7 during the dynamic cycling test: (a) complete cycling sequence; (b) magnified view of the line highlighted in red in (a). State 1 corresponds to a 5 s period without applied pressure (no load), while State 2 corresponds to a 5 s period under applied pressure (loaded).
To quantify the influence of cyclic loading, several data values were extracted from each block of 1000 loading cycles. (Rhigh,init) denotes the unloaded resistance measured during the first loading cycle, (Rhigh,mean) the average unloaded resistance over the 1000 cycles, and (Rhigh,1000) the unloaded resistance measured during the 1000th cycle. Similarly, (Rlow,mean) and (Rlow,1000) correspond to the average and final loaded resistances, respectively. Finally, (R2h,end) represents the unloaded resistance measured at the end of the 2-h recovery period. The corresponding values are reported in Table 5.
Table 5.
Durability and recovery performance of sensing point R7 during cyclic loading tests.
It should be noted that all sensing points of the glove are fabricated from the same piezoresistive material. Consequently, the sensing mechanisms and the associated electromechanical behavior remain similar throughout the sensing array. Although the resistance values may vary between sensing points, the durability and recovery characteristics observed on R7 are representative of the behavior of the other sensing nodes integrated into the glove. Only the low-resistance state was used for force estimation.
3.3. Experimentation on an Ergometer
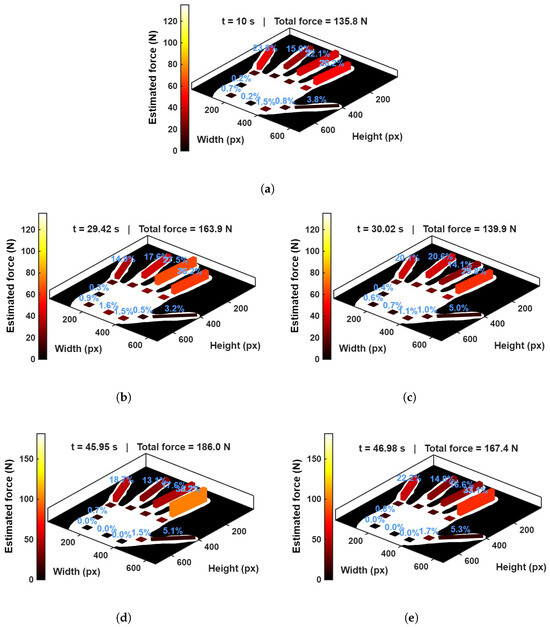
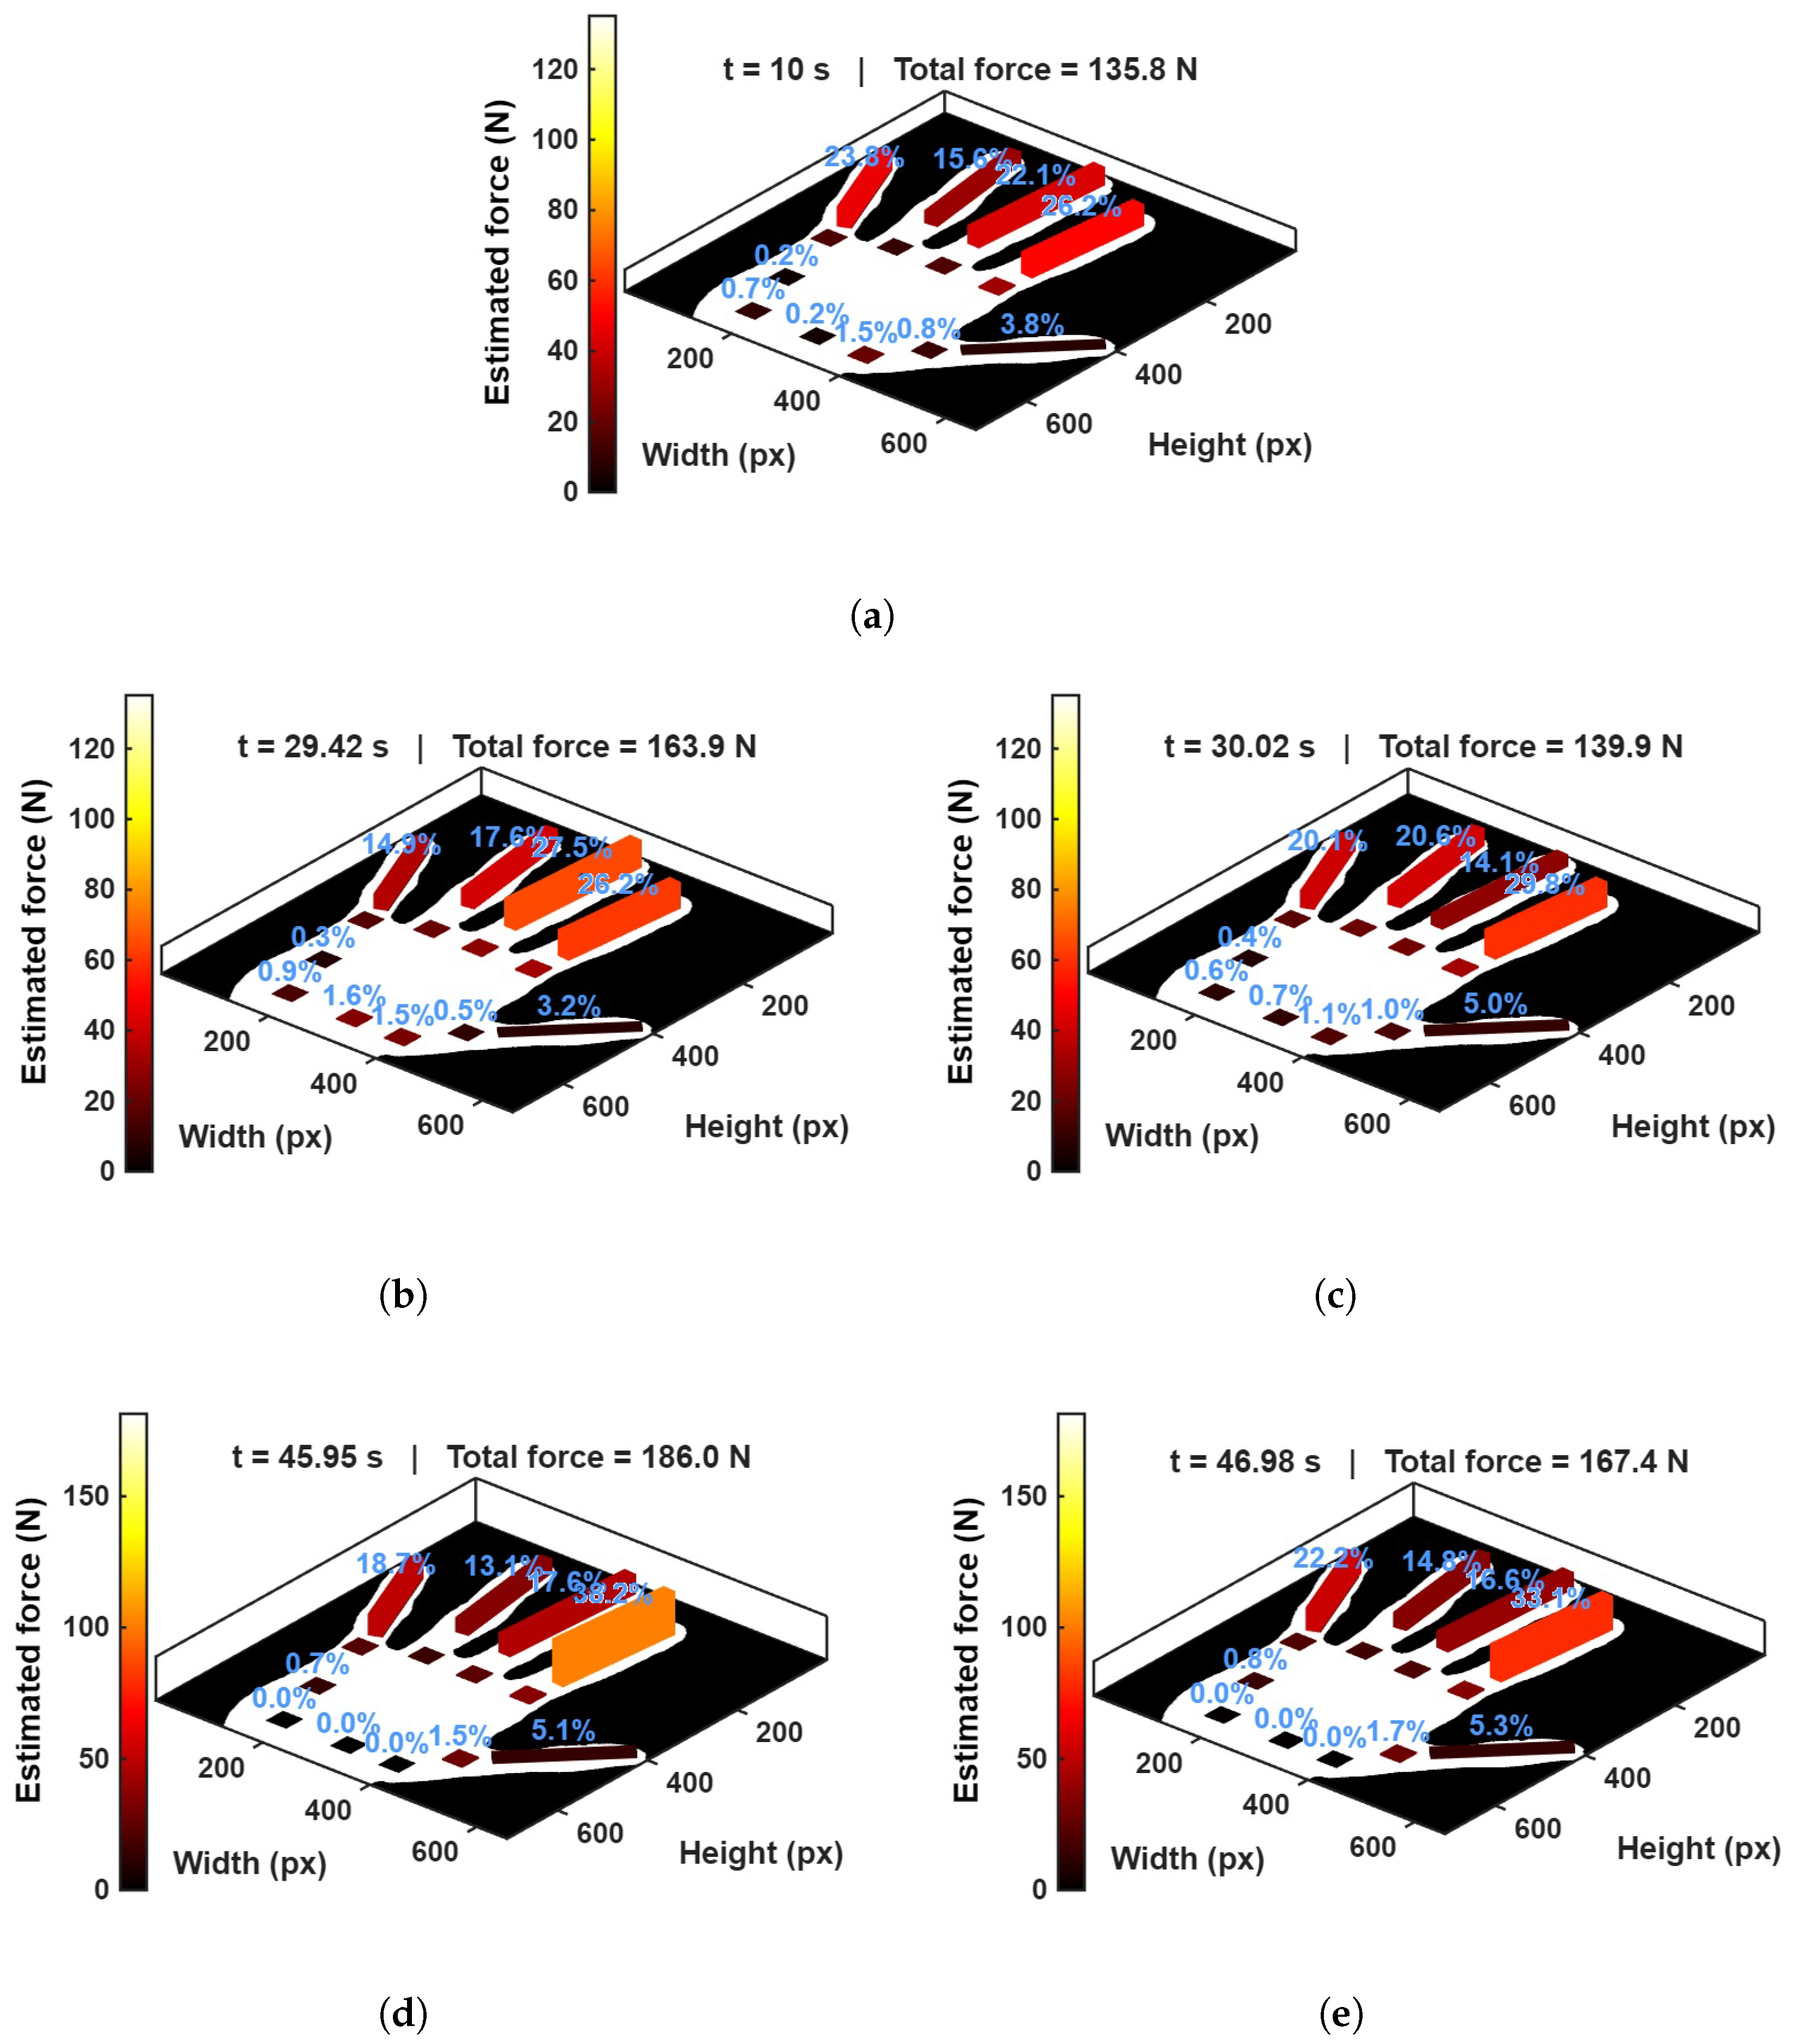
The processing of the experimental results was carried out in Matlab. A 3D mapping of the hand was generated to visualize, as a function of time, the variations of the estimated pressure on each sensor of the matrix during the movements. Each sensor is represented by a vertical bar whose height is proportional to the intensity of the estimated force, expressed as a percentage of the overall calculated force. This overall force is the sum of all sensor values in the matrix. The main results obtained from the dynamic mapping of the experiment are presented in Figure 12. It first illustrates the distribution of pressures when the athlete holds the paddle in a static position before the start of the movement (Figure 12a). This is followed by an initial paddling sequence at a moderate cadence, consisting of a pull phase (Figure 12b), during which the athlete pulls the paddle against the tension applied by the ergometer cords, and a push phase (Figure 12c), during which the athlete accompanies the paddle movement while the left hand pulls on the other side. Finally, these two phases are reproduced at a higher cadence (Figure 12d,e). The maximum values for each phase were plotted in order to highlight the distinct phases observed throughout the motion and to support the proof of concept.
Figure 12.
Dynamic estimation of contact forces during the stroke cycle: (a) initial position; (b) pull phase—moderate cadence; (c) push phase—moderate cadence; (d) pull phase—fast cadence; (e) push phase—fast cadence.
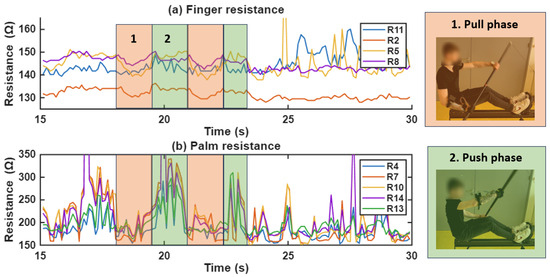
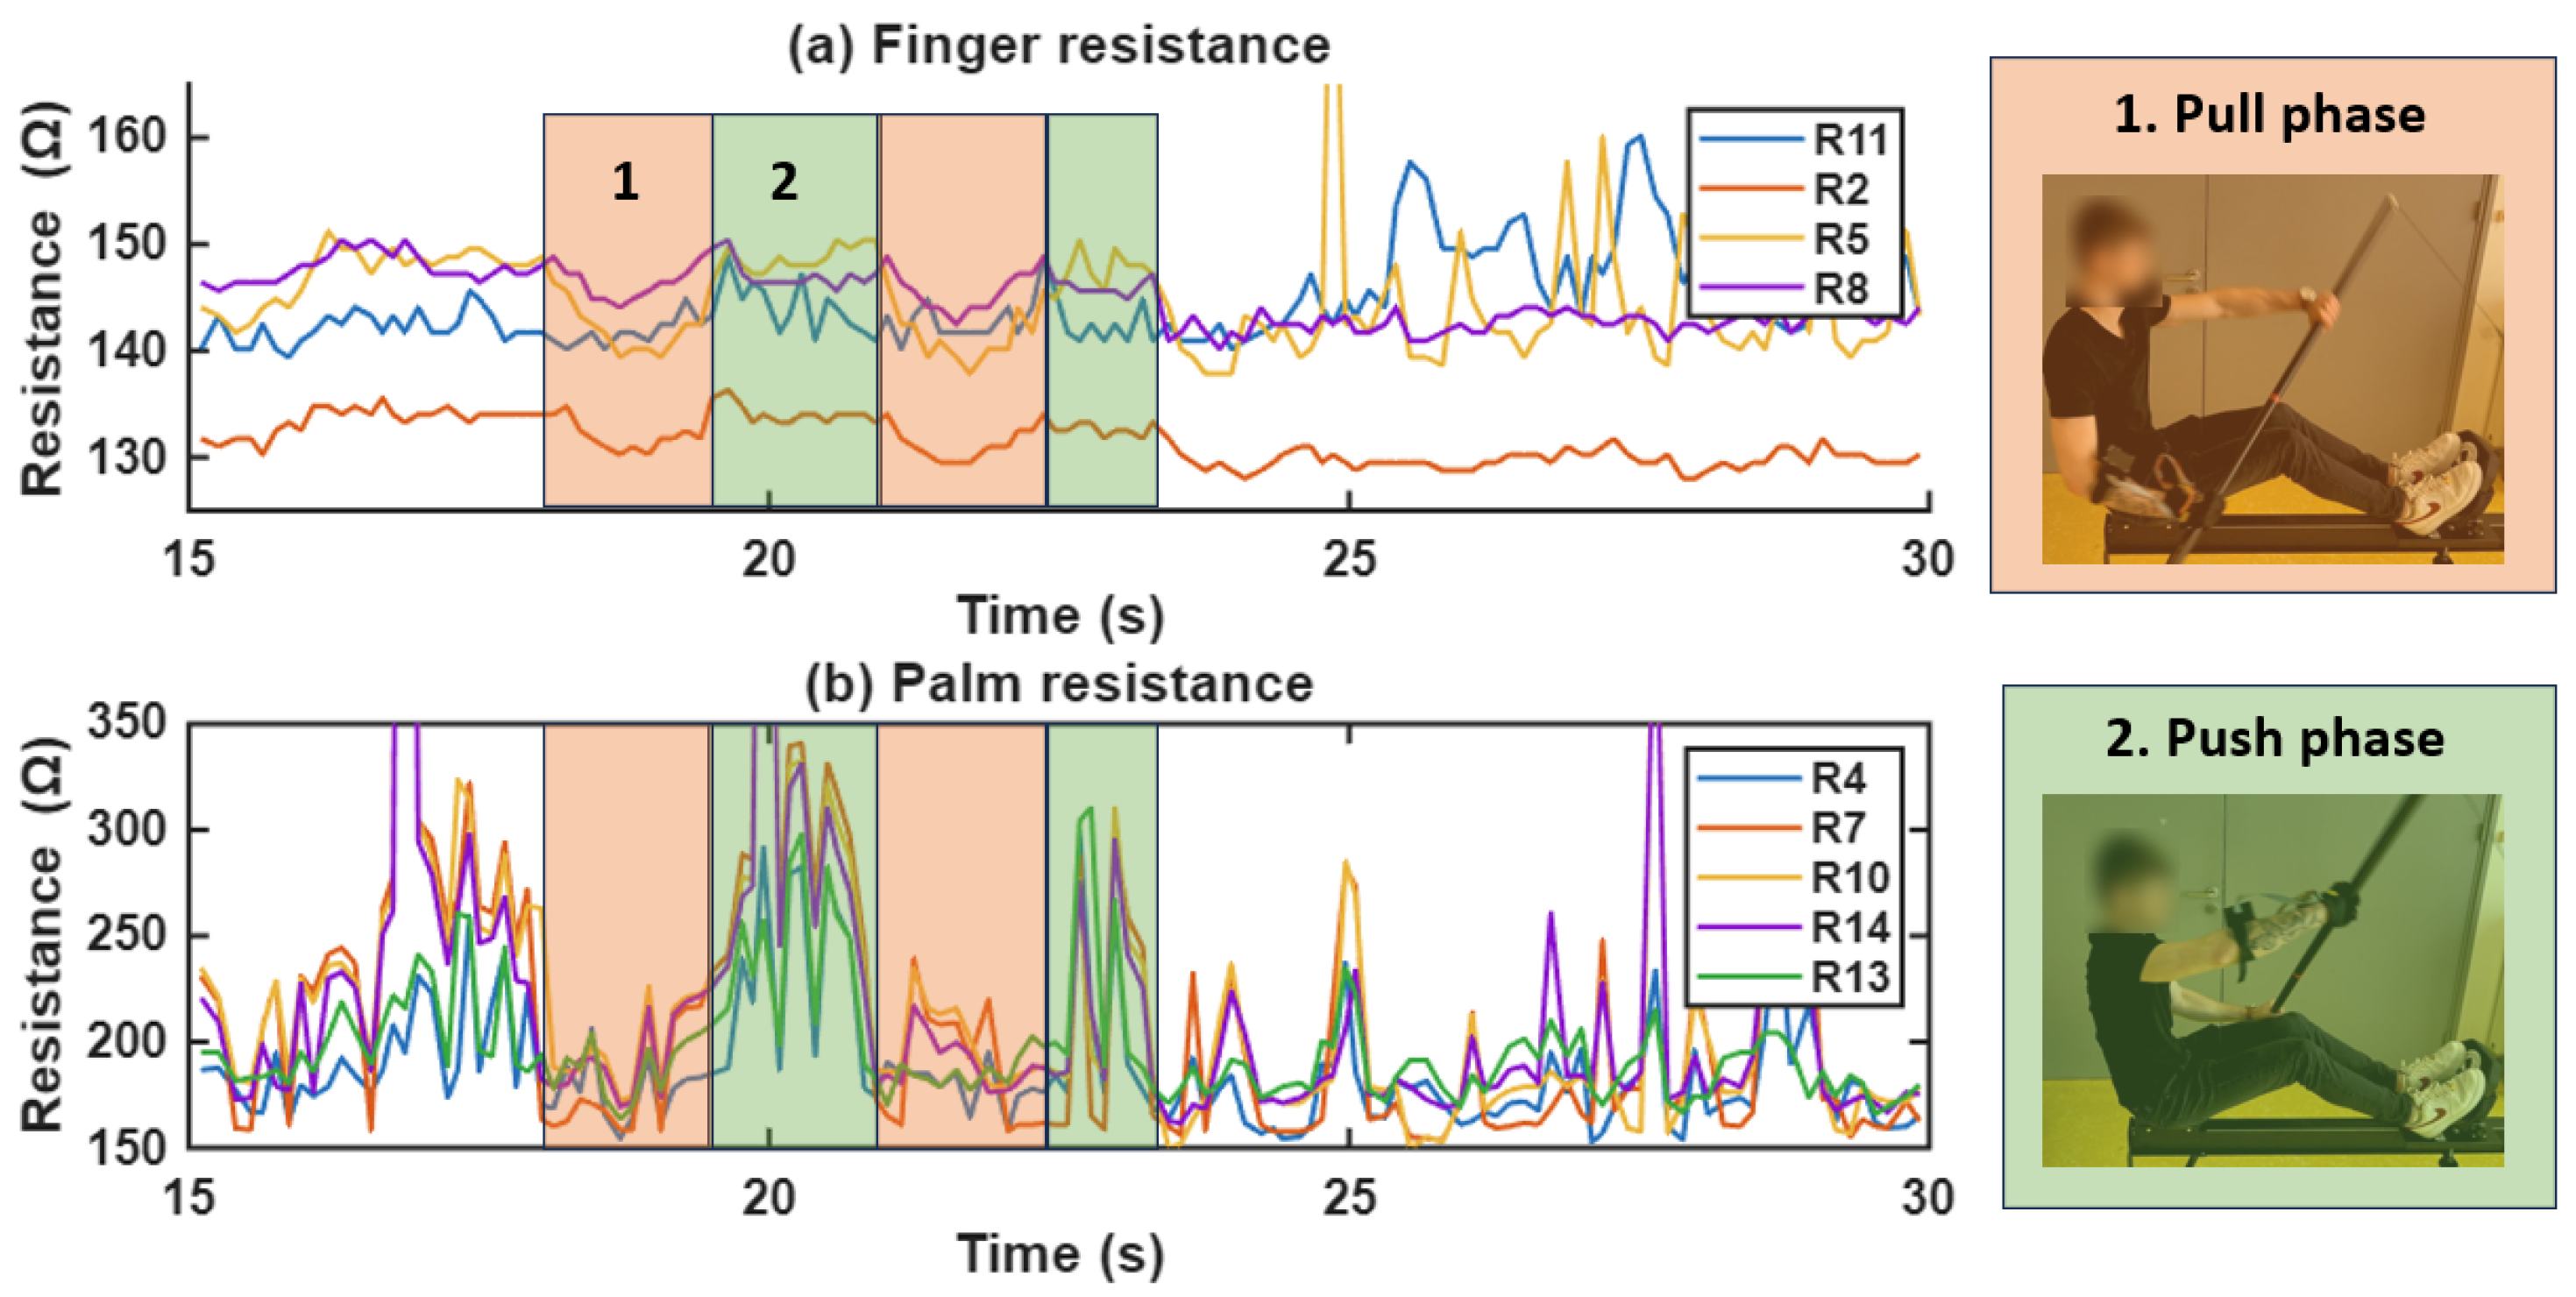
To complement the pressure maps, the temporal evolution of representative sensor nodes during a moderate paddling cadence is illustrated in Figure 13. The upper graph presents selected nodes located on the fingers, while the lower graph shows representative nodes positioned on the palm. These signals highlight the continuous variation of the sensor responses throughout the paddling cycle and provide the temporal information underlying the pressure distributions presented in Figure 12b,c.
Figure 13.
Temporal evolution of representative sensor node resistances during a moderate paddling sequence: (a) finger sensor nodes and (b) palm sensor nodes. The shaded orange regions correspond to the pull phase (1), while the shaded green regions correspond to the push phase (2).
Although these raw signals clearly reflect the dynamic nature of the hand–paddle interaction, their direct interpretation remains challenging because each sensor node exhibits a specific response that depends on its geometry and individual calibration characteristics. This observation highlights the importance of the proposed signal processing and viscoelastic modeling approach, which enables the conversion of resistance measurements into more meaningful load estimates. The lower resistance values observed for the finger sensor nodes compared with those located on the palm are consistent with the higher loads applied to the fingers during paddling, particularly on the index and middle fingers.
4. Discussion
Static characterization tests (Figure 9) confirmed good measurement repeatability in high-pressure ranges beyond 10 N, which is consistent with use conditions when gripping the kayak paddle. The low dispersion in these regions (Figure 9a,b) strengthens the reliability of the sensor matrix for dynamic use. This trend was verified at every node of the matrix. The mean relative error obtained from repeated measurements was 3.15 % for the 1 cm2 sensors and 1.18 % for the 7 cmv sensors, confirming the good reproducibility of both sensor geometries under static loading conditions. As reported in Table 2, both sensor geometries exhibited a pressure-dependent sensitivity, with higher values obtained in the low-pressure range than in the high-pressure range. The 1 cm2 sensors showed greater sensitivity than the 7 cm2 sensors, while both configurations exhibited comparable hysteresis levels. This hysteresis does not compromise sensor performance, as it is accounted for and handled by the viscoelastic model used. A decrease in sensitivity was observed as the applied pressure increased, indicating smaller conductance variations for a given pressure increment at higher load levels. This behavior is consistent with the nonlinear response of Velostat and reflects the progressive saturation of the conductive network within the material.
Dynamic characterization (Figure 10) highlighted encouraging performance of the viscoelastic model for estimating load from sensor resistance. The results in Table 4 suggest that the model is suitable for global load estimation, with an RMSE around 2 N and a low mean relative error. However, parameter estimation is required at each node of the matrix. This level of error is not limiting for quantifying large-amplitude phenomena. The dynamic cycling tests presented in Section Durability and Recovery Test demonstrate that the sensor response under load remained highly stable throughout the experiment, with (Rlow,mean) and (Rlow,1000) consistently remaining within a narrow range of approximately 35 to 45 . Although a slight conditioning effect was observed, characterized by a gradual increase in the unloaded resistance during the cycling phase, the resistance returned close to its initial unloaded value after each 2-h recovery period. This behavior indicates that the observed drift is largely reversible and does not originate from permanent degradation of the sensing element. Overall, these results demonstrate that the proposed sensor maintains its functionality and measurement capabilities after several thousand loading cycles under a representative load condition, supporting its suitability for long-term practical use.
The estimated load maps (Figure 12) visualize the spatial and temporal evolution of pressures on the hand over the paddling cycle. During the push and pull phases, there is a clear redistribution of loads across the fingers and the base of the hand. At moderate cadence (Figure 12b,c), loads remain relatively well distributed, with peaks primarily on the fingers, mostly the index and middle fingers, particularly during the pull. At higher cadence (Figure 12d,e), overall load intensity increases, with a more pronounced concentration on the flexor fingers, reflecting greater muscular engagement. Pulling also generates higher loads than pushing, consistent with the paddling mechanics on the ergometer. It should be recalled that the accuracy of the viscoelastic model must be taken into account when interpreting the mapping results.
These results can also be compared with the literature. For example, Hokaria et al. [50] reported a pressure of 250 kPa at the index finger during cylinder-grip experiments. In our high-cadence pull trial, a pressure of 101.5 kPa was recorded, which is of the same order of magnitude and supports the consistency of our findings with prior reports. Moreover, Bonito et al. [25] reported force peaks averaging up to 240 N at each hand in elite kayakers. Our measurements indicate total loads reaching 186 N during the most intense phases, which is consistent with laboratory conditions, even though the cadence here (up to 48 strokes/min) remains lower than peak race cadences. It should also be noted that the participant involved in this study was not a high-level athlete. In the study by Niu et al. [51], competitive female kayakers reached a mean right-hand grip force of 100.55 N during right-side strokes.
It should be noted that this experiment was primarily intended to validate the operation of the instrumented glove. The values obtained open promising avenues for assessing technique and conducting biomechanical analysis in a controlled environment.
5. Conclusions
The study enabled the development and experimental validation of an instrumented glove for elite kayaking, integrating a matrix of piezoresistive sensors coupled with a viscoelastic model to estimate the forces applied by the hand to the paddle throughout the movement. The results demonstrate the model’s accuracy, as well as good consistency of the dynamic maps with the different movement phases observed in ergometer tests and in the literature. Although this study is preliminary and based on a limited number of trials, it establishes a proof of concept. An energy assessment of the system, which is not detailed here, showed an autonomy of 26 h, which is more than sufficient for a training session with high-level athletes.
Although Velostat has been widely adopted in the literature for pressure-sensing applications, reported models, when provided, are most often restricted to static load or force estimation. In this work, we go beyond this perspective by leveraging a dynamic model that has already been validated in the literature [48], and we observe behavior that is consistent with previously published results. This validated framework then supports the definition and demonstration of new application scenarios, notably through the integration of stitched Velostat into textile-based structures, as presented in this paper.
There are many avenues for future work. On the hardware side, it would be valuable to ensure that the glove is fully waterproof for on-water testing and to characterize sensor stability under real humidity and temperature conditions. This includes characterizing not only the sensor itself but also the rubber-based waterproofing material used in wetsuits, as its viscoelastic behavior may influence the overall performance and reliability of the system. Developing a glove for the other hand would enable bilateral analysis of the stroke. For data transmission, a long-range communication system would allow coaches to perform real-time monitoring. Investigating the long-term mechanical behavior of the sensing material, including potential creep, stress relaxation, and fatigue effects, would be valuable to assess whether these phenomena could influence sensor performance and the reliability of the measured data over extended periods of use. Finally, combining these force data with variables such as stroke cadence or boat speed would offer new indicators of performance and individual technique.
This work has cross-cutting value for stakeholders across sports. Athletes would benefit from objective feedback on their technique, coaches would benefit from a tool to support technical monitoring, researchers would benefit from a reusable platform for movement analysis or load assessment, and the medical sector would benefit from a device potentially transferable to functional rehabilitation. Access to these measurements would also make it possible to identify movement asymmetries that may affect other parameters, such as stroke rate. In addition, quantifying the effort and combining it with other biomechanical and physiological indicators would enable a more precise assessment of its contribution to boat speed. At present, boat speed is typically measured independently of these parameters; estimating speed as a function of multiple metrics would provide clearer guidance for training, improve athlete monitoring, and enhance performance. Future work could combine the pressure measurements provided by the glove with other biomechanical and physiological indicators to enable a more comprehensive assessment of athlete performance. The system, therefore, paves the way for a compact, customizable tool.
Author Contributions
Conceptualization, C.D.; methodology, C.D., G.J., C.P., C.A. and A.M.; software, C.D.; validation, C.D. and G.J.; formal analysis, C.D.; investigation, C.D.; resources, C.D.; data curation, C.D.; writing—original draft preparation, C.D.; writing—review and editing, C.D., G.J. and F.R.; visualization, C.D.; supervision, G.J. and F.R.; project administration, G.J. and F.R.; funding acquisition, G.J. and F.R. All authors have read and agreed to the published version of the manuscript.
Funding
This study is funded by the ANR within the framework of the PIA EUR DIGISPORT project (ANR-18-EURE-0022) and by the French National Research Agency (ANR) under the France 2030 program and ESOS (ref. ANR-23-CMAS-0007).
Institutional Review Board Statement
Ethical review and approval were waived for this study because the experimental protocol consisted exclusively of voluntary non-invasive self-experimentation by the authors, without recruitment of external participants or clinical procedures. Under the authors’ understanding of Article L1121-1 of the French Public Health Code, formal ethics committee approval was not required. The authors provided informed consent for participation and publication of the experimental images included in this manuscript.
Informed Consent Statement
Informed consent was obtained from all subjects involved in the study.
Data Availability Statement
The data presented in this study are available on request from the corresponding author.
Acknowledgments
We would like to thank the team at Junia in Lille for the fruitful discussions on integrating electronics into textiles and the associated stitching techniques. Their expertise and insights greatly supported the development of this work. We also wish to thank the French Canoe Kayak Federation (FFCK) in Cesson-Sévigné, whose constructive exchanges were particularly valuable in better understanding field expectations and the realities of high-level sports.
Conflicts of Interest
The authors declare no conflicts of interest.
Abbreviations
The following abbreviations are used in this manuscript:
| BLE | Bluetooth Low Energy |
| RMSE | Root Mean Square Error |
| FSR | Force-Sensing Resistor |
| EMG | Electromyography |
| PVDF | PolyVinyliDene Fluoride |
| IDC | Insulation Displacement Connector |
| PLA | Polylactic Acid |
| FFCK | French Canoe Kayak Federation |
References
- Leong, D.P.; Teo, K.K.; Rangarajan, S.; Lopez-Jaramillo, P.; Avezum, A., Jr.; Orlandini, A.; Seron, P.; Ahmed, S.H.; Rosengren, A.; Kelishadi, R.; et al. Prognostic value of grip strength: Findings from the Prospective Urban Rural Epidemiology (PURE) study. Lancet 2015, 386, 266–273. [Google Scholar] [CrossRef] [Scilit] [PubMed]
- Huemer, M.T.; Kluttig, A.; Fischer, B.; Ahrens, W.; Castell, S.; Ebert, N.; Gastell, S.; Jöckel, K.-H.; Kaaks, R.; Karch, A.; et al. Grip strength values and cut-off points of the German National Cohort (NAKO). Age Ageing 2023, 52, afac324. [Google Scholar] [CrossRef] [Scilit] [PubMed]
- Tomkinson, G.R.; Lang, J.J.; Rubín, L.; McGrath, R.; Gower, B.; Boyle, T.; Klug, M.G.; Mayhew, A.J.; Blake, H.T.; Ortega, F.B.; et al. International norms for adult handgrip strength: A systematic review of data on 2.4 million adults aged 20 to 100+ years from 69 countries and regions. J. Sport Health Sci. 2025, 14, 101014. [Google Scholar] [CrossRef] [Scilit] [PubMed]
- Fan, J.; Chen, L.; Zhang, D. Comparison of grip strength measurements for predicting all-cause mortality among adults aged 20+ years from NHANES 2011–2014. Sci. Rep. 2024, 14, 29245. [Google Scholar] [CrossRef] [Scilit] [PubMed]
- Baruah, J.; Kharel, A.; Hina, M.; Ceylan, H.İ.; Raul-Ioan, M.; Thapa, R.K. Acute Effects of Squat and Ballistic Jump Exercises on Judo-Specific Performance, Handgrip Strength, and Perceived Exertion in Young Male Judokas. Appl. Sci. 2024, 14, 10558. [Google Scholar] [CrossRef] [Scilit]
- Fryer, S.; Stoner, L.; Scarrott, C.; Dickson, T.; Draper, N.; Hughes, J. Climbing-specific finger flexor performance and forearm muscle oxygenation in elite male and female sport climbers. Eur. J. Appl. Physiol. 2012, 112, 2839–2847. [Google Scholar] [CrossRef] [Scilit]
- Kong, K.; Park, J.; Yoon, J.; Kim, S. Finger Gesture Recognition Glove Using Velostat. In Proceedings of the 2011 International Conference on Control, Automation and Systems (ICCAS), Gyeonggi-do, Republic of Korea, 26–29 October 2011; pp. 1398–1402. [Google Scholar]
- Liu, H.; Xie, X.; Millar, M.; Edmonds, M.; Gao, F.; Zhu, Y.; Santos, V.J.; Rothrock, B.; Zhu, S.-C. A Glove-based System for Studying Hand-Object Manipulation via Joint Pose and Force Sensing. In Proceedings of the IEEE/RSJ International Conference Intelligent Robots and Systems (IROS), Vancouver, BC, Canada, 24–28 September 2017; pp. 6617–6624. [Google Scholar]
- Zhang, X.; Zhang, S.; Chen, X.; Zhang, J. A Tactile Glove for Object Recognition Based on Palmar Pressure and Joint Bending Strain Sensing. J. Meas. Sci. Instrum. 2025, 16, 173–185. [Google Scholar] [CrossRef] [Scilit]
- Lee, K.T.; Chee, P.S.; Lim, E.H.; Kam, Y.H. Development of Flexible Glove Sensors for Virtual Reality (VR) Applications. Mater. Today Proc. 2023, in press. [Google Scholar] [CrossRef] [Scilit]
- Zhang, Y.; Zeng, J.; Wang, Y.; Jiang, G. Flexible Three-Dimensional Force Tactile Sensor Based on Velostat Piezoresistive Films. Micromachines 2024, 15, 486. [Google Scholar] [CrossRef] [Scilit] [PubMed]
- De Mathelin, M.; Nageotte, F.; Zanne, P.; Dresp-Langley, B. Sensors for Expert Grip Force Profiling: Towards Benchmarking Manual Control of a Robotic Device for Surgical Tool Movements. Sensors 2019, 19, 4575. [Google Scholar] [CrossRef] [Scilit] [PubMed]
- Abiri, A.; Pensa, J.; Tao, A.; Ma, J.; Juo, Y.-Y.; Askari, S.J.; Bisley, J.; Rosen, J.; Dutson, E.P.; Grundfest, W.S. Multi-Modal Haptic Feedback for Grip Force Reduction in Robotic Surgery. Sci. Rep. 2019, 9, 5016. [Google Scholar] [CrossRef] [Scilit] [PubMed]
- Liu, R.; Nageotte, F.; Zanne, P.; de Mathelin, M. Wearable Sensors for Spatio-Temporal Grip Force Profiling. Sensors 2021, 21, 1234–1245. [Google Scholar]
- Seo, K.; Seo, J.; Jeong, H.; Kim, S.; Yoon, S.H. Posture-Informed Muscular Force Learning for Robust Hand Pressure Estimation. arXiv 2024, arXiv:2410.23629. [Google Scholar] [CrossRef] [Scilit]
- Nazeer, S. Design and Production of Micro-Pressure Sensors for Force Feedback Interface Instrumentation. Doctoral Thesis, University of Paris-Sud, Paris, France, 2012. [Google Scholar]
- Abbass, Y.; Gianoglio, C.; Al Haj Ali, H.; Saleh, M.; Valle, M. Texture Perception Using Tactile Sensing Glove Based on PVDF Sensors and Machine Learning. IEEE Sens. Lett. 2024, 8, 5502404. [Google Scholar] [CrossRef] [Scilit]
- Chen, H.; Ou, H.; Chen, H. A Method for Rehabilitation of Hand Dysfunction by Cyber Glove. In Proceedings of the 5th International Conference on Advanced Engineering Materials and Technology (AEMT 2015); Atlantis Press: Guangzhou, China, 2015. [Google Scholar] [CrossRef] [Scilit]
- Fobiri, G.K.; Tawiah, B.; Howard, E.K.; Crentsil, T.; Emmanuel, A.; Safo-Ankama, K.; Ibrahim, M.; Asinyo, B.K.; Asare, T.O.; Nyarko, M.O. Wearable Electronic Textile Systems for Health Monitoring: A Review of Advances and Adoption Challenges. Nano Sel. 2026, 7, e70146. [Google Scholar] [CrossRef] [Scilit]
- Stothart, J.; Reardon, F.; Thoden, J. A System for the Evaluation of On-Water Stroke Force Development During Canoe and Kayak Events. In International Symposium on Biomechanics in Sports; International Society of Biomechanics in Sports: Halifax, NS, Canada, 1986; pp. 146–152. [Google Scholar]
- Petrone, N.; Quaresimin, M.; Spina, S. A Load Acquisition Device for the Paddling Action on Olympic Kayak. In Proceedings of the International Conference on Experimental Mechanics, Oxford, UK, 24–28 August 1998; Volume 2, pp. 817–822. [Google Scholar]
- Sturm, D.; Yousaf, K.; Eriksson, M. A Wireless, Unobtrusive Kayak Sensor Network Enabling Feedback Solutions. In Proceedings of the 2010 International Conference on Body Sensor Networks (BSN), Singapore, 7–9 June 2010; pp. 159–163. [Google Scholar] [CrossRef] [Scilit]
- Gomes, B.B.; Ramos, N.V.; Conceição, F.A.V.; Sanders, R.H.; Vaz, M.A.P.; Vilas-Boas, J.P. Paddling Force Profiles at Different Stroke Rates in Elite Sprint Kayaking. J. Appl. Biomech. 2015, 31, 258–263. [Google Scholar] [CrossRef] [Scilit] [PubMed]
- Kong, P.W.; Tay, C.S.; Pan, J.W. Application of Instrumented Paddles in Measuring On-Water Kinetics of Front and Back Paddlers in K2 Sprint Kayaking Crews of Various Ability Levels. Sensors 2020, 20, 6317. [Google Scholar] [CrossRef] [Scilit] [PubMed]
- Bonito, P.; Sousa, M.; Ferreira, F.J.; Justo, J.F.; Gomes, B.B. Magnitude and Shape of the Forces Applied on the Foot Rest and Paddle by Elite Kayakers. Sensors 2022, 22, 1612. [Google Scholar] [CrossRef] [Scilit] [PubMed]
- Nates, F.M.M. Contribution to the Biomechanical Analysis of Kayaking Activity: Implementation and Validation of a Three-Dimensional Dynamometric Measurement Chain. Doctoral Thesis, University of Poitiers, Poitiers, France, 2013. [Google Scholar]
- Laaraibi, A.-R.A.; Jodin, G.; Depontailler, C.; Bideau, N.; Razan, F. Design and Characterization of Piezoresistive Sensors for Non-Planar Surfaces and Pressure Mapping: A Case Study on Kayak Paddle. Sensors 2024, 24, 222. [Google Scholar] [CrossRef] [Scilit]
- GripTM. Measurement of Tactile Grip Pressures. Available online: https://www.mescan.com/prehension-grip (accessed on 23 October 2025).
- 5DT Technologies. Data Glove Ultra. Wearable Glove for Hand and Finger Motion Capture Used in Virtual Reality, Rehabilitation, and Human–Computer Interaction Applications. Available online: https://5dt.com/5dt-data-glove-ultra/ (accessed on 23 October 2025).
- Pressure Profile Systems. Interpreting TactileGlove Data for Practical Use Cases. Technical Article Describing the Analysis and Practical Applications of Tactile Sensing Glove Data. Available online: https://pressureprofile.com/interpreting-tactileglove-data-for-practical-use-cases (accessed on 23 October 2025).
- Carbonhand. Assistive Soft Robotic Glove Designed to Enhance Grip Strength and Support Grasping Activities in Daily and Professional Tasks. Available online: https://www.ergo-diffusion.com/nos-solutions/ergonomie/carbonhand-gant-dassistance-la-prehension-sem (accessed on 23 October 2025).
- Tactilus® Grip Pressure Sensor Glove. System Specifications. Available online: https://www.sensorprod.com/applications/hand-grip-pressure/ (accessed on 5 January 2026).
- Helmer, R.J.N.; Farouil, A.; Baker, J.; Blanchonette, I. Instrumentation of a Kayak Paddle to Investigate Blade/Water Interactions. Procedia Eng. 2011, 13, 501–506. [Google Scholar] [CrossRef] [Scilit]
- Kottink, A.I.R.; Nikamp, C.D.M.; Bos, F.P.; van der Sluis, C.K.; Broek, M.v.D.; Onneweer, B.; Stolwijk-Swüste, J.M.; Brink, S.M.; Voet, N.B.M.; Rietman, J.S.; et al. Therapy Effect on Hand Function after Home Use of a Wearable Assistive Soft-Robotic Glove Supporting Grip Strength. PLoS ONE 2024, 19, e0306713. [Google Scholar] [CrossRef] [Scilit] [PubMed]
- Mohanaprasath, K.V.; Mangai, S. An Advanced Smart Glove for Stroke Rehabilitation Using IoT. In Proceedings of the 2025 Eleventh International Conference on Bio Signals, Images, and Instrumentation (ICBSII); Technical Report; Velalar College of Engineering and Technology: Erode, India, 2025. [Google Scholar]
- Athira, J.; Thomas, J. Soft Pneumatic Exoskeleton Glove with Feedback Control for Precise Rehabilitation Training. In Proceedings of the 2025 Advanced Computing and Communication Technologies for High Performance Applications (ACCTHPA); Technical Report; College of Engineering Trivandrum: Thiruvananthapuram, India, 2025. [Google Scholar]
- Priya, S.; Sherin Heera, P.; Hemalatha, R.J. Sensing of Surface Texture Using Smart Glove for Post-Stroke Rehabilitation. In Proceedings of the 2025 5th International Conference on Trends in Material Science and Inventive Materials (ICTMIM); Technical Report; Vels Institute of Science, Technology and Advanced Studies: Chennai, India, 2025. [Google Scholar]
- Pan, Y.; Chen, K.; Liu, Y.; Liu, Y.; He, M.; Xie, Z.; Wang, Z. High-Sensitivity All-Fiber Sensor Smart Gloves for Hand Perception. ACS Appl. Mater. Interfaces 2025, 17, 31454–31466. [Google Scholar] [CrossRef] [Scilit] [PubMed]
- Krishnan, A.; Yang, X.; Seth, U.; Jeyachandran, J.M.; Ahn, J.Y.; Gardner, R.; Pedigo, S.F.; Blom-Schieber, A.W.; Banerjee, A.G.; Manohar, K. Data-Driven Ergonomic Risk Assessment of Complex Hand-Intensive Manufacturing Processes. arXiv 2024, arXiv:2403.05591. [Google Scholar]
- Kottink, A.I.R.; Nikamp, C.D.; Bos, F.P.; van der Sluis, C.K.; Broek, M.v.D.; Onneweer, B.; Stolwijk-Swüste, J.M.; Brink, S.M.; Voet, N.B.; Buurke, J.B.; et al. Therapeutic Effect of a Soft Robotic Glove for Activities of Daily Living in People with Impaired Hand Strength: Protocol for a Multicenter Clinical Trial (iHand). JMIR Res. Protoc. 2022, 11, e34200. [Google Scholar] [CrossRef] [Scilit] [PubMed]
- Rehman, M.U.; Shah, K.; Haq, I.U.; Iqbal, S.; Ismail, M.A. A Wearable Force Myography-Based Armband for Recognition of Upper Limb Gestures. Sensors 2023, 23, 9357. [Google Scholar] [CrossRef] [Scilit] [PubMed]
- Xiao, Y.; Huang, Z.; Ren, J.; Song, H.; Gao, Y.; Bai, Y.; Jin, Z. Wrist2Finger: Sensing Fingertip Force for Force-Aware Hand Interaction with a Ring-Watch Wearable. arXiv 2025, arXiv:2510.04122. [Google Scholar] [CrossRef] [Scilit]
- Adafruit Industries. Velostat Pressure-Sensitive Conductive Sheet—Technical Datasheet. Available online: https://media.digikey.com/pdf/Data%20Sheets/Adafruit%20PDFs/1361_Web.pdf (accessed on 5 November 2025).
- Kirchhofer, S. Conception d’une prothèse bio-inspirée commandée par réseaux de neurones exploitant les signaux électromyographiques. Master’s Thesis, Université Clermont Auvergne, Clermont-Ferrand, France, 2021. (In French) [Google Scholar]
- Seo, N.J.; Armstrong, T.J. Investigation of Grip Force, Normal Force, Contact Area, Hand Size, and Handle Size for Cylindrical Handles. Hum. Factors 2008, 50, 734–744. [Google Scholar] [CrossRef] [Scilit] [PubMed]
- Faudot, J. Analyse biomécanique de la préhension manuelle: Application à l’évaluation de la prise d’objets cylindriques. Ph.D. Thesis, Université de Technologie de Belfort-Montbéliard, Belfort, France, 2021. Available online: https://theses.hal.science/tel-03687502 (accessed on 1 June 2026). (In French)
- Kitronik Ltd. Electro-Fashion Conductive Thread 250 m. Available online: https://kitronik.co.uk/products/2744-electro-fashion-conductive-thread-250m (accessed on 5 November 2025).
- Laaraibi, A.-R.A.; Jodin, G.; Hoareau, D.; Bideau, N.; Razan, F. Flexible Dynamic Pressure Sensor for Insole Based on Inverse Viscoelastic Model. IEEE Sens. J. 2023, 23, 7634–7643. [Google Scholar] [CrossRef] [Scilit]
- Liu, L.; Wang, H.-H.; Qiu, S.; Zhang, Y.-C.; Hao, Z.-D. Paddle Stroke Analysis for Kayakers Using Wearable Technologies. Sensors 2021, 21, 914. [Google Scholar] [CrossRef] [Scilit] [PubMed]
- Hokaria, K.; Kurihara, Y.; Katsuhira, J. Analysis of Finger Joint Angles and Contact Pressures during Cylindrical Gripping Tasks. Appl. Ergon. 2021, 94, 103404. [Google Scholar]
- Niu, L.; Kong, P.W.; Tay, C.S.; Lin, Y.; Wu, B.; Ding, Z.; Chan, C.C. Evaluating On-Water Kayak Paddling Performance Using Optical Fiber Technology. IEEE Sens. J. 2019, 19, 11918–11925. [Google Scholar] [CrossRef] [Scilit]

Disclaimer/Publisher’s Note: The statements, opinions and data contained in all publications are solely those of the individual author(s) and contributor(s) and not of MDPI and/or the editor(s). MDPI and/or the editor(s) disclaim responsibility for any injury to people or property resulting from any ideas, methods, instructions or products referred to in the content. |
© 2026 by the authors. Licensee MDPI, Basel, Switzerland. This article is an open access article distributed under the terms and conditions of the Creative Commons Attribution (CC BY) license.