


Abstract
Renewable-energy and transport infrastructure can fragment habitats and weaken ecological connectivity when siting is addressed only at the project-permitting stage. Using Western Macedonia, Greece, with detailed application in the Regional Unit of Florina, this study develops a screening-level decision-support framework that links biodiversity-relevant spatial evidence to strategic planning priorities. The framework combines exclusion and evaluation criteria derived from policy and the literature, elicitation from 17 regional experts, and PROMETHEE ranking of five strategic directions under four scenarios. GIS overlays relate existing and planned energy and transport infrastructure to Natura 2000 sites, wildlife refuges, roadless areas, pelican-use areas and terrestrial corridor proxies for large mammals. The perceived baseline assigned a normalized weight of 0.69 to energy and 0.01 to reversibility. The stakeholder-mean framework redistributed weight toward protected areas (0.21), reversibility (0.19), energy (0.18) and ecological corridors (0.16). The leading strategic direction changed from investment (+0.50) under the baseline to tourism (+0.43) under the stakeholder-mean scenario, while the between-direction spread narrowed from approximately 1.10 to 0.27 in the highest-score scenario. GIS screening identified persistent conflict areas in western Voras, pelican movement routes linking Prespa with other wetlands and the Kleidi terrestrial corridor. The mapped distances of 0.93, 1.81 and 2.00 km are stakeholder-derived scenario assumptions, not universal ecological thresholds or species-response distances. The framework is intended for early strategic screening and stakeholder deliberation, followed by species-specific surveys, cumulative-impact assessment and field validation.
1. Introduction
The rapid expansion of transport and energy infrastructure is a defining land-use pressure of the low-carbon transition. Roads, power lines, wind farms, photovoltaic parks and associated access networks can support decarbonization and regional development, but they also modify landscapes, increase human access to previously undisturbed areas and fragment habitats. These effects occur at a time when biodiversity loss is recognized as a systemic crisis that interacts with climate change rather than a secondary environmental concern [1,2]. Ecological connectivity has therefore become a central condition for biodiversity conservation, because species persistence depends not only on the size and quality of habitats but also on the ability of organisms and ecological processes to move between them [3,4,5,6]. Transportation ecology examines how infrastructure and traffic affect biodiversity and how these effects can be reduced. Primary effects include habitat loss, wildlife mortality, and barrier and edge effects. Together, they contribute to habitat fragmentation and cumulative impacts across landscapes and over time [6,7,8]. The precautionary principle and mitigation hierarchy should therefore guide planning, with priority given to avoiding irreversible impacts [8].
Renewable energy planning is particularly sensitive to this trade-off. Wind and solar energy are indispensable for climate mitigation, yet their siting can generate conflicts with biodiversity when installations and access roads are placed in protected areas, roadless landscapes, migration routes or key feeding and breeding habitats [9,10,11]. CBD COP 16 Decision 16/13 promotes biodiversity mainstreaming within and across sectors, including infrastructure and energy [12]. Decision 16/22 addresses the links between biodiversity loss and climate change [13]. Together, these decisions support considering biodiversity alongside climate objectives throughout infrastructure planning. Additionally, in the framework of the United Nations Decade of Sustainable Transport 2026–2035 [14], biodiversity is included in the main environmental objectives of its Implementation Plan [15]. In the European Union, the concepts of green infrastructure and Natura 2000 network coherence require the conservation of landscape elements that support migration, dispersal and genetic exchange [16,17]. The EU sustainable-investment framework [18] and the revised TEN-T guidelines, Regulation (EU) 2024/1679 [19], provide a complementary policy context for integrating environmental objectives into infrastructure investment. Investor attention to biodiversity is also receiving increasing research attention [20]. However, project-level environmental permitting often treats each installation independently and therefore may miss cumulative impacts, especially where many small or medium-sized projects are dispersed across the same mountain or wetland-connected landscape. The European Environment Agency (EEA) reported on European landscape fragmentation in 2011 [21]. Its 2021 assessment mapped five fragmentation classes using 2018 data and a 1 km2 grid [22].
Embedding biodiversity and natural capital in infrastructure and energy investment can connect robust scientific evidence to spatial planning and help address governance gaps in biodiversity mainstreaming [23,24]. Relevant resources include data on energy projects [25], roadless areas and terrestrial or avian ecological corridors [26,27,28,29,30], strategic environmental assessment for energy production [31], renewable-energy and transport decision support [32,33,34], ecosystem services and ecological networks [35,36,37], integrated ecological-connectivity and climate-risk mapping [38] and guidance for identifying and engaging stakeholders [8]. European experience illustrates both implementation progress and practical constraints. Defragmentation programs in the Netherlands, France and Germany have introduced wildlife passages across existing infrastructure [6]. Retrofitting large underpasses can be technically demanding and costly, while fencing without suitable crossings can increase barrier effects [6]. These experiences support early coordination between transport planners and conservation authorities, followed by site-specific design and monitoring.
Multi-criteria decision analysis (MCDA) provides a transparent way to structure such problems, because it allows policy, environmental, social and economic criteria to be weighted and compared explicitly [39,40,41]. When combined with Geographic Information Systems (GIS), MCDA can also translate qualitative policy choices into spatially explicit scenarios [42]. The PROMETHEE family of outranking methods is widely used because it allows the comparison of alternatives under multiple weighted criteria and can communicate preference flows in an accessible manner for decision-makers and stakeholders [43,44]. For infrastructure planning, MCDA becomes more policy-relevant when it also incorporates cumulative impacts, reversibility and the four sustainability dimensions of society, environment, economy and long-term recoverability [45].
Western Macedonia combines a rapid energy transition with high-value mountain, lake, forest, agricultural and cultural landscapes and therefore provides an appropriate case study for this planning problem [46,47,48,49]. Detailed geographical, ecological and infrastructure information is provided in Section 2.1. Although ecological connectivity is increasingly recognized in nature conservation planning, relatively few studies integrate transportation infrastructure, renewable energy development, stakeholder preferences, and spatial decision analysis within a unified framework for strategic infrastructure planning. This study addresses this gap, a topic of particular importance in Greece, where renewable energy infrastructure may also be developed within Natura 2000 network sites subject to environmental assessment. Specifically, the paper synthesizes exclusion and evaluation criteria for energy and transport infrastructure siting. It applies a stakeholder-informed PROMETHEE analysis to alternative strategic directions and develops four GIS-based planning scenarios that evaluate renewable energy development in relation to ecological connectivity in the Florina pilot area. Rather than proposing a final siting plan or a species-response model, the study presents a replicable, screening-level decision-support framework that makes trade-offs between biodiversity conservation and infrastructure development explicit before irreversible land-use decisions are taken.
2. Materials and Methods
2.1. Study Area
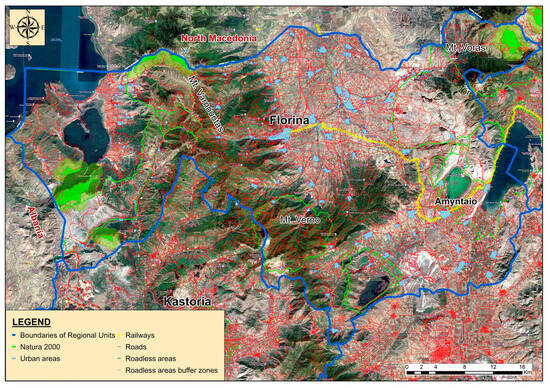
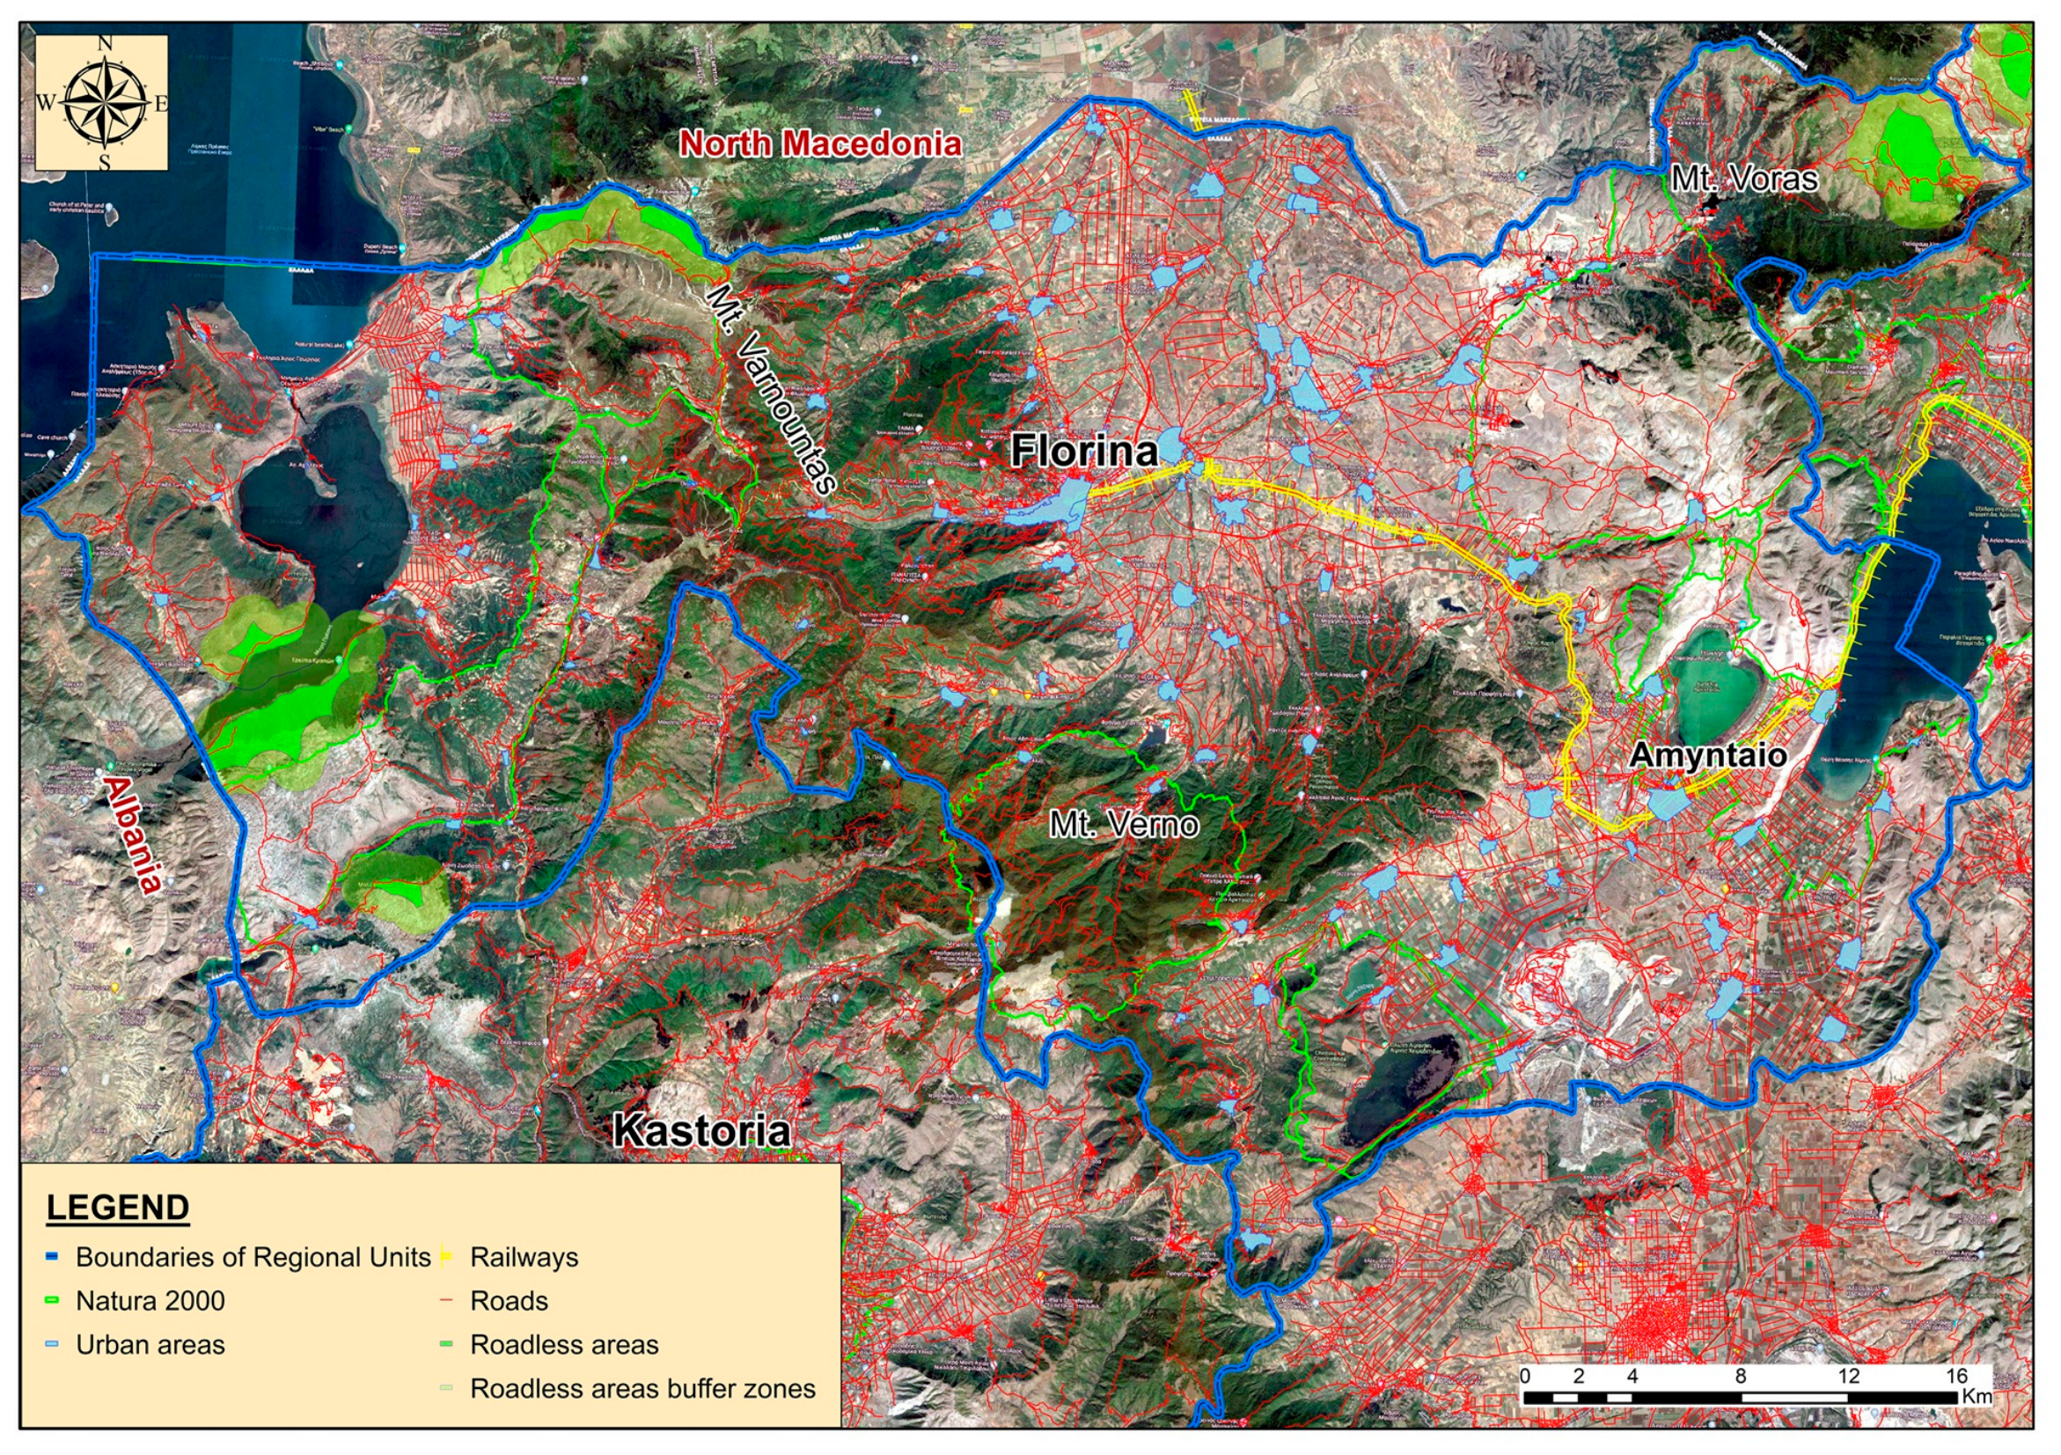
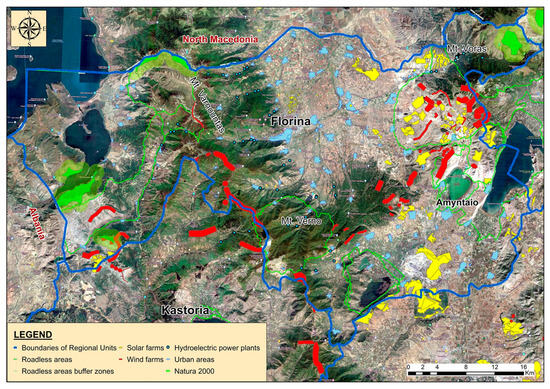
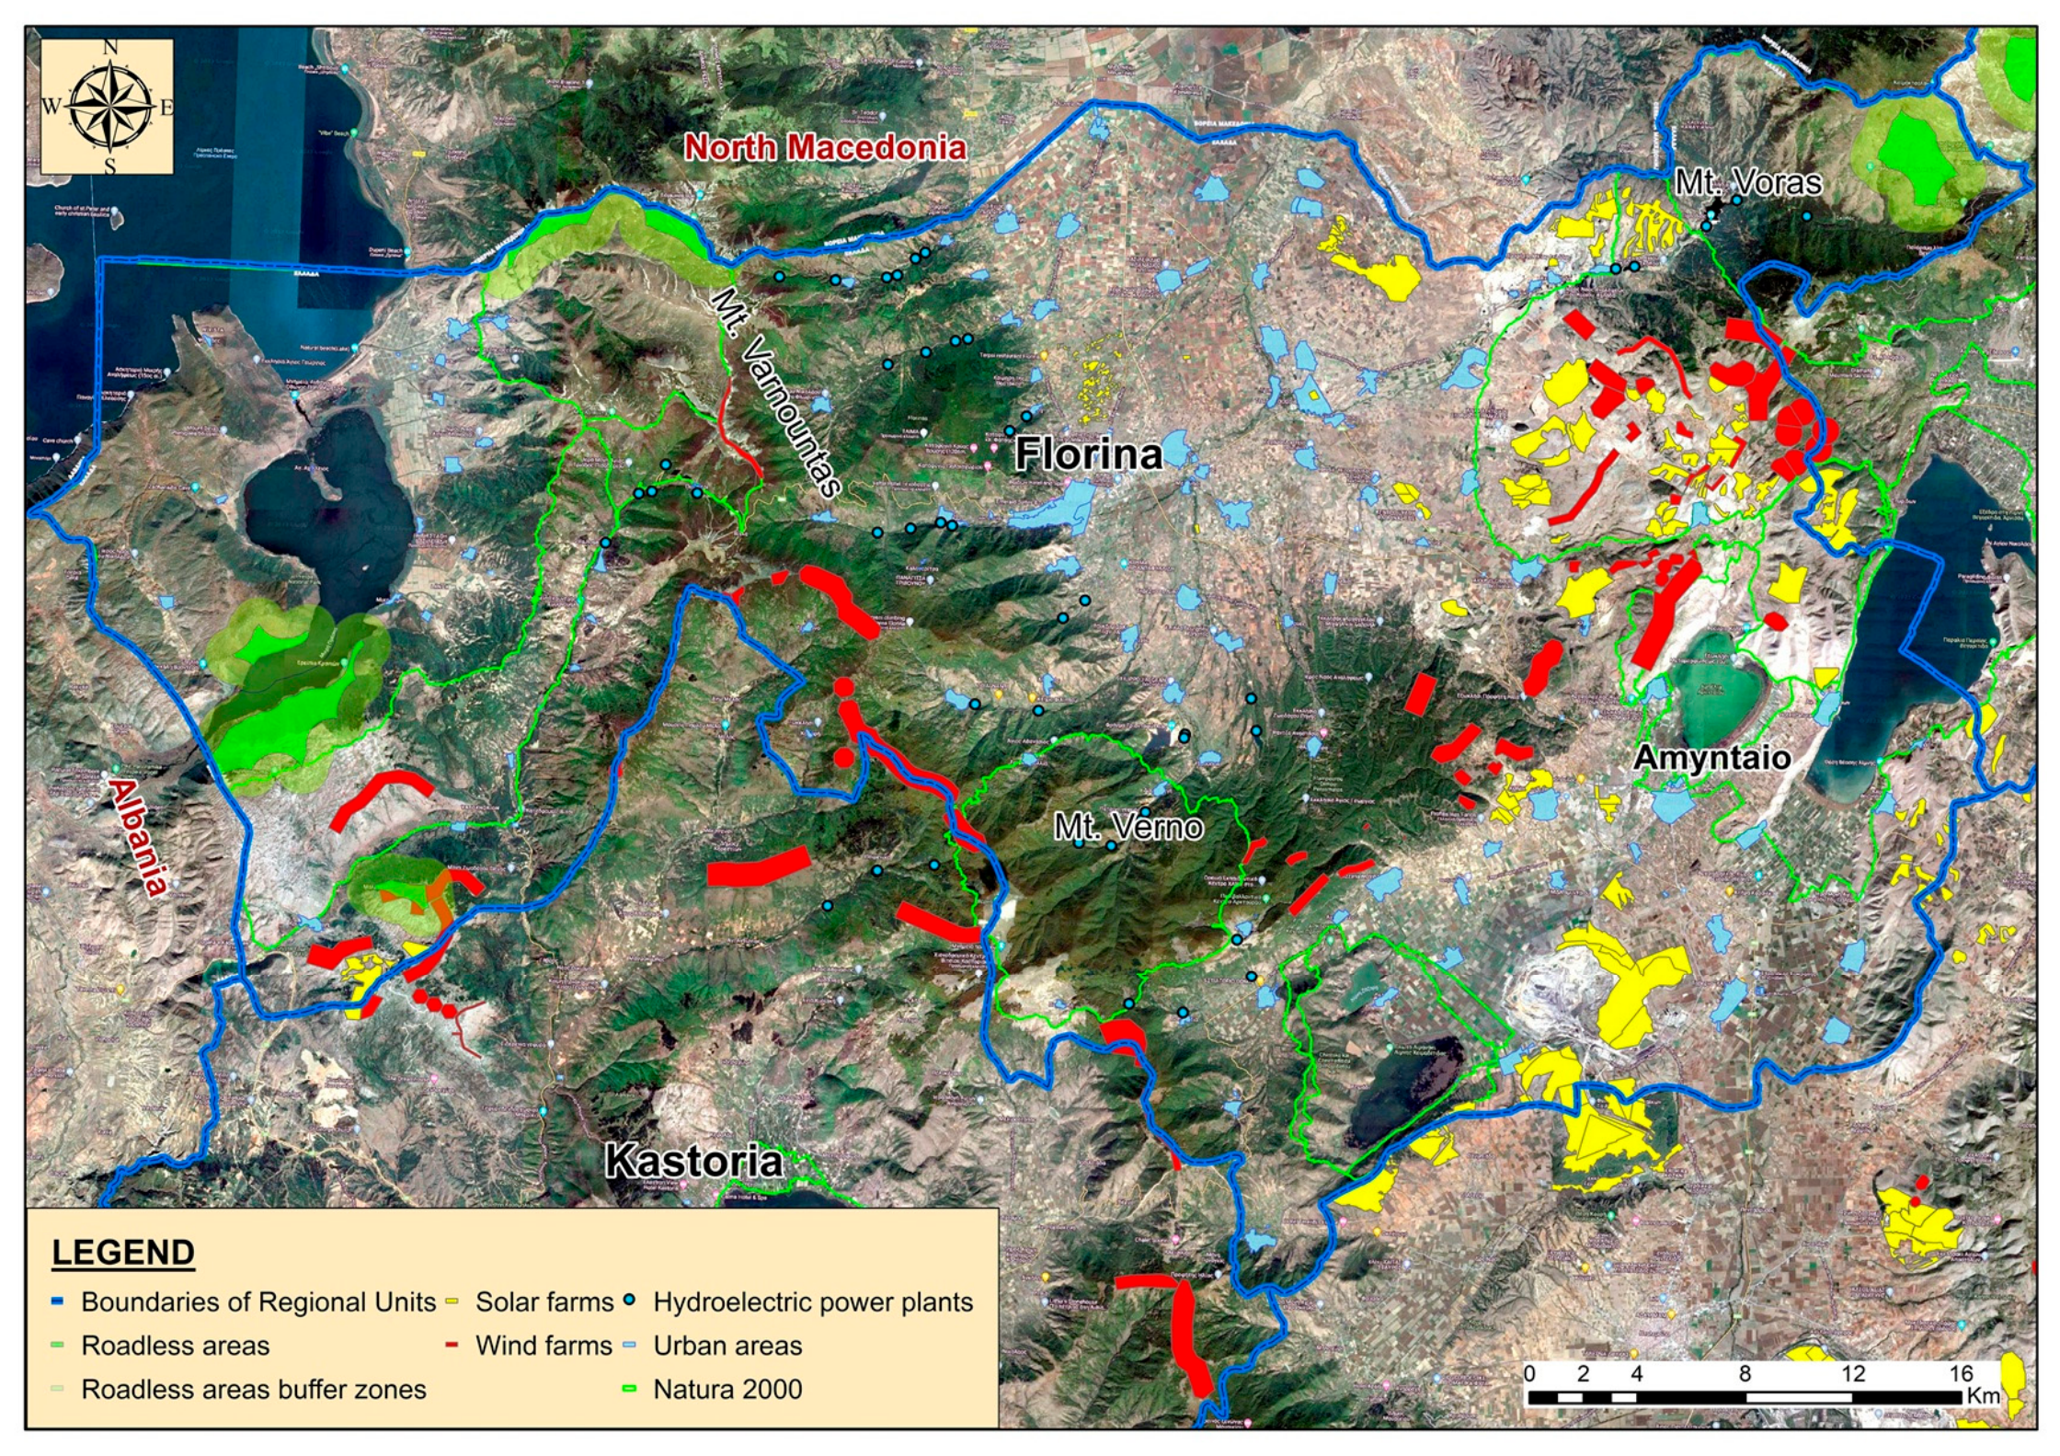
The case study focuses on Western Macedonia, Greece, with detailed scenario mapping in the Regional Unit of Florina. Historically central to electricity production in Greece, the region is undergoing rapid energy transition while retaining high-value mountain, lake, forest, agricultural and cultural landscapes [46,47]. Florina includes the Prespa National Park and transboundary Prespa ecosystem, as well as the Varnountas, Vernon/Vitsi and Voras massifs. Its landscapes support ecosystem services, tourism and primary production [46,48,49]. Natura 2000 sites, wildlife refuges, roadless areas, pelican movement routes, terrestrial corridor proxies for large mammals, roads, railways, wind farms, photovoltaic stations and small hydropower facilities overlap within the pilot area. The spatial processing and map development build on the underlying thesis [50]. These biodiversity layers, as seen in Figure 1 and Figure 2, represent planning-relevant proxies for potential connectivity and conflict. They are not measurements of population size, species mortality, habitat quality or functional connectivity and do not replace field surveys or species-specific movement modeling.
Figure 1.
Study area and existing transport in the Regional Unit of Florina. The map shows road and railway networks, and relevant polygons used as spatial context for the analysis. Source: adapted from the thesis mapping [50] using Geofabrik/OpenStreetMap geospatial data.
Figure 2.
Study area and existing renewable-energy infrastructure in the Regional Unit of Florina. The map shows wind farms, photovoltaic stations, hydropower facilities and relevant polygons used as spatial context for the analysis. Source: adapted from the thesis mapping [50] using RAE/RAAEY geospatial data [25].
2.2. Overall Analytical Design
The analysis was implemented in three linked stages. First, the literature and policy review identified infrastructure-planning criteria relevant to biodiversity, ecological connectivity, ecosystem services, landscape, social impacts and energy requirements. The review included MCDA applications for transport and energy planning, ecosystem-service-based decision support and guidance on ecological corridors and protected-area coherence [6,7,51]. Second, the criteria were organized into a two-level framework: exclusion criteria, which identify areas where infrastructure should be avoided or strongly restricted, and evaluation criteria, which allow alternative locations or strategic directions to be compared. Table 1 further distinguishes primarily spatial criteria from those requiring technical or procedural assessment. Some criteria can use both types of evidence. This grouping does not imply that wind resources, grid access or environmental impacts are inherently non-spatial. Third, the framework was applied through PROMETHEE and GIS scenario development. PROMETHEE was used to evaluate five strategic directions: priority to energy investment, priority to environment, priority to society, priority to tourism and an integrated policy direction. GIS was used to represent the spatial implications of the choices, particularly the exclusion of renewable energy installations from key protected areas and corridor zones.
Table 1.
Analytical stages and main information sources used in the decision-support framework.
The analytical workflow was implemented sequentially. The literature, policy documents and spatial datasets were first used to define the exclusion and evaluation criteria. Stakeholder elicitation then generated the criterion scores and weights used to construct four PROMETHEE scenarios. PROMETHEE compared five strategic directions, while GIS translated the spatially applicable scenario assumptions into mapped offsets and conflict areas. The GIS component therefore visualizes PROMETHEE-informed planning assumptions. It does not constitute an automated habitat-suitability or species-response model.
The multi-criteria analysis used Visual PROMETHEE Academic Edition, version 1.9, for Microsoft Windows [52]. PROMETHEE II net flows were used to rank five strategic directions under four scenarios. All six criteria were maximized using the usual (Type I) preference function, as shown in the original software tables [50]. For a criterion difference d, preference is 1 when d > 0 and 0 otherwise. No indifference (q), preference (p) or Gaussian (s) thresholds were used. Positive and negative flows summarize pairwise preferences over the other four alternatives, and net flow is their difference. Spatial processing and map production used ArcGIS Desktop 10.8.1 (Esri, Redlands, CA, USA), documented in the thesis [50], with the GGRS87/Greek Grid coordinate reference system (EPSG:2100). The GIS operations comprised clipping layers to the Florina study area, generating scenario offsets, overlaying infrastructure with protected areas and corridor proposals, and identifying spatial conflicts.
2.3. Criteria Framework
Table 2 distinguishes two decision roles. Exclusion or feasibility criteria identify constraints that must be satisfied before a location can be considered. A favorable score on another criterion cannot compensate for failure to satisfy an applicable constraint. Evaluation criteria compare eligible locations or strategic options using graded performance. The same feature may enter both stages: an adopted avoidance rule may concern a protected area, while distance from it can distinguish otherwise eligible alternatives. The table proposes a planning framework. It does not assert a universal legal prohibition across every listed land category. Binding restrictions and any additional precautionary avoidance rules must be specified for the application. The present PROMETHEE analysis compares five strategic directions using the six criteria in Section 2.4. It does not implement every item in Table 2 as a separate model variable.
Table 2.
Proposed criteria for decision-making in the planning of energy and transport infrastructure in Western Macedonia. Exclusion applies only where an explicit restriction or feasibility condition is defined. Monitoring and employment considerations are evaluated comparatively. Mandatory safety requirements remain feasibility conditions. Spatial and technical evidence may be combined.
2.4. Stakeholder Engagement and PROMETHEE Setup
Seventeen stakeholders with direct professional knowledge of Florina contributed to the assessment. Participants represented regional and municipal authorities, technical services, environmental management bodies, independent environmental professionals, non-governmental organizations and universities. Participants were recruited through purposive expert sampling and direct invitation by the research team. Selection was based on professional experience, knowledge of the Florina region and involvement in infrastructure planning, environmental management, biodiversity conservation, regional development or related research. The sample was designed to cover the principal regional functions involved in infrastructure planning rather than to estimate population-level preferences and may therefore underrepresent stakeholder groups that were not separately sampled. Local residents were not treated as a distinct stakeholder group. Future applications should include host-community residents and livelihood groups as a separately sampled and reported stratum.
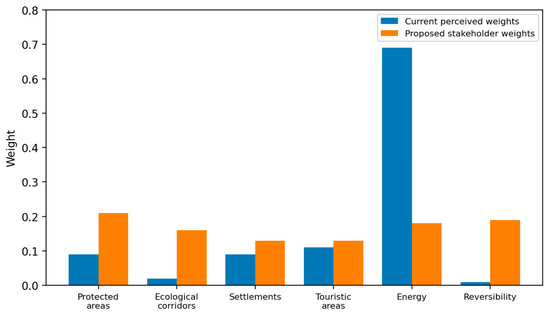
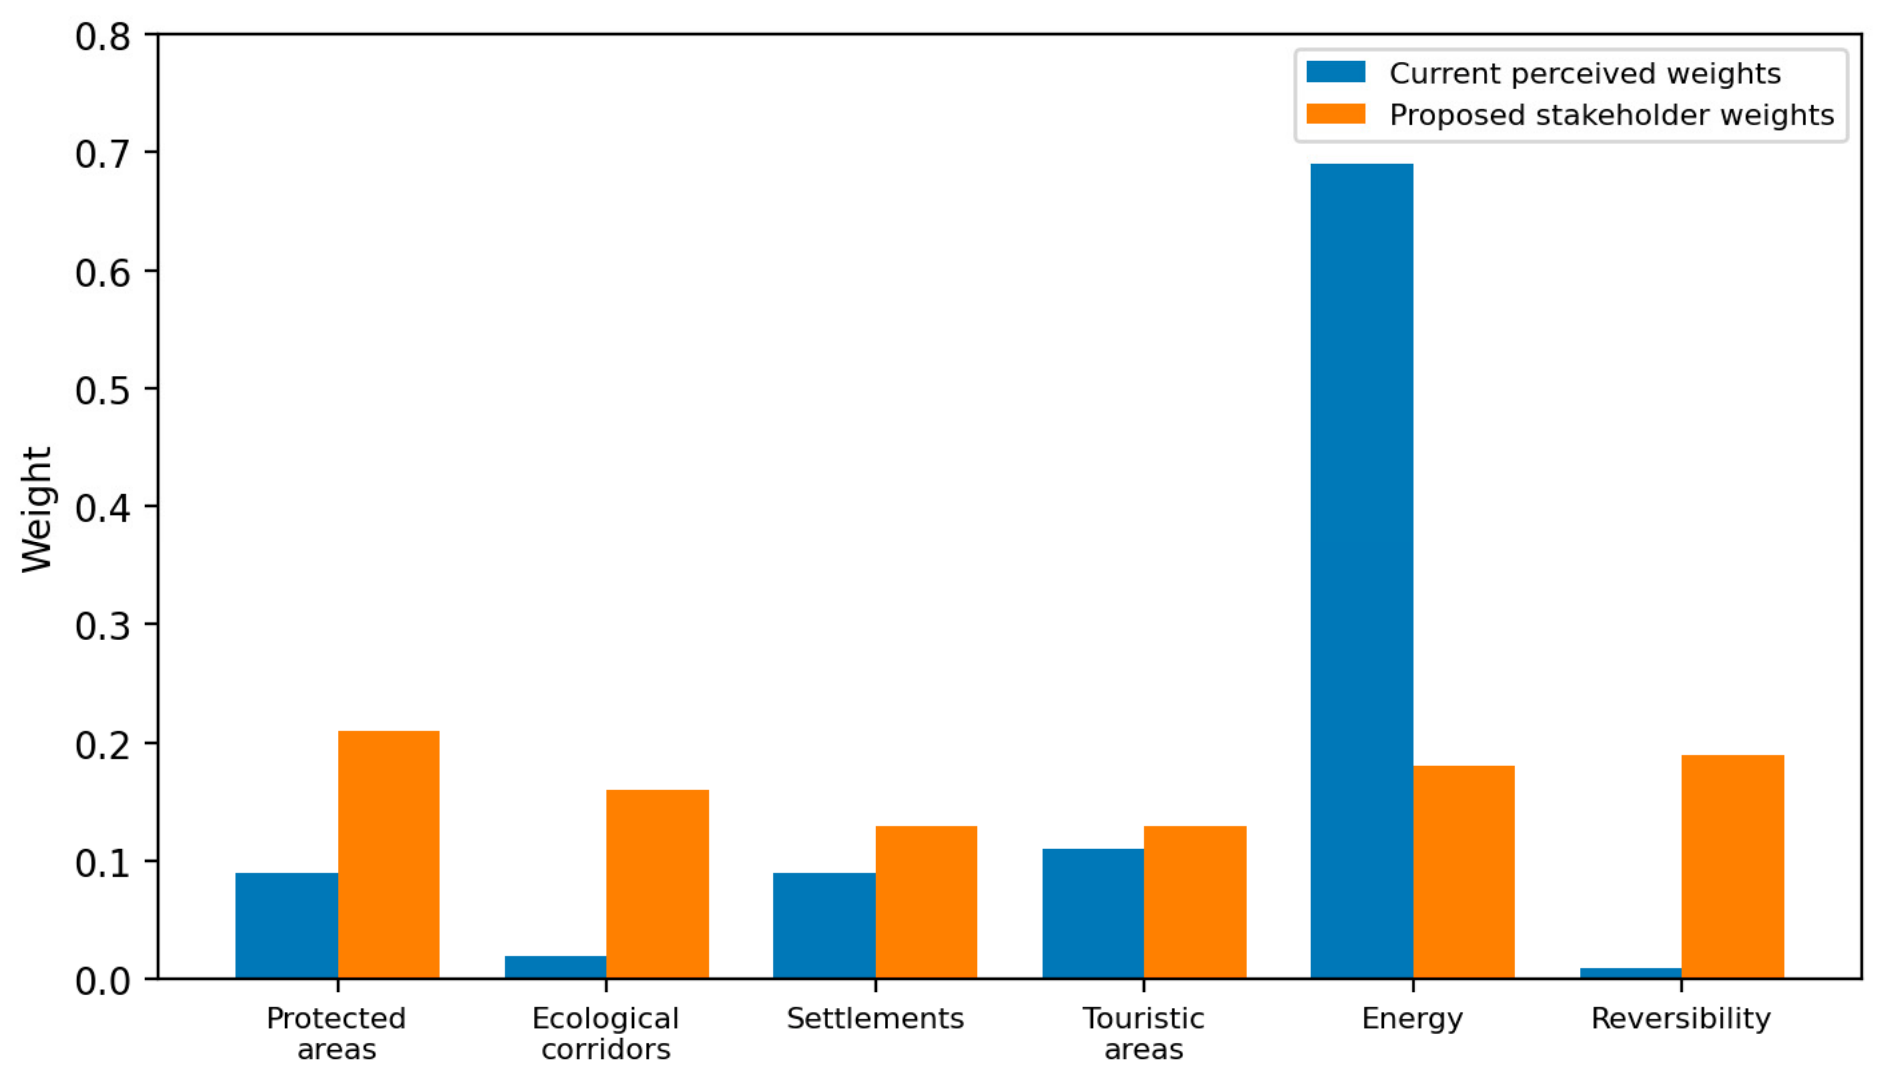
The PROMETHEE model used six criteria, as seen in Table 3: protected areas, ecological corridors, settlements, tourism areas, energy and reversibility. The questionnaire elicited criterion importance separately from alternative-performance ratings [50]. Each participant assigned two sets of non-negative importance weights, one for perceived current practice and one for proposed practice. Each weight ranged from 0 to 1, and the six weights in each set were required to sum to 1. For each set, the final weight was the arithmetic mean of the 17 participant weights, normalized across the six criteria: w_j = mean_i(u_ij)/sum_k mean_i(u_ik). Each participant contributed equally. Because the individual weight vectors sum to 1, their unrounded mean also sums to 1. The weights were not obtained by converting the signed performance scores. No indifference or preference thresholds were applied before aggregation.
Table 3.
Mean criterion-importance weights elicited separately for perceived current practice (Scenario 1) and stakeholder-proposed practice (Scenario 2). Both columns aggregate the 17 participants’ direct importance allocations on a scale from 0 to 1. These are not transformations of the −2 to +2 alternative-performance ratings. The columns describe perceived and preferred priorities, respectively, rather than expenditure shares or measured ecological performance. Each unrounded column sums to 1. The displayed baseline total of 1.01 reflects rounding.
Participants also rated each of the five strategic directions against each criterion on a bounded scale from −2 to +2, allowing intermediate values. Negative values indicated lower consideration or greater acceptance of development inside or near sensitive areas, while positive values indicated stronger consideration or spatial separation. Energy and reversibility used the same numerical scale to express their consideration, rather than physical distance. Scenario 1 used the mean perceived-current weights and ratings. Scenario 2 used the mean proposed weights and ratings. Scenarios 3 and 4 retained the proposed mean weights and replaced each alternative-criterion rating with the mean of its three lowest or three highest proposed ratings, respectively [50]. Preference functions were applied only during the subsequent pairwise comparison of alternatives.
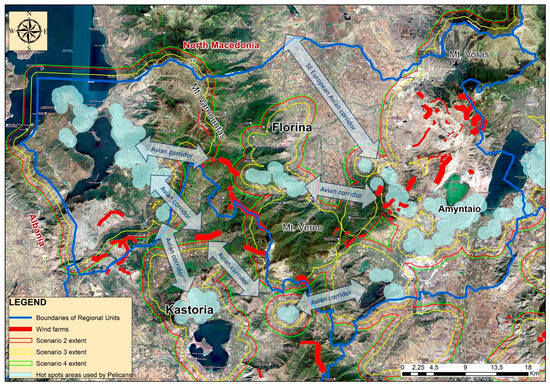
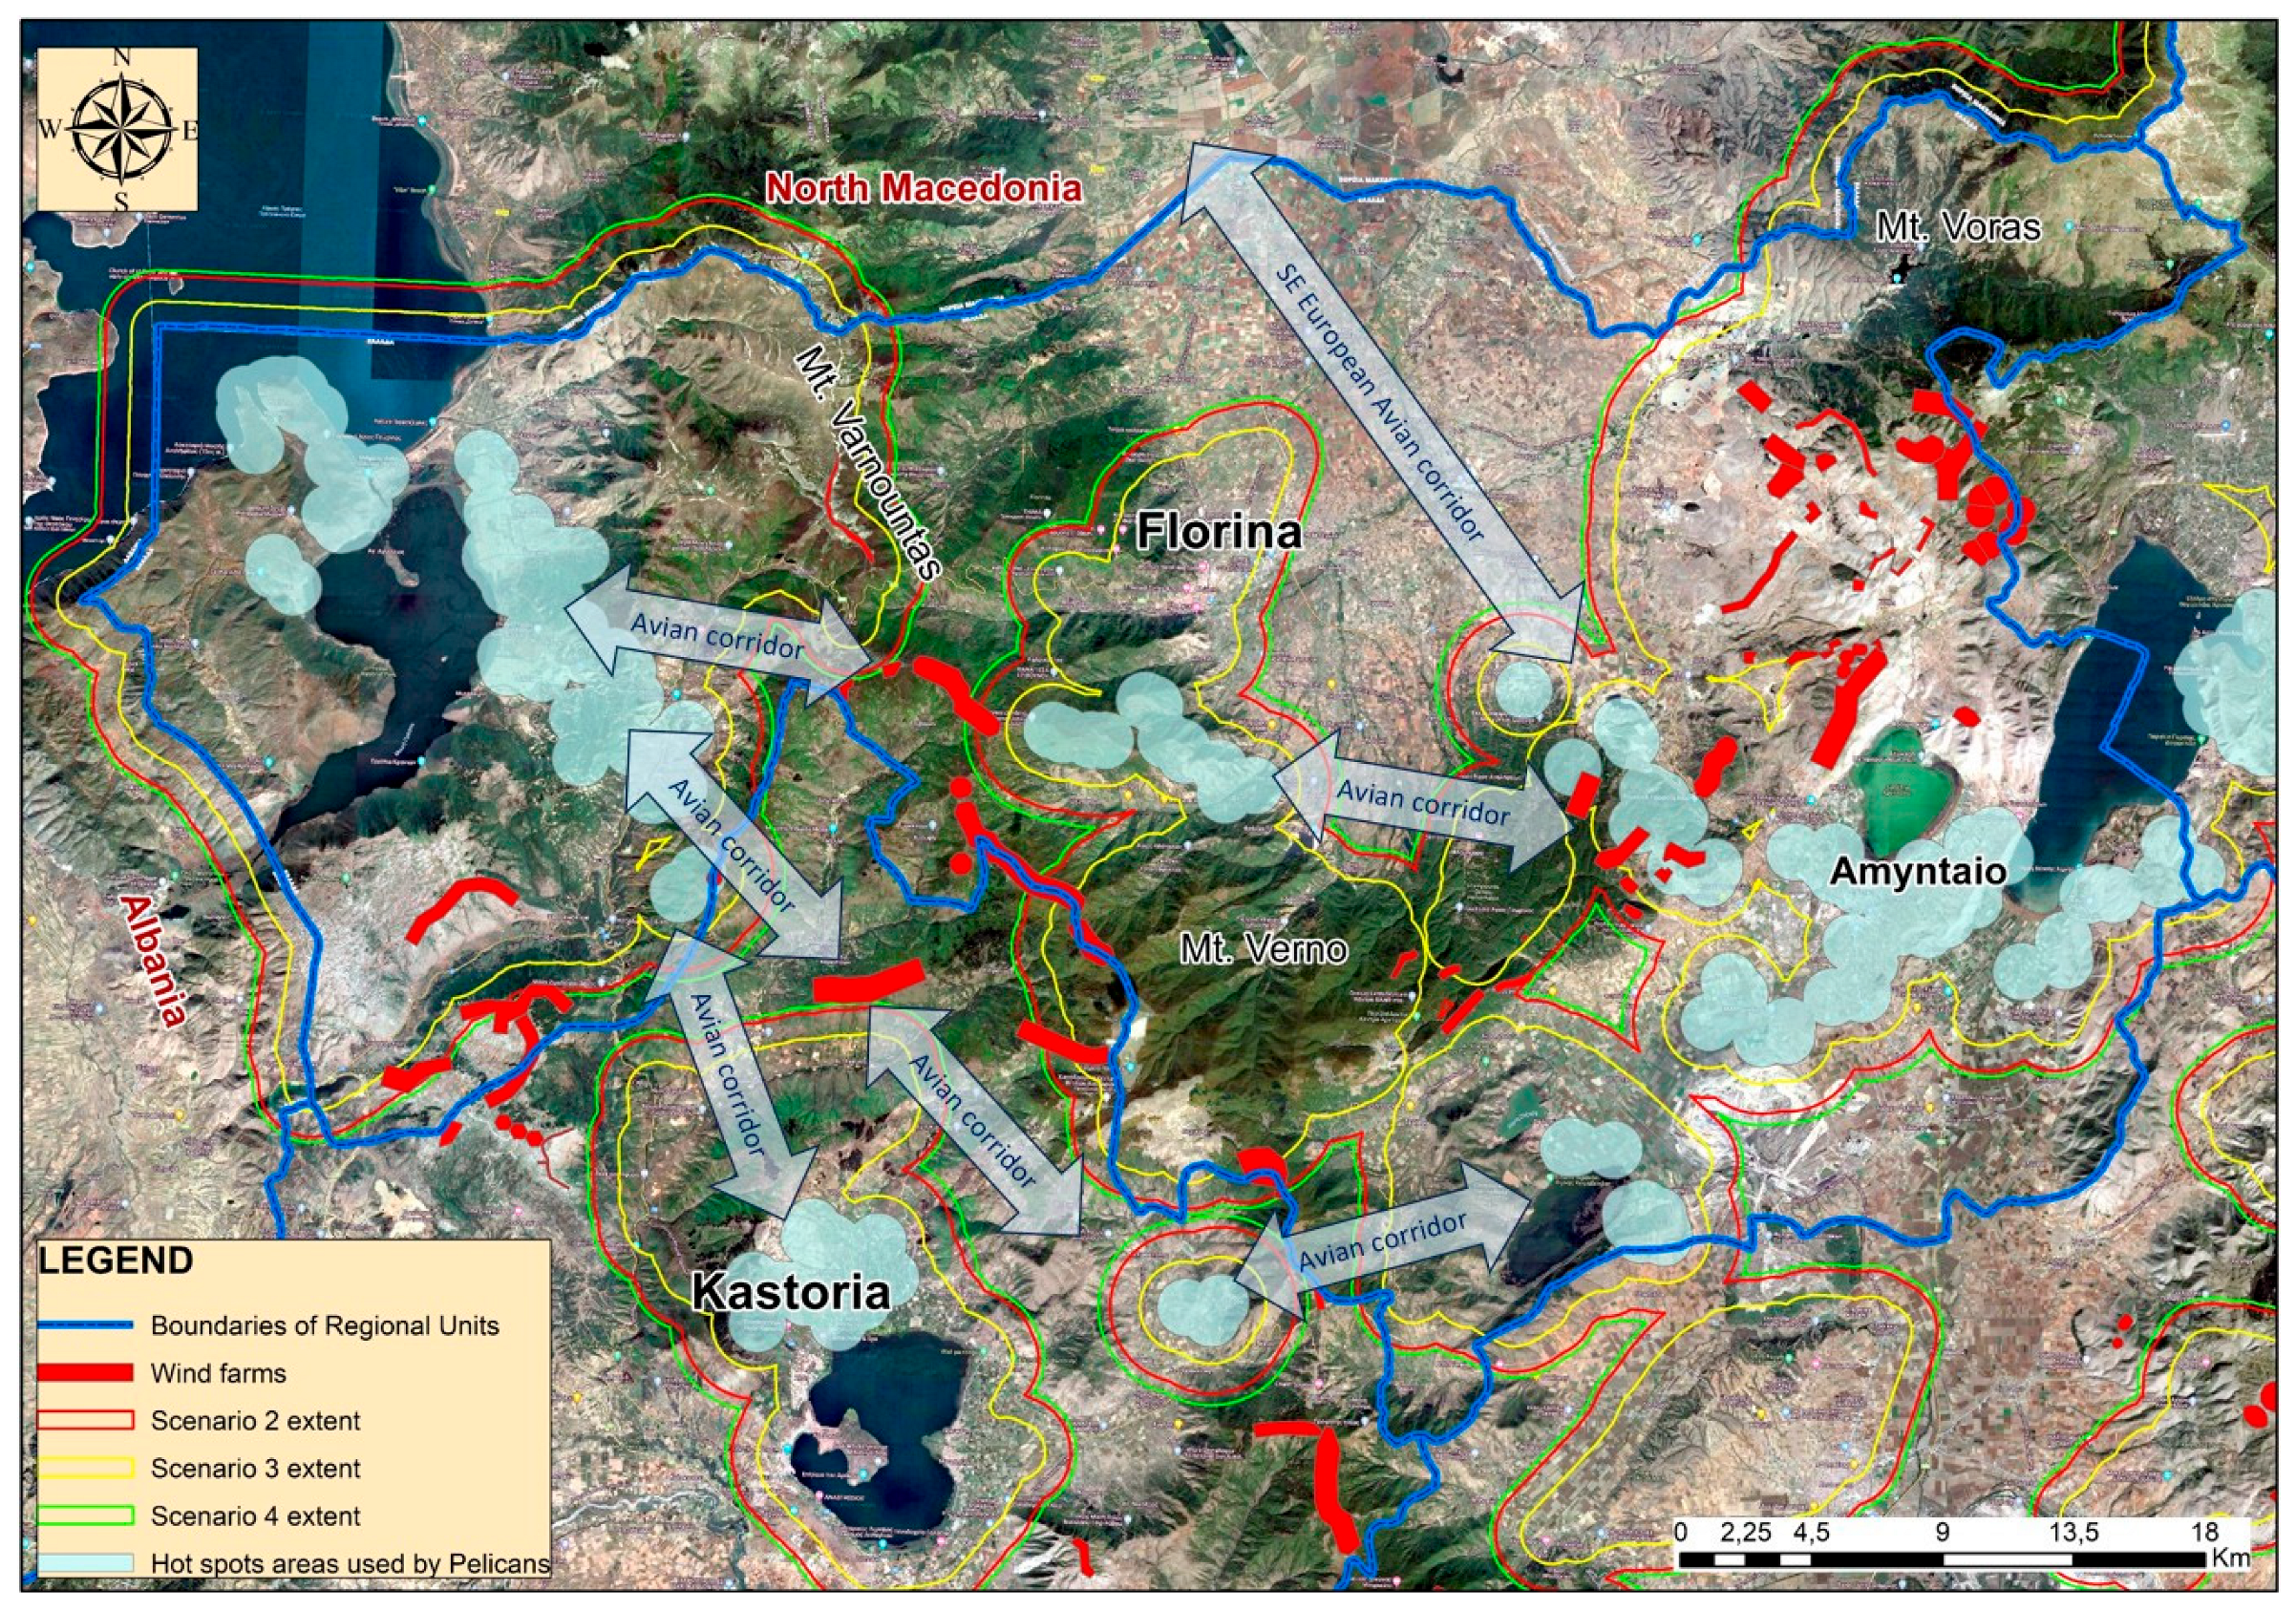
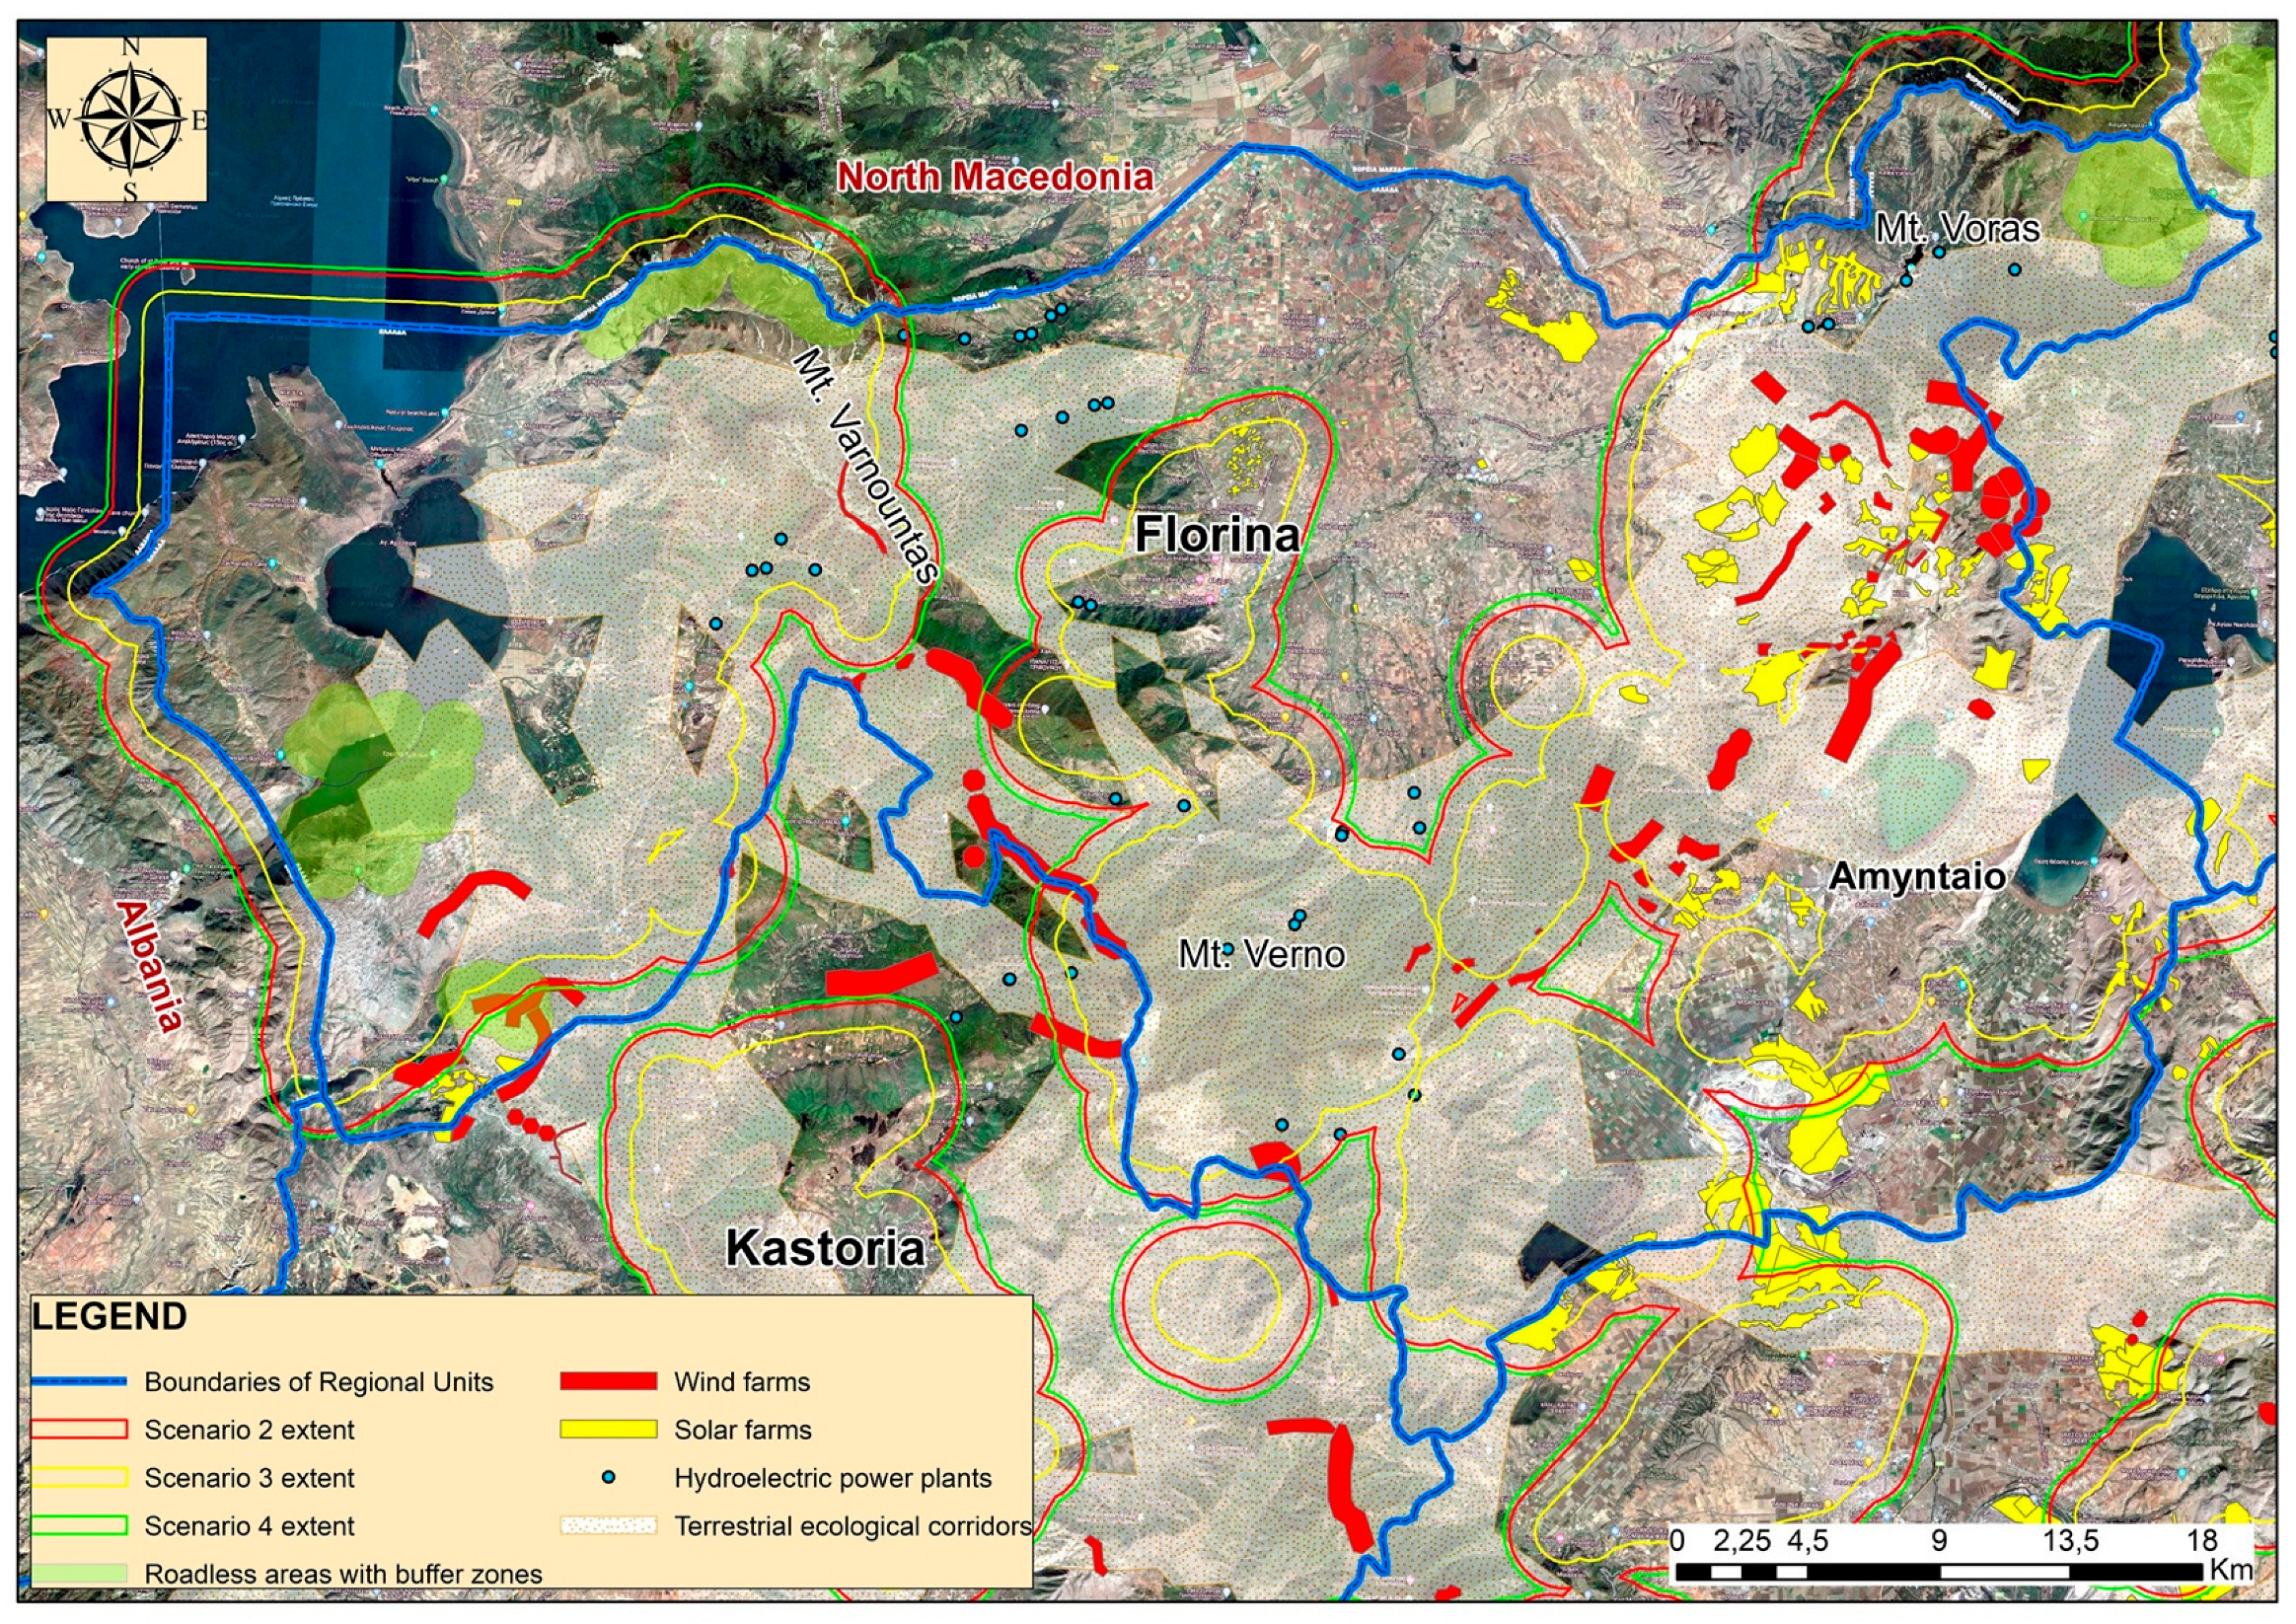
For the GIS illustration, the selected planning offsets correspond to the Protected Areas rating of the integrated Policy direction in the proposed, minimum and maximum scenario tables: 1.81 km for Scenario 2, 0.93 km for Scenario 3 and 2.00 km for Scenario 4. One rating unit corresponds to one kilometer on this planning scale. All three mapped offsets are positive and extend outward from the reference Natura 2000 and wildlife-refuge boundaries. The red, yellow and green outlines in Figure 3 and Figure 4 therefore represent the mean, lower-score and higher-score scenarios, respectively. These values express stakeholder-derived planning assumptions, not legally defined setbacks, ecological thresholds or species-response distances. The GIS illustration uses selected spatial assumptions from the decision framework. It is not a spatial conversion of the dimensionless PROMETHEE net flows.
Figure 3.
Comparison of normalized criterion weights for perceived current priorities (Scenario 1) and stakeholder-proposed priorities (Scenario 2). The baseline is dominated by the energy criterion, whereas the proposed framework distributes weight across protected areas, ecological corridors, energy needs and reversibility.
2.5. GIS Scenario Mapping
GIS mapping used a source-based habitat-network screening approach. Source layers comprised Natura 2000 boundaries from the Ministry of Environment and Energy, wildlife refuges from geodata.gov.gr, the Roadless Map of Greece Version 2 [27], renewable-energy projects [25], roads and administrative boundaries, and terrestrial and avian corridor proposals supplied by the team of Giannakis et al. (2023) [53]. The source is Study 3, Preparation of Special Environmental Studies and Management Plans for Natura 2000 Sites in parts of Western and Central Macedonia, prepared by PLAS S.A. and YETOS S.A. for the Ministry of Environment and Energy. The thesis identifies the supplied material as a draft under preparation for publication in 2023 [50]. This is the status and temporal reference of the material used. It is not a claim about the current legal status of those areas.
The source-study terrestrial proposals considered the distribution of Natura 2000 sites and critical habitat areas for large mammals. The avian proposals incorporated pelican-use concentrations and flight information from the Society for the Protection of Prespa, with the 2021 report by Alexandrou et al. providing the documented movement context [28,50]. In this study, the supplied corridor proposals were assembled with the protected-area, roadless-area and infrastructure layers, clipped to the pilot area, and examined through the three outward planning offsets described in Section 2.4. Their overlap with roads, renewable-energy installations and proposed development identified candidate conflict localities, including the Kleidi connection between Vernon/Vitsi and Voras. The derived outcome is the scenario-specific connectivity-conflict map and identification of areas requiring assessment. The underlying corridor proposals remain source evidence.
No resistance surface, least-cost optimization, circuit-theory calculation or statistical movement model was fitted in this study. The mapped corridors are therefore habitat-network planning proxies, not estimates of movement probability or independently validated functional connectivity. Source-document dates do not imply a common observation year across layers. The 2023 corridor proposals were not independently field-validated here, and no uniform positional accuracy or observation period is available for them. Table 4 separates source layers from the derived map product. These limits require current species evidence and cumulative-impact assessment before site-specific decisions.
Table 4.
Provenance, analytical roles and uncertainties of the spatial source layers and the derived mapping product. Corridor proposals supplied from the 2023 source study are distinguished from the connectivity-conflict maps produced by this study.
3. Results
3.1. Stakeholder Weighting Reveals a Shift from Energy Dominance to Balanced Sustainability
The stakeholder assessment revealed a strong divergence between the perceived current planning logic and the proposed decision-support logic. In the perceived baseline, energy was assigned a weight of 0.69, while ecological corridors and reversibility received weights of only 0.02 and 0.01, respectively. In the proposed framework, the highest weights were assigned to protected areas (0.21), reversibility (0.19), energy (0.18) and ecological corridors (0.16). This result indicates that stakeholders did not reject energy development but proposed that it should be evaluated alongside ecological connectivity and long-term recoverability.
The inclusion of reversibility was a particularly important outcome. Stakeholders treated reversibility not as a secondary mitigation issue, but as a core sustainability dimension. In practical terms, this means that if impacts are not reversible, the appropriate decision should move towards avoidance rather than compensation. This is especially relevant for new roads in natural areas, because access roads for wind farms can fragment habitats and facilitate further land-use change even when the energy installation itself occupies a limited footprint.
3.2. PROMETHEE Scenario Rankings
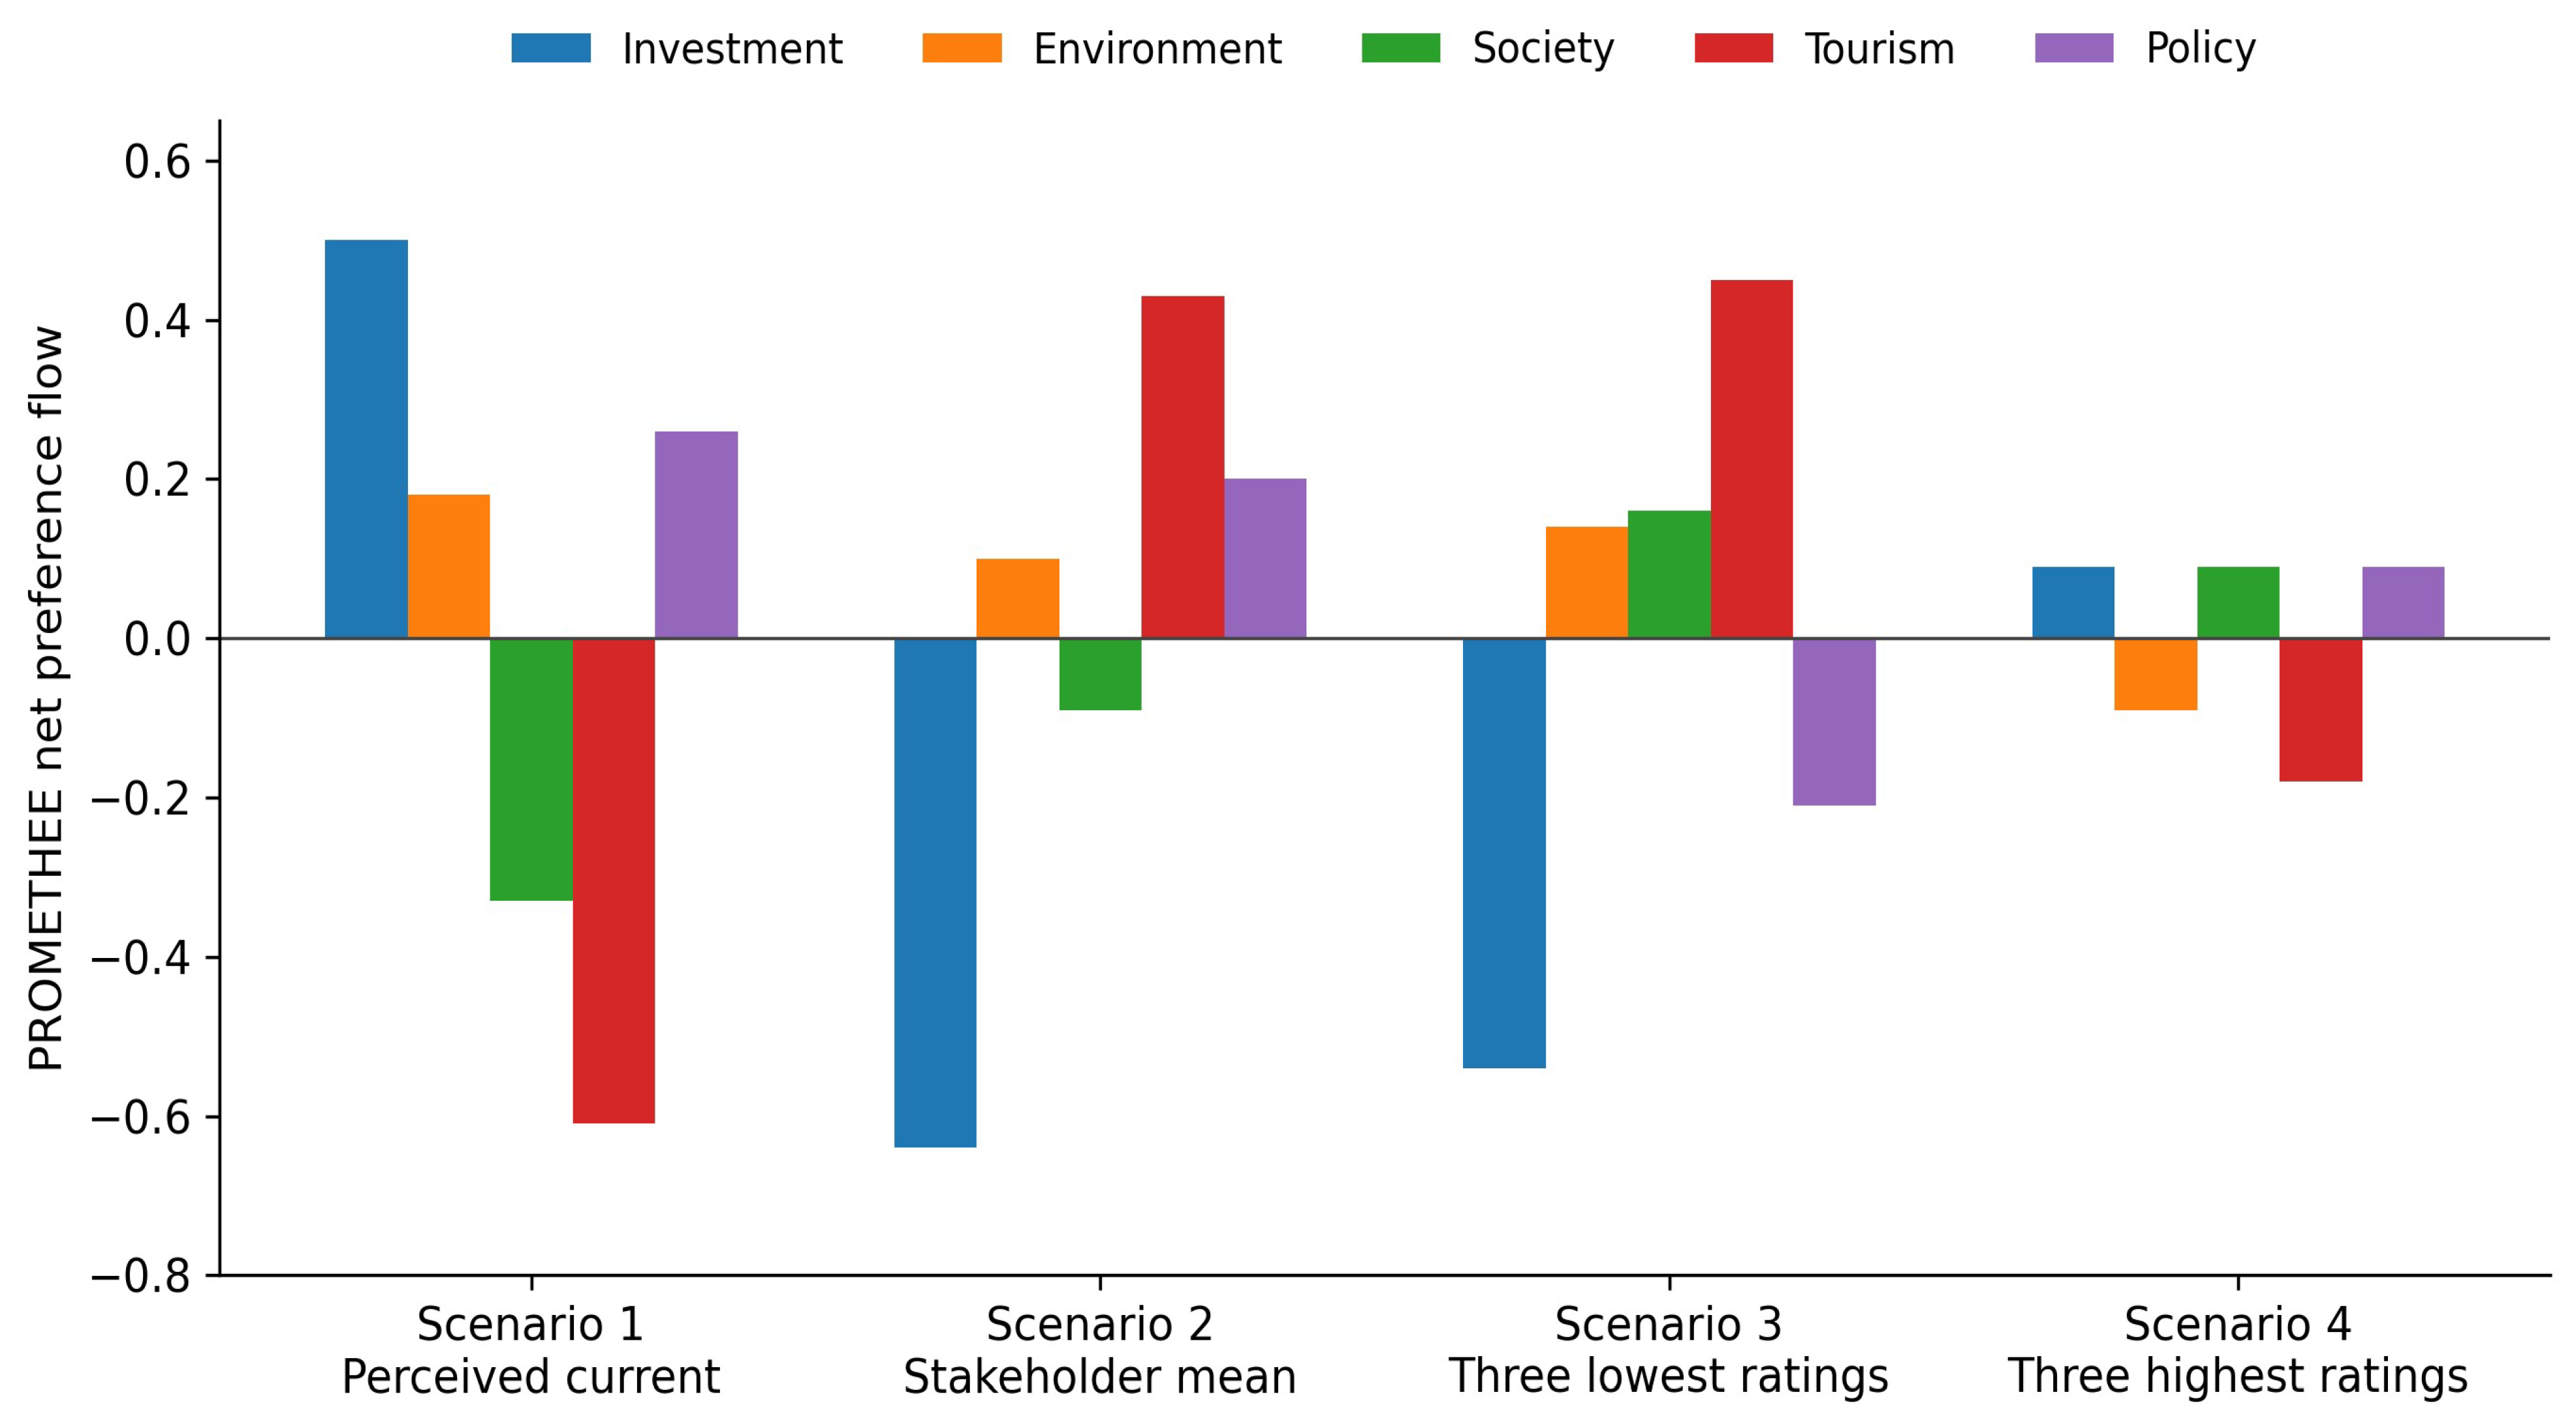
Figure 4 compares the relative ranking of the same five strategic directions under four sets of inputs. Net preference flow is the positive flow minus the negative flow: higher values indicate a more preferred direction within that scenario and are presented in Table 5. The values are dimensionless preference measures, not ecological benefits or probabilities. Differences between scenarios show how the model responds to alternative stakeholder assumptions. They do not represent measured changes over time.
Table 5.
PROMETHEE net preference flows for the four scenarios and five strategic directions. Flows are displayed to two decimal places. The spread row retains the approximate scenario summaries reported in the original analysis.
Scenario 1 ranked energy investment highest (+0.50), followed by policy (+0.26) and environment (+0.18), while society and tourism had negative preference flows. This pattern is consistent with a development logic in which energy infrastructure is prioritized and social, landscape and tourism criteria receive less weight.
Scenario 2, based on the mean stakeholder proposal, changed the ranking structure: tourism (+0.43), policy (+0.20) and environment (+0.10) ranked above society (−0.09) and investment (−0.64). Scenario 3, representing the lower-bound stakeholder values, retained tourism as the highest-ranked direction (+0.45), followed by society (+0.16) and environment (+0.14). Scenario 4, representing the highest stakeholder values, compressed the range between directions to 0.27 units. This indicates weaker differentiation among the five directions under those inputs. It does not demonstrate stakeholder consensus, ecological improvement or an optimal infrastructure layout.
Figure 4.
PROMETHEE net preference flows for five strategic directions under Scenario 1 (perceived current practice), Scenario 2 (stakeholder mean), Scenario 3 (three lowest scores per criterion) and Scenario 4 (three highest scores per criterion). Higher flow means greater relative preference within a scenario. The main message is that the leading direction changes from investment in Scenario 1 to tourism in Scenarios 2 and 3, while Scenario 4 differentiates the directions less strongly. These are conditional rankings, not ecological performance scores or a time series.
3.3. GIS Scenarios and Main Conflict Zones
The GIS scenario maps are presented in Figure 5 and Figure 6 and show that the Regional Unit of Florina is not a neutral space for energy siting. Many of the areas with high renewable-energy interest are also areas with protected-area functions, ecological corridors, high landscape value and tourism potential. Three conflict zones are particularly important.
Figure 5.
GIS screening of renewable-energy development in relation to avian corridor proposals and pelican-use areas. Red outlines denote Scenario 2 (stakeholder mean, 1.81 km outward planning offset). Yellow outlines denote Scenario 3 (three lowest ratings, 0.93 km outward offset). Green outlines denote Scenario 4 (three highest ratings, 2.00 km outward offset). These are planning assumptions, not ecological thresholds. Blue lines mark regional-unit boundaries. Solid red features denote wind farms. Corridor proposals were supplied from Study 3 [53], with pelican movement context from refs. [28,50].
Figure 6.
Derived terrestrial connectivity-conflict map showing the overlap of source-study corridor proposals, infrastructure and planning scenarios in the Florina pilot area. Red outlines denote Scenario 2 (stakeholder mean, 1.81 km outward planning offset). Yellow outlines denote Scenario 3 (three lowest ratings, 0.93 km outward offset). Green outlines denote Scenario 4 (three highest ratings, 2.00 km outward offset). These offsets are planning assumptions. Solid red and yellow features denote wind and solar farms, respectively. Blue lines mark regional-unit boundaries. The broad corridor proposals are screening proxies, not validated movement pathways [50,53].
First, the western Voras zone shows dense renewable-energy pressure, including wind farms and photovoltaic stations in or near a Natura 2000 context. The spatial concentration of installations and access roads raises a cumulative-impact concern because the integrity of a protected or semi-natural area can be reduced even when individual projects are assessed separately.
Second, the aerial corridors used by pelicans between Prespa and other Western and Central Macedonian wetlands intersect with areas of wind-energy interest. This creates a risk that project siting decisions may affect daily movements between breeding, feeding and resting areas. The aerial-corridor map uses stakeholder-derived planning offsets for initial screening. Species-specific movement data are needed to assess ecological effects and refine siting decisions.
Third, the terrestrial connectivity-conflict map derived from the supplied corridor proposals highlights the Kleidi pass and the connection between the Vernon/Vitsi and Voras massifs as a potential connection for large mammals. This preliminary spatial output identifies an area for investigation. It does not estimate movement probability or demonstrate functional connectivity. The area is already affected by major road and railway infrastructure, and further wind-related road development may reduce the function of wildlife refuges as corridor stepping stones. In such cases, the spatial role of wildlife refuges should be interpreted in relation to connectivity, not only as isolated protected polygons.
Qualitative comparison of the three stakeholder-derived scenario offsets shows that the same broad conflict localities remain visible in western Voras, along pelican movement routes, and at the Kleidi terrestrial corridor. The position and extent of the scenario boundary vary among scenarios. This recurrence identifies priorities for closer assessment within the three mapped scenarios. It does not demonstrate the robustness of exact boundaries or ecological outcomes. This comparison represents a scenario-envelope sensitivity check rather than a formal ecological sensitivity analysis. Alternative corridor definitions, updated infrastructure-permit data and field-validated movement layers were not available for systematic comparison.
4. Discussion
4.1. Stakeholder Weighting and Governance
The energy weight fell from 0.69 in the perceived baseline to 0.18 in the stakeholder-mean framework. Weights increased for protected areas (0.21), reversibility (0.19) and ecological corridors (0.16). This redistribution is the clearest result of the elicitation. It does not indicate opposition to renewable energy. Instead, it shows that the participating regional experts favored a less one-dimensional decision structure. Investment led the PROMETHEE ranking in Scenario 1, whereas tourism led in Scenarios 2 and 3. This change demonstrates how planning priorities can shift when ecological and social considerations are incorporated. This result must be interpreted within the sample design. The 17 participants contributed relevant regional expertise, but the non-probability sample is not representative of all residents or of regions with different institutional compositions. A private-sector-dominated panel could assign greater weight to investment and grid access, whereas a conservation-dominated panel could place more weight on protected areas and connectivity. Local residents are particularly important because they experience landscape, livelihood and access effects directly. Future applications should therefore include residents as a distinct stakeholder stratum rather than assuming that authorities or NGOs reproduce their preferences.
4.2. Comparison with Existing MCDA and GIS Research
The framework builds on established environmental MCDA practice [39,40] by combining an outranking method [43,44] with GIS-based screening [42] and an explicit distinction between exclusion and evaluation criteria. Compared with a conventional weighted-overlay analysis, PROMETHEE makes the ranking consequences of competing priorities visible, while GIS shows where those priorities intersect with biodiversity-relevant spatial evidence. The framework’s practical advantage is therefore traceability from stakeholder priorities to strategic rankings and then to spatial screening. Its limitation is that the outputs remain conditional on expert scores, PROMETHEE settings and the quality of the spatial layers. They do not represent an objective ecological optimum.
This planning logic is also consistent with research showing that progress toward development goals can displace land-use pressure toward ecologically sensitive terrain. Zhang et al. examined global changes in land use on steep slopes using high-resolution mapping and structural-equation analysis [54]. Although their study is not a PROMETHEE or infrastructure-siting application, it reinforces the need to introduce terrain and ecological constraints early and to monitor unintended spatial displacement. The present study contributes a regional stakeholder-weighted and corridor-oriented screening process, but does not provide the global causal analysis undertaken by Zhang et al.
International studies illustrate the additional analyses needed after this screening stage. In the western United States, Wu et al. coupled energy-system and land-use modeling to evaluate alternative siting protections [55]. Stronger protection of conservation areas reduced habitat conflicts with an approximately 3% increase in energy-system costs in their model. Florina addresses the same planning trade-off but does not optimize generation capacity or estimate system costs. In the Mysore Elephant Reserve, southwestern India, Vasudev et al. used a spatial absorbing Markov-chain model to combine movement and conflict mortality, and tested conflict predictions against independent reports [56]. This offers a more quantitative treatment of functional connectivity than the preliminary Florina proxy. Together, the studies support integrating conservation evidence into planning while showing why local movement data, economic constraints and validation are needed before transferring specific boundaries or numerical results.
4.3. Spatial Conflicts and Biodiversity Implications
The GIS analysis identifies three recurring conflict localities: the western Voras concentration of renewable-energy development, pelican movement routes between Prespa and other wetlands, and the Kleidi connection between the Vernon/Vitsi and Voras massifs. These locations connect the infrastructure inventory to biodiversity conservation more directly than protected-area overlap alone. The principal concern is cumulative. Wind farms, photovoltaic sites and their access roads can collectively modify habitat, movement and access conditions, even when each project is assessed independently [10,11,27,28,29,30,57,58].
The mapped corridors and protected-area boundaries are screening evidence rather than biological response models. They do not estimate collision mortality, population viability, landscape permeability or species-specific displacement. Decisions affecting these conflict localities should therefore be followed by current movement surveys, seasonal-use assessment, cumulative mortality and barrier analysis and comparison with lower-impact alternatives. This interpretation connects the spatial analysis to biodiversity conservation without treating stakeholder-derived distances as species requirements. The broad terrestrial proxy represents candidate connectivity space and does not make the entire mapped extent a no-development zone. Practical application should first establish binding constraints and any explicitly adopted precautionary exclusions, then investigate bottlenecks and movement routes within the wider candidate areas. Alternative infrastructure layouts can subsequently be compared using validated connectivity evidence, energy yield, access and grid requirements, and cumulative impacts. The present maps do not determine the land area that is definitively suitable or unsuitable for development.
4.4. Reversibility and Planning Recommendations
The distinction between exclusion and evaluation criteria prevents areas that should be avoided from being treated as freely negotiable, while retaining location optimization where development may be compatible. Reversibility is central because mitigation and compensation are not equivalent to avoidance when impacts are persistent. Roads in natural areas illustrate this issue: their effects extend beyond their physical footprint to barrier and edge effects, wildlife mortality, noise, light, increased access and subsequent development pressure [6]. Access roads may therefore be among the most consequential components of wind-energy development in roadless mountain landscapes.
Five actions follow from the results. First, aerial, terrestrial and aquatic corridors should be mapped and recognized as green infrastructure. Second, cumulative impacts should be assessed at the regional scale before individual projects are licensed. Third, screening should incorporate roadless and high-nature-value areas. Fourth, relevant stakeholders, including host communities, should be consulted before siting decisions become difficult to reverse. Finally, monitoring should cover operational mortality, habitat change, access-road effects and restoration after decommissioning.
4.5. Transferability, Uncertainty and Validation
The framework can be transferred by retaining its analytical sequence of criteria definition, stakeholder elicitation, PROMETHEE comparison and GIS screening. The local criteria, stakeholder groups and spatial layers should be replaced to suit the new context. In regions with fewer formally protected areas, ecological intactness, connectivity, ecosystem services and restoration opportunities may assume greater importance. Regions following solar-, wind-, hydropower- or transport-led development pathways should adapt the alternatives and impact mechanisms. Where stakeholder engagement is weak, a minimum transparent process should include documented recruitment, a common scoring rubric, separate reporting by stakeholder group and sensitivity testing of alternative weights.
The study has several limitations. The expert sample is regional and not statistically representative. The available aggregate results do not show individual-score dispersion or agreement. Spatial layers differ in validation status, temporal relevance and positional accuracy. The renewable-energy inventory can also change as permits evolve. The 0.93, 1.81 and 2.00 km offsets are planning scenarios rather than ecological thresholds. Consequently, mapped overlaps indicate locations requiring investigation, rather than confirmed ecological effects or robust siting boundaries. External validation was outside the present study. A future validation cycle should compare mapped conflict areas with actual licensing and siting decisions, test corridor assumptions using field or telemetry data, repeat the analysis using alternative corridor layers and obtain structured feedback from planning authorities, conservation bodies, developers and residents. Repeating the elicitation after this feedback would indicate whether the rankings are stable and whether the framework influences actual planning decisions.
5. Conclusions
This study developed a screening-level PROMETHEE-GIS framework for integrating ecological connectivity into renewable-energy and transport planning in Western Macedonia. The perceived baseline assigned 0.69 of the criterion weight to energy and 0.01 to reversibility. The stakeholder-mean framework redistributed weight to protected areas (0.21), reversibility (0.19), energy (0.18) and ecological corridors (0.16). The leading strategic direction changed from investment (+0.50) under the baseline to tourism (+0.43) under the stakeholder-mean scenario, while the reported between-direction spread narrowed from approximately 1.10 to 0.27 in the highest-score scenario. Spatial screening identified recurring conflicts in western Voras, pelican movement routes linking Prespa with other wetlands and the Kleidi terrestrial corridor for large mammals. These findings connect infrastructure planning to biodiversity conservation by identifying where cumulative assessment and species-specific evidence should be prioritized. The scenario offsets of 0.93, 1.81 and 2.00 km are deliberative planning assumptions and should not be used as universal setbacks or ecological thresholds. The principal contribution is a transparent sequence that distinguishes exclusion from evaluation, treats reversibility as a core criterion and makes the spatial consequences of alternative priorities visible before project permitting. Transfer requires locally appropriate data and stakeholder recruitment suited to the intended decision context. Future research should test the candidate corridors using telemetry, camera traps or genetic data and compare them with species-specific least-cost or circuit-theory models. It should also quantify rank stability under alternative weights, include host-community residents, and compare feasible infrastructure layouts and costs. Validation against actual siting decisions and monitored ecological outcomes would test the practical value of the framework. Subject to these conditions, the framework can support earlier and more biodiversity-aware deliberation in regions following different energy-transition pathways.
Author Contributions
Conceptualization, L.G., S.V., P.G.D. and T.K.; methodology, L.G., S.V., P.G.D. and T.K.; software, L.G., S.V. and T.K.; validation, S.V., P.G.D. and T.K.; formal analysis, L.G. and T.K.; investigation, L.G.; resources, S.V., P.G.D. and T.K.; data curation, L.G.; writing (original draft preparation), L.G. and S.V.; writing (review and editing), L.G., S.V., P.G.D. and T.K.; visualization, L.G. and T.K.; supervision, S.V.; project administration, S.V. and P.G.D. All authors have read and agreed to the published version of the manuscript.
Funding
This research received no external funding.
Institutional Review Board Statement
Ethical review and approval were not required for this study, as confirmed after verbal communication by the Research Ethics and Deontology Committee of the University of the Aegean. The stakeholder engagement constituted a minimal-risk, non-interventional professional expert consultation concerning regional infrastructure-planning criteria. No health information, special-category personal data or sensitive behavioral data were collected; participation was voluntary, and only aggregated, non-identifiable responses were reported.
Data Availability Statement
The aggregated, non-identifiable criterion weights and PROMETHEE results supporting this study are reported in Table 3 and Table 5, while metadata for the spatial datasets are provided in Table 4. Individual stakeholder responses are not publicly available because participant consent did not include the public disclosure of individual-level data. Sensitive biodiversity data and third-party geospatial layers are not redistributed and remain subject to the access conditions of their original providers.
Acknowledgments
This manuscript was prepared by converting and restructuring the MSc thesis of Lazaros Georgiadis into a journal-article format. During the preparation of this draft manuscript, ChatGPT (GPT-5.5 Pro) was used to assist with text restructuring, language editing and formatting into the Diversity template. The authors have reviewed and take full responsibility for the content. The authors also thank Lazaros Kotsios for his contribution to map development.
Conflicts of Interest
The authors declare no conflicts of interest.
References
- IPBES. Summary for Policymakers of the Global Assessment Report on Biodiversity and Ecosystem Services; IPBES Secretariat: Bonn, Germany, 2019. [Google Scholar] [CrossRef]
- Convention on Biological Diversity. Kunming-Montreal Global Biodiversity Framework; Decision CBD/COP/DEC/15/4; CBD: Montreal, QC, Canada, 2022. [Google Scholar]
- Hilty, J.; Worboys, G.L.; Keeley, A.; Woodley, S.; Lausche, B.; Locke, H.; Carr, M.; Pulsford, I.; Pittock, J.; White, J.W.; et al. Guidelines for Conserving Connectivity Through Ecological Networks and Corridors; IUCN: Gland, Switzerland, 2020. [Google Scholar] [CrossRef] [Scilit]
- Ament, R.; Clevenger, A.; van der Ree, R. (Eds.) Addressing Ecological Connectivity in the Development of Roads, Railways and Canals; IUCN WCPA Technical Report Series No. 5; IUCN: Gland, Switzerland, 2023. [Google Scholar] [CrossRef] [Scilit]
- Van der Ree, R.; Smith, D.J.; Grilo, C. (Eds.) Handbook of Road Ecology; Wiley-Blackwell: Oxford, UK, 2015. [Google Scholar] [CrossRef] [Scilit]
- Rosell, C.; Seiler, A.; Chrétien, L.; Guinard, E.; Hlaváč, V.; Moulherat, S.; Fernández, L.M.; Georgiadis, L.; Moț, R.; Reck, H.; et al. (Eds.) Biodiversity and Infrastructure: A Handbook for Action; IENE: Paris, France, 2023; Available online: https://www.biodiversityinfrastructure.org/ (accessed on 6 September 2026).
- Hlaváč, V.; Anděl, P.; Matoušová, J.; Dostál, I.; Strnad, M.; Immerová, B.; Kadlečík, J.; Meyer, H.; Moț, R.; Pavelko, A.; et al. Wildlife and Traffic in the Carpathians: Guidelines How to Minimize Impact of Transport Infrastructure Development on Nature in the Carpathian Countries; TRANSGREEN Project: Banská Bystrica, Slovakia, 2019. [Google Scholar]
- Georgiadis, L.; Sjölund, A.; Seiler, A.; Mira, A.; Rosell, C.; Papp, C.-R.; Hahn, E.; Mathews, F.; Shilling, F.; Bekker, H.; et al. A Global Strategy for Ecologically Sustainable Transport and Other Linear Infrastructure; IENE, ICOET, ANET, ACLIE, WWF and IUCN: Paris, France, 2020; Available online: https://www.iene.info/content/uploads/2020Dec_GlobalStrategyOnSustainableLTI205043.pdf (accessed on 6 September 2026).
- Bennun, L.; van Bochove, J.; Ng, C.; Fletcher, C.; Wilson, D.; Phair, N.; Carbone, G. Mitigating Biodiversity Impacts Associated with Solar and Wind Energy Development: Guidelines for Project Developers; IUCN: Gland, Switzerland; The Biodiversity Consultancy: Cambridge, UK, 2021. [Google Scholar] [CrossRef] [Scilit]
- Kati, V.; Kassara, C.; Vrontisi, Z.; Moustakas, A. The biodiversity-wind energy-land use nexus in a global biodiversity hotspot. Sci. Total Environ. 2021, 768, 144471. [Google Scholar] [CrossRef] [Scilit] [PubMed]
- Ibisch, P.L.; Hoffmann, M.T.; Kreft, S.; Pe’er, G.; Kati, V.; Biber-Freudenberger, L.; DellaSala, D.A.; Vale, M.M.; Hobson, P.R.; Selva, N. A global map of roadless areas and their conservation status. Science 2016, 354, 1423–1427. [Google Scholar] [CrossRef] [Scilit] [PubMed]
- Convention on Biological Diversity. Mainstreaming of Biodiversity Within and Across Sectors; Decision CBD/COP/DEC/16/13, Adopted 1 November 2024; CBD: Montreal, QC, Canada, 2024; Available online: https://www.cbd.int/doc/decisions/cop-16/cop-16-dec-13-en.pdf (accessed on 6 September 2026).
- Convention on Biological Diversity. Biodiversity and Climate Change; Decision CBD/COP/DEC/16/22, Adopted 1 November 2024. CBD: Montreal, QC, Canada, 2024. Available online: https://www.cbd.int/doc/decisions/cop-16/cop-16-dec-22-en.pdf (accessed on 6 September 2026).
- United Nations. Strengthening the Links Between All Modes of Transport to Achieve the Sustainable Development Goals; Resolution A/RES/78/148, Adopted 19 December 2023; United Nations: New York, NY, USA, 2023. [Google Scholar]
- United Nations Department of Economic and Social Affairs. United Nations Decade of Sustainable Transport 2026–2035: Implementation Plan; United Nations: New York, NY, USA, 2025. [Google Scholar]
- European Commission. Green Infrastructure (GI)—Enhancing Europe’s Natural Capital; COM(2013) 249 Final; European Commission: Brussels, Belgium, 2013. [Google Scholar]
- Kettunen, M.; Terry, A.; Tucker, G.; Jones, A. Guidance on the Maintenance of Landscape Features of Major Importance for Wild Flora and Fauna; Institute for European Environmental Policy: Brussels, Belgium, 2007. [Google Scholar]
- European Parliament and Council of the European Union. Regulation (EU) 2020/852 on the Establishment of a Framework to Facilitate Sustainable Investment. Off. J. Eur. Union 2020, L 198, 13–43. [Google Scholar]
- European Parliament and Council of the European Union. Regulation (EU) 2024/1679 of 13 June 2024 on Union Guidelines for the Development of the Trans-European Transport Network, Amending Regulations (EU) 2021/1153 and (EU) No 913/2010 and Repealing Regulation (EU) No 1315/2013. Off. J. Eur. Union 2024, 2024/1679. Available online: https://eur-lex.europa.eu/eli/reg/2024/1679/oj/eng (accessed on 6 September 2026).
- Garel, A.; Romec, A.; Sautner, Z.; Wagner, A.F. Do investors care about biodiversity? Rev. Financ. 2024, 28, 1151–1186. [Google Scholar] [CrossRef] [Scilit]
- European Environment Agency; Swiss Federal Office for the Environment. Landscape Fragmentation in Europe; EEA Report No. 2/2011; European Environment Agency: Copenhagen, Denmark, 2011; 92p. [Google Scholar] [CrossRef]
- European Environment Agency. Landscape Fragmentation Pressure and Trends in Europe (LSI 004); EEA Indicator Assessment: Copenhagen, Denmark, 2021; Available online: https://www.eea.europa.eu/data-and-maps/indicators/mobility-and-urbanisation-pressure-on-ecosystems-2/assessment (accessed on 7 September 2026).
- Georgiadis, L.; Chalkia, E.; Chalkia, M.; Mot, R. Recommendations for policy/strategy harmonization. Project BISON-Biodiversity and Infrastructure Synergies and Opportunities for European Transport Network; Horizon 2020, 2022. BISON Project. Biodiversity and Infrastructure Synergies and Opportunities for European Transport Networks (BISON). Available online: https://bison-transport.eu/ (accessed on 6 September 2026).
- Guinard, E. Report on Identification of Gaps and Barriers to Expand Replicability and Application of Good Practice to Mainstream Biodiversity and Transport; BISON-Biodiversity and Infrastructure Synergies and Opportunities for European Transport Network, Horizon 2020; CEREMA: Bron, France, 2023. [Google Scholar]
- Hellenic Regulatory Authority for Energy. Geoportal for Renewable Energy Projects. Available online: https://geo.rae.gr/ (accessed on 6 September 2026).
- Faselt, J.; Keeley, A.; Laur, A.; Oppler, G. Technical Guidance on Systematic Conservation Planning with Connectivity; Center for Large Landscape Conservation: Bozeman, MT, USA; Convention on the Conservation of Migratory Species of Wild Animals Secretariat (CMS Secretariat): Bonn, Germany, 2024. [Google Scholar]
- Kassara, C.; Petridou, M.; Tzortzakaki, O.; Papantoniou, E.; Galani, T.; Psaralexi, M.; Gkotsis, D.; Papaioannou, H.; Kati, V. The Roadless Map of Greece; Version 2; Mendeley Data: London, UK, 2022. [Google Scholar] [CrossRef]
- Alexandrou, O.; Catsadorakis, G.; Malakou, M.; Papanousi, F.; Roumeliotou, V. Siting Multiple Wind Farms Within Pelican Movement Corridors in Western and Central Macedonia; Society for the Protection of Prespa: Agios Germanos, Greece, 2021; (In Greek). [Google Scholar] [CrossRef]
- Vasilakis, D.P.; Whitfield, D.P.; Kati, V. A balanced solution to the cumulative threat of industrialized wind farm development on cinereous vultures (Aegypius monachus) in south-eastern Europe. PLoS ONE 2017, 12, e0172685. [Google Scholar] [CrossRef] [Scilit] [PubMed]
- Georgiakakis, P.; Kafkaletou Diez, A.; Salvarina, I.; Benda, P.; Billington, G.; Dietz, C.; Billington, J.; Cove, D.; Davison, S.; Cooke, M.; et al. The bats of Greece: An updated review of their distribution, ecology and conservation. Animals 2023, 13, 2529. [Google Scholar] [CrossRef] [Scilit] [PubMed]
- Jay, S. Strategic environmental assessment for energy production. Energy Policy 2010, 38, 3489–3497. [Google Scholar] [CrossRef] [Scilit]
- Suprayoga, G.B.; Bakker, M.; Witte, P.; Spit, T. A systematic review of indicators to assess the sustainability of road infrastructure projects. Eur. Transp. Res. Rev. 2020, 12, 19. [Google Scholar] [CrossRef] [Scilit]
- Cannemi, M.; García-Melón, M.; Aragonés-Beltrán, P.; Gómez-Navarro, T. Modeling decision making as a support tool for policy making on renewable energy development. Energy Policy 2014, 67, 127–137. [Google Scholar] [CrossRef] [Scilit]
- BirdLife Europe. Meeting Europe’s Renewable Energy Targets in Harmony with Nature; RSPB: Sandy, UK, 2011. [Google Scholar]
- European Commission. Assessment of Plans and Projects in Relation to Natura 2000 Sites—Methodological Guidance on Article 6(3) and (4) of the Habitats Directive 92/43/EEC; European Commission: Brussels, Belgium, 2021. [Google Scholar]
- Maes, J.; Egoh, B.; Willemen, L.; Liquete, C.; Vihervaara, P.; Schägner, J.P.; Grizzetti, B.; Drakou, E.G.; La Notte, A.; Zulian, G.; et al. Mapping ecosystem services for policy support and decision making in the European Union. Ecosyst. Serv. 2012, 1, 31–39. [Google Scholar] [CrossRef] [Scilit]
- Liquete, C.; Kleeschulte, S.; Dige, G.; Maes, J.; Grizzetti, B.; Olah, B.; Zulian, G. Mapping green infrastructure based on ecosystem services and ecological networks: A Pan-European case study. Environ. Sci. Policy 2015, 54, 268–280. [Google Scholar] [CrossRef] [Scilit]
- Fernández, L.M.; Rosell, C.; Marull, J.; Cano, S. Preliminary Draft of Integrated Ecological Connectivity, Biodiversity and Climate Risk Mapping Developed with Stakeholder Feedback; EU-Funded SYMBIOSIS Project, Milestone 9; Minuartia: Madrid, Spain, 2026. [Google Scholar]
- Huang, I.B.; Keisler, J.; Linkov, I. Multi-criteria decision analysis in environmental sciences: Ten years of applications and trends. Sci. Total Environ. 2011, 409, 3578–3594. [Google Scholar] [CrossRef] [Scilit] [PubMed]
- Adem Esmail, B.; Geneletti, D. Multi-criteria decision analysis for nature conservation: A review of 20 years of applications. Methods Ecol. Evol. 2018, 9, 42–53. [Google Scholar] [CrossRef] [Scilit]
- Greco, S.; Ehrgott, M.; Figueira, J.R. (Eds.) Multiple Criteria Decision Analysis: State of the Art Surveys; Springer: New York, NY, USA, 2016. [Google Scholar] [CrossRef] [Scilit]
- Malczewski, J. GIS-based multicriteria decision analysis: A survey of the literature. Int. J. Geogr. Inf. Sci. 2006, 20, 703–726. [Google Scholar] [CrossRef] [Scilit]
- Brans, J.P.; De Smet, Y. PROMETHEE methods. In Multiple Criteria Decision Analysis: State of the Art Surveys; Greco, S., Ehrgott, M., Figueira, J.R., Eds.; Springer: New York, NY, USA, 2016; pp. 187–219. [Google Scholar] [CrossRef] [Scilit]
- Behzadian, M.; Kazemzadeh, R.B.; Albadvi, A.; Aghdasi, M. PROMETHEE: A comprehensive literature review on methodologies and applications. Eur. J. Oper. Res. 2010, 200, 198–215. [Google Scholar] [CrossRef] [Scilit]
- Joumard, R.; Nicolas, J.P. Transport project assessment methodology within the framework of sustainable development. Ecol. Indic. 2010, 10, 136–142. [Google Scholar] [CrossRef] [Scilit]
- Region of Western Macedonia. Strategy and Action Plan for Biodiversity of the Region of Western Macedonia; Region of Western Macedonia: Kozani, Greece, 2017. (In Greek) [Google Scholar]
- Region of Western Macedonia. Regional Plan for Adaptation to Climate Change of the Region of Western Macedonia; Region of Western Macedonia: Kozani, Greece, 2019. (In Greek) [Google Scholar]
- Kalfas, D.G.; Zagkas, D.T.; Raptis, D.I.; Zagkas, T.D. The multifunctionality of the natural environment through the basic ecosystem services in the Florina region, Greece. Int. J. Sustain. Dev. World Ecol. 2019, 26, 57–68. [Google Scholar] [CrossRef] [Scilit]
- Georgiadis, L.; Zdraveski, N.; Ambas, V. Biodiversity Status and Challenges in Transborder Hotspots of the South-Western Balkans; Combine2Protect Project, Interreg–IPA CBC/CCI 2014 TC 16 I5CB 009; Region of Western Macedonia/Regional Unit of Florina: Florina, Greece; State Environmental Inspectorate: Athens, Greece; Centre for Development of the South-East Planning Region: Strumica, North Macedonia; Aristotle University of Thessaloniki, Department of Biology: Thessaloniki, Greece, 2020; 128p. [Google Scholar]
- Georgiadis, L. Application of Multi-Criteria Analysis and Scenario Development for the Design of Energy and Transport Infrastructure While Ensuring Ecological Connectivity in Western Macedonia. Master’s Thesis, University of the Aegean, Mytilene, Greece, 2023. (In Greek) [Google Scholar]
- Oikonomou, V.; Dimitrakopoulos, P.G.; Troumbis, A.Y. Incorporating ecosystem function concept in environmental planning and decision making by means of multi-criteria evaluation: The case-study of Kalloni, Lesbos, Greece. Environ. Manag. 2011, 47, 77–92. [Google Scholar] [CrossRef] [Scilit] [PubMed]
- Mareschal, B. Visual PROMETHEE Academic Edition and User Manual. Available online: https://bertrand.mareschal.web.ulb.be/PG2024/academic-edition.html (accessed on 7 September 2026).
- Giannakis, N.; Georganta, A.; Poirazidis, K.; Demertzi, A.; Theodoropoulos, G.; Liouza, S.; Sakellarakis, F.N.; Iliopoulos, Y.; Psaralexi, M.; Karagianni, K.; et al. Study 3: Preparation of Special Environmental Studies and Management Plans for Natura 2000 Sites in Western Macedonia (Parts of Kozani, Kastoria, Florina and Grevena) and Central Macedonia (Parts of Pella, Imathia and Pieria); The Hellenic Ministry of Environment and Energy, PLAS S.A. and YETOS S.A.: Athens, Greece, 2023. (In Greek) [Google Scholar]
- Zhang, H.; Chai, J.; Li, Z.; Li, H.; Gibson, J.; Kumar, P.; Jin, G. Global effects of progress towards SDGs on steeply sloped land use and land cover. Fundam. Res. 2025, in press. [Google Scholar] [CrossRef] [Scilit]
- Wu, G.C.; Jones, R.A.; Leslie, E.; Williams, J.H.; Pascale, A.; Brand, E.; Parker, S.S.; Cohen, B.S.; Fargione, J.E.; Souder, J.; et al. Minimizing habitat conflicts in meeting net-zero energy targets in the western United States. Proc. Natl. Acad. Sci. USA 2023, 120, e2204098120. [Google Scholar] [CrossRef] [Scilit] [PubMed]
- Vasudev, D.; Fletcher, R.J.; Srinivas, N.; Marx, A.J.; Goswami, V.R. Mapping the connectivity–conflict interface to inform conservation. Proc. Natl. Acad. Sci. USA 2023, 120, e2211482119. [Google Scholar] [CrossRef] [Scilit] [PubMed]
- Diffendorfer, J.E.; Dorning, M.A.; Keen, J.R.; Kramer, L.A.; Taylor, R.V. Geographic context affects the landscape change and fragmentation caused by wind energy facilities. PeerJ 2019, 7, e7129. [Google Scholar] [CrossRef] [Scilit] [PubMed]
- Saidur, R.; Rahim, N.A.; Islam, M.R.; Solangi, K.H. Environmental impact of wind energy. Renew. Sustain. Energy Rev. 2011, 15, 2423–2430. [Google Scholar] [CrossRef] [Scilit]

Disclaimer/Publisher’s Note: The statements, opinions and data contained in all publications are solely those of the individual author(s) and contributor(s) and not of MDPI and/or the editor(s). MDPI and/or the editor(s) disclaim responsibility for any injury to people or property resulting from any ideas, methods, instructions or products referred to in the content. |
© 2026 by the authors. Licensee MDPI, Basel, Switzerland. This article is an open access article distributed under the terms and conditions of the Creative Commons Attribution (CC BY) license.