


Abstract
The order Testudines, one of the oldest monophyletic vertebrate lineages, offers an excellent opportunity to investigate mitogenome evolution and deep phylogenetic inference. However, comparative analyses across the order remain limited. To address this gap, we conducted a large-scale comparative mitogenomic analysis of 170 turtle species across 14 families, including 26 newly assembled mitogenomes. Using 13 protein-coding genes (PCGs) and 22 mitochondrial tRNAs, we characterized codon usage patterns, codon aversion motifs (CAMs), and tRNA secondary structures. Our analysis revealed a strong AT bias and significant inter-familial variation in codon usage bias. Multiple lines of evidence consistently indicated that natural selection was the primary force shaping codon usage patterns. We also identified species-specific CAMs and genus-associated tRNA secondary structure features as potential molecular indicators for evolutionary patterns and structural diversity. Phylogenetic analyses using Maximum Likelihood (ML) and Bayesian Inference (BI) recovered the two major suborders and provided insights into historically debated deep-node relationships, including the placement of Chelydridae and generic boundaries within Chelidae. Overall, this study provides a comprehensive perspective on mitogenome evolution in turtles and highlights the potential of codon aversion patterns and tRNA structural diversity as informative molecular evidence for comparative evolutionary genomics and mitochondrial diversity in Testudines.
1. Introduction
As one of the most ancient reptilian lineages, turtles (Testudines) are important for understanding vertebrate evolution, although deep phylogenetic relationships among their major families remain unresolved [1,2,3,4]. This order is divided into two suborders, the side-necked turtles (Pleurodira) and the hidden-necked turtles (Cryptodira), which together comprise 14 families, 97 genera, and 364 extant species (https://iucn-tftsg.org/). The monophyly of these two suborders, as well as that of major Pleurodiran families such as Chelidae, is broadly supported. However, deep relationships within Cryptodira remain debated, as molecular and morphological datasets often yield conflicting topologies for several key lineages. In particular, the phylogenetic placement of snapping turtles (Chelydridae) has varied among studies, resulting in conflicting phylogenetic hypotheses [5,6]. Similarly, relationships among major families within Testudinoidea, such as Emydidae, Geoemydidae, and Testudinidae, are unresolved, likely reflecting rapid diversification during their evolutionary history [7]. These unresolved relationships suggest that additional genomic data and new molecular features are needed to better understand turtle evolution.
The mitochondrial genome (mitogenome) is a compact, maternally inherited molecule typically containing 13 protein-coding genes (PCGs). Owing to its rapid evolutionary rate and conserved gene content, it has been widely used to investigate molecular evolution and phylogenetic relationships. Although these PCGs have been widely applied in comparative evolutionary studies of vertebrate groups, such as amphibians and birds [8,9], their application within Testudines has been hampered by incomplete taxonomic sampling. Complete mitogenome sequences are still limited for many critical lineages [10], and most research has focused on restricted taxonomic groups, such as individual genera or families [11,12]. Consequently, large-scale comparative analyses of turtle mitogenomes remain limited, restricting our understanding of mitochondrial evolution across the order.
Beyond the primary DNA sequence, codon usage patterns offer a deeper layer of evolutionary information. Codon usage bias (CUB), defined as the unequal frequency of synonymous codons [13], is shaped by a dynamic interaction between mutational pressure and natural selection, often reflecting translation efficiency and metabolic constraints [14,15]. Although CUB has been extensively studied in other vertebrate clades, its evolutionary dynamics and potential implications for comparative genomics within Testudines remain poorly characterized. Furthermore, codon aversion, a phenomenon in which certain codons are consistently avoided (first described by Miller [16,17]), has recently emerged as a potential source of evolutionary signals. This phenomenon may harbor informative phylogenetic signals and has been investigated across diverse taxa, including birds and plants, in our previous studies [8,18,19,20,21]. However, the evolutionary patterns and systematic value of codon aversion motifs (CAMs) across Testudines remain largely unexplored. Alongside sequence patterns, mitochondrial tRNA secondary structures also hold important evolutionary signals [22,23,24]. Although core structures are generally conserved, small changes such as altered loops or missing arms may generate lineage-associated structural patterns [25,26]. To date, however, both codon aversion patterns and systematic tRNA secondary structural variations remain unexplored at the order level within Testudines. Comparative analyses of these features may therefore provide new insights into mitochondrial evolution and help evaluate their potential as molecular markers for evolutionary and systematic studies in turtles.
In this study, we conducted a large-scale comparative mitogenomic analysis to investigate mitochondrial evolution and codon-level features in turtles. To establish a broad comparative framework, we assembled 26 mitogenomes from Sequence Read Archive (SRA) data and combined them with 144 public sequences, generating a robust mitogenomic dataset of 170 turtle species. Using this dataset, we systematically (1) characterized codon usage patterns and the evolutionary forces shaping CUB across Testudines; (2) investigated lineage-specific CAMs and tRNA secondary structure features as potential molecular markers for evolutionary and systematic studies; and (3) reconstructed the mitochondrial phylogeny of Testudines using Maximum Likelihood (ML) and Bayesian Inference (BI) approaches. Together, this study provides a broader perspective on mitogenome evolution in turtles and highlights the potential of codon aversion patterns and tRNA structural features for comparative evolutionary genomics.
2. Materials and Methods
2.1. Mitogenome Data Acquisition, Assembly, and Annotation
To construct a comprehensive mitogenomic dataset for Testudines, we retrieved 144 publicly available mitogenomes from NCBI. However, several critical taxa were absent or poorly represented. Missing groups included the genera Gopherus, Rhinoclemmys, Chelonoidis, as well as Nilssonia. Intraspecific sampling was also limited for Chrysemys dorsalis, Terrapene Carolina, Graptemys, Pseudemys, and the relictual Dermatemys mawii. These sampling gaps limited the resolution of deep phylogenetic relationships within Testudines.
To establish a broad comparative framework, we assembled and annotated 26 additional mitogenomes using raw reads from the NCBI SRA database. The mitogenomes were assembled de novo using GetOrganelle v1.7.5 [27], with Chrysemys picta (NC_002073.3) serving as a seed reference sequence. We verified the circularity of each newly assembled mitogenome using Bandage v0.9.0 [28] and annotated them using the GeSeq online tool [29]. The 26 newly annotated sequences were deposited in GenBank and GenBase (see the Data Availability Statement and Table S1 for detailed accession information). Our final dataset comprised 170 mitogenomes, representing all 14 extant families (100%), 76 of 97 genera (78%), and 170 of the 364 species (47%) within Testudines.
These new mitogenomes introduced sequences for seven previously unrepresented genera (Mesoclemmys, Hydromedusa, Deirochelys, Clemmys, Emys, Rhinoclemmys, and Staurotypus) and deepened taxonomic sampling within four families (Chelidae, Emydidae, Testudinidae, Kinosternidae), thereby improving lineage coverage across the turtle phylogeny.
2.2. Mitogenome Compositional Analysis
We determined the total nucleotide length of each mitogenome to assess size variation across the order. Circular maps were generated using the Proksee v1.0.0a6 comparison tool [30] to visualize genomic architecture, gene content, and gene order.
We extracted the protein-coding sequences (CDSs) from each mitogenome. These sequences were processed by removing termination codons (TAA, TAG, AGG, AGA) and incomplete stop codons (e.g., T–). The resulting 13 CDSs were individually aligned across all species using MAFFT v.7.0 [31]. Based on these alignments, we calculated the total GC content and the GC content at the first (GC1), second (GC2), and third (GC3) codon positions using DAMBE v.7.0 [32].
2.3. Codon Usage, Evolutionary Rates, and tRNA Secondary Structures
To characterize codon usage trends, we processed the CDSs from each gene by excluding sequences shorter than 300 bp (MT-ATP8 < 300 bp), and removing termination codons. We then quantified CUB using CodonW v1.4 [33] by calculating two key indices. The first, Relative Synonymous Codon Usage (RSCU), quantifies the occurrence rate of a specific codon against its theoretical expectation, with values > 1.0 indicating a preferred codon [34,35]. The second, the Effective Number of Codons metric (ENC), determines gene-wide codon bias intensity, spanning from a score of 20 (maximum bias) up to 61 (no bias), and values below 35 indicate significant bias [36,37]. We plotted the RSCU profiles into a heatmap via TBtools-II v2.311 [38].
We also investigated codon aversion, defined as the complete absence of a particular synonymous codon within a gene (RSCU = 0) [16]. We quantified aversion events across 11 mitochondrial PCGs (>300 bp) for all 170 species to characterize CAMs and evaluate their potential as evolutionary and systematic markers [17]. Additionally, tRNA secondary folding models were inferred through tRNAscan-SE v2.0.12 [39], strictly applying the vertebrate mitochondrial search model (-M vert) to ensure accurate prediction. and visualized with VARNA v3-93 using the software’s default rendering parameters [40].
To quantify evolutionary pressure, we evaluated the nonsynonymous (dN) and synonymous (dS) tree lengths, along with the resulting ω ratio (dN/dS) implemented in the PAML v4.10.9 M0 package [41]. Here, estimates of ω > 1, ω = 1, or ω < 1 signify positive adaptation, neutral evolution, and purifying selection, respectively.
2.4. Investigating Evolutionary Drivers of Codon Usage
We analyzed the evolutionary drivers of codon usage across 170 testudine species and 10 outgroup taxa (Table S2). These outgroups provided a broader vertebrate evolutionary context for evaluating codon usage patterns. To evaluate how mutational bias and natural selection dynamically shape codon preference in testudine mitogenomes, three standard analytical approaches were implemented: Parity Rule 2 (PR2) bias plots, ENC–GC3s distributions, and neutrality regressions, excluding genes shorter than 300 bp. All visualizations were generated using the ggplot2 package v3.5.2 [42].
The PR2 plot assesses nucleotide compositional asymmetry specifically across 4-fold degenerate third-codon sites [43], with G3/(G3 + C3) plotted on the x-axis and A3/(A3 + T3) on the y-axis [44,45]. A shift in plotted positions from the central origin (0.5, 0.5) indicates directional mutation pressure [45].
The ENC–GC3s plot models ENC (y-axis) against GC3s (x-axis). Values positioned along or proximate to the expected curve reflect mutation-driven codon usage. Conversely, substantial downward deviation from the theoretical distribution indicates that natural selection drives CUB [36].
The neutrality plot analysis evaluates overall GC fraction in the leading two codon sites (GC12) relative to GC3 [44,45]. The regression slope is used as an index of neutrality. Values closer to 0 indicate a stronger influence of natural selection, while values closer to 1 represent a greater impact of mutation bias [46].
2.5. Phylogenetic Inference
To reconstruct the phylogeny, the 13 mitochondrial PCGs were extracted from the 170 testudine species together with two outgroup species, from Crocodylus porosus and Pycnonotus sinensis, following Guillon et al. [47]. These two species represent Crocodylia and Aves, respectively, which are the extant archosaurian sister lineages to Testudines. These genes were individually aligned using MAFFT v7.526 and subsequently concatenated into a single supermatrix using PhyloSuite v1.2.3 [48].
ML analysis was performed in RAxML v2.0-beta2 under the GTRCAT substitution model [49]. Nodal support was assessed via 1000 bootstrap replicates with convergence determined by the autoMRE criterion.
To assess the potential effect of nucleotide compositional bias, an additional ML phylogenetic analysis was performed using the concatenated amino acid sequences of the 13 mitochondrial PCGs. The resulting tree is provided as Supplementary Figure S1.
For BI, ModelTest-NG v0.1.7 selected GTR + I + G as the optimal nucleotide substitution model according to BIC evaluation criteria [50]. We implemented BI tree searches in MrBayes v3.2.7a [51] by running two parallel iterations, each utilizing a set of four MCMC chains. Total MCMC sampling proceeded across 5 million steps at a frequency of 1 sample per 1000 steps. After trimming the first 25% trees as burn-in fraction, MCMC chain convergence was evaluated through Tracer v1.7.2.
3. Results
3.1. Comparative Mitogenomic Characteristics of Testudines
3.1.1. Mitogenome Organization of Newly Assembled Species
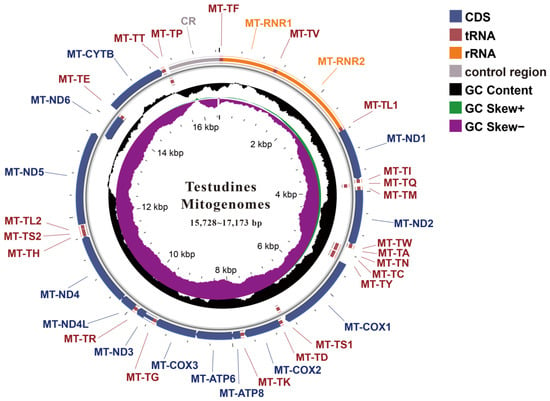
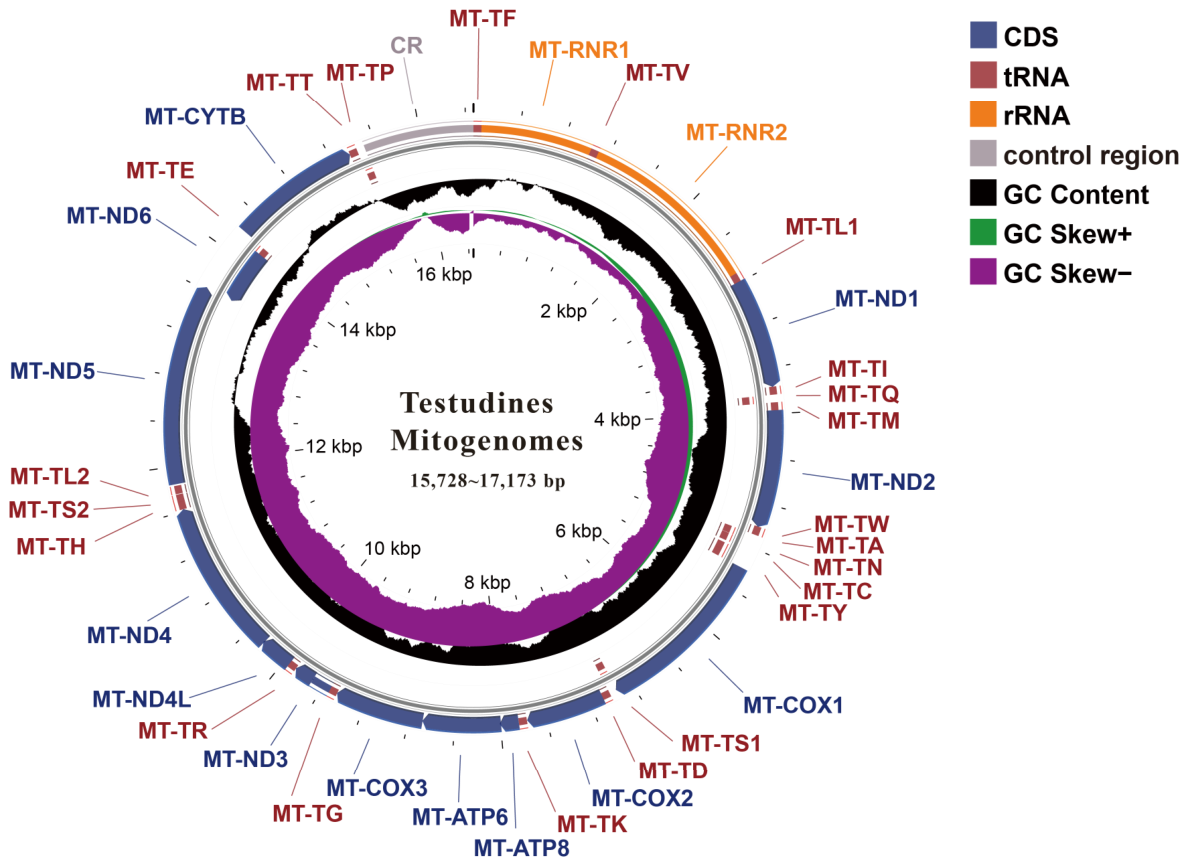
In this study, we assembled 26 new complete circular mitogenomes, including representative species from the genera Mesoclemmys, Hydromedusa, Deirochelys, Clemmys, Emys, Rhinoclemmys, Staurotypus, to broaden the taxonomic coverage for large-scale comparative evolutionary analyses (Table S1). Each mitogenome contained the typical set of 37 genes, comprising 13 PCGs, 2 rRNAs, and 22 tRNAs (Figure 1). Mitogenome sizes ranged from 15,728 bp (Nilssonia formosa) to 17,173 bp (Emys orbicularis) (Table S1).
Figure 1.
Representative circular mitogenome map of the 26 newly assembled testudine species. This map illustrates the conserved mitogenomic organization, with sizes ranging from 15,728 to 17,173 bp. The outermost tracks display the annotated genes, color-coded by function: protein-coding genes (CDS, blue), transfer RNAs (tRNA, red), ribosomal RNAs (rRNA, orange), and other regions (control region, gray). Genes on the outer and inner rings are located on the forward and reverse strands, respectively. Moving inward, the third circle illustrates the GC skew (purple indicates negative skew, GC Skew−; green indicates positive skew, GC Skew+). The innermost black line graph represents the overall GC content. The center of the map provides a scale in kilobase pairs (kbp).
3.1.2. Nucleotide Composition Across the 170-Taxon Dataset
Across the expanded dataset of 170 testudine taxa, mitogenome sizes ranged from 15,620 bp (Batagur dhongoka) to 19,438 bp (Testudo marginata) (Table S2). For the mitochondrial PCGs, species-level GC content ranged from 28.93% (in the MT-ATP8 gene of Emydura macquarii) to 49.66% (in the MT-ND4L gene in Mesoclemmys tuberculata) (Table S3). At the family level, the mean GC composition of the 13 PCGs ranged narrowly between 36.66% and 40.56% (Table 1), indicating a pronounced AT bias across all 14 families. Positional GC content consistently followed the trend: GC1 > GC2 > GC3. Notably, the family Kinosternidae exhibited the lowest GC3 content (27.76%), representing the only family with GC3 < 30%.
Table 1.
GC content of 13 mitochondrial protein-coding genes (PCGs) across 14 families of Testudines.
3.2. Codon Usage Patterns and Codon Aversion in Testudines Mitogenomes
3.2.1. Codon Usage Bias and Effective Number of Codons
To assess CUB patterns among Testudines, we calculated the ENC values for the 12 PCGs (excluding MT-ATP8) across the 170 testudine species. As shown in Table 2, the mean ENC values for each gene ranged from 33.62 ± 3.61 (MT-ND6) to 41.53 ± 3.12 (MT-CO1), indicating substantial variation in CUB among genes. The high ENC value of MT-CO1 suggests relatively weak CUB, whereas the low ENC value of MT-ND6 indicates stronger bias.
Table 2.
Mean Effective Number of Codons (ENC) values (± standard deviation) for 12 PCGs across 170 testudine species.
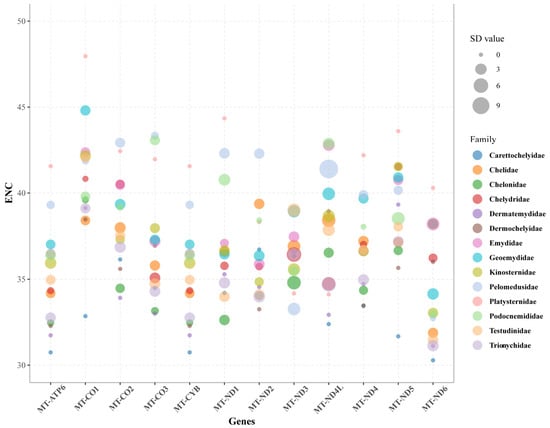
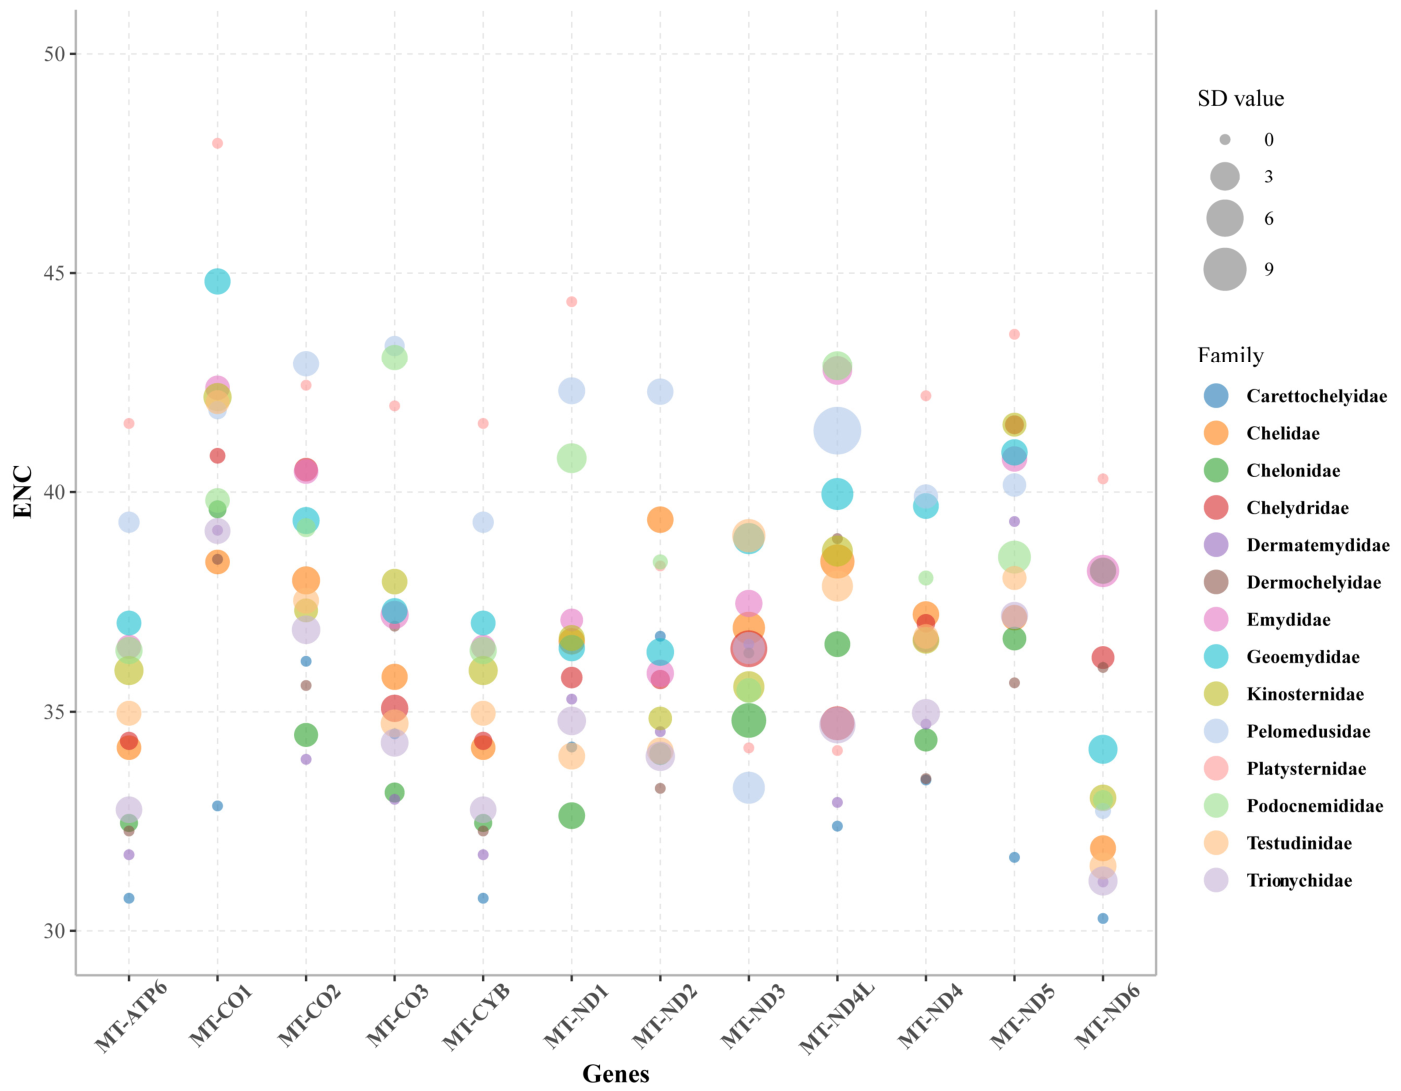
To further explore the differences among the 14 families, we compared the mean ENC values (± SD) of the 12 PCGs (Figure 2). The results demonstrated that the gene-level patterns were highly conserved across different families. Platysternidae maintained higher ENC values than other families in most genes, indicating lower codon usage bias. Conversely, Carettochelyidae displayed generally lower ENC values across all genes, suggesting a stronger bias. Additionally, MT-ND4L exhibited larger standard deviations in several families (such as Pelomedusidae), which was likely due to its short sequence length.
Figure 2.
The trends of ENC for each gene across 14 families of Testudines. The center, size, and color of each circle represent the average ENC value, SD, and turtle family, respectively.
3.2.2. Relative Synonymous Codon Usage Patterns
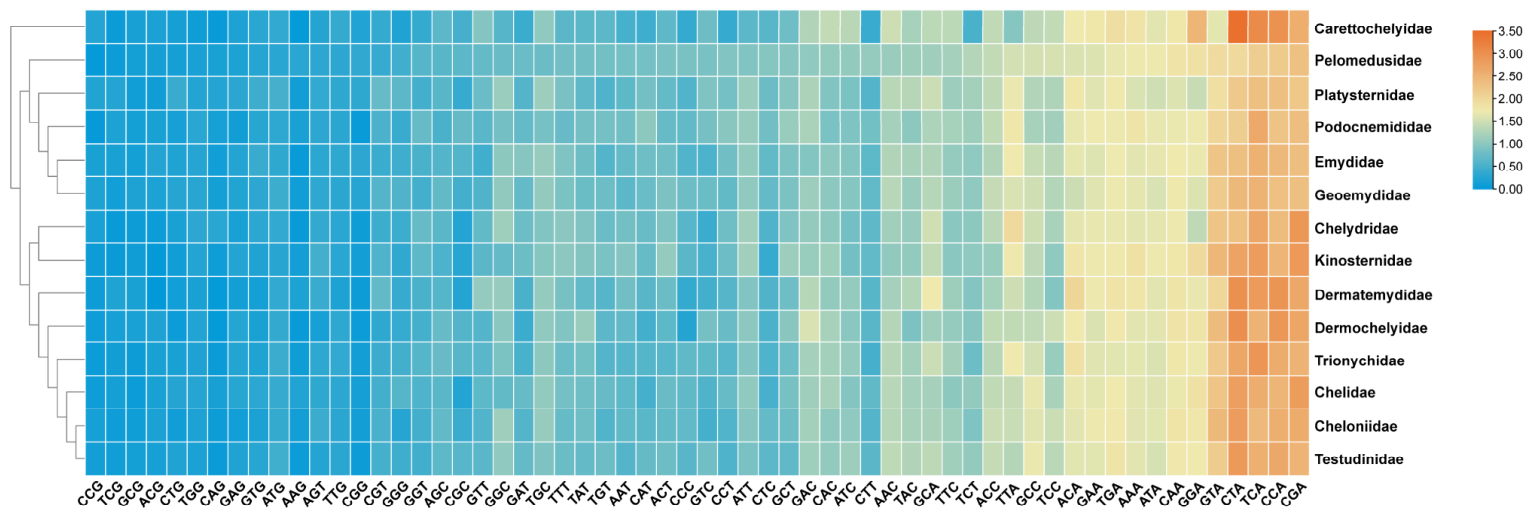
To characterize CUB patterns within Testudines, we analyzed RSCU values across 12 PCGs (excluding MT-ATP8 due to its short length) in 170 species. Species-level RSCU values ranged from 0 to 3.58 (Table S4). Notably, a high RSCU value of 3.58 was observed for the CTA codon (encoding Leucine) in Chitra vandijki, indicating substantial variability in CUB among species.
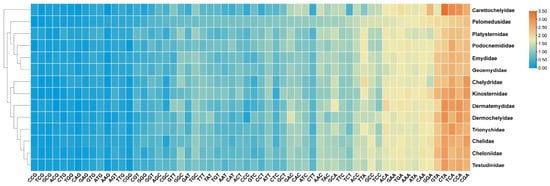
We then calculated average RSCU values for the 14 testudine families and performed a cluster analysis (Figure 3). Consistent vertical color stripes in the heatmap imply highly conserved CUB patterns across all families, exhibiting a strong preference for specific codons. Frequently used codons end with A (RSCU > 2, shown in orange/red), such as GTA, CTA, TCA, CCA, and CGA. In contrast, G-ending codons were rarely used (RSCU near 0, shown in dark blue), including CCG, TCG, GCG, and ACG. Carettochelyidae formed a separate branch, suggesting a slightly different codon usage pattern compared to the other 13 families.
Figure 3.
Relative Synonymous Codon Usage (RSCU) heatmap of overall mitochondrial PCGs across testudine families. The color gradient represents the frequency of codon usage, ranging from low (dark blue) to high (orange/red).
3.2.3. Species-Specific Codon Aversion Motifs
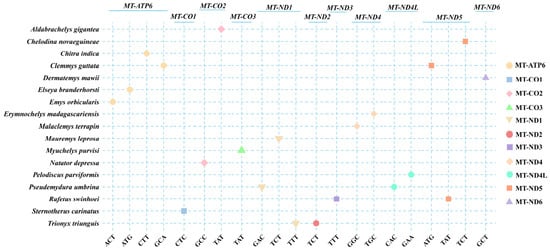
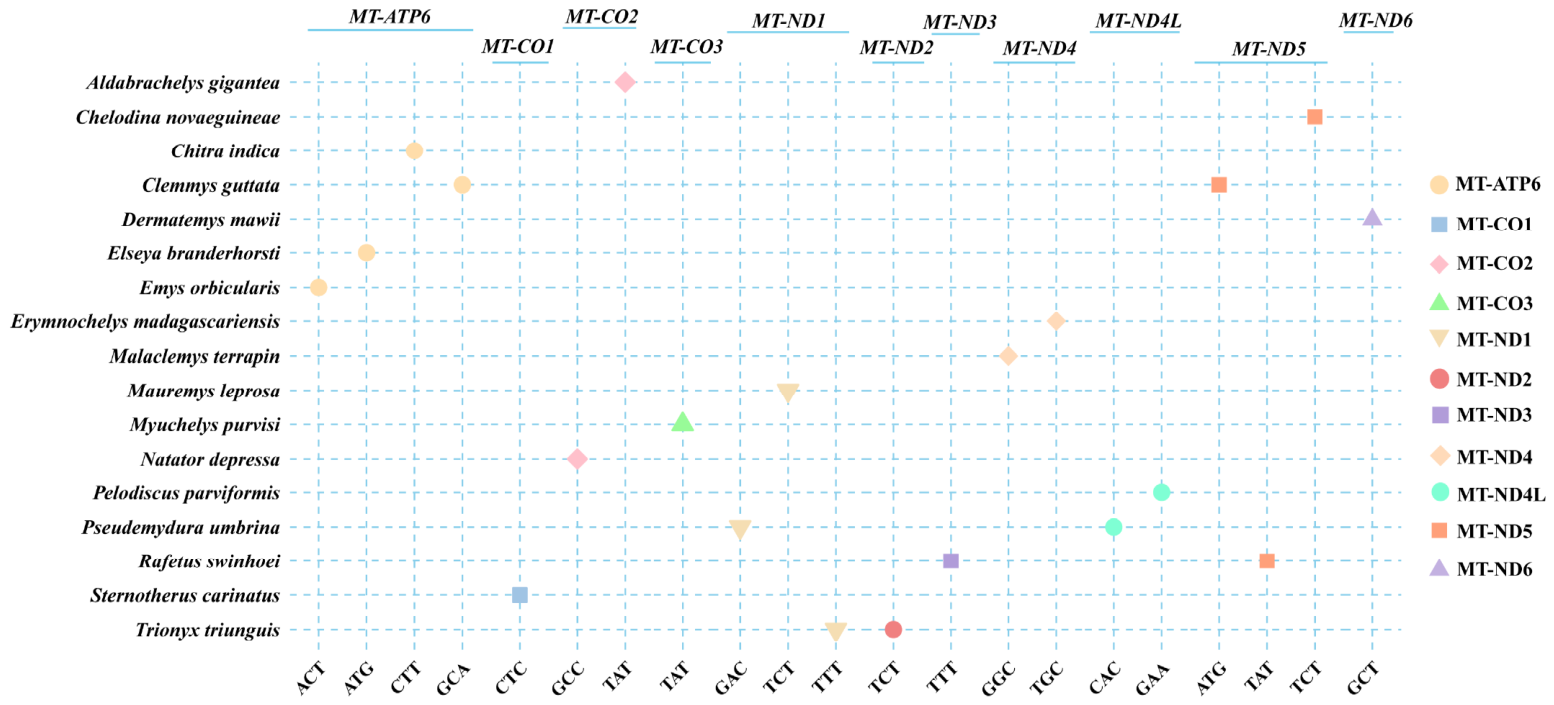
We analyzed codon aversion motifs (CAMs) across the mitochondrial PCGs of 170 testudine species. Codon aversion events were detected in all species, but only 17 species possessed species-specific CAMs. A total of 21 species-specific CAMs were identified across 11 PCGs (>300 bp) in these 17 species (Figure 4). For example, Aldabrachelys gigantea possessed a species-specific CAM, corresponding the absence of the TAT codon in the MT-CO2 gene. In 13 species, the CAM was confined to a single gene, whereas four species (Clemmys guttata, Pseudemydura umbrina, Rafetus swinhoei, and Trionyx triunguis) possessed CAMs in two different genes. No distinct genus- or family-level patterns were observed. These findings suggest that species-specific CAMs are rare but highly specific and may serve as molecular markers for species-level identification within the order Testudines.
Figure 4.
Distribution of species-specific codon aversion motifs (CAMs) across mitochondrial PCGs in Testudines. The y-axis lists species with species-specific CAMs, and the x-axis shows the absent codons grouped by gene. Shapes and colors in the legend specify different PCGs.
3.3. Mitochondrial tRNAs Secondary Structures and Evolutionary Features
3.3.1. Secondary Conformations of Mitochondrial tRNA Genes
Table S5 summarizes the nucleotide length parameters of the 22 tRNA genes derived from all 170 mitogenomes. Nearly all tRNAs adopt the classical cloverleaf spatial conformation, with the sole exception of trnS-GCU, which fails to form a functional dihydrouridine (D) stem.
Sequence and structural conservation varied among different tRNA regions. The anticodon loop (AC-loop) was highly conserved, maintaining a length of 7 nucleotides (nt) in most tRNAs. The acceptor arm (AC-arm) and T-arm also displayed relatively stable numbers of base pairs. In contrast, the D-loop was highly variable, with lengths ranging from 3.07 ± 0.39 nt in trnC-GCA to 13.65 ± 0.69 nt in trnL-UAA. Additionally, specific tRNAs such as trnW-UCA and trnI-GAU, showed higher interspecific variation in loop length.
Table S6 summarizes the structural diversity of 22 tRNA genes across 170 mitogenomes. The predicted structures showed substantial variation, with the number of structural conformations ranging from 100 in trnN-GUU to 147 in trnT-UGU. However, structural variation was unevenly distributed among different regions of tRNAs. The AC-loop showed limited variation, with trnS-UGA exhibiting only one structural conformation. In contrast, the D-loop and T-loop displayed greater structural diversity, with 117 conformations detected for the D-loop of trnW-UCA.
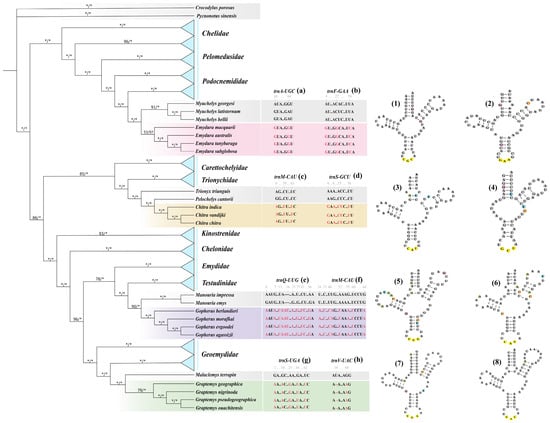
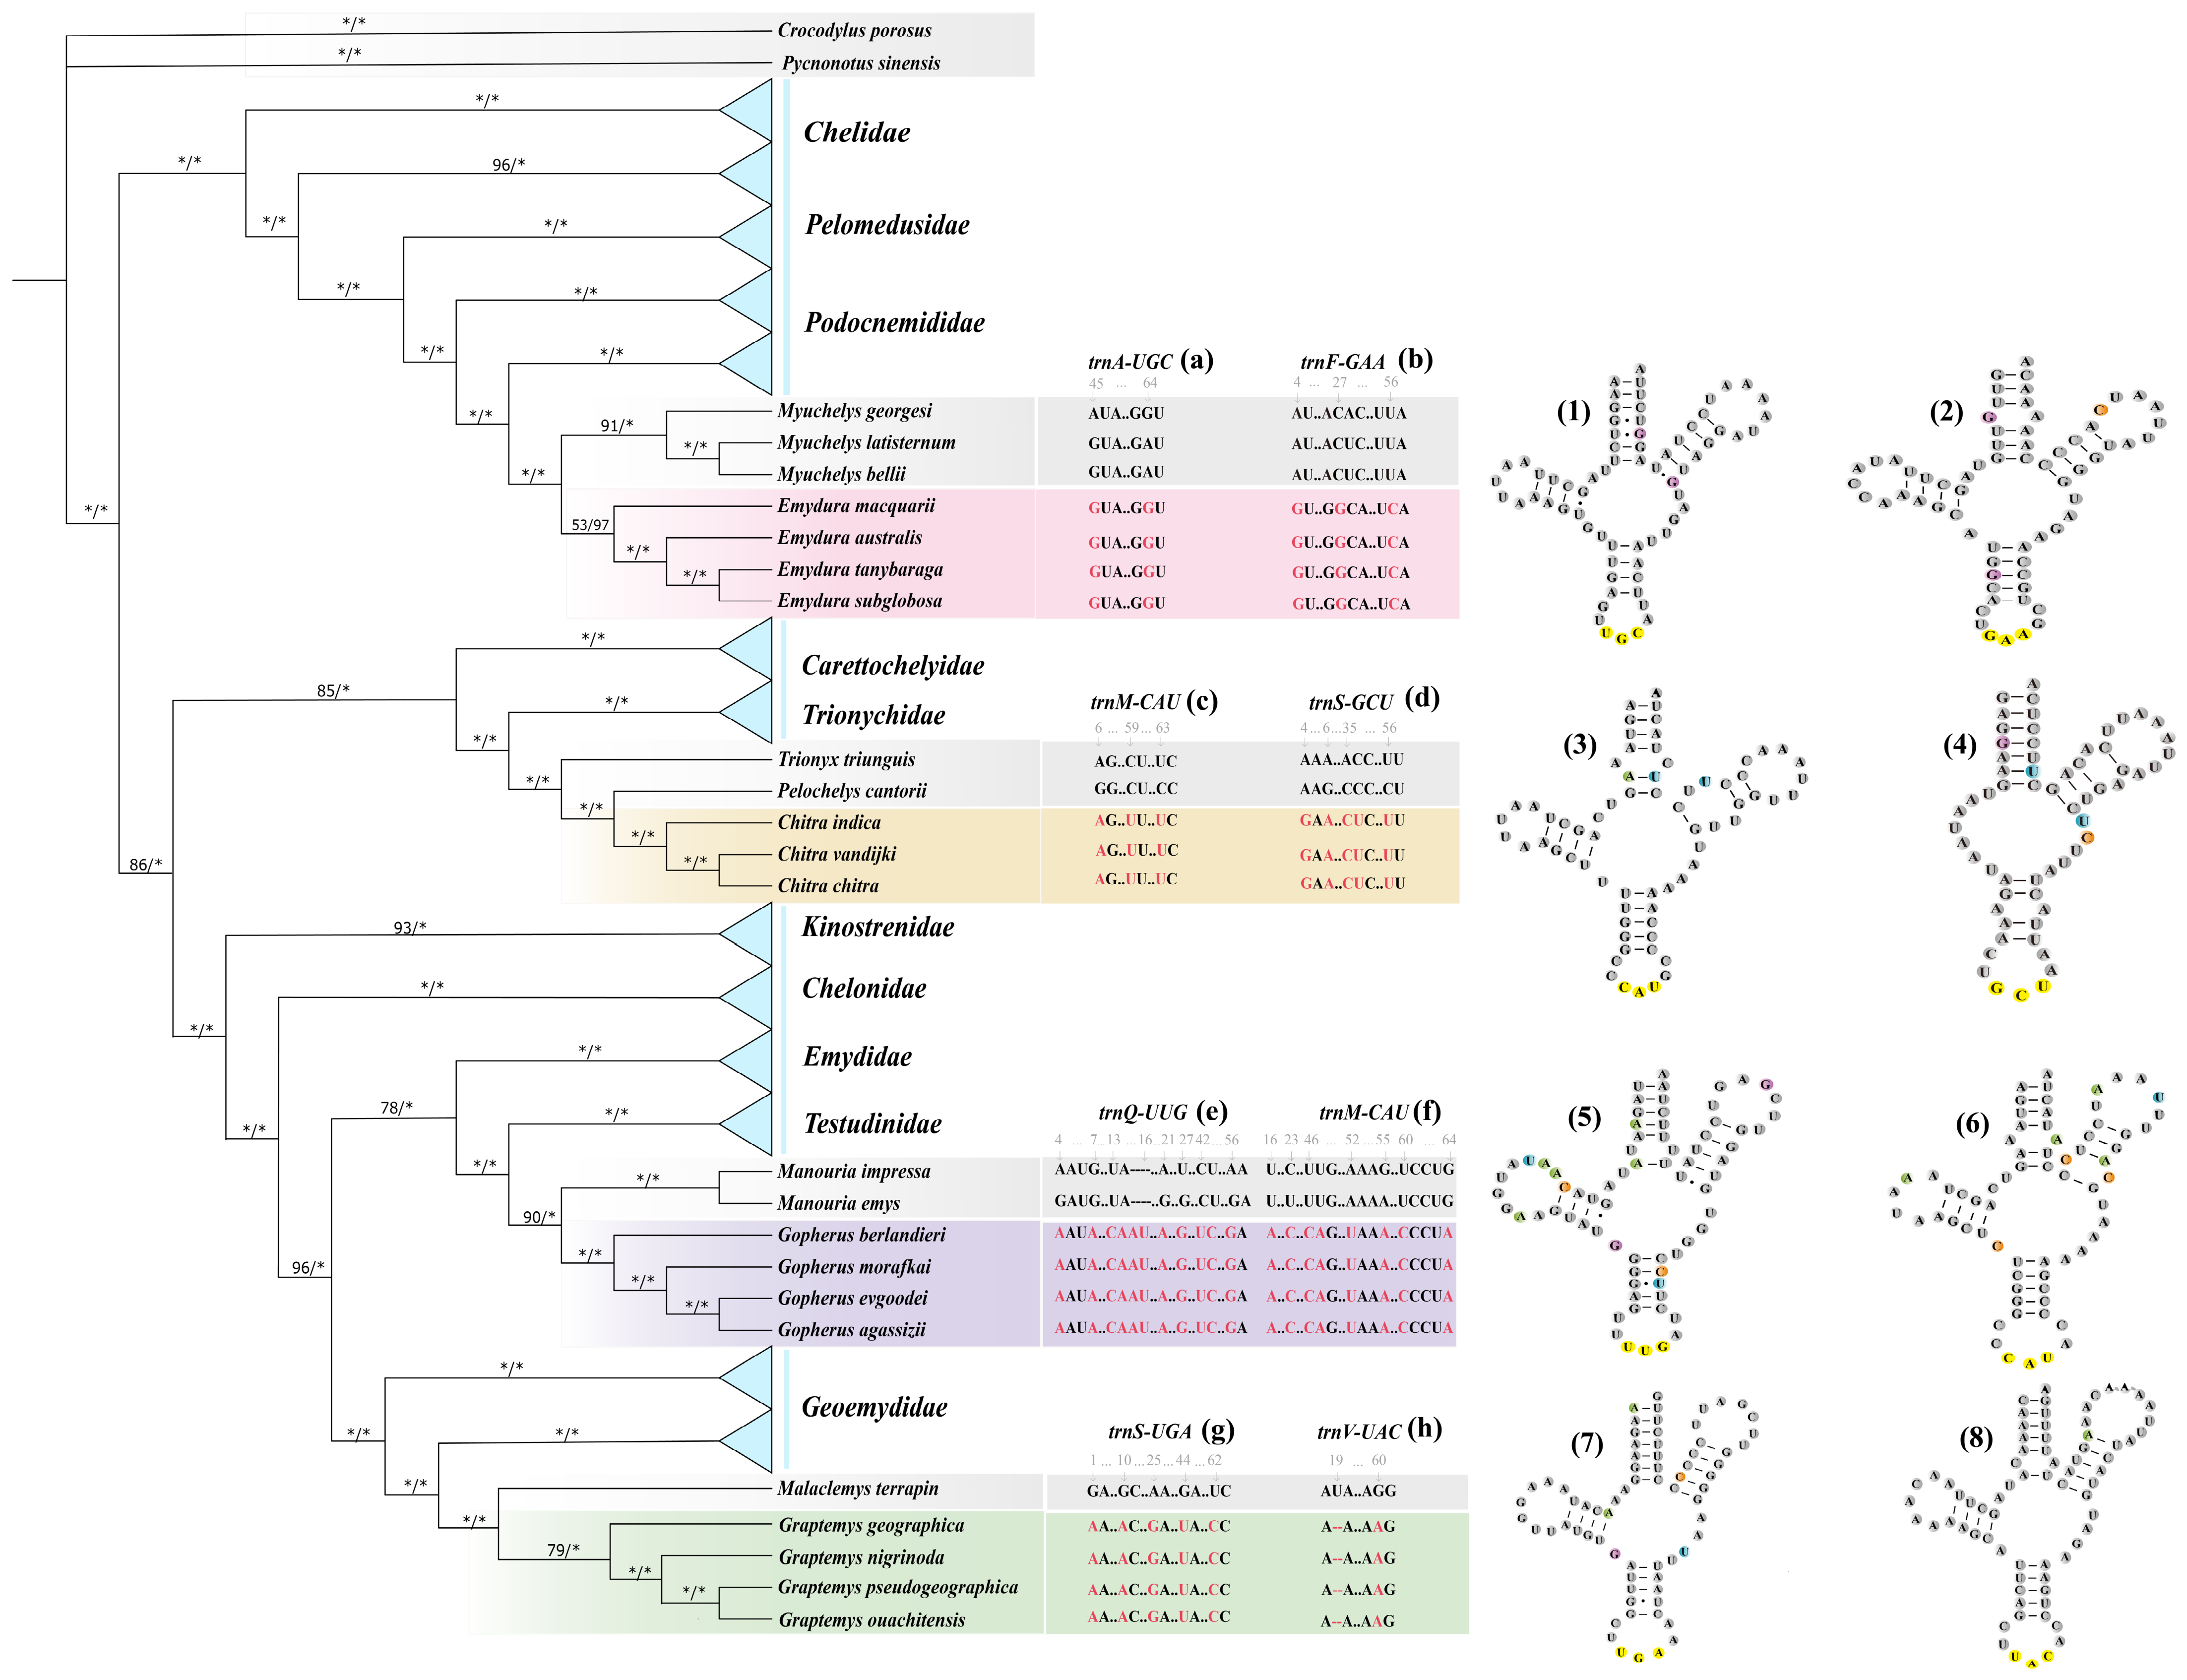
Phylogenetic mapping of tRNA secondary structures identified genus-specific markers in four genera of Testudines (Figure 5). In Emydura, conserved patterns were observed in trnA-UGC and trnF-GAA, including a fixed GU..GGCA..UCA motif in trnF-GAA, which distinguished it from its sister genus Myuchelys. Chitra was characterized by genus-specific patterns in trnM-CAU and trnS-GCU, distinguishing it from Pelochelys and Trionyx. Similar genus-specific motifs were also identified in Gopherus and Graptemys.
Figure 5.
Phylogenetic distribution of genus-specific mitochondrial tRNA markers in Testudines. (Left) Simplified phylogenetic tree showing four target genera (Emydura, Chitra, Gopherus, and Graptemys). The four genera are highlighted in pink, orange, purple, and green, respectively. Node labels indicate ML bootstrap support/BI posterior probability, with asterisks (*) denoting maximum support values (100% or 1.00) in their respective positions. (Middle) Sequence alignments of eight mitochondrial tRNA markers (a–h). Genus-specific substitutions or indels are highlighted in red, with sister clades shown in gray. Numbers above the alignments indicate nucleotide positions. (Right) Predicted tRNA secondary structures of the corresponding tRNAs (1–8). Panels (1–8) correspond sequentially to panels (a–h). Mutation sites are marked by colored circles, and anticodons are highlighted in yellow.
Secondary structure models (Figure 5, right panel) showed that genus-specific SNPs and indels altered arm pairing or loop sizes. These features may serve as molecular markers for distinguishing these taxa.
3.3.2. Evolutionary Rate Variation Among Mitochondrial PCGs
We estimated dN and dS tree lengths for the 13 PCGs using the CodeML M0 model. The dN tree lengths ranged from 1.0549 to 9.0525, whereas the dS tree lengths ranged from 45.2766 to 83.5752 (Table 3). The dN/dS ratios (ω) ranged from 0.01545 (MT-CO1) to 0.19994 (MT-ATP8). All ratios were below 1, indicating purifying selection across the mitochondrial PCGs.
Table 3.
Evolutionary rates of mitochondrial PCGs across testudine species.
3.4. Evolutionary Forces Shaping Codon Usage Bias
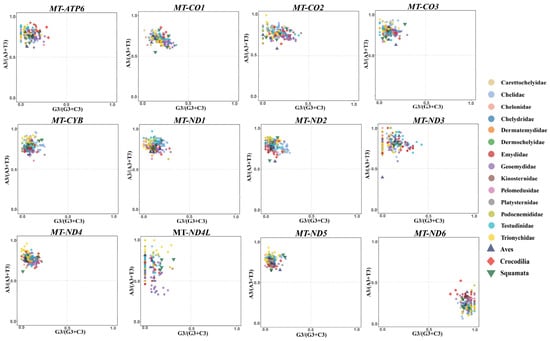
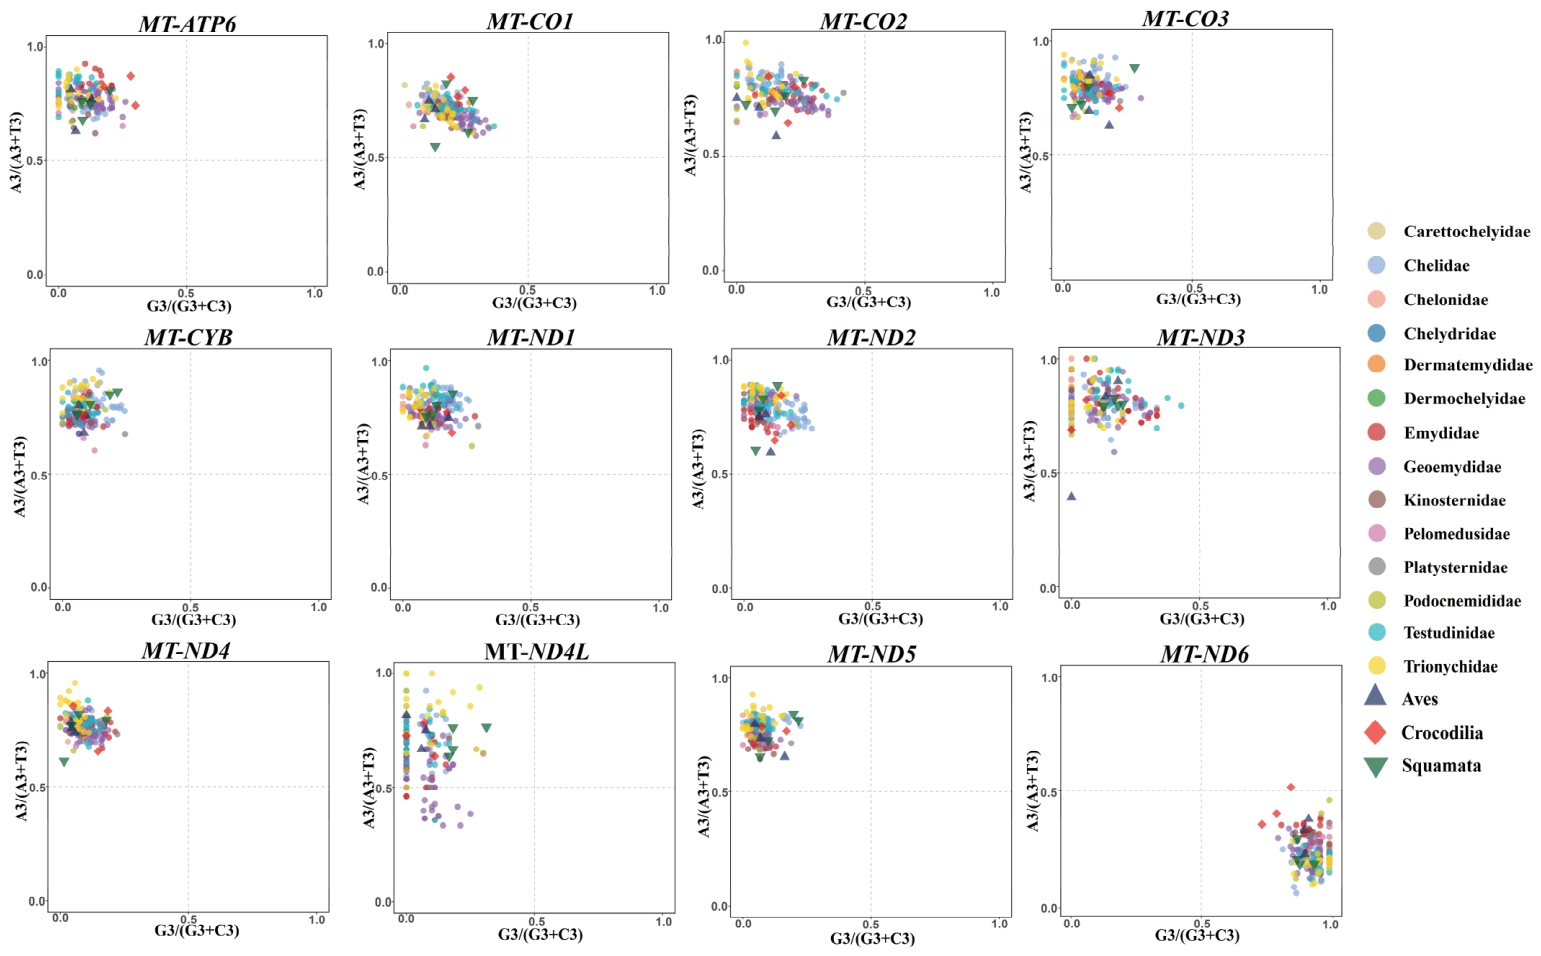
PR2 plots were generated for the 12 mitochondrial PCGs (excluding MT-ATP8 due to its exceptionally short sequence length) using the third positions of four-fold degenerate codons from 170 testudine species and 10 outgroup taxa (Table S2) (Figure 6). For 11 of the 12 PCGs, most points clustered in the second quadrant, away from the center, implying a pronounced enrichment of A/C nucleotides at third codon sites. Such a distribution is consistent with the combined effects of mutation and selection. In contrast, MT-ND6 showed the opposite pattern, with data points clustering within quadrant IV, reflecting a dominant usage of T and G at position three.
Figure 6.
Parity Rule 2 (PR2) bias analysis for 12 mitogenomic PCGs across Testudines. GC-bias [G3/(G3 + C3)] and AT-bias [A3/(A3 + T3)] are mapped along the horizontal and vertical axes, respectively. Every symbol denotes a species, with distinct colors differentiating families.
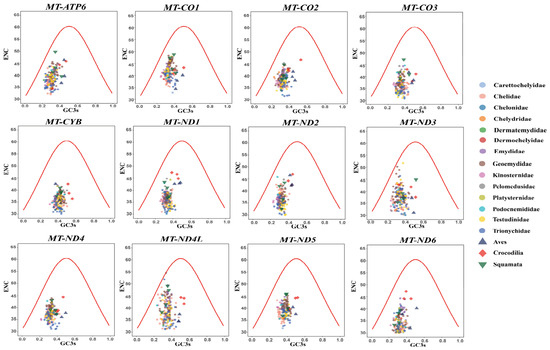
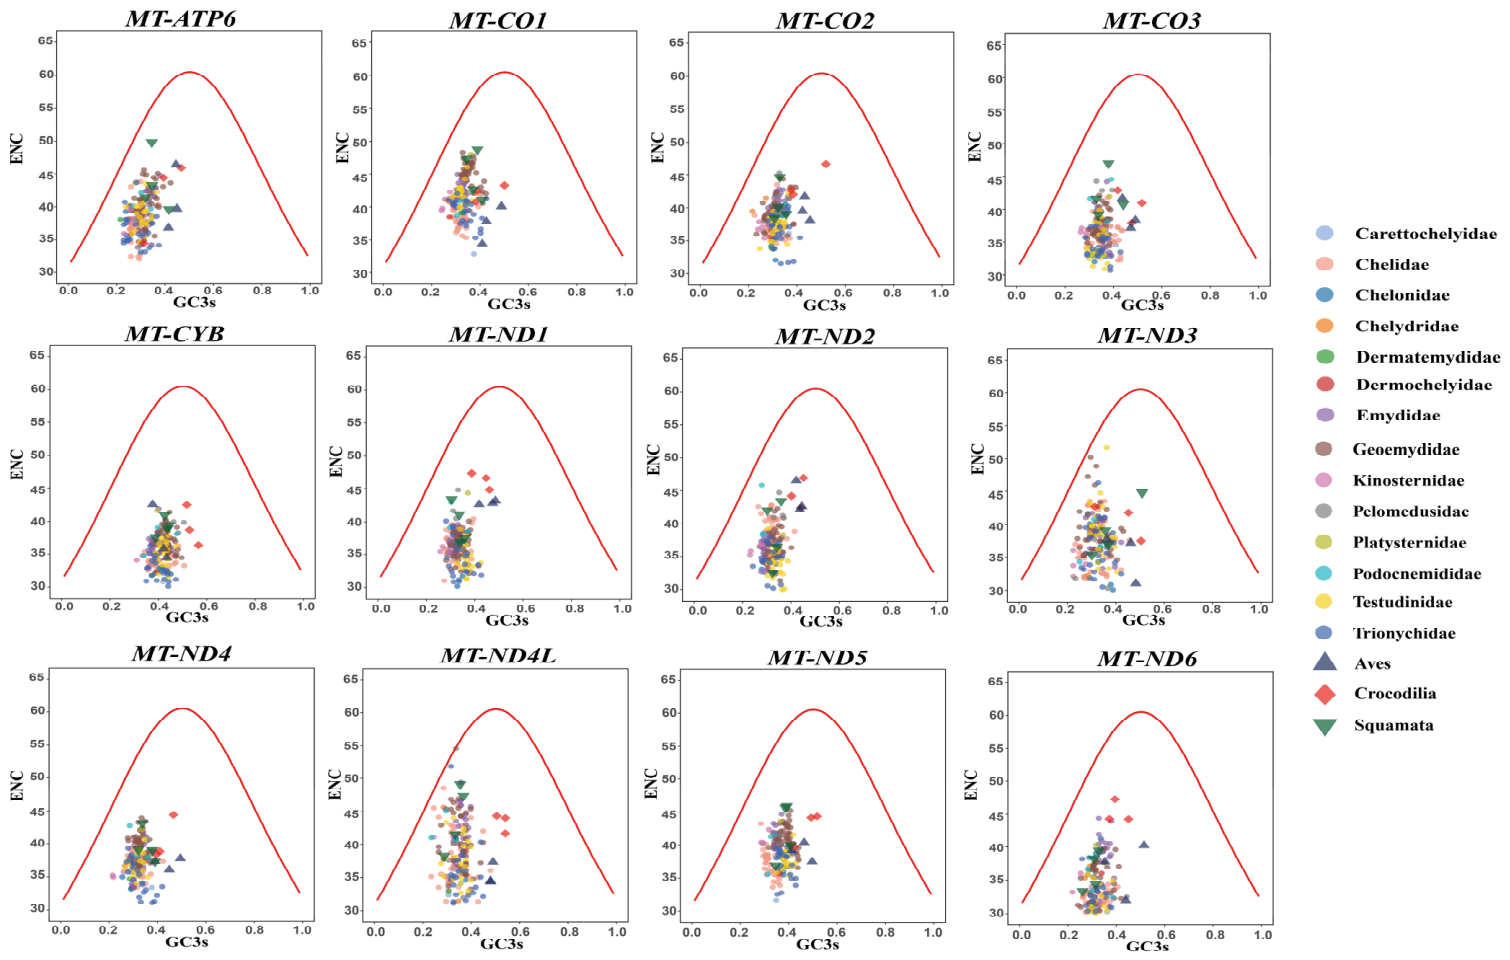
Both ENC and GC3 parameters were derived through CodonW v.1.4.4. To investigate CUB patterns, ENC-GC3s plots were generated, where the theoretical boundary corresponds to pure mutation-driven codon usage (Figure 7). The majority of points fell markedly below this curve.
Figure 7.
ENC–GC3s plots for 12 mitochondrial PCGs in Testudines and outgroups. Points represent individual species, colored by family (Testudines) or shaped by taxon (outgroups). The red curve shows the expected ENC under purely mutational pressure.
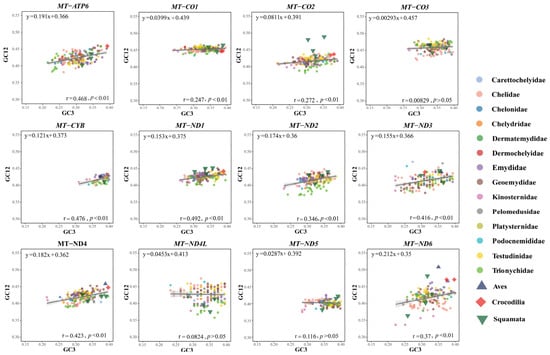
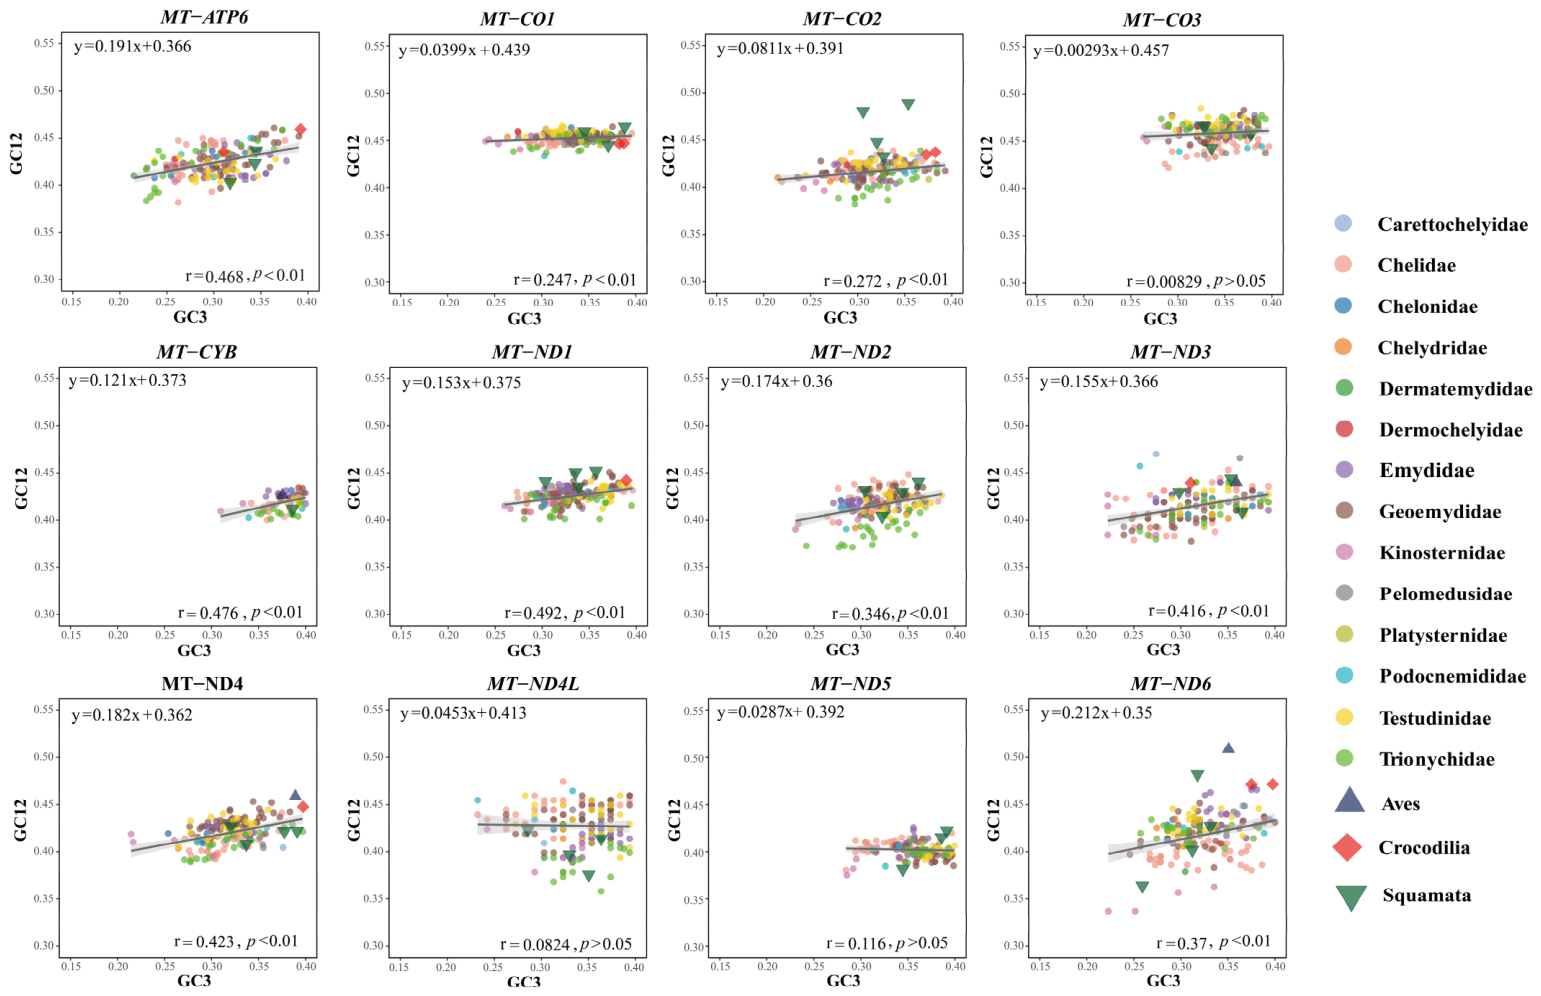
Finally, we evaluated neutrality models by plotting GC12 against GC3 (Figure 8), Estimated slope values varied from 0.00293 for MT-CO3 to 0.212 for MT-ND6. Since all calculated gradients were substantially skewed toward 0 rather than to 1, natural selection exerts a dominant evolutionary force over mutational pressure across mitochondrial PCGs.
Figure 8.
Neutrality plots (GC12 vs. GC3) for 12 mitochondrial PCGs in testudine species and outgroups. Points represent species, colored by family (Testudines) or shaped by taxon (outgroups). Regression lines are fitted to Testudines only.
Across all three analyses, the outgroup taxa (Aves, Crocodilia, and Squamata) largely overlapped with the testudine clusters. Together, these integrated results establish natural selection as the primary factor governing codon usage in Testudines.
3.5. Mitochondrial Phylogenetic Relationships of Testudines
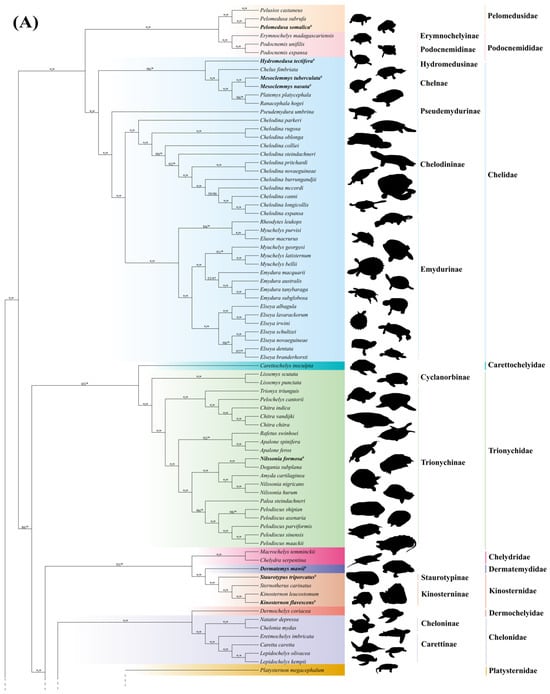
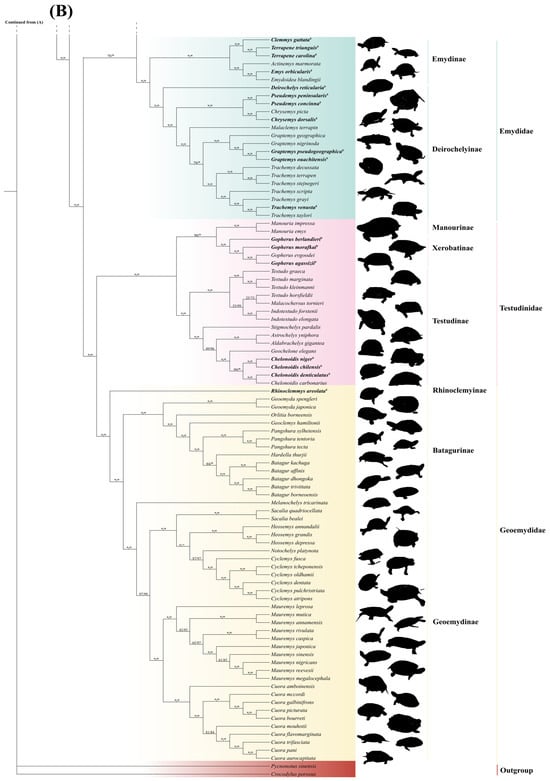
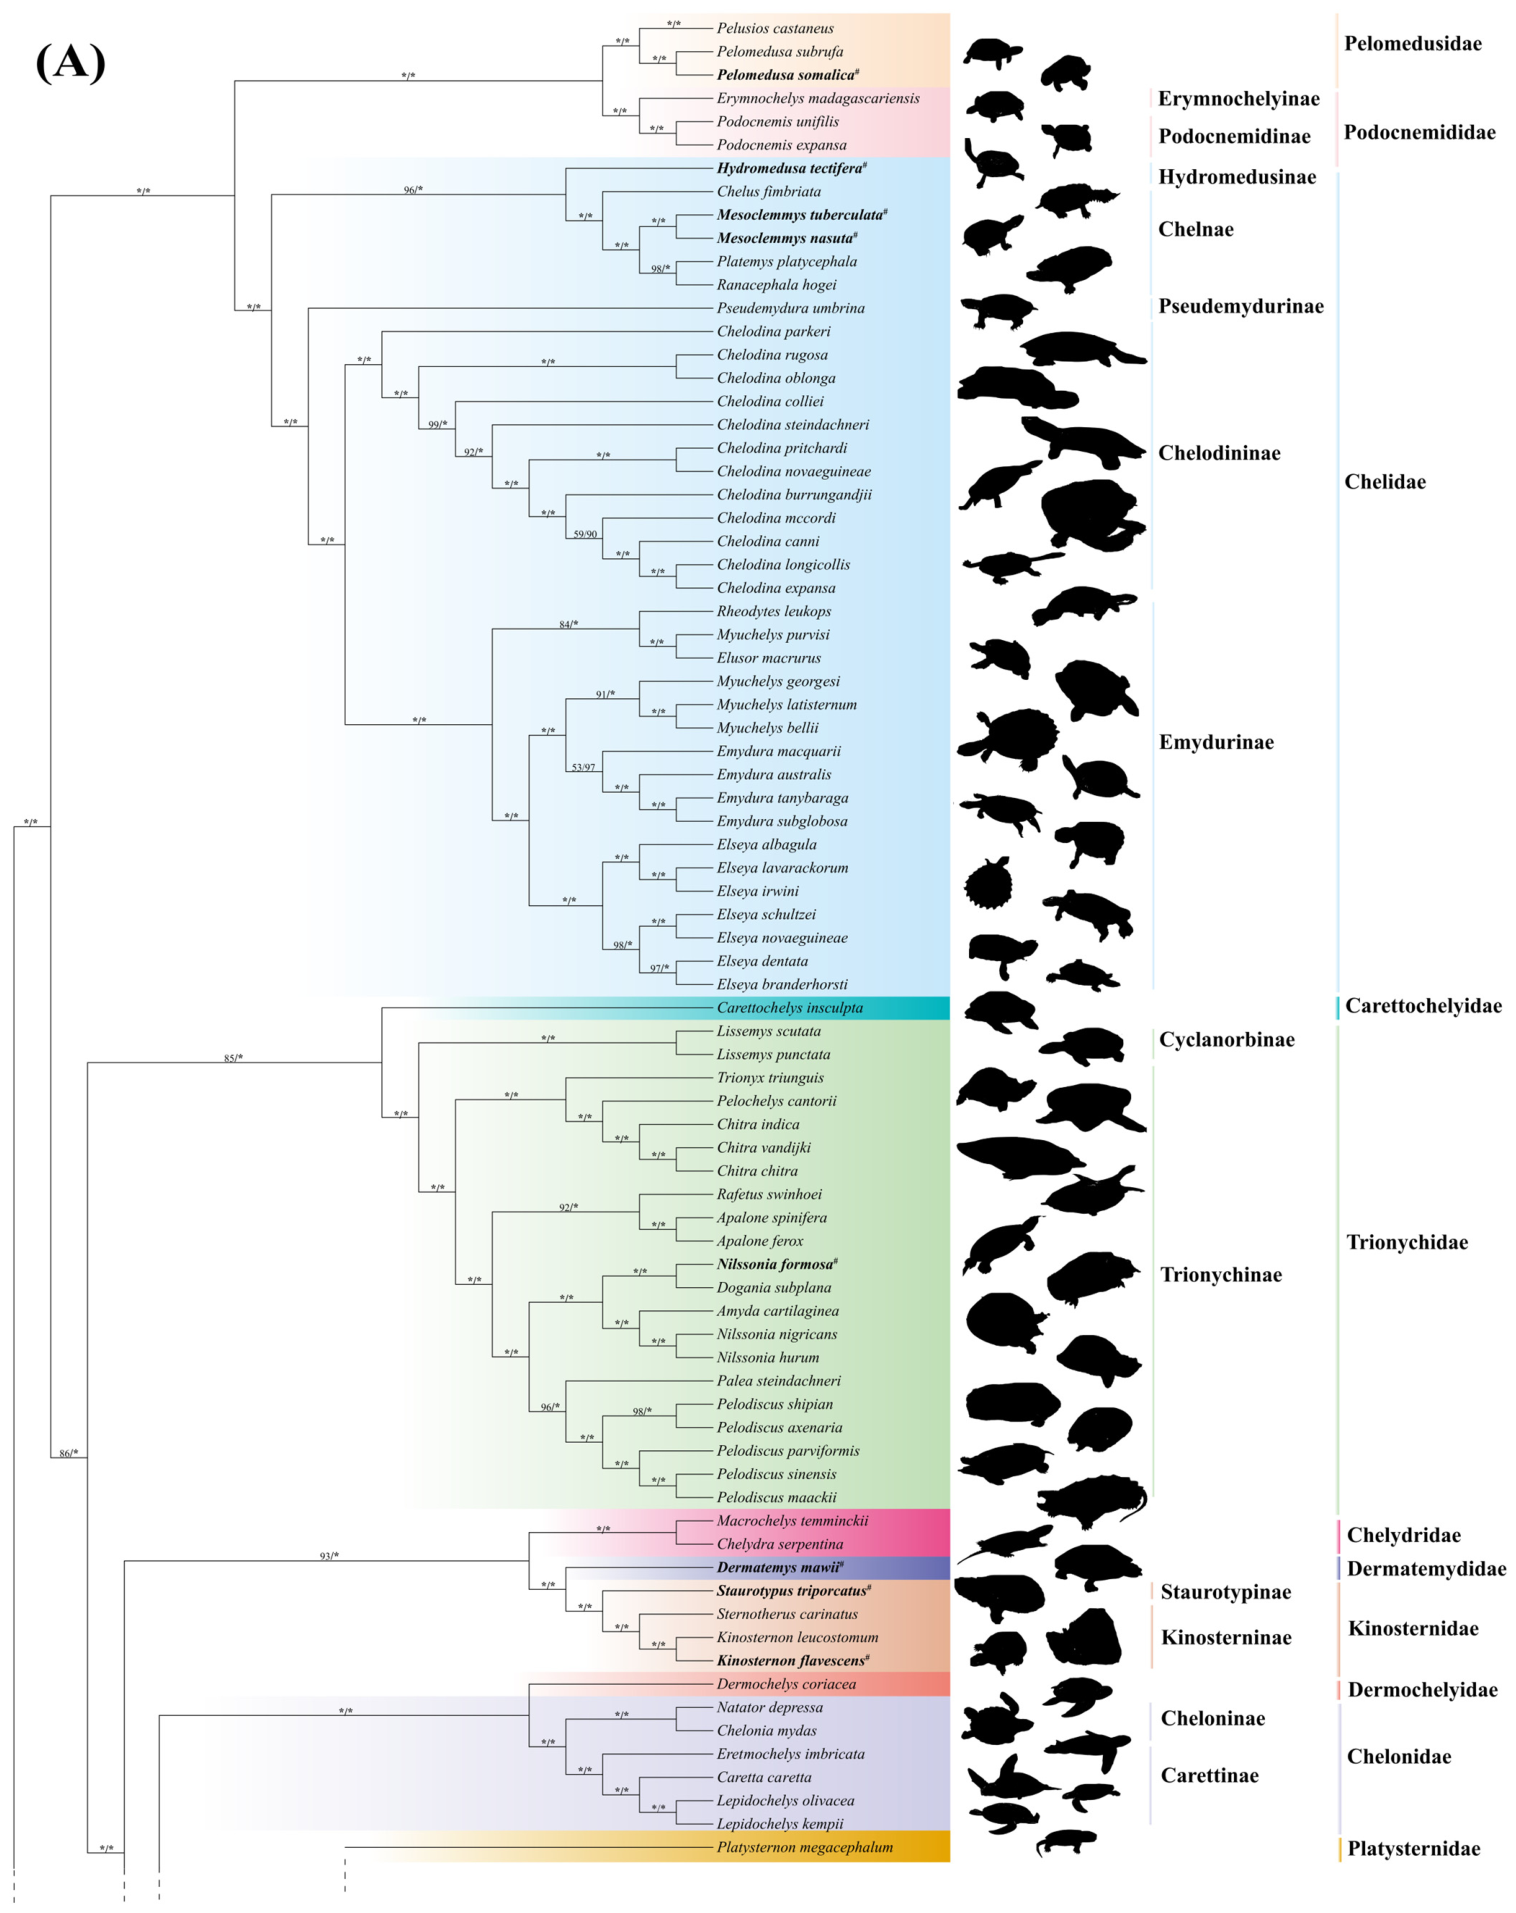
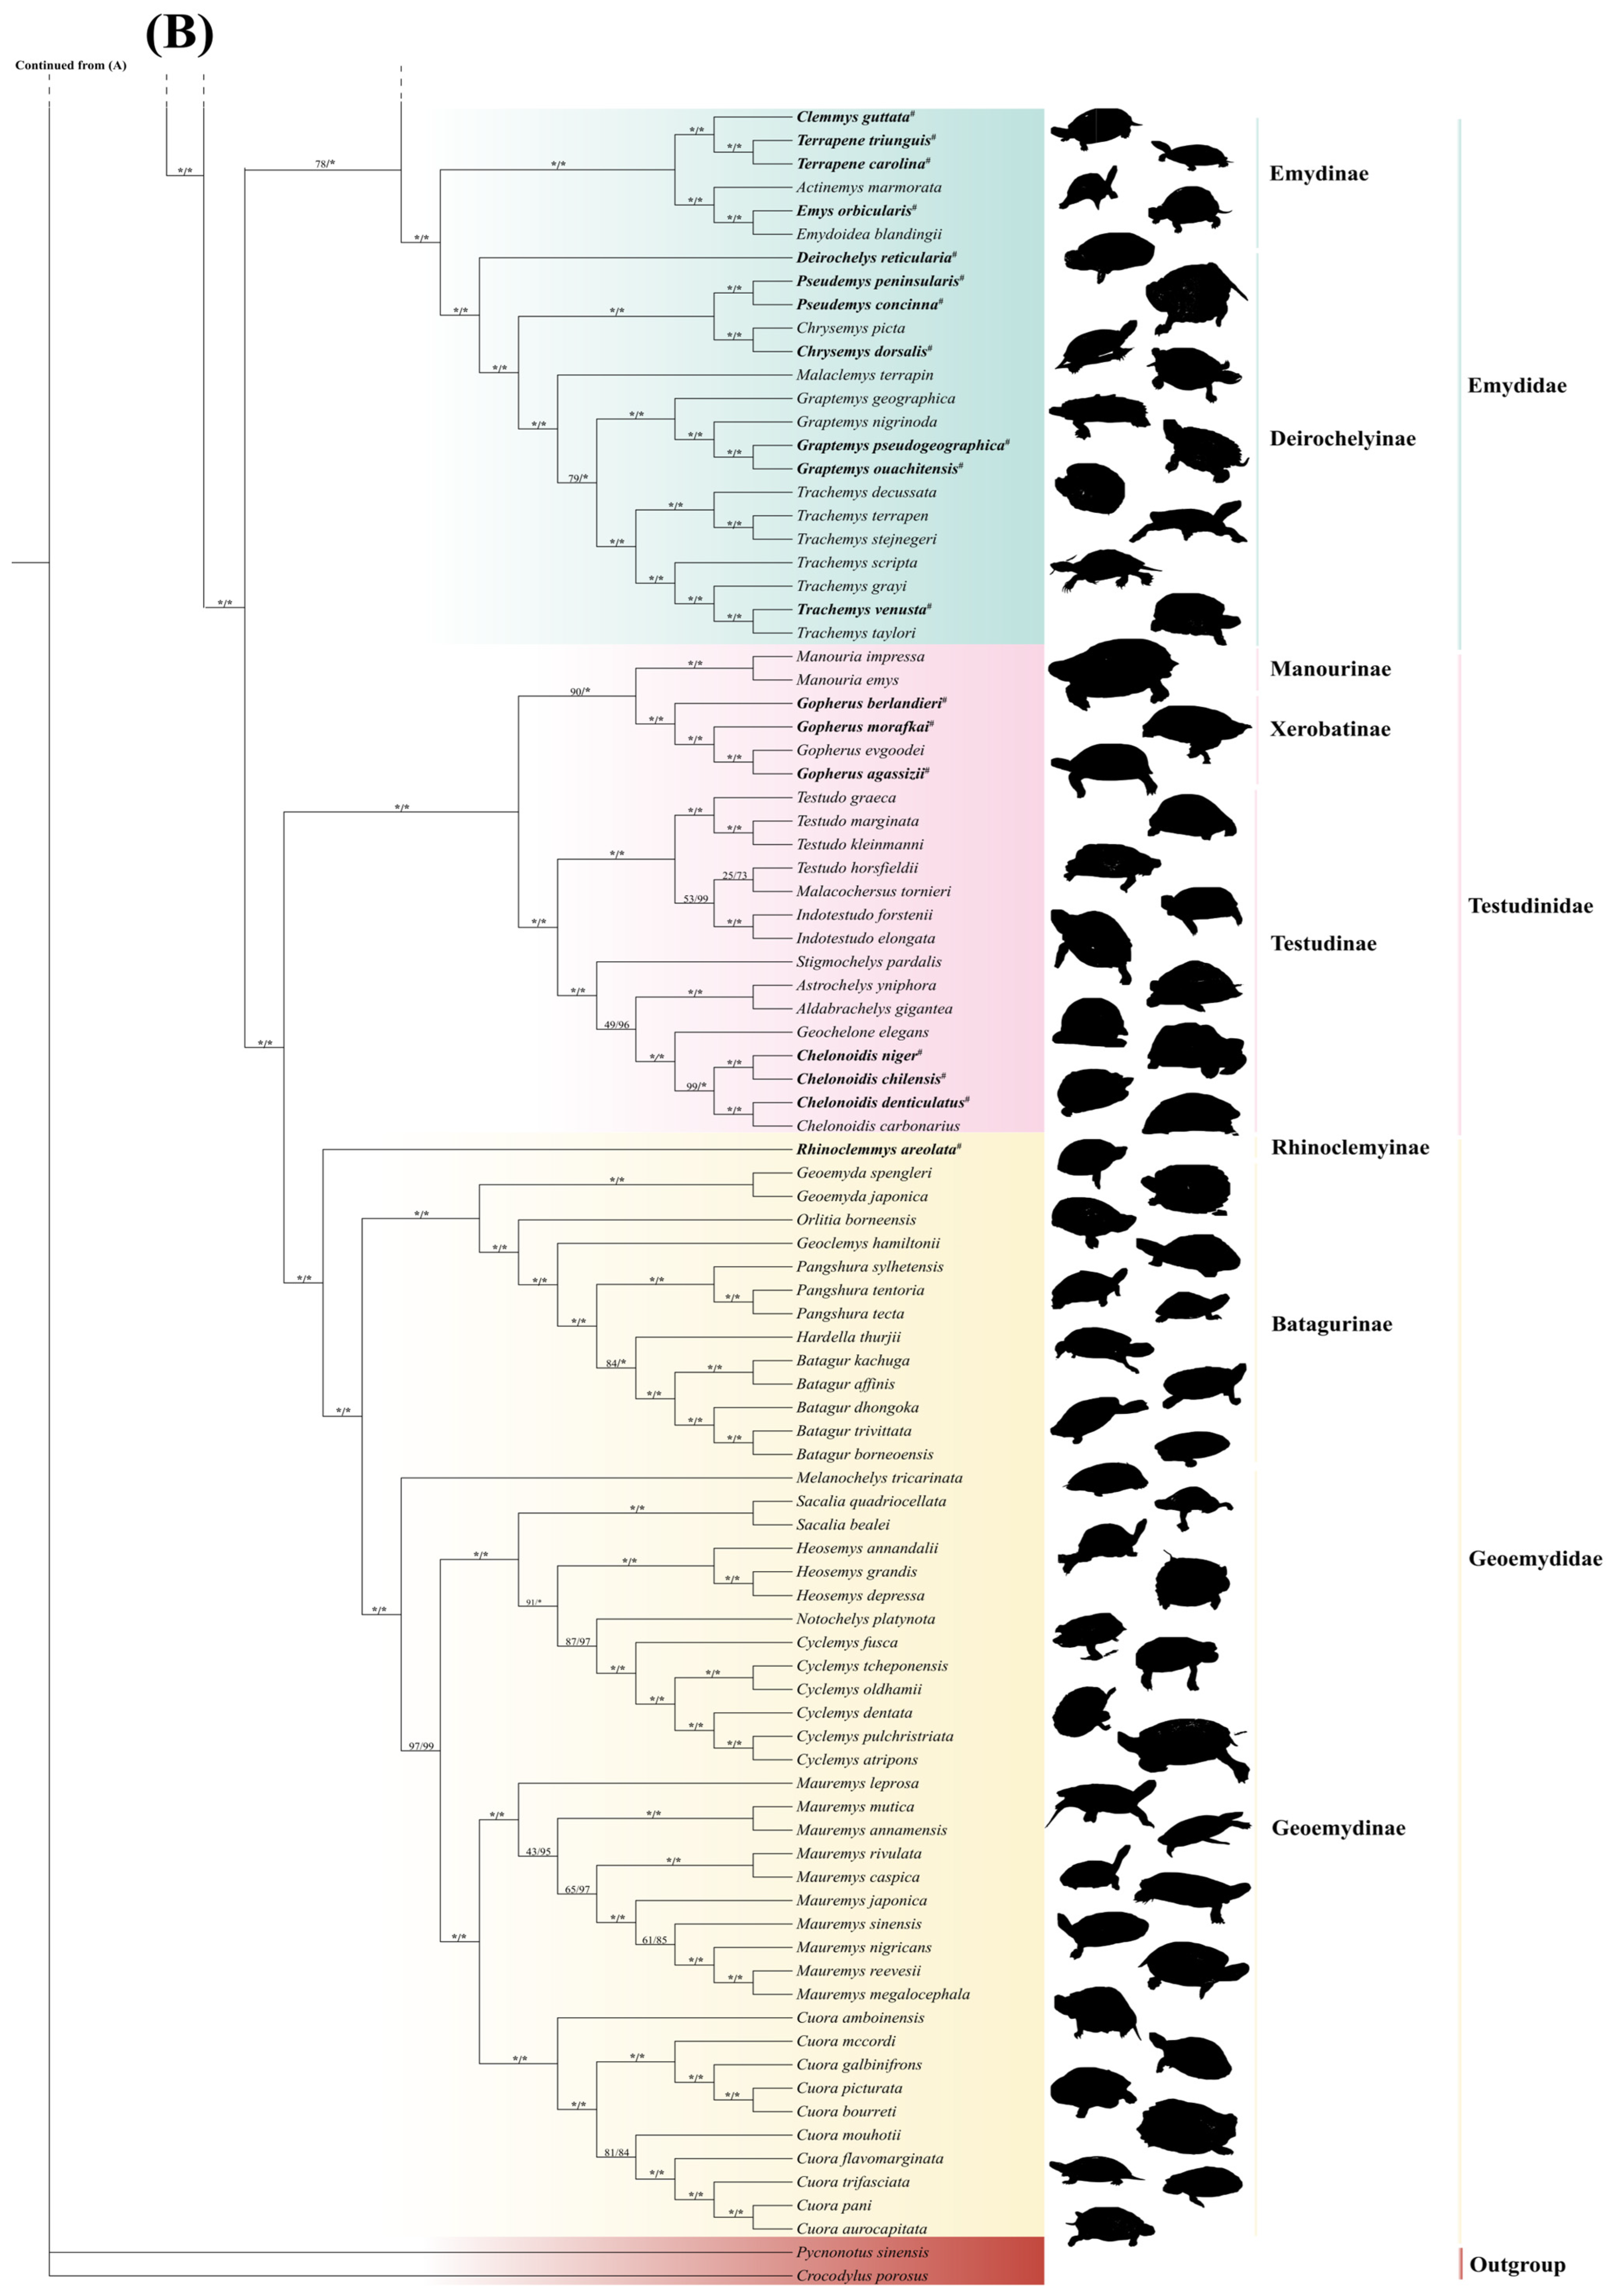
The concatenated dataset of 13 mitochondrial PCGs from 170 testudine species and two outgroups (Crocodylus porosus and Pycnonotus sinensis) was analyzed using ML and BI approaches. The best-fit models were assessed (Table S7). Both ML and BI analyses produced highly consistent topologies (Figure 9). The amino acid-based phylogenetic tree was largely consistent with the nucleotide-based tree and is provided in Supplementary Figure S1.
Figure 9.
Testudines phylogeny reconstructed based on combined nucleotide datasets of 13 mitogenomic PCGs. Both Maximum Likelihood (ML) and Bayesian Inference (BI) approaches yielded identical phylogenetic frameworks. (A) The first segment of the phylogenetic tree. (B) The subsequent segment of the same tree continued from panel (A). Nodal support values denote ML bootstrap frequencies and Bayesian posterior probability metrics, respectively (ML/BI). Different background colors represent different turtle families. The asterisk (*) indicates full node support (ML bootstrap = 100, BI posterior probability = 1.00). The hash (#) indicates sequences newly assembled in this study.
Our phylogenetic trees provided strong support for the monophyly of Testudines, recovering two major clades corresponding to Pleurodira and Cryptodira (BS = 100, PP = 1.00). Pleurodira comprises all extant side-necked turtles characterized by lateral neck retraction [52]. Within the suborder Pleurodira, Pelomedusidae and Podocnemididae formed a highly supported clade, whereas Chelidae formed another well-supported lineage (BS = 100, PP = 1.00). The mitochondrial phylogeny recovered Mesoclemmys hogei as distinct from the core Mesoclemmys clade, instead forming a sister group with Platemys platycephala with high support (BS = 98, PP = 1.00). This topology supports the previous proposal to recognize M. hogei as the monotypic genus Ranacephala. Within the subfamily Emydurinae, the genus Myuchelys was recovered as non-monophyletic. The three core species of the genus (M. georgesi, M. latisternum, and M. bellii) clustered together to form a monophyletic clade (BS = 91, PP = 1.00). In contrast, M. purvisi did not cluster with these species but instead formed a distinct clade with Rheodytes and Elusor (BS = 84, PP = 1.00).
Within Cryptodira, four major clades were robustly supported (BS = 100, PP = 1.00). One major clade corresponded to the superfamily Testudinoidea, which includes the families Platysternidae, Emydidae, Testudinidae, and Geoemydidae. Within this superfamily, Testudinidae and Geoemydidae clustered together as sister taxa, whereas Platysternidae and Emydidae formed another sister relationship. The superfamily Trionychia, including Trionychidae and Carettochelyidae, formed another well-supported clade (BS = 85, PP = 1.00). The superfamily Chelonioidea, which comprises the sister taxa Cheloniidae and Dermochelyidae, formed a strongly supported clade (BS = 100, PP = 1.00). Finally, Chelydridae, Dermatemydidae and Kinosternidae clustered together to form the fourth major clade.
Within the Trionychinae clade, the mitochondrial phylogeny recovered Nilssonia as non-monophyletic. Specifically, N. formosa did not cluster with its congeners (N. nigricans and N. hurum). Instead, N. formosa occupied a relatively basal position, with Dogania subplana and Amyda cartilaginea between it and the remaining Nilssonia species. Thus, based on the mitochondrial evidence, the traditional genus Nilssonia was recovered as paraphyletic. A similar non-monophyletic pattern was observed within Testudinidae for the genus Testudo. Specifically, T. horsfieldii was separated from the core clade containing T. graeca, T. marginata, and T. kleinmanni. Instead, T. horsfieldii clustered with the Malacochersus tornieri with very low node support (BS = 25, PP = 0.73). In addition, several basal nodes within Testudinidae, including relationships involving Stigmochelys, Astrochelys, and Aldabrachelys, showed relatively low support values (BS = 49–53, PP = 0.96–0.99).
4. Discussion
In this study, we analyzed mitogenomes from 170 testudine species representing 14 families, including 26 newly assembled mitogenomes, to examine patterns of mitochondrial evolution across Testudines. By combining newly generated and published sequences, we compared codon usage, codon aversion patterns, and tRNA secondary structures across this taxonomically broad dataset. Our results showed that testudine mitogenomes in turtles exhibit conserved compositional features but also display lineage-associated variation in codon usage and structural characteristics, suggesting that these molecular features may provide useful information for mitochondrial structural evolution and molecular diversity across turtle lineages.
Nucleotide composition analyses revealed a strong AT bias (GC < 41%) across all 14 testudine families. This pattern is widely observed in vertebrate mitochondrial genomes [53] and is primarily driven by asymmetric mutational pressure during mitochondrial replication [54,55]. The positional GC gradient (GC1 > GC2 > GC3) reflects heterogeneous selective constraints among codon positions. GC1 and particularly GC2 are under strict purifying selection to maintain protein function. In contrast, the relatively relaxed constraints on GC3 allow substitutions to accumulate more readily, yielding lower GC content [46,54,56,57]. Notably, Kinosternidae exhibited the lowest GC3 content (27.72%) among all families and represents the only lineage falling below 30%. This pronounced reduction in GC3 suggests that the evolutionary forces acting on synonymous sites may differ in this lineage, although the relative contributions of mutation and selection remain unclear and warrant further investigation.
The mean ENC values for the 12 mitochondrial PCGs across Testudines ranged from 33.62 to 41.53, reflecting a moderate overall CUB [36]. These inter-genic and inter-familial variations are probably due to differences in functional constraints and strand-specific mutational processes during mitochondrial replication. Notably, MT-CO1 exhibited the highest ENC value (41.53), implying minimal CUB. As a core component of the respiratory chain, MT-CO1 is highly conserved and generally subject to strong purifying selection [58,59]. MT-ND6 consistently showed low ENC values across all families, indicating a strong codon bias. This pattern is likely associated with the asymmetrical replication of vertebrate mitogenomes. Among the 13 PCGs, MT-ND6 is the only gene encoded on the light strand (L-strand) [60,61]. As the L-strand remains single-stranded during replication, it experiences distinct mutational pressures that may contribute to the characteristic codon usage pattern of MT-ND6 [54,62,63].
An analysis of RSCU values across 170 testudine species yielded values ranging from 0 to 3.58, providing a broad overview of codon usage variation [64]. Although the overall CUB patterns were highly conserved across families, several codons showed pronounced lineage-specific biases. For example, the CTA codon (Leucine) in Chitra vandijki reached an RSCU value of 3.58, representing one of the strongest biases detected in this dataset. These extreme preferences are likely shaped by both directional mutation pressure and translational selection [46]. At the family level, clustering analysis of RSCU values revealed that Carettochelyidae formed an independent cluster, whereas the remaining 13 families exhibited highly similar CUB patterns. This aligns with the ENC analysis, where Carettochelyidae consistently showed the lowest ENC values across all genes (indicating the strongest bias), whereas Platysternidae had the highest ENC values (lowest bias). Because Carettochelyidae is the sole extant survivor of its lineage, this distinctive codon usage profile may reflect a long, independent evolutionary history coupled with lineage-specific mutational processes, although its precise biological significance remains to be clarified.
Previous studies have proposed codon aversion as a novel phylogenetic feature and molecular marker in birds and plant groups [8,20,21]. Building upon this framework, our study is the first to apply this approach at the species level within the order Testudines. Our analysis of CAMs identified 21 unique codons capable of distinguishing species within our dataset. Furthermore, species such as Clemmys guttata, Pseudemydura umbrina, Rafetus swinhoei, and Trionyx triunguis can be identified through combinatorial CAM patterns across two different genes. Therefore, we propose that CAMs could serve as potential molecular markers for species-level identification within Testudines. However, while codon aversion events were detected in all 170 species, only 17 species possessed species-specific CAMs, and no clear genus- or family-level patterns were recovered. These findings suggest that CAMs currently hold limited value for resolving deep phylogenetic relationships within this order. Our identification of species-specific CAMs is based on 170 testudine mitogenomes. Because population-level sampling was not available, intraspecific variation cannot be completely excluded. Population-level studies will be needed to confirm the consistency of these species-specific CAMs.
Mitochondrial tRNAs are fundamental for synthesizing the proteins required for oxidative phosphorylation [65,66]. In this study, most tRNAs folded into the typical cloverleaf secondary structure, except for trnS-GCU, which lacks the stem of the DHU arm. This truncation is a well-documented phenomenon in metazoan (especially vertebrate) mitochondrial genomes and has been experimentally proven to remain functional during translation [22,25,67,68,69,70,71]. Furthermore, structural conservation differs greatly across tRNA domains. The AC-loop retains a fixed length of seven nucleotides with minimal conformational variation. Its stable structure is critical for precise matching with mRNA codons, reflecting strong purifying selection on the region [24,72]. Conversely, the D-loops and T-loops interact to maintain the tRNA’s tertiary L-shaped fold. Because they are under weaker evolutionary constraints, these regions readily accumulate SNPs and indels, resulting in high conformational diversity (e.g., 117 D-loop conformations in trnW-UCA) [69]. At the functional level, structural variations such as D-arm loss in trnS-GCU do not appear to affect mitochondrial tRNA function. Previous studies suggest that atypical mitochondrial tRNAs can be recognized and used for protein translation through specialized mechanisms [73,74].
From a phylogenetic perspective, we observed a distinct genus-level pattern in the secondary structures of mitochondrial tRNAs within four genera (Emydura, Chitra, Gopherus, and Graptemys). Within these groups, structures are highly conserved and nearly identical among congeneric species, yet display clear diagnostic differences between genera [75,76]. While strong purifying selection maintains the overall functional stability of tRNA structures, the long-term independent evolution of each clade has allowed stable, genus-specific modifications to accumulate [77,78,79]. Consequently, these structural variations possess potential as molecular biomarkers for genus-level taxonomic identification [80]. Although the tRNA secondary structures were computationally predicted, which consistent with the conserved cloverleaf topology of vertebrate mitochondrial tRNAs, including the absence of the D-arm in trnS-GCU. The predicted structures were also highly consistent with previously reported structures [75,81,82]. Nevertheless, experimental validation is needed to confirm these predictions.
The consistently low dN/dS ratios (all < 0.2) indicate that the 13 PCGs are under strong purifying selection to conserve their amino acid sequences. This suggests that these genes are indispensable for core life processes such as oxidative phosphorylation, whose functional integrity is important for energy homeostasis [83,84].
To explore the drivers of CUB, several theoretical models have been proposed, including the neutral theory [85], the expression regulation theory [86], and the selection–mutation–drift (SMD) model [87]. Among these, the SMD theory has gained the most support in recent years, integrating the effects of selection, mutation, and drift to explain the adaptiveness of codon usage [14,87,88]. In our analysis of testudine mitogenomes, we demonstrate that CUB is predominantly driven by natural selection.
This conclusion is supported by three independent graphical analyses. First, the PR2 bias plot shows that most points fall into the second quadrant and deviate from the central axis, indicating a strong AC bias stemming from compositional asymmetry and mutational pressure during replication [43]. Second, in the ENC–GC3s plot, a standard metric to distinguish between natural selection and mutational bias as the primary drivers of CUB patterns [36,89], the majority of points fall markedly below the expected curve. Third, the neutrality plot analysis shows that the slopes of GC12 versus GC3 (ranging from 0.00293 to 0.212) are nearly 0. Because natural selection on codon usage is known to improve the accuracy and efficiency of translation [14], these combined results robustly support the conclusion that natural selection plays a dominant role in shaping codon usage patterns in testudine mitogenomes [90].
Our robust phylogenetic tree based on the 13 mitochondrial PCGs strongly supports the monophyly of the order Testudines. This finding is highly consistent with previous research combining morphological and molecular evidence to recover Testudines as a monophyletic group comprising 14 recognized families [3,7], confirming that mitochondrial genomes are reliable for resolving large-scale phylogenetic relationships across this order. Importantly, our reconstruction successfully resolved historically debated deep nodes within the suborder Cryptodira. The phylogenetic placement of the snapping turtles (Chelydridae) has long been a source of conflict between morphological and molecular datasets. Our supermatrix analysis decisively places Chelydridae in a well-supported clade with Dermatemydidae and Kinosternidae, corroborating recent phylogenomic hypotheses. Furthermore, our topology confirms the sister-group relationships between Testudinidae and Geoemydidae, as well as between Platysternidae and Emydidae within the superfamily Testudinoidea. These results demonstrate that comprehensive taxon sampling, combined with the strong phylogenetic signal of the 13 PCGs, provides sufficient resolution to clarify deep and rapid diversification events in turtle evolutionary history.
Within the suborder Pleurodira, our results resolve several taxonomic debates at the genus level, particularly within Chelidae. Within Chelinae, the tree topology showed that Mesoclemmys hogei separated from the core Mesoclemmys clade and did not cluster with other congeneric species. Instead, it formed a sister group with Platemys platycephala with high node support. Therefore, our phylogenetic results strongly support the previous proposal to restore this species to the independent monotypic genus Ranacephala [3,91,92,93]. Within Emydurinae, our mitochondrial tree recovers Myuchelys as non-monophyletic, with M. purvisi clustering with Rheodytes and Elusor. Although this findings aligns with earlier proposals to place M. purvisi in a separate genus, Wollumbinia [94], it conflicts with recent phylogenomic evidence. Many studies using nuclear genes and ultraconserved elements (UCEs) have strongly supported the monophyly of Myuchelys. The cytonuclear discordance observed in our dataset, is likely driven by ancient mitochondrial introgression events [94,95,96]. Thus, while our mitochondrial phylogeny provides additional molecular evidence regarding the evolutionary history of Australasian short-necked turtles, it ultimately agrees with the current taxonomic consensus that retains M. purvisi within the genus Myuchely [7].
Consistent with the pattern in Australasian short-necked turtles, our mitochondrial tree shows that both Nilssonia (Trionychidae) and Testudo (Testudinidae) are non-monophyletic. N. Formosa is located in a basal position relative to other Nilssonia, and T. horsfieldii did not cluster with the core clade of its genus. However, recent nuclear genomic studies and the current taxonomic consensus strongly support the monophyly of both genera [3,7]. The cytonuclear discordance is common in softshell turtles and tortoises [97,98] and is generally attributed to frequent incomplete lineage sorting (ILS) and ancient mitochondrial introgression during the early rapid radiation of these lineages [95,98,99,100]. The low support values at the basal nodes of Testudinidae also confirm an early burst of rapid diversification.
5. Conclusions
This study provides a comprehensive evolutionary analysis of 170 Testudines mitogenomes, including 26 newly assembled sequences, to improve taxonomic sampling and investigate mitogenome evolution across 14 families. Our results revealed a strong AT-biased codon usage pattern with significant inter-familial variation. Multiple analyses indicated that natural selection was the primary force shaping codon usage bias, whereas mutational pressure played a limited role. Phylogenetic analyses based on the 13 mitochondrial PCGs resolved major evolutionary relationships within Testudines and clarified several debated familial placements. Crucially, we identified species-specific CAMs and genus-diagnostic tRNA secondary structure features as potential molecular indicators for investigating evolutionary dynamics. Overall, this study provides a large-scale mitogenomic resource for turtles and highlights the potential of codon usage patterns and tRNA structural diversity for comparative evolutionary genomics and mitochondrial diversity studies in Testudines.
Supplementary Materials
The following supporting information can be downloaded at https://www.mdpi.com/article/10.3390/d18090563/s1, Table S1: The SRA accession numbers of testudine species; Table S2: List of the mitogenomes of Testudines and outgroups involved in this study; Table S3: Nucleotide compositions of the mitogenomes among Testudines involved in this study; Table S4: Species-level RSCU values of codons among Testudines; Table S5: Length statistics of tRNA genes and their secondary structural regions. Values represent the number of base pairs (bp) for stem/arm regions, and the number of nucleotides (nt) for loop and variable regions; Table S6: Conformation counts of tRNA genes and their secondary structural regions; Table S7: The best fit Bayesian evolutionary models in the mitogenomic dataset. Figure S1: Maximum-likelihood phylogeny inferred from concatenated amino acid sequences of 13 mitochondrial PCGs to assess nucleotide compositional bias.
Author Contributions
Conceptualization, X.K. and B.Z.; methodology, M.Z. and D.B.; software, M.Z., C.X., X.C., and S.H.; validation, C.X., X.C., H.P., and C.D.; formal analysis, M.Z., D.B. and Y.X.; investigation, C.X., X.C., H.P. and W.G.; resources, J.Y. and C.D.; data curation, M.Z., D.B. and J.Y.; writing—original draft preparation, M.Z., D.B. and Y.X.; writing—review and editing, X.K. and B.Z.; visualization, M.Z.,Y.X. and C.X.; supervision, X.K. and B.Z.; project administration, W.G. and X.K.; funding acquisition, S.H., W.G. and X.K. All authors have read and agreed to the published version of the manuscript.
Funding
This research was funded by the Anhui Provincial Rural Revitalization Collaborative Technical Service Center, China (Grant No. KF202402); the 2024 Annual Provincial Quality Engineering Project of New Era Talent Cultivation (Graduate Education) (Grant No. 2024xscx035); and the Department of Education of Anhui Province (Key Project on Natural Science) (Grant No. 2024AH052014). The APC was funded by the Anhui Provincial Rural Revitalization Collaborative Technical Service Center, China (Grant No. KF202402).
Institutional Review Board Statement
Not applicable.
Data Availability Statement
The data presented in this study are openly available in public repositories. The 144 previously published mitogenome sequences analyzed in this study were retrieved from the NCBI database. The 26 newly assembled mitogenome sequences generated in this study have been deposited in two public repositories. Eleven sequences are available in the GenBank database under accession numbers BK072074–BK072084 (Third Party Annotation, TPA), and the remaining 15 mitogenome sequences are deposited in GenBase (Accession Nos. C_AA491306.1–C_AA491320.1; https://ngdc.cncb.ac.cn/genbase (accessed on 30 July 2026)). Detailed accession numbers and relevant species information for all 170 mitogenomes used in this study are provided in Table S2 of the Supplementary Materials.
Conflicts of Interest
The authors declare no conflicts of interest.
References
- Gable, S.M.; Byars, M.I.; Literman, R.; Tollis, M. A genomic perspective on the evolutionary diversification of turtles. Syst. Biol. 2022, 71, 1331–1347. [Google Scholar] [CrossRef] [Scilit] [PubMed]
- Selvatti, A.P.; Moreira, F.R.R.; Carvalho, D.C.; Prosdocimi, F.; de Moraes Russo, C.A.; Junqueira, A.C.M. Phylogenomics reconciles molecular data with the rich fossil record on the origin of living turtles. Mol. Phylogenetics Evol. 2023, 183, 107773. [Google Scholar] [CrossRef] [Scilit] [PubMed]
- Thomson, R.C.; Spinks, P.Q.; Shaffer, H.B. A global phylogeny of turtles reveals a burst of climate-associated diversification on continental margins. Proc. Natl. Acad. Sci. USA 2021, 118, e2012215118. [Google Scholar] [CrossRef] [Scilit] [PubMed]
- Uetz, P. The Reptile Database: Curating the biodiversity literature without funding. Biodivers. Inf. Sci. Stand. 2021, 5, 246–255. [Google Scholar] [CrossRef] [Scilit]
- Barley, A.J.; Spinks, P.Q.; Thomson, R.C.; Shaffer, H.B. Fourteen nuclear genes provide phylogenetic resolution for difficult nodes in the turtle tree of life. Mol. Phylogenetics Evol. 2010, 55, 1189–1194. [Google Scholar] [CrossRef] [Scilit] [PubMed]
- Crawford, N.G.; Parham, J.F.; Sellas, A.B.; Faircloth, B.C.; Glenn, T.C.; Papenfuss, T.J.; Henderson, J.B.; Hansen, M.H.; Simison, W.B. A phylogenomic analysis of turtles. Mol. Phylogenetics Evol. 2015, 83, 250–257. [Google Scholar] [CrossRef] [Scilit] [PubMed]
- Turtle Taxonomy Working Group. Turtles of the World: Annotated Checklist and Atlas of Taxonomy, Synonymy, Distribution, and Conservation Status, 10th ed.; Chelonian Research Foundation and Turtle Conservancy: Arlington, VT, USA, 2025; Volume 10, pp. 1–575. [Google Scholar]
- Han, S.; Ding, H.; Peng, H.; Dai, C.; Zhang, S.; Yang, J.; Gao, J.; Kan, X. Sturnidae sensu lato Mitogenomics: Novel Insights into Codon Aversion, Selection, and Phylogeny. Animals 2024, 14, 2777. [Google Scholar] [CrossRef] [Scilit] [PubMed]
- Zhang, J.; Miao, G.; Hu, S.; Sun, Q.; Ding, H.; Ji, Z.; Guo, P.; Yan, S.; Wang, C.; Kan, X.; et al. Quantification and evolution of mitochondrial genome rearrangement in Amphibians. BMC Ecol. Evol. 2021, 21, 19. [Google Scholar] [CrossRef] [Scilit] [PubMed]
- Montana-Lozano, P.; Balaguera-Reina, S.A.; Prada-Quiroga, C.F. Comparative analysis of codon usage of mitochondrial genomes provides evolutionary insights into reptiles. Gene 2023, 851, 146999. [Google Scholar] [CrossRef] [Scilit] [PubMed]
- Le, M.; Raxworthy, C.J.; McCord, W.P.; Mertz, L. A molecular phylogeny of tortoises (Testudines: Testudinidae) based on mitochondrial and nuclear genes. Mol. Phylogenetics Evol. 2006, 40, 517–531. [Google Scholar] [CrossRef] [Scilit] [PubMed]
- Wang, H.; Chen, Y.; Shi, W.; Guo, Y.; He, J.; Chu, Z.; Zhao, B. A Comprehensive Description and Evolutionary Analysis of Testudines Mitochondrial Genomes. Indian J. Anim. Res. 2021, 55, 1430–1438. [Google Scholar] [CrossRef] [Scilit]
- Parvathy, S.T.; Udayasuriyan, V.; Bhadana, V. Codon usage bias. Mol. Biol. Rep. 2022, 49, 539–565. [Google Scholar] [CrossRef] [Scilit] [PubMed]
- Hershberg, R.; Petrov, D.A. Selection on codon bias. Annu. Rev. Genet. 2008, 42, 287–299. [Google Scholar] [CrossRef] [Scilit] [PubMed]
- Plotkin, J.B.; Kudla, G. Synonymous but not the same: The causes and consequences of codon bias. Nat. Rev. Genet. 2011, 12, 32–42. [Google Scholar] [CrossRef] [Scilit] [PubMed]
- Miller, J.B.; Hippen, A.A.; Belyeu, J.R.; Whiting, M.F.; Ridge, P.G. Missing something? Codon aversion as a new character system in phylogenetics. Cladistics 2017, 33, 545–556. [Google Scholar] [CrossRef] [Scilit] [PubMed]
- Miller, J.B.; McKinnon, L.M.; Whiting, M.F.; Ridge, P.G. Codon use and aversion is largely phylogenetically conserved across the tree of life. Mol. Phylogenetics Evol. 2020, 144, 106697. [Google Scholar] [CrossRef] [Scilit] [PubMed]
- Ding, H.; Bi, D.; Han, S.; Yi, R.; Zhang, S.; Ye, Y.; Gao, J.; Yang, J.; Kan, X. Mitogenomic Codon Usage Patterns of Superfamily Certhioidea (Aves, Passeriformes): Insights into Asymmetrical Bias and Phylogenetic Implications. Animals 2022, 13, 96. [Google Scholar] [CrossRef] [Scilit] [PubMed]
- Ding, H.; Han, S.; Ye, Y.; Bi, D.; Zhang, S.; Yi, R.; Gao, J.; Yang, J.; Wu, L.; Kan, X. Ten Plastomes of Crassula (Crassulaceae) and Phylogenetic Implications. Biology 2022, 11, 1779. [Google Scholar] [CrossRef] [Scilit] [PubMed]
- Han, S.; Bi, D.; Yi, R.; Ding, H.; Wu, L.; Kan, X. Plastome evolution of Aeonium and Monanthes (Crassulaceae): Insights into the variation of plastomic tRNAs, and the patterns of codon usage and aversion. Planta 2022, 256, 35. [Google Scholar] [CrossRef] [Scilit] [PubMed]
- Zhang, S.; Han, S.; Bi, D.; Yang, J.; Ge, W.; Ye, Y.; Gao, J.; Dai, C.; Kan, X. Intraspecific and Intrageneric Genomic Variation across Three Sedum Species (Crassulaceae): A Plastomic Perspective. Genes 2024, 15, 444. [Google Scholar] [CrossRef] [Scilit] [PubMed]
- Jühling, F.; Pütz, J.; Bernt, M.; Donath, A.; Middendorf, M.; Florentz, C.; Stadler, P.F. Improved systematic tRNA gene annotation allows new insights into the evolution of mitochondrial tRNA structures and into the mechanisms of mitochondrial genome rearrangements. Nucleic Acids Res. 2012, 40, 2833–2845. [Google Scholar] [CrossRef] [Scilit] [PubMed]
- Masta, S.E.; Boore, J.L. Parallel evolution of truncated transfer RNA genes in arachnid mitochondrial genomes. Mol. Biol. Evol. 2008, 25, 949–959. [Google Scholar] [CrossRef] [Scilit] [PubMed]
- Kumazawa, Y.; Nishida, M. Sequence evolution of mitochondrial tRNA genes and deep-branch animal phylogenetics. J. Mol. Evol. 1993, 37, 380–398. [Google Scholar] [CrossRef] [Scilit] [PubMed]
- Wolstenholme, D.R. Animal mitochondrial DNA: Structure and evolution. Int. Rev. Cytol. 1992, 141, 173–216. [Google Scholar] [CrossRef] [Scilit] [PubMed]
- Giegé, R.; Jühling, F.; Pütz, J.; Stadler, P.; Sauter, C.; Florentz, C. Structure of transfer RNAs: Similarity and variability. Wiley Interdiscip. Rev. RNA 2012, 3, 37–61. [Google Scholar] [CrossRef] [Scilit] [PubMed]
- Jin, J.J.; Yu, W.B.; Yang, J.B.; Song, Y.; dePamphilis, C.W.; Yi, T.S.; Li, D.Z. GetOrganelle: A fast and versatile toolkit for accurate de novo assembly of organelle genomes. Genome Biol. 2020, 21, 241. [Google Scholar] [CrossRef] [Scilit] [PubMed]
- Wick, R.R.; Schultz, M.B.; Zobel, J.; Holt, K.E. Bandage: Interactive visualization of de novo genome assemblies. Bioinformatics 2015, 31, 3350–3352. [Google Scholar] [CrossRef] [Scilit] [PubMed]
- Tillich, M.; Lehwark, P.; Pellizzer, T.; Ulbricht-Jones, E.S.; Fischer, A.; Bock, R.; Greiner, S. GeSeq—Versatile and accurate annotation of organelle genomes. Nucleic Acids Res. 2017, 45, W6–W11. [Google Scholar] [CrossRef] [Scilit] [PubMed]
- Grant, J.R.; Enns, E.; Marinier, E.; Mandal, A.; Herman, E.K.; Chen, C.Y.; Graham, M.; Van Domselaar, G.; Stothard, P. Proksee: In-depth characterization and visualization of bacterial genomes. Nucleic Acids Res. 2023, 51, W484–W492. [Google Scholar] [CrossRef] [Scilit] [PubMed]
- Katoh, K.; Rozewicki, J.; Yamada, K.D. MAFFT online service: Multiple sequence alignment, interactive sequence choice and visualization. Brief. Bioinform. 2019, 20, 1160–1166. [Google Scholar] [CrossRef] [Scilit] [PubMed]
- Xia, X.; Xie, Z. DAMBE: Software package for data analysis in molecular biology and evolution. J. Hered. 2001, 92, 371–373. [Google Scholar] [CrossRef] [Scilit] [PubMed]
- Peden, J.F. Analysis of Codon Usage; Citeseer: Princeton, NJ, USA, 2000. [Google Scholar]
- Gupta, S.K.; Bhattacharyya, T.K.; Ghosh, T.C. Synonymous codon usage in Lactococcus lactis: Mutational bias versus translational selection. J. Biomol. Struct. Dyn. 2004, 21, 527–536. [Google Scholar] [CrossRef] [Scilit] [PubMed]
- Sharp, P.M.; Li, W.-H. An evolutionary perspective on synonymous codon usage in unicellular organisms. J. Mol. Evol. 1986, 24, 28–38. [Google Scholar] [CrossRef] [Scilit] [PubMed]
- Wright, F. The effective number of codons used in a gene. Gene 1990, 87, 23–29. [Google Scholar] [CrossRef] [Scilit] [PubMed]
- Comeron, J.M.; Aguadé, M. An evaluation of measures of synonymous codon usage bias. J. Mol. Evol. 1998, 47, 268–274. [Google Scholar] [CrossRef] [Scilit] [PubMed]
- Chen, C.; Wu, Y.; Li, J.; Wang, X.; Zeng, Z.; Xu, J.; Liu, Y.; Feng, J.; Chen, H.; He, Y.; et al. TBtools-II: A “one for all, all for one” bioinformatics platform for biological big-data mining. Mol. Plant 2023, 16, 1733–1742. [Google Scholar] [CrossRef] [Scilit] [PubMed]
- Chan, P.P.; Lin, B.Y.; Mak, A.J.; Lowe, T.M. tRNAscan-SE 2.0: Improved detection and functional classification of transfer RNA genes. Nucleic Acids Res. 2021, 49, 9077–9096. [Google Scholar] [CrossRef] [Scilit] [PubMed]
- Darty, K.; Denise, A.; Ponty, Y. VARNA: Interactive drawing and editing of the RNA secondary structure. Bioinformatics 2009, 25, 1974. [Google Scholar] [CrossRef] [Scilit] [PubMed]
- Yang, Z. PAML 4: Phylogenetic analysis by maximum likelihood. Mol. Biol. Evol. 2007, 24, 1586–1591. [Google Scholar] [CrossRef] [Scilit] [PubMed]
- Wickham, H. ggplot2. Wiley Interdiscip. Rev. Comput. Stat. 2011, 3, 180–185. [Google Scholar] [CrossRef] [Scilit]
- Sueoka, N. Intrastrand parity rules of DNA base composition and usage biases of synonymous codons. J. Mol. Evol. 1995, 40, 318–325. [Google Scholar] [CrossRef] [Scilit] [PubMed]
- Sueoka, N. Translation-coupled violation of Parity Rule 2 in human genes is not the cause of heterogeneity of the DNA G+C content of third codon position. Gene 1999, 238, 53–58. [Google Scholar] [CrossRef] [Scilit] [PubMed]
- Sueoka, N. Two aspects of DNA base composition: G+C content and translation-coupled deviation from intra-strand rule of A=T and G=C. J. Mol. Evol. 1999, 49, 49–62. [Google Scholar] [CrossRef] [Scilit] [PubMed]
- Sueoka, N. Directional mutation pressure and neutral molecular evolution. Proc. Natl. Acad. Sci. USA 1988, 85, 2653–2657. [Google Scholar] [CrossRef] [Scilit] [PubMed]
- Guillon, J.-M.; Guéry, L.; Hulin, V.; Girondot, M. A large phylogeny of turtles (Testudines) using molecular data. Contrib. Zool. 2012, 81, 147–158. [Google Scholar] [CrossRef] [Scilit]
- Zhang, D.; Gao, F.; Jakovlic, I.; Zou, H.; Zhang, J.; Li, W.X.; Wang, G.T. PhyloSuite: An integrated and scalable desktop platform for streamlined molecular sequence data management and evolutionary phylogenetics studies. Mol. Ecol. Resour. 2020, 20, 348–355. [Google Scholar] [CrossRef] [Scilit] [PubMed]
- Stamatakis, A. RAxML version 8: A tool for phylogenetic analysis and post-analysis of large phylogenies. Bioinformatics 2014, 30, 1312–1313. [Google Scholar] [CrossRef] [Scilit] [PubMed]
- Darriba, D.; Posada, D.; Kozlov, A.M.; Stamatakis, A.; Morel, B.; Flouri, T. ModelTest-NG: A New and Scalable Tool for the Selection of DNA and Protein Evolutionary Models. Mol. Biol. Evol. 2020, 37, 291–294. [Google Scholar] [CrossRef] [Scilit] [PubMed]
- Ronquist, F.; Teslenko, M.; van der Mark, P.; Ayres, D.L.; Darling, A.; Hohna, S.; Larget, B.; Liu, L.; Suchard, M.A.; Huelsenbeck, J.P. MrBayes 3.2: Efficient Bayesian phylogenetic inference and model choice across a large model space. Syst. Biol. 2012, 61, 539–542. [Google Scholar] [CrossRef] [Scilit] [PubMed]
- Werneburg, I.; Wilson, L.A.; Parr, W.C.; Joyce, W.G. Evolution of neck vertebral shape and neck retraction at the transition to modern turtles: An integrated geometric morphometric approach. Syst. Biol. 2015, 64, 187–204. [Google Scholar] [CrossRef] [Scilit] [PubMed]
- Uddin, A.; Mazumder, T.H.; Barbhuiya, P.A.; Chakraborty, S. Similarities and dissimilarities of codon usage in mitochondrial ATP genes among fishes, aves, and mammals. IUBMB Life 2020, 72, 899–914. [Google Scholar] [CrossRef] [Scilit] [PubMed]
- Reyes, A.; Gissi, C.; Pesole, G.; Saccone, C. Asymmetrical directional mutation pressure in the mitochondrial genome of mammals. Mol. Biol. Evol. 1998, 15, 957–966. [Google Scholar] [CrossRef] [Scilit] [PubMed]
- Ding, H.; Gao, J.; Yang, J.; Zhang, S.; Han, S.; Yi, R.; Ye, Y.; Kan, X. Genome evolution of Buchnera aphidicola (Gammaproteobacteria): Insights into strand compositional asymmetry, codon usage bias, and phylogenetic implications. Int. J. Biol. Macromol. 2023, 253, 126738. [Google Scholar] [CrossRef] [Scilit] [PubMed]
- Muto, A.; Osawa, S. The guanine and cytosine content of genomic DNA and bacterial evolution. Proc. Natl. Acad. Sci. USA 1987, 84, 166–169. [Google Scholar] [CrossRef] [Scilit] [PubMed]
- Min, X.J.; Hickey, D.A. DNA asymmetric strand bias affects the amino acid composition of mitochondrial proteins. DNA Res. 2007, 14, 201–206. [Google Scholar] [CrossRef] [Scilit] [PubMed]
- Pentinsaari, M.; Salmela, H.; Mutanen, M.; Roslin, T. Molecular evolution of a widely-adopted taxonomic marker (COI) across the animal tree of life. Sci. Rep. 2016, 6, 35275. [Google Scholar] [CrossRef] [Scilit] [PubMed]
- Galtier, N.; Nabholz, B.; Glémin, S.; Hurst, G. Mitochondrial DNA as a marker of molecular diversity: A reappraisal. Mol. Ecol. 2009, 18, 4541–4550. [Google Scholar] [CrossRef] [Scilit] [PubMed]
- Zardoya, R.; Meyer, A. Complete mitochondrial genome suggests diapsid affinities of turtles. Proc. Natl. Acad. Sci. USA 1998, 95, 14226–14231. [Google Scholar] [CrossRef] [Scilit] [PubMed]
- Boore, J.L. Animal mitochondrial genomes. Nucleic Acids Res. 1999, 27, 1767–1780. [Google Scholar] [CrossRef] [Scilit] [PubMed]
- Fonseca, M.M.; Posada, D.; Harris, D.J. Inverted replication of vertebrate mitochondria. Mol. Biol. Evol. 2008, 25, 805–808. [Google Scholar] [CrossRef] [Scilit] [PubMed]
- Jia, W.; Higgs, P.G. Codon usage in mitochondrial genomes: Distinguishing context-dependent mutation from translational selection. Mol. Biol. Evol. 2008, 25, 339–351. [Google Scholar] [CrossRef] [Scilit] [PubMed]
- McInerney, J.O. GCUA: General codon usage analysis. Bioinformatics 1998, 14, 372–373. [Google Scholar] [CrossRef] [Scilit] [PubMed]
- Yarham, J.W.; Elson, J.L.; Blakely, E.L.; McFarland, R.; Taylor, R.W. Mitochondrial tRNA mutations and disease. Wiley Interdiscip. Rev. RNA 2010, 1, 304–324. [Google Scholar] [CrossRef] [Scilit] [PubMed]
- Kim, S.; Sussman, J.; Suddath, F.; Quigley, G.; McPherson, A.; Wang, A.; Seeman, N.; Rich, A. The general structure of transfer RNA molecules. Proc. Natl. Acad. Sci. USA 1974, 71, 4970–4974. [Google Scholar] [CrossRef] [Scilit] [PubMed]
- Watanabe, Y.-i.; Suematsu, T.; Ohtsuki, T. Losing the stem-loop structure from metazoan mitochondrial tRNAs and co-evolution of interacting factors. Front. Genet. 2014, 5, 109. [Google Scholar] [CrossRef] [Scilit] [PubMed]
- Frazer-Abel, A.A.; Hagerman, P.J. Variation of the acceptor–anticodon interstem angles among mitochondrial and non-mitochondrial tRNAs. J. Mol. Biol. 2004, 343, 313–325. [Google Scholar] [CrossRef] [Scilit] [PubMed]
- Ohtsuki, T.; Kawai, G.; Watanabe, K. The minimal tRNA: Unique structure of Ascaris suum mitochondrial tRNASerUCU having a short T arm and lacking the entire D arm. FEBS Lett. 2002, 514, 37–43. [Google Scholar] [CrossRef] [Scilit] [PubMed]
- Suematsu, T.; Sato, A.; Sakurai, M.; Watanabe, K.; Ohtsuki, T. A unique tRNA recognition mechanism of Caenorhabditis elegans mitochondrial EF-Tu2. Nucleic Acids Res. 2005, 33, 4683–4691. [Google Scholar] [CrossRef] [Scilit] [PubMed]
- Hanada, T.; Suzuki, T.; Watanabe, K. Translation activity of mitochondrial tRNA with unusual secondary structure. In Nucleic Acids Symposium Series; Oxford University Press: Oxford, UK, 2000; Volume 44, pp. 249–250. [Google Scholar]
- Ikemura, T. Correlation between the abundance of Escherichia coli transfer RNAs and the occurrence of the respective codons in its protein genes. J. Mol. Biol. 1981, 146, 1–21. [Google Scholar] [CrossRef] [Scilit] [PubMed]
- Karakaidos, P.; Rampias, T. Mitonuclear interactions in the maintenance of mitochondrial integrity. Life 2020, 10, 173. [Google Scholar] [CrossRef] [Scilit] [PubMed]
- Kuhle, B.; Hirschi, M.; Doerfel, L.K.; Lander, G.C.; Schimmel, P. Structural basis for shape-selective recognition and aminoacylation of a D-armless human mitochondrial tRNA. Nat. Commun. 2022, 13, 5100. [Google Scholar] [CrossRef] [Scilit] [PubMed]
- Kundu, S.; Kumar, V.; Tyagi, K.; Chakraborty, R.; Singha, D.; Rahaman, I.; Pakrashi, A.; Chandra, K. Complete mitochondrial genome of Black Soft-shell Turtle (Nilssonia nigricans) and comparative analysis with other Trionychidae. Sci. Rep. 2018, 8, 17378. [Google Scholar] [CrossRef] [Scilit] [PubMed]
- Kundu, S.; Kumar, V.; Tyagi, K.; Chakraborty, R.; Chandra, K. The first complete mitochondrial genome of the Indian Tent Turtle, Pangshura tentoria (Testudines: Geoemydidae): Characterization and comparative analysis. Ecol. Evol. 2019, 9, 10854–10868. [Google Scholar] [CrossRef] [Scilit] [PubMed]
- Macey, J.R.; Larson, A.; Ananjeva, N.B.; Fang, Z.; Papenfuss, T.J. Two novel gene orders and the role of light-strand replication in rearrangement of the vertebrate mitochondrial genome. Mol. Biol. Evol. 1997, 14, 91–104. [Google Scholar] [CrossRef] [Scilit] [PubMed]
- Pavlova, A.; Gan, H.M.; Lee, Y.P.; Austin, C.; Gilligan, D.M.; Lintermans, M.; Sunnucks, P. Purifying selection and genetic drift shaped Pleistocene evolution of the mitochondrial genome in an endangered Australian freshwater fish. Heredity 2017, 118, 466–476. [Google Scholar] [CrossRef] [Scilit] [PubMed]
- Ozerova, I.; Fallmann, J.; Mörl, M.; Bernt, M.; Prohaska, S.J.; Stadler, P.F. Aberrant mitochondrial tRNA genes appear frequently in animal evolution. Genome Biol. Evol. 2024, 16, evae232. [Google Scholar] [CrossRef] [Scilit] [PubMed]
- Kumazawa, Y.; Nishida, M. Variations in mitochondrial tRNA gene organization of reptiles as phylogenetic markers. Mol. Biol. Evol. 1995, 12, 759–772. [Google Scholar] [CrossRef] [Scilit] [PubMed]
- Infante-Rojas, H.; Marino-Ramirez, L.; Hernández-Fernández, J. Structural analysis of leucine, lysine and tryptophan mitochondrial tRNA of nesting turtles Caretta caretta (Testudines: Chelonioidea) in the Colombian Caribbean. PeerJ 2020, 8, e9204. [Google Scholar] [CrossRef] [Scilit] [PubMed]
- Kundu, S.; Kumar, V.; Tyagi, K.; Chandra, K. The complete mitochondrial genome of the endangered Assam Roofed Turtle, Pangshura sylhetensis (Testudines: Geoemydidae): Genomic features and phylogeny. PLoS ONE 2020, 15, e0225233. [Google Scholar] [CrossRef] [Scilit] [PubMed]
- Zhang, F.; Broughton, R.E. Mitochondrial-nuclear interactions: Compensatory evolution or variable functional constraint among vertebrate oxidative phosphorylation genes? Genome Biol. Evol. 2013, 5, 1781–1791. [Google Scholar] [CrossRef] [Scilit] [PubMed]
- Nabholz, B.; Ellegren, H.; Wolf, J.B. High levels of gene expression explain the strong evolutionary constraint of mitochondrial protein-coding genes. Mol. Biol. Evol. 2013, 30, 272–284. [Google Scholar] [CrossRef] [Scilit] [PubMed]
- Kimura, M. Evolutionary rate at the molecular level. Nature 1968, 217, 624–626. [Google Scholar] [CrossRef] [Scilit] [PubMed]
- Gouy, M.; Gautier, C. Codon usage in bacteria: Correlation with gene expressivity. Nucleic Acids Res. 1982, 10, 7055–7074. [Google Scholar] [CrossRef] [Scilit] [PubMed]
- Bulmer, M. The selection-mutation-drift theory of synonymous codon usage. Genetics 1991, 129, 897–907. [Google Scholar] [CrossRef] [Scilit] [PubMed]
- Li, W.-H. Models of nearly neutral mutations with particular implications for nonrandom usage of synonymous codons. J. Mol. Evol. 1987, 24, 337–345. [Google Scholar] [CrossRef] [Scilit] [PubMed]
- Yang, J.; Ding, H.; Kan, X. Codon usage patterns and evolution of HSP60 in birds. Int. J. Biol. Macromol. 2021, 183, 1002–1012. [Google Scholar] [CrossRef] [Scilit] [PubMed]
- Akashi, H. Synonymous codon usage in Drosophila melanogaster: Natural selection and translational accuracy. Genetics 1994, 136, 927–935. [Google Scholar] [CrossRef] [Scilit] [PubMed]
- McCord, W.P.; Joseph-Ouni, M.; Lamar, W.W. Taxonomic reevaluation of Phrynops (Testudines: Chelidae) with the description of two new genera and a new species of Batrachemys. Rev. Biol. Trop. 2001, 49, 715–764. [Google Scholar] [PubMed]
- Bour, R.; Zaher, H. A new species of Mesoclemmys, from the open formations of northeastern Brazil (Chelonii, Chelidae). Pap. Avulsos Zool. 2005, 45, 295–311. [Google Scholar] [CrossRef] [Scilit]
- Assis, C.L.; Valadão, R.M.; Mendonça, S.H.S.D.; Peçanha, E.L.S.; Costa, H.C.; Novaes, C.M.; Barros, T.F.D.; Rodrigues, L.S.; Gasparini, J.L.; Feio, R.N. Extensive sampling and citizen science expand the distribution of the threatened freshwater turtle Ranacephala hogei (Mertens, 1967). An. Acad. Bras. Cienc. 2024, 96, e20240484. [Google Scholar] [CrossRef] [Scilit] [PubMed]
- Le, M.; Reid, B.N.; McCord, W.P.; Naro-Maciel, E.; Raxworthy, C.J.; Amato, G.; Georges, A. Resolving the phylogenetic history of the short-necked turtles, genera Elseya and Myuchelys (Testudines: Chelidae) from Australia and New Guinea. Mol. Phylogenetics Evol. 2013, 68, 251–258. [Google Scholar] [CrossRef] [Scilit] [PubMed]
- Spinks, P.Q.; Shaffer, H.B. Conflicting mitochondrial and nuclear phylogenies for the widely disjunct Emys (Testudines: Emydidae) species complex, and what they tell us about biogeography and hybridization. Syst. Biol. 2009, 58, 1–20. [Google Scholar] [CrossRef] [Scilit] [PubMed]
- Kehlmaier, C.; Zhang, X.; Georges, A.; Campbell, P.D.; Thomson, S.; Fritz, U. Mitogenomics of historical type specimens of Australasian turtles: Clarification of taxonomic confusion and old mitochondrial introgression. Sci. Rep. 2019, 9, 5841. [Google Scholar] [CrossRef] [Scilit] [PubMed]
- Le, M.; Duong, H.T.; Dinh, L.D.; Nguyen, T.Q.; Pritchard, P.C.; McCormack, T. A phylogeny of softshell turtles (Testudines: Trionychidae) with reference to the taxonomic status of the critically endangered, giant softshell turtle, Rafetus swinhoei. Org. Divers. Evol. 2014, 14, 279–293. [Google Scholar] [CrossRef] [Scilit]
- Li, H.; Liu, J.; Xiong, L.; Zhang, H.; Zhou, H.; Yin, H.; Jing, W.; Li, J.; Shi, Q.; Wang, Y. Phylogenetic relationships and divergence dates of softshell turtles (Testudines: Trionychidae) inferred from complete mitochondrial genomes. J. Evol. Biol. 2017, 30, 1011–1023. [Google Scholar] [CrossRef] [Scilit] [PubMed]
- Liebing, N.; Praschag, P.; Gosh, R.; Vasudevan, K.; Rashid, S.; Rao, D.-q.; Stuckas, H.; Fritz, U. Molecular phylogeny of the softshell turtle genus Nilssonia revisited, with first records of N. formosa for China and wild-living N. nigricans for Bangladesh. Vertebr. Zool. 2012, 62, 261–272. [Google Scholar] [CrossRef] [Scilit]
- Graciá, E.; Vargas-Ramírez, M.; Delfino, M.; Anadón, J.D.; Giménez, A.; Fahd, S.; Corti, C.; Jdeidi, T.B.; Fritz, U. Expansion after expansion: Dissecting the phylogeography of the widely distributed spur-thighed tortoise, Testudo graeca (Testudines: Testudinidae). Biol. J. Linn. Soc. 2017, 121, 641–654. [Google Scholar] [CrossRef] [Scilit]

Disclaimer/Publisher’s Note: The statements, opinions and data contained in all publications are solely those of the individual author(s) and contributor(s) and not of MDPI and/or the editor(s). MDPI and/or the editor(s) disclaim responsibility for any injury to people or property resulting from any ideas, methods, instructions or products referred to in the content. |
© 2026 by the authors. Licensee MDPI, Basel, Switzerland. This article is an open access article distributed under the terms and conditions of the Creative Commons Attribution (CC BY) license.